 Fei Zhang
 Feng LuYanqiu Wang*Zhipeng ZhangJiaxu WangKuangye Zhang
 Han WuJianqiu ZouYouhou DuanFulai KeKai Zhu*
- Sorghum Breeding and Cultivation Physiology Laboratory, Sorghum Institute, Liaoning Academy of Agricultural Sciences, Shenyang, China
Sorghum is an important food crop with high salt tolerance. Therefore, studying the salt tolerance mechanism of sorghum has great significance for understanding the salt tolerance mechanism of C4 plants. In this study, two sorghum species, LRNK1 (salt-tolerant (ST)) and LR2381 (salt-sensitive (SS)), were treated with 180 mM NaCl salt solution, and their physiological indicators were measured. Transcriptomic and metabolomic analyses were performed by Illumina sequencing and liquid chromatography-mass spectrometry (LC-MS) technology, respectively. The results demonstrated that the plant height, leaf area, and chlorophyll contents in LRNK1 were significantly higher than in LR2381. Functional analysis of differently expressed genes (DEGs) demonstrated that plant hormone signal transduction (GO:0015473), carbohydrate catabolic processes (GO:0016052), and photosynthesis (GO:0015979) were the main pathways to respond to salt stress in sorghum. The genes of the two varieties showed different expression patterns under salt stress conditions. The metabolomic data revealed different profiles of salicylic acid and betaine between LRNK1 and LR2381, which mediated the salt tolerance of sorghum. In conclusion, LRNK1 sorghum responds to salt stress via a variety of biological processes, including energy reserve, the accumulation of salicylic acid and betaine, and improving the activity of salt stress-related pathways. These discoveries provide new insights into the salt tolerance mechanism of sorghum and will contribute to sorghum breeding.
Highlight
Transcriptomic and metabolomic data were combined to reveal the changes in genes and metabolites, which provide new insights into the salt tolerance mechanism of sorghum.
Introduction
Plant growth can be affected by various abiotic stresses such as drought, cold, heat, and high salinity conditions. To maintain adequate proliferation, plants have evolved intricate mechanisms by which they perceive external signals and respond accordingly (Rahman, 2012). A major event in stress response is the perception and transduction of stress signals through signaling components (Kumar et al., 2011), which results in the activation of numerous stress-related genes and metabolites. In Arabidopsis and rice plants, networks interacting during stress defenses have recently been elucidated using transcriptomic analysis (Yao et al., 2018; Chandran et al., 2019). Ionic imbalance and osmotic stress are the two major effects challenged by salt stress. These stresses result in membrane damage and enhance lipid peroxidation and the production of reactive oxygen species (ROS) (Kumar et al., 2013). The performance and mechanism of salt tolerance in plants have also been reviewed in many studies (Fahad et al., 2014; Parihar et al., 2014; Dar et al., 2015; Liang et al., 2017). Sorghum is a major food crop for millions of people worldwide and also suffers from salt stress. Food and Agriculture Organization data have demonstrated that sorghum is currently the fifth most important grain crop in the world (Zheng et al., 2011) and plays an important role in the development and evolution of dedicated energy crops. Sorghum has also evolved a series of responses to salt stress. Lacerda reported that sorghum could reduce Na+ and Cl− transport from the roots to the shoot and compartmentalize part of it in specific places in the stems and roots in plants treated with salt (Lacerda et al., 2001). Swami revealed changes in the protein complement of sorghum leaves under salt stress (Kumar et al., 2011). In addition, the use of exogenous components can increase the salt tolerance of sorghum, such as exogenous spermine (Chai et al., 2010), salicylic acid (Mahmood et al., 2010), abscisic acid (ABA) (Amzallag et al., 1990), and glycine betaine (Ibrahim, 2004; Agboma et al., 2008). Like other essential crops, salt stress reduces sorghum yield and production. Several articles have reviewed the physiological and biochemical responses of sorghum to salt stress (Almodares and Hadi, 2009; Tari et al., 2013; Anami et al., 2015; Yang et al., 2020). When sorghum is subjected to salt stress, cells mobilize multiple components in response. Some studies have demonstrated the stress response mechanism of salt stress in sorghum at the level of gene expression (Dugas et al., 2011; Fracasso et al., 2016; Yang et al., 2017), although these are insufficient. Organic solutes such as sugars, organic acids, polyols, and many nitrogen-containing compounds such as amino acids, amides, amino acids, ectoine, proteins, and quaternary ammonium compounds have been proven to play important roles in tolerating the toxicity of ions under salt stress (Ashraf and McNeilly, 2004). Meanwhile, genes also actively respond to salt stress signals, and the expression levels of some genes change dramatically in a short time to synthesize the proteins needed for stress response. Some genes are suppressed under salt stress. Biotechnological methods dedicated to planting transcriptomics analysis provide a valuable opportunity to uncover the basis of plant response to salt stress at the molecular level (Daldoul et al., 2014). The continuous advancement of technology will allow us to obtain the transcriptome expression profile in plant cells and use liquid chromatography/mass spectrometry (LC/MS) technology to identify and analyze metabolites and proteins in the plant (Fiehn, 2002). Integrative omics approaches within large-scale experiments, including genomics, transcriptomics, ionomics, proteomics, and metabolomics, can help decipher the interplay of cellular functions at different levels (Biswapriya et al., 2019). Therefore, we can reveal a series of response mechanisms triggered by cells in response to salt stress. Transcriptomics, along with metabolomics, provides a major tool for characterizing postgenomic processes (Morgenthal et al., 2006). In China, many salt-tolerant sorghum varieties have been selected after many years of breeding. LRNK1 is a sorghum variety with high yield and salt tolerance and is an ideal plant material to study the salt tolerance mechanism of sorghum. The development of liquid chromatography-mass spectrometry (LC-MS) technology has made it possible to research such resistance in plants. With LC-MS, all nonvolatile polar metabolites, such as amino acids, can be assayed without derivatization (D’Amelia et al., 2018). In particular, short analysis times, selectivity, and almost no matrix interferences have become significant advantages for the LC-MS method when determining metabolites (Thiele et al., 2012). Natera revealed the root lipidome profile response to salt stress in barley by LC-MS (Natera et al., 2016). Kechebar found the phenolic composition changed in salt-treated Saharan trees (Karoune et al., 2017). Therefore, it is possible to use LC-MS to study the metabolite profile response to salt stress in sorghum.
In this study, we reveal changes in genes and metabolites in two extreme sorghum materials under salt stress by combining transcriptomic and metabolomic data under four treatments of salt stress and control. This study will provide technical support for the potential mining of sorghum salt tolerance and selecting salt-tolerant varieties.
Materials and methods
Plant materials
Two sorghum restorer lines, LRNK1 (salt-tolerant (ST)) and LR2381 (salt-sensitive, SS), were used as plant materials. While they had different sensitivities to salt, the crop maturity period, growth rate, and phenotypic traits of the two sorghum genotypes (Bicolor L. Moench) were similar. LRNK1 and LR2381 seeds were collected from the sorghum seed resource bank in the Liaoning Academy of Agricultural Sciences with ID: 011427 and ID: 010362, respectively. After disinfection (surface-sterilized with 1% sodium hypochlorite for 5 min followed by rinsing three times with distilled water), the seeds were planted in a hydroponic beaker filled with sorghum hydroponic culture (Kimura solution, Supplementary Table S1) under artificially simulated climatic conditions: day/night temperatures of 28°C/25°C, approximately 50% relative humidity (Rh), photoperiod of 14:10 h of light (1,500 μmol·m−2·s−1)/dark in April 2019 in an artificial climate room in Liaoning Provincial Academy of Agricultural Sciences.
Salt treatment and sample collection
Sorghum plants at the six-leaf stage were used for the salt treatment experiment. For each variety, 144 plants were randomly selected and then divided into six hydroponic beakers with 24 plants in each. These six hydroponic beakers were then randomly divided into two groups: salt treatment (T) and control (C), with three hydroponic beakers in each group. For group T, both LRNK1 and LR2381 were treated with an additional 180 mM NaCl in the basic sorghum hydroponic culture, which was based on previous salt stress simulations at 60, 120, 180, and 240 mM NaCl. The two extremes of 180 mM NaCl showed significant phenotypic differences between the salt stress and control treatments. The salt-sensitive lines survived, while the salt-sensitive lines died under 240 mM NaCl simulations. In addition, the salt stress adversity simulated by 180 mM NaCl most closely matched the actual production environment. For group C, both LRNK1 and LR2381 were treated with basic sorghum hydroponic culture (no NaCl supplement). A total of four sets of samples were prepared: LRNK1-control (STC), LRNK1-salt treatment (STT), LR2381-control (SSC), and LR2381-salt treatment (SST). After 72 h of cultivation, six plant samples were randomly selected from each hydroponic beaker and the fifth leaf at tillering on each plant was sampled (18 leaves obtained in each group). These 18 leaves were pooled and divided into six parts in each group, three of which were used for RNA-seq analysis and three for metabolomic analysis. All sampled leaves were immediately placed in liquid nitrogen for 5 min, stored at −80°C, and tested within 3 to 4 weeks. The root tissue of each group was sampled to determine the physiological indicators.
After the hydroponic salt stress sampling was completed, the seedlings of the four groups of STC, STT, SSC, and SST were transplanted into prepared pots treated with the same salinity as the hydroponics for cultivation until maturity, and the sorghum growth phenotype parameter was recorded.
Determination of plant physiological indicators
The plant height and leaf area (the fifth leaf at tillering) of seedlings at the six-leaf stage with and without salt treatment were measured according to a previous report (Iqbal et al., 2010). Fresh leaves were determined by an electronic balance to obtain the fresh mass (FM) and dried at 105°C for half an hour and at 70°C for 48 h to achieve constant weight. The dry mass (DM) was recorded. Turgid mass (TM) was determined after the leaves had been immersed in distilled water for 12 h. The FM, DM, and TM of root tissues were also determined. The relative water content (RWC) of a plant tissue is expressed by RWC (%) = [(FM − DM)/(TM − DM)] * 100%. For the leaf chlorophyll content determination, the ethanol-acetone method was used as described by Zhang (1992). The same experimental protocol was repeated three times.
Total RNA extraction and sequencing
Total RNA was extracted using an RNAprep pure Plant Kit (Tiangen, Beijing, China) according to the manufacturer’s instructions, and the RNA quality was evaluated by gel electrophoresis. Total RNA was reverse transcribed to cDNA by a QuantScript RT Kit (Tiangen, Beijing, China). An efficient VAHTS® mRNA-seq v2 Library Prep Kit for Illumina (Vazyme Biotech, Nanjing, China) was then used to construct the sequence libraries. All 12 mRNA libraries (six groups with three biological replicates in each group) obtained were evaluated by an Agilent 2100 Bioanalyzer (Agilent Technologies, USA) and the qRT-PCR method. Finally, all mRNA-seq libraries were sequenced on an Illumina HiSeq 4000 sequencing platform with pair-end 2 × 150 bp mode to obtain sequencing data.
mRNA sequence data processing
The sequencing data were filtered using FastQC (version 0.11.5) with default criteria. Low-quality reads and adaptor reads were removed from the raw data, and the clean data were assembled and mapped to the sorghum assembly genome (https://www.ncbi.nlm.nih.gov/genome/term=Sorghum+bicolor) using HISAT2 (version 2.1.0) (Kim et al., 2015). The value of FPKM (expected number of fragments per kb of exon per million of reads) of reads in each sample was calculated using Cufflinks (version 2.2.1) (Roberts et al., 2011). Principal component analysis (PCA) and Pearson’s correlation analysis were performed based on the FPKM of reads. The differentially expressed genes (DEGs) by different comparisons were identified using DESeq2 (version 1.24.0) (Anders, 2010), with the criteria of the corrected p-value (padj) <0.05 by the negative binomial distribution test and |log2(fold change (FC))|>0. Genes with log2FC >0 and log2FC <0 were identified as up- and downregulated DEGs, respectively. Hierarchical clustering based on the expression profiles of DEGs was presented by pheatmap (version 1.0.10). DEGs enriched into modules correlated with the phenotypes were separately subjected to the enrichment analysis for Gene Ontology (GO) and Kyoto Encyclopedia of Genes and Genomes (KEGG) pathways (Kanehisa et al., 2007). Significant GO biological processes (BP) and KEGG pathways were identified with the criterion of p < 0.05.
Nontargeted liquid chromatography-mass spectrometry
The chromatographic column (Accucore HILIC column; Thermo Fisher Scientific) was maintained at 40°C with an injection volume of 5 µl. The mobile phase (0.3 ml/min flow rate) consisted of 0.1% formic acid, 95% acetonitrile, and 10 mM ammonium acetate in solvent A, and 0.1% formic acid, 50% acetonitrile, and 10 mM ammonium acetate in solvent B. The gradient elution phase of solvent A was 98% for the first 1 min, decreased to 50% during 1–17 min, stabilized for 0.5 min (17.5 min), returned to 98% after 17.5–18 min, and stabilized at 98% for the last 2 min (18–20 min). A 5-min interval was set for the equilibrating instrument. All samples were analyzed using a Q Exactive (QE) HF-X mass spectrometer detector (Thermo Fisher Scientific) in positive and negative (polarity) ionization modes (spray voltage of 3.2 kV) with MS/MS data-dependent scans (mass range of 100–1500 m/z). The parameters of the electrospray ion source were set as 320°C drying gas temperature, 35 arb sheath gas flow rate, and 10 arb Aux gas flow rate. System stability and accuracy were validated using QC samples with an interval of five samples.
Nontargeted LC-MS analysis
The data were recorded using the compound discoverer (CD) software, and the parameters, including retention times and mass charge ratio of compounds, were analyzed and corrected. The relative standard deviation (RSD) and signal-to-noise (S/N) ratio were analyzed. After feature screening, candidate features (RSD >30%, S/R ratio <3, signal intensity >105) were retained and aligned against mzCloud (https://www.mzcloud.org/). QC samples were used for data normalization, and the relative expression of the metabolites was obtained and used for further analysis. The resulting three-dimensional data involving the peak number, sample name, and normalized peak area were fed into R package metaX for PCA and projections to latent structures-discriminant analysis (PLS-DA) (Wen et al., 2017). A Student’s t-test was used to compare peak areas of three metabolites, with the threshold of variable importance in the projection (VIP) value >1, fold change (FC) ≥2 (|log2FC|≥1), and p < 0.05. A hierarchical clustering analysis was then performed to present the expression patterns of the differential metabolites. Subsequently, the correlations between the differential metabolites were calculated by R software (v3.1.3). Differential metabolites with significant correlations (false discovery rate, FDR <0.05) were retained and used for enrichment analysis of the KEGG pathway, with significant criteria of padj < 0.05.
Soluble sugars, salicylic acid, and betaine
Soluble sugars
Soluble sugar in plant leaves was determined with the methods used by Zhang (1992) with minor modifications. Plant leaves (0.25 g) were placed in a boiling water bath for 1 h. Total soluble sugar content was analyzed with the phenol-sulfuric method after hydrolysis of starch using perchloric acid.
Salicylic acid content
In total, 1.5 g of seedling leaves was placed in a grinder, and 4 ml of 80% methanol was added to grind them. PVP with 0.2 times the quality of the product was continuously ground into a homogenate. The homogenate was leached in a 4°C refrigerator for 12 h and centrifuged (10,000 r/min, 4°C, 20 min); the supernatant was transferred to a Petri dish and placed in a lighted incubator to dry. A total of 2.5 ml was added to the residue with 80% methanol and leached in a 4°C refrigerator for 12 h, followed by centrifugation. This was repeated three times. After the liquid in the petri dish dried, 2.5 ml of 100% methanol was added to dissolve the dry sample, which was placed into a centrifuge tube and centrifuged (10,000 r/min, 4°C, 10 min). The supernatant was then filtered with a 0.22-μm organic filter membrane and placed in a refrigerator at 4°C. The salicylic acid (SA) content was determined by high-performance liquid chromatography.
Betaine
The sample was predried at 105°C to a constant weight, 0.4 g of the dried sample was weighed, 50 ml of glacial acetic acid was added, and heated to dissolve. A total of 25 ml of mercuric acetate solution was added and allowed to cool, then two drops of crystal violet indicator were added and titrated with perchloric acid standard solution (0.1 mol/L) until the solution turned green. The titration result was corrected with a blank test, and high-performance liquid chromatography was used to determine the content of SA.
Statistical analysis
Differences in expression levels were investigated using a one-way analysis of variance (ANOVA). The means of the values were compared using Tukey’s multiple comparison tests. A p-value of <0.05 was considered significant. For conjoint analysis, the correlation analysis between the top 100 DEGs and the top 50 differential metabolites was performed, and the p-value was calculated. KEGG enrichment analysis was then performed on these significantly related DEGs and differential metabolites. A p-value of <0.05 was considered significant.
Results
Effects of salt stress on plant physiological indicators
Physiological indicators showed that plant height, leaf area, and chlorophyll contents showed no significant difference between the two sorghum varieties under normal conditions (Figure 1). However, after salt treatment, these three indicators in the salt-tolerant sorghum LRNK1 were significantly higher than in the salt-sensitive LR2381. In addition, RWC in LR2381 leaves and roots had significantly lower contents than that in LRNK1, which revealed the serious water loss in the salt-sensitive LR2381 due to salt stress. The morphological differences between salt-tolerant and salt-sensitive sorghum under salt stress are obvious in the seedling period, jointing period, and mature period (Table 1; Figure 1).
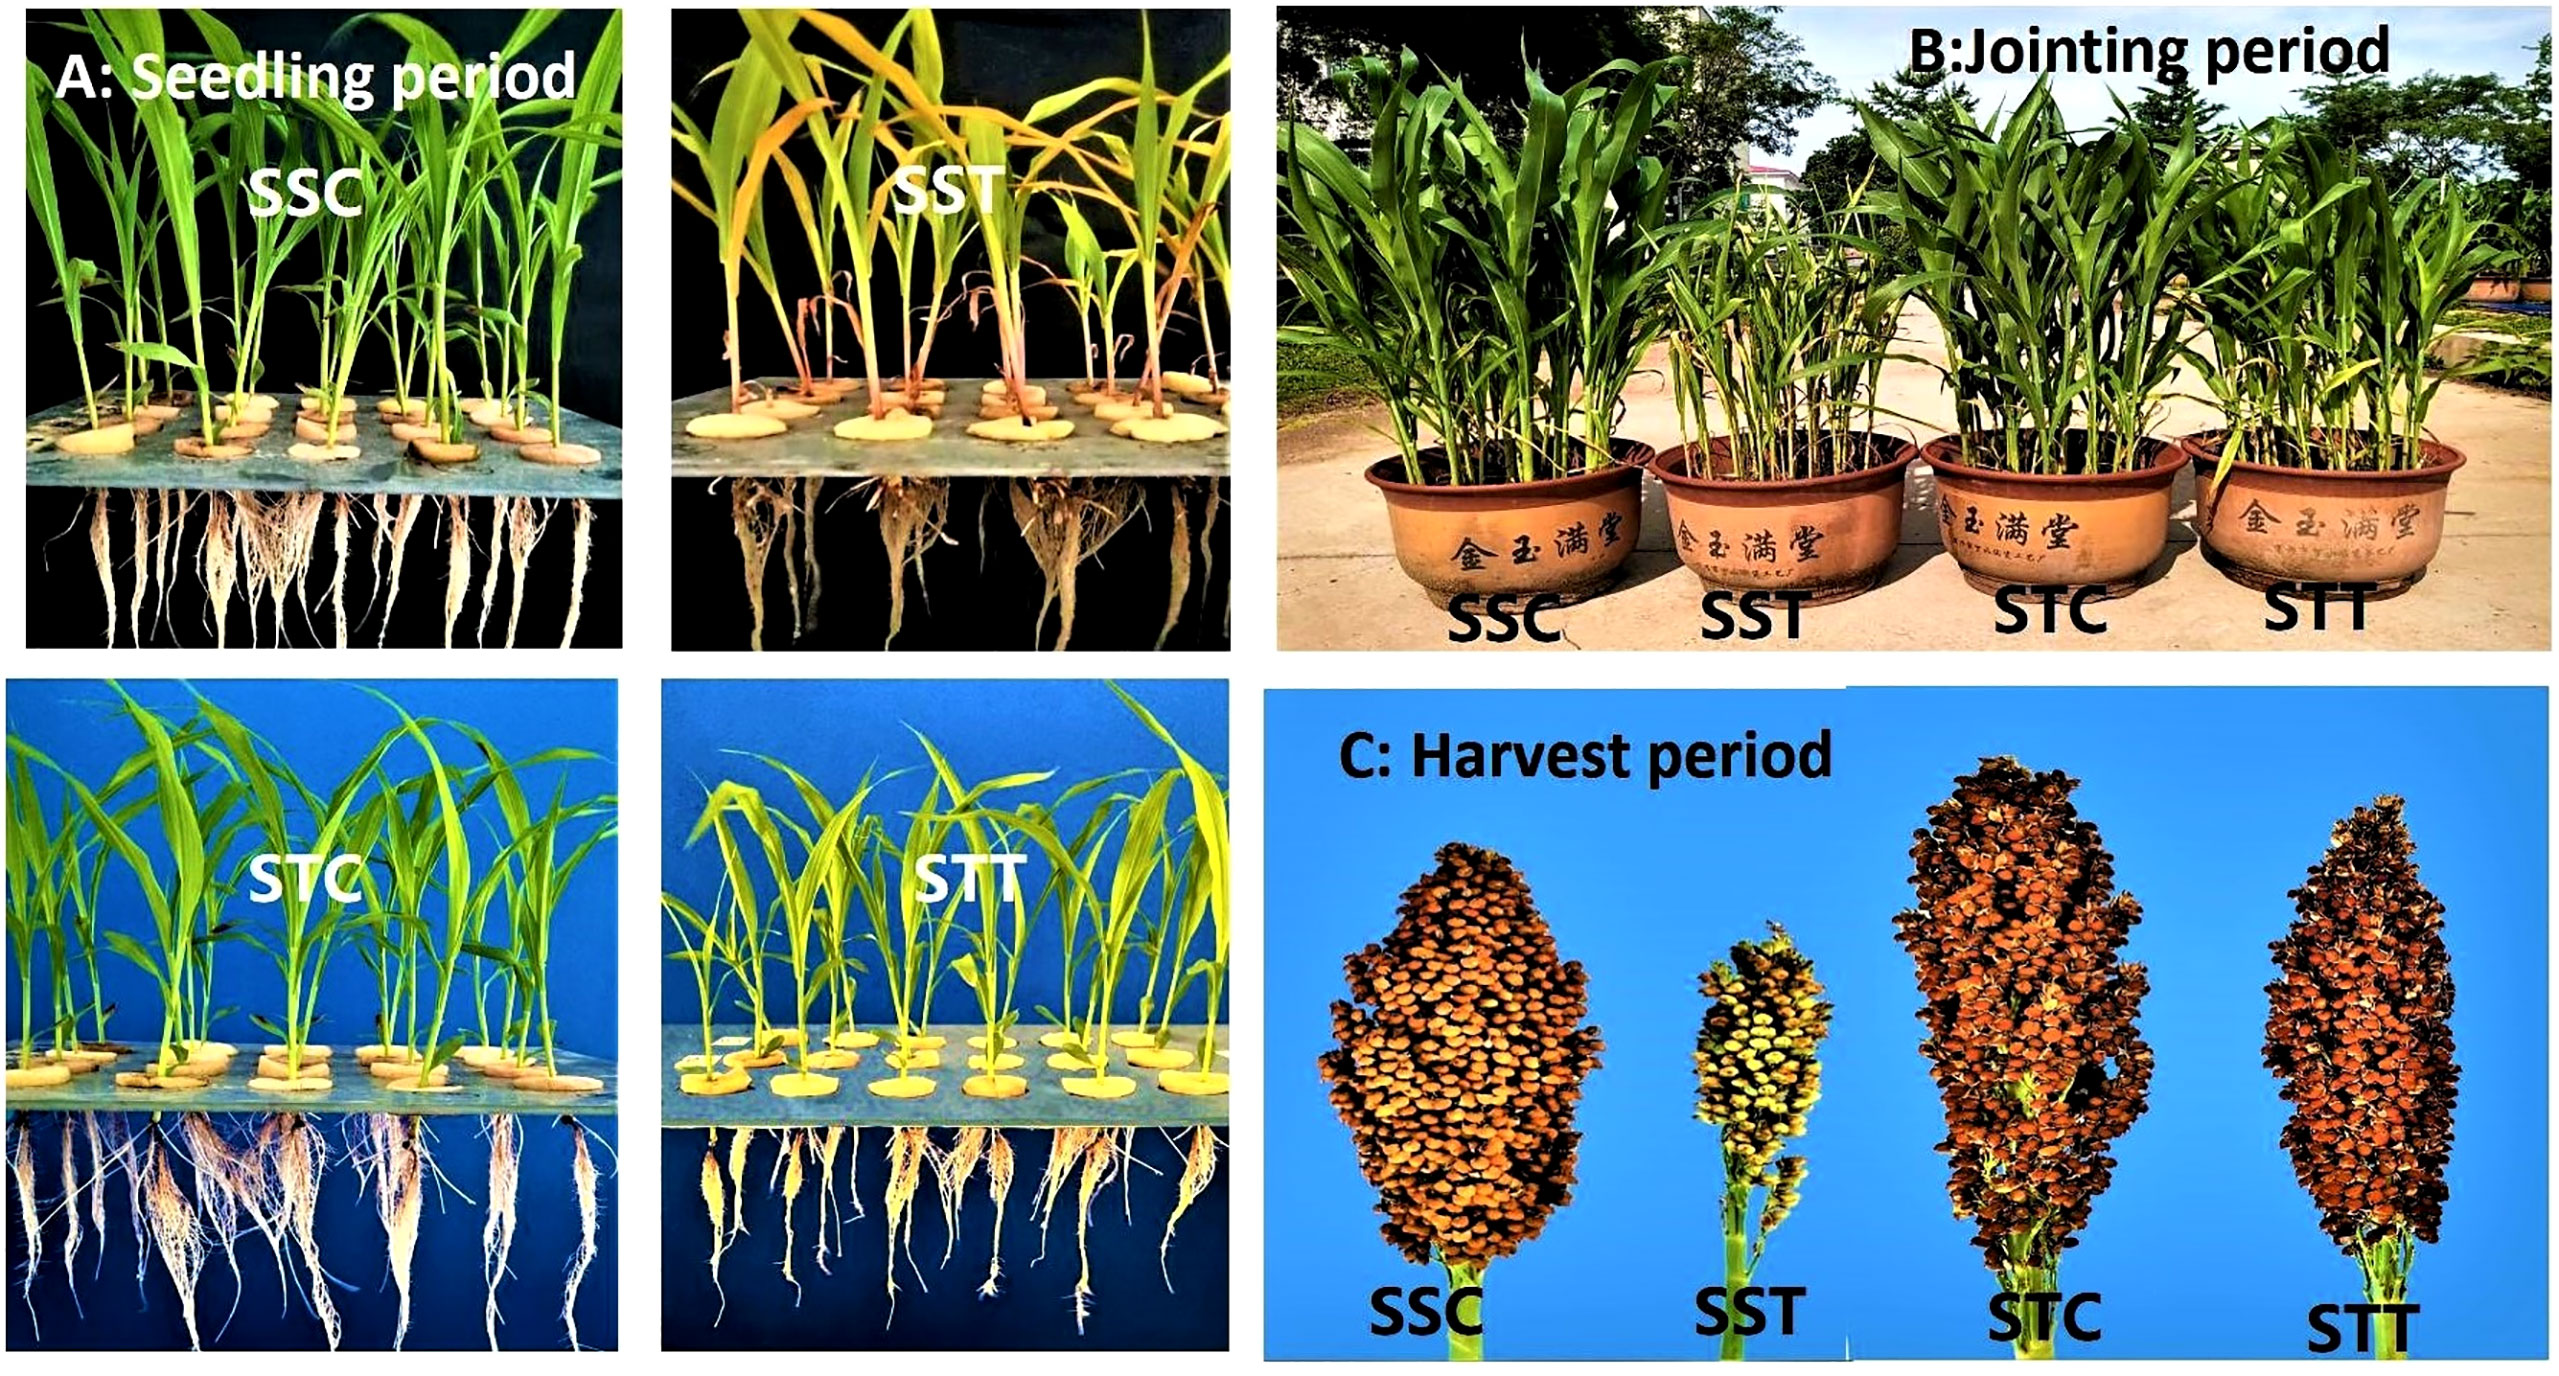
Figure 1 Phenotypic differences between salt-tolerant and salt-sensitive genotypes of sorghum under control and salt stress at seedling period, jointing period, and mature period (A) Control vs salt stress phenotypic differences at seedling period. (B) Control vs salt stress phenotypic differences at jointing period. (C) Control vs salt stress phenotypic differences at harvest period.
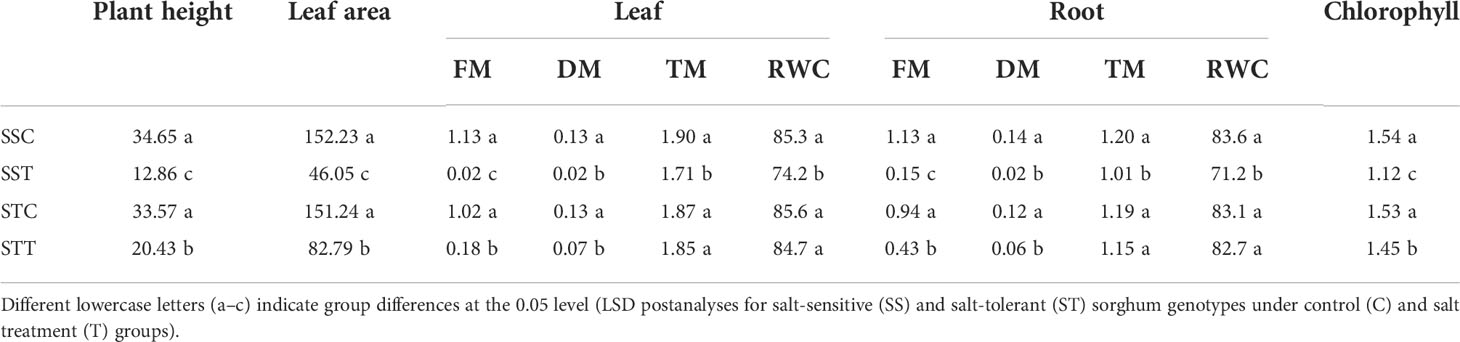
Table 1 Plant physiological indicators for plant height, leaf area, leaf (FM, DM, TM, RWC), root (FM, DM, TM, RWC), and chlorophyll of salt-sensitivity (SS).
Illumina sequencing data summary
A total of 458.10 Mb of raw reads from the 12 libraries were generated, with an average sequencing error rate of 0.02% and an average GC content of 54.74% (Supplementary Table S2). The average data ratio of sequencing quality to Q20 and Q30 was 97.96% and 94.34%, respectively. After read mapping analysis, an average of 92.59% of reads were uniquely mapped to the sorghum genome sequence (Supplementary Table S2). PCA results showed that the biological repeat samples in each group are clustered together (Supplementary Figure S1A). Sample-to-sample correlation analysis results showed a similar result with PCA, indicating good consistency and reproducibility between biological repetitions (Supplementary Figure S1B).
DEGs between salt treatment and control group
A total of 10,771 DEGs were identified by pairwise comparison of all the groups. There were 2,354, 4,162, 719, and 1,559 upregulated DEGs and 1,863, 3,797, 1,169, and 1,576 downregulated DEGs found during the comparison of STT vs. STC, SST vs. SSC, STC vs. SSC, and STT vs. SST, respectively (Figure 2A). The expression pattern of all DEGs showed a significant distinction between different groups (Figure 2B). Venn diagram analysis results showed that there were 3,326 common DEGs between STT vs. STC and SST vs. SSC (Figure 2C).
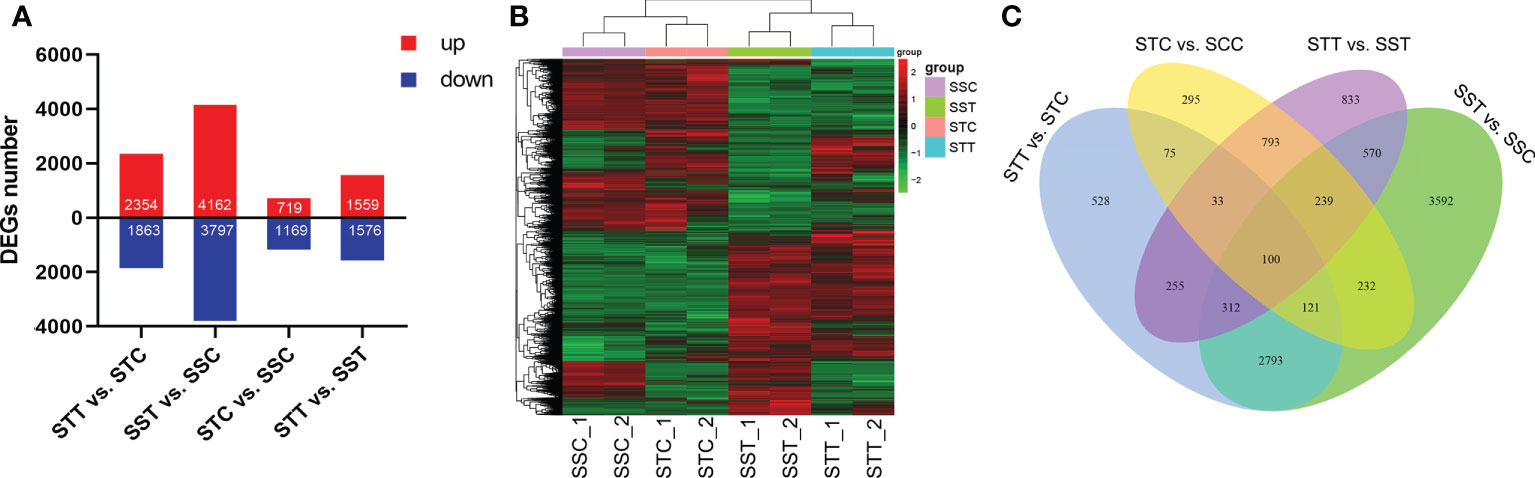
Figure 2 Summary of DEGs between salt treatment and control. (A) Number of DEGs in different comparisons. STC: LRNK1-Control, STT: LRNK1-Salt treatment, SSC: LR2381-Control, SST: LR2381-Salt treatment; (B) Expression heatmap of DEGs in different groups. The redder the color, the higher the expression; the greener the color, the lower the expression. (C) Venn diagram analysis results among different comparisons.
Functional analysis of DEGs
To reveal the role of DEGs, GO and KEGG enrichment analyses were performed. GO enrichment results revealed that 11 GO terms were significantly enriched in STT vs. STC, including carbohydrate catabolic process (GO:0016052) and transmembrane transport (GO:0055085). Most of the DEGs were upregulated in the carbohydrate catabolic process, including SbFBA (fructose-bisphosphate aldolase), SbPGK (phosphoglycerate kinase), and SbPFK (pyrophosphate-fructose 6-phosphate) family members (Figure 3A). In addition, some GO processes related to DNA replication were also related based on downregulated DEGs in STT vs. STC, including DNA metabolic process (GO:0006259), mismatch repair (GO:0006298), and mismatched DNA binding (GO:0030983). SbCAT (catalase), SbPUT (polyamine transporter), SbMSH (DNA mismatch repair protein), and SbBAT (amino-acid permease) were the key differentially expressed regulators in these GO terms (Figure 3B). For the salt-sensitive species LR2381, 16 GO terms were enriched, most of which were related to photosynthesis, including photosynthesis (GO:0015979), photosystem II (GO:0009523), and thylakoid (GO:0009579). DEGs like SbpsbP (photosystem II oxygen-evolving complex protein), Sbpsa (photosystem I assembly factor), and SbLHCs (light-harvesting complex) played key roles in these processes (Figure 3C). KEGG results showed that biosynthesis of amino acids (sbi01230), carbon fixation in photosynthetic organisms (sbi00710), glutathione metabolism (sbi00480), and circadian rhythm–plant (sbi04712) were significantly enriched based on the DEGs in STT vs. STC, and most DEGs involved were upregulated with salt treatment. Most of the genes in the C4-dicarboxylic acid cycle (belonging to sbi00710) were active. SbPIF (ATP-dependent DNA helicase), SbHY5 (transcription factor HY5), and SbFT (FT-interacting protein) in circadian rhythm–plants were upregulated. For DEGs in the glutathione metabolism, SbNADP+ was downregulated and SbGST (probable glutathione S-transferase) was upregulated. As for SST vs. SSC, the upregulated DEGs were enriched in carbon fixation in photosynthetic organisms (sbi00710), plant hormone signal transduction (sbi04075), MAPK signaling pathway–plant (sbi04016), glutathione metabolism (sbi00480), and carbon metabolism (sbi01200). The downregulated DEGs were enriched in porphyrin and chlorophyll metabolism (sbi00860), photosynthesis (sbi00195), carbon metabolism (sbi01200), starch and sucrose metabolism (sbi00500), and the TCA cycle (sbi00020). DEGs in plant hormone signal transduction showed that SbPP2C (probable protein phosphatase 2C), SbABF, SbIAA (Auxin), SbEIN3 (EIN3-binding F-box protein), and all genes related to salicylic acid (including SbJAR1, SbNPR1, and SbTGA) increased by salt treatment (Figure 4). Also, SbMAP3K responded positively to salt stress. Photosynthesis-related genes, including SbPsa, SbPsb, and SbPet, were downregulated by salt stress.
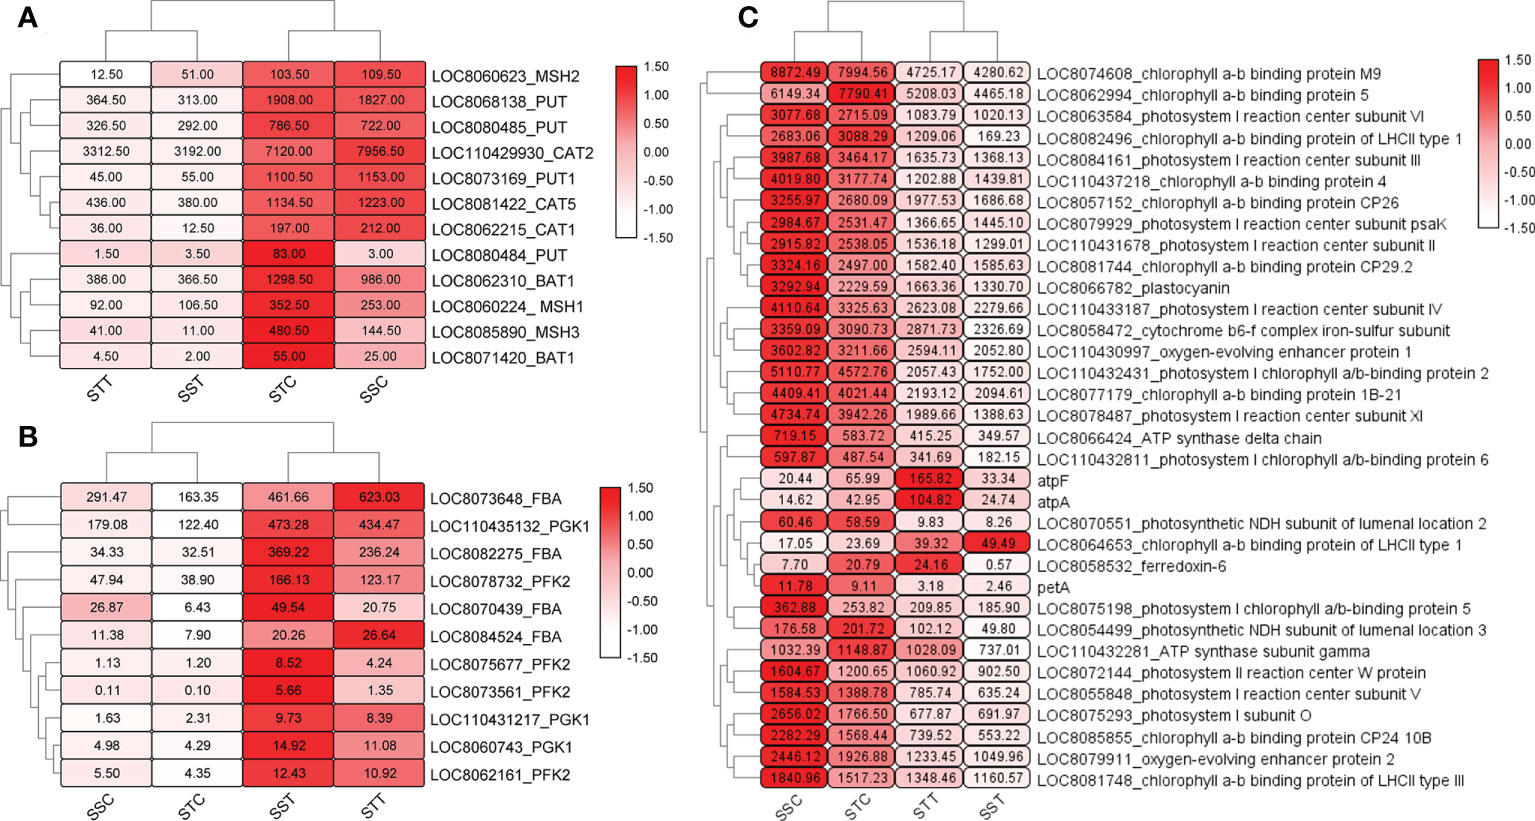
Figure 3 Heatmap of differently expressed genes (DEGs) in candidate pathways. The redder and larger the circle, the higher the expression. (A) Expression of DEGs in carbohydrate catabolic process. (B) Expression pattern of transcripts of SbCAT, SbPUT, SbMSH, and SbBAT. (C) Expression of DEGs related to photosynthesis.
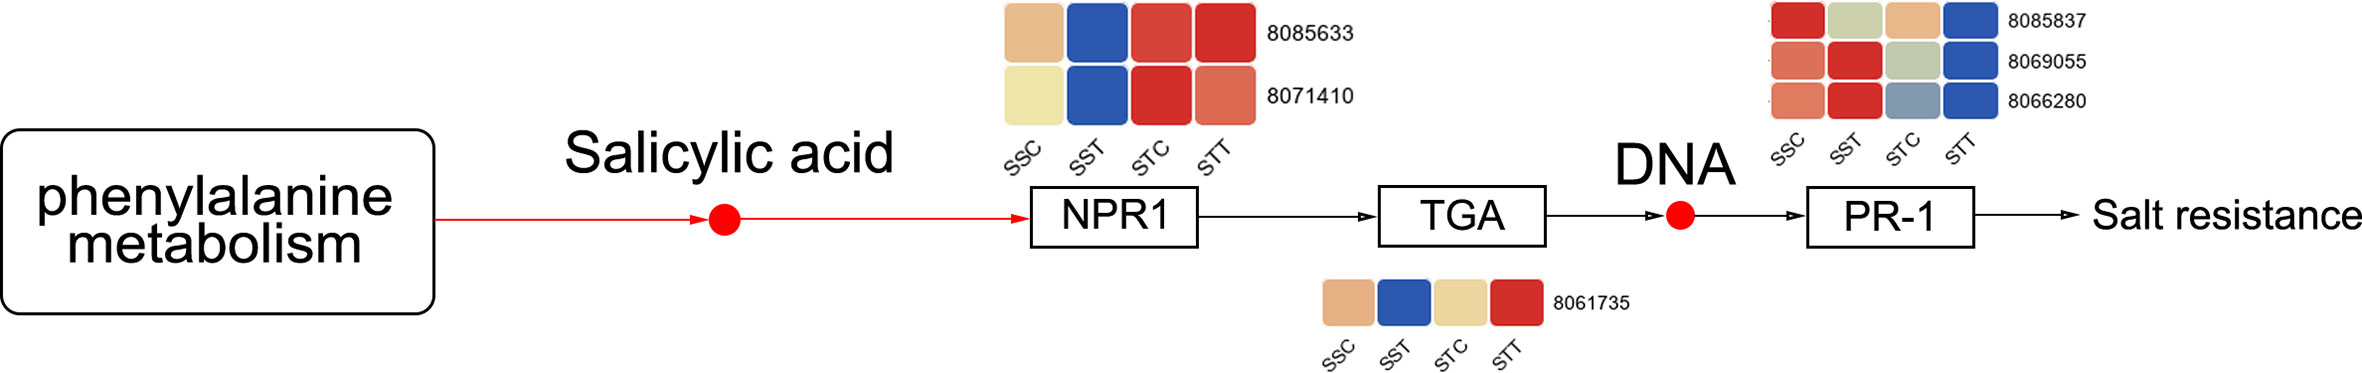
Figure 4 Differently expressed genes (DEGs) in the salicylic acid signal pathway. The redder the circle, the higher the expression. STC: LRNK1-Control, STT: LRNK1-Salt treatment, SSC: LR2381-Control, SST: LR2381-Salt treatment.
Summary of the LC-MS/MS metabolomics
The MS raw data (total ion current (TIC)) showed that there were 548 and 824 metabolites detected from all samples and quality controls under the negative and positive modes, respectively. PCA results showed that metabolisms differed between groups (Supplementary Figures S2A, B). XComparison analysis determined that there were 63 and 66 differential metabolites in STT vs. STC under negative and positive ion modes, respectively (Supplementary Figures S2D, E). As for SST vs. SSC, there were 40 and 46 differential metabolites under negative and positive ion modes, respectively (Supplementary Figure S2C, D).
Differential metabolites responding to salt stress
In the negative ion mode, distinct profiles of these metabolites are shown by a heatmap in these four groups (Figure 5A). In salt-tolerant LRNK1, 32 and 31 metabolites were up- and downregulated, respectively, after salt treatment. As for the salt-sensitive LR2381, salt stress mediated 31 upregulated and nine downregulated metabolites (Figure 5B). The results of the KEGG enrichment analysis showed that plant hormone signal transduction (sbi04075) was significantly enriched, which was partially regulated by salicylic acid (Com_87_neg). Aside from the two metabolites, salt stress decreased the contents of 2-oxobutyric acid (Com_274_neg), which was involved in multiple pathways but was different in the two sorghum species. In addition, phenylalanine metabolism (map00360) and starch and sucrose metabolism (map00500) were active for energy homeostasis to cope with salt stress. Of these, five metabolites showed different profiles in STT vs. STC and SST vs. SSC (Table 2; Figure 5C), which is important.
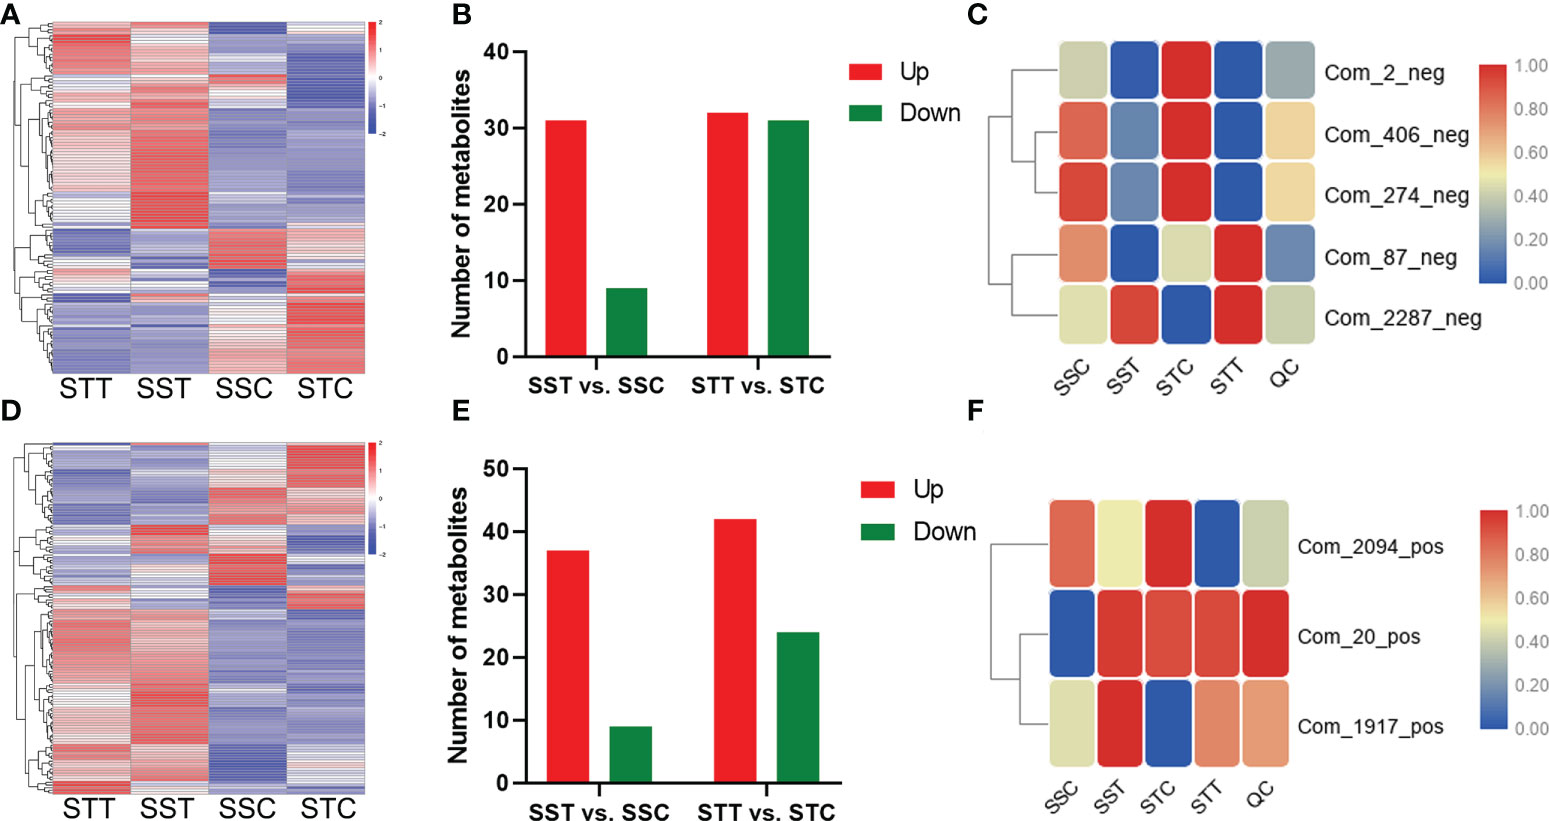
Figure 5 Differential metabolites respond to salt stress. (A, D) mean the differential metabolite content in different groups under negative and positive modes, respectively. The redder the circle, the higher the content. (B, E) showed the differential metabolite content in different comparisons under negative and positive modes, respectively. (C, F) showed the candidate metabolite profile content in different groups under negative and positive modes, respectively. The redder the circle, the higher the content.
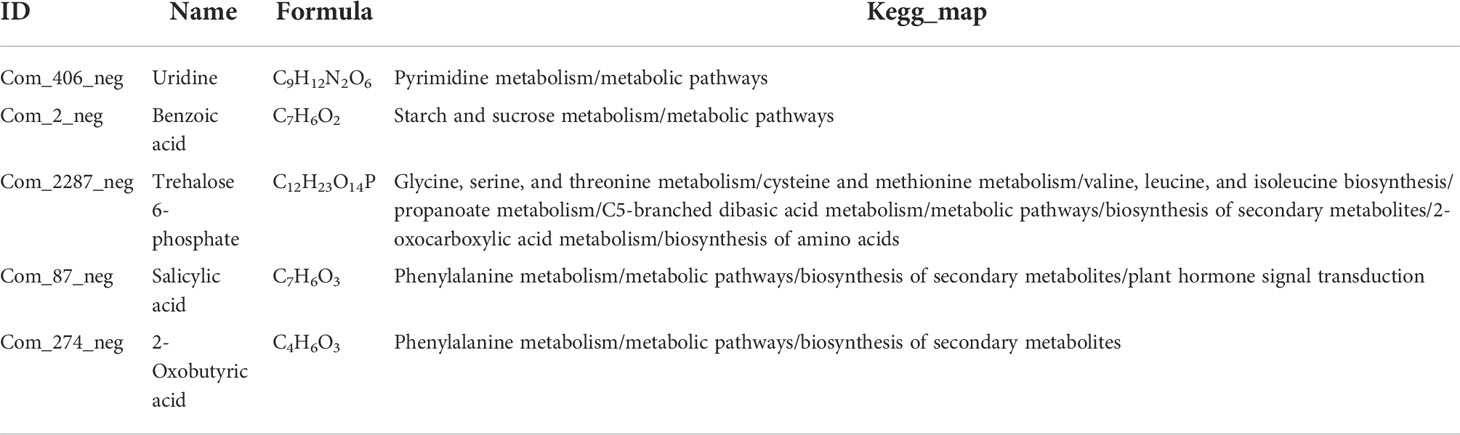
Table 2 Five candidate metabolites in negative ion mode for salt-tolerant (ST) sorghum genotype under salt treatments (T).
In the positive ion mode, distinct metabolic profiling was found after salt treatment (Figure 5D). In LRNK1, 42 and 24 metabolites were up- and downregulated, respectively. In LR2381, salt stress mediated 37 upregulated and nine downregulated metabolites (Figure 5E). Metabolic profiling in salt-tolerant LRNK1, glutathione metabolism (map00480), and flavonoid biosynthesis (map00941) were significantly enriched in KEGG analysis, in which glutathione disulfide (Com_2094_pos) and gallocatechin (Com_1917_pos) act as the key regulators, respectively. As for the salt-sensitive LR2381, Betaine (Com_20_pos) in glycine, serine, and threonine metabolism and ABC transporters pathway were upregulated by salt stress. The expression of these three differential metabolites in different groups indicated that they were the key metabolites affected by salt stress (Table 3; Figure 5F).
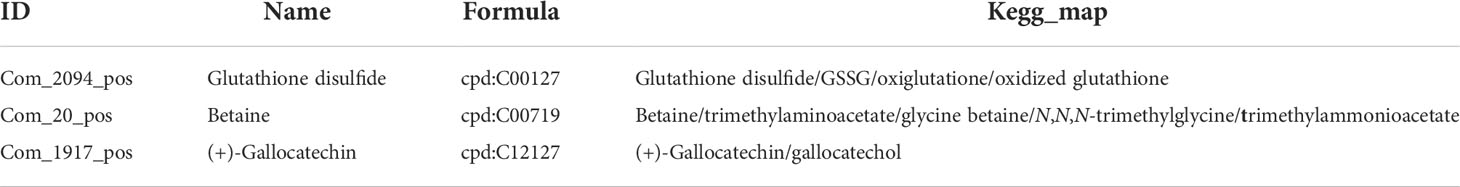
Table 3 Three candidate metabolites in positive ion mode for salt-tolerant (ST) sorghum genotypes under salt treatments (T).
Conjoint analysis of metabolomic and transcriptomic data
To better understand the relationship between DEGs and differential metabolites, integration analysis of metabolomic and transcriptomic data was performed. Association results of the KEGG pathway showed that plant hormone signal transduction (sbi04075) was active in both LRNK1 and LR2381. Glutathione metabolism (sbi00480) was active in salt-tolerant LRNK1 but not enriched in LR2381 (Figures 6A–D). This demonstrates that plant hormone signal transduction (sbi04075) and glutathione metabolism (sbi00480) are the key pathways responding to salt stress.
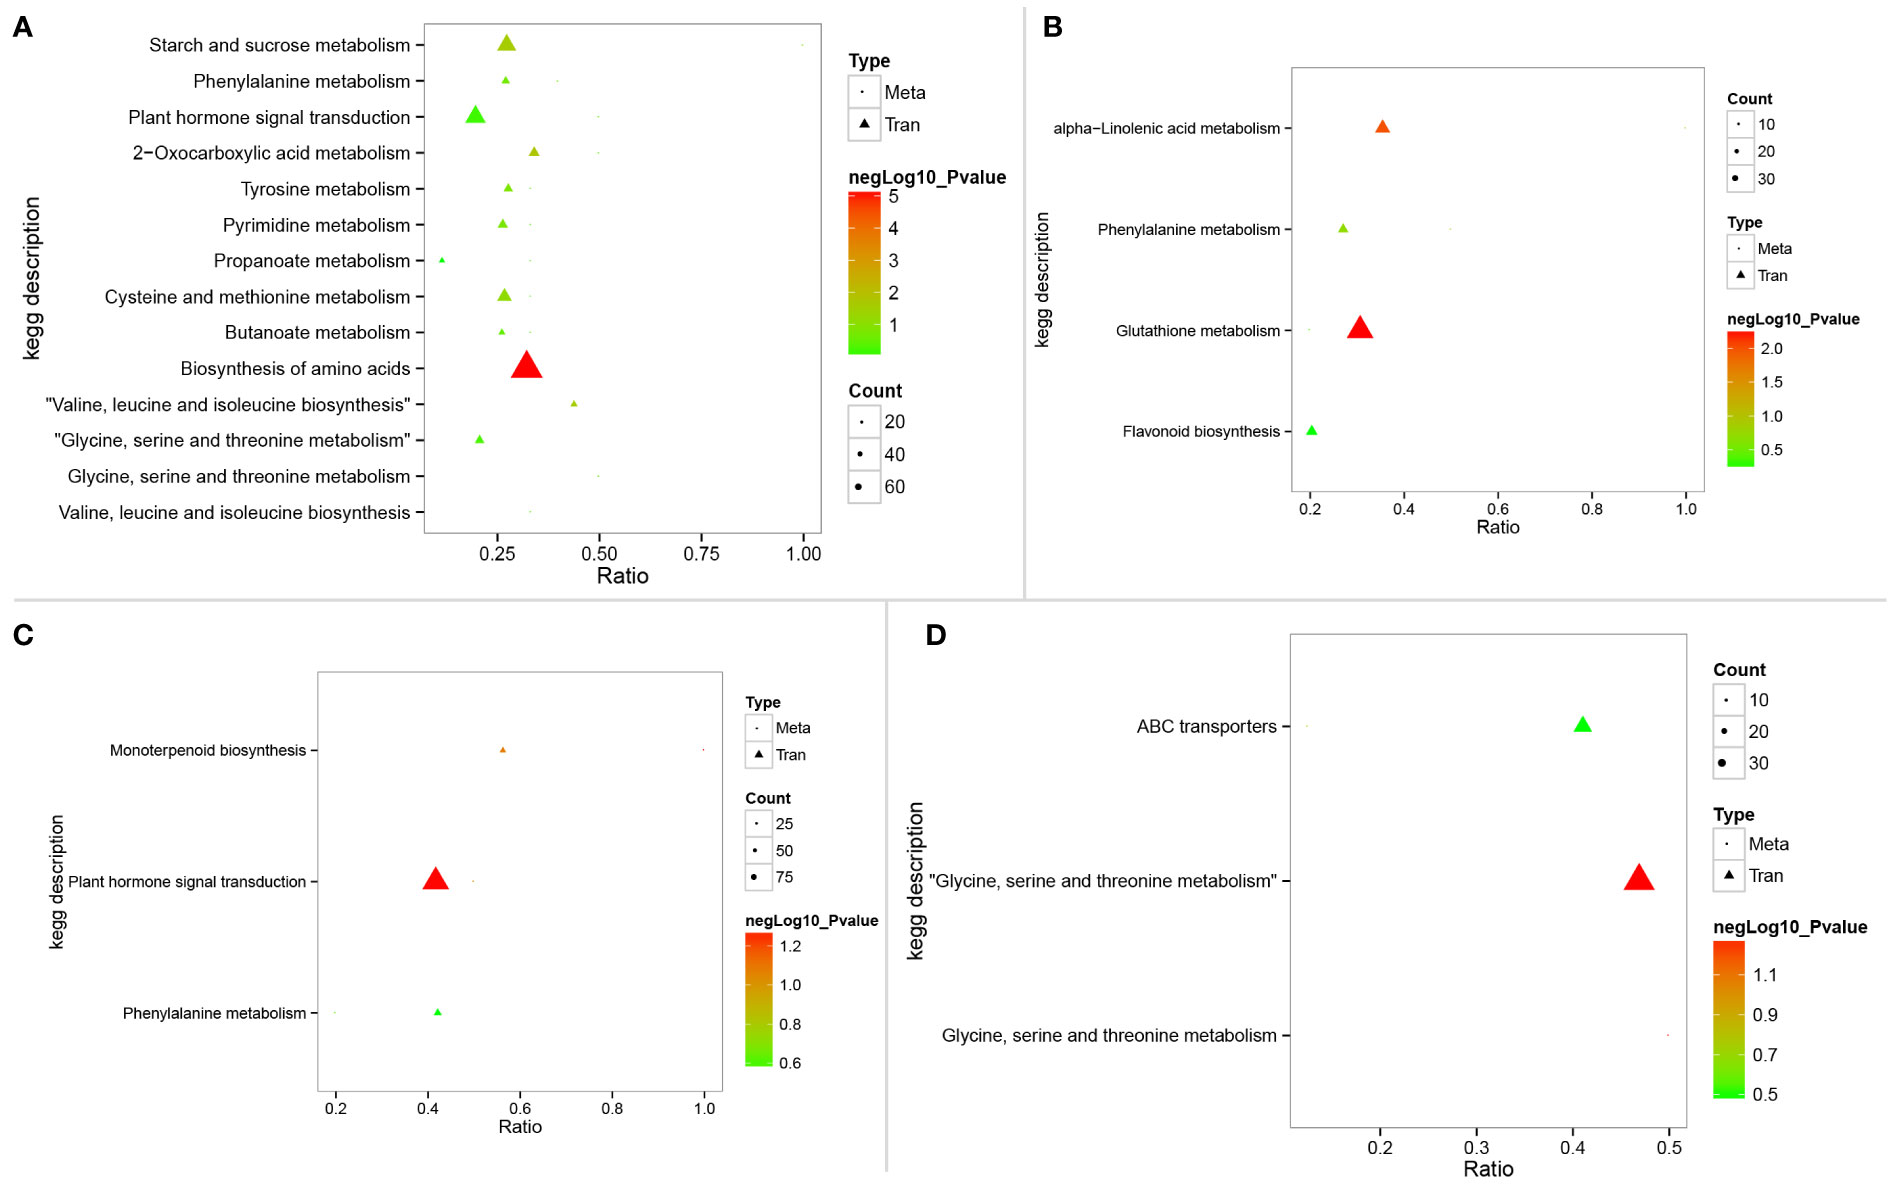
Figure 6 KEGG pathways enriched in integration analysis of metabolomics and transcriptomic data. (A–D) represent the KEGG enriched results in SST vs. SSC, STC vs. SSC, STT vs. SST, and STT vs. STC, respectively. STC: LRNK1-Control, STT: LRNK1-Salt treatment, SSC: LR2381-Control, SST: LR2381-Salt treatment.
Discussion
As sessile organisms, plants have developed sophisticated strategies to respond to diverse environmental stresses. Stress signals are perceived by several receptors at the cell membrane level, followed by their transduction to multiple second messengers such as abscisic acid (ABA), hydrogen peroxide (H2O2), and nitric oxide (NO) (Shi et al., 2014). In this study, the protective role of metabolites and gene expression patterns on the response to salt stress was revealed. A decrease in dry and fresh weights indicated that the leaves and roots of sorghum were damaged by short-term salt treatment. Relative water content is considered one of the easiest agricultural parameters that can be used to screen plants for drought and stress tolerance (Boutraa et al., 2010). The significant decrease in relative water content after salt stress in our results aligns with this view. Similar to our results, Nxele found that salinity stress could reduce water retention in sorghum plants (Nxele et al., 2017), which is a common response to salt stress. Under adverse circumstances, the chlorophyll level in the plant is a good indicator of photosynthetic function (Xu et al., 2008; Dourado et al., 2022). It has been found that the chlorophyll level of plants decreases with aggravated salt stress (Pires et al., 2015; Rachoski et al., 2015; Dąbrowski et al., 2016). In this study, we demonstrated that the chlorophyll content in the leaves of sorghum plants was significantly decreased by salt stress, which could be affected by oxygen species (ROS) such as O2− and H2O2 that leads to lipid peroxidation and chlorophyll destruction (Foreman et al., 2003; Rustioni et al., 2015; Dąbrowski et al., 2016). The expression of DEGs related to chlorophyll was also decreased by salt stress, which was consistent with the chlorophyll level of leaves.
The transcriptome analysis results revealed the DEGs and pathways that respond to salt stress. Two sorghum species showed differences in several biological processes. In this study, the carbohydrate catabolic process was active after salt treatment. Carbohydrates act as signaling molecules and play a role in adaptive mechanisms to stress (Hanson and Smeekens, 2009; Ramel et al., 2009). Energy provision was essential for plants to survive under abiotic stresses. To fight against abiotic stress, the upregulation of catabolism-related proteins such as phosphoglycerate kinase to activate energy-generating processes seems reasonable (Ma et al., 2017). We found that members of the SbFBAs, SbPGKs, and SbPFKs families increased under salt stress, indicating an active energy metabolism during salt stress. Most of the DEGs had higher expression in the salt-tolerant LRNK1 than in the salt-sensitive LR2381 in the control group. Under salt treatment, the expression of these genes dramatically increased in both species. The salt tolerance of sorghum plants could be related to the energy supply of carbohydrates under normal conditions.
To defend against salt stress, plant hormone signal transduction (sbi04075) was active, where the salicylic acid signal pathway showed different response patterns between the two sorghum species. As expected, the metabolite salicylic acid (Com_87_neg) showed a great difference between LRNK1 and LR2381, highlighting the critical role of the salicylic acid signal pathway during salt stress. Salicylic acid is a signaling molecule known to participate in defense responses against a variety of environmental stresses (Jayakannan et al., 2015a). Previous studies have reported that salicylic acid is an important signaling phytohormone that can increase salt tolerance in plants (Borsani et al., 2001; Horváth et al., 2007; Jayakannan et al., 2015b).
Salicylic acid-mediated resistance is related to the expression of pathogenesis-related (PR) genes (Vicente and Plasencia, 2011), which is partially controlled by redox-regulated nonexpresser of pathogenesis-related 1 (NPR1) protein, a positive regulator of salicylic acid signaling acting downstream of salicylic acid (Mou et al., 2003). NPR1 has also been shown to serve as a salicylic acid receptor (Wu et al., 2012). The overexpression of NPR1 in many species enhances the resistance of transgenic plants to stress (Chern et al., 2001; Fitzgerald et al., 2004). In our results, transcripts of SbNPR1 (8085633 and 8071410) were more highly expressed in LRNK1 than in LR2381, and the contents of salicylic acid increased in LRNK1 and decreased in LR2381 after salt stress. This could lead to higher resistance in LRNK1 sorghum.
Applying certain concentrations of salicylic acid can reduce the salt stress of many plants, including peanuts and wheat (Mahmood et al., 2010). Salicylic acid can increase the content or activity of antioxidant enzymes in plants during salt tolerance, and maintain the stability of the membrane system in plants to improve their salt tolerance of plants. The contents of hydrogen peroxide (H2O2) and superoxide anion radical (O2−) and the harmful oxidation of lipids in plant cells could be appraised by increased malonaldehyde (MDA) content (Zhang X., 1992).
Increasing evidence has demonstrated that jasmonic acid functions in the regulation of plant responses to abiotic stresses (Qiu et al., 2014; Ding et al., 2015; Salimi et al., 2016; Aboagla et al., 2022). Although the results of metabolomics did not reflect differences in jasmonic acid between different species, transcripts of SbJAZ had higher expression in LRNK1 than in LR2381. JAZ proteins are involved in abiotic stress tolerance mechanisms (Ye et al., 2009; Kazan, 2015; Chini et al., 2017). Enhanced stress tolerance of transgenic lines overexpressing JAZ proteins has been described in rice, cotton, and wild soybean (Ye et al., 2009; Wu et al., 2014; Zhao et al., 2016; Zhu et al., 2012). From the results, we speculated that the higher expression of SbJAZ promoted resistance to salt stress in LRNK1 sorghum. The integration of metabolomic and transcriptomic results also supports this inference.
Betaine can protect plants from the adverse effects of abiotic stresses by ROS detoxification, adjusting cellular osmotica, and protecting membrane integrity (Ashraf and Foolad, 2007; Hayat et al., 2012). The overaccumulation of betaine can improve the stress resistance of wheat in a high-salt environment (Tian et al., 2016). In this study, the content of betaine (Com_20_pos) in STC (LRNK1 without salt treatment) was significantly higher than that of SSC (LR2381 without salt treatment). After salt treatment, the betaine in LR2381 increased; however, due to the lack of betaine reserves before salt treatment, the LR2381 plants suffered considerable damage under salt stress. Sufficient betaine reserves can likely help sorghum plants resist salt stress.
Conclusion
The damage of salt stress to sorghum was similar to that of other plants, including decreases in relative water content, chlorophyll, and leaf weight. The dynamic gene expression pattern responded to salt stress. As a salt-tolerant species, LRNK1 sorghum can defend against salt stress by a variety of biological processes. According to our results, sufficient carbohydrate energy reserves under normal conditions are important for resisting salt stress, and the expression of SbFBAs, SbPGKs, and SbPFKs could reflect the activity of the carbohydrate catabolic process. Importantly, the salt tolerance of sorghum was mediated by salicylic acid. Plants with higher salt tolerance have a higher salicylic acid content. Additionally, the expression of SbNPR1, a salicylic acid receptor, was positively correlated with salt tolerance. Similarly, betaine had been shown to respond to salt stress in sorghum, the accumulation of which under normal conditions was important for resisting salt stress. Moreover, a higher expression of SbJAZ promoted resistance to salt stress in LRNK1 sorghum. The results of this research will play an important role in revealing the metabolic regulatory mechanism of sorghum salt tolerance and will contribute to sorghum breeding for salt tolerance, the efficient production of salt tolerance, and the development and utilization of saline land.
Data availability statement
The datasets presented in this study can be found in online repositories. The names of the repository/repositories and accession number(s) can be found below: NCBI [accession: PRJNA810939].
Author contributions
Lab work primarily conducted by FZ at Liaoning Agriculture Science as a PhD. FL, YW, ZZ, JW, KuZ, HW, JZ, YD, FK provided help for the manuscript preparation. KaZ provided technical guidance and advice for experiment design during the research. All authors contributed to the article and approved the submitted version.
Funding
This research was funded by the following projects: National Key R&D Program of China (2019YFD1001700), China Agriculture Research System of MOF and MARA (CARS-06), Liaoning Provincial Natural Science Foundation Project, China (2019-MS-197), Science and Technology Plan of Shenyang in 2022-Research on Sorghum Germplasm Innovation and breeding of high-quality special varieties, General Project of the Dean’s Fund of Liaoning Academy of Agricultural Sciences, China (2021MS0504), and Agricultural Public Relations and Industrialization Project in Liaoning Province, China (2020JH2/10200014).
Conflict of interest
The authors declare that the research was conducted in the absence of any commercial or financial relationships that could be construed as a potential conflict of interest.
Publisher’s note
All claims expressed in this article are solely those of the authors and do not necessarily represent those of their affiliated organizations, or those of the publisher, the editors and the reviewers. Any product that may be evaluated in this article, or claim that may be made by its manufacturer, is not guaranteed or endorsed by the publisher.
Supplementary material
The Supplementary Material for this article can be found online at: https://www.frontiersin.org/articles/10.3389/fpls.2022.880373/full#supplementary-material
Supplementary Figure 1 | Samples correlation and PCA results based on the sequence data. (A) Pearson correlation between samples. (B) PCA results based on the sequence data.
Supplementary Figure 2 | KEGG pathways enriched in integration analysis of metabolomics and transcriptomic data. (A–D) represent the KEGG enriched results in SST vs. SSC, STC vs. SSC, STT vs. SST, and STT vs. STC, respectively. STC: LRNK1-Control, STT: LRNK1-Salt treatment, SSC: LR2381-Control, SST: LR2381-Salt treatment.
References
Aboagla, M., Zhou, G., Nimir, N., Adam, Y. (2022). Effect of exogenous ascorbic acid on two sorghum varieties under different types of salt stress. Chil J. Agric. Res. 82 (1), 10–20.
Agboma, P., Jones, M., Peltonen-Sainio, P., Rita, H., Pehu, E. (2008). Exogenous glycinebetaine enhances grain yield of maize, sorghum and wheat grown under two supplementary watering regimes. J. Agron. Crop Sci. 178, 29–37. doi: 10.1111/j.1439-037X.1997.tb00348.x
Almodares, A., Hadi, M. (2009). Production of bioethanol from sweet sorghum: A review. Afr J. Agr Res. 4, 772–780.
Amzallag, G., Lerner, H., Poljakoff-Mayber, A. (1990). Exogenous ABA as a modulator of the response of sorghum to high salinity. J. Exp. Bot. 41, 1529–1534. doi: 10.1093/jxb/41.12.1529
Anami, S. E., Zhang, L. M., Xia, Y., Zhang, Y. M., Liu, Z. Q., Jing, H. C. (2015). Sweet sorghum ideotypes: genetic improvement of stress tolerance. Food Energy Secur 4, 3–24. doi: 10.1002/fes3.54
Ashraf, M., Foolad, M. (2007). Roles of glycine betaine and proline in improving plant abiotic stress resistance. Environ. Exp. Bot. 59, 206–216. doi: 10.1016/j.envexpbot.2005.12.006
Ashraf, M., McNeilly, T. (2004). Salinity tolerance in brassica oilseeds. Crit. Rev. Plant Sci. 23, 157–174. doi: 10.1080/07352680490433286
Biswapriya, B. M., Carl, L., Michael, O., Laura, A. C. (2019). Integrated omics: tools, advances and future approaches. J. Mol. Endocrinol. 62, 21–45. doi: 10.1530/JME-18-0055
Borsani, O., Valpuesta, V., Botella, M. (2001). Evidence for a role of salicylic acid in the oxidative damage generated by NaCl and osmotic stress in arabidopsis seedlings. Plant Physiol. 126, 1024–1030. doi: 10.1104/pp.126.3.1024
Boutraa, T., Akhkha, A., Al-Shoaibi, A., Alhejeli, A. (2010). Effect of water stress on growth and water use efficiency (WUE) of some wheat cultivars (Triticum durum) grown in Saudi Arabia. J. Taibah Univ Sci. 3, 39–48. doi: 10.1016/S1658-3655(12)60019-3
Chai, Y. Y., Jiang, C. D., Shi, L., Shi, T., Gu, W. (2010). Effects of exogenous spermine on sweet sorghum during germination under salinity. Biol. Plantarum .54, 145–148. doi: 10.1007/s10535-010-0023-1
Chandran, A., Kim, J. W., Yoo, Y. H., Park, H. L., Kim, Y. J., Cho, M. H., et al. (2019). Transcriptome analysis of rice-seedling roots under soil-salt stress using RNA-seq method. Plant Biotechnol. Rep. 13, 567–578. doi: 10.1007/s11816-019-00550-3
Chern, M., Fitzgerald, H., Yadav, R., Canlas, P., Dong, X., Ronald, P. (2001). Evidence for a disease-resistance pathway in rice similar to the NPR1-mediated signaling pathway in arabidopsis. Plant J. 27, 101–113. doi: 10.1046/j.1365-313x.2001.01070.x
Chini, A., Ben-Romdhane, W., Hassairi, A., Aboul-Soud, M. (2017). Identification of TIFY/JAZ family genes in solanum lycopersicum and their regulation in response to abiotic stresses. PloS One 12, e0177381. doi: 10.1371/journal.pone.0177381
Dąbrowski, P., Baczewska-Dąbrowska, A., Pawluśkiewicz, B., Paunov, M., Aleksandrov, V., Goltsev, V., et al. (2016). Prompt chlorophyll a fluorescence as a rapid tool for diagnostic changes in PSII structure inhibited by salt stress in perennial ryegrass. J. Photoch Photobio B. 157, 22–31.
Daldoul, S., Ben Amar, A., Guillaumie, S., Mliki, A. (2014). Integration of omics and system biology approaches to study grapevine (Vitis vinifera l.) response to salt stress: a perspective for functional genomics - a review. J. Int. Sci. Vigne Vin. 48, 189–200. doi: 10.20870/oeno-one.2014.48.3.1573
D’Amelia, L., Dell’Aversana, E., Woodrow, P., Ciarmiello, L. F., Carillo, P. (2018). Metabolomics for crop improvement against salinity stress. Genome Edi Sys Biol. 2, 267–287.
Dar, D. T., uddin, M., Khan, M. M., Hakeem, K., Jaleel, H. (2015). Jasmonates counter plant stress: A review. Env. Exp. Bot. 115, 49–57. doi: 10.1016/j.envexpbot.2015.02.010
Ding, H., Lai, J., Wu, Q., Zhang, S., Chen, L., Dai, Y.-S., et al. (2015). Jasmonate complements the function of arabidopsis lipoxygenase3 in salinity stress response. Plant Sci. 244, 1–7. doi: 10.1016/j.plantsci.2015.11.009
Dourado, P.R.M., de Souza, E.R., dos Santos, M.A., Monteiro, C.M.T., Monteiro, D., Paulino, M.K.S.S, et al. (2022). Stomatal regulation and osmotic adjustment in sorghum in response to salinity. Agriculture 12, 1–12.
Dugas, D. V., Monaco, M. K., Olson, A., Klein, R. R., Kumari, S., Ware, D., et al. (2011). Functional annotation of the transcriptome of sorghum bicolor in response to osmotic stress and abscisic acid. BMC Genomics .12, 514,1–51421. doi: 10.1186/1471-2164-12-514
Fahad, S., Hussain, S., Matloob, A., Khan, F., Khaliq, A., Saud, S., et al. (2014). Phytohormones and plant responses to salinity stress: a review. Plant Growth Regul. 75, 391–404. doi: 10.1007/s10725-014-0013-y
Fiehn, O. (2002). Metabolomics – the link between genotypes and phenotypes. Plant Mol. Bio 48, 155–171. doi: 10.1023/A:1013713905833
Fitzgerald, H., Chern, M., Navarre, R., Ronald, P. (2004). Overexpression of ( At ) NPR1 in rice leads to a BTH- and environment-induced lesion-Mimic/Cell death phenotype. Mol. Plant M Int. 17, 140–151. doi: 10.1094/MPMI.2004.17.2.140
Foreman, J., Demidchik, V., Bothwell, J., Mylona, P., Miedema, H., Torres, M. A., et al. (2003). Reactive oxygen species produced by NADPH oxidase regulate plant cell growth. Nature 422, 442–446. doi: 10.1038/nature01485
Fracasso, A., Trindade, L. M., Amaducci, S. (2016). Drought stress tolerance strategies revealed by RNA-seq in two sorghum genotypes with contrasting WUE. BMC Plant Biol. 16, 115. doi: 10.1186/s12870-016-0800-x
Hanson, J., Smeekens, S. (2009). Sugar perception and signaling–an update. Curr. Opin. Plant Bio. 12, 562–567. doi: 10.1016/j.pbi.2009.07.014
Hayat, S., Hayat, Q., Alyemeni, M., Wani, D. A., Pichtel, J., Ahmad, A. (2012). Role of proline under changing environment: A review. Plant Signal Behav. 7, 1456–1466. doi: 10.4161/psb.21949
Horváth, E., Szalai, G., Janda, T. (2007). Induction of abiotic stress tolerance by salicylic acid signaling. J. Plant Growth Regul. 26, 290–300. doi: 10.1007/s00344-007-9017-4
Ibrahim, A. (2004). Efficacy of exogenous glycine betaine application on sorghum plants grown under salinity stress. Acta Botan Hungar. 46, 307–318. doi: 10.1556/ABot.46.2004.3-4.5
Iqbal, M., Khan, K., Rahman, H., Sher, H. (2010). Detection of epistasis for plant height and leaf area per plant in maize (Zea mays l.) from generation means analysis. Maydica, 55, 33–39.
Jayakannan, M., Bose, J., Babourina, O., Rengel, Z., Shabala, S. (2015a). Salicylic acid in plant salinity stress signalling and tolerance. Plant Grow Regul. 76, 25–40. doi: 10.1007/s10725-015-0028-z
Jayakannan, M., Bose, J., Babourina, O., Shabala, S., Massart, A., Poschenrieder, C., et al. (2015b). The NPR1-dependent salicylic acid signalling pathway is pivotal for enhanced salt and oxidative stress tolerance in arabidopsis. J. Exp. Bot. 66, 1865–1875. doi: 10.1093/jxb/eru528
Kanehisa, M., Araki, M., Goto, S., Hattori, M., Hirakawa, M., Itoh, M., et al. (2007). KEGG for linking genomes to life and the environment. Nucl. Aci Res. .36, 480–484. doi: 10.1093/nar/gkm882
Karoune, S., Kechebar, M., Falleh, H., Belhamra, M., Rahmoune, C., Ksouri, R. (2017). LC-MS phenolic composition changes and antioxidant capacities of the saharan tree argania spinosa leaves under salinity. Food Nutr. Sci. 9, 1–11.
Kazan, K. (2015). Diverse roles of jasmonates and ethylene in abiotic stress tolerance. Trends Plant Sci. 20, 219–229. doi: 10.1016/j.tplants.2015.02.001
Kim, D., Langmead, B., Salzberg, S. L. (2015). HISAT: a fast spliced aligner with low memory requirements. Nat. Meth 12, 357. doi: 10.1038/nmeth.3317
Kumar, A., Alam, S., Sengupta, N., Sarina, R. (2011). Differential proteomic analysis of salt stress response in sorghum bicolor leaves. Envir Exp. Bot. 71, 321. doi: 10.1016/j.envexpbot.2010.12.017
Kumar, K., Kumar, M., Kim, S. R., Ryu, H., Cho, Y. G. (2013). Insights into genomics of salt stress response in rice. Rice 6, 27. doi: 10.1186/1939-8433-6-27
Lacerda, C., Cambraia, J., Oliva, M., Ruiz, H. (2001). Plant growth and solute accumulation and distribution in two sorghum genotypes, under NaCl stress. Rev. Brasil Fisiol Veg. 13, 107–120. doi: 10.1590/S0103-31312001000300003
Liang, W., Ma, X., Wan, P., Liu, L. (2017). Plant salt-tolerance mechanism: A review. Biochem. Bio Res. Communica .495, 286–291.
Mahmood, T., Raza, S., Qasim, M., Ashraf, M. (2010). Growth modulation and ion partitioning in salt stressed sorghum (Sorghum bicolor l.) by exogenous supply of salicylic acid. Pak .J. Bot. 42, 3047–3054.
Ma, Q., Kang, J., Long, R., Zhang, T., Xiong, J., Zhang, K., et al. (2017). Comparative proteomic analysis of alfalfa revealed new salt and drought stress-related factors involved in seed germination. Mol. Biol. Rep. 44, 1–10. doi: 10.1007/s11033-017-4104-5
Morgenthal, K., Weckwerth, W., Steuer, R. (2006). Metabolomic networks in plants: Transitions from pattern recognition to biological interpretation. Biosystems 83, 108–117. doi: 10.1016/j.biosystems.2005.05.017
Mou, Z., Fan, W., Dong, X. (2003). Inducers of plant systemic acquired resistance regulate NPR1 function through redox changes. Cell .113, 935–944. doi: 10.1016/S0092-8674(03)00429-X
Natera, S., Hill, C., Rupasinghe, T., Roessner, U. (2016). Salt-stress induced alterations in the root lipidome of two barley genotypes with contrasting responses to salinity. Funct. Plant Biol. 43, 207–219. doi: 10.1071/FP15253
Nxele, X., Klein, A., Ndimba, B. K. (2017). Drought and salinity stress alters ROS accumulation, water retention, and osmolyte content in sorghum plants. South Afr J. Bot. 108, 261–266. doi: 10.1016/j.sajb.2016.11.003
Parihar, P., Singh, S., Singh, D. V., Prasad, S. (2014). Effect of salinity stress on plants and its tolerance strategies: a review. Envir Sci. Pollut. Res. 22, 4056–4075. doi: 10.1007/s11356-014-3739-1
Pires, I., Negrao, S., Oliveira, M., Purugganan, M. (2015). Comprehensive phenotypic analysis of rice ( oryza sativa ) response to salinity stress. Phy plantarum 155, 43–54. doi: 10.1111/ppl.12356
Qiu, Z., Guo, J., Zhu, A., Zhang, L., Zhang, M. (2014). Exogenous jasmonic acid can enhance tolerance of wheat seedlings to salt stress. Ecotoxe Envsafety 104, 202–208. doi: 10.1016/j.ecoenv.2014.03.014
Rachoski, M., Gázquez, A., Calzadilla, P. I., Bezus, R., Rodríguez, A., Ruiz, O., et al. (2015). ). chlorophyll fluorescence and lipid peroxidation changes in rice somaclonal lines subjected to salt stress. Acta Physiol. Plantarum 37, 21–29. doi: 10.1007/s11738-015-1865-0
Ramel, F., Sulmon, C., Gouesbet, G., Couée, I. (2009). Natural variation reveals relationships between pre-stress carbohydrate nutritional status and subsequent responses to xenobiotic and oxidative stress in arabidopsis thaliana. Ann. Bot. .104, 1323–1337. doi: 10.1093/aob/mcp243
Roberts, A., Trapnell, C., Donaghey, J., Rinn, J. L., Pachter, L. (2011). Improving RNA-seq expression estimates by correcting for fragment bias. Genome Biol. 12, R22. doi: 10.1186/gb-2011-12-3-r22
Rustioni, L., Milani, C., Parisi, S., Failla, O. (2015). Chlorophyll role in berry sunburn symptoms studied in different grape (Vitis vinifera l.) cultivars. Scientia Horticul. 185, 145–150. doi: 10.1016/j.scienta.2015.01.029
Salimi, F., Shekari, F., Hamzei, J. (2016). Methyl jasmonate improves salinity resistance in German chamomile (Matricaria chamomilla l.) by increasing activity of antioxidant enzymes. Acta Physiol. Plantarum 38, 1–14. doi: 10.1007/s11738-015-2023-4
Shi, H., Jiang, C., Ye, T., Tan, D. X., Reiter, R., Zhang, H., et al. (2014). Comparative physiological, metabolomic, and transcriptomic analyses reveal mechanisms of improved abiotic stress resistance in bermudagrass (Cynodon dactylon l.) pers. by exogenous melatonin. J. Exp. Botany. 66, 681–694. doi: 10.1093/jxb/eru373
Tari, I., Laskay, G., Takács, Z., Poór, P. (2013). Response of sorghum to abiotic stresses: A review. J. Agr Crop Sci. 199, 264–274. doi: 10.1111/jac.12017
Thiele, B., Stein, N., Oldiges, M., Hofmann, D. (2012). Direct analysis of underivatized amino acids in plant extracts by LC-MS-MS. Methods Mol. Biol. 828, 317–328. doi: 10.1007/978-1-61779-445-2_25
Tian, F., Wang, W., Liang, C., Wang, X., Wang, G., Wang, W. (2016). Overaccumulation of glycine betaine makes the function of the thylakoid membrane better in wheat under salt stress. Crop J. 5, 25–36.
Vicente, M., Plasencia, J. (2011). Salicylic acid beyond defence: Its role in plant growth and development. J. Exp. Bot. 62, 3321–3338. doi: 10.1093/jxb/err031
Wen, B., Mei, Z., Zeng, C., Liu, S. (2017). MetaX: a flexible and comprehensive software for processing metabolomics data. BMC Bioinf. 18, 183. doi: 10.1186/s12859-017-1579-y
Wu, H., Ye, H., Yao, R., Zhang, T., Xiong, L. (2014). OsJAZ9 acts as a transcriptional regulator in jasmonate signaling and modulates salt stress tolerance in rice. Plant Sci. 232, 1–12. doi: 10.1016/j.plantsci.2014.12.010
Wu, Y., Zhang, D., Chu, J., Boyle, P., Wang, Y., Brindle, I., et al. (2012). The arabidopsis NPR1 protein is a receptor for the plant defense hormone salicylic acid. Cell Rep. 1 (6), 639–647. doi: 10.1016/j.celrep.2012.05.008
Xu, X., Xu, H., Wang, Y., Wang, X., Qiu, Y., Xu, B. (2008). The effect of salt stress on the chlorophyll level of the main sand-binding plants in the shelterbelt along the tarim desert highway. Chin. Sci. Bullet .53, 109–111. doi: 10.1007/s11434-008-6012-5
Yang, Z., Li, J.-L., Liu, L.-N., Xie, Q., Sui, N. (2020). Photosynthetic regulation under salt stress and salt-tolerance mechanism of sweet sorghum. Front. Plant Sci. 10, 1722. doi: 10.3389/fpls.2019.01722
Yang, Z., Wang, Y., Wei, X., Zhao, X., Wang, B., Sui, N. (2017). Transcription profiles of genes related to hormonal regulations under salt stress in sweet sorghum. Plant Mol. Rep. 35, 586–599. doi: 10.1007/s11105-017-1047-x
Yao, W., Zhao, K., Cheng, Z., Li, X., Zhou, B., Jiang, T. (2018). Transcriptome analysis of poplar under salt stress and over-expression of transcription factor NAC57 gene confers salt tolerance in transgenic arabidopsis. Front. Plant Sci. 9, 1121–1131. doi: 10.3389/fpls.2018.01121
Ye, H., du, H., Tang, N., Li, X., Xiong, L. (2009). Identification and expression profiling analysis of TIFY family genes involved in stress and phytohormone responses in rice. Plant Mol. Biol. . 71, 291–305. doi: 10.1007/s11103-009-9524-8
Zhao, G., Song, Y., Wang, C., Butt, H., Wang, Q., Zhang, C., et al. (2016). Genome-wide identification and functional analysis of the TIFY gene family in response to drought in cotton. Mol. Genet. Genomic. 291, 2173–2187. doi: 10.1007/s00438-016-1248-2
Zheng, L. Y., Guo, X. S., He, B., Sun, L., Peng, Y., Dong, S., et al. (2011). Genome-wide patterns of genetic variation in sweet and grain sorghum. Genome Biol. .12, 114–121. doi: 10.1186/gb-2011-12-11-r114
Keywords: sorghum, resistance, salt stress, transcriptomic, metabolomic, salicylic acid
Citation: Zhang F, Lu F, Wang Y, Zhang Z, Wang J, Zhang K, Wu H, Zou J, Duan Y, Ke F and Zhu K (2022) Combined transcriptomic and physiological metabolomic analyses elucidate key biological pathways in the response of two sorghum genotypes to salinity stress. Front. Plant Sci. 13:880373. doi: 10.3389/fpls.2022.880373
Received: 19 May 2022; Accepted: 21 September 2022;
Published: 13 October 2022.
Edited by:
Marco Landi, University of Pisa, ItalyCopyright © 2022 Zhang, Lu, Wang, Zhang, Wang, Zhang, Wu, Zou, Duan, Ke and Zhu. This is an open-access article distributed under the terms of the Creative Commons Attribution License (CC BY). The use, distribution or reproduction in other forums is permitted, provided the original author(s) and the copyright owner(s) are credited and that the original publication in this journal is cited, in accordance with accepted academic practice. No use, distribution or reproduction is permitted which does not comply with these terms.
*Correspondence: Kai Zhu, emh1a2FpNzJAMTI2LmNvbQ==; Yanqiu Wang, d2FuZ3lhbnFpdTczQDEyNi5jb20=