 Pervez H. Zaidi1*
 Mohammed Shahid
 Kaliyamoorthy Seetharam
 Madhumal Thayil Vinayan
- 1Asia Regional Maize Program, International Maize & Wheat Improvement Center (CIMMYT), Hyderabad, India
- 2International Centre for Biosaline Agriculture (ICBA), Dubai, United Arab Emirates
Being a widely cultivated crop globally under diverse climatic conditions and soil types, maize is often exposed to an array of biotic and abiotic stresses. Soil salinity is one of the challenges for maize cultivation in many parts of lowland tropics that significantly affects crop growth and reduces economic yields. Breeding strategies integrated with molecular approach might accelerate the process of identifying and developing salinity-tolerant maize cultivars. In this study, an association mapping panel consisting of 305 diverse maize inbred lines was phenotyped in a managed salinity stress phenotyping facility at International Center for Biosaline Agriculture (ICBA), Dubai, United Arab Emirates (UAE). Wide genotypic variability was observed in the panel under salinity stress for key phenotypic traits viz., grain yield, days to anthesis, anthesis-silking interval, plant height, cob length, cob girth, and kernel number. The panel was genotyped following the genome-based sequencing approach to generate 955,690 SNPs. Total SNPs were filtered to 213,043 at a call rate of 0.85 and minor allele frequency of 0.05 for association analysis. A total of 259 highly significant (P ≤ 1 × 10⁻⁵) marker-trait associations (MTAs) were identified for seven phenotypic traits. The phenotypic variance for MTAs ranged between 5.2 and 9%. A total of 64 associations were found in 19 unique putative gene expression regions. Among them, 12 associations were found in gene models with stress-related biological functions.
Introduction
Increasing maize productivity is inevitable for plant breeders in the backdrop of meeting the ever-increasing demand for feeding the growing population and decreasing arable lands (Foley et al., 2011; Hansen et al., 2019). In addition to this socioeconomical stress, the wide adaptability of maize exposes it to several major abiotic stresses viz., moisture availability such as drought and excessive moisture, and heat and salinity stresses (Zaidi et al., 2010; Lobell et al., 2011; Smale et al., 2011; Cairns et al., 2012; Enders et al., 2019). In recent years, salinity stress has been gaining momentum causing economically consequential yield losses in tropics (Bänziger and Araus, 2007). Unpredictable environmental variables resulting in increased rate of evapotranspiration due to rise in temperature, and increased inundation of land mass with sea water due to rise in their levels are some of the major factors responsible for changes in soil properties and making it more saline. In addition, unchecked exploitation of ground water is also among one of the key factors in increasing the incidence of salinity (Flowers and Yeo, 1995; Munns, 2002; Shahid et al., 2018). Recent estimates stated that globally, around 1,128 million ha of land was affected by salinity stress (Mandal et al., 2018), which is 20% of the cultivable area and 33% of the irrigated area (Shrivastava and Kumar, 2015).
The maize crop is reported to be moderately susceptible to salinity stress (Zörb et al., 2004; Chinnusamy et al., 2005). In general, all crop stages and all parts of maize are affected by salinity stress. In the early phase of crop development, saline affects seed germination by hampering water absorption by germinating seed due to Na+ and/or Cl– toxicity that alters the osmotic potential of a soil solution (Hasegawa et al., 2000; Khajeh-Hosseini et al., 2003; Munns and James, 2003; Farsiani and Ghobadi, 2009). The early vegetative phase of the crop expresses stunted growth (Munns, 1993) with suppressed leaf expansion and internodal growth (Qu et al., 2012) due to reduction in cell elongation (Szalai and Janda, 2009) and programmed cell death. The reproductive phase of the crop is affected by micro-sporogenesis elongation of stamen filament, rate of photosynthesis, source-sink limitation, abortion of assimilation by fertilized kernels, which results in reduced kernel number and seed set, and, ultimately, reduced economic yield (Abdullah et al., 2001; Rahnama et al., 2010; Kaya et al., 2013).
Mitigating salinity stress through several agronomical and other management practices are available, but adopting those techniques by small-holderand marginal farmers will add up to their cost of cultivation and increase the risk of low returns and even crop failures in some cases, which challenges the sustainability of farmers to adopt those practices (Minhas and Sharma, 2003). Developing salt tolerance cultivars is considered relatively better, suitable for adopt to range of farmers with varied land-holdings and most economical approach. Maize genome being known to express its diversity for diverse environmental scenario (Hoisington et al., 1999) and its rich molecular marker, particularly SNPs resource is an added advantage to develop salt tolerant varieties or hybrids within short span of time through molecular breeding approach (Gilliham et al., 2017). Salt stress in per se and its tolerance mechanism in crops at physiological level, cellular level and phenotypical level are more complex (Farooq et al., 2015). In the maize crop, a number of QTLs were reported for rate of seed germination, salt tolerance ranking, shoot fresh and dry weights, shoot K+/Na+ ratio, and Na+ and K+ concentrations in shoots (Cui et al., 2015; Luo et al., 2017, 2021; Zhang et al., 2018; Xie et al., 2019). However, studies on salt tolerance of maize and reporting of QTLs/genomic regions for salt tolerance are still very limited in field-grown maize crop for a full crop cycle. Among several molecular breeding approaches, genome-wide association studies (GWAS) have several advantages (Frova and Sari-Gorla, 1994; Shikha et al., 2021). They take into account the historical recombination found in a broad panel of diverse germplasm and population-wide linkage disequilibrium (LD) among single nucleotide polymorphisms (SNPs) and quantitative trait loci (QTLs) (Luo et al., 2021). Furthermore, genome-wide scanning can locate genomic regions associated with several stress tolerance mechanism and nullify the complexity to a reasonable extent than relying solely on the phenotypic approach (Prasanna et al., 2021). With this rationale, this study was aimed at (i) managing the stress phenotyping of an association mapping panel consisting of 305 diverse maize inbred lines under saline conditions (ii) identifying genomic regions associated with grain yield and key secondary traits in maize under salinity stress using the GWAS approach.
Materials and Methods
Phenotyping
The association mapping panel consisting of 305 maize inbred lines used in this study is an amalgamation of advanced generation breeding lines derived from CIMMYT’s tropical and subtropical pools and populations from Latin America, Africa, and Asian maize programs. These lines were selected out of over 1,000 lines evaluated in Asian tropics for their general adaptation under optimal growing conditions. Lines with reasonably good adaptation in Asian tropics were selected for constituting the panel named CIMMYT Asia Association Mapping (CAAM), avoiding sister lines or over-representation of lines derived from any specific pools or populations. The inbred lines involved in this panel were derived from various pools and populations, including several biparental pedigree populations. Further details about the pools and populations of CIMMYT’s tropical maize program can be found elsewhere (Edmeades and Heisey, 1997; Zaidi et al., 2016a).
The panel was phenotyped the during dry season of 2017 and 2018 in a managed salt stress phenotyping facility at International Center for Biosaline Agriculture (ICBA) (25.0947°N, 55.3899°E), Dubai, United Arab Emirates (UAE), which is located about 23 km from the Arabian Gulf (Persian Gulf). The soils at ICBA experimental fields are sandy in texture, including fine sand (sand 98%, silt 1%, and clay 1%), calcareous (50–60% CaCO3 equivalents), porous (45% porosity), and moderately alkaline (pH 8.22). Saturation percentage of the soil is 26% with very high drainage capacity, while electrical conductivity of its saturated extract (ECe) is 1.2 dS m –1. According to American Soil Taxonomy (Soil Survey Staff, 2010), the soil is classified as Typic Torripsamments, carbonatic, and hyperthermic (Shahid et al., 2009). A drip irrigation system was used for the field experiments with drippers at a 0.25-m distance and row-to-row spacing of 0.5 m. About 13.3 mm of water per day was used for irrigation. The field trials followed a lattice design, and each entry was planted in a 2-m row length with a plant-to-plant distance of 0.25 m and a row-to-row distance of 0.5 m with two replications. For the first 2 weeks, the experiment materials were irrigated with fresh water to avoid seed germination issues. Afterward, the field was irrigated with saline water with an ECe of 8 dS m–1. In the reproductive stage, days to 50% anthesis (AD), days of 50% silking (SD), anthesis silking interval (ASI), and plant height (PH) were measured using the standard phenotyping protocol for maize (Zaidi et al., 2016b). At maturity, ears were harvested separately from each plot, and grain yield (GY) was recorded on a per-plot basis. Final grain yield was calculated after adjusting for kernel moisture content at 12.5% for each plot and converted into tons per hectare (t ha––1). In 2018, in addition to grain yield, cob length (CL), cob girth (CG), and kernel number (KN) per cob were also measured by capturing digital photographs of harvested cobs of each plot. The ears were properly arranged and placed on a contrast background with equal spacing between the ears to avoid any overlapping. The ears were imaged using a digital camera at a uniform height. An image analysis was performed using the ImageJ software,1 open-source software using a script (ear analyzer) developed at CIMMYT (Makanza et al., 2018).
Statistical Analysis
The linear model lmer from package lme4 of R using REML was used to calculate BLUEs and BLUPs, and variance components were estimated using the META-R (Multi-Environment Trial Analysis in R) software (Alvarado et al., 2020) in which replications, blocks, and environments were treated as random factors and genotypes as fixed factor. A cross-year analysis was conducted following the model described below:
where Yijkl is the trait of interest, μ is mean effect, Envi is the effect of ith environment, Repi is the effect of ith replicate, Blockj (EnviRepi) is the effect of jth incomplete block within ith replicate and environment, Genl is the effect of lth genotype, Envi and Envi × Genl are the effects of ith environment and environment by genotype interaction, and ∈ is the residue. Broad-sense heritability (h2) was estimated as follows:
where , , , nEnvs, and nreps represent variance estimates of genotype, genotype × environment interaction, error, number of environments, and number of replications, respectively. Descriptive statistics including mean, minimum, maximum, and Co-efficient of variation were also generated using standard procedures implemented in META-R. Best linear unbiased estimators (BLUEs) from individual year and across years were used for the genome-wide association studies (GWAS).
Association Mapping Panel Genotyping
DNA extraction was conducted following the modified CTAB method (CIMMYT Applied Molecular Genetics Laboratory, 2003) on 3–4 week young leaves harvested from each inbred line involved in the panel. Single nucleotide polymorphisms (SNPs) were generated through GBS v2.7 using Illumina Hi-seq 2000/2500 at the Institute for Genomic Diversity, Cornell University, Ithaca, NY, United States. Physical coordinates of GBS SNPs were derived from AGPv2. A total of 955,690 SNPs were generated after imputing missing data points by accepting a 5% mismatch with the closest neighbor in small SNP windows across the entire maize database (∼22,000 Zea samples). The criteria for filtering SNPs for GWAS and LD (linkage disequilibrium) analysis were based on Suwarno et al. (2015) but with slight modifications. SNPs were filtered based on a call rate (CR) > 0.85 and with a minor allele frequency (MAF) ≥ 0.05 for the association analysis.
Linkage Disequilibrium Analysis and Genome-Wide Association Studies
Linkage disequilibrium was estimated using 1, 28, and 913 SNPs filtered from the total SNPs with a CR of > 0.9 and a MAF of > 0.1. The extent of genome-wide linkage disequilibrium was estimated based on adjacent pairwise r2 values and the physical distance among the SNPs using the “nlin” function in R (Remington et al., 2001; R Development Core Team, 2015). Average pairwise distances in which LD decayed at r2 = 0.2 and r2 = 0.1 were then calculated based on the model given by Hill and Robertson (1968).
The SNPs (955,690) obtained for the association panel after imputation were further filtered to 213,043 SNPs using the multiple selection criteria of CR > 0.85 and MAF ≥ 0.05 for the GWAS analysis. The association between the filtered SNPs and the trait of interest was detected by employing a mixed linear model (MLM) in the SNP and Variation Suits v8.6.0 software (GoldenHelix, Inc., Bozeman, MT, United States2). The fitness of the model was determined by observing Q-Q (quantile-quantile) plots (Supplementary Figures 1, 2). A marker-trait association (MTA) with a p-value threshold of ≤ 10–5 was considered significant. Significant SNPs that fell within or near gene models (> 1 MB) were searched for the putative gene function in maize GDB in B73 RefGen_V3.3 Gene models having a stress related gene/biological function were considered as candidate genes.
Results
The GWAS panel exhibited a highly (P > 0.001) significant genotypic variance for all the traits studied under salinity stress in both individual and across years. Environmental and genotype × environmental interaction variance was also significant for all the traits. The magnitude of genotypic variance and error variance was narrow for individual years, whereas the magnitude of error variance and G × E variance of across year analysis was multi-folded when compared to genotypic variance. Broad-sense heritability of the traits in 2017 and 2018 ranged from 0.4 (CL) to 0.9 (AD), whereas across-year heritability ranged between 0.2 (GYG) and 0.8 (AD) (Table 1). In addition, the standard deviation (SD) of traits during 2017 and 2018 fell within a desirable range for all the traits (Table 1).
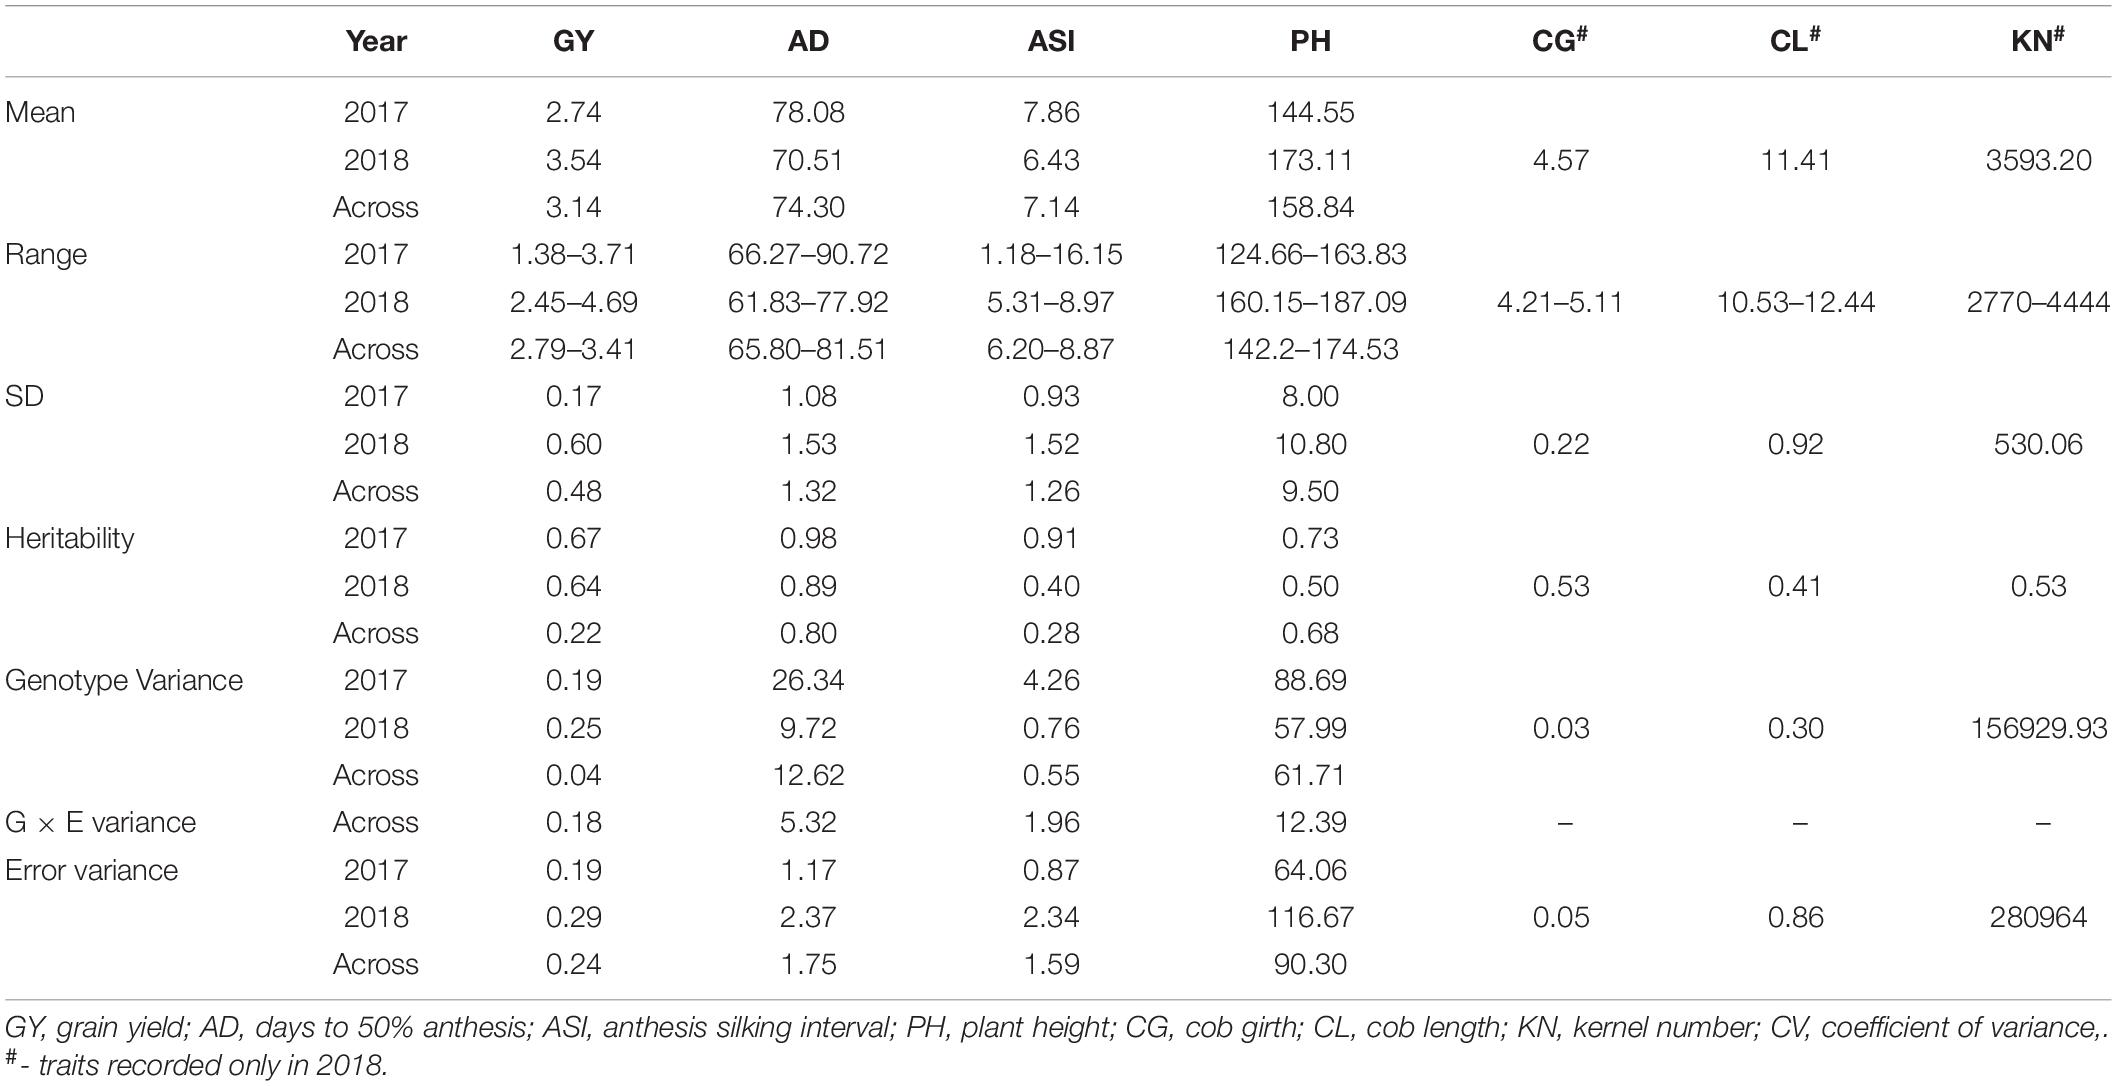
Table 1. Descriptive statistics of the association mapping panel evaluated under salinity stress.
Mean GY, AD, and ASI in the panel was consistent between individual years and across years. The mean value of GY and ASI was < 4 tha–1 and > 5 days, respectively, with a very wide range for both traits (GY: 1.38–4.69 tha–1, ASI: 1.18–16.15 days). The mean of PH slightly varied between years and across years, but it had a comparatively narrow range. The low values of GY and higher values of ASI indicate the impact of salinity stress on the reproductive stage of the crop. A similar effect of salinity stress was found on other morphological traits as well.
In this study, total SNPs (955 K) were shortlisted to 128,913 SNPs (CR = 0.9 and MAF = 0.1) for linkage disequilibrium (LD) decay estimation, and 213,043 SNPs (CR = 0.85 and MAF = 0.05) were used for the association analysis. The LD decay of the panel was 3.82 kb at r2 = 0.1 and 1.38 kb at r2 = 0.2 (Figure 1). In the association analysis for the seven phenotypic traits, a total of 259 highly significant (P < 1 × 10⁻⁵) (Supplementary Figures 3, 4) MTAs were identified for the traits under consideration. The phenotypic variance (PV) for MTAs ranged from 9.4 to 5.2%. For reproductive traits viz., GY, AD, and ASI, and 57 MTAs were found with PV ≥ 6%. A maximum number of 69 MTAs were identified for AD (total of 2017, 2018 and across) followed by ASI (59 MTAs) and grain yield (48 MTAs) (Table 2). In individual year, a maximum number of MTAs were identified for AD (28 MTAs in 2017) followed by GY, ASI, and CL (23 MTAs) (28 MTAs in 2018). In across-year GWAS, a maximum number of 25 MTAs were identified for AD. The traits GY, AD, and ASI had a maximum number of MTAs on chromosome 5 followed by chromosomes 2, 3, and 9 for KN, PH, and CL, respectively (Table 2 and Supplementary Table 1). A total of 15, 8, and 5 MTAs were found to be common between the across-year analysis and any of the individual year for AD, ASI, and PH, respectively (Table 2 and Supplementary Table 2). The SNPs, viz., S5_69435496, S5_69435513, and S5_69435514 were found to have common MTAs for GY and AD in 2017 and across year. Similarly, the SNPs S6_157029418 and S6_87402488 were found to be associated with GY and KN in 2018 (Table 3).
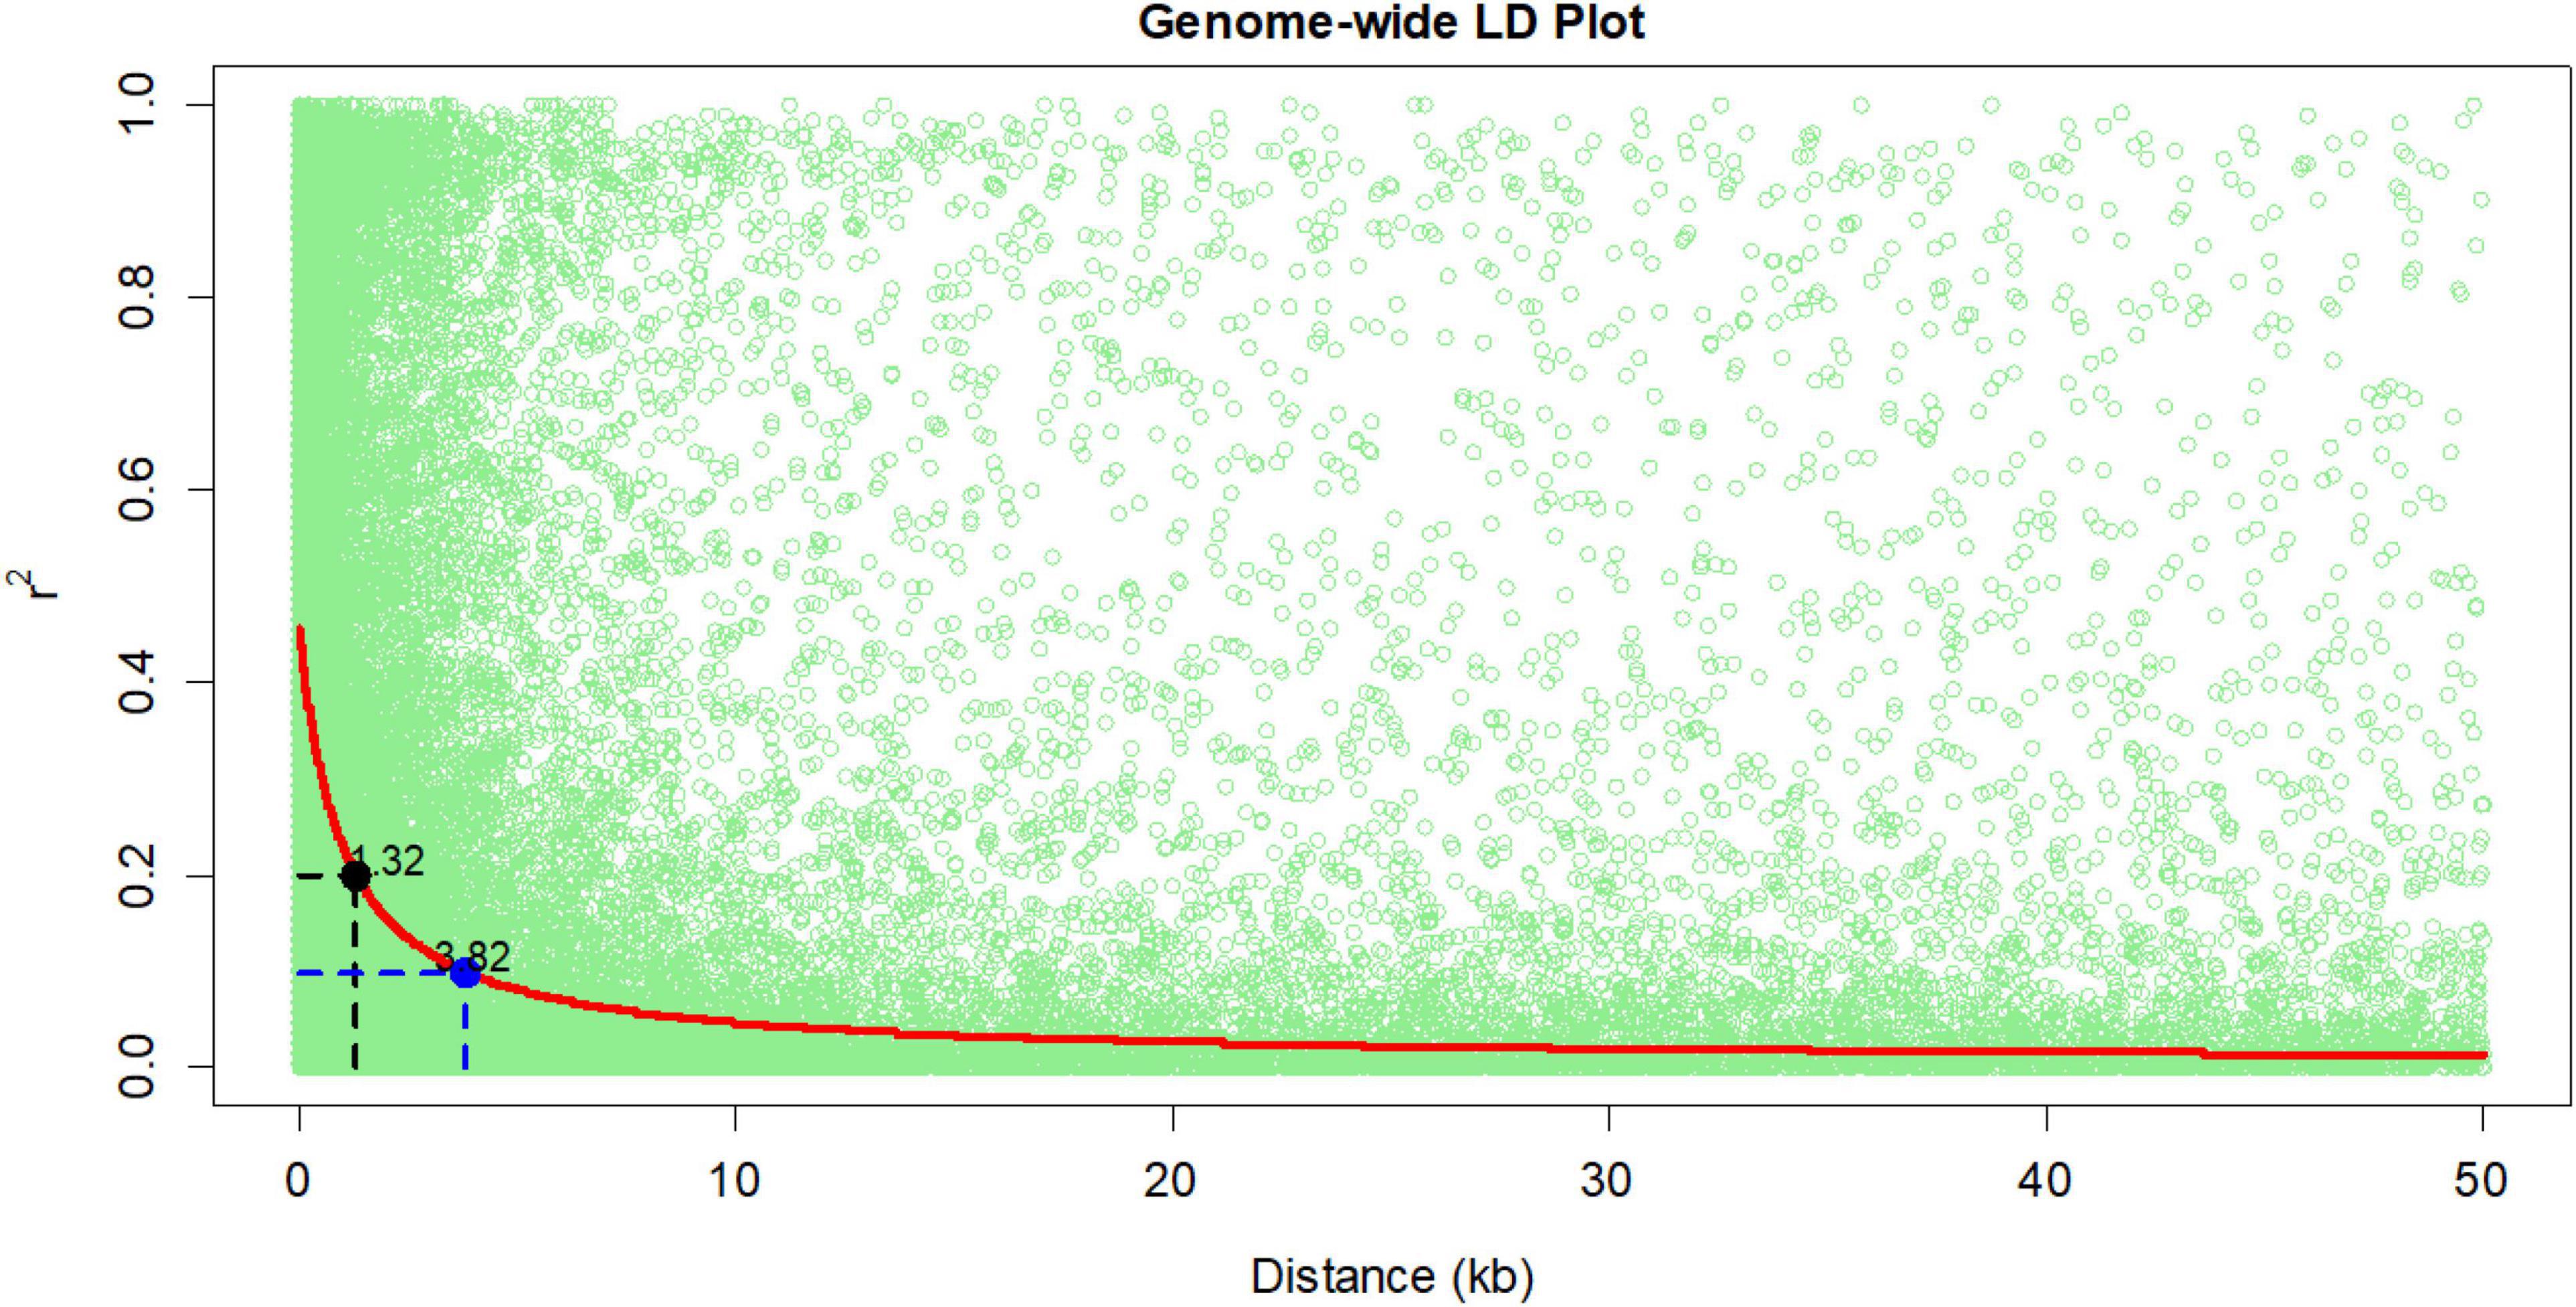
Figure 1. Linkage disequilibrium (LD) decay for the association mapping panel.
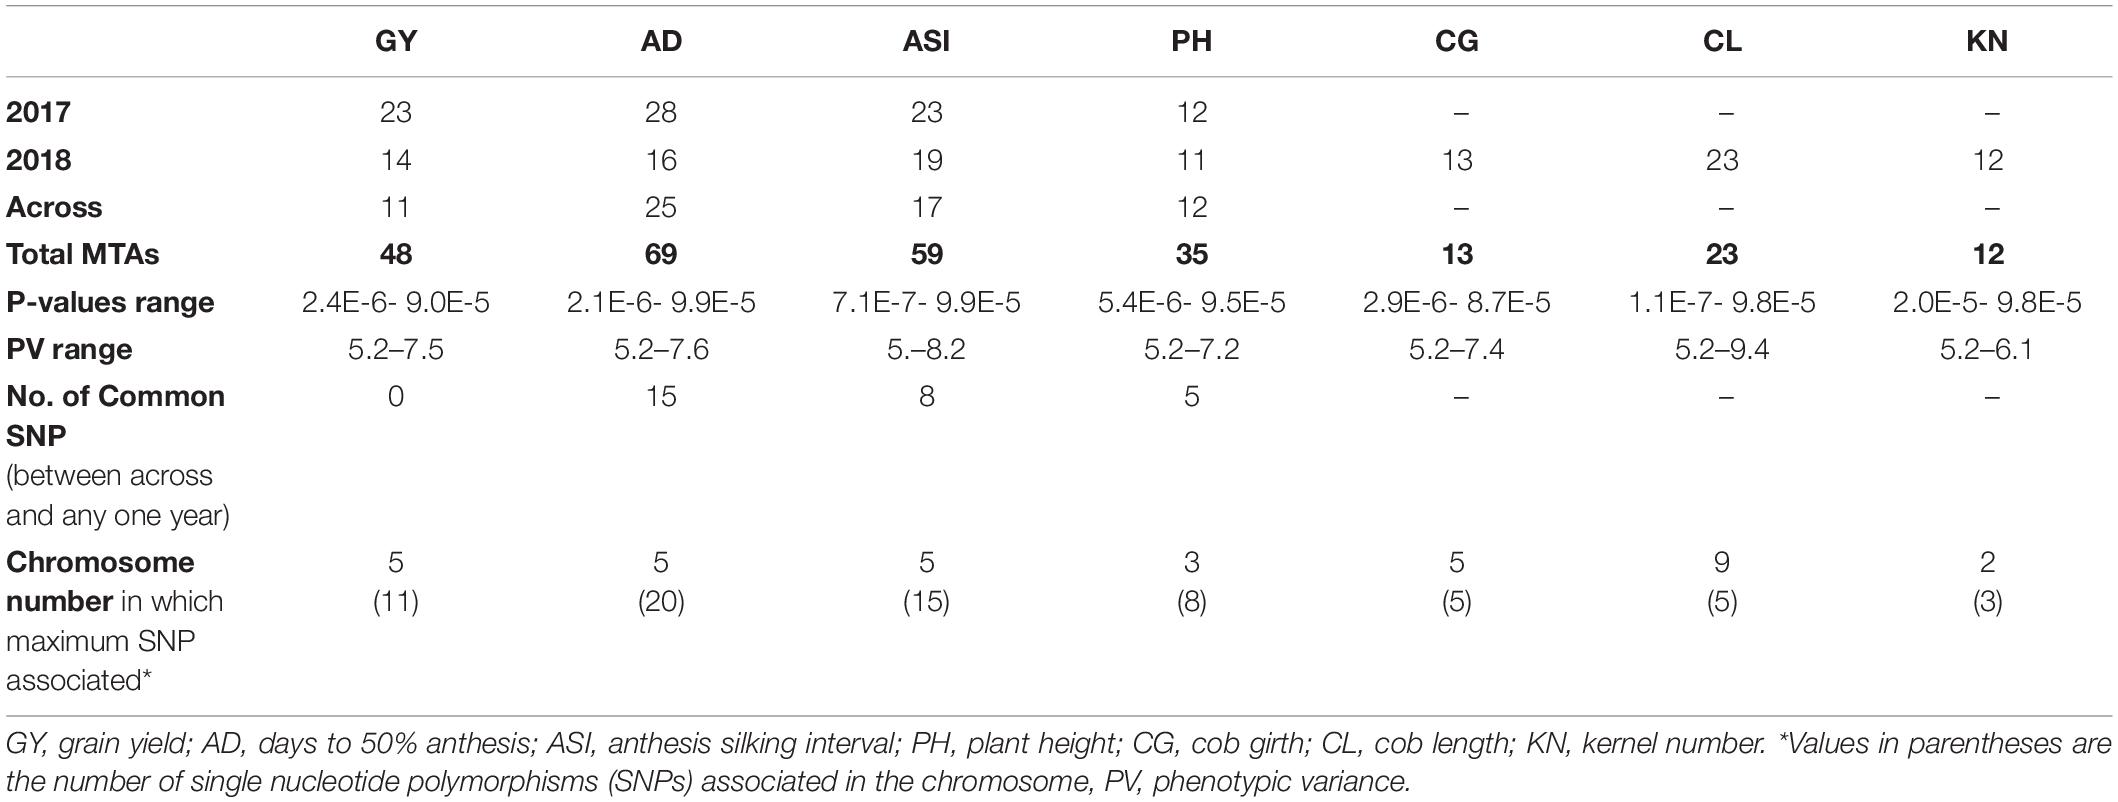
Table 2. Details of marker-trait associations identified for the traits under salinity stress.
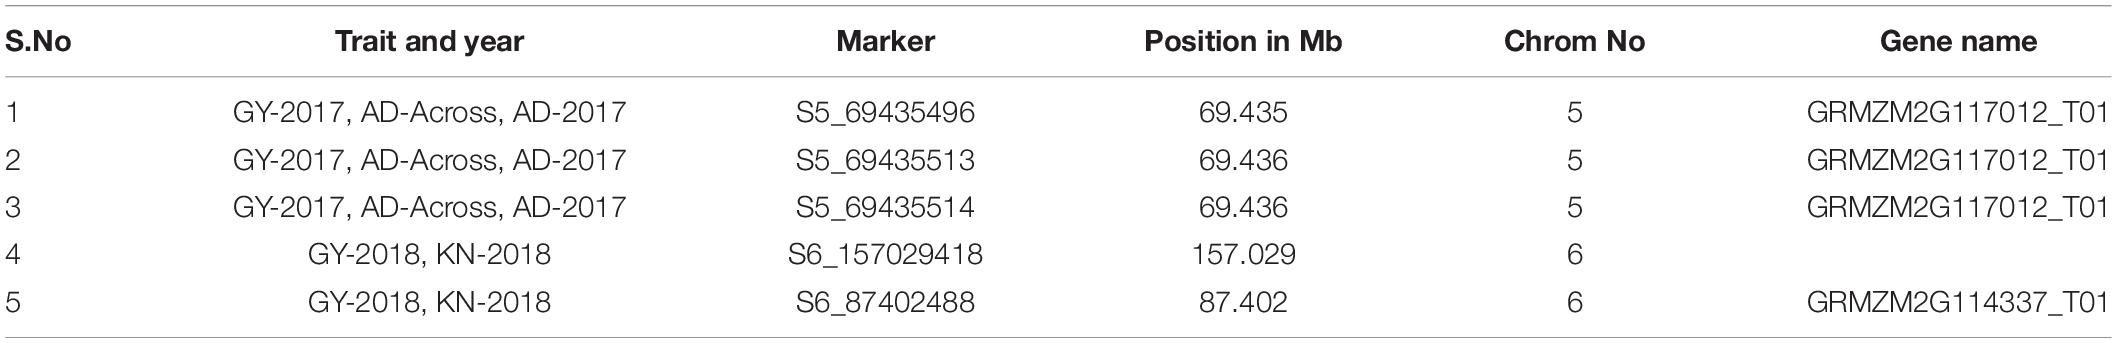
Table 3. Details of marker-trait associations common for multiple traits.
In this study, a total of 236 MTAs were found in 113 unique putative gene expression regions. In particular, 11 MTAs: 7 for GY and 4 for AD were found in gene models with stress-related biological functions (Table 4). Notably the SNP S4_83197497, S6_87402488, S7_15827091, S5_191376709 in the gene model GRMZM2G168002, GRMZM2G114337, GRMZM2G478965, GRMZM2G057386 coding for the biological functions like glk49 - G2-like-transcription factor 49, Core-2,AP2-EREBP-transcription factors, which plays important roles in regulating various physiological functions or response to the various abiotic and biotics stress.
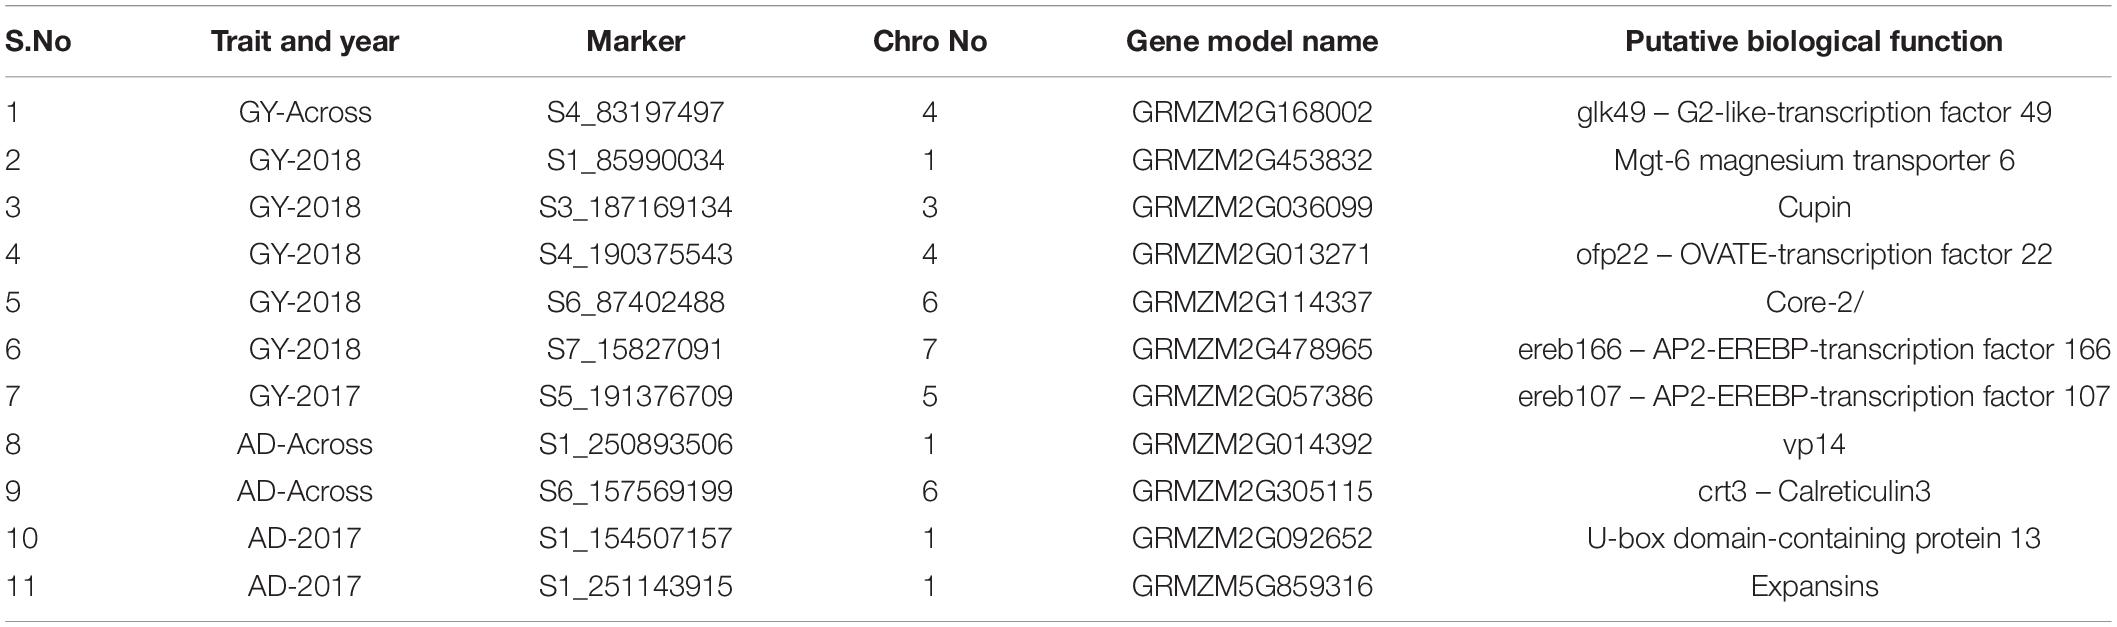
Table 4. List of marker-trait associations within the expression region of genome.
Discussion
Maize, a widely adopted crop under a range of climatic conditions, is often planted on salt-affected fields, as many farmlands are salinized (Zaidi et al., 2020; Prasanna et al., 2021). Analyzing the salt tolerance mechanism in maize by studying the diverse maize germplasm and understanding the genetic architecture of salinity tolerance can guide breeding programs aimed at developing salt-tolerant maize varieties (Luo et al., 2017). Apart from use of various agronomical and other biological means of avoiding/circumventing salinity stress, genetic intervention is considered a more viable and sustainable approach. Exploring the diversity and genotypic variability of the association mapping panel for salinity tolerance and identifying genomic regions associated with grain yield under salinity stress may significantly contribute to the development of salt-tolerant maize hybrids.
In this study, mean values of the traits were consistent between and across years, and a very wide range and magnitude of genotypic variance was observed between individual year and across years for each of the traits, making the panel very amenable for GWAS analysis. The LD decay in the panel based on 1, 28, 913 and SNPs was 3.82 and 1.34 kb at r2 = 0.1 and 0.2, respectively, which is characteristic of tropical and subtropical maize lines. The high LD (Yan et al., 2009) indicated that the panel is genotypically diverse in nature and favorable for obtaining high-resolution mapping (Yan et al., 2009; Suwarno et al., 2014; Yuan et al., 2019). A similar result of high LD decay was reported in previous association mapping panels developed for biotic and abiotic stresses and quality traits (Zaidi et al., 2016a; Hindu et al., 2018; Rashid et al., 2018; Seetharam et al., 2021).
The wide range of phenotypic expression for all the traits indicated that the genotypes responded in different intensities or adopted different physiological mechanisms and pathways to cope with salinity stress. Under salinity stress, the maize crop experiences high osmotic stress because of low water potential (Sümer et al., 2004), ion toxicity (Turan et al., 2010), and nutrient imbalance (Shahzad et al., 2012). In particular, each part of the plant is affected in different ways; for instance, leaf growth and expansion and internodal elongation are affected by accelerated abscission (Akram et al., 2010; Qu et al., 2012), and stomatal conductance is affected by altered water relationships and increased synthesis of abscisic acid, which in turn affects transpiration, photo-assimilation, and sink strength, reduces acid invertase activity in developing maize grains (Farooq et al., 2015), and ultimately reduces kernel set and seed weight (Abdullah et al., 2001; Kaya et al., 2013). Exploiting the existing genetic diversity by integrating the available advanced molecular approach can catalyze the process of developing salinity-tolerant inbred lines and hybrids.
In this GWAS study, 259 significant MTAs were found for seven phenotypic traits. The PV % explained by these traits was small (5.2–9.4%) and lower than the observed broad-sense heritability explained based on phenotypic data. This gap, also known as the missing heritability (Manolio et al., 2009; Eskin, 2015), might be the result of non-heritable genome changes, cross-talk between genes, RNAs, environments, statistical limitations, and many other unexplained factors (Slatkin, 2009; Marian, 2012; Zuk et al., 2012; Grandjean et al., 2013). Grain yield and related traits, viz., ASI and AD, had a total of > 50 MTAs (sum of individual and across-year analysis) but only a very few SNPs, i.e., 28, were significantly associated in individual and across years. Reduced commonality might be the result of the statistical threshold that is used in this study. Many associations that actually exist could have been missed reaching significance in any of the experiments. The frequency of “false negatives” depends on the number of genotypes and their diversity. The problem is very noticeable in sample sizes less than 500 compared to fewer samples (Beavis, 1997). This reduced commonality of SNPs indicates the complexity and influence of environment and its interaction with genome. A similar result of uncommon SNPs across location and year was reported by Seetharam et al. (2021) in maize for heat stress-related trait association analysis. Apart from this, notably, SNPs S5_69435496, S5_69435513, S5_69435514, S6_157029418, and S6_87402488 had across-year and multi-trait associations (GY, AD, and KN). The SNPs reported in this study were also found to be in QTL regions reported in earlier studies. Particularly the SNPs S5_163119125, S5_165071094, and S9_153775211, which were found to be significantly associated with AD-across and SNP S10_147245009, which was significantly associated with PH-across, were in the reported QTLs qSPH5-1 (plant height at saline field), qPHI9, and qPHI10 (plant height-based salt tolerance index) (Luo et al., 2017). Similarly, the SNPs S1_202305536 (GY-across), S4_235453550 (AD-across), and S7_168994991 (CL-2018) were found to be in QTLs reported for various seedling stage traits like shoot length, root length, root and shoot dry weight in a panel consisting of 348 maize inbred lines (Luo et al., 2021). This multi-trait associated SNPs and SNPs in previously reported QTL regions are of major importance, as they have a potential utility in routine marker-assisted selection/screening in breeding pipeline post-validation.
Associations (MTAs) in the expression region of genomes are of practical interest. In this study, 19 unique putative expression regions with various biological functions were associated with 64 SNPs. Plants develop a complex defensive or escape mechanism to overcome multiple stresses during the crop period through interconnected and diverse downstream signaling cascades by regulating genes (Papdi et al., 2015). A few SNPs that were in gene models (listed in Table 4) were found to a have biological function that is important for stress tolerance. The SNP S4_83197497 was in the gene model coding for glk49–G2-like-transcription factor 49. This G2-like (Golden 2 like) transcription factor plays a role in regulating chloroplast development to optimize photosynthetic capacity under varying environmental conditions (Waters and Langdale, 2009). Other SNPs, viz.- S7_15827091 and S5_191376709, were associated with coding regions for the AP2/EREBP transcription factor. Bodies of literature state that AP2/ERFs are strong regulators of several stress responsive genes and complex networks of pathways in response to stress stimulants in different crop growth stages (Licausi et al., 2013; Li et al., 2015). Similarly, the SNP S6_157569199 codes for crt3, calreticulin3. Calreticulin is a highly conserved and abundant multifunctional protein that is encoded by a small gene family and is often associated with biotic and abiotic stresses (Xiang et al., 2015). Calcium is an essential secondary messenger that mediates plant responses to developmental and environmental clues like salt stress. CRTs play an important role in regulating calcium signaling, assisting protein folding (Jia et al., 2009), etc. Furthermore, some of the SNPs were found associated with regions coding for cupin (S3_187169134), ofp22 (S4_190375543), vp14 (S1_250893506), U-box domain-containing protein-13 (S1_154507157), and expanins (S1_251143915). These regions have been reported to have major role in regulating several pathways in various growth and developmental stages of the crop in response to various stress inducers (Messing et al., 2010; Marowa et al., 2016; Hu et al., 2018). The SNPs/genomic regions identified in this study will be an effective resource to the maize breeding community to catalyze the process of maize varietal or hybrid development with stress tolerance. In addition, separate association analyses can be carried out for various growth stages viz., germination, emergence and early growth stages in same population to conclude with common genomic regions associated with the vegetative and reproductive stages of the crop. Significant SNPs in expressive regions can also be scanned for putative candidate regions associated with different crop stage salinity stress tolerance or pathways that can be utilized for candidate gene approach and followed up by deep sequencing of specific genes identified.
Data Availability Statement
The datasets presented in this study can be found in online repositories. The names of the repository/repositories and accession number(s) can be found in the article/Supplementary Material.
Author Contributions
PZ and MS: conceptualization, investigation, and supervision. KS and MV: formal analysis. PZ, MS, and KS: methodology. PZ, MS, KS, and MV: visualization and writing – review and editing. KS, PZ, and MV: writing – original draft. All authors contributed to the article and approved the submitted version.
Funding
This study was carried out under CGIAR Research Program on MAIZE (CRP-MAIZE). The financial support including sub-grant to ICBA, operational cost, and part of staff-time is duly acknowledged.
Conflict of Interest
The authors declare that the research was conducted in the absence of any commercial or financial relationships that could be construed as a potential conflict of interest.
Publisher’s Note
All claims expressed in this article are solely those of the authors and do not necessarily represent those of their affiliated organizations, or those of the publisher, the editors and the reviewers. Any product that may be evaluated in this article, or claim that may be made by its manufacturer, is not guaranteed or endorsed by the publisher.
Supplementary Material
The Supplementary Material for this article can be found online at: https://www.frontiersin.org/articles/10.3389/fpls.2022.869270/full#supplementary-material
Footnotes
References
Abdullah, Z., Khan, M. A., and Flowers, T. J. (2001). Causes of sterility in seed set of rice under salinity stress. J. Agron. Crop Sci. 187, 25–32. doi: 10.1046/j.1439-037X.2001.00500.x
Akram, M., Ashraf, M. Y., Ahmad, R., Rafiq, M., Ahmad, I., and Iqbal, J. (2010). Allometry and yield components of maize (Zea Mays L.) hybrids to various potassium levels under saline conditions. Arch. Biol. Sci. 62, 1053–1061. doi: 10.2298/ABS1004053A
Alvarado, G., Rodríguez, F., Pacheco, A., Burgueño, J., Crossa, J., Vargas, M., et al. (2020). META-R: A software to analyze data from multi-environment plant breeding trials. Crop J. 8:10. doi: 10.1016/j.cj.2020.03.010
Bänziger, M., and Araus, J.-L. (2007). “Recent Advances in Breeding Maize for Drought and Salinity Stress Tolerance BT,” in Advances in Molecular Breeding Toward Drought and Salt Tolerant Crops, eds M. A. Jenks, P. M. Hasegawa, and S. M. Jain (Dordrecht: Springer), 587–601. doi: 10.1007/978-1-4020-5578-2_23
Beavis, W. D. (1997). “QTL analyses: Power, precision, and accuracy,” in Molecular Dissection of Complex Traits, ed. A. H. Paterson (Boca Raton: CRC Press), 145–159.
Cairns, J. E., Sonder, K., Zaidi, P. H., Verhulst, N., Mahuku, G., Babu, R., et al. (2012). Maize production in a changing climate: impacts, adaptation, and mitigation strategies. Adv. Agron. 114, 1–65. doi: 10.1016/B978-0-12-394275-3.00006-7
Chinnusamy, V., Jagendorf, A., and Zhu, J.-K. (2005). Understanding and improving salt tolerance in plants. Crop Sci. 45, 437–448. doi: 10.2135/cropsci2005.0437
Cui, D., Wu, D., Somarathna, Y., Xu, C., Li, S., Li, P., et al. (2015). QTL mapping for salt tolerance based on snp markers at the seedling stage in maize (Zea mays L.). Euphytica 203, 273–283. doi: 10.1007/s10681-014-1250-x
Edmeades, G. O., and Heisey, P. W. (1997). World maize facts and trends 1997/98 maize production in drought-stressed environments : technical options and research resource allocation. Agricult. Econ. 1997:74.
Enders, T. A., StDennis, S., Oakland, J., Callen, S. T., Gehan, M. A., Miller, N. D., et al. (2019). Classifying cold-stress responses of inbred maize seedlings using RGB imaging. Plant Direct. 3:e00104. doi: 10.1002/pld3.104
Eskin, E. (2015). Discovering genes involved in disease and the mystery of missing heritability. Commun. ACM 58, 80–87. doi: 10.1145/2817827
Farooq, M., Hussain, M., Wakeel, A., and Siddique, K. H. M. (2015). Salt stress in maize: effects, resistance mechanisms, and management. A review. Agron. Sust. Dev. 35, 461–481. doi: 10.1007/s13593-015-0287-0
Farsiani, A., and Ghobadi, M. E. (2009). Effects of PEG and NACL stress on two cultivars of corn (Zea mays l.) at germination and early seedling stages. World Acad. Sci. Eng. Technol. 57, 382–385. doi: 10.5281/zenodo.1069947
Flowers, T. J., and Yeo, A. R. (1995). Breeding for salinity resistance in crop plants: where next? Funct. Plant Biol. 22, 875–884.
Foley, J. A., Ramankutty, N., Brauman, K. A., Cassidy, E. S., Gerber, J. S., Johnston, M., et al. (2011). Solutions for a cultivated planet. Nature 478, 337–342. doi: 10.1038/nature10452
Frova, C., and Sari-Gorla, M. (1994). Quantitative trait loci (QTLs) for pollen thermotolerance detected in maize. Mol. Gener. Genet. MGG 245, 424–430. doi: 10.1007/BF00302254
Gilliham, M., Able, J. A., and Roy, S. J. (2017). Translating knowledge about abiotic stress tolerance to breeding programmes. Plant J. 90, 898–917. doi: 10.1111/tpj.13456
Grandjean, V., Badro, D. A., and Kiani, J. (2013). RNA: a possible contributor to the “missing heritability”. Basic Clin. Androl. 23:9. doi: 10.1186/2051-4190-23-9
Hansen, J., Hellin, J., Rosenstock, T., Fisher, E., Cairns, J., Stirling, C., et al. (2019). Climate risk management and rural poverty reduction. Agricult. Syst. 172, 28–46. doi: 10.1016/j.agsy.2018.01.019
Hasegawa, P., Bressan, R., Zhu, J.-K., and Bohnert, H. (2000). Plant cellular and molecular responses to high salinity. Annu. Rev. Plant Physiol. Plant Mol. Biol. 51, 463–499. doi: 10.1146/annurev.arplant.51.1.463
Hill, W. G., and Robertson, A. (1968). Linkage disequilibrium in finite populations. Theor. Appl. Genet. 38, 226–231. doi: 10.1007/BF01245622
Hindu, V., Palacios-Rojas, N., Babu, R., Suwarno, W. B., Rashid, Z., Usha, R., et al. (2018). Identification and validation of genomic regions influencing kernel zinc and iron in maize. Theor. Appl. Genet. 2018:893. doi: 10.1007/s00122-018-3089-3
Hoisington, D., Khairallah, M., Reeves, T., Ribaut, J.-M., Skovmand, B., Taba, S., et al. (1999). Plant genetic resources: what can they contribute toward increased crop productivity? Proc. Nat. Acad. Sci. 96, 5937–5943. doi: 10.1073/pnas.96.11.5937
Hu, H., Dong, C., Sun, D., Hu, Y., and Xie, J. (2018). Genome-wide identification and analysis of U-box E3 ubiquitin–protein ligase gene family in banana. Int. J. Mol. Sci. 19:874. doi: 10.3390/ijms19123874
Jia, X.-Y., He, L.-H., Jing, R.-L., and Li, R.-Z. (2009). Calreticulin: conserved protein and diverse functions in plants. Physiol. Plant. 136, 127–138. doi: 10.1111/j.1399-3054.2009.01223.x
Kaya, C., Ashraf, M., Dikilitas, M., and Tuna, A. L. (2013). Alleviation of salt stress-induced adverse effects on maize plants by exogenous application of indoleacetic acid (IAA) and inorganic nutrients - A field trial. Aust. J. Crop Sci. 7, 249–254.
Khajeh-Hosseini, M., Powell, A. A., and Bingham, I. (2003). The interaction between salinity stress and seed vigour during germination of soyabean seeds. Seed Sci. Technol. 31, 715–725. doi: 10.15258/sst.2003.31.3.20
Li, M.-Y., Xu, Z.-S., Huang, Y., Tian, C., Wang, F., and Xiong, A.-S. (2015). Genome-wide analysis of AP2/ERF transcription factors in carrot (Daucus carota L.) reveals evolution and expression profiles under abiotic stress. Mol. Genet. Genomics 290, 2049–2061. doi: 10.1007/s00438-015-1061-3
Licausi, F., Ohme-Takagi, M., and Perata, P. (2013). APETALA2/Ethylene Responsive Factor (AP2/ERF) transcription factors: mediators of stress responses and developmental programs. New Phytol. 199, 639–649. doi: 10.1111/nph.12291
Lobell, D. B., Bänziger, M., Magorokosho, C., and Vivek, B. (2011). Nonlinear heat effects on African maize as evidenced by historical yield trials. Nat. Clim. Chan. 1, 42–45. doi: 10.1038/nclimate1043
Luo, M., Zhang, Y., Li, J., Zhang, P., Chen, K., Song, W., et al. (2021). Molecular dissection of maize seedling salt tolerance using a genome-wide association analysis method. Plant Biotechnol. J. 19, 1937–1951. doi: 10.1111/pbi.13607
Luo, M., Zhao, Y., Zhang, R., Xing, J., Duan, M., Li, J., et al. (2017). Mapping of a major QTL for salt tolerance of mature field-grown maize plants based on SNP markers. BMC Plant Biol. 17:7. doi: 10.1186/s12870-017-1090-7
Makanza, R., Zaman-Allah, M., Cairns, J. E., Eyre, J., Burgueno, J., Pacheco, A., et al. (2018). High-throughput method for ear phenotyping and kernel weight estimation in maize using ear digital imaging. Plant Methods 14, 1–13. doi: 10.1186/s13007-018-0317-4
Mandal, S., Raju, R., Kumar, A., Kumar, P., and Sharma, P. (2018). Current status of research, technology response and policy needs of salt-affected soils in india -a review. J. Indian Soc. Coastal Agric. Res. 36, 40–53.
Manolio, T. A., Collins, F. S., Cox, N. J., Goldstein, D. B., Hindorff, L. A., Hunter, D. J., et al. (2009). Finding the missing heritability of complex diseases. Nature 461, 747–753. doi: 10.1038/nature08494
Marian, A. J. (2012). Elements of “missing heritability”. CurrOpinCardiol 27, 197–201. doi: 10.1097/HCO.0b013e328352707d
Marowa, P., Ding, A., and Kong, Y. (2016). Expansins: roles in plant growth and potential applications in crop improvement. Plant Cell Rep. 35, 949–965. doi: 10.1007/s00299-016-1948-4
Messing, S. A. J., Mario Amzel, L., Gabelli, S. B., Echeverria, I., Vogel, J. T., Guan, J. C., et al. (2010). Structural insights into maize viviparous14, a key enzyme in the biosynthesis of the phytohormone abscisic acid. Plant Cell 22, 2970–2980. doi: 10.1105/tpc.110.074815
Minhas, P. S., and Sharma, O. P. (2003). Management of soil salinity and alkalinity problems in india. J. Crop Prod. 7, 181–230. doi: 10.1300/J144v07n01_07
Munns, R. (1993). Physiological processes limiting plant growth in saline soils: some dogmas and hypotheses. Plant Cell Environ. 16, 15–24. doi: 10.1111/j.1365-3040.1993.tb00840.x
Munns, R. (2002). Comparative physiology of salt and water stress. Plant Cell Environ. 25, 239–250. doi: 10.1046/j.0016-8025.2001.00808.x
Munns, R., and James, R. A. (2003). Screening methods for salinity tolerance: a case study with tetraploid wheat. Plant Soil 253, 201–218. doi: 10.1023/A:1024553303144
Papdi, C., Pérez-Salamó, I., Joseph, M. P., Giuntoli, B., Bögre, L., Koncz, C., et al. (2015). The low oxygen, oxidative and osmotic stress responses synergistically act through the ethylene response factor VII genes RAP2.12, RAP2.2 and RAP2.3. Plant J. 82, 772–784. doi: 10.1111/tpj.12848
Prasanna, B. M., Cairns, J. E., Zaidi, P. H., Beyene, Y., Makumbi, D., Gowda, M., et al. (2021). Beat the stress: breeding for climate resilience in maize for the tropical rainfed environments. Theor. Appl. Genet. 134, 1729–1752. doi: 10.1007/s00122-021-03773-7
Qu, C., Liu, C., Gong, X., Li, C., Hong, M., Wang, L., et al. (2012). Impairment of maize seedling photosynthesis caused by a combination of potassium deficiency and salt stress. Environ. Exp. Bot. 75, 134–141. doi: 10.1016/j.envexpbot.2011.08.019
R Development Core Team (2015). R: A language and environment for statistical computing. Vienna: R Foundation for Statistical Computing.
Rahnama, A., James, R. A., Poustini, K., and Munns, R. (2010). Stomatal conductance as a screen for osmotic stress tolerance in durum wheat growing in saline soil. Funct. Plant Biol. 37, 255–263.
Rashid, Z., Singh, P. K., Vemuri, H., Zaidi, P. H., Prasanna, B. M., and Nair, S. K. (2018). Genome-wide association study in Asia-adapted tropical maize reveals novel and explored genomic regions for sorghum downy mildew resistance. Sci. Rep. 8, 1–12. doi: 10.1038/s41598-017-18690-3
Remington, D. L., Thornsberry, J. M., Matsuoka, Y., Wilson, L. M., Whitt, S. R., Doebley, J., et al. (2001). Structure of linkage disequilibrium and phenotypic associations in the maize genome. Proc. Nat. Acad. Sci. 98, 11479–11484. doi: 10.1073/pnas.201394398
Seetharam, K., Kuchanur, P. H., Koirala, K. B., Tripathi, M. P., Patil, A., Sudarsanam, V., et al. (2021). Genomic regions associated with heat stress tolerance in tropical maize (Zea mays L.). Sci. Rep. 11:13730. doi: 10.1038/s41598-021-93061-7
Shahid, S. A., Dakheel, A. H., Mufti, K. A., and Shabbir, G. (2009). Automated In-Situ soil salinity logging in irrigated agriculture. Eur. J. Sci. Res. 26, 288–297.
Shahid, S. A., Zaman, M., and Heng, L. (2018). “Soil Salinity: Historical Perspectives and a World Overview of the Problem BT,” in Guideline for Salinity Assessment, Mitigation and Adaptation Using Nuclear and Related Techniques, eds M. Zaman, S. A. Shahid, and L. Heng (Cham: Springer International Publishing), 43–53. doi: 10.1007/978-3-319-96190-3_2
Shahzad, M., Witzel, K., Zörb, C., and Mühling, K. H. (2012). Growth-related changes in subcellular ion patterns in maize leaves (Zea mays L.) under Salt Stress. J. Agron. Crop Sci. 198, 46–56. doi: 10.1111/j.1439-037X.2011.00487.x
Shikha, K., Shahi, J. P., Vinayan, M. T., Zaidi, P. H., Singh, A. K., and Sinha, B. (2021). Genome-wide association mapping in maize: status and prospects. Biotech 11:244. doi: 10.1007/s13205-021-02799-4
Shrivastava, P., and Kumar, R. (2015). Soil salinity: A serious environmental issue and plant growth promoting bacteria as one of the tools for its alleviation. Saudi J. Biol. Sci. 22, 123–131. doi: 10.1016/j.sjbs.2014.12.001
Slatkin, M. (2009). Epigenetic inheritance and the missing heritability problem. Genetics 182, 845–850. doi: 10.1534/genetics.109.102798
Smale, M., Byerlee, D., and Jayne, T. (2011). Maize Revolutions in Sub-Saharan Africa. Washington, DC: The World Bank, doi: 10.1596/1813-9450-5659
Soil Survey Staff (2010). Keys to Soil Taxonomy. Washington, DC: United States Department of Agriculture.
Sümer, A., Zörb, C., Yan, F., and Schubert, S. (2004). Evidence of sodium toxicity for the vegetative growth of maize (Zea mays L.) during the first phase of salt stress. J. Appl. Bot. Food Qual. 78, 135–139.
Suwarno, W. B., Pixley, K. V., Palacios, N., Shawn, R., and Zeaxanthin, Z. E. A. (2015). Genome - wide association analysis reveals new targets for carotenoid biofortification in maize. Theor. Appl. Genet. 128, 851–864. doi: 10.1007/s00122-015-2475-3
Suwarno, W. B., Pixley, K. V., Palacios-Rojas, N., Kaeppler, S. M., and Babu, R. (2014). Formation of heterotic groups and understanding genetic effects in a provitamin a biofortified maize breeding program. Crop Sci. 2014:96. doi: 10.2135/cropsci2013.02.0096
Szalai, G., and Janda, T. (2009). Effect of salt stress on the salicylic acid synthesis in young maize (Zea mays L.) Plants. J. Agron. Crop Sci. 195, 165–171. doi: 10.1111/j.1439-037X.2008.00352.x
Turan, M. A., Elkarim, A. H. A., Taban, N., and Taban, S. (2010). Effect of salt stress on growth and ion distribution and accumulation in shoot and root of maize plant. African J. Agricult. Res. 5, 584–588. doi: 10.5897/AJAR09.677
Waters, M. T., and Langdale, J. A. (2009). The making of a chloroplast. EMBO J. 28, 2861–2873. doi: 10.1038/emboj.2009.264
Xiang, Y., Lu, Y. H., Song, M., Wang, Y., Xu, W., and Wu, L. (2015). Overexpression of a Triticum aestivum Calreticulin gene (TaCRT1) improves salinity tolerance in tobacco. PLoS One 10:e0140591. doi: 10.1371/journal.pone.0140591
Xie, Y., Feng, Y., Chen, Q., Zhao, F., Zhou, S., Ding, Y., et al. (2019). Genome-wide association analysis of salt tolerance QTLs with SNP markers in maize (Zea mays L.). Genes Genom. 41, 1135–1145. doi: 10.1007/s13258-019-00842-6
Yan, W., and Holland, J. B. (2009). A heritability-adjusted GGE biplot for test environment evaluation. Euphytica 171, 355–369. doi: 10.1007/s10681-009-0030-5
Yuan, Y., Cairns, J. E., Babu, R., Gowda, M., Makumbi, D., Magorokosho, C., et al. (2019). Genome-wide association mapping and genomic prediction analyses reveal the genetic architecture of grain yield and flowering time under drought and heat stress conditions in maize. Front. Plant Sci. 9:1919. doi: 10.3389/fpls.2018.01919
Zaidi, P. H., Maniselvan, P., Srivastava, A., Yadav, P., and Singh, R. P. (2010). Genetic analysis of water-logging tolerance in tropical maize (Zea mays L.). Maydica 55, 17–26.
Zaidi, P. H., Nguyen, T., Ha, D. N., Thaitad, S., Ahmed, S., Arshad, M., et al. (2020). Stress-resilient maize for climate-vulnerable ecologies in the Asian tropics. Aust. J. Crop Sci. 14, 1264–1274. doi: 10.21475/ajcs.20.14.08.p2405
Zaidi, P. H., Seetharam, K., Krishna, G., Krishnamurthy, L., Gajanan, S., Babu, R., et al. (2016a). Genomic regions associated with root traits under drought stress in tropical maize (Zea mays L.). PLoS One 11:4340. doi: 10.1371/journal.pone.0164340
Zaidi, P. H., Zaman-Allah, M., Trachsel, S., Seetharam, K., Cairns, J. E., and Vinayan, M. T. (2016b). Phenotyping for abiotic stress tolerance in maize – Heat stress. A field manual. México-Veracruz: The International Maize and Wheat Improvement Center.
Zhang, M., Cao, Y., Wang, Z., Wang, Z., Shi, J., Liang, X., et al. (2018). A retrotransposon in an HKT1 family sodium transporter causes variation of leaf Na+ exclusion and salt tolerance in maize. New Phytol. 217, 1161–1176. doi: 10.1111/nph.14882
Zörb, C., Schmitt, S., Neeb, A., Karl, S., Linder, M., and Schubert, S. (2004). The biochemical reaction of maize (Zea mays L.) to salt stress is characterized by a mitigation of symptoms and not by a specific adaptation. Plant Sci. 167, 91–100. doi: 10.1016/j.plantsci.2004.03.004
Keywords: maize, abiotic stress, salinity, SNP, association analysis
Citation: Zaidi PH, Shahid M, Seetharam K and Vinayan MT (2022) Genomic Regions Associated With Salinity Stress Tolerance in Tropical Maize (Zea Mays L.). Front. Plant Sci. 13:869270. doi: 10.3389/fpls.2022.869270
Received: 04 February 2022; Accepted: 26 April 2022;
Published: 31 May 2022.
Edited by:
Dejan Dodig, Maize Research Institute Zemun Polje, SerbiaReviewed by:
Ana Nikolić, Maize Research Institute Zemun Polje, SerbiaPaul Gibson, Makerere University, Uganda
Jiuran Zhao, Beijing Academy of Agricultural and Forestry Sciences, China
Copyright © 2022 Zaidi, Shahid, Seetharam and Vinayan. This is an open-access article distributed under the terms of the Creative Commons Attribution License (CC BY). The use, distribution or reproduction in other forums is permitted, provided the original author(s) and the copyright owner(s) are credited and that the original publication in this journal is cited, in accordance with accepted academic practice. No use, distribution or reproduction is permitted which does not comply with these terms.
*Correspondence: Pervez H. Zaidi, cGh6YWlkaUBjZ2lhci5vcmc=