- State Key Laboratory for Conservation and Utilization of Bio-Resources in Yunnan, Research Center for Perennial Rice Engineering and Technology of Yunnan, School of Ecology and Environmental Science, School of Agriculture, Yunnan University, Kunming, China
The rhizome is an important organ through which many perennial plants are able to propagate vegetatively. Its ecological role has been thoroughly studied on many grass species while the underlying genetic basis is mainly investigated using a rhizomatous wild rice species—Oryza longistaminata. Previous studies have revealed that the rhizome trait in O. longistaminata is jointly controlled by multiple loci, yet how these loci interact with each other remains elusive. Here, an F2 population derived from Oryza sativa (RD23) and O. longistaminata was used to map loci that affect rhizome-related traits. We identified 13 major-effect loci that may jointly control rhizomatousness in O. longistaminata and a total of 51 quantitative trait loci (QTLs) were identified to affect rhizome abundance. Notably, some of these loci were found to have effects on more than one rhizome-related trait. For each trait, a genetic network was constructed according to the genetic expectations of the identified loci. Furthermore, to gain an overview of the genetic regulation on rhizome development, a comprehensive network integrating all these individual networks was assembled. This network consists of three subnetworks that control different aspects of rhizome expression. Judging from the nodes’ role in the network and their corresponding traits, we speculated that qRHZ-3-1, qRHZ-4, qRHI-2, and qRHI-5 are the key loci for rhizome development. Functional verification using rhizome-free recombinant inbred lines (RILs) suggested that qRHI-2 and qRHI-5, two multi-trait controlling loci that appeared to be critical in our network analyses, are likely both needed for rhizome formation. Our results provide more insights into the genetic basis of rhizome development and may facilitate identification of key rhizome-related genes.
Introduction
Rhizomes are modified subterranean stems that grow horizontally and can produce roots and shoots on their nodes, enabling vigorous asexual proliferation in various perennial species (Gizmawy et al., 1985; Li et al., 2022). From a physiological point of view, the rhizome is also the main energy storage organ of many perennial plants and plays a determinate role in their survival in harsh environment (Paterson et al., 1995). In agriculture, the rhizome trait is of significance due to both its positive and negative effects. On the one hand, strong rhizomes largely contribute to the competitiveness and invasiveness of weeds (Jang et al., 2006). On the other hand, rhizomes are also dispersal in many forage crops and may be utilized for developing perennial grain crops (Hu et al., 2011). Notably, it has been speculated that genes controlling rhizome development could be used to prolong the nutritional life cycle of certain plant species, potentially converting major annual grain crops into perennial ones (Paterson et al., 1995; Hu et al., 2003; Cox et al., 2006; Glover et al., 2010). As such, understanding the genetic mechanisms underlying rhizome development is not only instrumental in devising control or productivity-enhancing strategies for rhizomatous plants, but also beneficial to sustainable food production and ecosystem maintenance given the multiple ecological threats posed by our current annual crop dominated agricultural system (Hu et al., 2003; Cox et al., 2006; Glover et al., 2010).
Previous efforts to dissect the genetic basis of the rhizome trait were largely hindered by the sparsity of genomic resources. Recently, Oryza longistaminata is emerging as a useful model system for exploring rhizome development (Hu et al., 2003; Li et al., 2022). Originated from Africa, O. longistaminata is the only rhizomatous wild Oryza species that has the same AA genome type as the cultivated rice species O. sativa (Morishima, 1967; Tao and Sripichitt, 2000; Hu et al., 2003; Sacks et al., 2003; Ghesquiere, 2008). Hence, it can be crossed with well-studied rice cultivars for which high-quality genomic information is available, a strategy that is widely used for mapping genes or quantitative trait loci (QTLs) for agronomic traits. It is noteworthy that through such strategy, known as wide hybridization, a number of perennial rice lines have been successfully developed and are currently on trial in many Chinese provinces, representing an environmentally and economically sound rice production system (Zhang et al., 2017, 2019; Huang et al., 2018; Zhang et al., 2021).
An early study (Meakawa et al., 1998) that took advantage of the hybridization between O. sativa and O. longistaminata has suggested that the rhizomatous growth habit of O. longistaminata was segregated as a single dominant trait. The single dominant allele responsible for the rhizome trait was termed Rhz, and it was loosely linked to the liguleless (lg) locus on chromosome 4 with a recombination value of 37 ± 3.6% (Meakawa et al., 1998). However, the rhizomatous phenotypes displayed pronounced variations in the F2 population, indicating the presence of other modifying genes. Based on a complete simple sequence-repeat map, Hu et al. (2003) identified two dominant-complementary loci, termed Rhz2 and Rhz3, that predominantly control rhizomatousness in O. longistaminata, and the authors also revealed many QTLs affecting rhizome abundance (Hu et al., 2003). Recently, through entire population genotyping mapping and selective genotyping mapping using three F2 populations, over 10 major- or minor-effect rhizome-regulating QTLs were identified; however, none of these QTLs could be able to function alone, indicating that interactions among multiple QTLs are required for proper rhizome development (Fan et al., 2020). Nevertheless, to our knowledge, no reports have detailed how the rhizome-related QTLs interact with each other.
Understanding the relationships between complex genotypes and their underlying phenotypes is still one of the main challenges in modern genetics (Mackay et al., 2009). To better characterize the genetic networks underlying complex traits, a theoretical framework founded upon knowledge of signal transduction pathways has been proposed (Zhang et al., 2011). In this framework, the principle of hierarchy is defined as one-way functional dependency of downstream genes on upstream regulators, and functional genetic units (FGUs) refer to a group of functionally dependent genes acting at each level of a signaling pathway (Zhang et al., 2011). This framework was later employed to explore the pleiotropic effects of SD1, whose mutant alleles greatly contribute to the Green Revolution, and three genetic systems (SD1-mediated, -repressed, and -independent) were revealed, comprising 43, 38, and 64 FGUs, respectively, and jointly controlling growth, development and productivity of rice (Zhang et al., 2013). The functionality of this framework was further demonstrated in an investigation of the genetic basis of submergence tolerance (Wang et al., 2015). The putative networks consisted of 296 loci that were grouped into 167 FGUs, and the directional links between and among the nodes (the detected loci) suggested that submergence tolerance in rice is genetically controlled by a number of positively regulated signaling pathways (Wang et al., 2015).
Here, to gain insights into the genetic basis of rhizomatousness in O. longistaminata, a large F2 population containing 818 individuals was used to map loci that control various rhizome-related traits. These identified loci were further interwoven into putative networks to elucidate their interconnections. Our results highlight the intricate genetic regulation on rhizome development and may provide information for pinpointing key rhizome-related genes that may be utilized in future perennial rice breeding programs.
Materials and Methods
Plant Materials
The mapping population was prepared from a cross between an unnamed O. longistaminata accession featuring long and strong rhizomes and the O. sativa cultivar RD23 (an indica cultivar from Thailand) (Tao and Sripichitt, 2000). The F1 plant was grown at the Perennial Rice Research Station of Yunnan University located in Jinghong, Yunnan Province, China, a typically double rice cropping region with a tropical monsoon climate (20°57′ E, 100°45′ N, at an altitude of 555 m). A large number of F2 seeds were obtained by bagged self-pollination and vegetative propagation using tillers. All F2 plants were grown at the same region in Jinghong during the first cropping season of 2016, and the distance between F2 plants was 50 cm. At the time of flowering, all plants were dug up, and the underground parts were washed free of soil for phenotypic evaluation.
Recombinant inbred lines were developed in our laboratory using the single seed descent technique. Since 2007, one single individual plant from the previous generation was randomly selected for selfing. The seeds were harvested and planted as a new generation. These steps were repeated, and finally, a RIL population consisting of 133 lines was obtained. This RIL population was employed to preliminarily validate the key loci identified in this study.
Phenotypic Evaluation
Each plant was first evaluated for the presence or absence of rhizomes (hereafter referred to as Rhz). For individuals with rhizomes, rhizome-related quantitative traits were measured, including rhizome number (RN), cumulative length of primary branches (RLsum), average length of primary branches (RLmean), maximum length of primary branches (RLmax), number of secondary branches (RB2), number of tertiary branches (RB3), and number of quaternary branches (RB4) per plant (Figure 1).
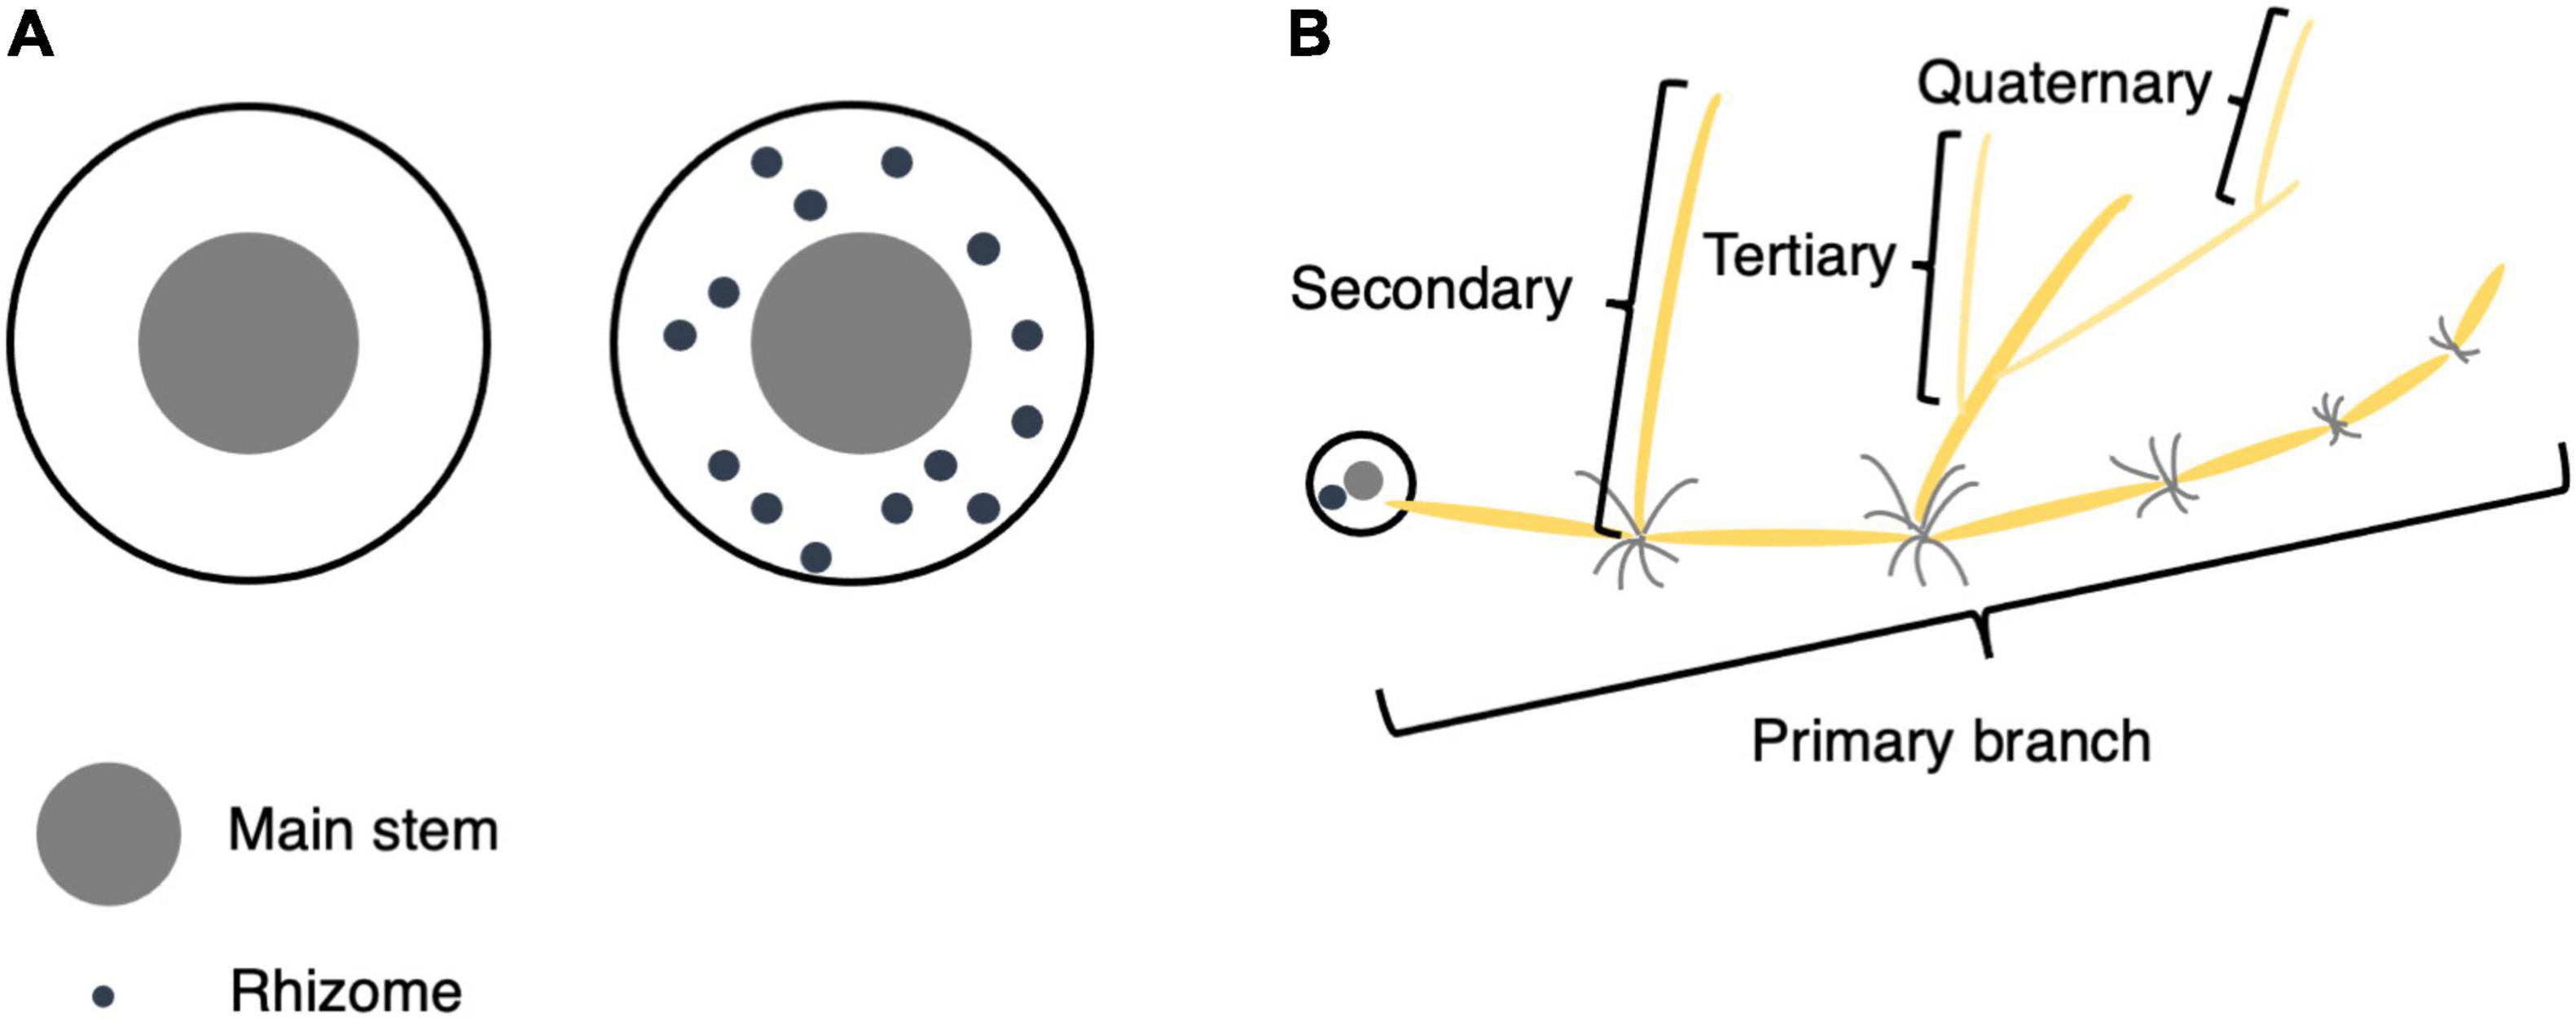
Figure 1. Phenotypic evaluation of rhizomes. (A) Top view of plants with and without rhizomes. If a plant’s underground part contained only the main stem and tillers, its Rhz was recorded as 0 (without rhizomes), and if there were obvious internodes in the underground part, its Rhz was recorded as 1 (with rhizomes). (B) Schematic illustration for primary, secondary, tertiary, and quaternary branches.
Genotyping-by-Sequencing Library Construction and Single Nucleotide Polymorphism Detection
DNA was extracted using the cetyltrimethylammonium bromide method (Doyle, 1987). A genotyping-by-sequencing library was prepared following the protocol developed by Clark et al. (2014). Briefly, DNA samples were first digested by the restriction enzymes PstI and MspI, and then sheared to 200–400 bp for restriction site-associated DNA library construction. Sequencing was performed on an Illumina HiSeq 2000 machine and 150-base paired-end reads were obtained.
Raw read files were decoded for each sample by using “process_radtags” in Stacks v2.3 according to their barcode files. Subsequently, the raw reads for each sample were aligned to the O. sativa genome (IRGSP V1.0 O. sativa Nipponbare, Kawahara et al., 2013) by using the Burrows-Wheeler Alignment software (parameter: mem −t 4 −M −R). The alignment results were formatted and converted into input files using SAMtools. The programs “pstacks,” “cstacks,” and “genotypes” in Stacks were used to perform SNP calling and obtain the genotypic data based on SNPs. The raw SNPs were filtered by an R script. First, SNPs that were not present in over 20% of individuals in the population were filtered, and the second round of filtering was performed according to segregation ratios and parental genotypes: for each SNP, it should be homozygous in both RD23 and O. longistaminata genomes, and be able to differentiate O. longistaminata and RD23. Finally, 1665 high-quality SNPs were obtained for genetic map construction.
Qualitative Trait Locus Identification and Quantitative Trait Loci Analysis
Chi-square tests were performed to detect qualitative trait loci associated with Rhz, with the significance level setting to 5%. On one chromosome, the locus with the maximum chi-square value was regarded as a hypothetical major-effect locus. To find all independent loci on the same chromosome, correlation analyses between the hypothetical major-effect locus and other loci were carried out. All loci that were significantly associated with the hypothetical main locus (P < 0.05) were considered as dependent loci and removed, and the remaining loci were identified as independent major-effect loci.
The linkage map was constructed by using Joinmap 4.0 (Van Ooijen, 2006). Inclusive composite interval mapping was performed for QTL analysis using QTL IciMapping 4.2 (Lei et al., 2015). The LOD score threshold for QTL identification was set to 2.50. QTLs were named as described by McCouch et al. (1997). Note that the corresponding QTLs for RLmean and RLmax were named as qRLM and qRLMAX, respectively.
Network Construction
Using the molecular-quantitative genetic model developed by Zhang et al. (2011), a genetic network underlying each measured trait was constructed according to genetic expectations of the identified loci. Briefly, FGUs were identified by performing multiple comparisons of the corresponding phenotypic data of one genotype represented by two loci. When there was a significant phenotypic difference (P < 0.05) between one genotype and the other genotypes, and the interaction effect between the two loci was equivalent to the main effect, these two loci were grouped into an FGU. According to whether one locus was significant responsible for the phenotypical difference or not, the locus and the other locus in a locus pair were regarded as hierarchy QTLs (directional links) or epistatic QTLs/loci (E-QTLs/loci, non-directional links), respectively. The integrated network of all identified loci was assembled based on loci that were found to affect more than one rhizome-related trait.
Verification of Key Quantitative Trait Loci
Locus sequences were obtained from the National Centre for Biotechnology Information and our unpublished O. longistaminata genome data (data not shown). Sequence-tagged site (STS) markers were designed by using Primer 5.0. The primer sequences were qRHZ-3-1-F (5′-CTACCAGGTTCGTT GATGTC-3′) and qRHZ-3-1-R (5′-CGAGGTACATCGTCTT GGA-3′) for qRHZ-3-1, qRHZ-4-F (5′-CAGACGGATTGAATC GATACCA-3′), and qRHZ-4-R (5′-CCATTTTCCCTGTTC ATCCATC-3′) for qRHZ-4, qRHI-2-F (5′-ATAAAATGGTATG GTGTAATGG-3′) and qRHI-2-R (5′-TGTTTCGCATTGCA TCTG-3′) for qRHI-2, qRHI-5-F (5′-TTAGCTCTCACAAA TGAATATC-3′), and qRHI-5-R (5′-TATCCAACCCTTCAA ACG-3′) for qRHI-5. PCR was performed in a 20 μL reaction containing 1 μL genomic DNA extracted from one RIL individual, 0.5 μL Primer-F/R, 2 μL 10 × Taq Buffer, 1.6 μL dNTP, 0.5 μL Taq polymerase, and 13.9 μL ddH2O. Amplification was programmed for 3 min at 94°C for initial denaturation and 30–35 cycles consisting of 30 s at 94°C, 30 s at 56–60°C, 20 s at 72°C, followed by a final 5 min at 72°C. Amplified DNA fragments were detected using 8% polyacrylamide gel electrophoresis.
Results
Phenotypes of the F2 Population
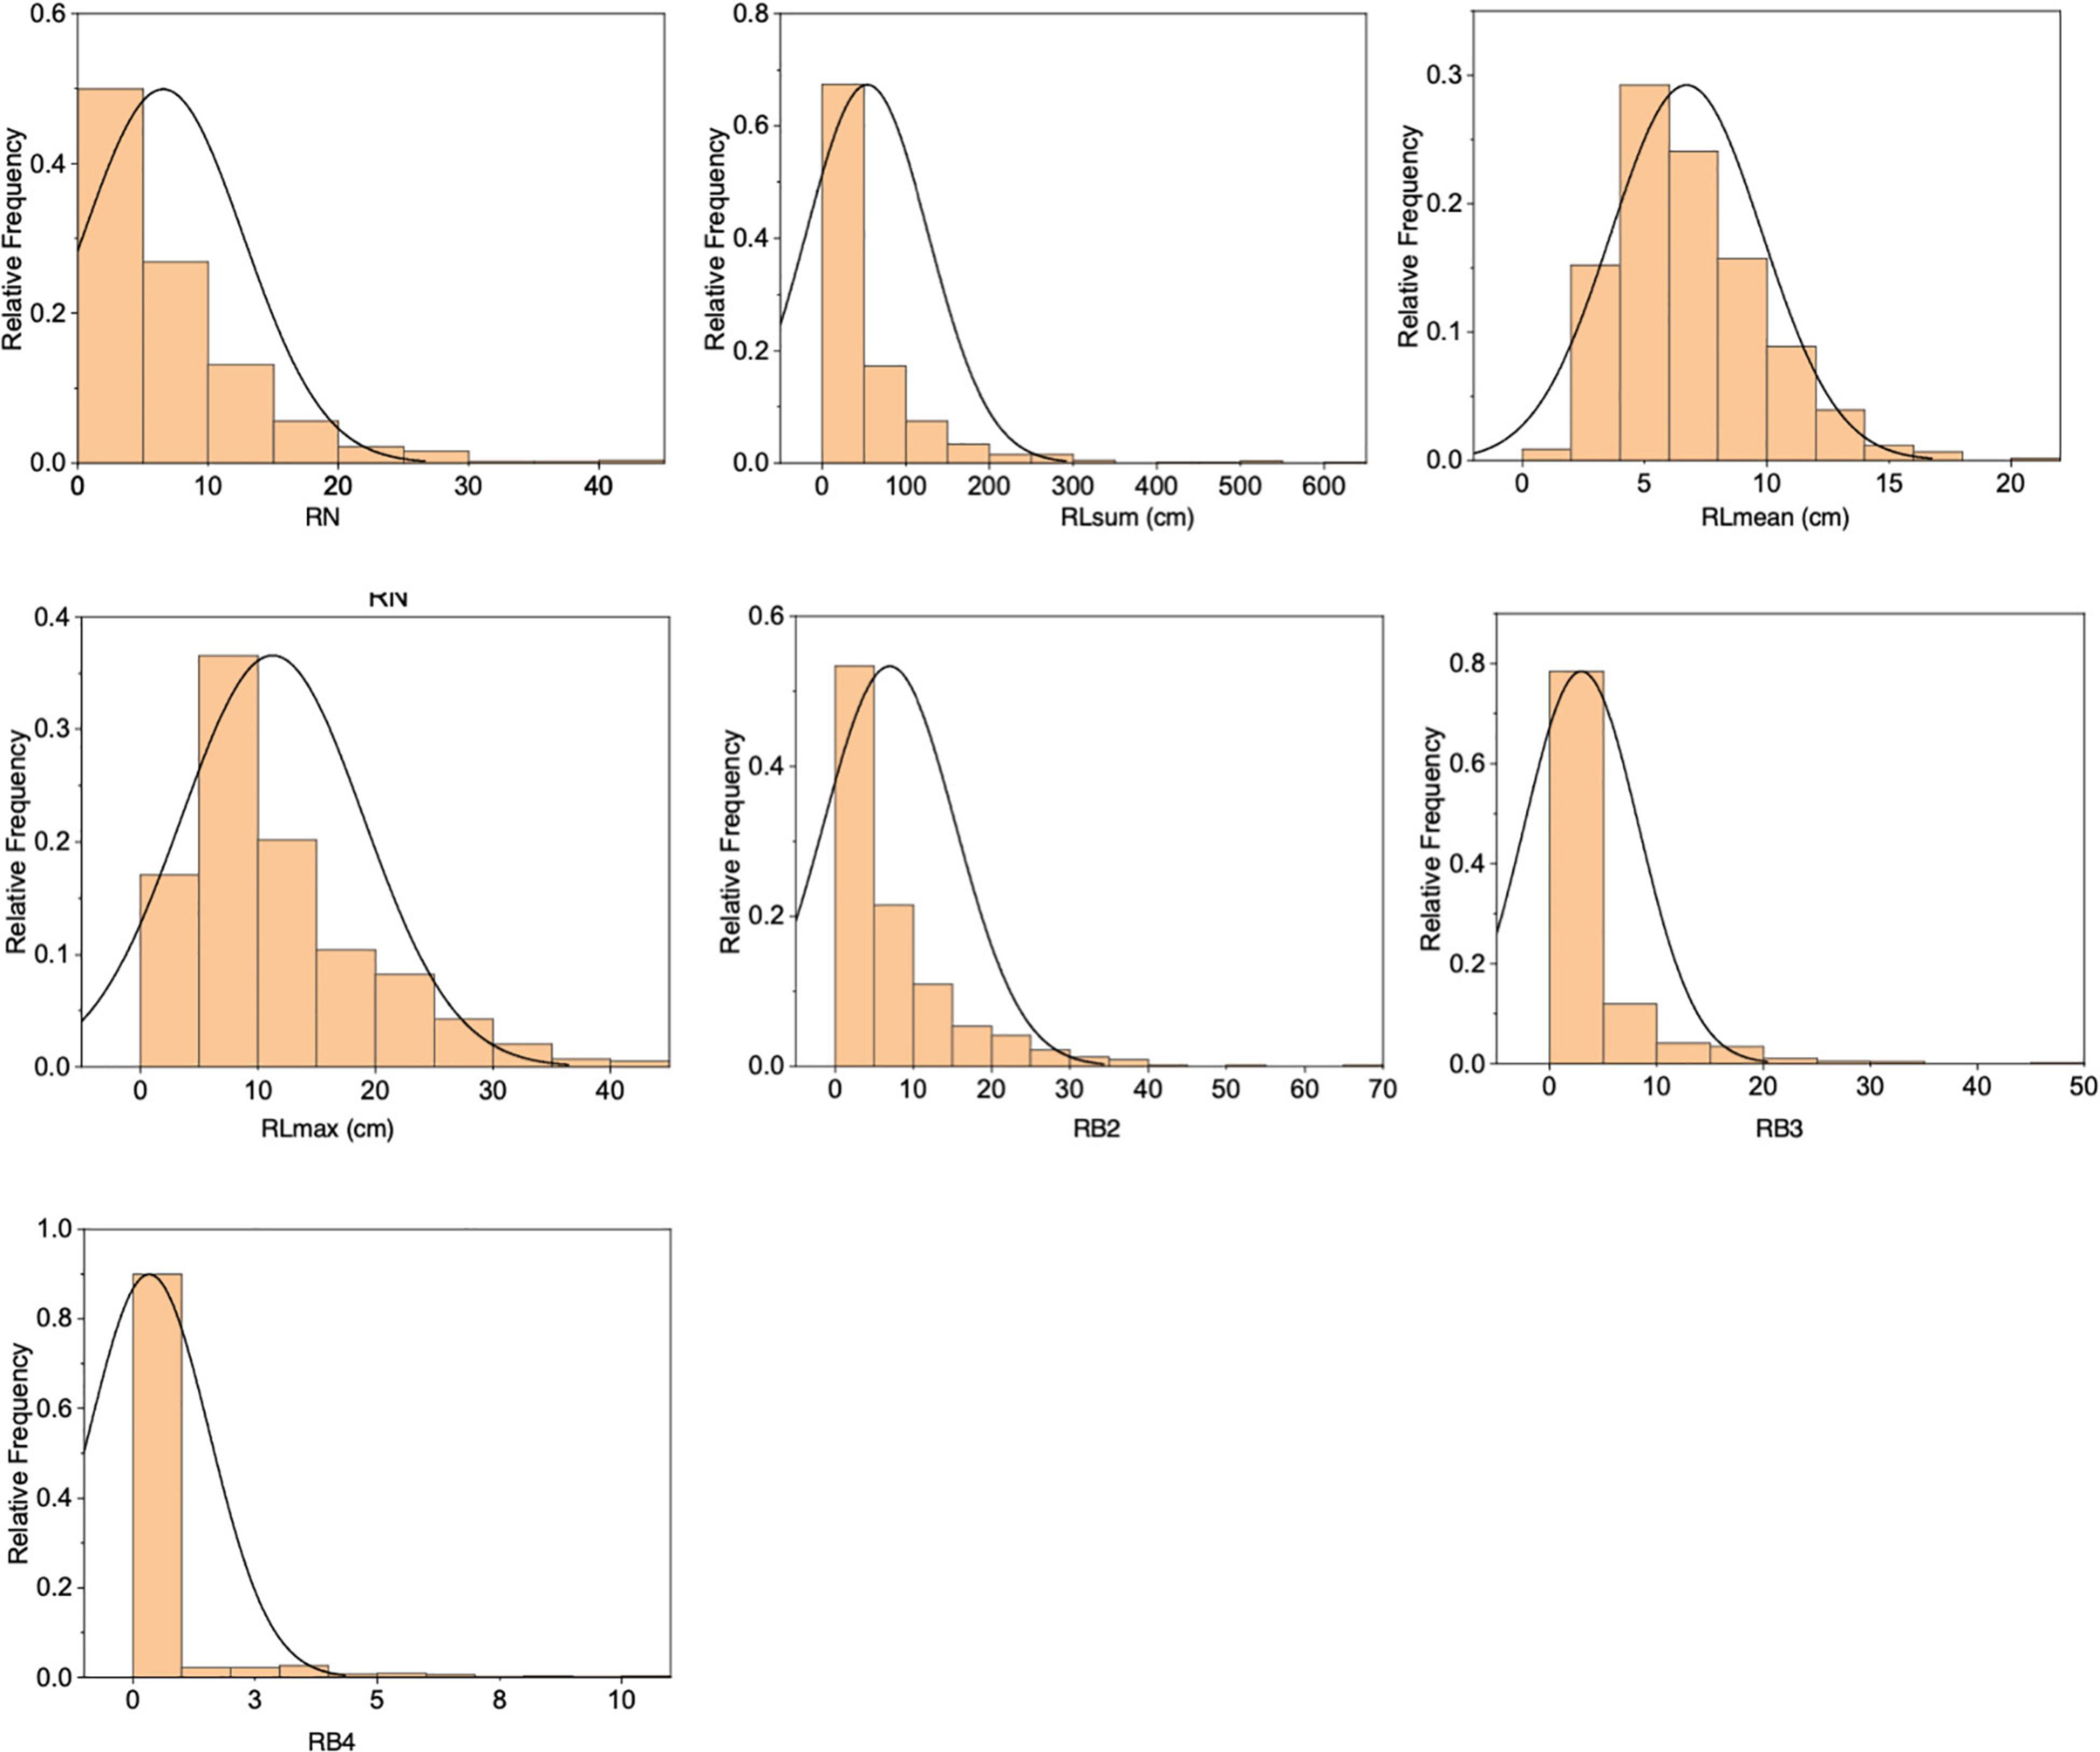
The F2 population derived from a cross between RD23 and O. longistaminata contained 818 individuals, of which 585 individuals had rhizomes. Significant variations were observed in the seven measured rhizome-related traits (RN, RLsum, RLmean, RLmax, RB2, RB3, and RB4), all exhibiting a skewed distribution (Figure 2 and Supplementary Table 1). The correlation analysis of seven rhizome-related quantitative traits revealed that there were significant correlations between these traits, with the correlation coefficients of RN and RLsum, and RLmax and RLmean reached 0.934 and 0.873, respectively (Supplementary Table 2).
Construction of Linkage Map of the F2 Population
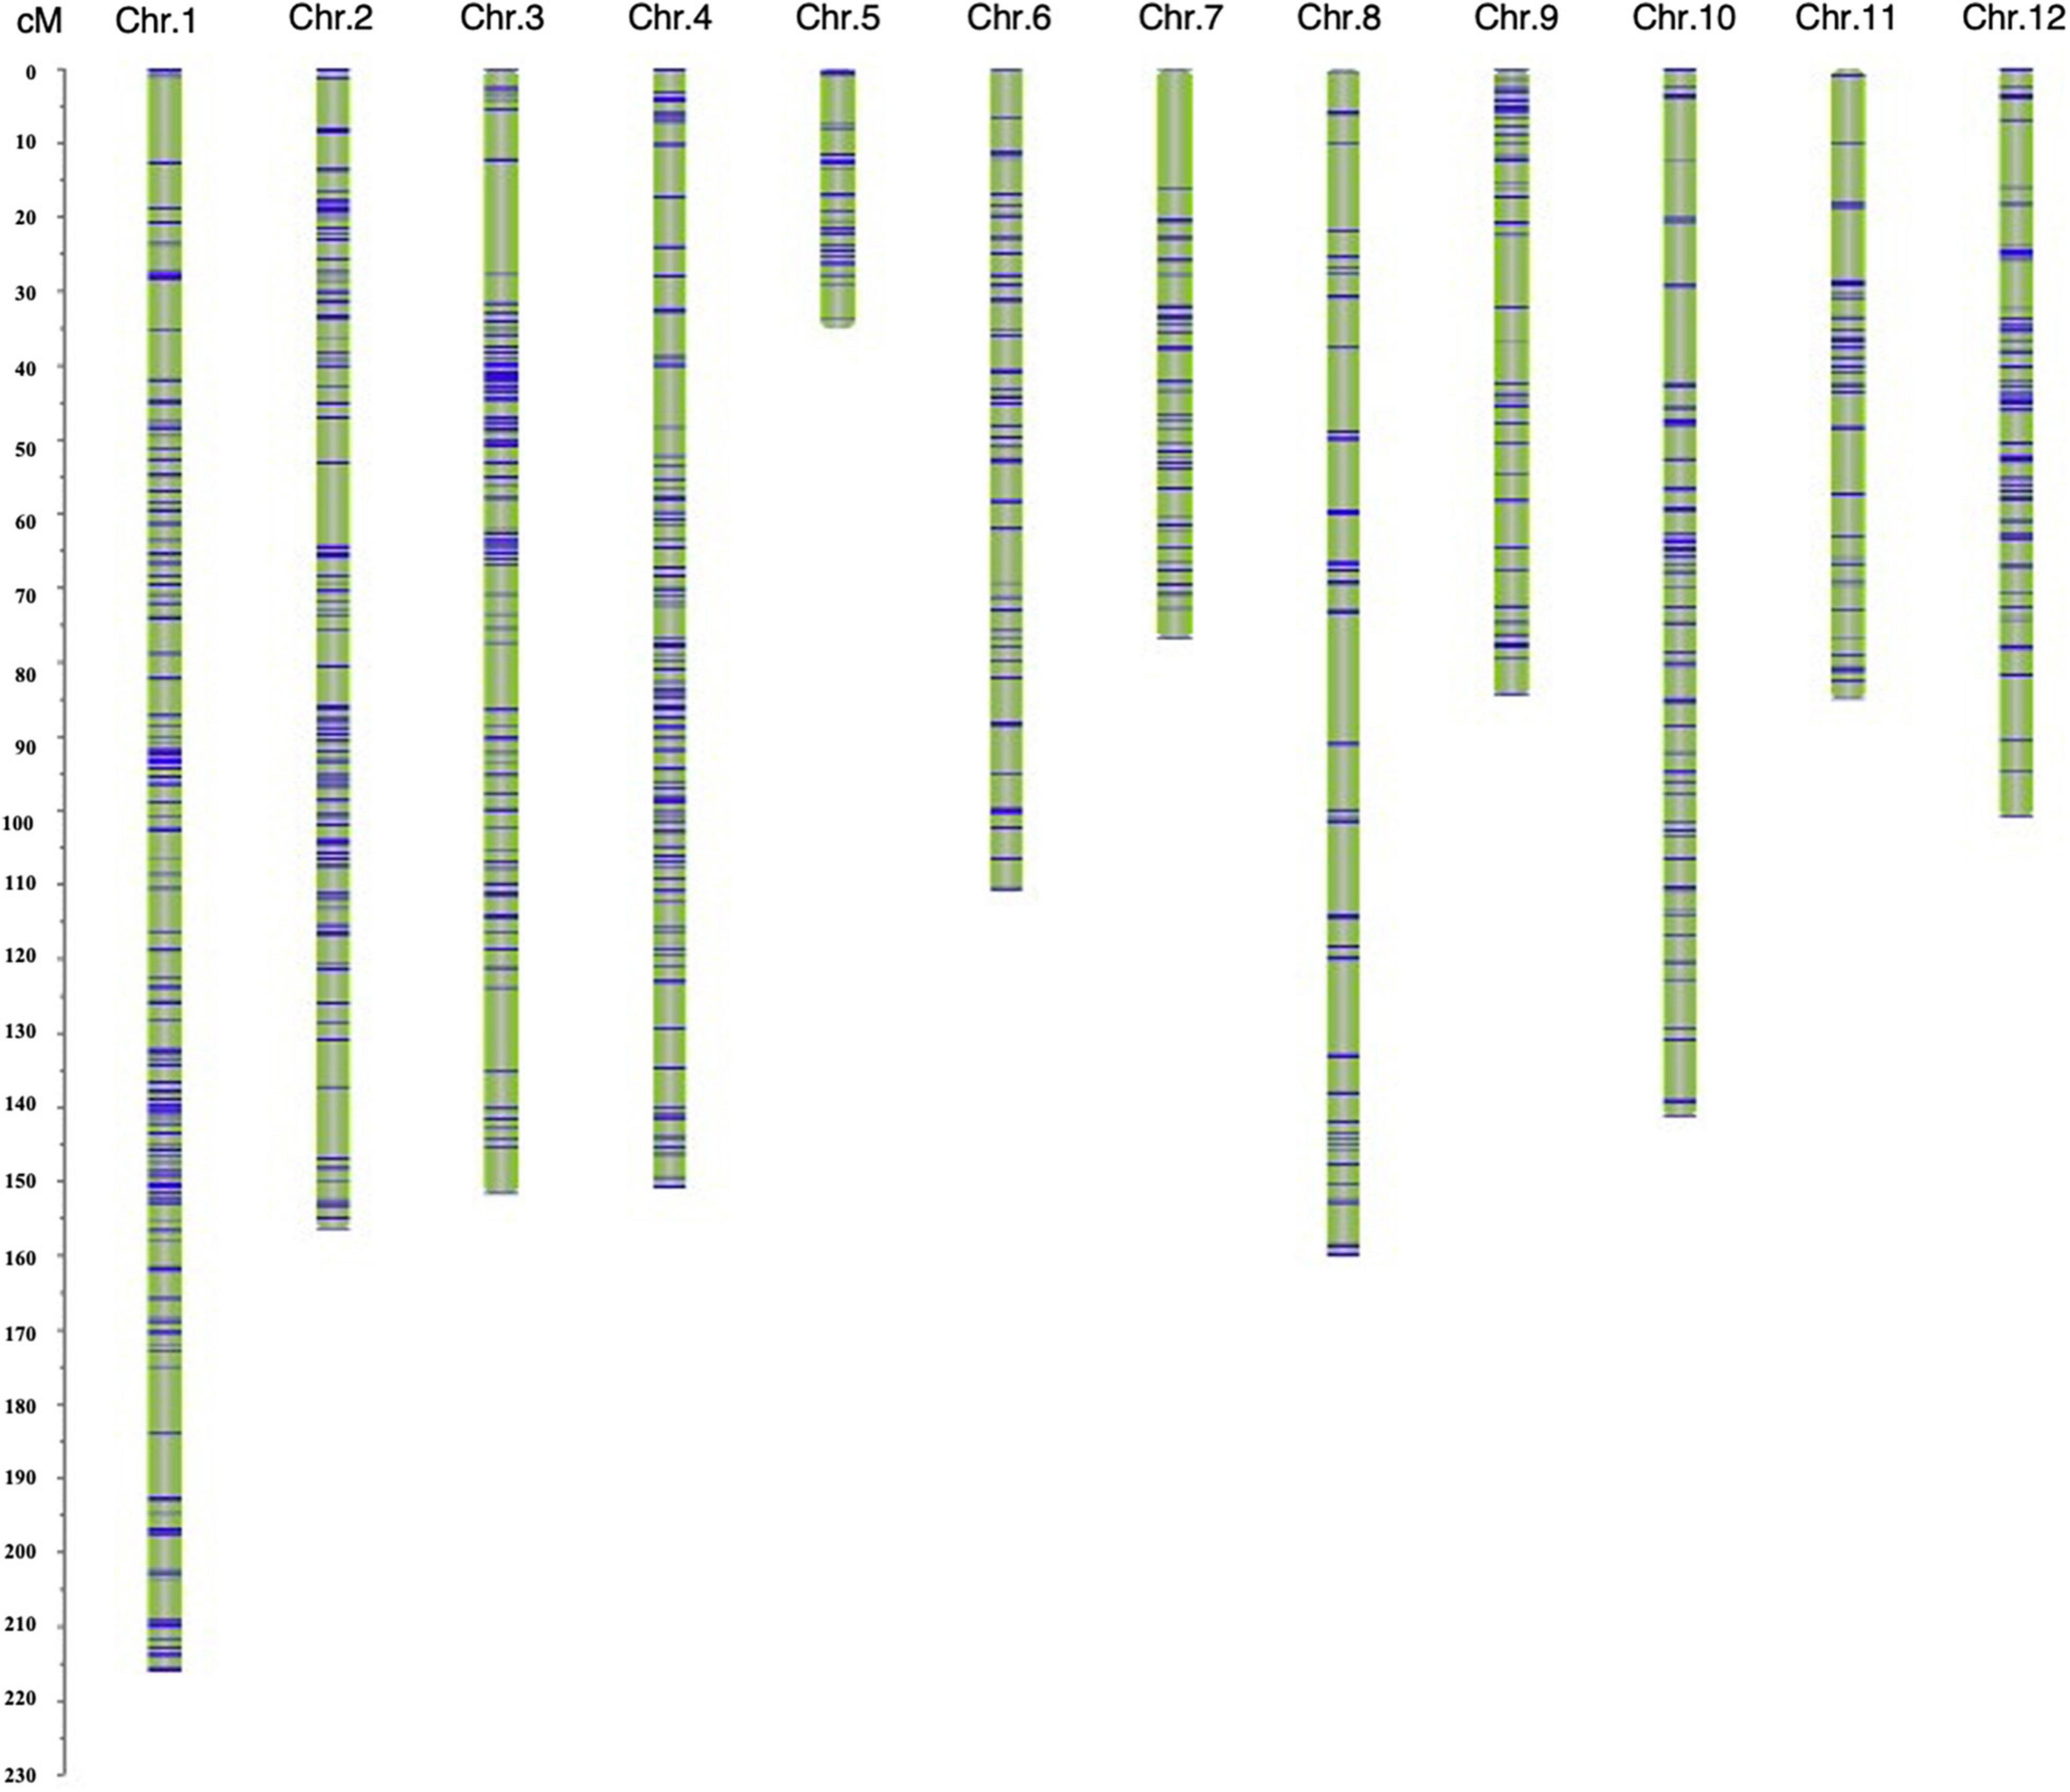
A genetic map was constructed based on 1487 SNP markers spanning 1469.27 cM and covering all 12 chromosomes. The length of a single chromosome was between 35.04 and 216.00 cM, and the average distance between makers was 0.99 cM (Supplementary Table 3). Among the 12 chromosomes, chromosome 1 harbored the largest number (267) of markers, and the average distance between markers was 0.81 cM, whereas the number of markers on chromosome 5 was the lowest (38 markers), with the average distance being 0.92 cM (Figure 3 and Supplementary Table 3).
Qualitative Trait Loci for Rhz and Quantitative Trait Loci Affecting Rhizome Development
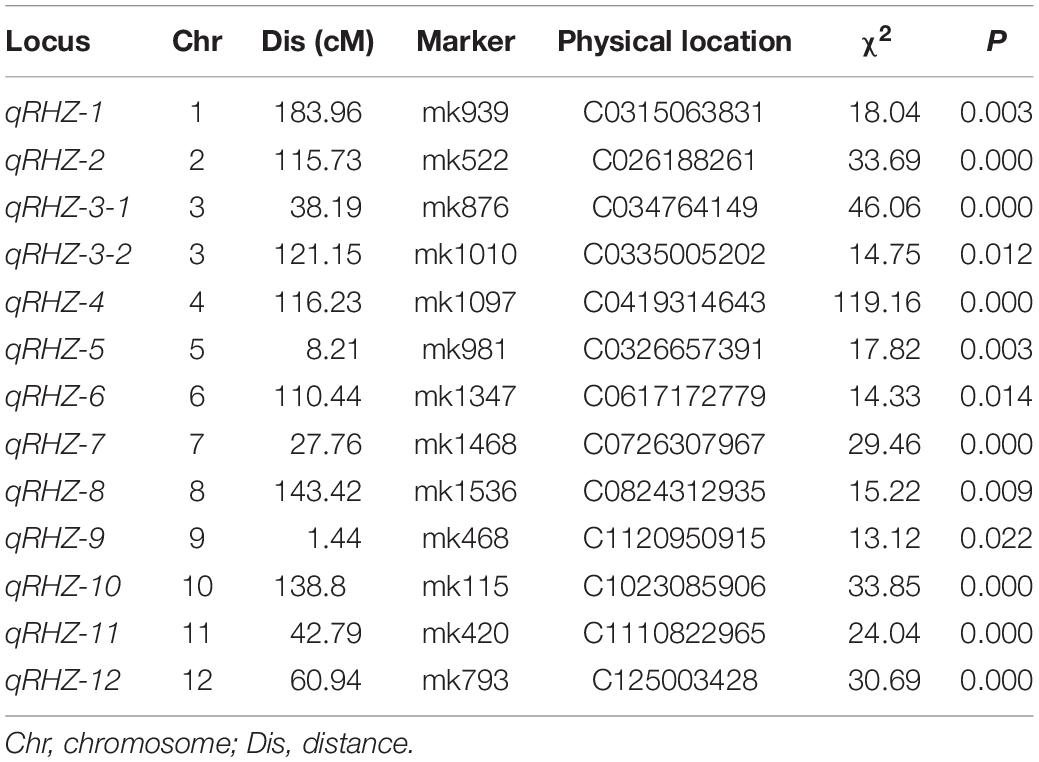
In all, 13 regions located in 12 chromosomes were identified as qualitative trait loci that were significantly associated with Rhz (Table 1 and Supplementary Table 4). Among these loci, chromosome 4-located qRHZ-4 showed the most significant segregation distortion (χ2 = 119.16), and it was therefore hypothesized as one major Rhz locus. On this premise, the effects of the remaining 12 Rhz loci were further analyzed after the interference of qRHZ-4 was removed. The results showed that, except for qRHZ-2, no other loci were significantly associated with Rhz. Hence, qRHZ-2 could be regarded as another major hypothetical Rhz locus (Supplementary Table 5).
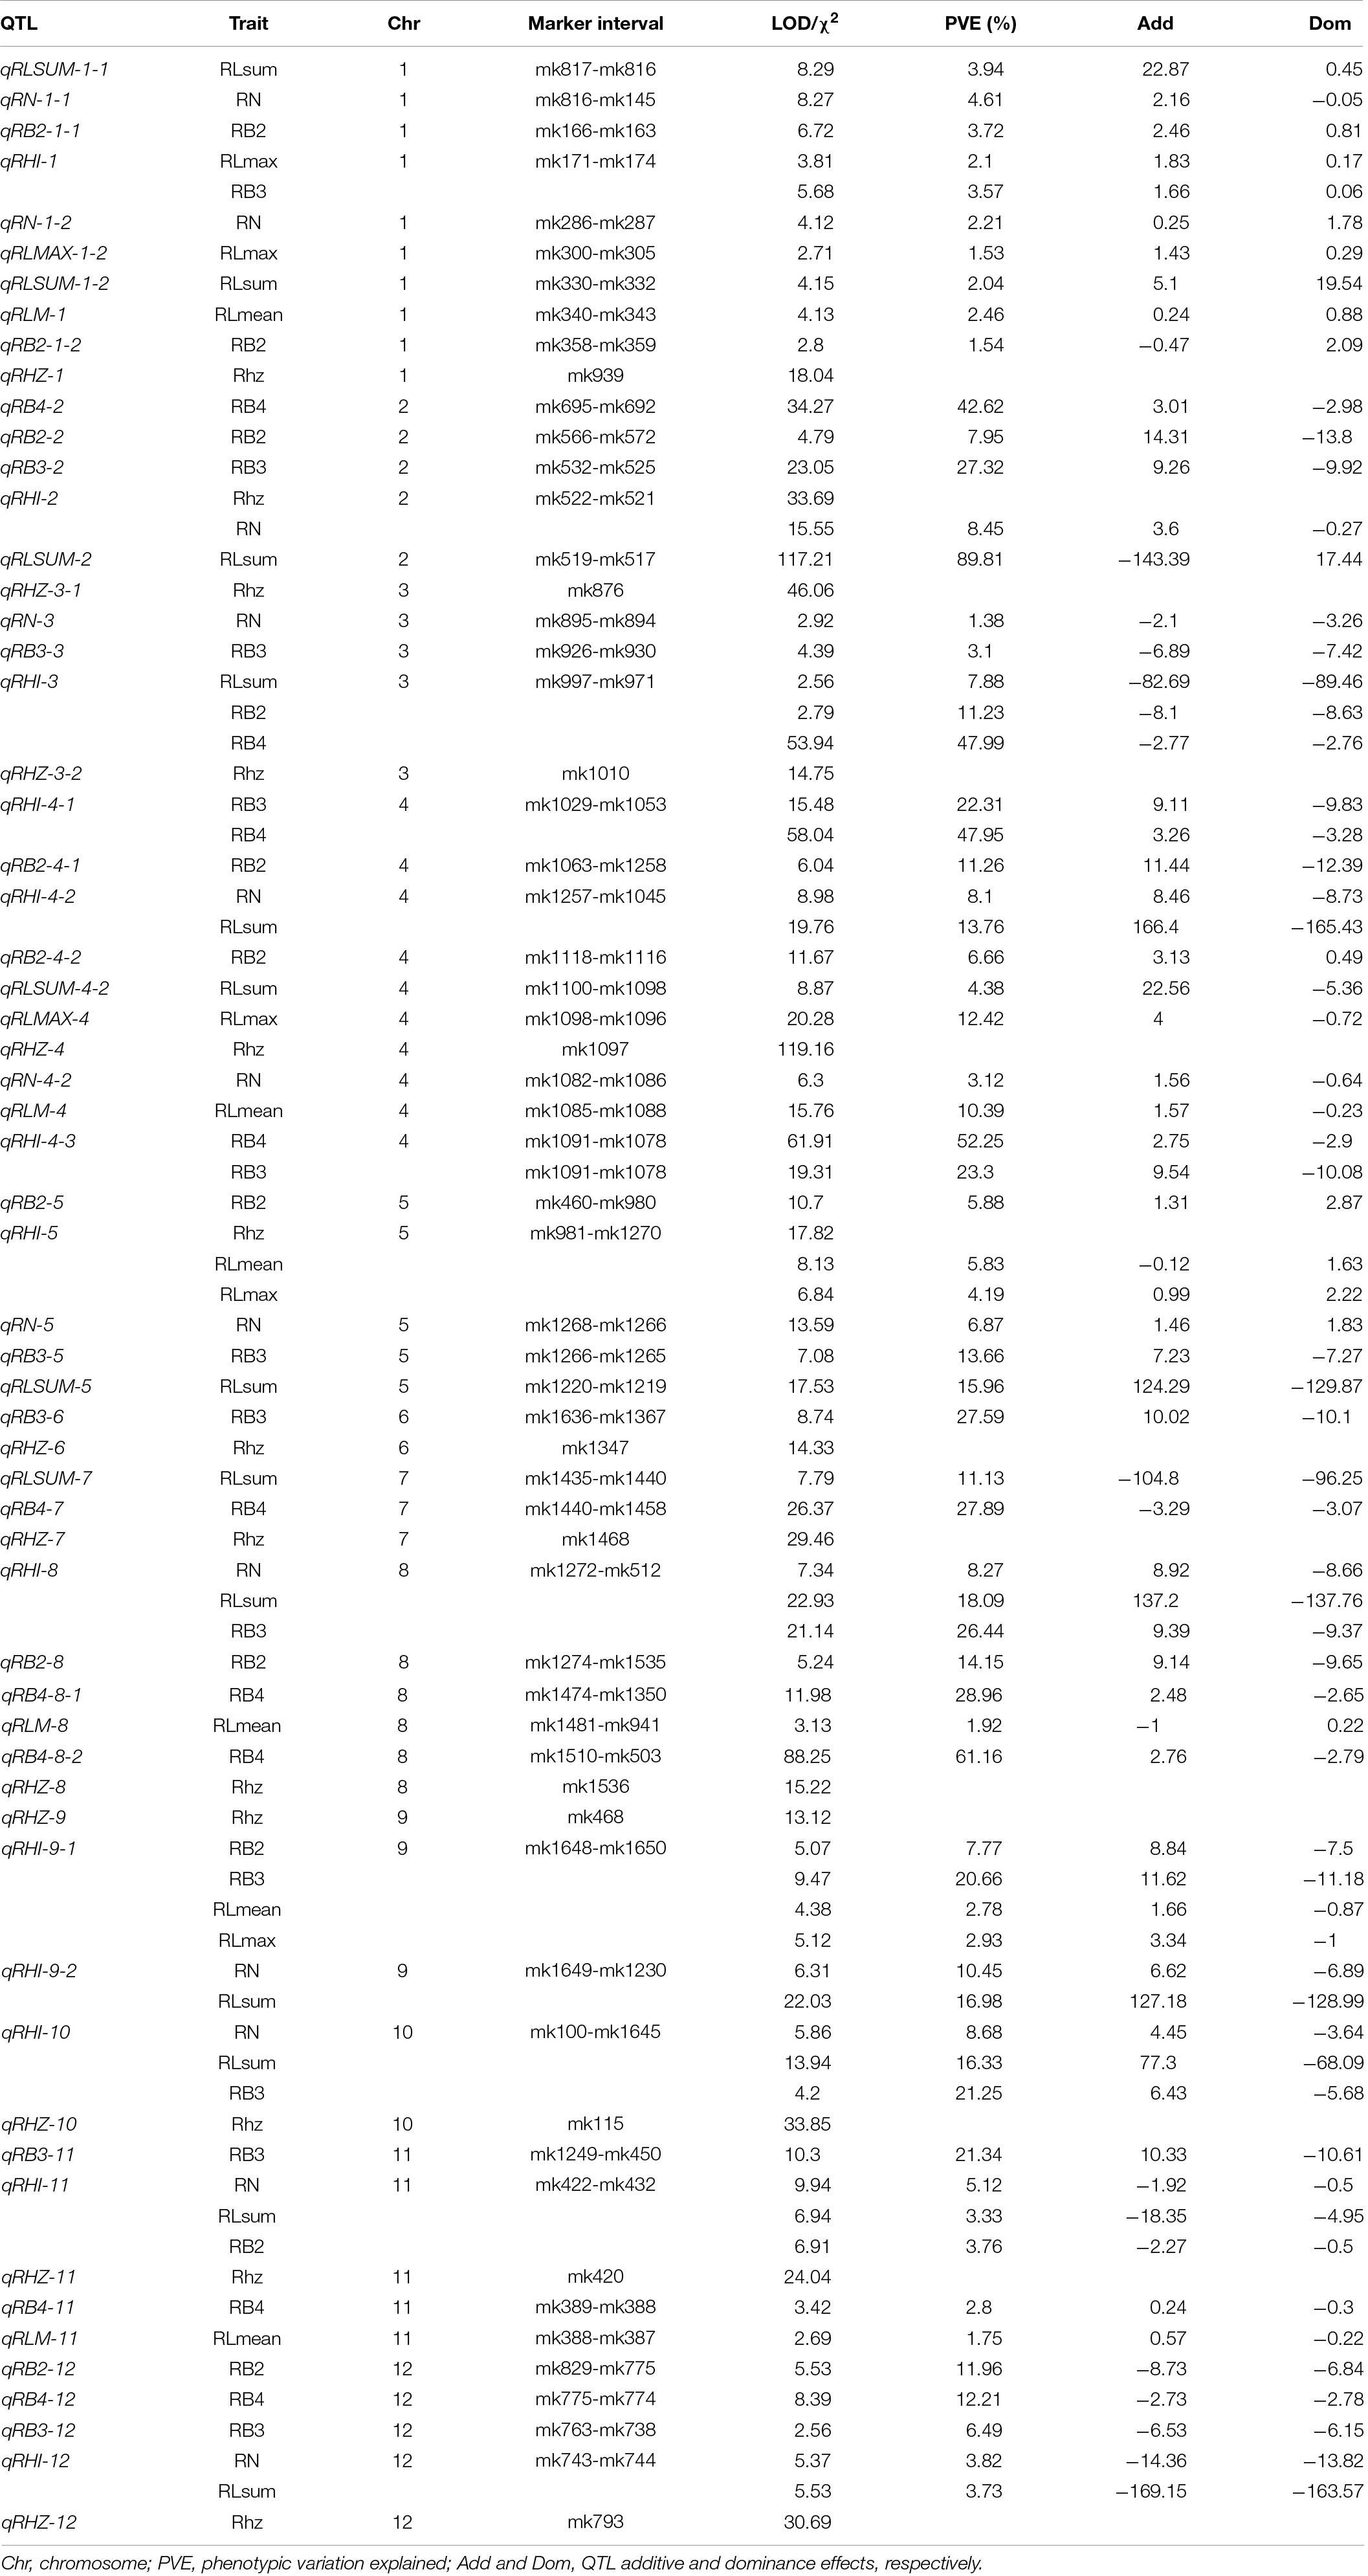
For the rhizome abundance traits measured in this study, a total of 51 QTLs were identified, while their effects on the phenotype varied greatly (Table 2 and Figure 4). For example, among the 12 QTLs that were found to affect RN, the highest phenotypic variation explained (PVE) was 10.45, whereas the lowest PVE was 1.38. Interestingly, we found that 11 QTLs may control at least two traits, and they were re-termed qRHI. Most of these QTLs appeared to affect multiple highly correlated traits, such as qRHI-1 for RLmax and RB3; qRHI-3 for RLsum, RB2, and RB4; qRHI-4-1 and qRHI-4-3 for RB3 and RB4; and qRHI-4-2 for RLsum and RN. It is worth noting that three regions identified to determine Rhz were also found to be located in QTL intervals affecting other rhizome-related traits, such as qRHI-2 for Rhz and RN, and qRHI-5 for Rhz, RLmean and RLmax.
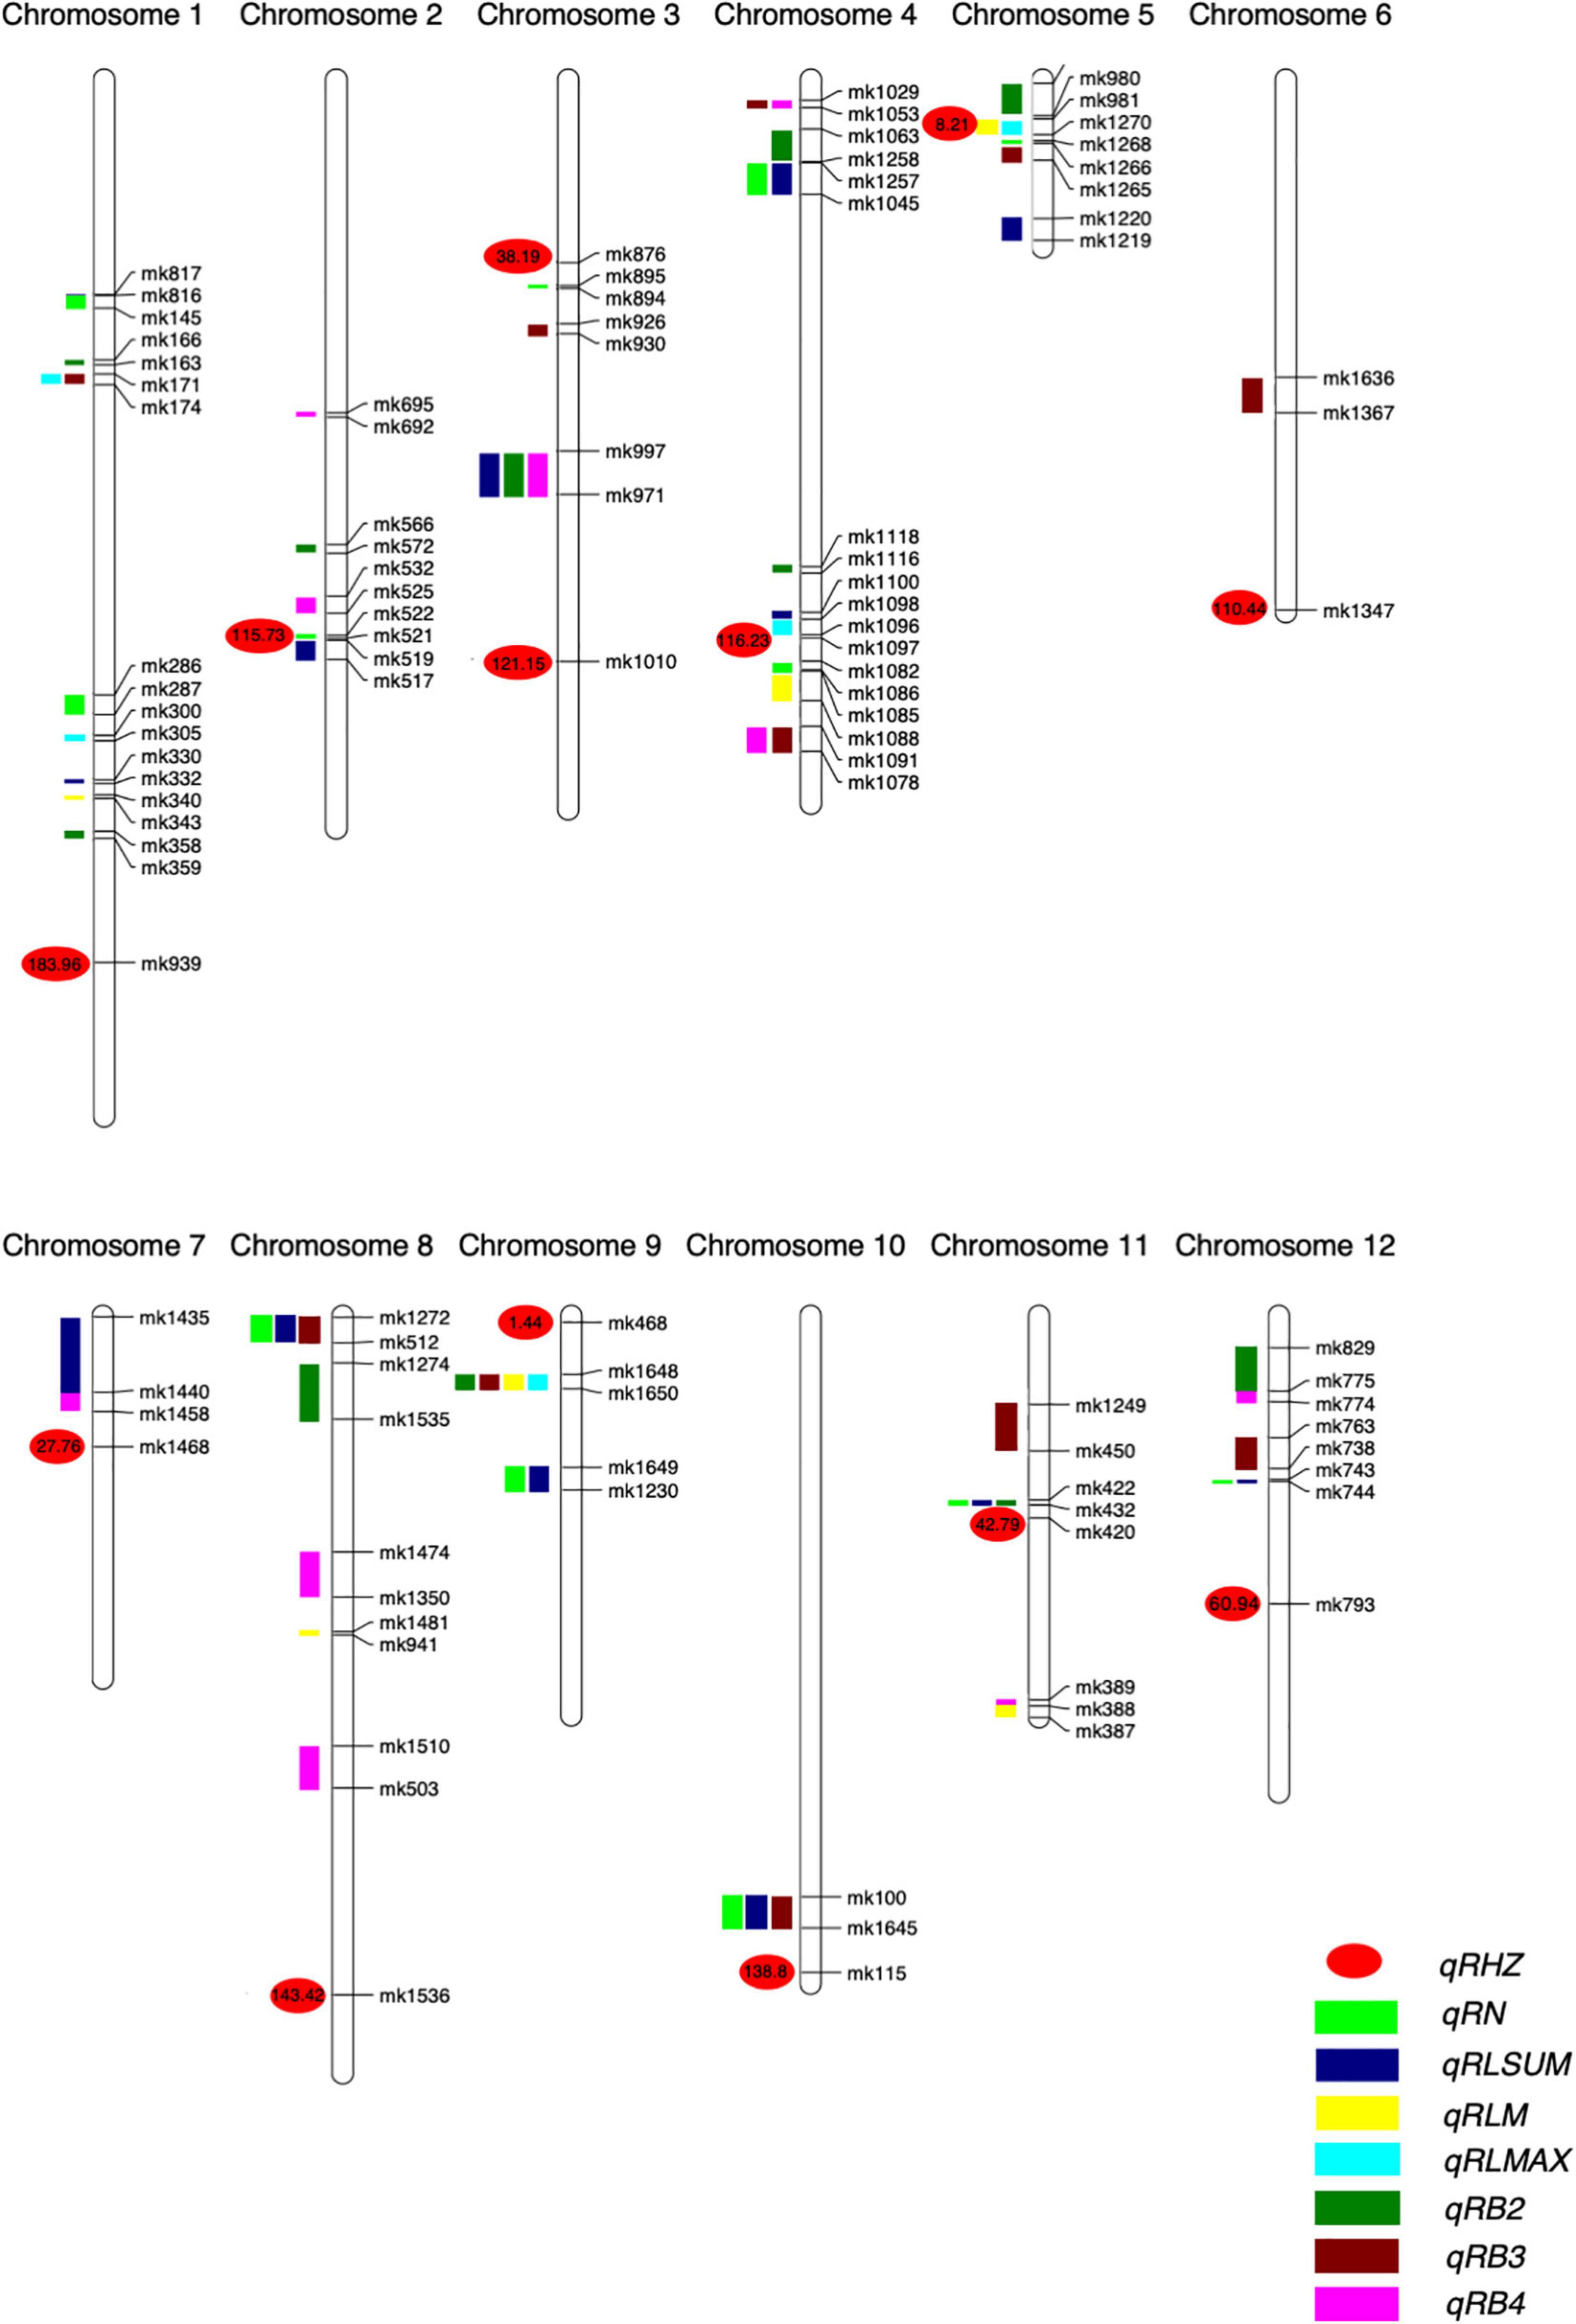
Figure 4. Positions of QTLs on the genetic linkage map of the F2 population. Numbers are genetic distances.
qRHZ-3-1, qRHZ-4, qRHI-2, and qRHI-5 Are Key Quantitative Trait Loci in the Genetic Network Underlying Rhizome Development
To further understand the relationships between and among the identified loci, we constructed a genetic network for each trait based on FGUs (Figure 5 and Supplementary Table 6). A total of 12 FGUs affecting Rhz were detected, consisting of 2 pairs of hierarchical loci and 29 pairs of E-loci (Figure 5A and Supplementary Table 6). This network displayed a clear hierarchical structure with qRHZ-4 as the highest-level node. Another similar highly hierarchical network was the RLsum network, with qRLsum as the top node and each layer containing more nodes along with the hierarchy (Figure 5C). By contrast, the networks for RB and RB4 appeared to be non-hierarchical, with no obvious loci located on the upstream of other loci (Figures 5F,H). The network for RLmax was the network of the simplest form (containing only three nodes), in which qRLmax-4 was hierarchically connected with other two nodes (Figure 5E).
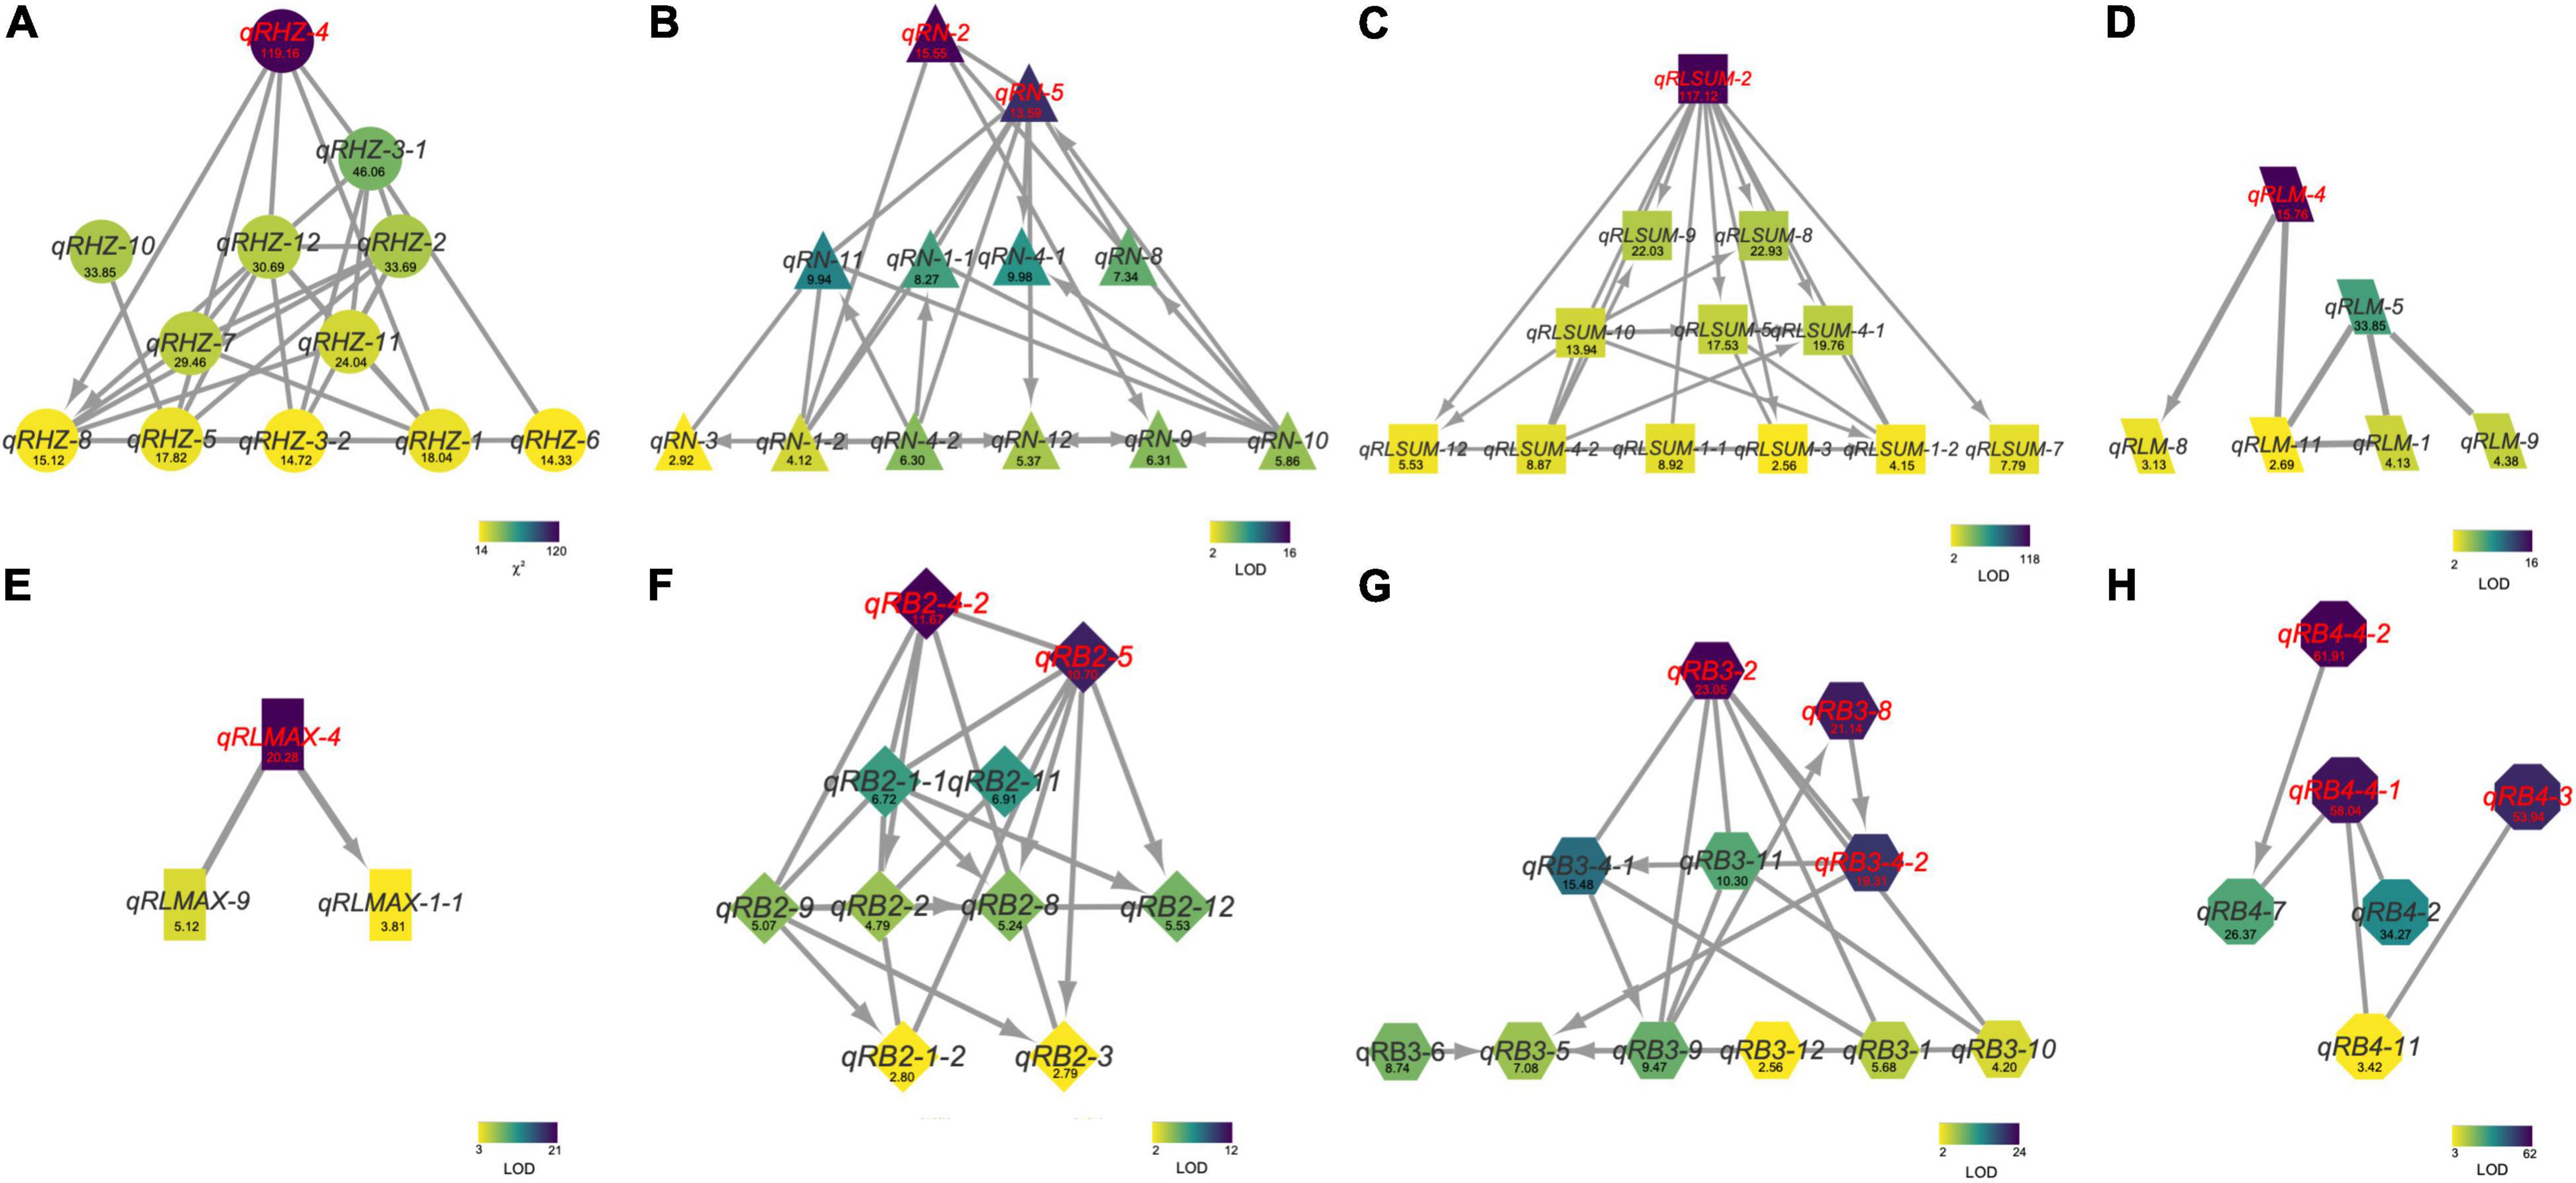
Figure 5. The genetic networks for Rhz (A), RN (B), RLsum (C), RLmean (D), RLmax (E), RB2 (F), RB3 (G), and RB4 (H). A line between two nodes indicates that these two nodes are a pair of E-loci (A) or E-QTLs (B–H). An arrow between two nodes represents a hierarchical relationship between this node pair, with the node at the arrowhead being regulated by the other node of the pair. Numbers are Chi square values (A) or LOD values (B–H).
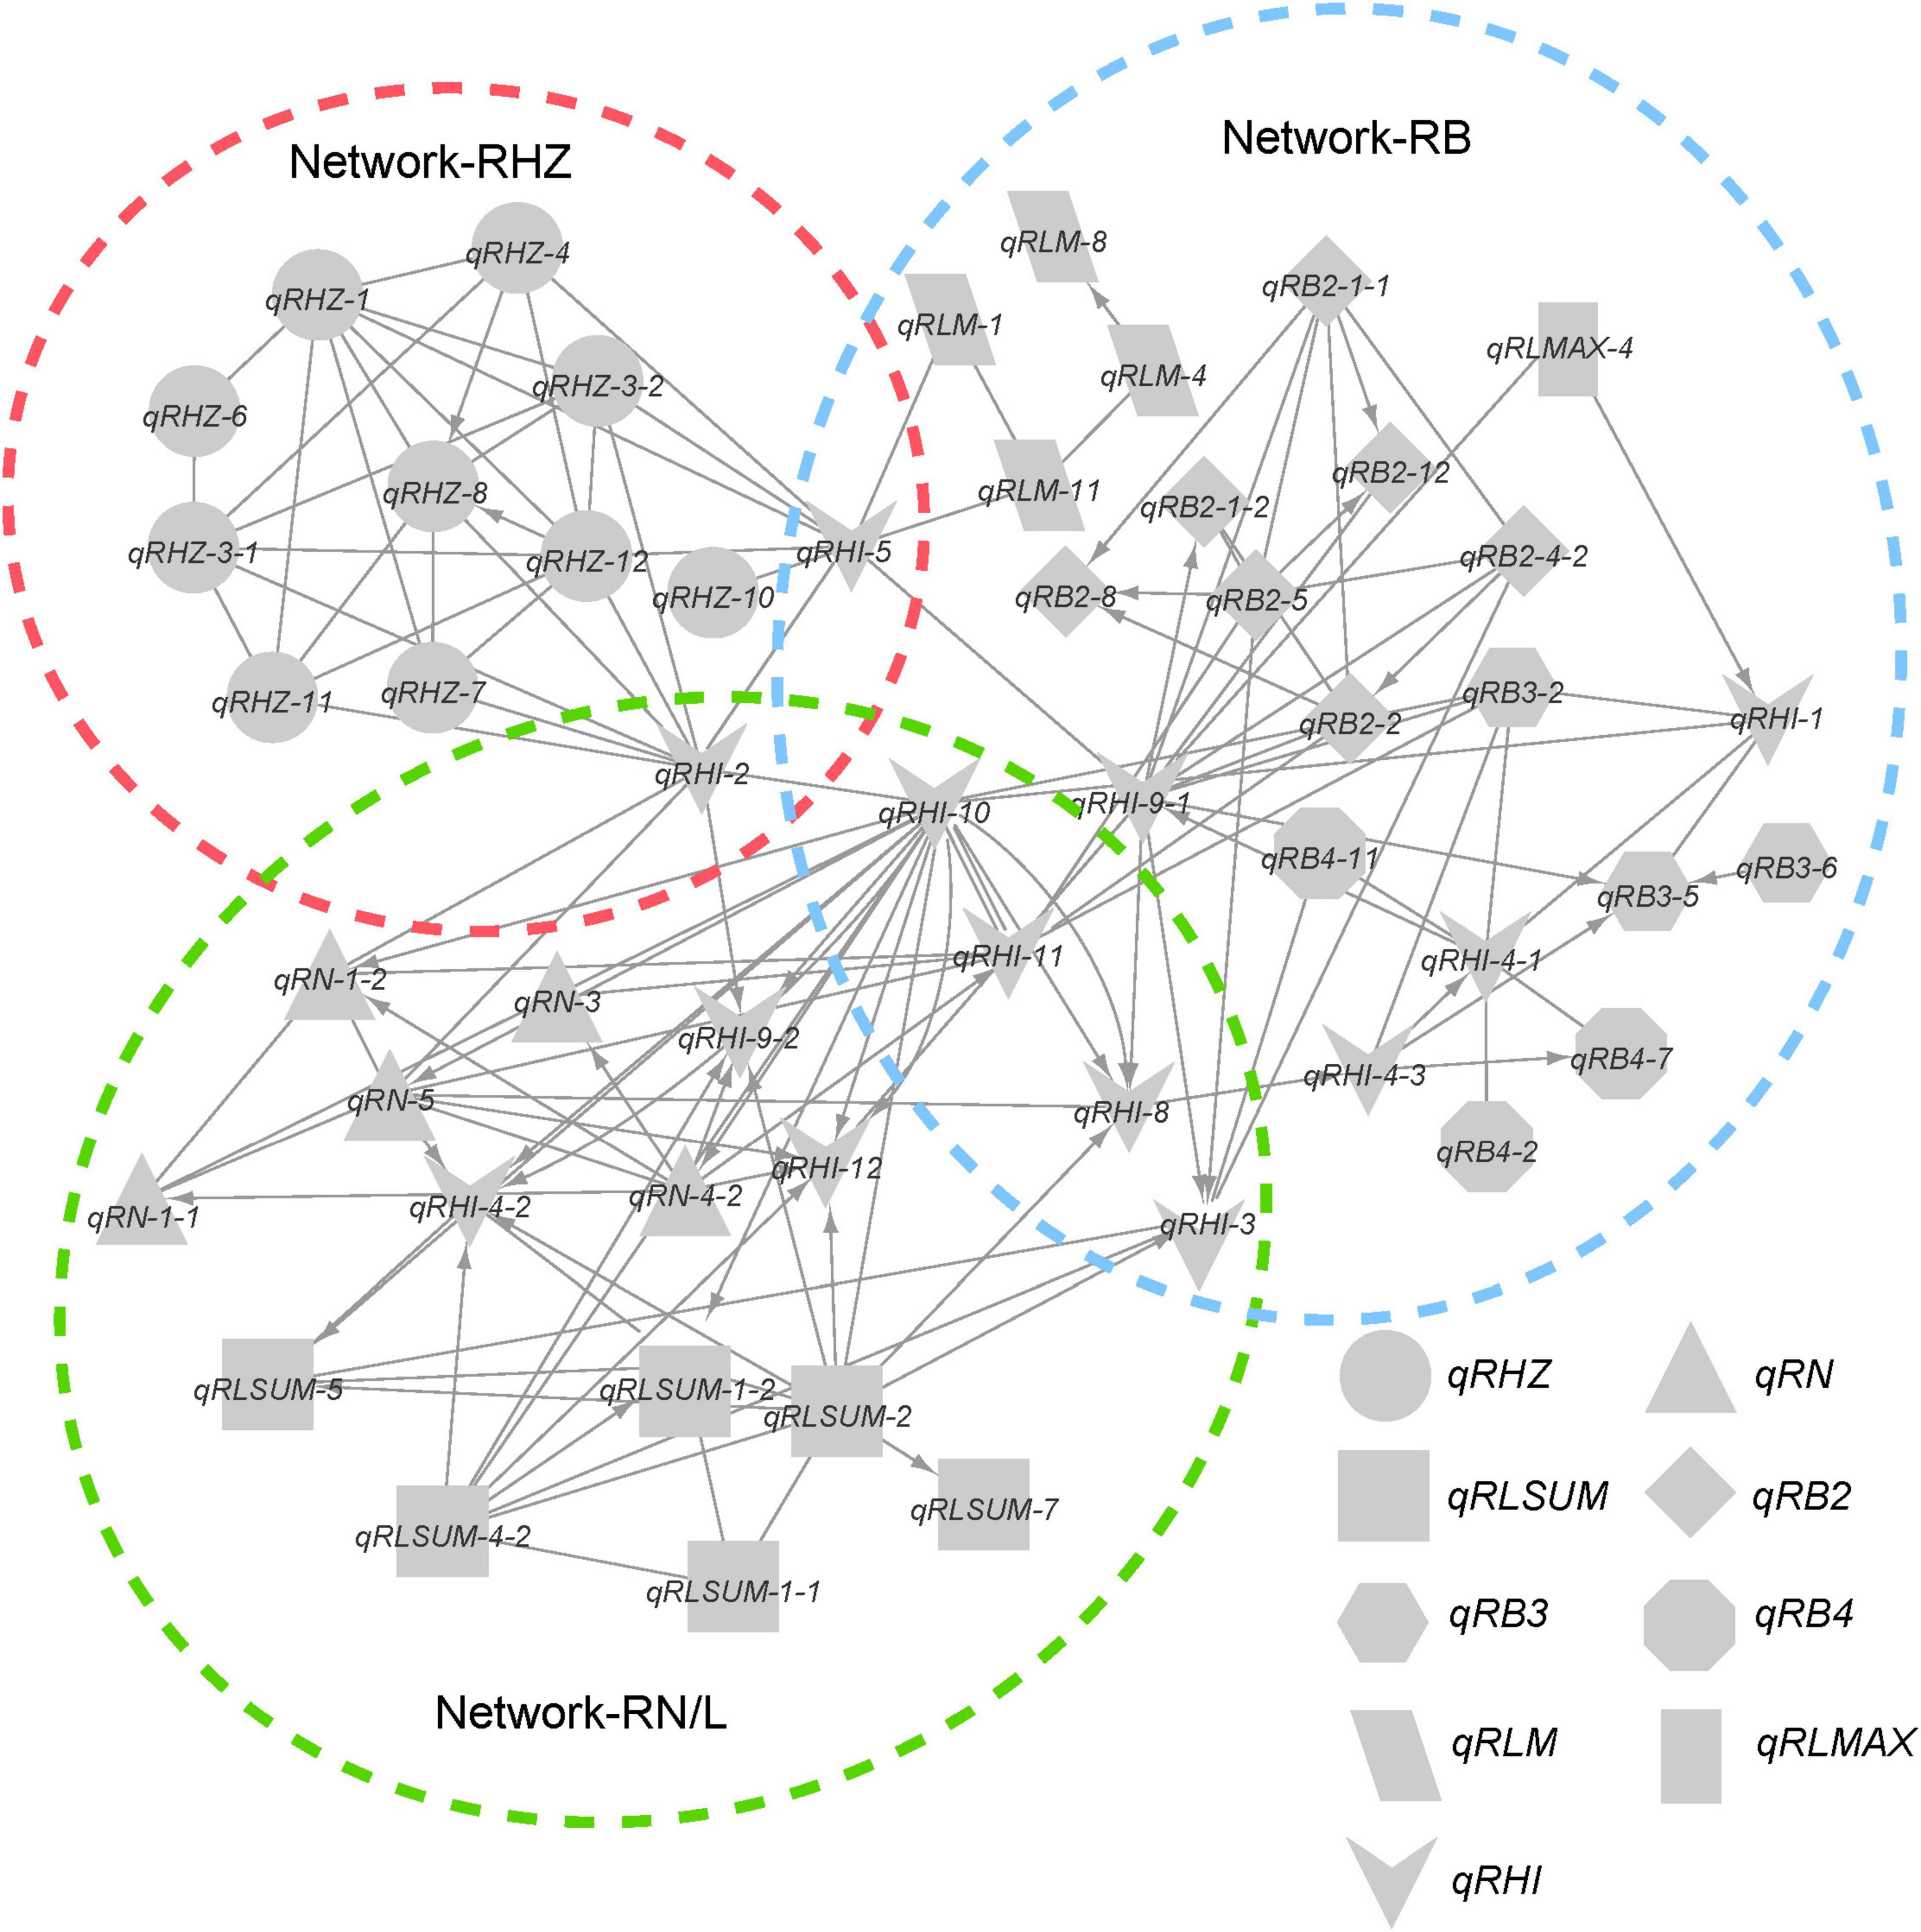
Considering the possible interactions among loci for different traits, we further integrated the individual networks for single traits into a comprehensive network (Figure 6). In this network, a total of 58 FGUs were included, containing 62 pairs of hierarchy loci/QTLs and 104 pairs of E-loci/QTLs. Based on network properties, we extracted three sub-networks and termed them as network-RHZ, network-RB, and network-RN/L, which corresponded to Rhz, rhizome branching traits, and rhizome number/length, respectively. Given that network-RHZ should be the prerequisite for other two networks, its nodes with the most marked effects, qRHZ-3-1 and qRHZ-4, and its connector nodes with the other two networks, qRHI-2 and qRHI-5 were classified as key loci in the network (Figure 6).
Preliminary Verification of Key Loci in the Networks
To preliminarily verify the biological function of the four key loci we identified, we detected the genotypes of a rhizome-free RIL population containing 133 individuals by using the STS markers of these loci, and observed the corresponding phenotypes. For each individual locus, most individuals of the RIL population were RD23 homozygous, but a few O. longistaminata homozygous individuals were also detected (Supplementary Table 7). There were five individuals harboring two pairs of O. longistaminata homozygous alleles, namely, RIL 129, 117, 303, 304, and 322 (Figure 7; as RIL 303 and 304 are of the same genotype, only the phenotype of RIL 303 is shown). The observation that all RILs with homozygous O. longistaminata alleles at single locus were rhizome-free confirmed that no single locus can ensure the presence of rhizomes. Moreover, none of these rhizome-free individuals were detected to harbor more than two of these key loci with O. longistaminata alleles, suggesting that three or more loci with O. longistaminata alleles are required for the presence of rhizomes. Given that we failed to detect any genotype with homozygous O. longistaminata alleles at both qRHI-2 and qRHI-5, two multi-trait controlling loci that appeared to be critical in our network analyses, we hypothesize that these two loci are likely both needed for proper rhizome growth.
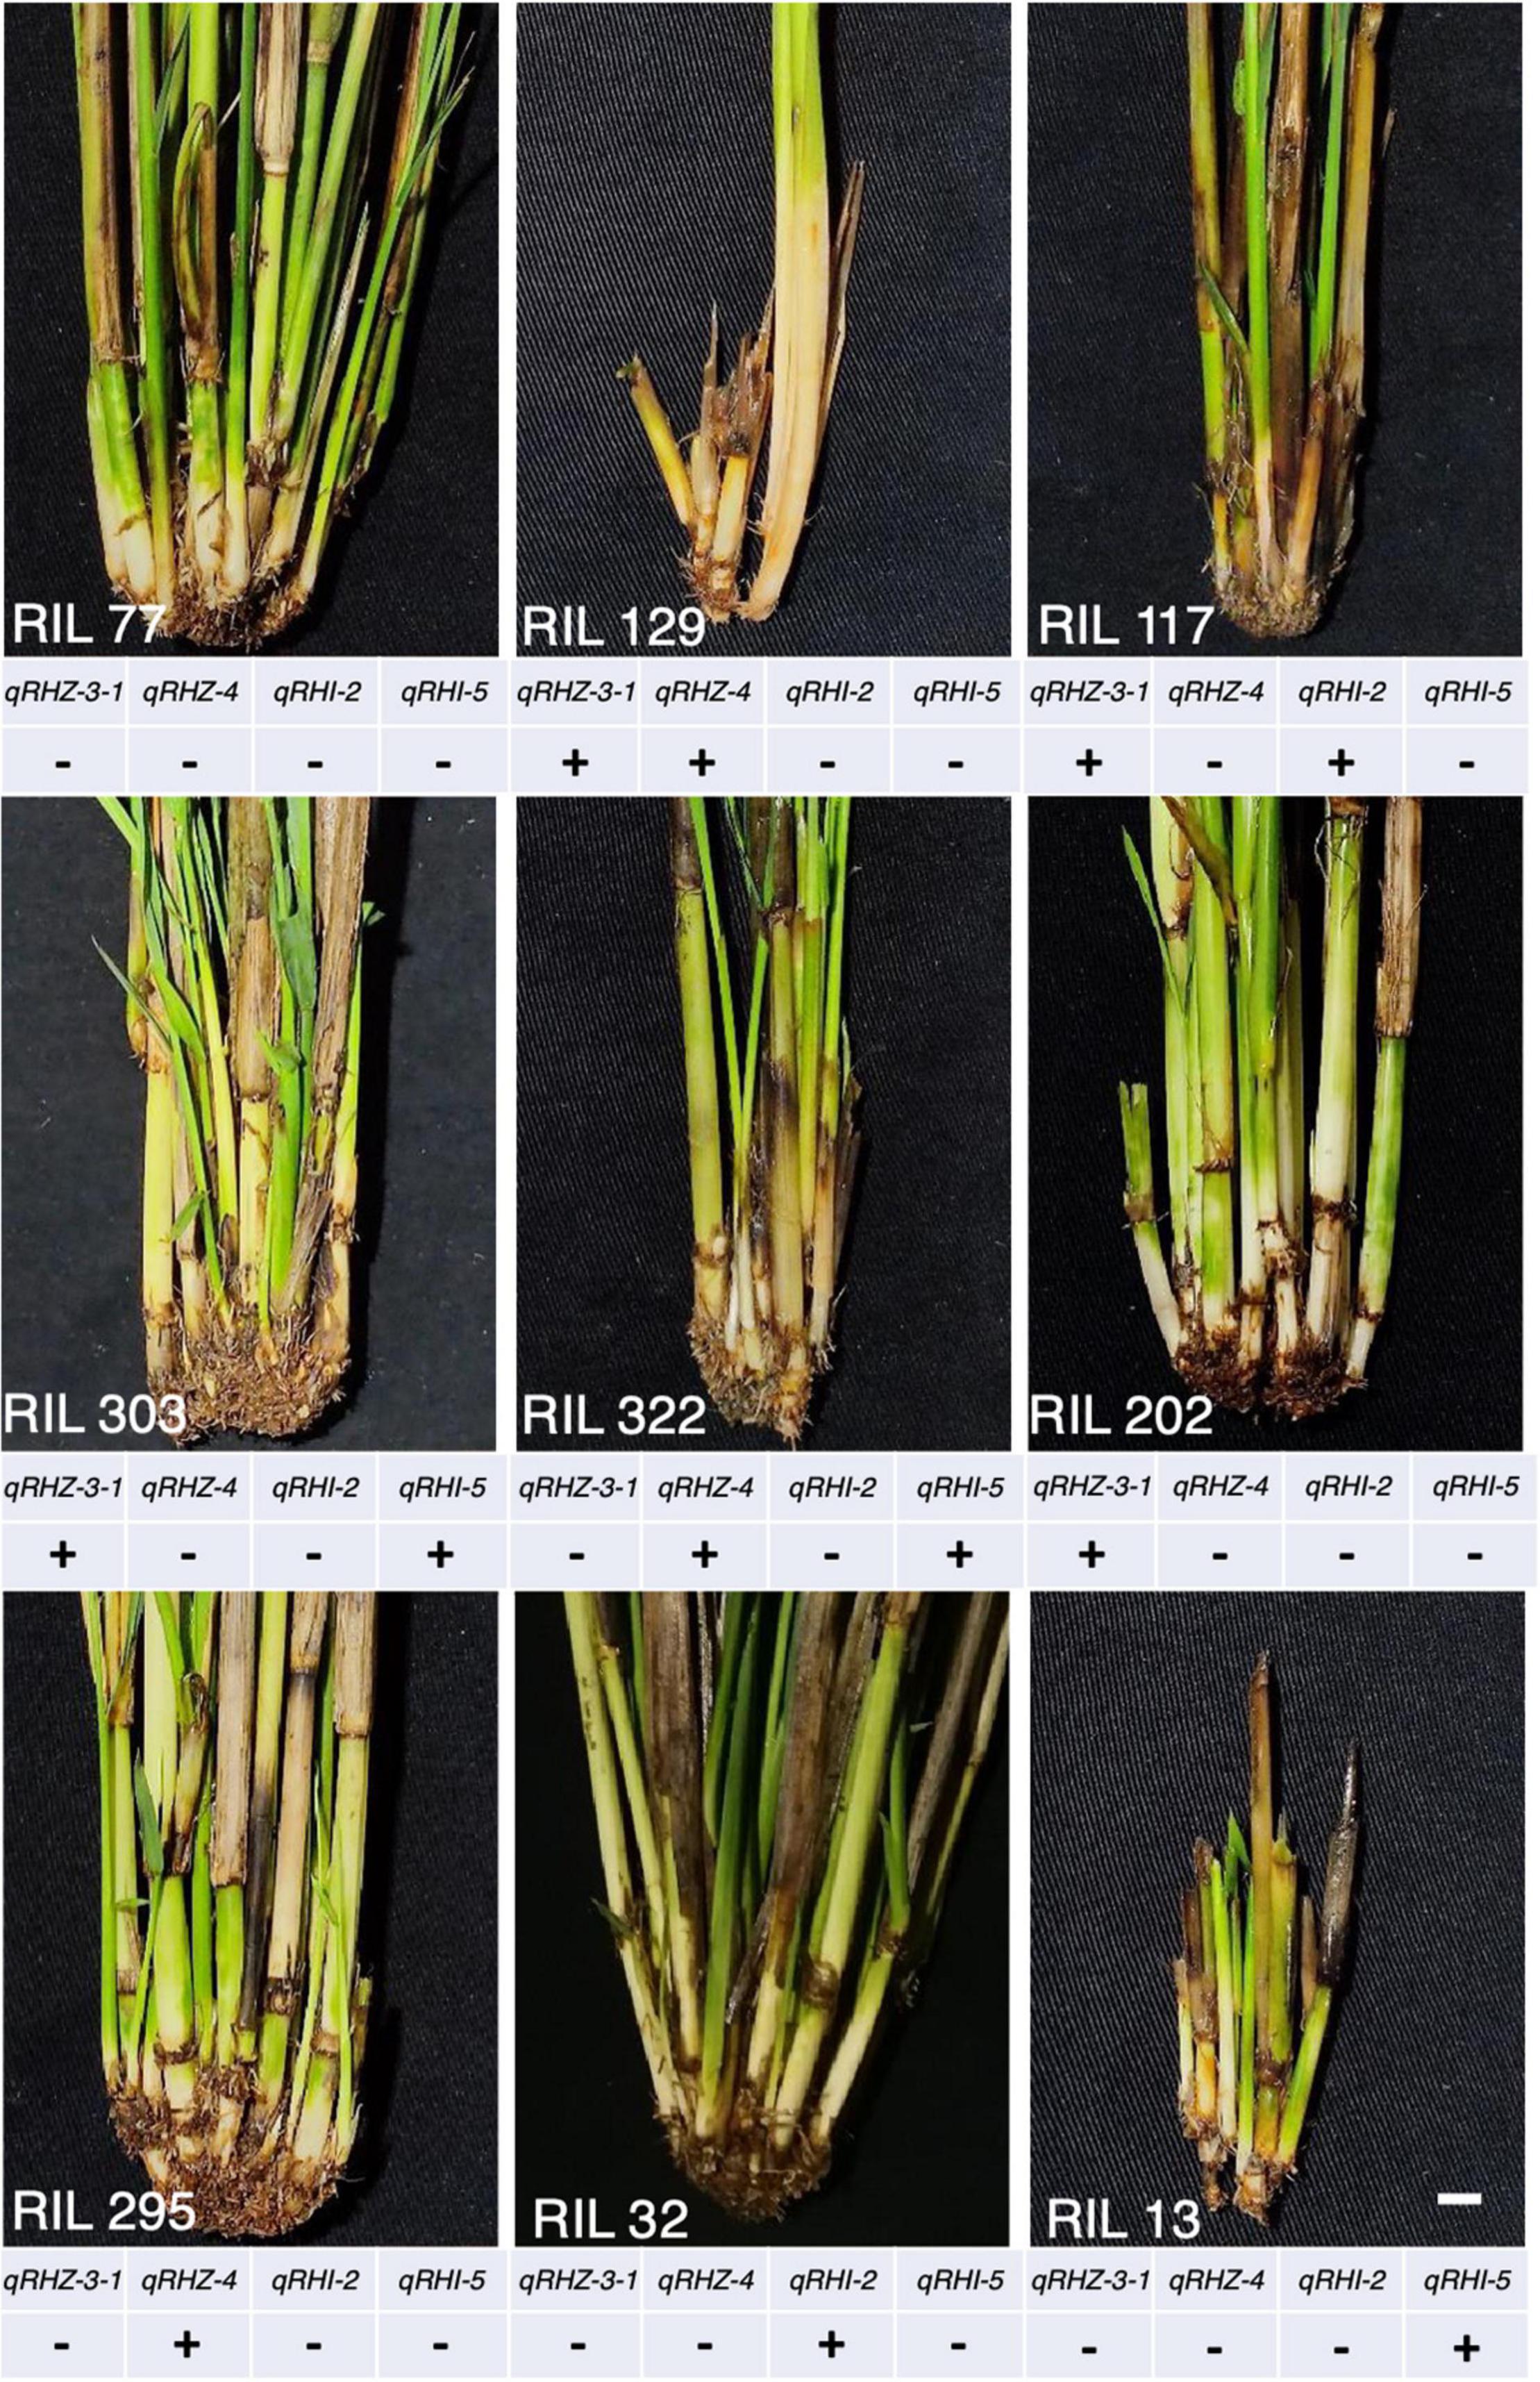
Figure 7. Phenotypes of representative rhizome-free RILs. “+” and “–” represent O. longistaminata and RD23 homozygous alleles at the locus, respectively.
Discussion
In the present study, we substantially expanded the genetic repertoire for rhizome development. A recent manuscript (Fan et al., 2020) identified over 10 loci related to rhizome growth, including five major-effect loci—qRED1.2, qRED3.1, qRED3.3, qRED4.1, and qRED4.2, some of which are partially overlapped with two previously mapped loci determining the presence of rhizome, Rhz2 and Rhz3 (Hu et al., 2003). Here, we identified 13 Rhz-regulating loci and as many as 51 QTLs controlling rhizome abundance. Not surprisingly, some of them are overlapped with those previously reported QTLs. Comparing with Fan et al. (2020), eight of our identified loci (qRN-1-2, qRLSUM-2, qRHZ-3-1, qRHZ-3-1, qRHI-3, qRB2-4-2, qRHI-11, and qRHZ-11) are overlapped with their QTL intervals. Among these, two Rhz-regulating loci, qRHZ-3-1 and qRHZ-11, are located in the intervals of qRED3.1 and qRED-11, respectively, highlighting the potential prerequisite role of these loci, and qRHI-3 and qRHI-11, two intervals controlling multiple rhizome traits, were found to coincide with qRED3.3 and qRED11 (Fan et al., 2020). Meanwhile, many rhizome abundance QTLs we identified are closely linked with their major-effect loci, such as qRB2-2 and qRED2.2, qRN-3 and qRED3.1, and qRLSUM-4-2 and qRED4.1 (Fan et al., 2020). In general, these two studies are mutually confirmative; however, it is important to note that, instead of using the average rhizome extension distance (measured in soil surface, Fan et al., 2020), we treated the presence of rhizomes as a qualitative trait and carefully evaluated specific rhizome-related traits by digging the plants up. This may explain why our results do not completely include the previously identified QTLs, and such comprehensive phenotypic evaluation also evidently gave rise a larger number of identified QTLs in our study. Furthermore, the results presented here are also largely consistent with our previous study (Hu et al., 2003). A total of six pairs of loci are overlapped, and many of these loci pairs were identified to control the same or similar trait, such as qRN-1-2 and QRl1, and qRBD3-2 and QRbd2. The disparity between our current and previous results may stem from the distinct populations. Moreover, compared with previously used simple-sequence repeat (Hu et al., 2003) and insertion/deletion markers (Fan et al., 2020), the SNP markers used in this study have relatively wider coverage and higher density in the whole genome; thus, more QTLs have emerged.
Multiple genetic networks were established on the basis of classical QTL mapping (Zhang et al., 2011; Figures 5, 6). We observed a clear hierarchical structure in some networks for individual traits (Figure 5). This indicates that some loci, such as qRHZ-4 in the Rhz network (Figure 5A) and qRLsum-2 in the RLsum network (Figure 5C), may play a more significant regulatory role than the other loci in the same network since upstream loci are likely prerequisite for downstream loci to execute their functions. Given that the other traits measured in this study all depend on the presence of rhizomes, the two top-located nodes in the RHZ network are presumably of primary importance for proper rhizome development. Furthermore, in the comprehensive network containing all the identified loci, qRHI-2 and qRHI-5 were the hub loci connecting network-RHZ with network-RB and network-RN/L. In network analyses, hub nodes are generally considered to be critical (Zhang et al., 2011). In our case, considering that no other networks would exist if network-RHZ collapses, qRHI-2 and qRHI-5 are therefore considered as secondarily important loci for rhizome development. It is attempting to speculate that these four loci might be the minimal set of loci required for rhizome development, and this is worth of further investigation. Of note, the concept of FGU in this study is defined as a pair of mutual functional dependent genes, whose encoding proteins may not necessarily physically interact with each other, and FGUs in our networks were generated by comparing the genes’ contributions to the phenotype. Compared with RIL and doubled haploid populations, F2 populations usually have a larger number of distinct genotypes, and the efficacy of detecting genetic networks using F2 populations is weakened due to the possible errors occurred in multiple comparisons (Zhang et al., 2011). Such weaking effect would be amplified if there are a large number of loci controlling the trait (Zhang et al., 2011). Therefore, even though our preliminary functional verification suggested that the two hub loci, qRHI-2 and qRHI-5, are likely both needed for the rhizome phenotype, we could not exclude the possibility that other loci are also required here. Further verification using rhizomatous accessions and functional characterization of these loci would be needed to unravel the complex genetic basis of rhizome development.
Conclusion
In this study, we detected 62 loci that are putative regulators for rhizome development. By grouping these loci into FGUs, we provided evidence that rhizome growth is controlled by a multi-locus, multi-layered genetic network. Based upon the network structure and the interactions among the nodes, we predicted four loci, two major-effect loci for rhizome initiation and two hub loci connecting the individual genetic networks, as key loci. Functional verification using rhizome-free RILs confirmed that none of these key loci could solely initiate rhizome morphogenesis and suggested that qRHI-2 and qRHI-5 are likely both needed for rhizome initiation.
Data Availability Statement
The original contributions presented in the study are included in the article/Supplementary Material, further inquiries can be directed to the corresponding authors.
Author Contributions
FH and SZ designed the experiments. WL, SZ, LH, GH, and JZ performed the experiments. FH, ZL, and WL wrote the manuscript. WL, SZ, and ZL analyzed the data. All authors have read and approved the final manuscript.
Funding
This work was funded by the National Natural Science Foundation of China (U1302264 and 31660387).
Conflict of Interest
The authors declare that the research was conducted in the absence of any commercial or financial relationships that could be construed as a potential conflict of interest.
Publisher’s Note
All claims expressed in this article are solely those of the authors and do not necessarily represent those of their affiliated organizations, or those of the publisher, the editors and the reviewers. Any product that may be evaluated in this article, or claim that may be made by its manufacturer, is not guaranteed or endorsed by the publisher.
Acknowledgments
We thank members in our laboratory for their help with phenotypical evaluation.
Supplementary Material
The Supplementary Material for this article can be found online at: https://www.frontiersin.org/articles/10.3389/fpls.2022.866165/full#supplementary-material
References
Clark, L. V., Brummer, J. E., Głowacka, K., Hall, M. C., Heo, K., Peng, J., et al. (2014). A footprint of past climate change on the diversity and population structure of Miscanthus sinensis. Ann. Bot. 114, 97–107. doi: 10.1093/aob/mcu084
Cox, T. S., Glover, J. D., Van Tassel, D. L., Cox, C. M., and DeHaan, L. R. (2006). Prospects for developing perennial grain crops. BioScience 56, 649–659. doi: 10.1641/0006-3568(2006)56[649:pfdpgc]2.0.co;2
Doyle, J. J. (1987). A rapid DNA isolation procedure for small quantities of fresh leaf tissue. Phytochem. Bull. 19, 11–15.
Fan, Z., Wang, K., Rao, J., Cai, Z., Tao, L., Fan, Y., et al. (2020). Interactions among multiple quantitative trait loci underlie rhizome development of perennial rice. Front. Plant Sci. 11:591157. doi: 10.3389/fpls.2020.591157
Ghesquiere, A. (2008). Evolution of oryza longistaminata. Rice Genet. 1, 15–25. doi: 10.1142/9789812814265_0002
Gizmawy, I., Kigel, J., Koller, D., and Ofir, M. (1985). Initiation, orientation and early development of primary rhizomes in Sorghum halepense (L.) pers. Ann. Bot. 55, 343–350. doi: 10.1093/oxfordjournals.aob.a086911
Glover, J. D., Reganold, J. P., Bell, L. W., Borevitz, J., Brummer, E. C., Buckler, E. S., et al. (2010). Increased food and ecosystem security via perennial grains. Science 328, 1638–1639. doi: 10.1126/science.1188761
Hu, F. Y., Tao, D. Y., Sacks, E., Fu, B. Y., Xu, P., Li, J., et al. (2003). Convergent evolution of perenniality in rice and sorghum. Proc. Natl. Acad. Sci. U.S.A. 100, 4050–4054. doi: 10.1073/pnas.0630531100
Hu, F., Wang, D., Zhao, X., Zhang, T., Sun, H., Zhu, L., et al. (2011). Identification of rhizome-specific genes by genome-wide differential expression analysis in oryza longistaminata. BMC Plant Biol. 11:18. doi: 10.1186/1471-2229-11-18
Huang, G., Qin, S., Zhang, S., Cai, X., Wu, S., Dao, J., et al. (2018). Performance, economics and potential impact of perennial rice PR23 relative to annual rice cultivars at multiple locations in yunnan province of China. Sustainability 10:1086. doi: 10.3390/su10041086
Jang, C. S., Kamps, T. L., Skinner, D. N., Schulze, S. R., Vencill, W. K., and Paterson, A. H. (2006). Functional classification, genomic organization, putatively cis-acting regulatory elements, and relationship to quantitative trait loci, of sorghum genes with rhizome-enriched expression. Plant Physiol. 142, 1148–1159. doi: 10.1104/pp.106.082891
Kawahara, Y., de la Bastide, M., Hamilton, J. P., Kanamori, H., McCombie, W. R., Ouyang, S., et al. (2013). Improvement of the oryza sativa nipponbare reference genome using next generation sequence and optical map data. Rice 6:4. doi: 10.1186/1939-8433-6-4
Li, Z., Lathe, R. S., Li, J., He, H., and Bhalerao, R. P. (2022). Towards understanding the biological foundations of perenniality. Trends Plant Sci. 27, 56–68. doi: 10.1016/j.tplants.2021.08.007
Mackay, T. F. C., Stone, E. A., and Ayroles, J. F. (2009). The genetics of quantitative traits: challenges and prospects. Nat. Rev. Genet. 10, 565–577. doi: 10.1038/nrg2612
McCouch, S., Cho, Y., Yano, M., Paul, E., Blinstrub, M., Morishima, H., et al. (1997). Report on QTL nomenclature. Rice Genet. Newsl 14, 11–13.
Meakawa, M., Inukai, T., Rikiishi, K., and Govindaraj, K. G. (1998). Inheritance of the rhizomatous traits in hybrid of Oryza longistaminata Chev. et Roehr. and O. sativa L. SABRAO J. Breed. Genet. 30, 67–72.
Lei, M, Li, H., Zhang, L., and Wang, J. (2015). QTL IciMapping: integrated software for genetic linkage map construction and quantitative trait locus mapping in bi-parental populations. Crop J. 3, 269–283. doi: 10.1016/j.cj.2015.01.001
Morishima, O. H. (1967). Variation in the breeding system of a wild rice, oryza perennis. Evolution 21, 249–258. doi: 10.2307/2406673
Paterson, A. H., Schertz, K. F., Lin, Y. R., Liu, S. C., and Chang, Y. L. (1995). The weediness of wild plants: molecular analysis of genes influencing dispersal and persistence of johnsongrass, Sorghum halepense (L.). Proc. Natl. Acad. Sci. U.S.A. 92, 6127–6131. doi: 10.1073/pnas.92.13.6127
Sacks, E., Roxas, J. P., and Cruz, M. S. T. (2003). Developing perennial upland rice II: field performance of S families from an intermated Oryza sativa/Oryza longistaminata population. Crop Sci. 43, 129–134. doi: 10.2135/cropsci2003.1290
Tao, D., and Sripichitt, P. (2000). Preliminary report on transfer traits of vegetative propagation from wild rice species to oryza sativa via distant hybridization and embryo rescue. Kasetsart J. 34, 1–11.
Van Ooijen, J. (2006). JoinMap 4, Software for the Calculation of Genetic Linkage Maps in Experimental Populations. Wageningen: Kyazma BV.
Wang, W., Fu, B., Ali, J., Xu, J., Gao, Y., Zheng, T., et al. (2015). Genome-wide responses to selection and genetic networks underlying submergence tolerance in rice. Plant Genome 8:66. doi: 10.3835/plantgenome2014.10.0066
Zhang, F., Jiang, Y. Z., Yu, S. B., Ali, J., Paterson, A. H., Khush, G. S., et al. (2013). Three genetic systems controlling growth, development and productivity of rice (Oryza sativa L.): a reevaluation of the ‘green revolution’. Theor. Appl. Genet. 126, 1011–1024. doi: 10.1007/s00122-012-2033-1
Zhang, F., Zhai, H.-Q., Paterson, A. H., Xu, J.-L., Gao, Y.-M., Zheng, T.-Q., et al. (2011). Dissecting genetic networks underlying complex phenotypes: the theoretical framework. PLoS One 6:e14541. doi: 10.1371/journal.pone.0014541
Zhang, S., Hu, J., Yang, C., Liu, H., Yang, F., Zhou, J., et al. (2017). Genotype by environment interactions for grain yield of perennial rice derivatives (Oryza sativa L./ Oryza longistaminata) in southern China and laos. Field Crops Res. 207, 62–70. doi: 10.1016/j.fcr.2017.03.007
Zhang, S., Huang, G., Zhang, J., Huang, L., Cheng, M., Wang, Z., et al. (2019). Genotype by environment interactions for performance of perennial rice genotypes (Oryza sativa L./Oryza longistaminata) relative to annual rice genotypes over regrowth cycles and locations in southern China. Field Crops Res. 241:107556. doi: 10.1016/j.fcr.2019.107556
Keywords: Oryza longistaminata, rhizomes, development, genetic networks, quantitative trait loci
Citation: Li W, Zhang S, Huang G, Huang L, Zhang J, Li Z and Hu F (2022) A Genetic Network Underlying Rhizome Development in Oryza longistaminata. Front. Plant Sci. 13:866165. doi: 10.3389/fpls.2022.866165
Received: 30 January 2022; Accepted: 09 March 2022;
Published: 05 April 2022.
Edited by:
Kenneth Lee McNally, International Rice Research Institute (IRRI), PhilippinesReviewed by:
Binying Fu, Institute of Crop Sciences (CAAS), ChinaJiangyi Yang, Guangxi University, China
Copyright © 2022 Li, Zhang, Huang, Huang, Zhang, Li and Hu. This is an open-access article distributed under the terms of the Creative Commons Attribution License (CC BY). The use, distribution or reproduction in other forums is permitted, provided the original author(s) and the copyright owner(s) are credited and that the original publication in this journal is cited, in accordance with accepted academic practice. No use, distribution or reproduction is permitted which does not comply with these terms.
*Correspondence: Zheng Li, emhlbmdsaUB5bnUuZWR1LmNu; Fengyi Hu, aGZlbmd5aUB5bnUuZWR1LmNu
†These authors have contributed equally to this work
 Wenfei Li†
 Shilai Zhang
 Guangfu Huang
 Liyu Huang
 Jing Zhang
 Zheng Li
 Fengyi Hu