
95% of researchers rate our articles as excellent or good
Learn more about the work of our research integrity team to safeguard the quality of each article we publish.
Find out more
ORIGINAL RESEARCH article
Front. Plant Sci. , 08 April 2022
Sec. Crop and Product Physiology
Volume 13 - 2022 | https://doi.org/10.3389/fpls.2022.864258
This article is part of the Research Topic Advances in Nitrogen Use Efficiency for Agriculture and Environment View all 36 articles
 Ben Zhao1*†
 Syed Tahir Ata-Ul-Karim2
 Aiwang Duan1
 Yang Gao1He Lou3Zugui Liu1Anzhen Qin1Dongfeng Ning1Shoutian Ma1Zhandong Liu1*
Accurate and timely appraisal of plant nitrogen (N) demand is imperative to regulate the canopy structure and corn production. The strength and time of plant N deficit can be quantified by critical N concentration. The study was aimed to analyze nitrogen nutrition index (NNI), nitrogen deficit content (NDC), plant nitrogen productivity (PNP), and a fraction of intercepted photosynthetic active radiation (FIPAR) across different N treatments and to develop NNI-NDC, NNI-PNP, NNI-FIPAR, NDC-PNP, and NDC-FIPAR relationships from V6 to V12 stages of corn to quantify the suitable PNP and FIPAR values under the optimal plant N condition. Four multi-N rates (0, 75, 90, 150, 180, 225, 270, and 300 kg N ha−1) field experiments were conducted with two cultivars of corn in Henan province of China. Results indicated that N fertilization affected yield, plant biomass, plant N content, and leaf area index. The values of NNI and NDC were from 0.54 to 1.28 kg ha−1 and from −28.13 to 21.99 kg ha−1 under the different treatments of N rate, respectively. The NDC and NNI showed significantly negative relationships from V6 to V12 stages. The values of PNP and FIPAR increased gradually with the crop growth process. The PNP values gradually declined while the FIPAR values of every leaf layer increased with the increase of N supply. The NDC-PNP and NNI-FIPAR relationships were significantly positive; however, the relationships between NNI-PNP and NDC-FIPAR were significantly negative during the vegetative period of corn. The coefficient of determination (R2) based on NNI was better than that on NDC. The FIPAR values were ~0.35, 0.67, and 0.76% at the upper, middle, and bottom of leaf layers, respectively, and PNP values were ~39, 44, and 51 kg kg−1 at V6, V9, and V12 stages, respectively, when NNI and NDC values were equal to 1 and 0 kg ha−1, respectively. This study described the quantitative information about the effect of a plant's internal N deficit on plant N productivity and canopy light intercept. The projected results would assist in predicting the appropriate plant growth status during key N top-dressing stages of corn, which can optimize N application and improve N use efficiency.
Corn is an important cereal crop, and its grain can be used for human consumption and as a feedstock (Hammad et al., 2018). Corn production in China increased tremendously during the past few decades due to the development of high-yielding cultivars and the over application of nitrogen (N) fertilizer (Cui et al., 2008). N is the most important nutrition element known to limit crop yield and quality after water deficit (Zheng et al., 2017). The Chinese farmers often applied the maximum N fertilizer amount to assure plant growth and to get a high grain yield. Over N application (average 205 kg N ha−1 season−1) has caused poor N use efficiency in the major corn planting regions of China, which has been reported to be critically dropped to 26% as compared to other developed countries and regions where it is 40–50% (Omara et al., 2019; Qi and Pan, 2022). Conversely, excessive N application is leading to multiple side effects perturbing aquatic and terrestrial ecosystems (Geary et al., 2020). Crop and environmental scientists are trying to overcome the economic and ecological problems associated with the excessive N fertilizer by developing the N management strategies, which can cut the N application rate to minimize pollution risks without affecting the grain yield (Zhao et al., 2020). Islam et al. (2012) showed that the intensity and time of N application have a synergistic function to increase harvested yield and N use efficiency. Corn development and grain yield varied with location and season response to N fertilizer (Dhital and Raun, 2016). This variation brings some difficulties to determine the crop N status during the corn growth under different environments. At present, it lacks a good way to understand crop N status and its production capacity during corn growth in China.
Non-destructive diagnostic techniques (sensors, chlorophyll meter, and digital camera) were used to crop N management. However, these techniques were different in range, spatial scale, and time resources (Ata-Ul-Karim et al., 2016a,b), and their accuracy is affected by abiotic stresses, canopy characteristics, soil background, sensor viewing geometry, and solar illumination (Ata-Ul-Karim et al., 2017a,b). The critical N concentration (Nc) was widely used as a classical technique to diagnose the N status of various crop species (Justes et al., 1994), which has a simple, biologically sound, and specific characteristic. The critical curve constructed by Plénet and Lemaire (2000) is considered as a reference corn curve (%Nc = 3.4DM−0.37 when DM ≥ 1 t ha−1; %Nc = 3.4% when DM <1 t ha−1) and has been successfully tested for its applicability in corn-growing regions of China (Liang et al., 2013). Several studies have been reported by using the Nc curve-based N nutrition index (NNI) for the diagnosis of plant N status (Lemaire and Gastal, 1997; Liang et al., 2013; Zhao et al., 2017). Additionally, the NNI has also been used to estimate harvested yield, quality, leaf area index, and photosynthetic active radiation (PAR) (Bélanger et al., 1992; Hu et al., 2014). However, NNI cannot quantify the real value of crop N deficit. Therefore, an alternative diagnosis index based on crop Nc concentration has been derived to quantitatively represent the real value of plant N deficit in crops (Yao et al., 2014a,b), which is named as N deficit content (NDC) (Ata-Ul-Karim et al., 2013). So far, NDC has not yet been used to describe plant N deficit and growth indices of corn quantitatively.
The optimal N management requires the knowledge of plant N deficit during crop vegetative growth, which can induce the reasonable plant N productivity (PNP) in this period (Hu et al., 2014). The PNP was introduced to interpret the dependency of plant growth on internal N, which is described as the increase of plant biomass per unit of plant N content (Lemaire et al., 2008). The change of PNP was affected by the external N environment and plant internal N deficit (Lemaire and Gastal, 1997). Greenwood et al. (1991) showed that the PNP can keep constant value during the vegetative period of crop growth under non-limiting N conditions. On the other hand, the production efficiency of plant biomass is also related to the fraction of intercepted photosynthetic active radiation (FIPAR) within the canopy during crop growth (Zhang et al., 2008). The plant N deficit can affect the structure of the canopy and the distribution of FIPAR within the canopy. The FIPAR values showed distribution differences from top to bottom of canopy height, which can induce the optimized vertical N distribution in the canopy for maximized photosynthesis (Hirose and Werger, 1987). At present, most studies focused on the effect of external N input on the canopy distribution of FIPAR at the crop vegetative stage (Campbell et al., 2001; Ruiz and Bertero, 2008). Hernández et al. (2015) showed that the FIRAR of corn canopy increased in response to external N (0–120 kg ha−1) supply both under irrigated and rain-fed conditions. However, the external N input has some limitations to evaluate canopy light interception and PNP, due to the unstable relationship between external N input and plant canopy structure. Its parameters were affected by years, sites, or N treatments (Prieto et al., 2012).
Plant internal N deficit has been evaluated by crop Nc curve (Zhao et al., 2017). The development of the crop Nc curve based on crop N dilution theory has a close relationship with the physiological process occurring in the plant during its growth period (Lemaire et al., 2008). We hypothesized that plant internal N deficit could better respond to the change of crop canopy structure and production capacity under different N conditions. Louarn et al. (2015) combined light attenuation and NNI to develop the empirical model of alfalfa canopy N distribution. At present, the simulation of canopy N distribution on corn has received comparatively less attention. Little information has been found about the connection between plant N productivity, canopy structure, and plant internal N deficit during the vegetative period of corn by using the Nc curve. Therefore, the main objectives of this study were to describe the changes in NNI, NDC, PNP, and FIPAR across different N treatments and to analyze the effect of crop internal N deficit on PNP and FIPAR of corn vegetative growth. It is useful to explore the reasonable and efficient development of canopy structures to improve plant production efficiency on corn.
Four field experiments (0–300 kg N ha−1) were conducted at Qinyang (35°18′N, and 113°52′) located in China during the 2015 and 2016 seasons (Table 1). The weather condition of the experiment seasons was shown in Figure 1. Before planting, the soil samples (0–20 cm layer) were gathered. The soil type was light loam soil. The total N, Olsen-P, NH4OAc-K+, and organic matter were measured in the soil samples (Olsen et al., 1954; Bremner and Mulvancy, 1982; Nelson and Sommers, 1982; van Reeuwijk, 1992). The detailed soil physiochemical characteristics (total N, Olsen-P, NH4OAc-K+, and organic matter) were shown in Table 1. A randomized complete block design was arranged in all experiments with three replications. The ratio of basal fertilizer (before sowing) and top-dressing (V6 stage) of N fertilizer was 50:50%. V6 indicated that the sixth leaf of more than 50% of plants was fully expanded in the field. The triple superphosphate (150 kg P2O5 ha−1) and potassium chloride (120 kg K2O ha−1) was applied in all the experimental plots as basal fertilizer. The 60 m2 size was (10 m length and 6 m width) in each plot from all the experiments. The sowing dates were June 7, June 9, June 10, and June 11 for experiments 1–4, respectively. The cultivars (Dingyou919 and Jundan20) were developed for high-input production systems and were suitable for planting in the experimental region. The planting density of corn was as a stand of 75,000 plants ha−1 during the 2015 and 2016 seasons. In total, 60 mm was irrigated after the planting of corn, which can ensure the emergence of corn. Due to the abundant rainfall, irrigation was not needed in the field during corn growth. The weeds, pests, and diseases were controlled using a chemical method.
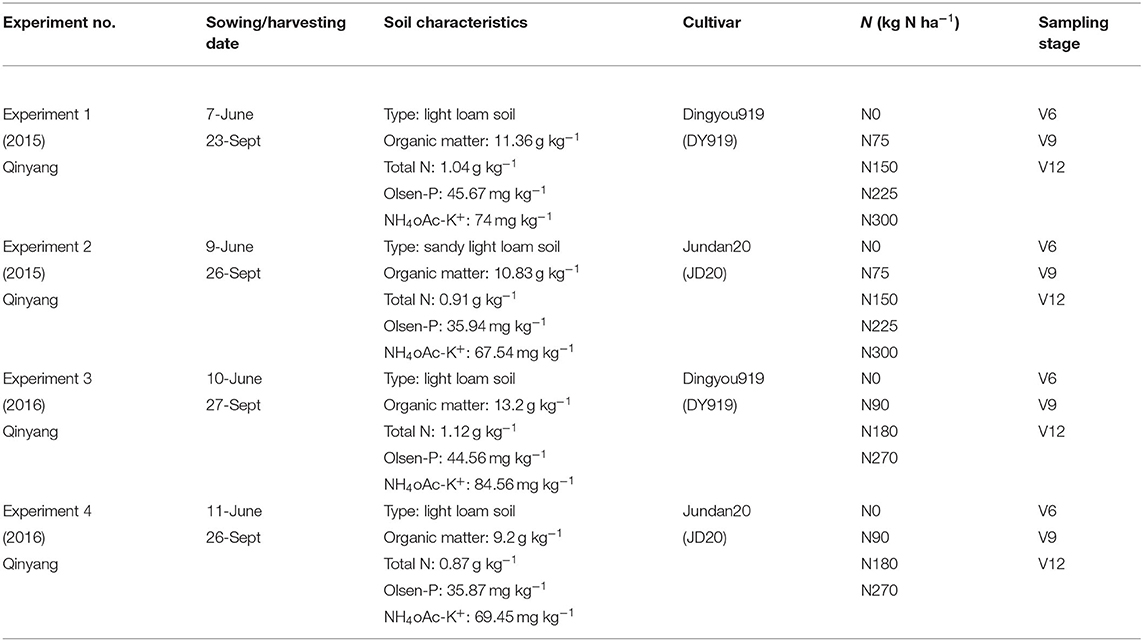
Table 1. Basic information about the four field experiments conducted during the 2015 and 2016 growing seasons at Qinyang.
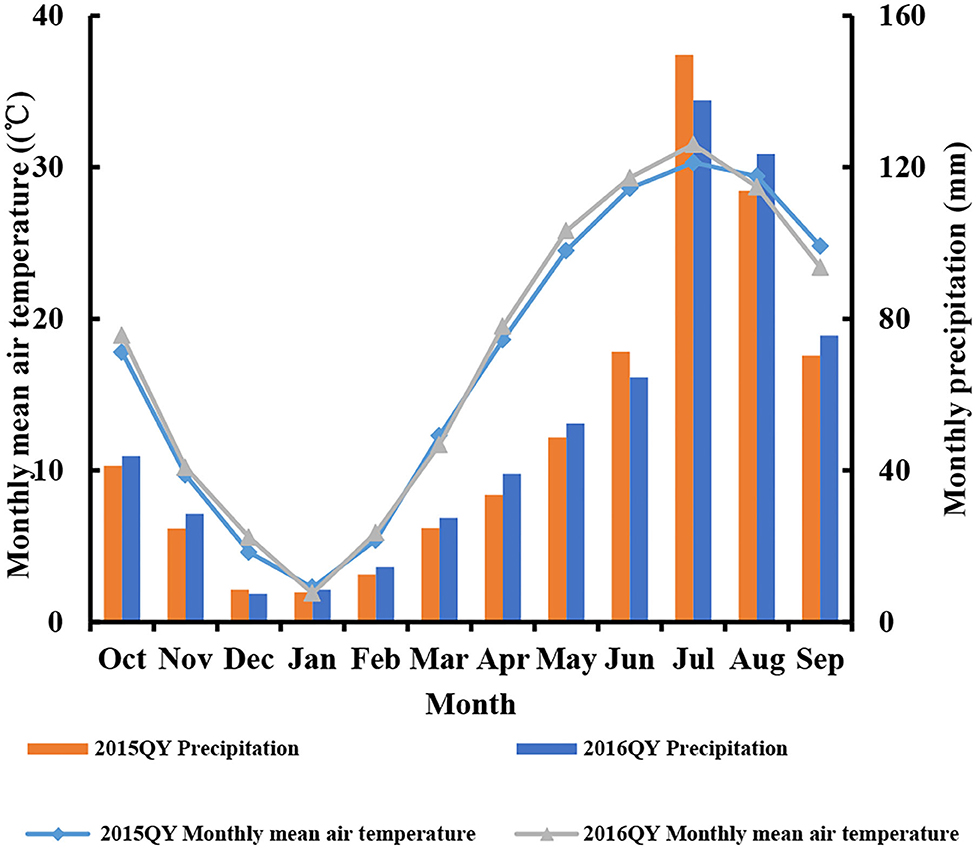
Figure 1. Monthly mean air temperature (°C) and precipitation (mm) during the 2015 and 2016 seasons at Qinyang (QY).
To obtain a representative plant sample, six plants were randomly and destructively sampled from each plot during the key N top-dressing stages (V6, V9, and V12). V9 and V12 indicated that the ninth and twelfth leaves of more than 50% of plants were fully expanded in the field, respectively. Li-3000 meter was used to measure the green leaf area index (LI-COR, Nebraska, USA). Table 1 showed the sampling stages in each experiment. These samples were collected to determine plant N concentration (PNC) and plant biomass. Plant biomass was obtained by drying plant samples at 80°C to constant weight, followed by analytical balance weighing. These samples were grounded and passed through a sieve (1 mm) for further chemical analysis. The micro-Kjeldahl method was used to determine PNC. The plant N content was determined as the production of plant biomass weight (kg ha−1) and PNC on a biomass basis (%). Corn grain yield at maturity was collected from a 12 m2 area of each plot by harvesting the whole plant. In total, 14% moisture of grain yield was adjusted.
The N deficit content of corn was calculated by subtracting plant Nc content based on the corn Nc curve from actual plant N content under the different N treatments at each sampling date. The crop Nc concentration is defined as the minimum N concentration required to obtain maximum crop growth, as proposed for corn (Nc = 3.4DM−0.37 when DM ≥ 1 t ha−1; Nc = 3.4% when DM <1 t ha−1) by Plénet and Lemaire (2000).
Ncn is a plant critical N content (kg ha−1), Nac is the actual plant N content (kg ha−1), and 10 is the conversion factor.
The NNI was determined based on plant Nc concentration under the different N treatments at each sampling date (Zhao et al., 2017).
Nc is the plant Nc concentration (%) and Na is the actual PNC (%).
Plant nitrogen productivity (PNP) was defined as the increase in plant biomass per unit of plant N content in this study.
The photosynthetic active radiation of the corn canopy was measured by SUNSCAN Canopy Analysis System (Delta, England). The measurement of PAR was implemented at different stages (V6, V9, and V12) of corn. The measurement was operated at 2 h of intervals from 8:00 a.m. to 4:00 p.m. each day selected. At every measurement period, six points were chosen in every plot. The canopy was averagely divided into 3 leaf layers (upper, middle, and bottom) and measured 4 times from top to bottom at every point. The FIPARi of every layer was determined as (O'Connell et al., 2004):
PARi was the PAR of the ith layer within the canopy (i = 1–3), PARc was the PAR above 0.2 m of the canopy top. The ith layer within the canopy (i = 1–3) was the upper, middle, and bottom of the canopy.
The analysis of variance method was used to analyze the data according to a 2 × 2 × 5 factorial design (Year × Cultivar × N) with three replications (Zhao et al., 2021a,b). The 95% level of significance (least significant difference) was used to assess the difference between treatments (Zhao et al., 2016). The fixed factors were season, cultivar, and N treatments. The SPSS version 13 software package was used to perform all statistical analyses (SPSS Inc., Chicago, USA). Microsoft Excel was used to conduct the regression analysis between NNI, NDC, PNP, and FIPAR (Microsoft Cooperation, Redmond, USA).
There were non-significant variations of grain yield between different cultivars and seasons. The plant biomass, plant N content, and leaf area index showed non-significant variations between the different cultivars; however, these differences were significant between the different seasons. The grain yield, plant biomass, plant N content, and leaf area index gradually increased from N0 to N4 treatments. These indices had a significant difference from N0 to N225 treatments in the 2015 season, but there was no significant difference between the high N treatments in the 2015 season (N225 and N300). The grain yield of N4 treatment was 47.1% higher than the yield of N0 treatment (Table 2).
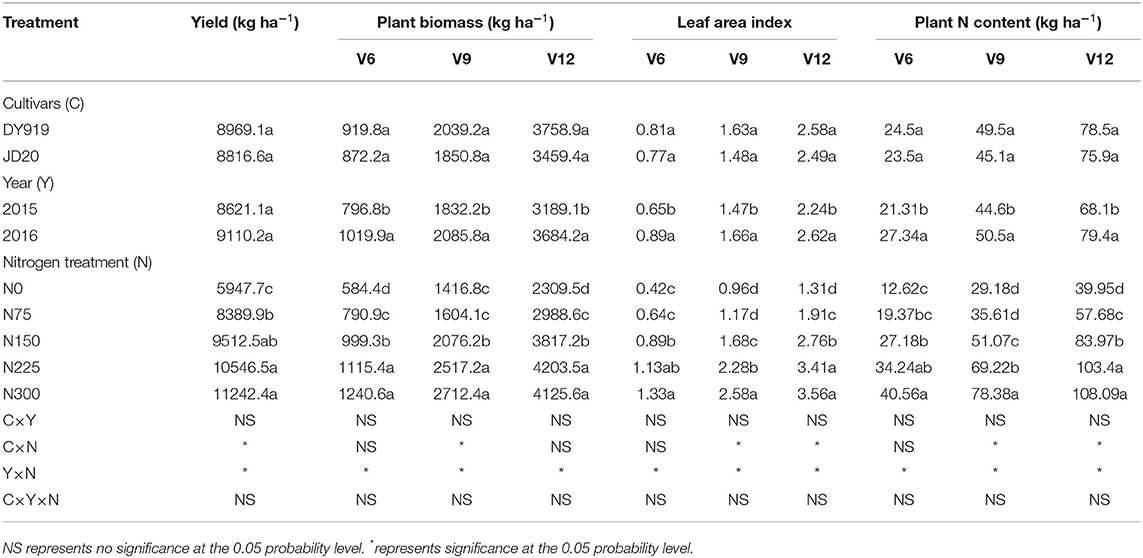
Table 2. Grain yield, plant biomass, leaf area index, and plant N content of two corn cultivars at the three growth stages under five N levels during the 2015 and 2016 seasons.
There was a non-significant effect of cultivar × year interaction on yield, plant biomass, plant N content, and leaf area index, while year × N interaction revealed the significant effect on yield, plant biomass, plant N content, and leaf area index (P < 0.05). The performance of cultivar × N treatment was not uniform at the different growth stages and indices. The year × cultivar × N interaction had not a significant effect on yield, leaf area index, plant biomass, and plant N content (Table 2).
There were substantial differences in NNI under the different N treatments (Figure 2). The NNI gradually increased with the increased N amounts from V6 to V12 stages of corn. The NNI was ranged from 0.55 to 1.23 and 0.54 to 1.28 for DY919 (Figures 2A,C) and JD20 (Figures 2B,D), respectively, across different N treatments during the 2015 and 2016 growing seasons. There were lower than 1 of NNI values for N0–N150 treatments and for N0–N90 treatments, respectively (plant N status was insufficient), during the 2015 and 2016 seasons. NNI values were near to 1 for N225 and N180 treatments during the 2015 and 2016 growing seasons, which indicated an optimal corn growth (Figure 2). In contrast, there were higher than 1 of NNI values for N300 and N270 treatments during the 2015 and 2016 seasons, respectively (plant N status was sufficient).
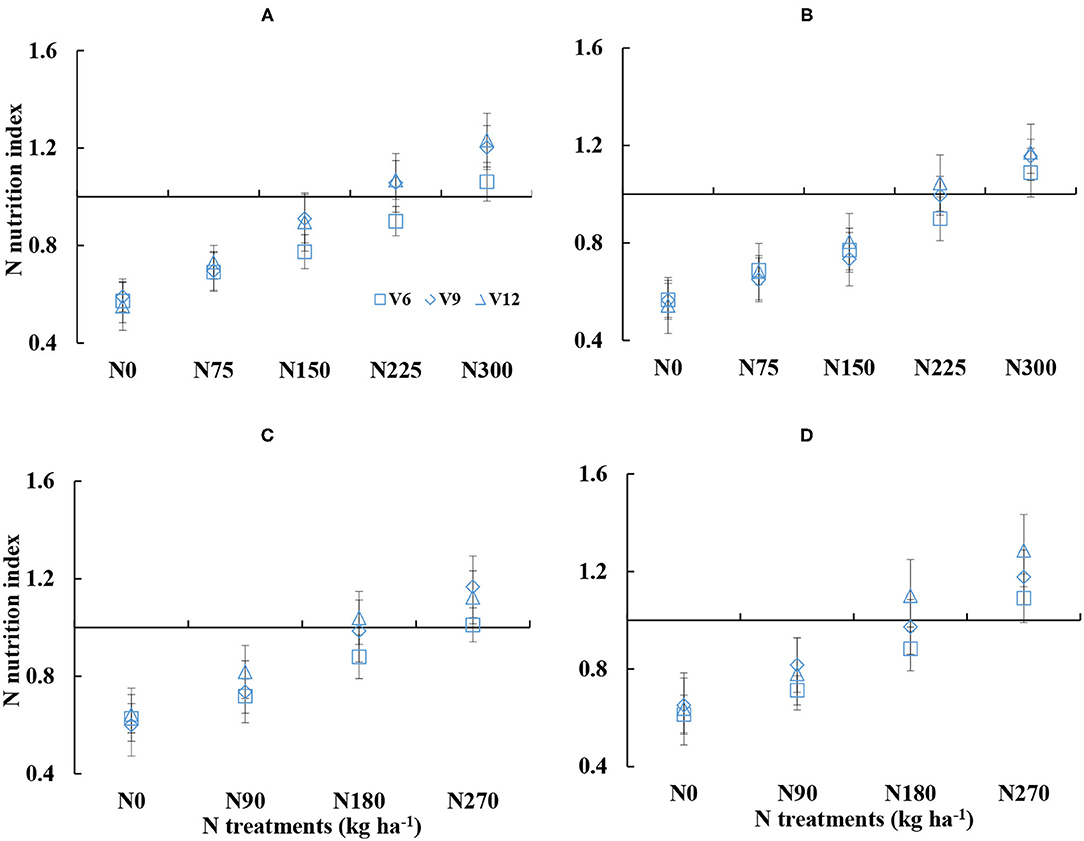
Figure 2. Dynamic changes in the nitrogen nutrition index (NNI) under various nitrogen (N) application rates from V6 to V12 growth stages of corn (A: 2015 DY919; B: 2015 JD20; C: 2016 DY919; D: 2016 JD20. V6, V9, and V12 represent the sixth, ninth, and twelfth leaves, respectively).
Nitrogen deficit content also showed obvious differences under different N treatments (Figure 3). NDC decreased with increased N supply during corn growth. The NDC values were ranged from −25.48 to 21.99 kg ha−1 and from −28.13 to 20.81 kg ha−1 for DY919 (Figures 3A,C) and JD20, respectively (Figures 3B,D). NDC values were near to 0 during the 2015 and 2016 growing seasons for N225 and N180 treatments, which indicated an optimal growth of corn (Figure 3). The NDC values were higher than 0 for N0–N150 treatments and for N0–N90 treatments, respectively (plant N status was insufficient). However, during the 2015 and 2016 seasons, NDC values were lower than 0 for N300 and N270 treatments (plant N status was sufficient; refer to Figure 3).
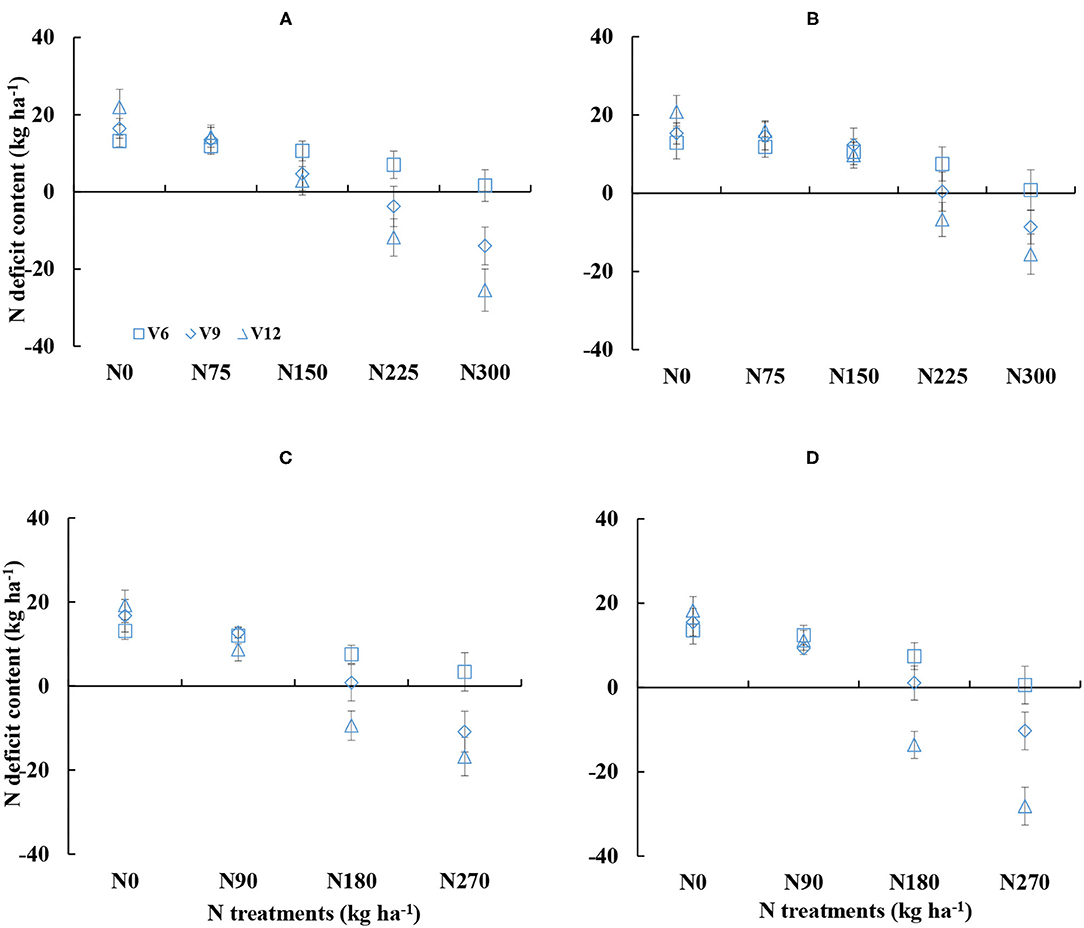
Figure 3. Dynamic changes in the nitrogen deficit content (NDC) under various nitrogen (N) application rates from V6 to V12 growth stages of corn (A: 2015 DY919; B: 2015 JD20; C: 2016 DY919; D: 2016 JD20. V6, V9, and V12 represent the sixth, ninth, and twelfth leaves, respectively).
The yield had a negative linear-plateau function with the average value of NDC from V6 to V12 stages. The yield decreased with the increasing NDC value until NDC was lower or equal to 0 kg ha−1 (Figure 4A). However, the average NNI value had a positive linear relationship with yield (Figure 4B), and the R2 value (0.83) of the relationship between NNI and yield was higher than the R2 value (0.73) of the relationship between NDC and yield.
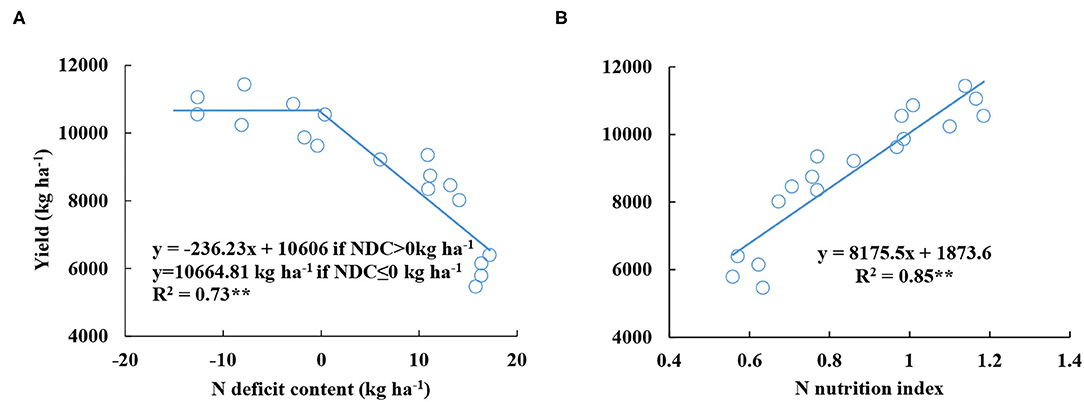
Figure 4. Relationships between grain yield and nitrogen deficit content (A) and nitrogen nutrition index (B) from V6 to V12 stages during the 2015–2016 growing seasons (experiments 1–4).
There were significantly negative relationships between NNI and NDC from V6 to V12 stages (Figure 5). When NDC was lower or equal to 10 kg ha−1, NNI values gradually decreased from V6 to V12 stages at the same NDC value, and when NDC was higher than 10 kg ha−1, NNI values gradually increased from V6 to V12 stages at the same NDC value.
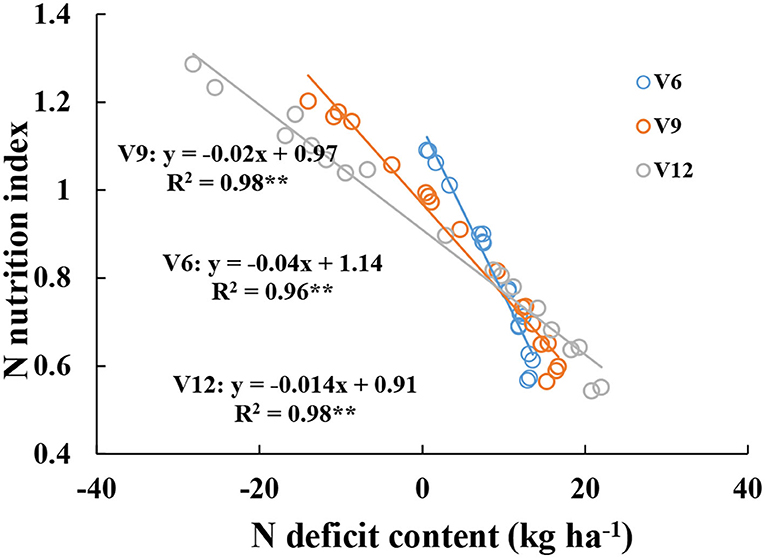
Figure 5. Relationships between nitrogen nutrition index and nitrogen deficit content from V6 to V12 stages of corn during the 2015–2016 growing seasons (experiments 1–4).
Plant N productivity increased with corn growth. The PNP had an obvious difference between different N treatments, and the PNP gradually decreased with the increased N supply. The maximum value of PNP was 60.46 kg kg−1 at N0 treatment of V12 stage in 2015 for DY919. The minimum value of PNP was 30.25 kg kg−1 at N300 treatment of V6 stage in 2015 for JD20. The PNP value had a non-significant difference across different years and cultivars. The year × cultivar interaction revealed a non-significant effect on PNP, while cultivar × N and year × N interactions exerted a significant effect on PNP from V6 to V12 stages (P < 0.05). There was a non-significant effect of the year × cultivar × N interactions on PNP (Table 3).
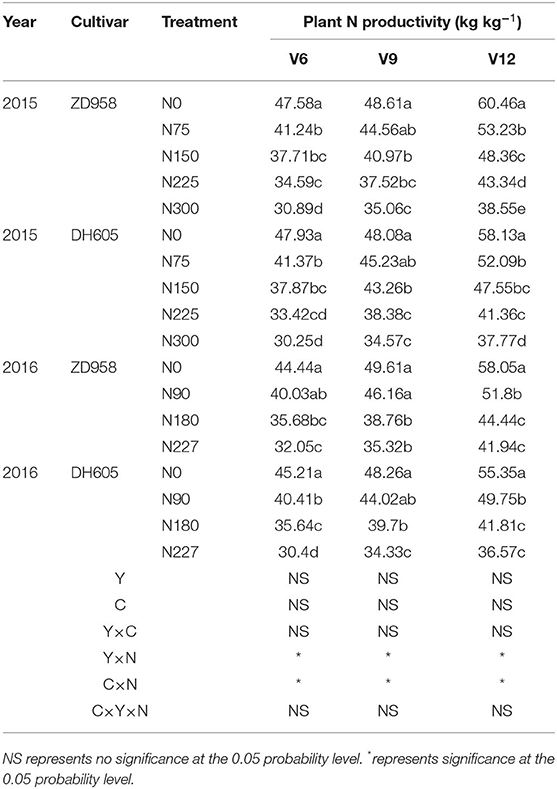
Table 3. Plant N productivity of two corn cultivars at the three growth stages under five N levels during the 2015 and 2016 seasons.
Additionally, the relationships between PNP-NNI and PNP-NDC were developed across different growth stages (V6, V9, and V12). Figure 6 showed the significant positive relationship between PNP and NNI, while a significantly negative relationship was observed between PNP and NDC. From V6 to V12 stages, PNP values increased gradually at the same NDC and NNI values. When NDC was equal to 0 kg ha−1, PNP values were 39.58, 44.31, and 51.72 kg kg−1 at V6, V9, and V12, respectively. In contrast, when NNI was equal to 1, PNP values were 38.42, 43.42, and 50.79 kg kg−1 at V6, V9, and V12, respectively.
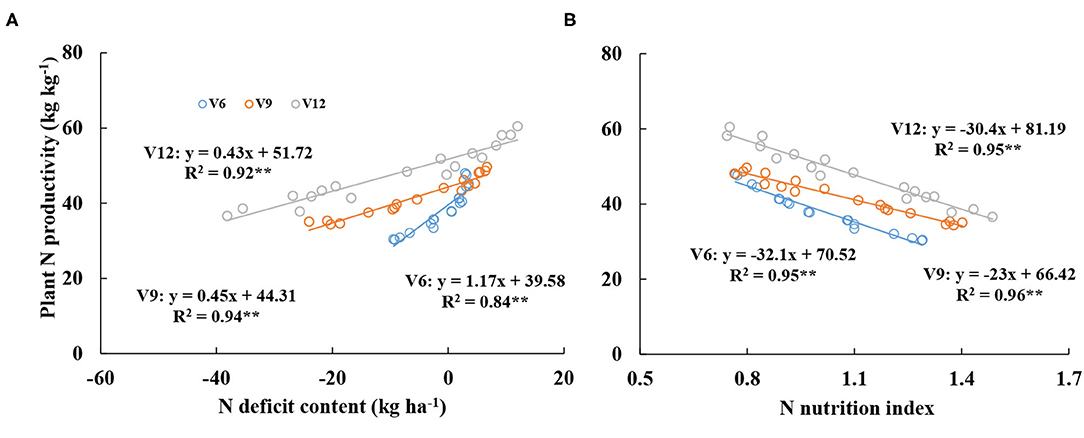
Figure 6. Relationships between plant nitrogen productivity and nitrogen deficit content (A) and nitrogen nutrition index (B) from V6 to V12 stages of corn during the 2015–2016 growing seasons (experiments 1–4).
The change of fraction of intercepted PAR was similar across different cultivars and years (Figure 7). The FIPAR within the canopy gradually increased with the growth process of corn (V6 to V12), and the FIPAR values were lower at the lower N treatments. The FIPAR values of the upper leaf layer ranged from 0.2 to 0.4 across different N treatments, while the FIPAR values of the middle and bottom leaf layers were ranged from 0.6 to 0.8. The PAR was mainly intercepted by the upper and middle leaf layers. The FIPAR values of the middle leaf layer were similar to the FIPAR values of the bottom leaf layer, and the FIPAR values of the upper leaf layer were significantly lower than FIPAR values of the middle and bottom leaf layers. The increased proportion of the average FIPAR values of the middle and bottom leaf layers was 18 and 10% at N0 and N225 treatments, respectively. The bottom FIPAR values of the higher N treatments were lower than the bottom FIPAR values of the lower N treatments.
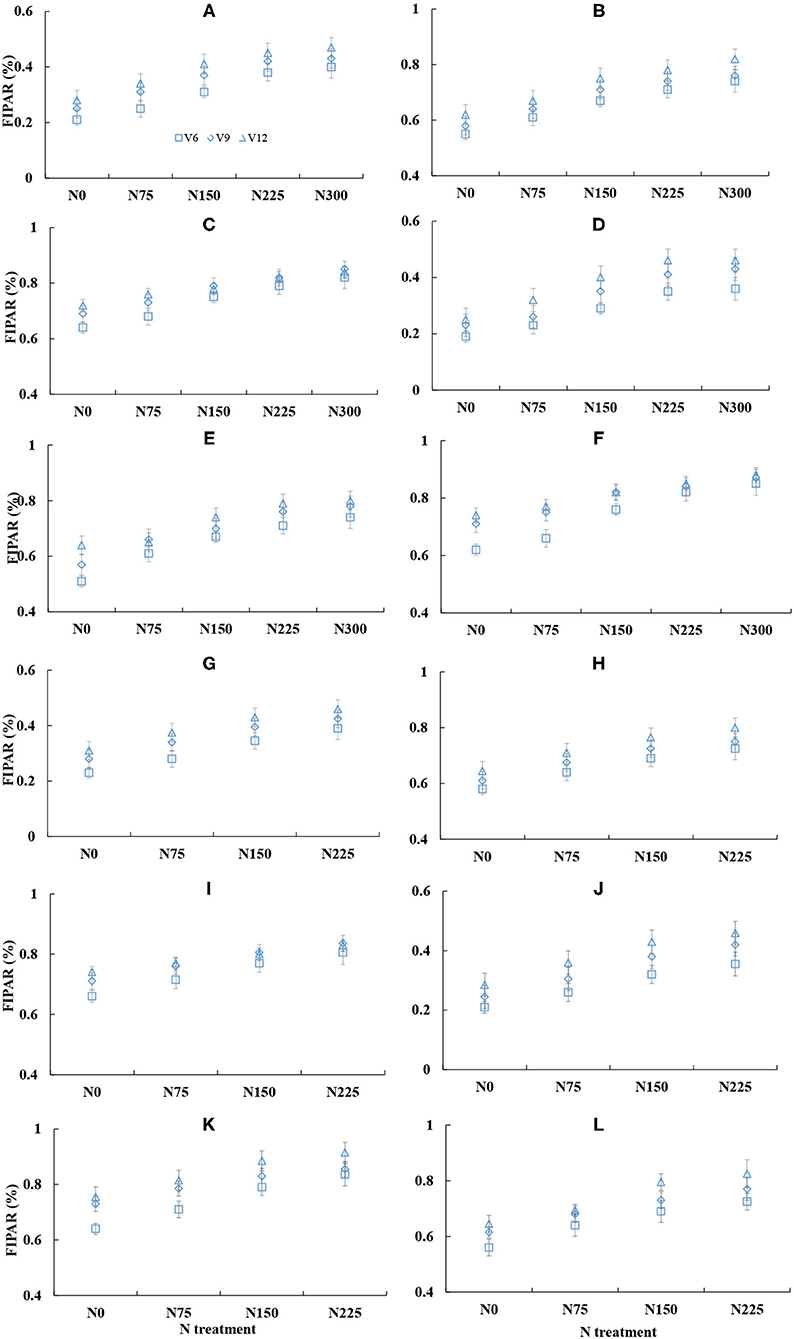
Figure 7. Changes in the fraction of intercepted photosynthetic active radiation (FIPAR) under the different leaf layers across various nitrogen (N) treatment from V6 to V12 stages of corn during the 2015–2016 growing seasons (A: 2015 DY919 L1; B: 2015 DY919 L2; C: 2015 DY919 L3; D: 2015 JD20 L1; E: 2015 JD20 L2; F: 2015 JD20 L3; G: 2016 DY919 L1; H: 2016 DY919 L2; I: 2016 DY919 L3; J: 2016 JD20 L1; K: 2016 JD20 L2; L: 2016 JD20 L3. V6, V9, and V12 represent the sixth, ninth, and twelfth leaves, respectively).
There was a significantly negative and positive relationship between FIPAR, NDC, and NNI from different leaf layers. The quadratic polynomial could well represent the relationships between FIPAR and NDC from the upper to bottom leaf layers (Figure 8). The maximum R2 value (0.74) was observed at the upper leaf layer. The linear curve could well represent the relationships between FIPAR and NNI on the canopy scale (Figure 8). The maximum R2 value (0.84) was observed at the middle level. At the same leaf layer, the R2 value deduced from NNI was higher than that deduced from NDC. When NNI was equal to 1 and NDC was equal to 0 kg ha−1, FIPAR values were 0.32, 0.67, and 0.76 kg kg−1 and 0.39, 0.67 and 0.76 kg kg−1 at the upper, middle, and bottom leaf layers, respectively.
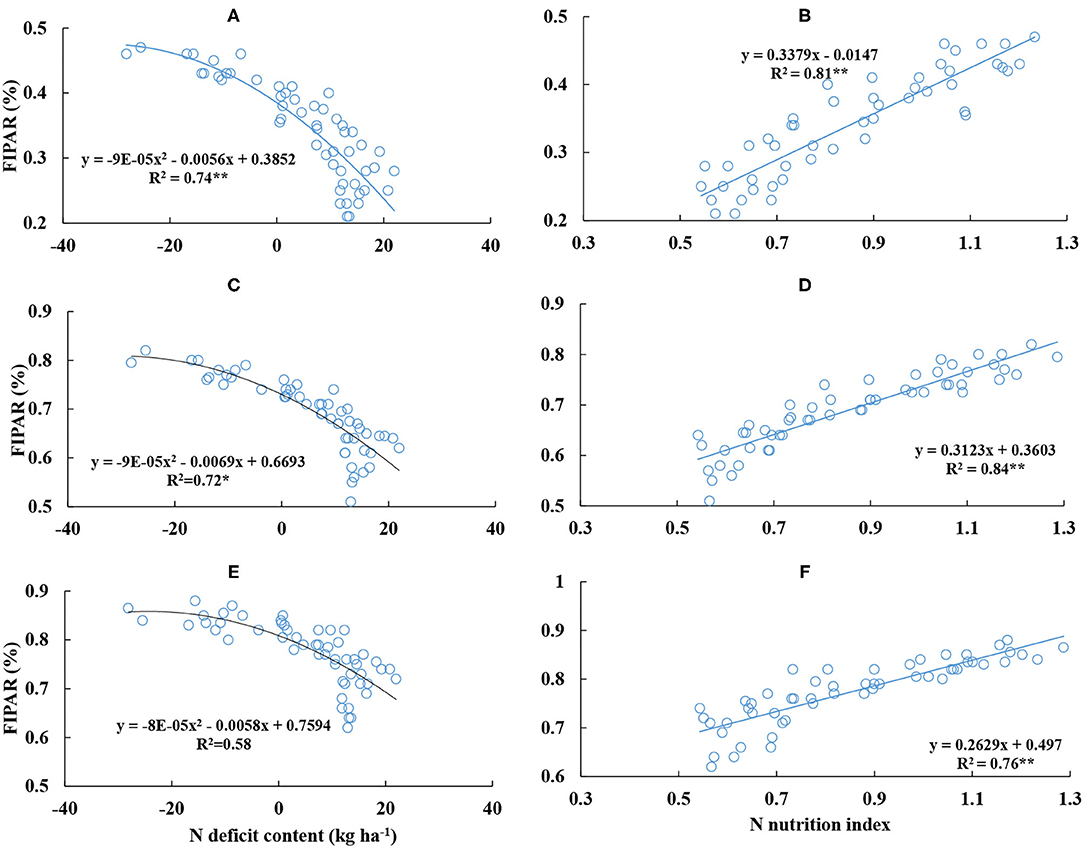
Figure 8. Relationships between the fraction of intercepted photosynthetic active radiation (FIPAR) of different leaf layers and nitrogen deficit content and nitrogen nutrition index from V6 to V12 stages of corn during the 2015–2016 growing seasons (A,B: L1; C,D: L2; E,F: L3).
The N fertilizer had a significantly positive effect on plant biomass, plant N content, leaf area index, and yield of corn. The results of grain yield, plant biomass, plant N content, and leaf area index under different N environments were the same as previous studies on corn (Yue et al., 2012; Zhao et al., 2017). Plant N content was regulated by plant growth rate and soil N availability under the N-limiting environment (Justes et al., 1994). Under a non-limiting N environment, when crop growth rate reaches the maximum value, the plant growth rate remains relatively stable, plant N content would be regulated by soil N availability, which was independent of plant growth rate. The relationships between plant growth rate and plant N content under the N-limiting and non-limiting N environments on corn were developed (Lemaire et al., 2008). The allometric growth relationship between plant N content and plant biomass was shown across different N environments; however, the relationship between plant N content and leaf area index showed linear growth at the same N environment. This difference of the two relationships was based on the decrease of leaf area ratio with the corn growth process. The result of this study further validates the relationship between plant N content and plant growth potential of corn.
Corn N status was diagnosed accurately by NNI and NDC. NNI and NDC values were ranged from 0.54 to 1.28 and from −28.13 to 21.99 kg ha−1, respectively. The two indices were significantly affected by the plant growth period, season, cultivar, and N treatment. Similar effects of NDC and NNI of corn have been reported in the other studies (Yue et al., 2012). The change of NNI and NDC were deduced from plant internal N deficit across different N treatments. The plant internal N deficit was calculated from the difference value between plant actual N content and plant Nc content, which indicates the trade-off result between plant DM accumulation and external N supply during the vegetative period of corn. The plant Nc content was based on N dilution theory. The theory has two main aspects: (i) stem (low N concentration pool) had a greater proportion of biomass and (ii) a decline of leaf N concentration within the canopy for the optimization of plant N allocation (Lemaire et al., 2008). This phenomenon had a close connection with light competition and distribution within the canopy (Lemaire and Gastal, 2009). The interactions of plant growth are related to the perception of the neighboring plants by changing in light spectrum including sensing red: far-red ratio of light by phytochrome and blue light by cryptochrome (Ballaré et al., 1997), which permits plants to forecast the light competition by modifying plant structure (leaf size, tillering, and plant height) and strategies for shade avoidance (Bahmani et al., 2000). This behavior can promote the increased stem proportion, which causes an intensification of plant N dilution process with the crop growth. When light enters into the canopy, the upper leaf layers can intercept most of PAR in the light (Figure 7). The plant will distribute and transport more N into upper leaves that occupy better illuminative conditions for maximum photosynthesis (Hirose and Werger, 1987), the growing leaves at the upper of the canopy usually have the higher N concentration per leaf area (SLN) and photosynthesis rate. The old leaves will remobilize N to new leaves, and their SLN decline as the old leaves are progressively shaded by newer leaves (Lemaire and Gastal, 2009), so the vertical N distribution is not uniform with the plant growth process (Zhao et al., 2018). The difference of the vertical N gradient exists in different crops, which depend on the variable light extinction profile between crops. The vertical N distribution of wheat canopy is steeper than the distribution of corn (Lemaire et al., 2008). Therefore, the plant N dilution is more obvious in wheat than in corn. Due to the clear physiological theory of plant N dilution, the NNI and NDC can well diagnose plant N status quantitatively across different N environments.
Plant N productivity explains the capacity of plant biomass accumulation per plant N content during the crop growth period. PNP value was affected by the crop growth stage, which increased with the growth of corn (Table 3). Our results of PNP were not in line with the result of Greenwood et al. (1991); the PNP remains constant under the N non-limiting condition during the vegetative period of the crop. Under the N non-limiting condition, plant N content of corn increase linearly with the expansion of leaf area, and the rate of plant biomass accumulation per leaf area increases exponentially with the crop growth process (Lemaire et al., 2007). Therefore, the change of PNP is affected by the expansion of leaf area during the corn vegetative stage. When the rate of plant biomass accumulation per leaf area is higher than the rate of plant N uptake per leaf area, the PNP value can gradually increase during corn vegetative growth. On the contrary, plant biomass and leaf area expansion affect the intercepted PAR within the canopy. Leaf area and biomass of corn increase during corn vegetative growth, and the FIPAR performs a corresponding increase. The upper and middle leaf layers can intercept more PAR than the bottom leaf layer within the canopy (Figure 7). The FIPAR values were also affected by plant morphological characteristics (leaf angle and leaf curl degree) and N supply (Bélanger et al., 1992; Bonelli et al., 2016). The reduction of the intercepted PAR is very obvious under the N-limiting condition when the leaf area index is below 3; however, when the leaf area index is above 3, N deficiency would only have a small effect on the intercepted PAR (Bélanger et al., 1992). In this study, the leaf area index was below 3 during V6–V12 stages of corn, and the intercepted PAR was affected by N supply (Figure 8). These results were in agreement with previous studies (Chen et al., 2016).
Previous studies have evaluated the relationships between chlorophyll meter readings, grain yield, grain quality (amylose and protein content), N requirement, crop N partition, photosynthesis, and NNI and NDC (Ata-Ul-Karim et al., 2016a,b; 2017a,b; Hu et al., 2014), which showed a highly satisfactory performance between these relationships. Under the N non-limiting condition, NNI was higher than 1 or NDC was lower than 0 kg ha−1 (Figures 1, 2), and plant N nutrition was excessive. The PAR was mainly intercepted by the upper and middle leaf layers, which weaken the light condition of the bottom leaf layer. The photosynthesis ability is lower at the bottom leaf layer, and the respiration of the bottom leaf layer can consume more energy from carbohydrates and proteins in the plant, which is against the plant biomass accumulation (Hikosaka, 2014; Chen et al., 2016). The excessive N was stored in the plant body, which cannot be used to produce more biomass. The excess leaf N accumulation in corn could not increase leaf photosynthetic rate because the excess N in the leaf is channeled into phosphoenolpyruvate carboxylase rather than Rubisco (Uribelarrea et al., 2009). So the PNP value becomes lower with the increase of NNI or the decrease of NDC (Table 3, Figures 6, 8). Under the N limiting condition, NNI was lower than 1 or NDC was higher than 0 kg ha−1 (Figures 2, 3), plant N nutrition was insufficient. Leaf area expansion and biomass accumulation are limited under this condition, the capacity of light interception decline at the upper and middle leaf layers, more light can transfer into the bottom of the canopy, therefore, the ability of leaf photosynthesis correspondingly increase at the bottom leaf layer (Hikosaka, 2014; Chen et al., 2016). Plant distribute more N to the bottom leaf layer for metabolism, the absorbed N in the plant body can be more efficiently used to produce biomass, which improves the value of PNP within the total canopy (Table 3). Therefore, NNI had a significantly positive relationship with PNP, and a negative relationship was found between NDC and PNP (Figures 6, 8). Moreover, the R2 values of the NNI-PNP and NNI-FIPAR relations of different leaf layers were higher than the R2 values of NDC-PNP and NDC-FIPAR of different leaf layers. The better assessment of plant growth indices (PNP and FIPAR) to N deficiency using NNI than that of NDC assessment was attributed to the calculation method of NNI, which can reduce the effect of the external environment and cultivar characteristic to the regression equations. The NDC value was the actual value of plant N deficit, and it can clearly show the amount of plant internal N deficit under N non-limiting and N limiting treatments. Significantly negative regressions of NDC with NNI from V6 to V12 stages of corn were similar to that of rice and wheat (Ata-Ul-Karim et al., 2013). NNI and NDC have advantages over the other N diagnosis indices as being based on actual crop growth (Ravier et al., 2017). The diagnostic tools based on the Nc curve of corn could be used directly for the assessment of plant N status to quantify the response of plant growth to N deficiency. The development of the relationships between NNI-PNP, NNI-FIPAR, NDC-PNP, and NDC-FIPAR was helpful for understanding the change of corn production efficiency and the intercepted PAR across different N treatments at the key top-dressing stage of corn, which can assist in guiding the more reasonable N input to produce the suitable canopy structure and improve N production efficiency for obtaining high corn yield. Further studies are required to test the application of NNI and NDC as an efficient tool for assessing of plant growth under the different N environments.
The amount of N fertilizer input significantly affected the grain yield, plant biomass, plant N content, and leaf area index. The FIPAR and PNP values were regulated by N fertilizer during the corn vegetative growth. NNI and NDC were calculated based on the Nc curve of corn, which can diagnose plant N status and quantify the level of plant N deficit. NNI had a significantly negative relationship with NDC from V6 to V12 stages of corn. The FIPAR and PNP gradually increased with the growth process of corn (V6–V12), and the FIPAR was lower at the N limiting treatments than at the N non-limiting treatments. However, the PNP was higher at the N limiting treatments than at the N non-limiting treatments. NDC and NNI showed strong relationships with PNP and FIPAR. When NDC was equal to 0 kg ha−1 or NNI was equal to 1, the PNP was ~39, 44, and 51 kg kg−1 across different growth stages, and the FIPAR was ~0.35, 0.67, and 0.76 of the upper, middle, and bottom leaf layers, respectively. This study was conducted to understand the variations in the FIPAR of different leaf layers and PNP under N non-limiting and N limiting conditions at the N key top-dressing stages in corn, which is helpful to develop the feasible canopy structure to improve N fertilizer use efficiency across different N treatment. The newly developed empirical relationships could be affected by the external environment. Therefore, further studies under diverse environmental conditions will be required to check the stability of the newly developed models for their applicability on large scale.
The original contributions presented in the study are included in the article/supplementary material, further inquiries can be directed to the corresponding authors.
BZ and ZL conceived the idea and led the study design. BZ and SA-U-K carried out the experiments, performed the analysis, wrote the manuscript, and edited the manuscript. AD, YG, HL, ZL, AQ, DN, and SM assisted with study design and experiments. All authors contributed to the article and approved the submitted version.
This study was supported by the National Natural Science Foundation of China (51609247), Henan Provincial Natural Science Foundation of China (222300420589, 202300410553), the National Public-interested Scientific Institution Based Research Fund of China (FIRI2022-21), the Science and Technology Project of Henan Province (212102110278), Grant-in-Aid for Scientific Research from Japan Society for the Promotion of Science (18KT0087), the China Agriculture Research System (CARS-02), the Agricultural Science and Technology Innovation Program (ASTIP), the National Natural Science Foundation of Henan Province (202300410553), and the Major science and technology projects of Xinxiang City (ZD2020009).
HL is employed by Henan Weisheng Electric Limited Company.
The remaining authors declare that the research was conducted in the absence of any commercial or financial relationships that could be construed as a potential conflict of interest.
All claims expressed in this article are solely those of the authors and do not necessarily represent those of their affiliated organizations, or those of the publisher, the editors and the reviewers. Any product that may be evaluated in this article, or claim that may be made by its manufacturer, is not guaranteed or endorsed by the publisher.
Ata-Ul-Karim, S. T., Cao, Q., Zhu, Y., Tang, L., Rehmani, M. I. A., and Cao, W. (2016a). Nondestructive assessment of plant nitrogen parameters using leaf chlorophyll measurements in rice. Front. Plant Sci. 7, 1829. doi: 10.3389/fpls.2016.01829
Ata-Ul-Karim, S. T., Liu, X., Lu, Z., Yuan, Z., Zhu, Y., and Cao, W. (2016b). In-season estimation of rice grain yield using critical nitrogen dilution curve. Field Crops Res. 195, 1–8. doi: 10.1016/j.fcr.2016.04.027
Ata-Ul-Karim, S. T., Yao, X., Liu, X. J., Cao, W. X., and Zhu, Y. (2013). Development of critical nitrogen dilution curve of Japonica rice in Yangtze River Reaches. Field Crops Res. 149, 149–158. doi: 10.1016/j.fcr.2013.03.012
Ata-Ul-Karim, S. T., Zhu, Y., Cao, Q., Rehmani, M. I. A., Cao, W., and Tang, L. (2017b). In-season assessment of grain protein and amylose content in rice using critical nitrogen dilution curve. Eur. J. Agron. 90, 139–151. doi: 10.1016/j.eja.2017.08.001
Ata-Ul-Karim, S. T., Zhu, Y., Lu, X. J., Cao, Q., Tian, Y. C., and Cao, W. (2017a). Estimation of nitrogen fertilizer requirement for rice crop using critical nitrogen dilution curve. Field Crops Res. 2017, 32–40. doi: 10.1016/j.fcr.2016.10.009
Bahmani, I., Hazard, L., and Varlet-Grancher, C. (2000). Differences in tillering of long-and short-leaved perennial ryegrass genetic lines under full light and shade treatments. Crop Sci. 40, 1095–1102. doi: 10.2135/cropsci2000.4041095x
Ballaré, C. L., Scopel, A. L., and Sanchez, R. A. (1997). Foraging for light: photosensory ecology and agricultural implications. Plant Cell Environ. 20, 820–825. doi: 10.1046/j.1365-3040.1997.d01-112.x
Bélanger, G., Gastal, F., and Lemaire, G. (1992). Growth analysis of a tall fescue sward fertilized with different rates of nitrogen. Crop Sci. 32, 1371–1376. doi: 10.2135/cropsci1992.0011183X003200060013x
Bonelli, L. E., Monzon, J. P., Cerrudo, A., Rizzalli, R. H., and Andrade, F. H. (2016). Maize grain yield components and source-sink relationship as affected by the delay in sowing date. Field Crops Res. 198, 215–225. doi: 10.1016/j.fcr.2016.09.003
Bremner, J. M., and Mulvancy, C. S. (1982). “Nitrogen-total,” in Methods of Soil Analysis, Part 2. American Society of Agronomy, ed A. L. Page (Madison, WI: American Society of Agronomy), 595–624.
Campbell, C. S., Heilman, J. L., Mclnnes, K. J., Wilson, L. T., Medley, J. C., Wu, G. W., et al. (2001). Seasonal variation in radiation use efficiency of irrigated rice. Agr. Forest Meteorol. 110, 45–54. doi: 10.1016/S0168-1923(01)00277-5
Chen, Y., Wu, D., Mu, X., Xiao, C., Chen, F., Yuan, L., et al. (2016). Vertical distribution of photosynthetic nitrogen use efficiency and its response to nitrogen in field-grown maize. Crop Sci. 56, 397–407. doi: 10.2135/cropsci2015.03.0170
Cui, Z. L., Chen, X. P., Miao, Y. X., Zhang, F. S., and Sun, Q. P. (2008). On-farm evaluation of the improved soil Nmin-based nitrogen management for summer maize in North China Plain. Agron. J. 100, 517–525. doi: 10.2134/agronj2007.0194
Dhital, S., and Raun, W. R. (2016). Variability in optimum nitrogen rates for maize. Agron. J. 108, 2165–2173. doi: 10.2134/agronj2016.03.0139
Geary, W. L., Bode, M., Doherty, T. S., Fulton, E. A., Nimmo, D. G., Tulloch, A. I. T., et al. (2020). A guide to ecosystem models and their environmental applications, Nat. Ecol. Evol. 4, 1459–1471. doi: 10.1038/s41559-020-01298-8
Greenwood, D. J., Gastal, F., Lemaire, G., Draycott, A., Millard, P., and Neeteson, J. J. (1991). Growth rate and %N of field grown crops: theory and experiments. Ann. Bot. 67, 181–190. doi: 10.1093/oxfordjournals.aob.a088118
Hammad, H. M., Farhat, A., Ahmad, A., Farhad, W., Wilerson, C., and Hoogenboom, G. (2018). Evaluation of timing and rates for nitrogen application for optimizing maize growth and development of maximizing yield. Agron. J. 110, 565–571. doi: 10.2134/agronj2017.08.0466
Hernández, M., Echarte, L., Della Maggiora, A., Cambareri, M., Barbieri, P., and Cerrudo, D. (2015). Maize water use efficiency and evapotranspiration response to N supply under contrasting soil water availability. Field Crops Res. 178, 8–15. doi: 10.1016/j.fcr.2015.03.017
Hikosaka, K. (2014). Optimal nitrogen distribution within a leaf canopy under direct and diffuse light. Plant Cell Environ. 37, 2077–2085. doi: 10.1111/pce.12291
Hirose, T., and Werger, M. J. (1987). Maximizing daily canopy photosynthesis with respect to the leaf nitrogen allocation pattern in the canopy. Oecologia 72, 520–526. doi: 10.1007/BF00378977
Hu, D. W., Sun, Z. P., Li, T. L., Yan, H. Z., and Zhang, H. (2014). Nitrogen nutrition index and its relationship with N use efficiency, tuber yield, radiation use efficiency, and leaf parameters in potatoes. J. Integr. Agr. 13, 1008–1016. doi: 10.1016/S2095-3119(13)60408-6
Islam, M. Z., Sattar, M. A., Ashrafuzzaman, M., Saud, H. M., and Uddin, M. K. (2012). Improvement of yield potential of rice through combined application of biofertilizer and chemical nitrogen. Afr. J. Microbiol. Res. 6, 745–750. doi: 10.5897/AJMR11.859
Justes, E., Mary, B., and Machet, J. M. (1994). Determination of a critical nitrogen dilutioncurve for winter wheat crops. Ann. Bot. 74, 397–407. doi: 10.1006/anbo.1994.1133
Lemaire, G., and Gastal, F. (1997). “N uptake and distribution in plant canopies,” in Diagnosis of the Nitrogen Status in Crops, ed G. Lemaire (Heidelberg: Springer-Verlag), 3–43.
Lemaire, G., and Gastal, F. F. (2009). “Quantifying crop responses to nitrogen deficiency and avenues to improve nitrogen use efficiency,” in Crop Physiology: Applications for Genetic Improvement and Agronomy, eds V. O. Sadras and D. F. Calderini (San Diego, CA: Academic Press), 171–211.
Lemaire, G., Jeuffroy, M. H., and Gastal, F. (2008). Diagnosis tool for plant and crop N status in vegetative stage theory and practices for crop N management. Eur. J. Agron. 28, 614–624. doi: 10.1016/j.eja.2008.01.005
Lemaire, G., van Oosterom, E., Sheehy, J., Jeuffroy, M. H., Massignam, A., and Rossato, L. (2007). Is crop demand more closely related to dry matter accumulation or leaf area expansion during vegetative growth? Field Crops Res. 100, 91–106. doi: 10.1016/j.fcr.2006.05.009
Liang, X. G., Zhang, J. T., Zhou, L. L., Li, X. H., and Zhou, S. L. (2013). Critical nitorgen dilution curve and nitrogen nutrition index for summer maize in North China Plain. Acta Agron. Sin. 92, 292–299. doi: 10.3724/SP.J.1006.2013.00292
Louarn, G., Frak, E., Zaka, S., Prieto, J., and Lebon, E. (2015). An empirical model that uses light attenuation and plant nitrogen status to predict within-canopy nitrogen distribution and upscale photosynthesis from leaf to whole canopy. AoB Plants 7, plv116. doi: 10.1093/aobpla/plv116
Nelson, E. W., and Sommers, L. E. (1982). “Total carbon, organic carbon, and organic matter,” in Methods of Soil Analysis. Part 2. Agronomy Monograph 9, 2nd Edn, eds A. L. Page (Madison, WI: ASA; SSSA), 539–579.
O'Connell, M. G., O'Leary, G. J., Whitfield, D. M., and Connor, D. J. (2004). Interception of photosynthetically active radiation and radiation-use efficiency of wheat, field pea and mustard in a semi-arid environment. Field Crops Res. 85, 111–124. doi: 10.1016/S0378-4290(03)00156-4
Olsen, S. R., Cole, C. V., Watanabe, F. S., and Dean, L. A. (1954). Estimation of Available Phosphorus in Soils by Extraction With Sodium Bicarbonate USDA Circ. 939. Washington, DC: U.S. Government Printing Office.
Omara, P., Aula, L., Oyebiyi, F., and Raun, W. R. (2019). World cereal nitrogen use efficiency trends: review and current knowledge. Agrosystems 2, 1–8. doi: 10.2134/age2018.10.0045
Plénet, D., and Lemaire, G. (2000). Relationships between dynamics of nitrogen uptake and dry matter accumulation in maize crops. Determination of critical N concentration. Plant Soil 216, 65–82. doi: 10.1023/A:1004783431055
Prieto, J. A., Louarn, G., Perez Pena, J., Ojeda, H., Simonneau, T., and Lebon, E. (2012). A leaf gas exchange model that accounts for intra-canopy variability by considering leaf nitrogen content and local acclimation to radiation in grapevine (Vitis vinifera L.). Plant Cell Environ. 35, 1313–1328. doi: 10.1111/j.1365-3040.2012.02491.x
Qi, D. L., and Pan, C. (2022). Responses of shoot biomass accumulation, distribution, and nitrogen use efficiency of maize to nitrogen application rates under waterlogging. Agr. Water Manage. 261, 107352. doi: 10.1016/j.agwat.2021.107352
Ravier, C., Meynard, J. M., Cohan, J. P., Gate, P., and Jeuffroy, M. H. (2017). Early nitrogen deficiencies favor high yield, grain protein content and N use efficiency in wheat. Eur. J. Agron. 89, 16–24. doi: 10.1016/j.eja.2017.06.002
Ruiz, R. A., and Bertero, H. D. (2008). Light interception and radiation use efficiency in temperate quinoa (Chenopodium quinoa Willd.) cultivars. Eur. J. Agron. 29, 144–152. doi: 10.1016/j.eja.2008.05.003
Uribelarrea, M., Crafts-Brandner, S. J., and Below, F. E. (2009). Physiological N response of field-grown maize hybrids (Zea mays L.) with divergent yield potential and grain protein concentration. Plant Soil 316:151–160. doi: 10.1007/s11104-008-9767-1
Yao, X., Aat-Ul-Karim, S. T., Zhu, Y., Tian, Y., and Liu, X. (2014a). Development of critical nitrogen dilution curve in rice based on leaf dry matter. Eur. J. Agron. 55, 20–28. doi: 10.1016/j.eja.2013.12.004
Yao, X., Zhao, B., Tian, Y. C., Liu, X. J., Ni, J., Cao, W. X., et al. (2014b). Using leaf dry matter to quantify the critical nitrogen dilution curve for winter wheat cultivated in eastern China. Field Crops Res. 149, 149–158. doi: 10.1016/j.fcr.2013.12.007
Yue, S. C., Meng, Q. F., Zhao, R. F., Li, F., Chen, X. P., Zhang, F. S., et al. (2012). Critical nitrogen dilution curve for optimizing nitrogen management of winter wheat production in the North China Plain. Agron. J. 104, 523–529. doi: 10.2134/agronj2011.0258
Zhang, F. S., Wang, J. Q., Zhang, W. F., Cui, Z. L., Ma, W. Q., Chen, X. P., et al. (2008). Nutrient use efficiencies of major cereal crops in China and measures for improvement. Acta Pedol. Sin. 45, 915–924. doi: 10.11766/200805200517
Zhao, B., Ata-Ul-Karim, S. T., Lemaire, G., Duan, A., Liu, Z., Liu, Z., et al. (2021a). Estimating the growth indices and nitrogen status based on color digital image analysis during early growth period of winter wheat. Front. Plant Sci. 12, 502. doi: 10.3389/fpls.2021.619522
Zhao, B., Ata-Ul-Karim, S. T., Liu, Z., Xiao, J., Liu, Z., and Qin, A. (2017). Development of a critical nitrogen dilution curve based on leaf dry matter for summer maize. Field Crops Res. 208, 60–68. doi: 10.1016/j.fcr.2017.03.010
Zhao, B., Ata-Ul-Karim, S. T., Liu, Z., Zhang, J., Xiao, J., Liu, Z., et al. (2018). Simple assessment of nitrogen nutrition index in summer maize by using chlorophyll meter readings. Front. Plant Sci. 9, 11. doi: 10.3389/fpls.2018.00011
Zhao, B., Ata-Ul-Karim, S. T., Yao, X., Tian, Y., Cao, W., Zhu, Y., et al. (2016). A new curve of critical nitrogen concentration based on spike dry matter for winter wheat in eastern china. PLoS ONE 11, e0164545. doi: 10.1371/journal.pone.0164545
Zhao, B., Niu, X. L., Ata-Ul-Karim, S. T., Wang, L. G., Duan, A. W., Liu, Z. D., et al. (2020). Determination of the post-anthesis nitrogen status using ear critical nitrogen dilution curve and its implications for nitrogen management in maize and wheat. Eur. J. Agron. 113, 125967. doi: 10.1016/j.eja.2019.125967
Zhao, B., Zhang, Y., Duan, A., Liu, Z., Xiao, J., Liu, Z., et al. (2021b). Exploring the nitrogen source-sink ratio to quantify ear nitrogen accumulation in maize and wheat using critical nitrogen dilution curve. Field Crop. Res. 205, 106–115. doi: 10.1016/j.fcr.2021.108332
Keywords: corn, nitrogen, nitrogen diagnosis index, critical nitrogen concentration, plant growth status
Citation: Zhao B, Ata-Ul-Karim ST, Duan A, Gao Y, Lou H, Liu Z, Qin A, Ning D, Ma S and Liu Z (2022) Estimating the Impacts of Plant Internal Nitrogen Deficit at Key Top Dressing Stages on Corn Productivity and Intercepted Photosynthetic Active Radiation. Front. Plant Sci. 13:864258. doi: 10.3389/fpls.2022.864258
Received: 28 January 2022; Accepted: 14 March 2022;
Published: 08 April 2022.
Edited by:
Adnan Noor Shah, Khwaja Fareed University of Engineering and Information Technology (KFUEIT), PakistanReviewed by:
Muhammad Tahir, University of Minnesota Twin Cities, United StatesCopyright © 2022 Zhao, Ata-Ul-Karim, Duan, Gao, Lou, Liu, Qin, Ning, Ma and Liu. This is an open-access article distributed under the terms of the Creative Commons Attribution License (CC BY). The use, distribution or reproduction in other forums is permitted, provided the original author(s) and the copyright owner(s) are credited and that the original publication in this journal is cited, in accordance with accepted academic practice. No use, distribution or reproduction is permitted which does not comply with these terms.
*Correspondence: Ben Zhao, emhhb2JlbjUxN0AxNjMuY29t; Zhandong Liu, bGl1emhhbmRvbmdAY2Fhcy5jbg==
†Present address: Ben Zhao, Farmland Irrigation Research Institute, Chinese Academy of Agricultural Sciences, Xinxiang, China
Disclaimer: All claims expressed in this article are solely those of the authors and do not necessarily represent those of their affiliated organizations, or those of the publisher, the editors and the reviewers. Any product that may be evaluated in this article or claim that may be made by its manufacturer is not guaranteed or endorsed by the publisher.
Research integrity at Frontiers
Learn more about the work of our research integrity team to safeguard the quality of each article we publish.