 Ningyi Zhang1*
 Sarah R. Berman1
 Dominique Joubert2
 Silvere Vialet-Chabrand1
 Leo F. M. Marcelis1
 Elias Kaiser1*
- 1Horticulture and Product Physiology, Department of Plant Sciences, Wageningen University & Research, Wageningen, Netherlands
- 2Biometris, Department of Mathematical and Statistical Methods, Wageningen University & Research, Wageningen, Netherlands
Under natural conditions, irradiance frequently fluctuates, causing net photosynthesis rate (A) to respond slowly and reducing the yields. We quantified the genotypic variation of photosynthetic induction in 19 genotypes among the following six horticultural crops: basil, chrysanthemum, cucumber, lettuce, tomato, and rose. Kinetics of photosynthetic induction and the stomatal opening were measured by exposing shade-adapted leaves (50 μmol m–2 s–1) to a high irradiance (1000 μmol m–2 s–1) until A reached a steady state. Rubisco activation rate was estimated by the kinetics of carboxylation capacity, which was quantified using dynamic A vs. [CO2] curves. Generally, variations in photosynthetic induction kinetics were larger between crops and smaller between cultivars of the same crop. Time until reaching 20–90% of full A induction varied by 40–60% across genotypes, and this was driven by a variation in the stomatal opening rather than Rubisco activation kinetics. Stomatal conductance kinetics were partly determined by differences in the stomatal size and density; species with densely packed, smaller stomata (e.g., cucumber) tended to open their stomata faster, adapting stomatal conductance more rapidly and efficiently than species with larger but fewer stomata (e.g., chrysanthemum). We conclude that manipulating stomatal traits may speed up photosynthetic induction and growth of horticultural crops under natural irradiance fluctuations.
Introduction
Irradiance in canopies frequently fluctuates due to changes in solar angle, cloud movements, and wind-induced leaf movements (Pearcy, 1953; Kaiser et al., 2015). When irradiance increases, the rate of photosynthesis of a shade-adapted leaf does not immediately increase to a new steady-state level. Instead, leaf photosynthesis increases progressively, until it reaches a new steady-state level; this process is referred to as photosynthetic induction. The time needed for photosynthetic induction leads to a potential carbon loss, as during this time period, leaf photosynthesis operates below its steady-state rate (Mott and Woodrow, 2000; Salter et al., 2019; Acevedo-Siaca et al., 2020). Thus, speeding up photosynthetic induction may increase the yields of crops grown under fluctuating light (Slattery et al., 2018; Tanaka et al., 2019; Acevedo-Siaca et al., 2020).
Photosynthetic induction is generally considered to be limited by three main processes: (1) photoactivation of enzymes involved in the regeneration and production of ribulose 1,5-bisphosphate (RuBP), (2) increase in the activation state of Rubisco, and (3) stomatal opening (Pearcy, 1953; Kaiser et al., 2015, 2018). Mesophyll conductance may also limit photosynthetic induction (especially when transitioning from darkness to light), but the importance of mesophyll conductance limitation for photosynthetic induction is currently under debate (De Souza et al., 2020; Liu et al., 2021; Sakoda et al., 2021). Large genotypic variation in photosynthetic induction rates has previously been found in many crop species (McAusland et al., 2016; Salter et al., 2019; Acevedo-Siaca et al., 2020; Yamori et al., 2020). For example, in rice, soybean, and cassava, the integrated net photosynthesis rate (A) during the first 5 min after a switch from low to high irradiance was affected by genotypic variation (Soleh et al., 2017; Acevedo-Siaca et al., 2020; De Souza et al., 2020). Quantifying the genotypic variations of photosynthetic induction and identifying the relevant physiological traits can help with trait selection for breeding high-yielding cultivars with optimized photosynthetic induction.
The activation of enzymes involved in RuBP regeneration is thought to be complete within the first 1–2 min of photosynthetic induction (Pearcy, 1953); the extent of this limitation was found to be relatively similar among closely related wheat genotypes (Salter et al., 2019). The extent to which Rubisco activation and stomatal opening limit photosynthetic induction vary more strongly among species, and these two limitations are often interlinked. For example, in rice, wheat, and soybean, photosynthetic induction was found to be limited by the rate of Rubisco activation and presumably driven by concentrations of Rubisco and Rubisco activase (Soleh et al., 2016; Salter et al., 2019; Acevedo-Siaca et al., 2020). However, some studies also showed a strong role of stomatal conductance (gs) in the photosynthetic induction of rice and wheat (Adachi et al., 2019; McAusland et al., 2020; Qu et al., 2020; Yamori et al., 2020). In recent years, the activation of Rubisco during photosynthetic induction has been approximated by estimating the dynamics of maximum Rubisco carboxylation rate (Vcmax) during photosynthetic induction through dynamic A vs. intercellular CO2 concentration (Ci) curves (Soleh et al., 2016; Taylor and Long, 2017; Salter et al., 2019). This requires a measure of photosynthetic induction at several Ci, allowing for the estimation of the time constants that describe several phases of Vcmax induction and the kinetics of changes in electron transport rate at high irradiance (Soleh et al., 2016; Taylor and Long, 2017; Salter et al., 2019).
In many species, such as cassava, tomato, Arabidopsis, and in some tropical trees and shrubs, photosynthetic induction tends to strongly correlate with stomatal traits (e.g., initial gs in low irradiance or stomatal opening rate) (Valladares et al., 1997; Allen and Pearcy, 2000; Kaiser et al., 2016, 2020; De Souza et al., 2020). Increasing gs has been found to speed up the photosynthetic induction in rice and tomato (Kaiser et al., 2020; Sakoda et al., 2020; Yamori et al., 2020). Stomatal anatomy (e.g., stomatal density and size) affects gs, including its kinetics. Smaller stomata tend to show lower initial gs at low irradiance, but faster opening and closure kinetics (Drake et al., 2013; Giday et al., 2013; Kardiman and Ræbild, 2018; Zhang et al., 2019). However, this inverse stomatal size–speed relationship is not conserved across species, as guard cell shape (elliptical, dumbbell) and guard cell cytoskeleton, cell wall elasticity, number and activity of transporters, or ion channels, also affect the rapidity of the stomatal response (Elliott-Kingston et al., 2016; McAusland et al., 2016; Lawson and Vialet-Chabrand, 2019).
Studies investigating the photosynthetic induction have so far mostly been conducted on the major field crops (e.g., rice, wheat, and soybean) and species in forestry eco-systems (Valladares et al., 1997; Allen and Pearcy, 2000; McAusland et al., 2016; Salter et al., 2019; Acevedo-Siaca et al., 2020), which leave a knowledge gap for other economically important species, such as tomato, cucumber, lettuce, and chrysanthemum. Despite the fact that irradiance fluctuations mostly occur under open-field conditions, irradiance in greenhouses can also fluctuate substantially (Supplementary Figure 1; Marcelis et al., 2018). Irradiance fluctuations in greenhouses are caused by the movement of the sun and cloud, both of which affect the shade cast by the greenhouse structure, including shading screens and supplemental lighting and canopy self-shading. An important distinction between the open fields and greenhouses is a near-complete lack of wind in the latter, which presumably reduces the frequency of sunlight fluctuations, and increases their duration, in the greenhouse. Crop growth in greenhouses is often source-limited, i.e., limited by crop photosynthesis (Marcelis, 1994); hence, greenhouse crops that respond to irradiance fluctuations with high efficiency are likely to show increased growth rates. Despite this substantial relevance of dynamic photosynthesis for crop growth in greenhouses, studies on the genotypic variation of photosynthetic induction so far have not included the major greenhouse crops.
The objective of this study was to quantify the genotypic variation of photosynthetic induction in some of the world’s major horticultural crops, such as tomato, cucumber, rose, chrysanthemum, lettuce, and basil. Furthermore, we aimed to elucidate the influence of the main factors that affect the rapidity of photosynthetic induction: Rubisco activation and stomatal opening, including the role of stomatal anatomy.
Materials and Methods
Plant Material and Growth Conditions
The experiment was conducted from 28 January to 12 June 2020, in a compartment (8 × 8 m) of a Venlo-type glasshouse located in Wageningen, the Netherlands (52°N, 6°E). Four growth tables were situated in the compartment. All genotypes were grown in the same compartment to avoid artifacts caused by different growth conditions. In total, 19 genotypes of six horticultural crop species were used, including two flower crops, chrysanthemum (Chrysanthemum morifolium) and rose (Rosa hybrida); two fruit vegetables, cucumber (Cucumis sativus L.) and tomato (Solanum lycopersicum L.); and two leafy vegetables, basil (Ocimum basilicum) and lettuce (Lactuca sativa L.; Table 1). Cultivars for each crop were chosen based on their commercially relevant traits as horticultural merchandise: cultivars of the flower crops differed in flower color and number, those of fruit vegetables differed in fruit size, and those of leafy vegetables differed in leaf color and texture. For basil, cucumber, lettuce, and tomato, seeds were sown in rockwool plugs (diameter: 2 cm). Following germination, the seedlings were transferred to rockwool cubes (10 × 10 cm). Chrysanthemum plants were grown in plastic pots (diameter: 14 cm) filled with potting soil. Rose plants were grown in rockwool cubes (7 × 7 cm).
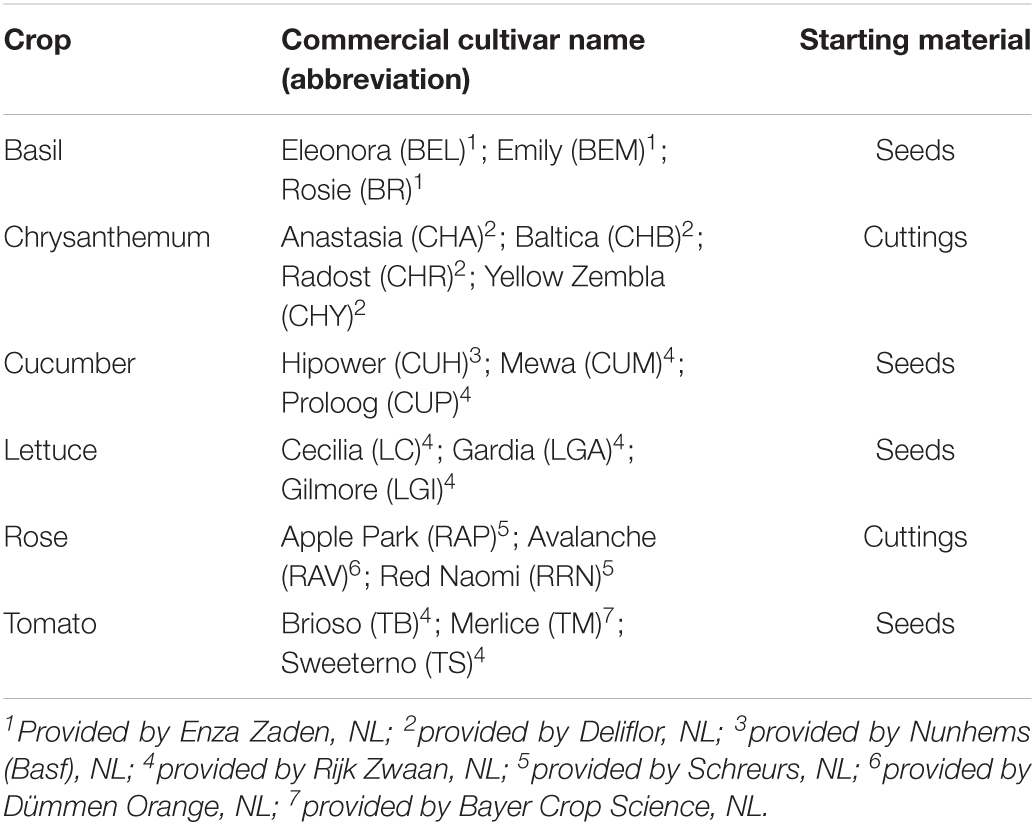
Table 1. Horticultural genotypes used in the experiment, with abbreviations used throughout the text in brackets, and starting plant materials.
For basil, cucumber, lettuce, and tomato, the seeds were sown weekly. For chrysanthemum and rose, the plants were cut back weekly at the third or fourth node, counting from the base, to allow for the formation of a new axillary bud. Two weeks after sowing seeds or cutting back plants, two plants per genotype were placed on a growth table in a grid of four rows (distance between rows: 50 cm; distance between plants within the row: 30 cm). Plant positions were randomized two times per week to minimize any effects of a heterogeneous climate in the greenhouse compartment on plant growth. Plants were placed on the growth table for 2–3 weeks (i.e., 4–5 weeks after sowing seeds or cutting back plants), after which the measurements were conducted. This protocol was repeated weekly until data of 7–9 replicates per genotype had been collected.
A mixture of high-pressure sodium lamps (600 W, Philips, Eindhoven, Netherlands) and white light-emitting diodes (LEDs) (GreenPower LED toplighting module, Signify, Eindhoven, Netherlands) were used between 02:00 and 18:00 (a photoperiod of 16 h). Lamps were switched on during the photoperiod whenever global radiation (GR) outside the greenhouse dropped below 150 W m–2 and were switched off when GR > 250 W m–2. Photosynthetically active radiation (PAR) from both lamp types combined was, on average, 226 ± 16 μmol m–2 s–1 at the canopy level (mean ± S.D.; Supplementary Figure 2). A shading screen (HARMONY 4215 O FR, Ludvig Svensson, Hellevoetsluis, Netherlands) was closed when GR > 600 W m–2 and was opened when GR < 500 W m–2. Day and night temperatures were set to 20 and 19°C, respectively. Relative humidity was set to 60%. Climate settings were designed to provide reasonably optimal growth conditions for all genotypes, in discussion with greenhouse cultivation experts at the Wageningen University. Average values of daily PAR (from both solar light and supplemental lamps), air temperature, relative humidity, and [CO2] inside the greenhouse during the experiment were 241 ± 48 μmol m–2 s–1, 21.5 ± 1.4°C, 63 ± 6%, and 445 ± 11 ppm, respectively (mean ± SD; Supplementary Figure 3). Plants were irrigated four times per day between 7:00 and 19:00 with a customized nutrient solution suitable for all six greenhouse crops (pH: 6.3; EC: 2.2 mS cm–1; Supplementary Table 1).
Gas Exchange Measurements
Net photosynthesis rate (A) and stomatal conductance to water vapor (gs) were measured on the youngest fully expanded leaf, using a gas exchange system (LI-6800, Li-Cor Bioscience, Lincoln, NE, United States) equipped with a 6 cm2 leaf chamber fluorometer. No correction for the leaf area was needed for any of the gas exchange measurements as the leaves always fully filled the leaf chamber. All measurements were performed at an air temperature of 23°C, relative humidity of 65%, and a flow rate of air through the system of 500 μmol s–1. Irradiance was provided by a mixture of red (90%) and blue (10%) LEDs in the fluorometer. Before any gas exchange measurement, single plants were preconditioned to a low irradiance (ca. 50 μmol m–2 s–1) for 40–60 min in the greenhouse compartment, using a custom-built shading construction. The shading construction was covered by opaque plastic films and with LEDs installed at the top, which produced an irradiance at around 50 μmol m–2 s–1 with 90% red and 10% blue colors. Preadaptation under the shading construction for 40–60 min was applied to ensure that during subsequent gas exchange measurements, the leaves were sufficiently shade-adapted to produce comparable data.
Photosynthetic induction was measured under a range of [CO2]: 50, 100, 250, 400, 600, 800, and 1,000 ppm. At 400 ppm of CO2, the leaf was first exposed to a low irradiance of 50 μmol m–2 s–1 for 30 min in the gas exchange chamber, after which the irradiance was increased in a single step to a high level (1,000 μmol m–2 s–1) for an additional 30 min. A low irradiance rather than darkness was used for the initial light conditions, as in natural environments; shade-adapted leaves are often suddenly exposed to high light (due to cloud movements or wind), whereas the exposure of an entirely dark-adapted leaf to a high irradiance is unlikely in nature and greenhouses. Gas exchange data was logged every 2 s. If a steady-state A value was not reached after 30 min under high irradiance, measurements continued until A reached a steady state. For other [CO2], the leaf was clamped into the cuvette at 50 μmol m–2 s–1 for 5 min, after which the irradiance was increased to 1,000 μmol m–2 s–1 for 15 min. All measurements ([CO2] × genotype) were randomized. Every week, a group of new plants (one per genotype) was chosen and measurements at different [CO2] were randomized among these plants during the day, to avoid potential diurnal effects being entangled with treatment effects. Once photosynthetic induction was measured on a given plant, the particular plant was not used for another measurement for at least 40 min, to avoid interference from previous conditions. All gas exchange measurements were done between 8:00 and 16:00 h.
Leaf Anatomical and Physiological Measurements
Samples to measure the stomatal size and density were taken on the same leaf used for gas exchange measurements. In addition, leaf light absorptance and chlorophyll and carotenoid contents were measured.
Stomatal Imprints
Stomatal imprints were taken after the final gas exchange measurement on a given plant had been completed. Imprints were taken using a silicone impression material (Zhermack, Badia Polesine, Italy), with two technical replicates on the abaxial side and two technical replicates on the adaxial side of each leaf. The silicon was allowed to fully dry on the leaf before it was removed gently. Clear nail polish was applied to the imprint and allowed to dry. The dry nail polish was viewed under a microscope (Leitz Aristoplan; Leica Microsystems, Wetzlar, Germany) and photographed at 25X and 40X magnification (Digital-Sight DS-Ri-1; Nikon, Tokyo, Japan). Images were analyzed with ImageJ, using the CellCounter and ObjectJ plugins (National Institute of Health, Bethesda, MD, United States).
Leaf Optical Properties
Leaf reflectance and transmittance were measured in the range of 400–700 nm for both adaxial and abaxial sides of the leaf. The measurement system consisted of two integrating spheres, each connected to a spectrometer and a custom-made light source (Hogewoning et al., 2010).
Leaf Chlorophyll and Carotenoid Contents
After the completion of gas exchange measurements, a leaf sample of 0.75 cm2 was taken from each leaf and stored at –80°C. Samples were extracted with 1.5 ml of N,N-Dimethylformamide (DMF) at –20°C for approximately 2 weeks (Wellburn, 1994). The absorption of the DMF solution was measured at 480, 647, 664, and 750 nm for chlorophyll a, chlorophyll b, and carotenoid contents, using a SpectraMax iD3 Microplate Reader (software version 1.2.0.0, Molecular Devices, San Jose, CA, United States) or a Genesys 15 UV-Visible spectrophotometer (Thermo Fisher Scientific, Waltham, United States). Concentrations were calculated according to the study by Wellburn (1994).
Calculations
Rate of A Induction
The induction state of photosynthesis (IS) was calculated as follows:
where A(t) (μmol CO2 m–2 s–1) is CO2 assimilation rate at time t and 400 ppm CO2; Ai (μmol CO2 m–2 s–1) is initial A at low irradiance (average A measured in the last minute of low irradiance at 400 ppm CO2); Af (μmol CO2 m–2 s–1) is final steady-state A reached in high irradiance, at 400 ppm CO2. The times to reach 20% (T20), 50% (T50), and 90% (T90) of full induction state were determined as the moments at which IS was the closest to these percentages, based on the IS time course generated from Eq. 1.
Rate of Vcmax and J Induction
Based on photosynthetic induction measurements at different [CO2], A/Ci curves were generated from the data obtained every 2 s under different [CO2]. First, respiration rate (Rd) was estimated according to the study by Laisk (1977), i.e., Rd was identified as the intercept with the y-axis of the common intersection point of A vs. Ci at low and high irradiance, using the last data points measured under low and high irradiance at atmospheric [CO2] below 400 ppm. Then, the model of Farquhar et al. (1980) (the FvCB model) was fitted to each A/Ci curve to provide transient values of Vcmax and electron transport rate (J) during photosynthetic induction (Supplementary Method 1). The response of Vcmax induction during the first 15 min after exposure to high irradiance was fitted to an empirical model that represents a two-phase exponential function of time (Salter et al., 2019):
where Vcmax(t) is Vcmax at time t; Vmi is initial Vcmax after exposure to high irradiance; Vmf is final Vcmax after 15 min of high irradiance exposure; τfast and τslow are time constants for the fast and slow phase of Vcmax induction; f is a weighting factor (value: 0–1).
Transient Stomatal and Non-stomatal Limitations
Transient stomatal and non-stomatal limitations during photosynthetic induction were calculated based on an elimination approach. First, using the FvCB model, instantaneous A during photosynthetic induction was calculated every 2 s, with estimated Vcmax and J and measured gs every 2 s (i.e., Vmt, Jt, and gs,t) as input parameters. Calculated A was compared with the measured A during photosynthetic induction to ensure that model outputs accurately predicted the observed data before applying the elimination approach (Supplementary Presentation 1). In case of mismatches, values of Vmt and Jt were optimized to improve model predictions. Photosynthesis rate as affected by transient stomatal limitation (As) was calculated by removing the transient limitations of Rubisco and electron transport rate changes, by using final Vcmax and J (Vmf and Jf) at high irradiance and instantaneous gs (gs,t) during induction (Eq. 3; Wang and Jarvis, 1993).
In this case, any difference between As and Af can be seen as caused by incomplete stomatal opening during induction. Stomatal limitation (Ls) was then calculated using Eq. 4:
Photosynthesis rate as affected by transient non-stomatal limitation (Ans) was calculated by using instantaneous Vcmax and J (Vmt and Jt) during induction and final gs (gs,f) reached at high irradiance (Eq. 5; Wang and Jarvis, 1993).
In this case, any difference between Ans and Af can be seen as caused by the incomplete induction of Vcmax and J. Nonstomatal limitation (Lns) was then quantified using Eq. 6.
Kinetics of gs Responses
The response of gs to a single step change in light intensity was quantified using a dynamic gs model (Vialet-Chabrand et al., 2013; McAusland et al., 2016). The model describes the temporal response of gs, using a time constant (k, min), an initial time lag (λ, min), and a steady-state gs (gs,f, mol m–2 s–1) reached a given irradiance:
where gs,i is the initial gs value at low irradiance (average gs measured in the last minute of low irradiance at 400 ppm CO2). The time constant, k, describes the rapidity of the gs response, independent of the amplitude of variation in gs. The value, e is Euler’s number (2.71828). Based on k and gs,f, the maximum slope of the gs response to a step-change in irradiance (Slmax, μmol m–2 s–2), which combines the rapidity and amplitude of the response, was calculated:
Theoretical Maximum Stomatal Conductance
The maximum stomatal conductance to water vapor (gs,max) when all stomates open to their maximum extent was calculated based on the studies by Franks and Farquhar (2001) and Franks and Beerling (2009):
where d is the diffusivity of water vapor in the air (24.9 × 10⁻⁶ m2 s–1); v is the molar volume of air (24.4 × 10⁻³ m3 mol–1); SD is stomatal density; amax is the maximum pore area and is approximated as π(ρ/2)2, where ρ is stomatal pore length and l is stomatal pore depth (assumed to be equal to guard cell width). Both ρ and guard cell width were measured from stomatal imprints (Supplementary Table 2). Based on the stomatal density and length obtained from abaxial and adaxial leaf surfaces, gs,max per leaf surface was calculated. Then, gs,max for a specific genotype was calculated as the sum of gs,max for both leaf surfaces.
Kinetics of Stomatal Pore Area Increase
When substituting gs,max in Eq. 9 with gs obtained from gas exchange measurements, amax represents the average stomatal pore area a across the leaf surface. Thus, the stomatal pore area and its kinetics during the stomatal opening were quantified by solving a from Eq. 9 (refer to details in Supplementary Method 2):
It is important to note that the relationship between a and gs is not linear, which can result in differences in temporal kinetics between both traits.
Coefficient of Variation
To evaluate the variation of traits among genotypes, the coefficient of variation (CV, %) was calculated:
where Xsd and Xavg are, respectively, the standard deviation and mean value of the genotype-specific average of a given trait across all 19 genotypes.
Statistical Analysis
Using a nonlinear regression with the GAUSS method in PROC NLIN of SAS (SAS Institute Inc., Cary, NC, United States), parameters of the dynamic gs model and Vcmax kinetics during A induction were estimated. Statistical analyses were conducted using R1. First, normality was tested using the Shapiro–Wilk test, and homogeneity was tested using Levene’s test to determine whether residuals showed equal variances. For traits that did not show equal variance, log transformation of data was applied. Differences between genotypes were detected using one-way ANOVA (p < 0.05), by taking into account, the different weeks of sowing/cutting as a block effect. When a significant difference was detected, a post hoc test was conducted for pairwise comparisons between genotypes, using Fisher’s Protected Least Significant Difference (LSD) test (p < 0.05).
Results
Genotypic Variation of A and gs Responses to a Single-Step Change in Irradiance
The kinetics of A induction varied substantially among the 19 horticultural genotypes tested (Figures 1A–C). Variation in the key traits of photosynthesis dynamics tended to be larger between different crop species than between cultivars of the same species (Figure 2). CV of T20, T50, and T90 was 55, 61, and 42%, respectively, while CV of average A during the first 300 s of induction (Aavg,300) was 22% (Table 2). The rate of A induction in rose was the fastest as demonstrated by small values for T50 and T90 in all three rose cultivars (Figures 1B, 2A,B). Chrysanthemum and lettuce, on the other hand, tended to have the highest T90 values (Figure 2B) and thus showed relatively slow induction. Chrysanthemum also had high T50 values, except for cv. Anastasia (CHA) had a very low T50, whereas lettuce showed a relatively smaller T50 (Figure 2A). Tomato and cucumber had intermediate T50 and T90 (Figures 2A,B). Most crops showed a relatively small variation between cultivars, except for basil, which showed relatively large variations in T50 and T90 for its three cultivars (Figures 2A,B).
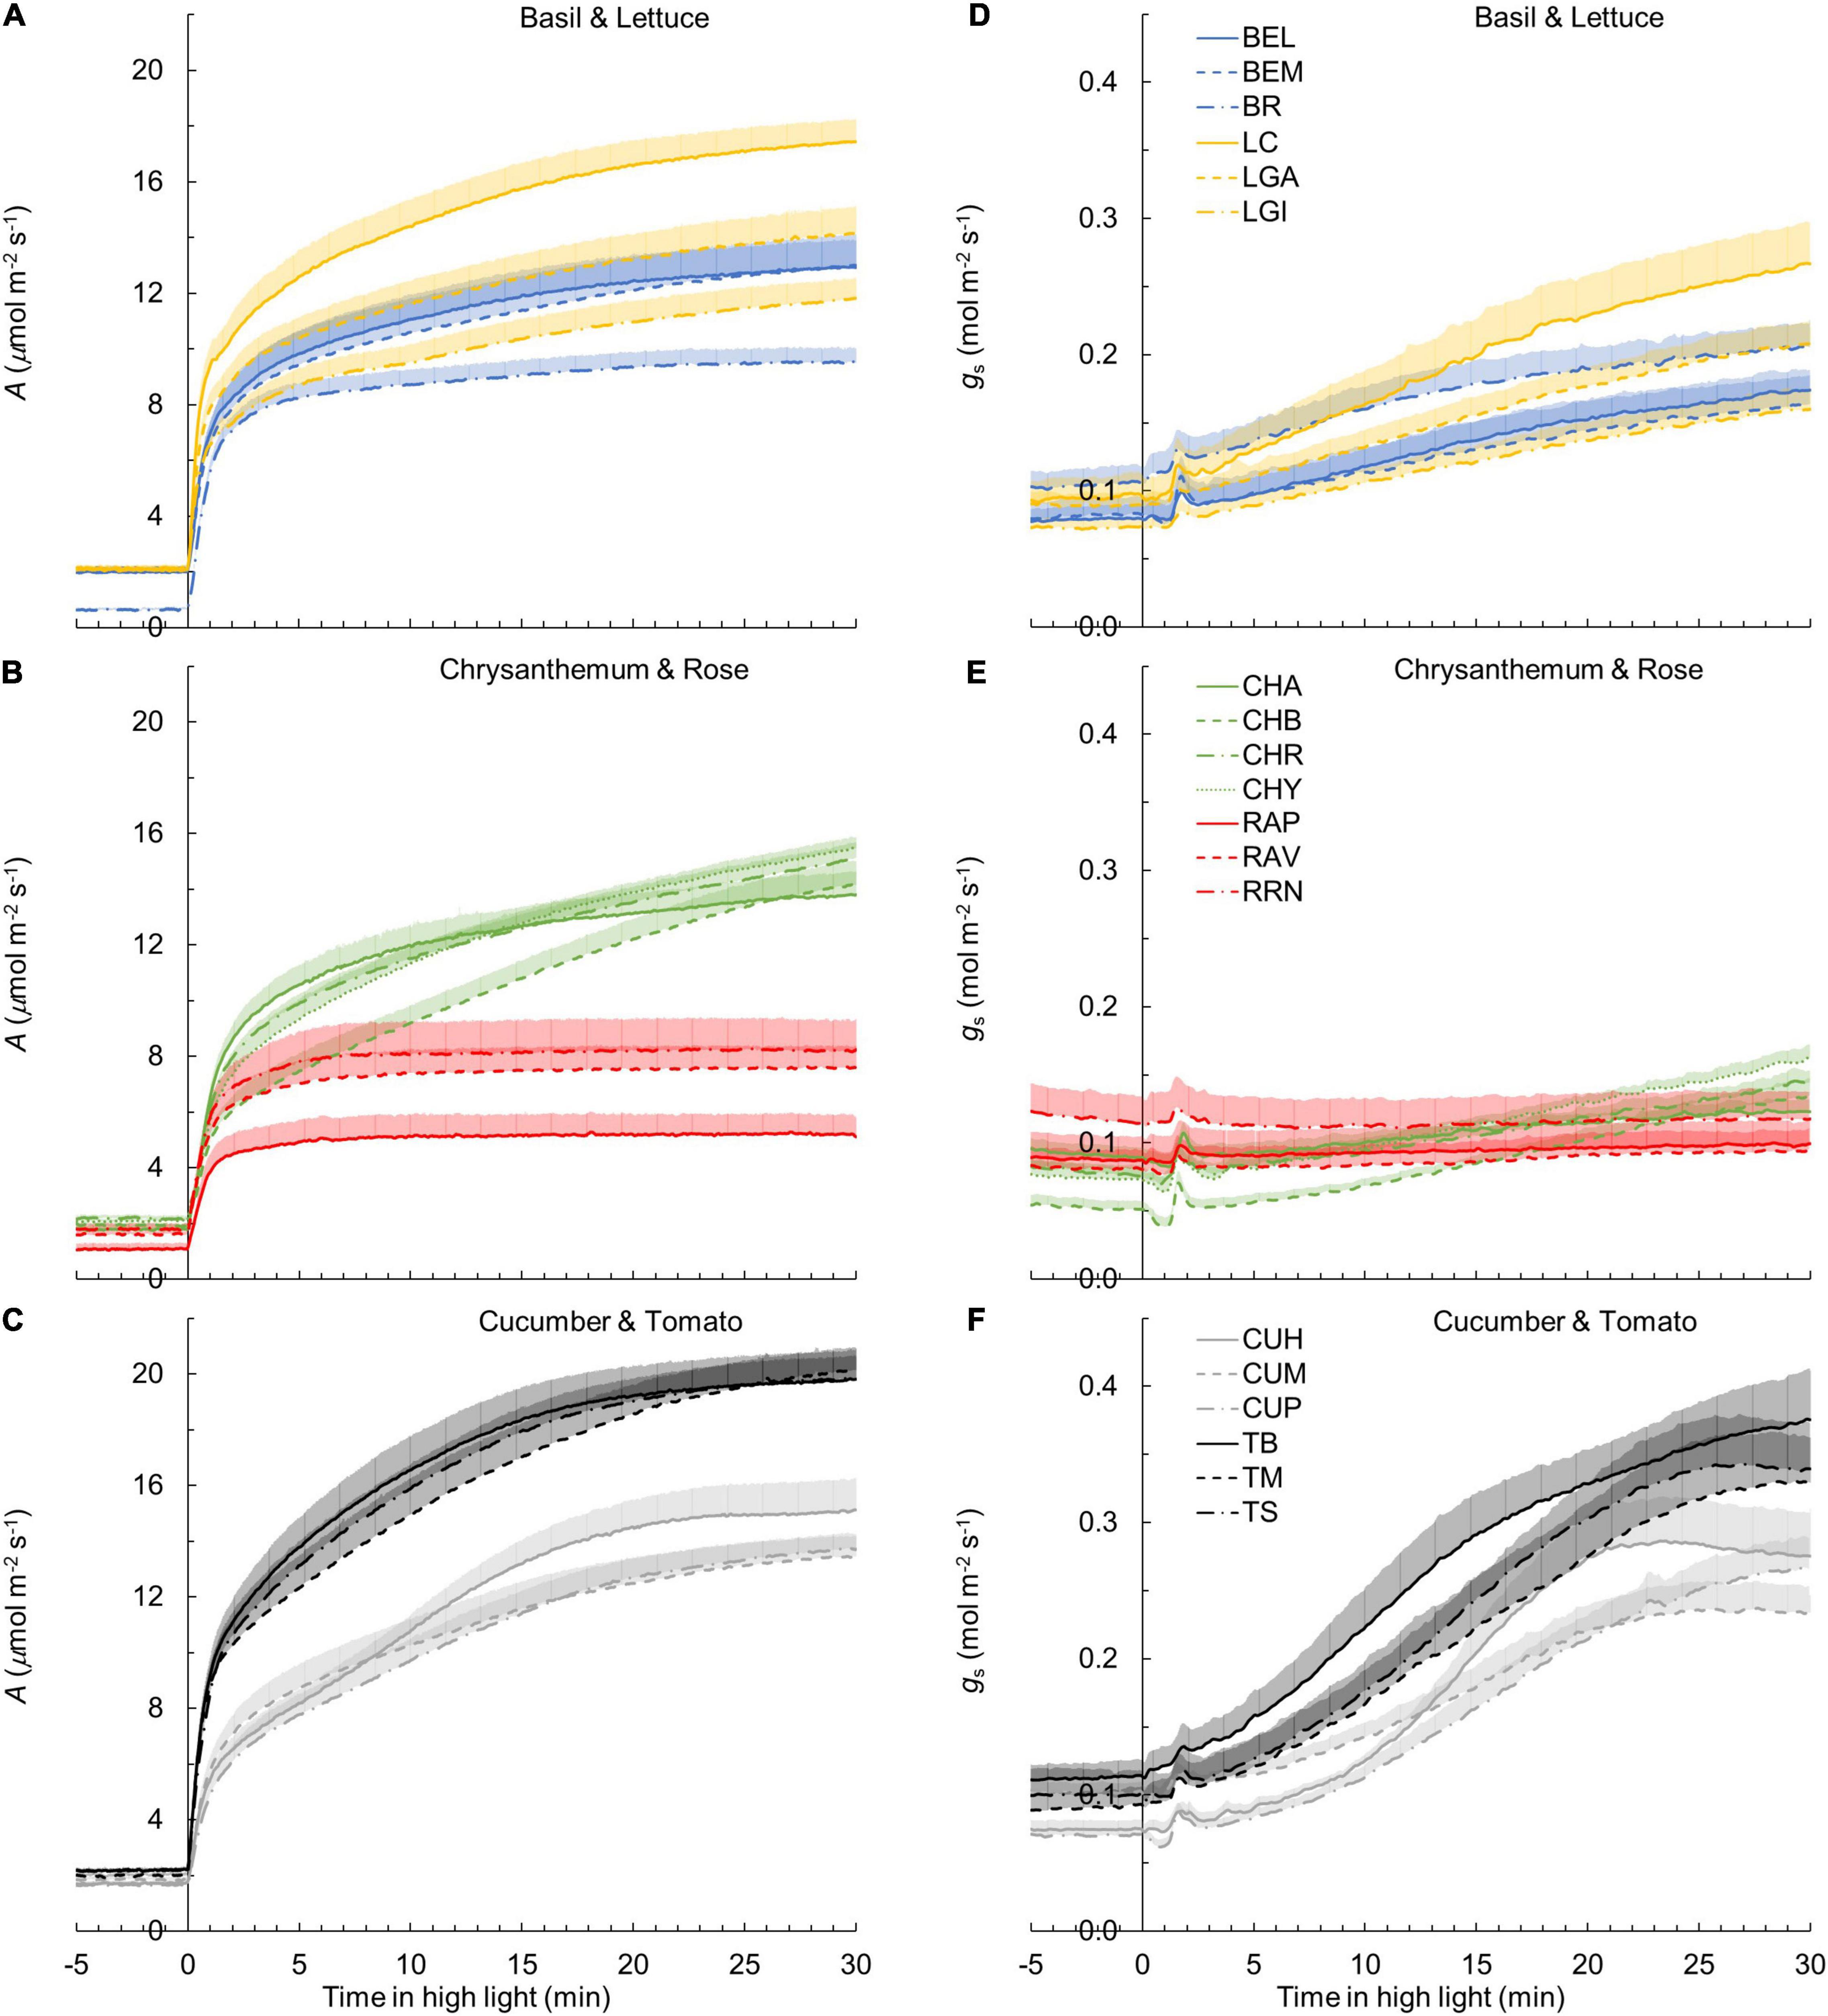
Figure 1. Leaf photosynthesis rate (A) (A–C) and stomatal conductance gs (D–F) responses to a single-step change in irradiance in 19 horticultural genotypes of six species (A,D: basil and lettuce; B,E: chrysanthemum and rose; C,F: cucumber and tomato; refer to Table 1 for full names of genotypes). Time zero indicates the moment when irradiance was increased from 50 to 1,000 μmol m–2 s–1. A and gs values were logged every 2 s. Line colors represent crop species, while line types differentiate between cultivars. Each curve represents the mean of 7–9 individual plants (mean + SE).
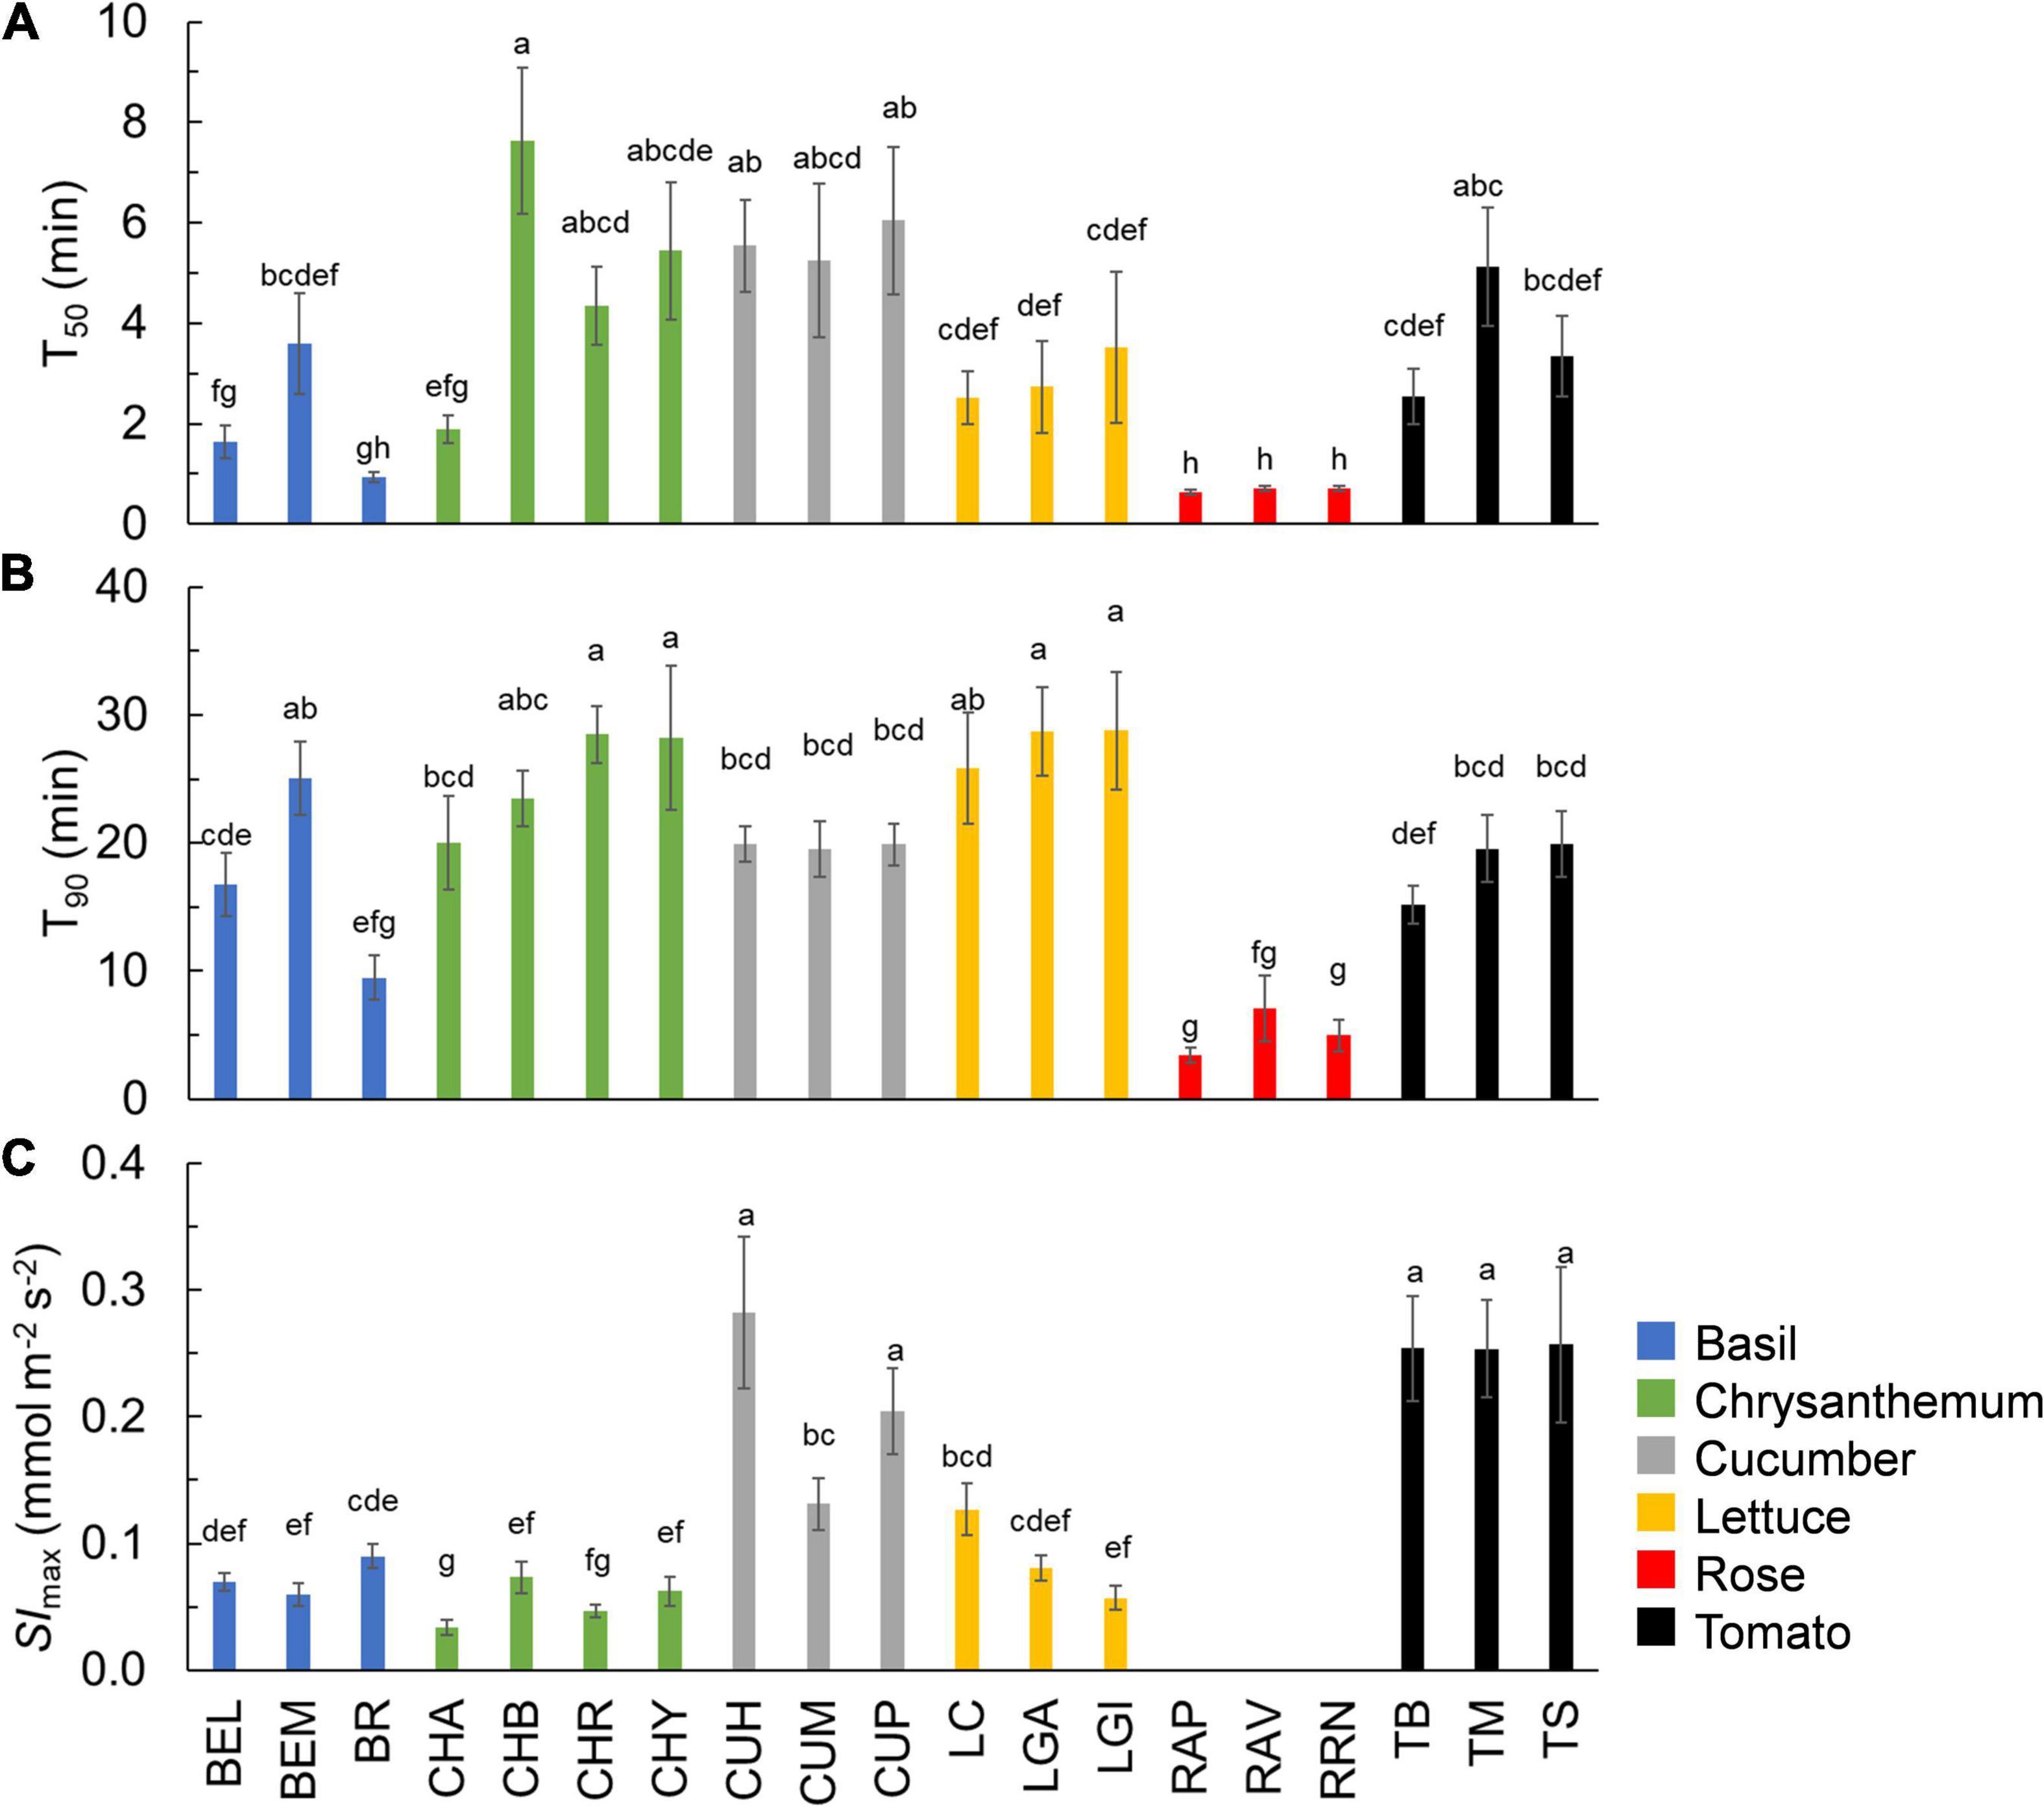
Figure 2. Time needed for A to reach 50% (A: T50) and 90% (B: T90) of full photosynthetic induction, as well as the maximum rate of stomatal opening after an increase in irradiance (C: Slmax) in 19 horticultural genotypes. Colors indicate crop species. Bars show means ± SE (n = 7–9). Letters indicate significant differences (p < 0.05). For T50, the result of the statistical test was based on log transformation of original data. Slmax was not estimated for rose. Refer to Table 1 for full genotype names.
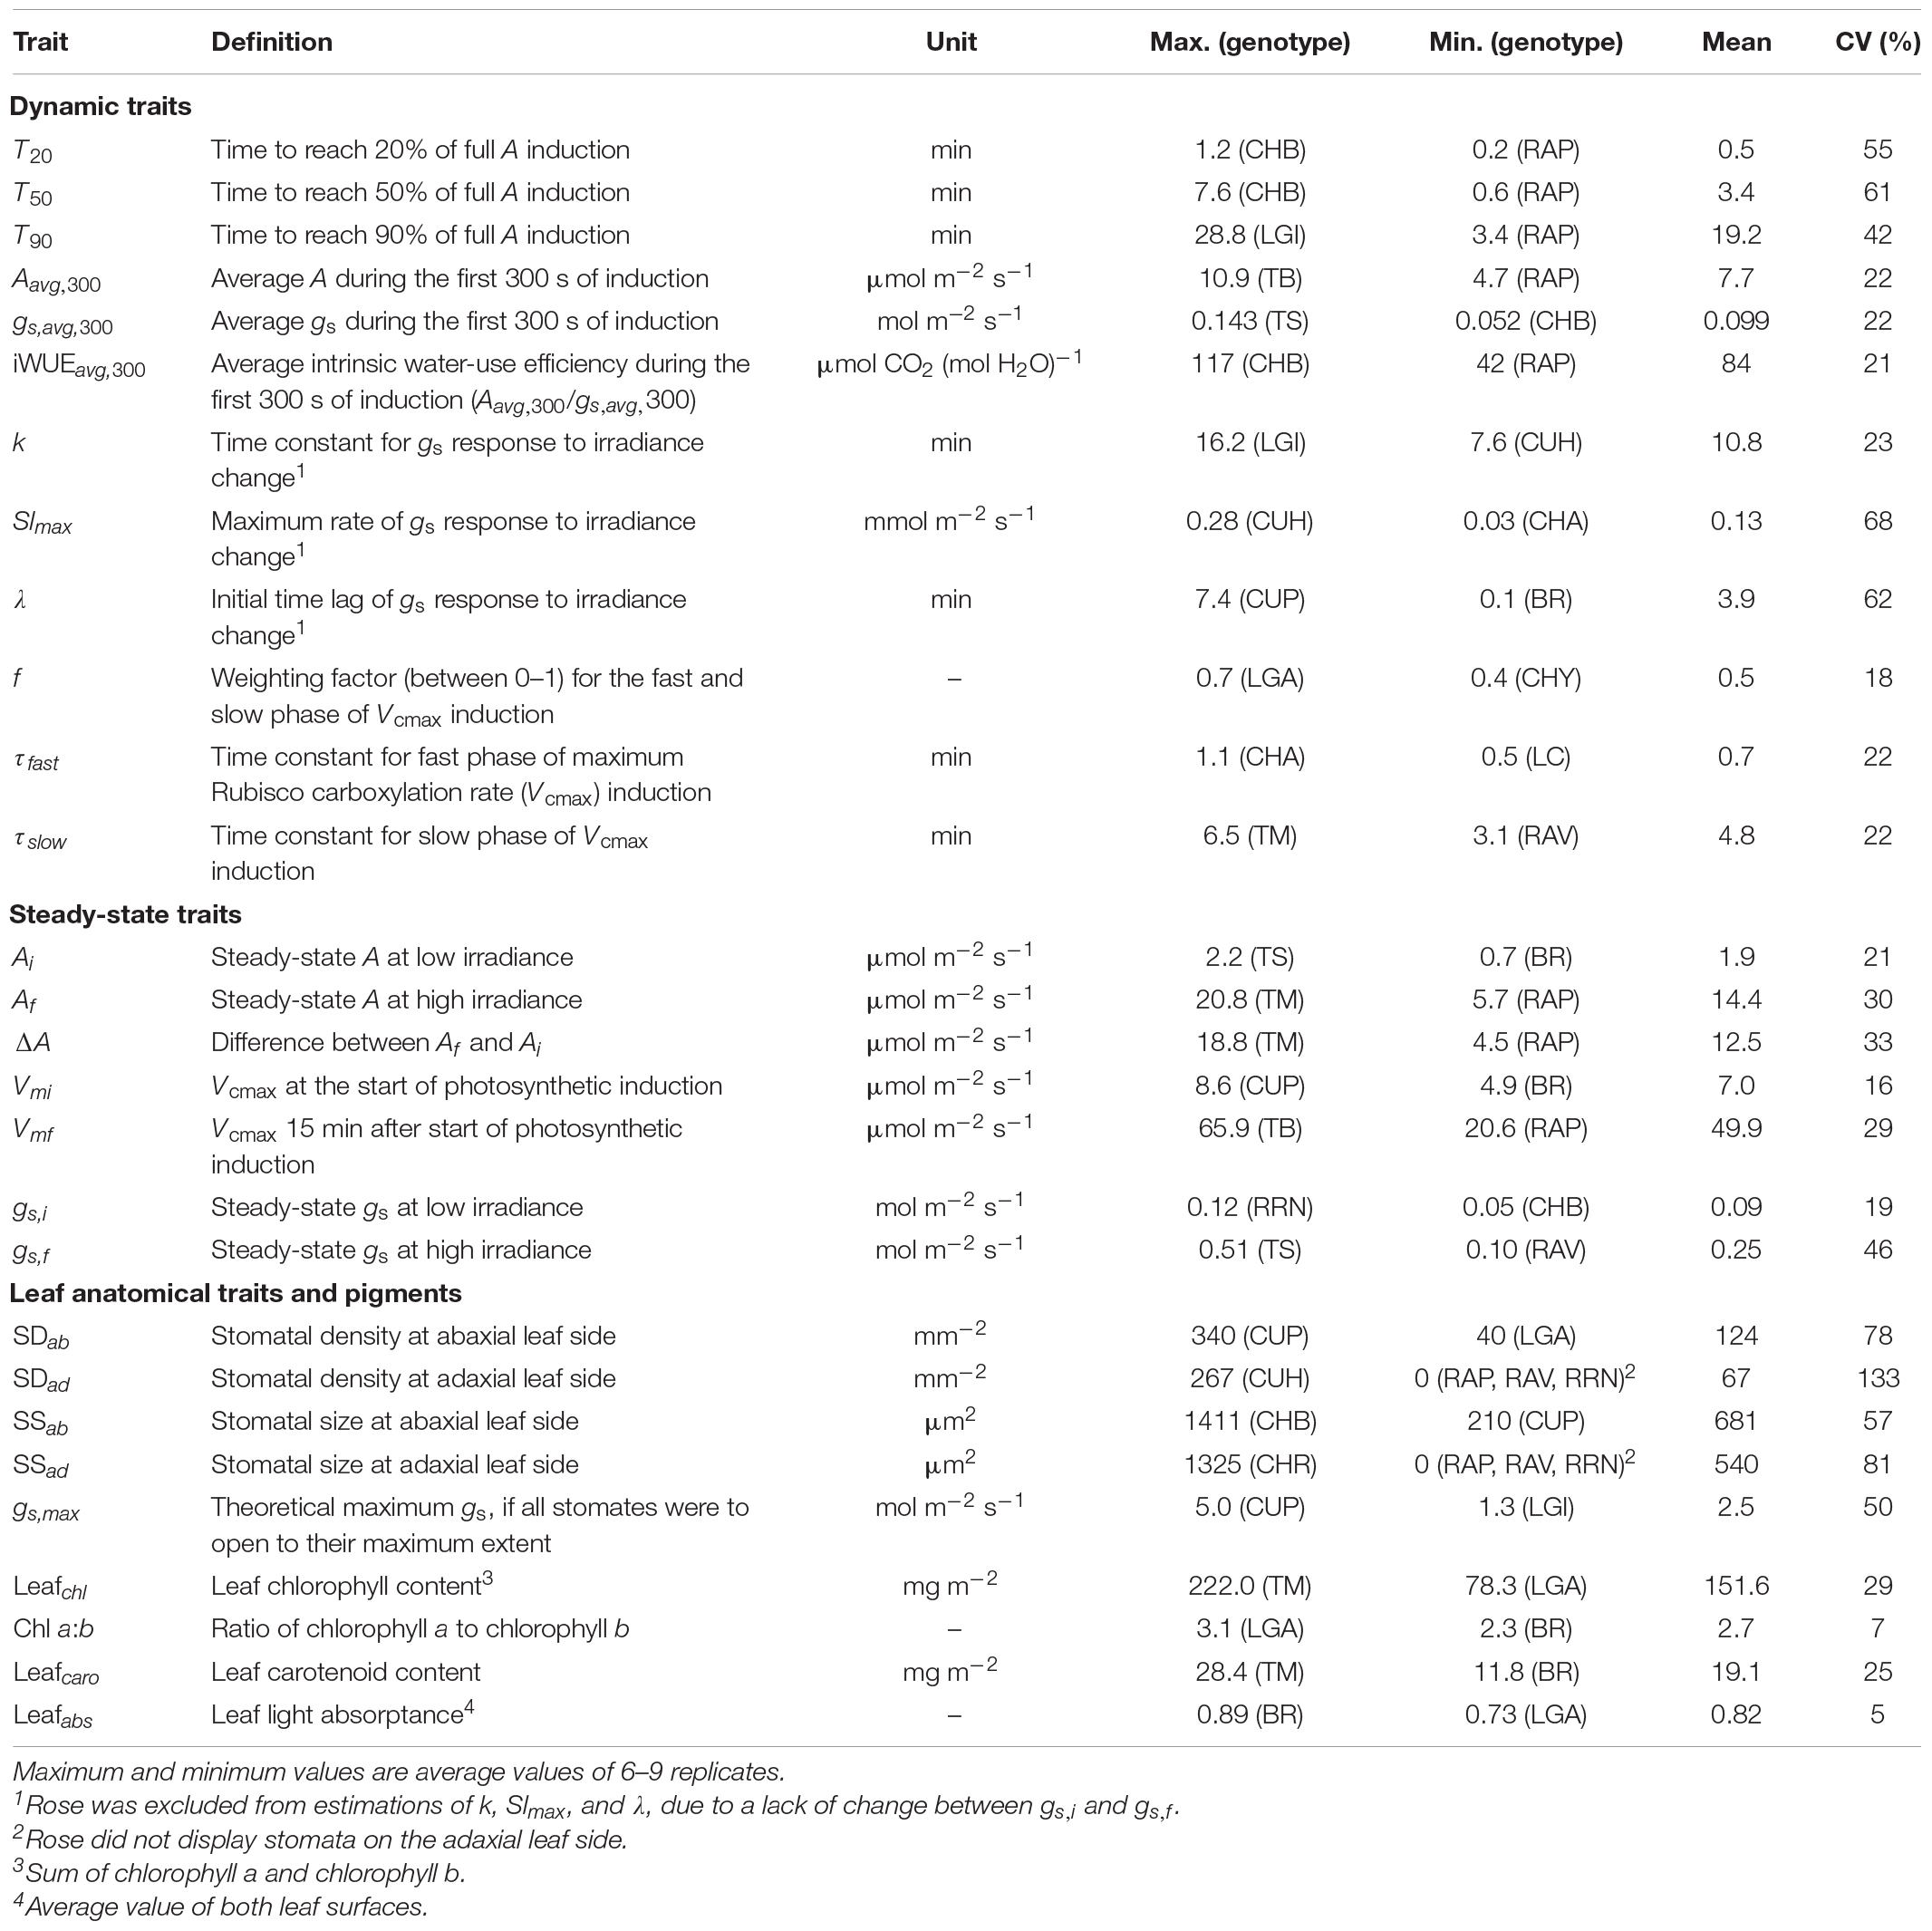
Table 2. Definition, unit, maximum, minimum, mean, and coefficient of variation (CV) for dynamic, steady-state, anatomical and physiological traits across 19 horticultural genotypes.
The kinetics of the gs response to increases of irradiance also varied substantially among genotypes (Figures 1D–F). The value of gs in rose barely responded to an irradiance increase; hence, gs,i and gs,f of rose cultivars were nearly identical (Figure 1E and Supplementary Figure 4). Therefore, the parameters representing the temporal response of gs (k, λ, and Slmax) were not estimated for rose. Values for the CV of k, Slmax, and λ (among the remaining 16 genotypes) were, respectively, 23, 68, and 62% (Table 2). Both tomato and cucumber tended to have fast gs increases, as well as exhibit stomatal oscillations (Figure 1F). Lettuce had medium Slmax, followed by chrysanthemum and basil, which had a relatively smaller Slmax (Figure 2C). The CV of average gs and water use efficiency in the first 5 min of A induction (gs,avg,300 and iWUEavg,300) were 22 and 21%, respectively, which were smaller than CV for most dynamic gs parameters (λ and Slmax; Table 2).
Additionally, steady-state A and gs varied strongly among genotypes (Figures 1A–C). Ai and gs,i had a CV of ∼20% each (Table 2). For Ai, basil had the lowest value and tomato the highest, while for gs,i, chrysanthemum showed the lowest value and rose showed the highest (Table 2). Steady-state A and gs at high irradiance (Af and gf) showed CV of 30 and 46%, respectively, with tomato showing the highest and rose the lowest Af and gs,f (Table 2).
Kinetics of Biochemical Parameters and Transient Limitations During Photosynthetic Induction
Based on dynamic A vs. Ci curves, the kinetics of Vcmax and J, as well as the stomatal and nonstomatal limitations to photosynthesis during A induction, were quantified (Figure 3 and Supplementary Figure 5). Both Vcmax and J induction kinetics varied between crops and cultivars of the same crop (Figures 3A,B and Supplementary Figures 5A,B). After 15 min in high irradiance, Vcmax and J of rose were the smallest, while tomato and chrysanthemum showed higher values for final Vcmax and J (Figures 3A,B). Interestingly, tomato and lettuce showed transient drops in Vcmax and J induction during the first 3 min after exposure to high irradiance (Figures 3A,B). Variations in time constants for Vcmax induction were smaller than those describing A induction. Both τfast and τslow had CV values of 22% (Table 2). Generally, τfast varied between 0.5 and 1 min, with chrysanthemum showing the largest τfast (Figure 4A). The values of τslow of basil, chrysanthemum, cucumber, and lettuce were generally around 5 min, and rose had the smallest τslow (3.1–3.6 min; Figure 4B). Surprisingly, large variations of τslow between cultivars were found in basil and tomato; basil cv. Eleonora (BEL) showed significantly smaller τslow than the other two basil cultivars, while tomato cv. Merlice (TM) showed a significantly larger τslow than the other two tomato cultivars (Figure 4B).
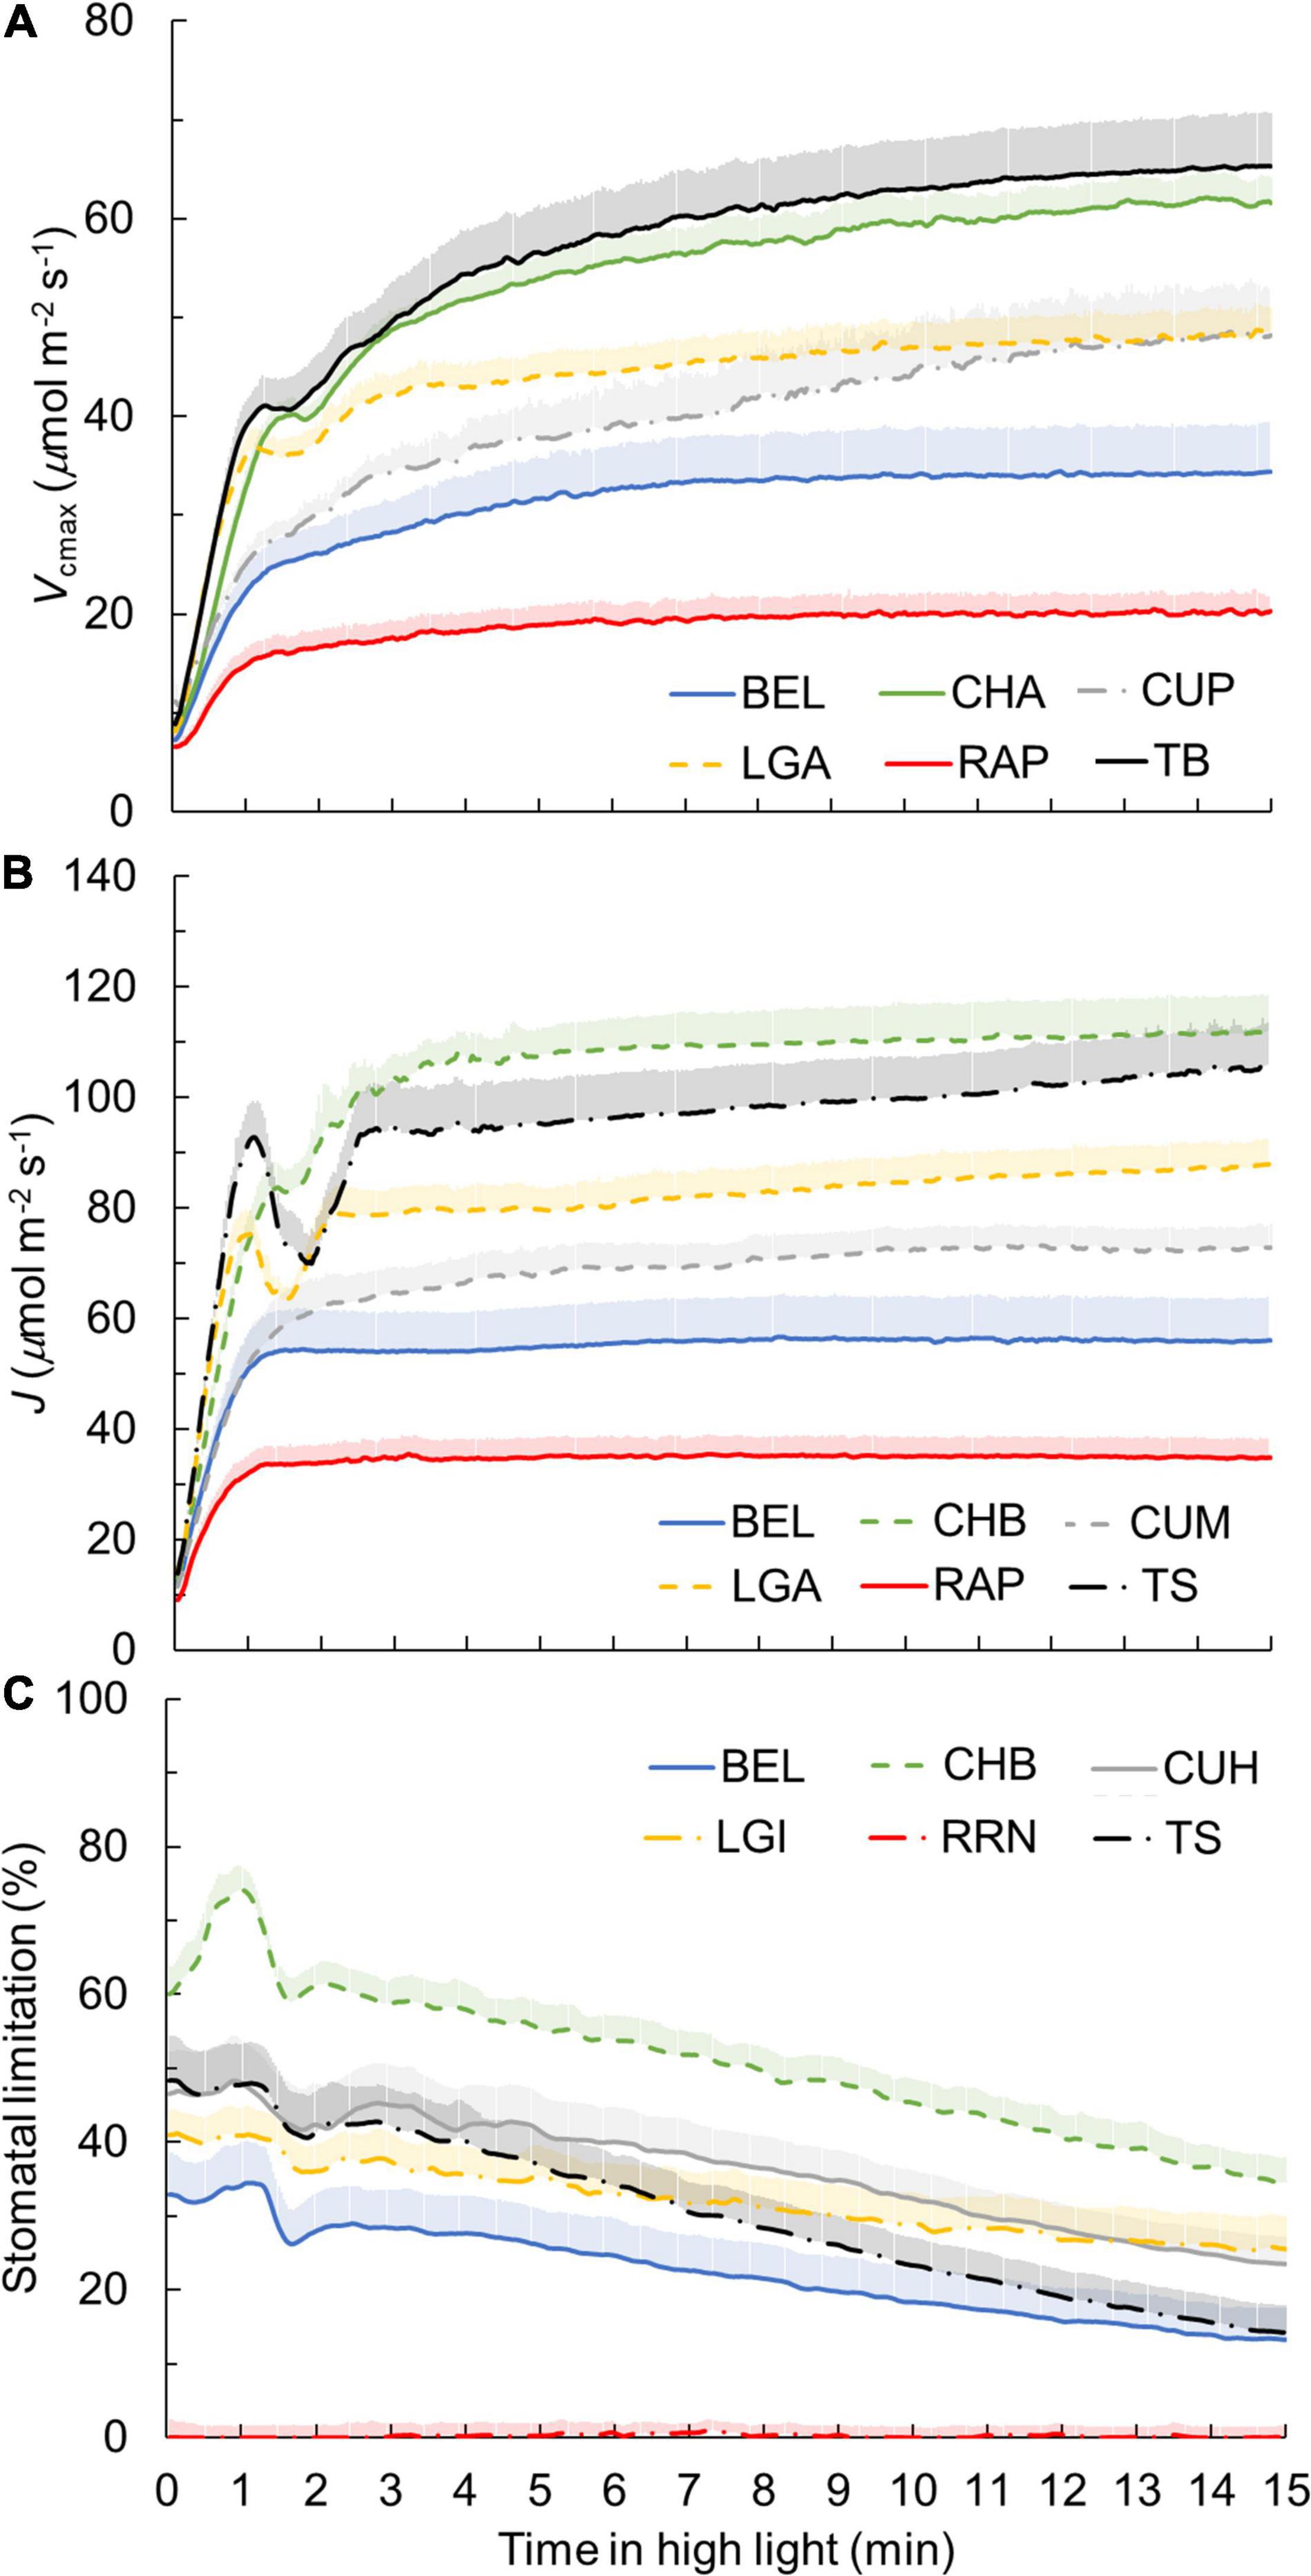
Figure 3. Dynamics of maximum Rubisco carboxylation rate Vcmax (A), electron transport rate J (B), and stomatal limitations for photosynthesis (C) during photosynthetic induction for six representative genotypes. Each curve represents the mean of 6–7 individual plants (mean + SE). Genotypes showing the smallest and largest value for a given trait among all genotypes, as well as cultivars with an intermediate response for their crop, are shown. Refer to Supplementary Figure 5 for representation of all 19 genotypes, as well as non-stomatal limitations for photosynthesis during photosynthetic induction.
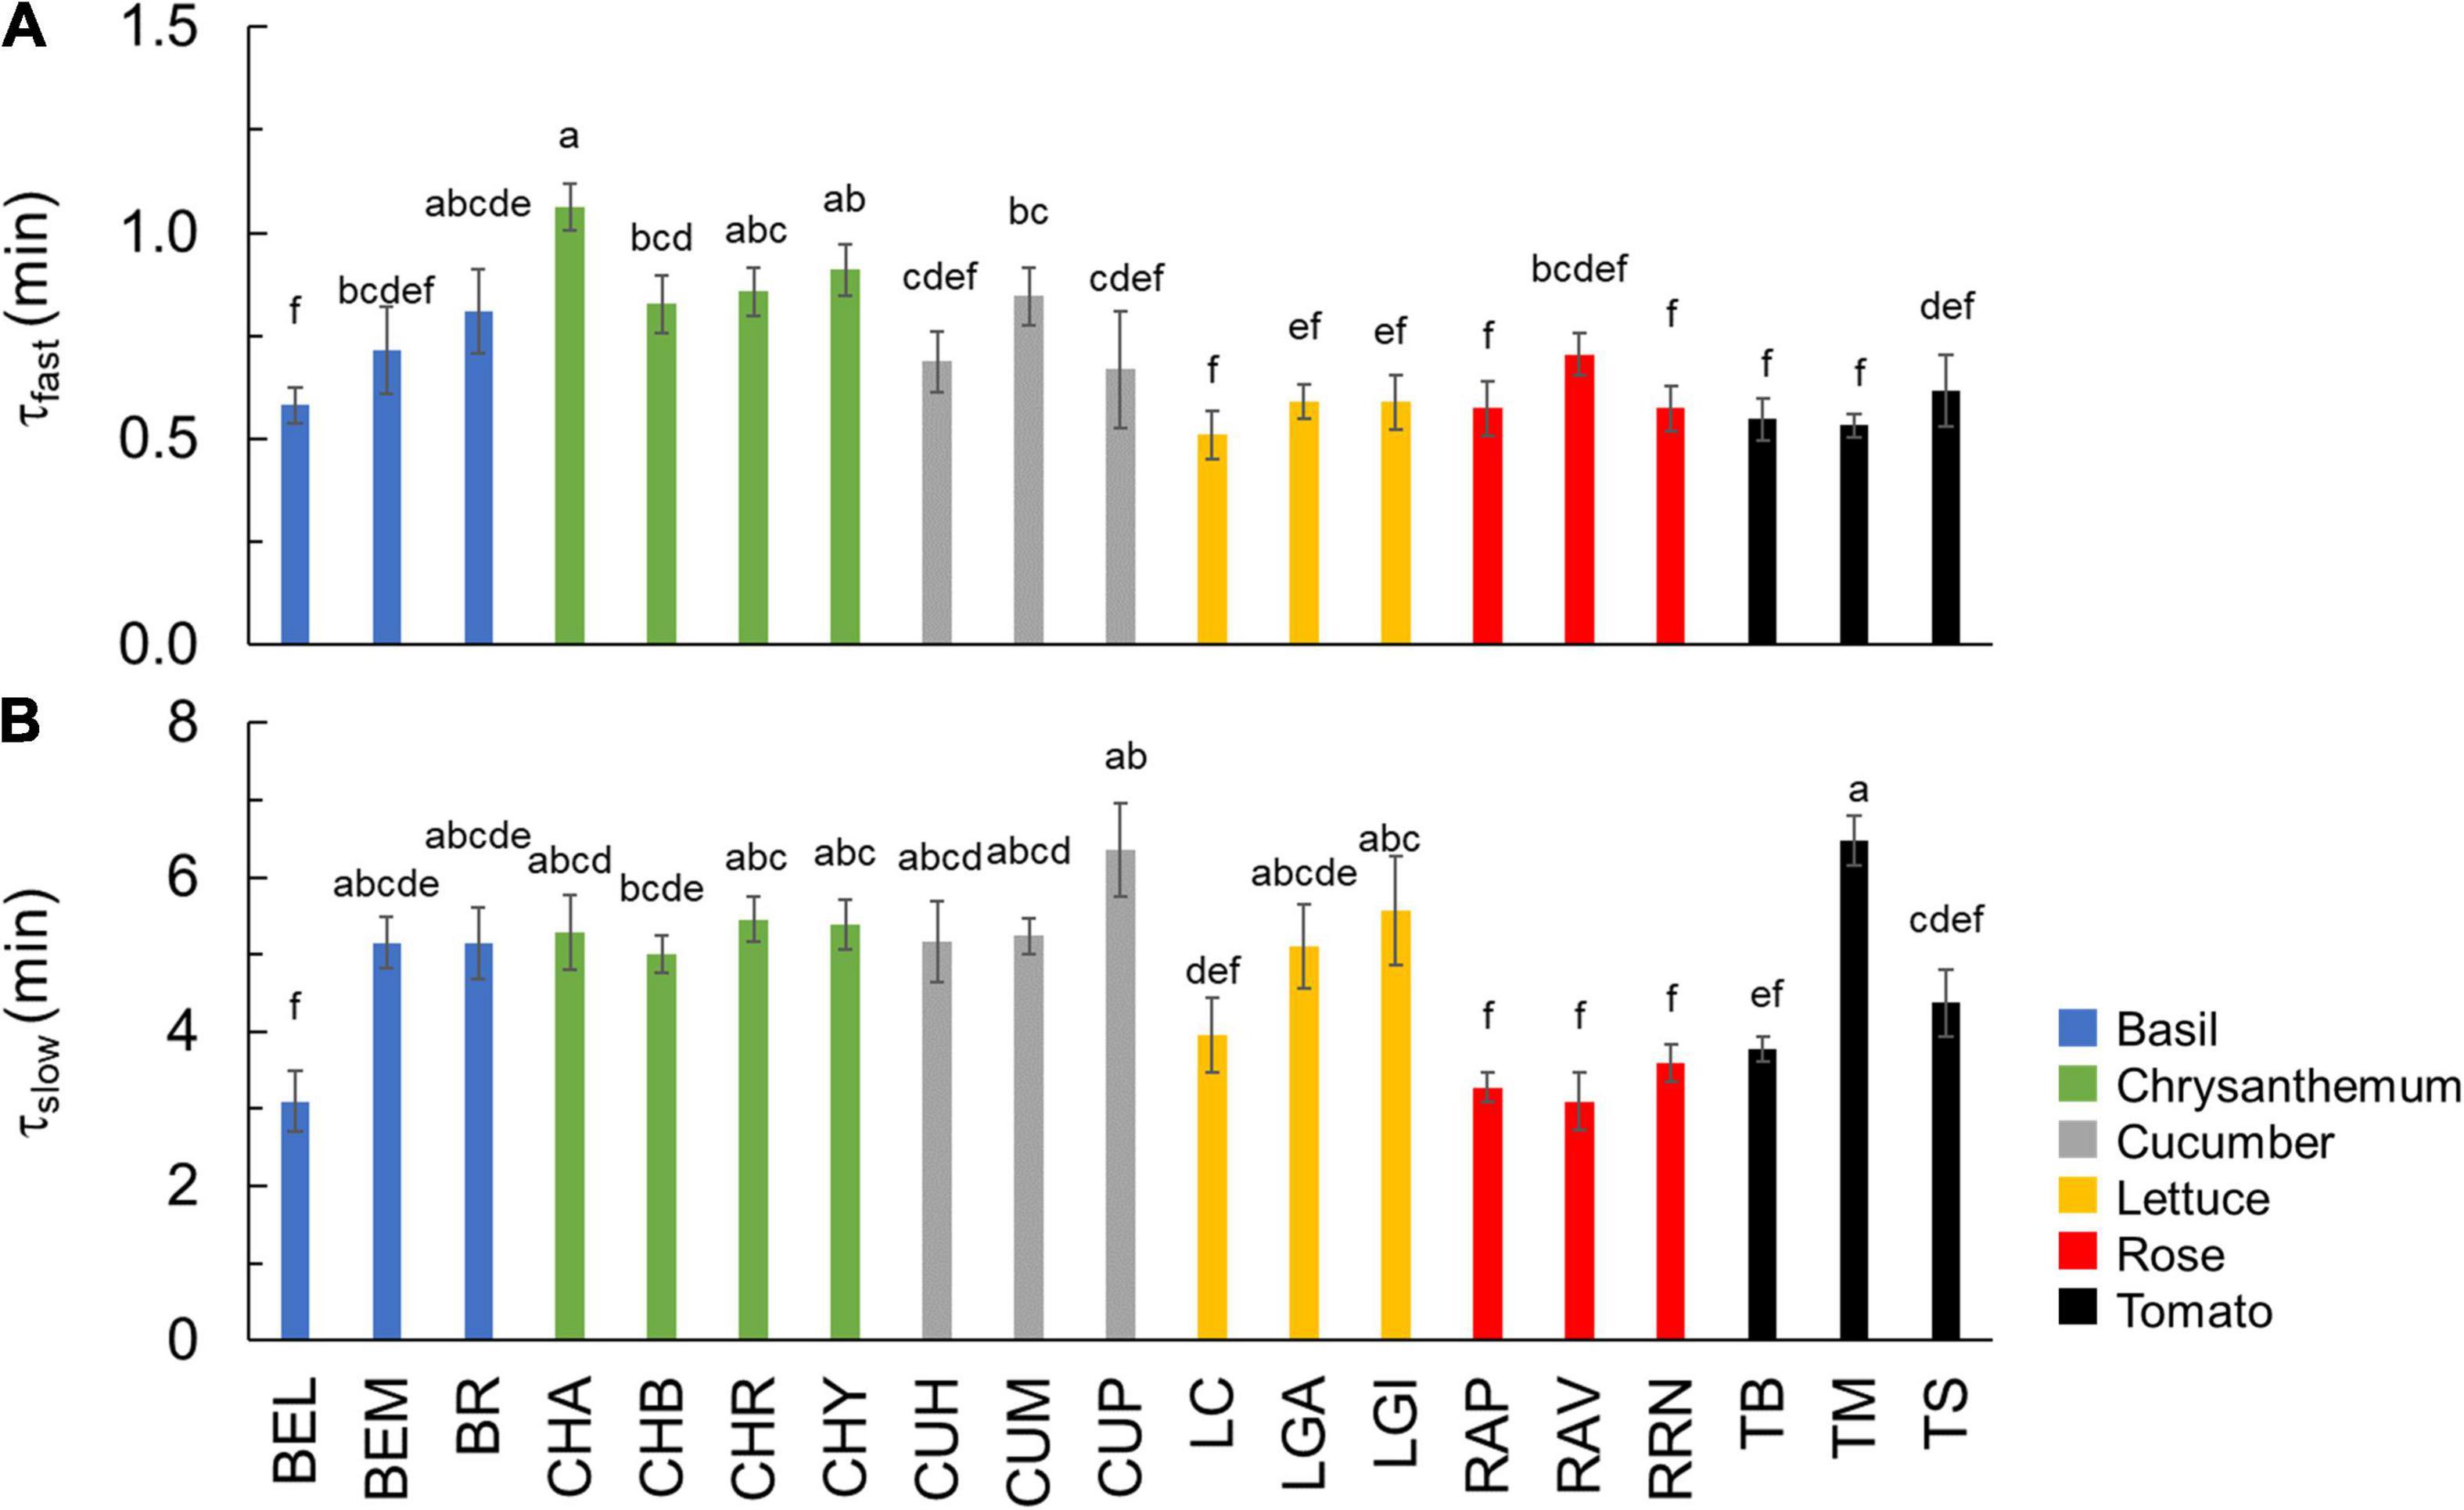
Figure 4. Time constants describing the fast (A: τfast) and slow (B: τslow) phase of Vcmax kinetics during photosynthetic induction. Colors indicate crop species. Bars show means ± SE (n = 6–7). Letters indicate significant differences (p < 0.05). Refer to Table 1 for full genotype names.
Within the first 15 min of exposure to high irradiance, transient non-stomatal and stomatal limitations of A induction showed substantial genotypic variation, with a greater variation in the level of transient stomatal limitation than in non-stomatal limitation (Figure 3C and Supplementary Figures 5C,D). Chrysanthemum showed the largest transient stomatal limitation among all crops, which went up to 70% during the first 1–2 min of induction and remained high (up to 40%) after 15 min in high irradiance (Figure 3C). Rose hardly exhibited any transient stomatal limitation during photosynthetic induction (Figure 3C), which can be explained by its non-responsive gs to an irradiance increase (Figure 1E). Tomato showed a fast decrease in transient stomatal limitation (from ∼50% to ∼10% in 15 min) after an irradiance increase (Figure 3C). Transient non-stomatal limitation decreased sharply in the first 4–5 min after an irradiance increase (Supplementary Figure 5C). Most genotypes showed a transient non-stomatal limitation at around 10% after 15 min in high irradiance, except for cucumber, which still had ∼20% nonstomatal limitation after 15 min of high irradiance (Supplementary Figure 5C). Some crops (basil, chrysanthemum, and tomato) also showed relatively large variations between cultivars for transient stomatal and nonstomatal limitations (Supplementary Figures 5C,D).
Genotypic Variation of Leaf Structural Traits
Stomatal density and size showed large CV, especially adaxially, and this was partly due to the fact that the rose had no stomata at the adaxial side (Table 2). The CV of stomatal density and size at the leaf abaxial side were, respectively, 78 and 57% (Table 2). Generally, large variation in the stomatal density and size occurred between crop species, while the variation between cultivars was relatively small (Figures 5A,B). Chrysanthemum had the largest, and cucumber had the smallest stomata (Figure 5A). Both chrysanthemum and lettuce had low stomatal density, while cucumber had the highest stomatal density (Figure 5B). These large variations in the stomatal density and size resulted in large variation in theoretical maximum stomatal conductance (gs,max): the CV of gs,max was 50%, with cucumber showing the highest gs,max (up to ∼5 mol m–2 s–1), followed by tomato (up to ∼4 mol m–2 s–1), and lettuce, having the lowest gs,max (∼1 mol m–2 s–1; Figure 5C and Table 2).
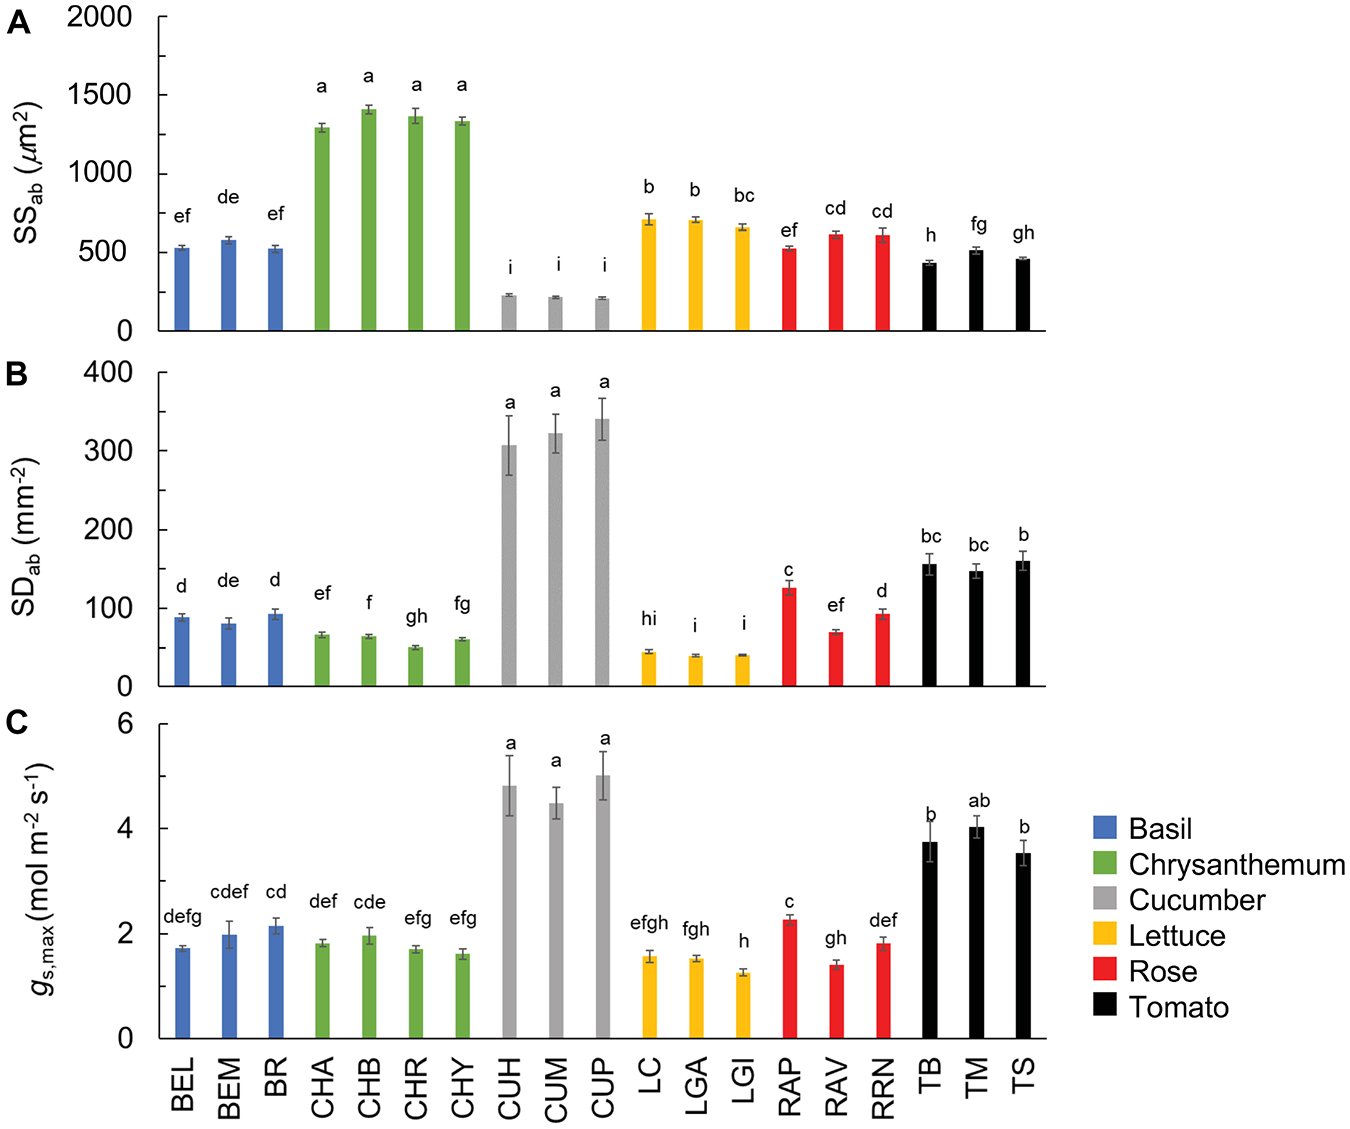
Figure 5. Stomatal size (A; SSab) and density (B; SDab) at the abaxial leaf side, and theoretical maximum stomatal conductance (C; gs,max) of all 19 horticultural genotypes. Colors indicate crop species. Bars show means ± SE (n = 7–9). Letters indicate significant differences (p < 0.05). Statistical test results of SSab, SDab, and gs,max were based on log-transformation of the data. Refer to Table 1 for full genotype names.
Using values of gs,max and observed gs during photosynthetic induction (Figures 1D–F), absolute pore area opening was calculated. Kinetics of absolute pore area opening during A induction varied substantially between crops (Figures 6A–C). In cucumber leaves, individual pore area was found to be increased from ∼1 to ∼3 μm2 after 30 min in high irradiance, resulting in an increase of gs from about 0.1 to 0.3 mol m–2 s–1 (Figure 6C and Supplementary Figure 4). The pore area of tomato was calculated to increase more strongly, from ∼4 to ∼16 μm2, leading to a gs increase from about 0.1 to 0.4 mol m–2 s–1 (Figure 6C and Supplementary Figure 4). In contrast, the pore area of chrysanthemum and lettuce required a larger extent of opening to achieve a comparable gs increase with cucumber and tomato from ∼18 to ∼36 μm2 in chrysanthemum and from ∼10 μm2 to ∼29 μm2 in lettuce (Figures 6A–C).
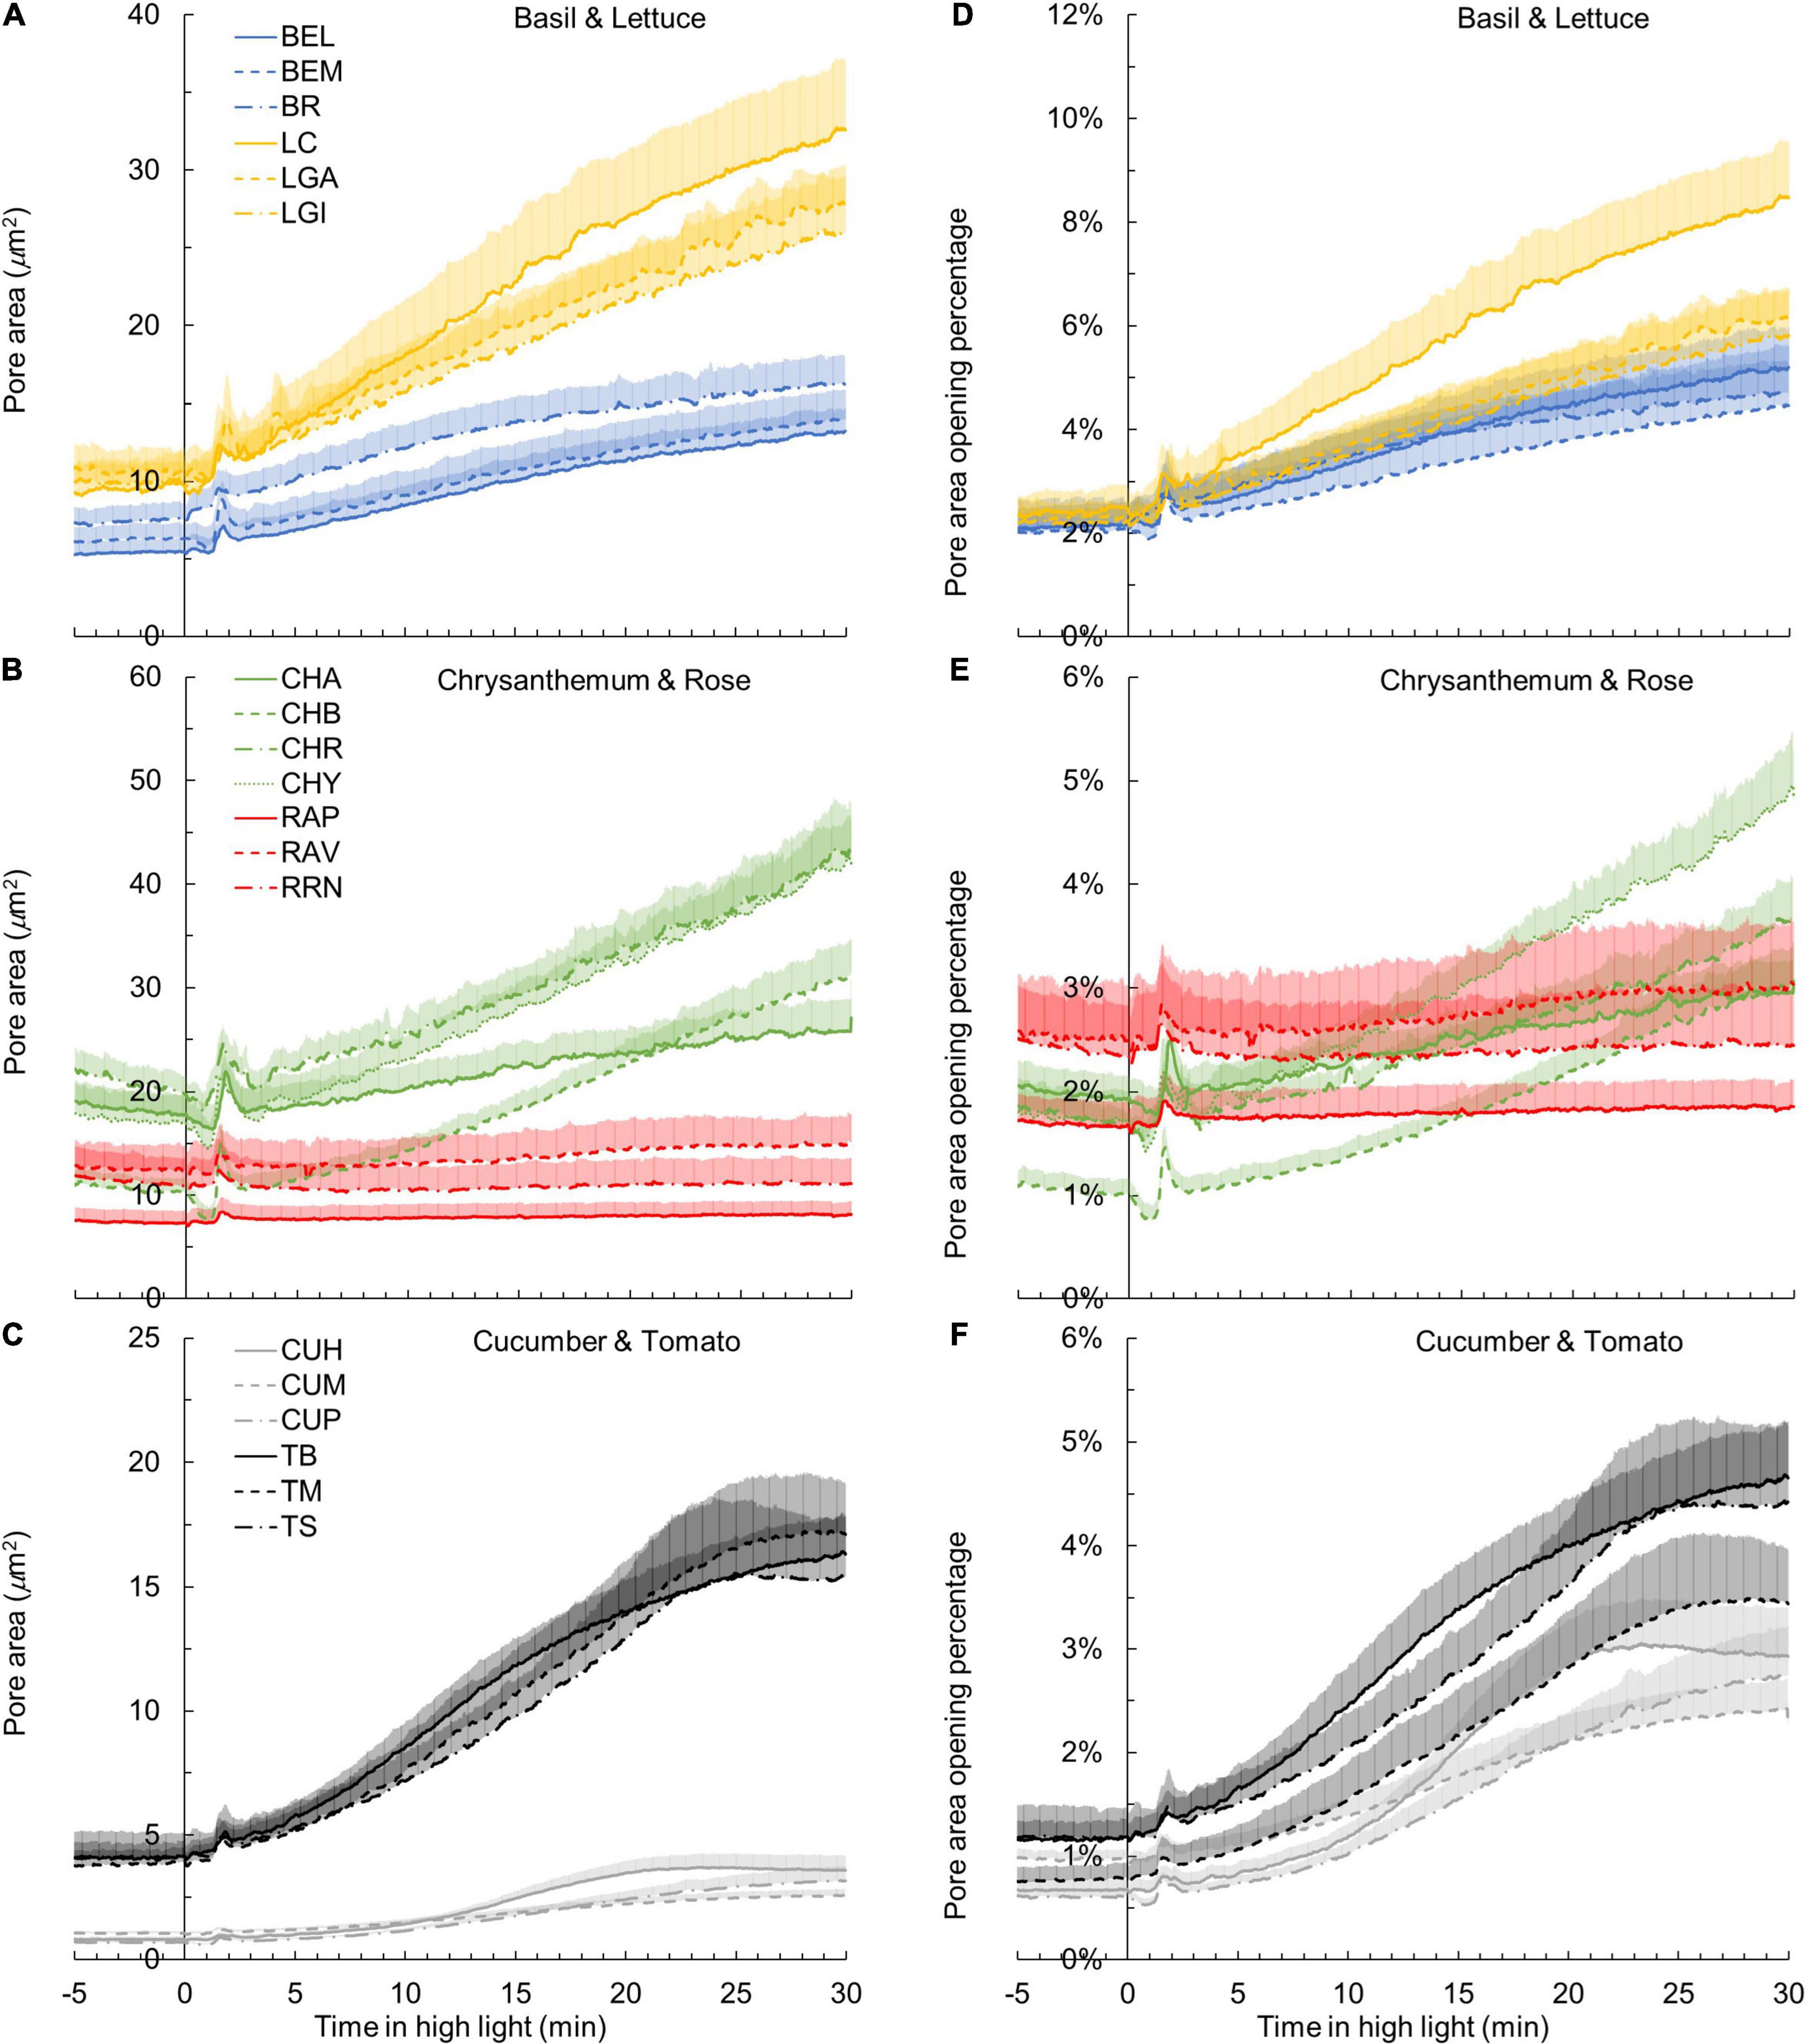
Figure 6. Kinetics of pore area opening (A–C) and pore area opening as a percentage of the theoretical maximum pore area (D–F) in response to a single-step change in irradiance in 19 horticultural genotypes (A,D: basil and lettuce; B,E: chrysanthemum and rose; C,F: cucumber and tomato; refer to Table 1 for full genotype names). Time zero indicates the moment when irradiance was increased from 50 to 1000 μmol m–2 s–1. Line colors represent crop species, while line types differentiate between cultivars. Each curve represents the mean of 7–9 individual plants (mean + SE).
Surprisingly, when calculating the percentage of pore area opening relative to the maximum pore area, variation between crops was much smaller than for other traits (Figures 6D–F). During photosynthetic induction, all genotypes opened their stomata by less than 10% of the theoretical maximum pore area (calculated from pore length; Figures 6D–F). For example, the absolute pore area after 30 min in high irradiance reached ∼40 μm2 in chrysanthemum (which was the largest among all crops), which only accounted for 3–5% of the maximum pore area (Figures 6B,E). The pore area of cucumber only reached ∼3 μm2 after 30 min in high irradiance, which was also ∼3% of the maximum pore area (Figures 6C,F).
Leaf pigment concentrations showed relatively less variation among genotypes compared with most stomatal traits, with a CV of 25–30% for chlorophyll and carotenoid contents (Table 2). Since leaf color differed between cultivars (e.g., purple leaves in BR and brownish leaves in LGI), pigment types varied between crop species and cultivars (Supplementary Figures 6A,B). The chlorophyll a:b ratio showed little genotypic variation (CV: 7%), and an average of 2.7 across genotypes (Table 2). Leaf light absorptance was even more conserved, with a CV of 5%, the lowest value among all traits (Table 2). Small but significant differences in leaf light absorptance occurred between crop species, whereas variations between cultivars were not found, except for basil and lettuce which had cultivars (BR and LGI) with different leaf colors (Supplementary Figure 6C).
Trait Correlations
Generally, steady-state gas exchange traits correlated well with one another (e.g., gs,f vs. Af, Vmf vs. Af), as did dynamic traits (e.g., k vs. T90; Figure 7). Some steady-state traits also correlated well with dynamic traits (e.g., Slmax vs. gs,f; Figure 7). Importantly, we identified key traits that showed strong correlations with indicators of the rate of photosynthetic induction (i.e., T20, T50, or T90); these key traits were relevant to either stomata and their rate of movement (gs,i and k) or Rubisco activation (f, τslow, and Vmf) (Figure 8). Furthermore, these traits represented either dynamic (f, τslow, or k) or steady-state traits (gs,i or Vmf), suggesting that both types of the trait were relevant for the rate of photosynthetic induction. The value gs,i correlated negatively with T20 and T50 (Figures 8A,C). T20 was also correlated with f, and T50 was correlated with τslow (Figures 8B,D). Both k and Vmf were positively correlated with T90, and k and T90 showed an especially strong linear correlation (Figures 8E,F). Given the strong correlations between photosynthetic induction traits (T20, T50, and T90) and stomatal parameters (gs,i or k), we further tested whether stomatal conductance-related parameters were correlated with traits characterizing stomatal anatomy (stomatal size and density). The stomatal size was not correlated with either gs,i, k, or Slmax, but was negatively correlated with stomatal density across species (except for chrysanthemum, which had large stomates; Supplementary Figures 7A–D). Interestingly, there was a very strong linear correlation between stomatal size on the abaxial side with that on the adaxial side of the leaf (Supplementary Figure 7E), with stomatal size on the adaxial leaf surface being ∼93% of the size on the abaxial leaf surface for all species except for rose.
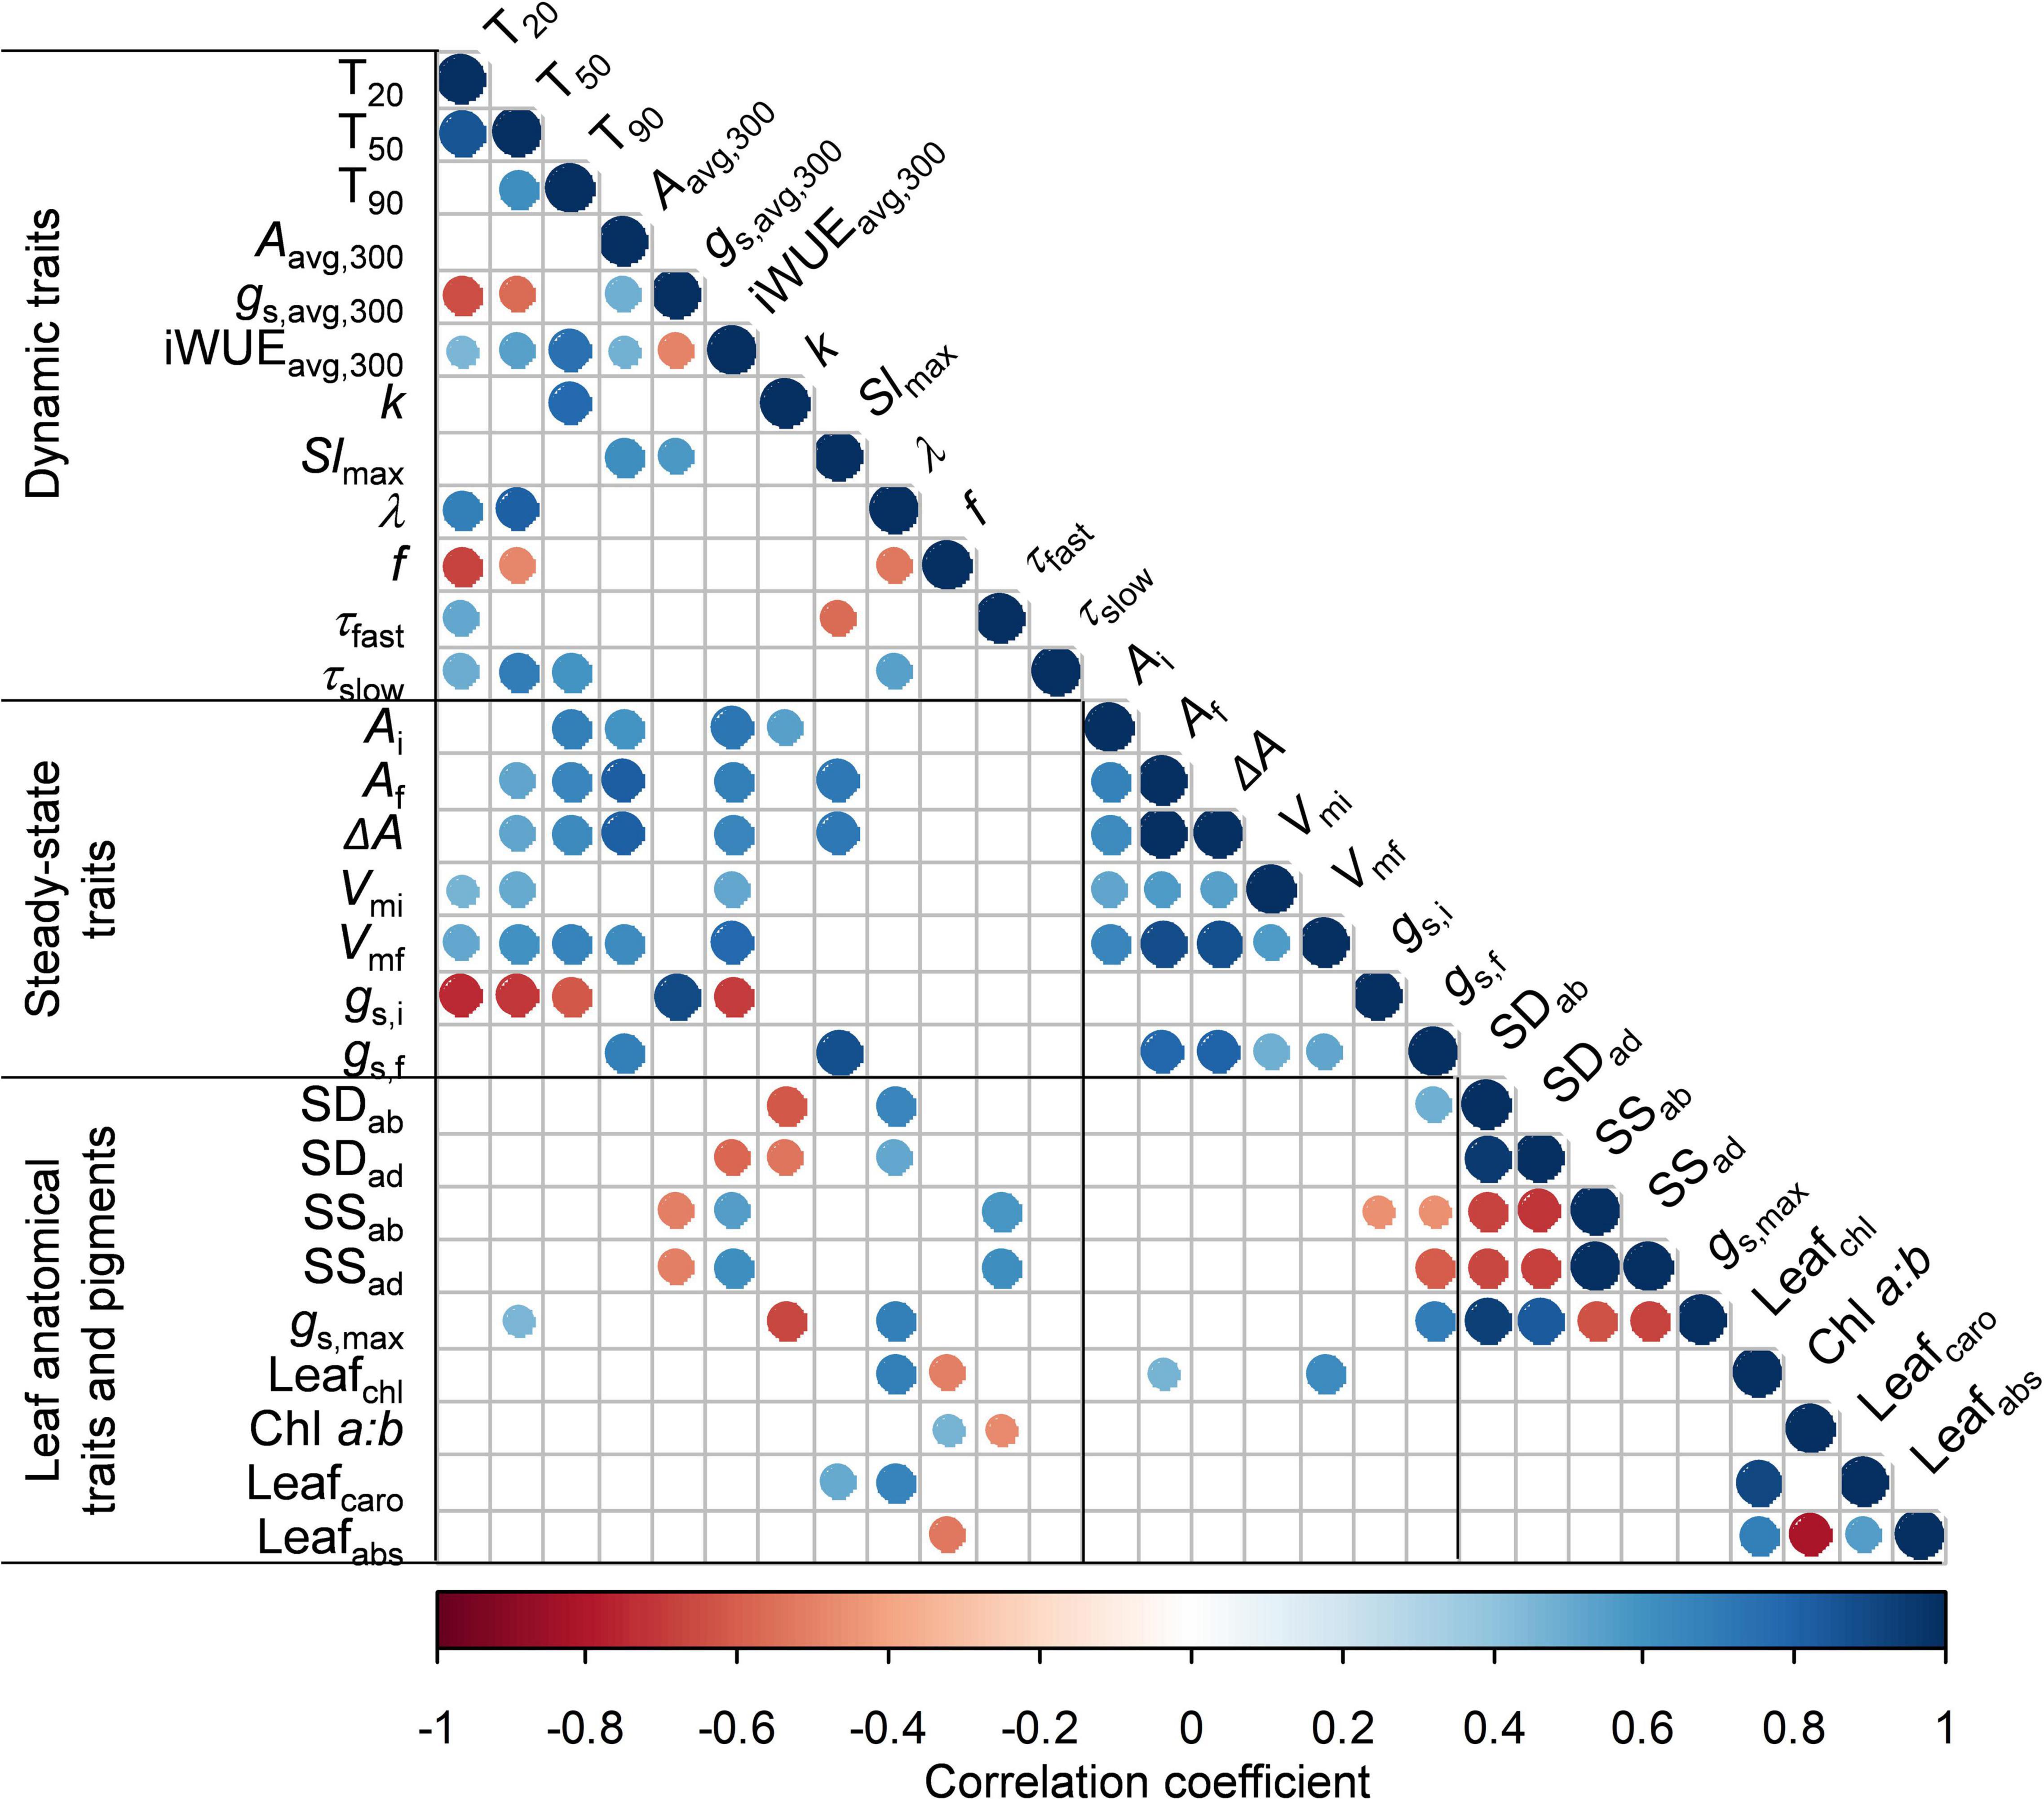
Figure 7. Correlation matrix among all traits measured in this study. Statistically significant (p < 0.05) negative linear correlations are shown in red, significant positive correlations are shown in blue, insignificant correlations are left blank. For definitions and units, refer to Table 2. Correlation coefficients and p-values for each correlation are given in Supplementary Table 3.
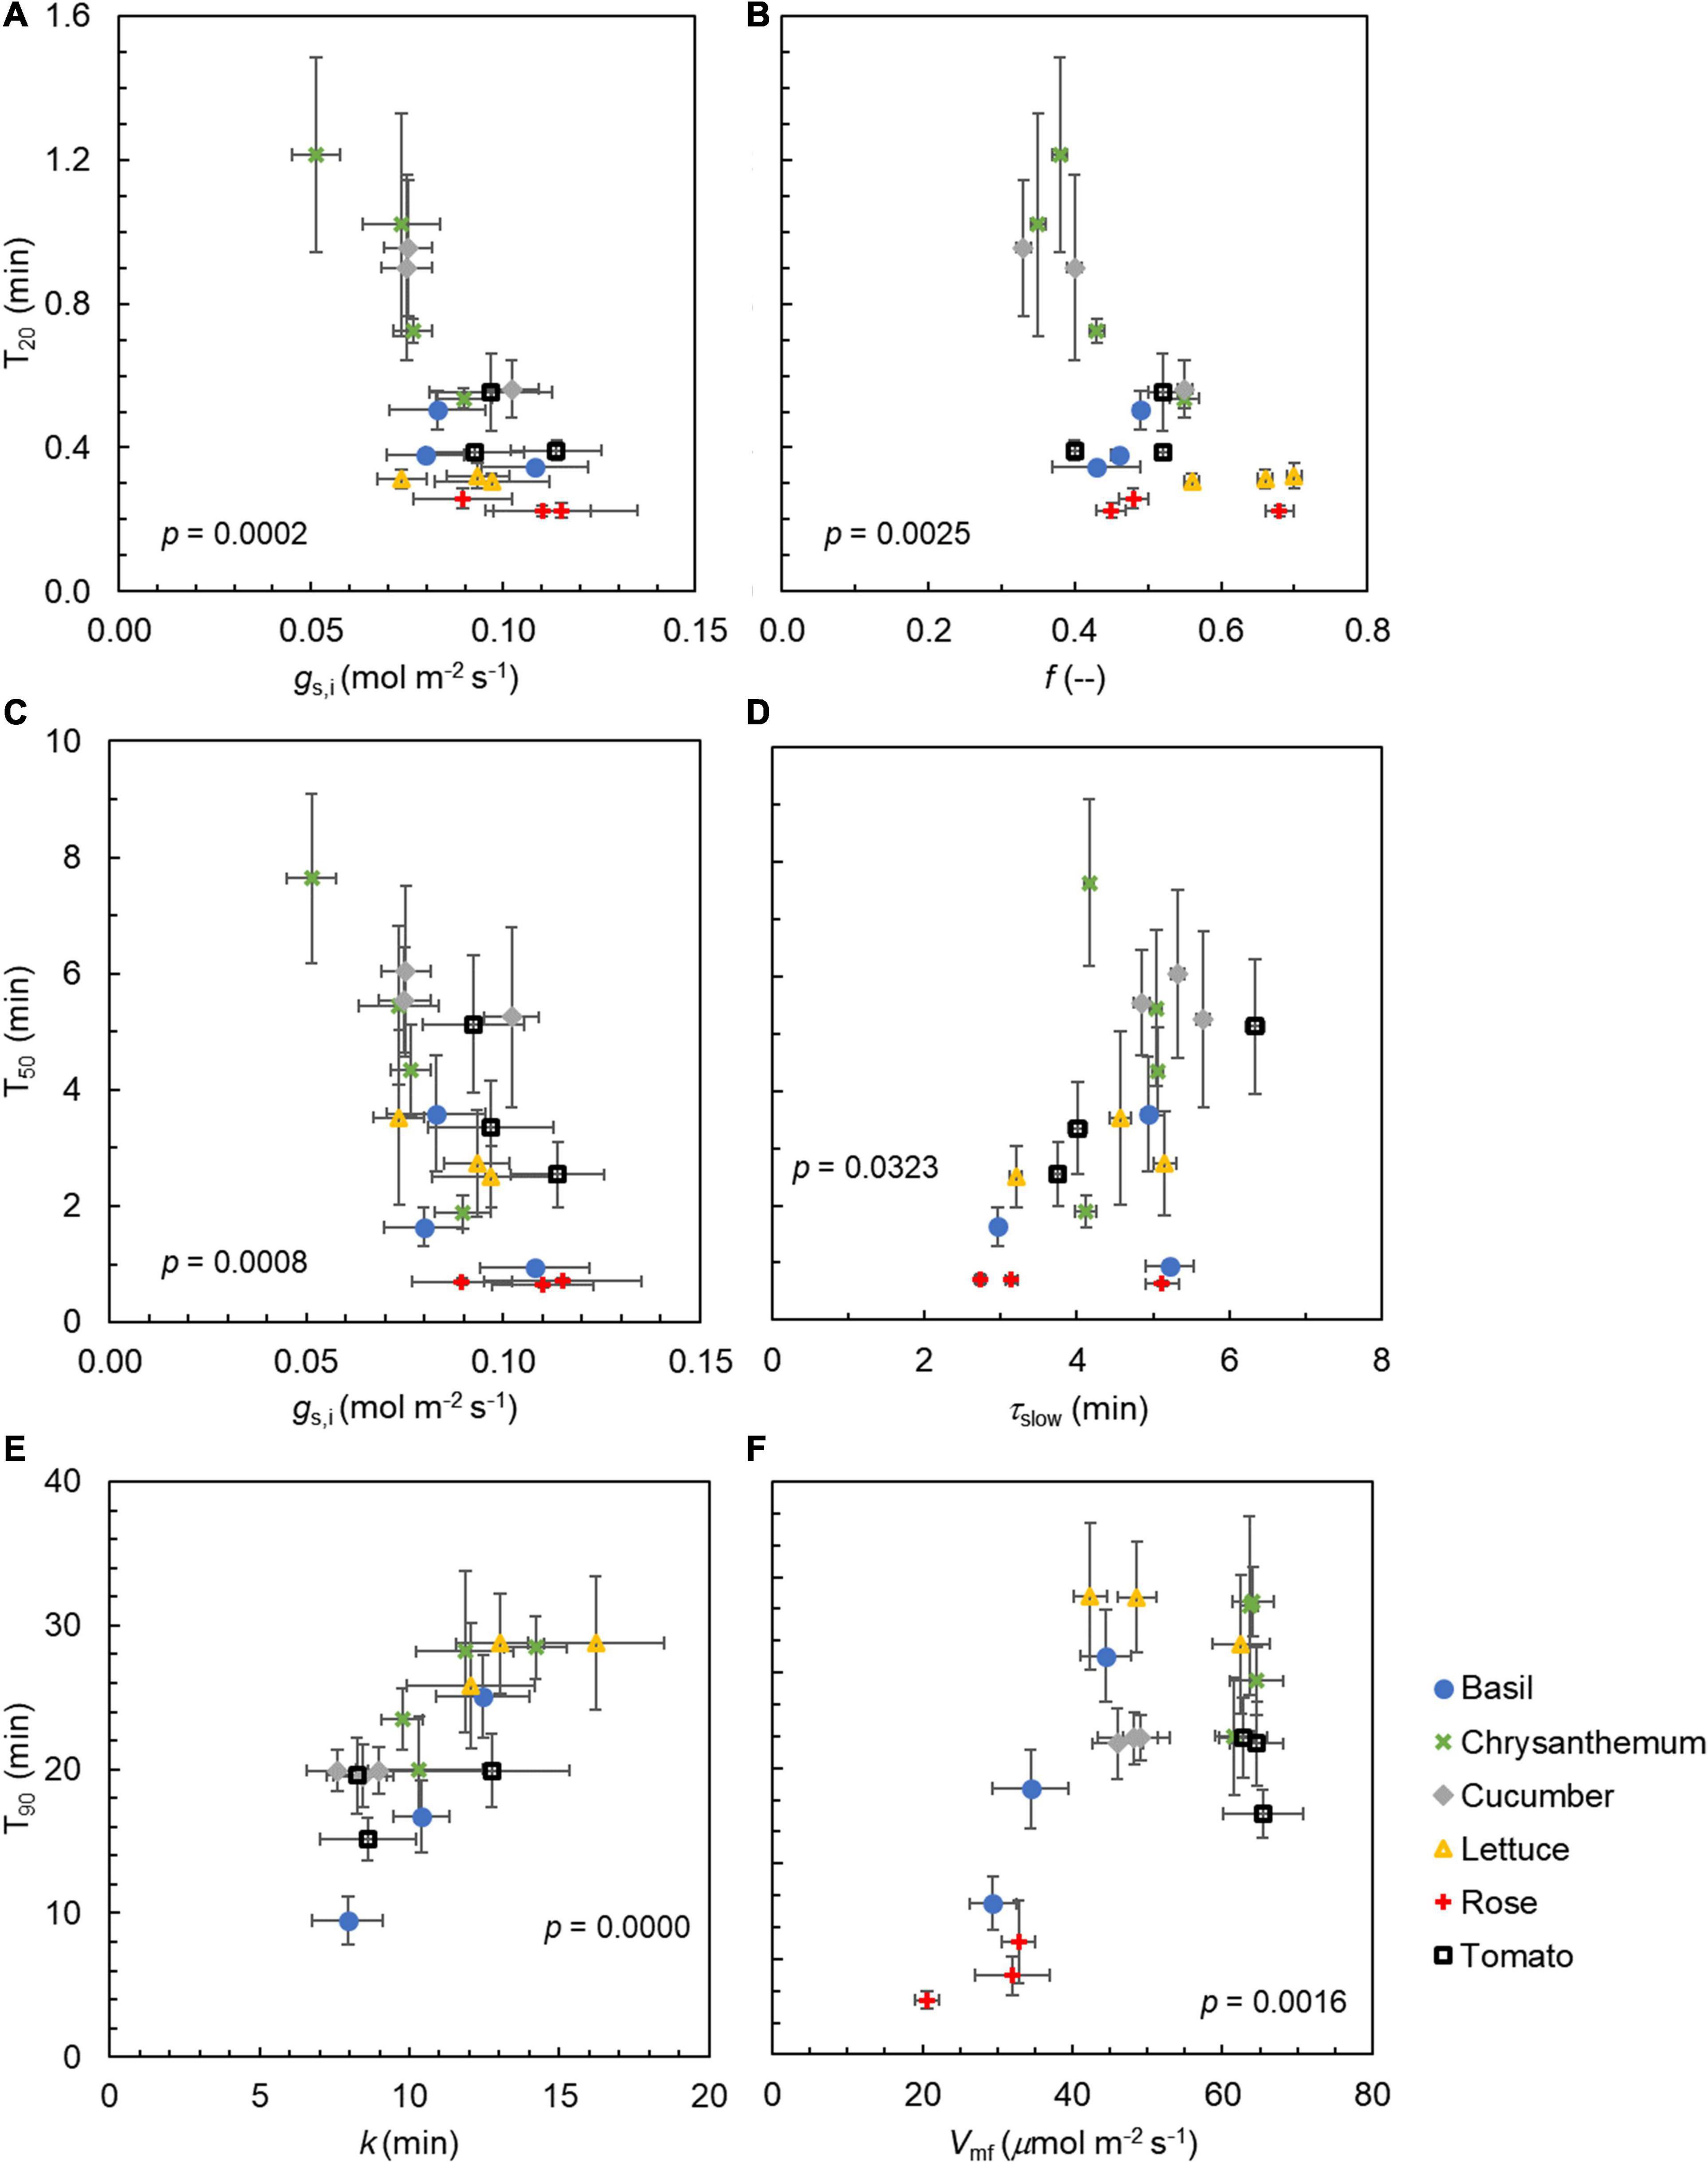
Figure 8. Relationships between (A) initial stomatal conductance in low irradiance (gs,i) and time to reach 20% of full photosynthetic induction (T20), (B) the weighting factor f describing the kinetics of maximum Rubisco carboxylation rate (Vcmax) during photosynthetic induction and T20, (C) gs,i and time to reach 50% of full photosynthetic induction (T50), (D) the time constant for the slow phase of Vcmax induction (τslow) and T50, (E) time constant k for stomatal opening and time to reach 90% of full photosynthetic induction (T90), and (F) final Vcmax under 15 min of high irradiance (Vmf) and T90. Datapoints are means ± SE (n = 6–9). Values shown are p-values of Pearson correlation. Data for rose is not presented in (E) due to absence of stomatal movement.
Discussion
Large Variation in Induction Kinetics Exists in Major Horticultural Species
Increasing the rate of photosynthesis is expected to increase crop yields (Ort et al., 2015; Simkin et al., 2019). Although the harvested product for horticultural crops can be very different from staple food crops, e.g., fresh flowers, fruits, and flavor additives, biomass production (thus photosynthesis) remains the basis for high yield and good product quality. For example, flower number was positively correlated with plant dry weight in chrysanthemum (Carvalho and Heuvelink, 2003), and extra assimilates contributed by the canopy improved the stem quality of cut-rose (Zhang et al., 2020). Therefore, increasing photosynthesis is important for optimizing horticultural crop production, especially where growth in most crops can be assumed to be a source rather than sink limited for most of the production season (Marcelis, 1994; Li et al., 2015).
Natural genetic variation is an important resource for breeding. The genotypic variation of photosynthesis has been examined widely regarding its steady-state traits (Flood et al., 2011). However, steady-state photosynthesis does not provide an accurate representation of operating photosynthesis under fluctuating light (which often happens in the field and greenhouses, e.g., Supplementary Figure 1), given that time constants of induction/relaxation of photosynthesis reduce the time-integrated rate of carbon fixation (Kromdijk et al., 2016; Morales et al., 2018). Speeding up photosynthetic induction has been suggested as an important breeding target (Tanaka et al., 2019; Qu et al., 2020). Large genotypic variation of photosynthetic induction has been found in field crops (e.g., rice, wheat, soybean, and cassava) and woody species in forestry systems, proving that breeding for improving the dynamic crop photosynthesis is feasible (Valladares et al., 1997; Soleh et al., 2017; Salter et al., 2019; Acevedo-Siaca et al., 2020; De Souza et al., 2020). Here, we show that a large genotypic variation in photosynthetic induction also exists between major horticultural crops, and generally this variation for dynamic traits is larger than the variation for steady-state traits. Also, variation between crops in photosynthetic induction was generally larger than the variation between cultivars of the same crop.
Variation of photosynthetic induction in these 19 horticultural genotypes was quantified under near-optimal conditions, i.e., climate control management in the greenhouse was done similarly as in commercial greenhouse production. This is similar to other studies that aimed to quantify genotypic variation in crops, such as rice and cassava (De Souza et al., 2020; Acevedo-Siaca et al., 2021). However, abiotic stresses often occur during crop growth, not only in the field but also in low-tech greenhouses. When testing a genotypic variation of steady-state photosynthetic traits under both well-watered and drought conditions, drought accounted for a larger proportion of total variation compared with the genotypic variation (Gu et al., 2012). Genotypic variation of dynamic photosynthetic traits could potentially be coupled with variations induced by environmental fluctuations other than irradiance. For example, genotypic variation in intrinsic water-use efficiency found in our and other studies (Acevedo-Siaca et al., 2021) could lead to different crop performance between genotypes when drought occurs. Additionally, a recent study suggested that taking into account photosynthetic induction effects led to a reduction of 2–7% in the estimation of daily carbon gain (Murakami and Jishi, 2021), which is much smaller than the estimation error predicted by earlier studies (Naumburg and Ellsworth, 2002; Taylor and Long, 2017) and in real measurements (Adachi et al., 2019). The patterns of irradiance fluctuations appear to be very important in determining the discrepancy between simulating daily carbon gain with and without the effects of photosynthetic induction (Murakami and Jishi, 2021). However, only few studies quantified irradiance fluctuations in greenhouses at the relevant time scales (van Westreenen et al., 2020), hampering such estimations for the greenhouse production context. Moreover, previous irradiances potentially affect photosynthetic induction responses to the upcoming irradiance (Jackson et al., 1991; Kaiser et al., 2017). Further studies are needed to quantify the genotypic variation of dynamic photosynthesis under stress conditions and to evaluate their importance in different irradiance fluctuation patterns under greenhouse conditions with considering photosynthetic induction rates across different irradiances.
Variation in Photosynthetic Induction of Horticultural Crops Is Mostly Driven by Differences in Stomatal Traits
Photosynthetic induction is mainly regulated by three transient limitations: RuBP regeneration, Rubisco activation, and stomatal opening (Pearcy, 1953). We found large (CV up to 68%, Table 2) genotypic variation in the kinetics of stomatal responses to an irradiance increase, compared to the genotypic variation in the other two limitations. A large variation in the stomatal opening time was also found across 15 vascular plants including fern, gymnosperm, and angiosperm species (Deans et al., 2019), indicating that strong genotypic variation of stomatal response kinetics exists in many species. In our study, Slmax was 0–0.3 μmol m–2 s–2, and values for k varied between 8 and 16 min (Table 2). These values of Slmax and k are within the range of those found for other species that had partially grown and evolved outdoors (McAusland et al., 2016), suggesting that the specific indoor growth conditions horticultural crops experienced do not influence the rapidity of stomatal opening. Faster stomatal opening tends to speed up photosynthetic induction (Shimadzu et al., 2019; Yamori et al., 2020), and our results showed a strong linear correlation between k and T90 (Figure 8E), indicating that genotypes that require less time to open their stomata reach full photosynthetic induction faster. The strong correlation between the time constants of stomatal opening and the time to approach full photosynthetic induction also suggests that stomatal effects are typically the major ones left in the later phase of photosynthetic induction. Moreover, a higher initial gs before an irradiance increase led to a faster speed of photosynthetic induction (Figures 8A,C), which is confirmatory of many previous studies (Soleh et al., 2017; Kaiser et al., 2020; Sakoda et al., 2020). These results highlight the importance of stomatal traits to explain the variations in photosynthetic induction, not only between genotypes of the same crop but also among different crops.
The speed of the stomatal response to environmental changes is generally considered to be related to the stomatal size (Hetherington and Woodward, 2003; Raven, 2014). A negative correlation exists between the stomatal size and the speed of gs increase upon an irradiance increase, which has been found in many species (Drake et al., 2013; Kardiman and Ræbild, 2018). In addition, the relationship between average pore aperture and gs is nonlinear (Kaiser and Kappen, 2000, 2001), which means that similar stomatal opening responses could result in different gs kinetics, depending on the anatomical features of the stomatal complex in a given species. This nonlinear change in scale can also result in different time constants (e.g., time to reach 50% of the total variation) for the kinetic of pore aperture compared to gs. We found that the pore area of cucumber and tomato (which had relatively small stomates) tended to reach a plateau earlier after an irradiance increase than that in chrysanthemum (which had relatively large stomates) (Figures 5A, 6B,C). The time needed to reach 50% of the final pore area in high irradiance was found to be higher in chrysanthemum than in cucumber and tomato (Supplementary Figure 8), suggesting that horticultural species with larger stomates require more time to open their stomata. However, this does not necessarily lead to a close correlation between parameters of gs kinetics (k and Slmax) and stomatal size (Supplementary Figures 7B,C). This could be due to the fact that stomatal density also determines gs, and the range of genotypic variation in these traits may also be too small to identify the correlations. Both tomato and cucumber showed large absolute changes in gs for low- and high irradiance adapted leaves (Supplementary Figure 4). However, changes in absolute pore area for low- and high-irradiance adapted leaves in cucumber and tomato were rather small, compared to other crops (Figure 6C). This could result from relatively high stomatal density in cucumber and tomato (Figure 5B), magnifying small changes in an individual pore area. In the hypothetical situation of a cucumber leaf having a low stomatal density, such as that of chrysanthemum, stomata in this cucumber leaf would need to open their individual pore area up to ∼40 μm2 to achieve the observed increase in gs (Supplementary Figure 9A). In contrast, the pore area of chrysanthemum substantially increased after exposure to high irradiance, but due to a low stomatal density, this did not lead to a large increase in gs (Figures 5B, 6B and Supplementary Figure 4). When using the hypothetical situation of a chrysanthemum leaf possessing the stomatal density of a cucumber leaf, stomata in the chrysanthemum leaf only needed to open to a very small extent (∼3 μm2) to achieve the observed gs increase (Supplementary Figure 9B). These results suggest that species having small but many stomates are more efficient in adjusting gs to changes in irradiance, as it only requires small changes in individual pores to achieve large changes in gs.
Interestingly, the actual pore area opening generally accounted for less than 10% of the theoretical maximum pore area in all genotypes (Figures 6D–F), resulting in an average ratio between gs,f and gs,max (determined by anatomical traits) of 0.1 across genotypes (Supplementary Figure 10). This average gs,f/gs,max ratio among horticultural crops is generally lower than what has been found in previous studies (McElwain et al., 2016; Murray et al., 2020). In a modeling study, Dow et al. (2014) predicted an optimal ratio between operating gs and anatomical gs,max of 0.2; their study suggested that at 20% operating capacity, guard cells could increase the pore size efficiently when favorable conditions persisted, but could also close the pore just as quickly under stress (Dow et al., 2014). While experimental studies on the gs-gs,max relationship across species are scarce, some have described a relatively constant ratio of 0.25 between operating gs and gs,max in shrub and tree species (McElwain et al., 2016; Murray et al., 2020). Our results suggest that for horticultural crops, operating gs at 10% of its maximum capacity may be already sufficient for guard cells to function efficiently.
Variation in Biochemical Processes During Photosynthetic Induction Is Less Strong Than Differences in Stomatal Traits in Horticultural Crops
The initial, fast phase of photosynthetic induction involves the availability of RuBP and other Calvin cycle intermediates and is assumed to last 1–2 min (Pearcy, 1953; Sassenrath-Cole and Pearcy, 1992). The time constant for the fast phase of Vcmax induction (τfast; Figure 4A) may indicate the speed of completing the initial phase of photosynthetic induction, but this assumption needs to be verified using Calvin cycle metabolomics studies. Here, τfast varied between 0.5 and 1.1 min, which is generally larger than what has been found across wheat cultivars (0.3–0.5 min; Salter et al., 2019). This may suggest higher activities and/or amounts of fructose-1,6-bisphosphatase (FBPase), sedoheptulose-1,7-bisphosphatase (SBPase), and phosphoribulokinase (PRK) in field agronomic crops than in horticultural crops, given that the activation of RuBP regeneration is mainly limited by these three enzymes (reviewed by Kaiser et al., 2018). Nevertheless, our results confirm that the time needed to complete the initial phase of photosynthetic induction is generally rapid, and this is especially true when the leaf was adapted to low irradiance instead of darkness before switching to a high irradiance (Kaiser et al., 2017), as was the case in this study.
The following, slow phase of photosynthetic induction involves light-dependent activation of Rubisco by Rubisco activase, and this phase seems to show more variation between species: time constants of 4–5 min were reported for Alocasia macrorrhiza and Spinacia oleracea, and 2–4 min for wheat (Pearcy, 1953; Salter et al., 2019). For the horticultural genotypes examined here, we found slightly larger time constants (τslow) of 3–7 min (Figure 4B). The rate of Rubisco activation has been found to be an important determinant of photosynthetic induction in many species (e.g., wheat and soybean) (Soleh et al., 2017; Salter et al., 2019). However, we found a relatively smaller variation in Rubisco activation rate compared to variations found in many other traits. A CV of 22% was found for τslow, which was less than the CV of photosynthetic induction (e.g., 61% for T50) and traits related to stomatal opening (e.g., 68% for Slmax; Table 2). This corresponds with the findings of Deans et al. (2019) who found that the biochemical activation response time (5–25 min) was much more conserved between species (including angiosperms, ferns, and gymnosperms) than the time required for stomatal opening (10–150 min). It is worth noting that although the dynamic A vs. Ci approach has been used in many studies to quantify Vcmax kinetics during photosynthetic induction (Soleh et al., 2016; Taylor and Long, 2017; Salter et al., 2019; De Souza et al., 2020), the original FvCB model describes steady-state photosynthesis. By applying the FvCB model on dynamic A vs. Ci, it was assumed that the slow A induction changes are mainly caused by Rubisco activation. Although the role of Rubisco activation during A induction has been verified experimentally (Taylor et al., 2022), other processes, such as changes in mesophyll conductance could also play a role during A induction (Liu et al., 2021; Sakoda et al., 2021). However, mesophyll conductance changes have been suggested to be far more rapid than the observed Vcmax kinetics presented here, and the relative importance of mesophyll conductance for A induction is still under debate (De Souza et al., 2020; Liu et al., 2021; Sakoda et al., 2021). We conclude that the variation in Rubisco activation kinetics among the six horticultural crops may not be the primary cause for the large variation found in photosynthetic induction.
In some species (chrysanthemum, lettuce, and tomato), photosynthetic induction in the first 1–2 min exhibited a transient drop when photosynthetic induction was measured under high CO2 (>600 ppm; Supplementary Figure 11). This is likely caused by a limited amount of inorganic phosphate (Pi) in the metabolite pool of the Calvin cycle, due to insufficient and slow activation of sucrose-phosphate synthase (SPS) during the initial phase of the light increase (Stitt and Quick, 1989; Huber and Huber, 1992). Supposedly, during the first 1–2 min of the irradiance increase, the amount of free Pi is sufficient to support photosynthesis independently of any end-product synthesis. However, once Pi is exhausted, photosynthesis is inhibited until the conversion of triose-phosphates to sucrose in the cytosol releases enough Pi, which can then be translocated back into the chloroplast (Stitt and Quick, 1989). The activation of SPS is regulated by irradiance in some species (e.g., barley and maize) but not in others (e.g., soybean, tobacco, and cucumber) (Huber et al., 1989), leading to species variations in the level of Pi limitation. This may explain why in our results, the transient drop of photosynthesis in high CO2 was seen in some species only (Supplementary Figure 11).
Implications for Horticultural Crop Breeding
We showed that in major horticultural crops, transient limitations to photosynthetic induction appeared to be species-dependent, but the general trend was that there was a large genotypic variation in the level of transient stomatal limitation, whereas the extent of transient non-stomatal limitation during photosynthetic induction was relatively conserved (Supplementary Figures 5C,D). Previous studies showed that in rice, the primary transient limitation was biochemical, whereas, in cassava, primary limitations were caused by stomata (Yamori et al., 2012; De Souza et al., 2020). For horticultural species, photosynthesis transients of some crops (e.g., cucumber) tended to be limited by biochemistry and stomata to a comparative extent, whereas those in other crops (e.g., lettuce and chrysanthemum) tended to be more strongly limited by stomata (Supplementary Figures 5C,D). Stomatal size may partially regulate the level of stomatal limitation during photosynthesis induction. Species (e.g., rice) with smaller stomata have been found to show a low level of stomatal limitation (Acevedo-Siaca et al., 2020). In our study, chrysanthemum, which had the largest stomata among the tested greenhouse crops, showed the highest level of transient stomatal limitation (Figures 3C, 5A and Supplementary Figure 5D). This is possibly due to the fact that larger stomata need more time to open until a new steady state has reached (Drake et al., 2013; also refer to Figures 6A–C and Supplementary Figure 8), resulting in a higher level of transient stomatal limitation during photosynthetic induction.
Species with small stomata displayed high stomatal density, which in the case of incomplete stomatal closure may lead to high transpiration and increased water demand (e.g., during the night). Reduced stomatal density improves drought tolerance in species, such as rice and barley (Hughes et al., 2017; Caine et al., 2019). We found that the two cut-flowers have relatively low total stomatal density (including both leaf surfaces), which possibly favors vase life by increasing water conservation, such as in other cut-flowers (e.g., Antirrhinum majus L., Schroeder and Stimart, 2005). Altogether, these results suggest that manipulating stomatal traits rather than biochemical traits is more relevant for horticultural crop breeding.
Additionally, we found a highly conserved ratio between stomatal size at the abaxial and adaxial leaf surface, as well as between the stomatal densities on both leaf sides in all crops, except for rose (Supplementary Figures 7E,F). Stomatal size and density at the adaxial leaf surface were respectively 93 and 71% of the size and density at the abaxial leaf surface. A linear correlation between the stomatal densities of both leaf sides has previously been found in rice and tomato, with more stomata on the abaxial leaf surface (Fanourakis et al., 2015; Zhang et al., 2019). The distribution of stomatal density between the two leaf sides is relevant for total gs partitioning between leaf sides (Ticha, 1982). A more uniform gs partitioning favors CO2 diffusion inside the leaf, and therefore gas exchange (Parkhurst and Mott, 1990; Muir et al., 2014), but may come at the expense of stress resilience in the field. Milla et al. (2013) found that wild species showed a larger difference in stomatal density between leaf sides, while domestication tended to reduce the difference of stomatal density between leaf sides, by lowering the stomatal density at the abaxial side. Interestingly, wild but not domesticated tomato genotypes showed even stomatal distribution between leaf sides (Koenig et al., 2013; Fanourakis et al., 2015). Given the potential effects of gs partitioning between leaf sides on gas exchange, further studies are needed to explore whether or not a uniform gs partitioning favors photosynthetic induction and the underlying mechanisms that regulate the distribution of stomatal density between leaf sides for breeding.
Conclusion
Large variations in the rate of photosynthetic induction were found among 19 genotypes from six of the world’s most commercially relevant horticultural crops. Variations in stomatal density and size and their effects on dynamic changes in the stomatal conductance were the major determinants of variation in the rate of photosynthetic induction, not only between crops but also between cultivars of the same crop. RuBP regeneration and Rubisco activation during photosynthetic induction exhibited relatively less genotypic variation (CV up to 22%) than did stomatal traits (CV up to 68%). Crops with large but few stomata tended to have a slow increase in stomatal conductance, potentially leading to a high level of transient stomatal limitation during photosynthetic induction. All horticultural genotypes showed an operational gs of ∼10% of its maximum capacity, which was lower than the average gs/gs,max ratio found in previous studies. The ratio of stomatal size between abaxial and adaxial leaf surfaces was highly conserved among horticultural crops, as was the ratio of stomatal density, suggesting that the partitioning of gs between leaf surfaces was hardly affected by species difference when under similar growth conditions. Our results highlight the importance of manipulating stomatal traits for speeding up photosynthetic induction in horticultural crops.
Data Availability Statement
The original contributions presented in the study are included in the article/Supplementary Material, further inquiries can be directed to the corresponding author/s.
Author Contributions
NZ, LM, and EK designed the research. NZ and SB conducted the measurements. NZ, SB, and DJ analyzed the data, with suggestions from SV-C and EK. EK and LM secured funding. NZ drafted the manuscript. SB, DJ, SV-C, LM, and EK made substantial contributions to improve the manuscript. All authors contributed to the article and approved the submitted version.
Funding
This project (No. 17173) was funded by the Netherlands Organisation for Scientific Research (NWO), with contributions by Signify, Glastuinbouw Nederland, Ridder Growing Solutions, and Adviesbureau JFH Snel.
Conflict of Interest
The authors declare that the research was conducted in the absence of any commercial or financial relationships that could be construed as a potential conflict of interest.
Publisher’s Note
All claims expressed in this article are solely those of the authors and do not necessarily represent those of their affiliated organizations, or those of the publisher, the editors and the reviewers. Any product that may be evaluated in this article, or claim that may be made by its manufacturer, is not guaranteed or endorsed by the publisher.
Acknowledgments
We thank Samikshya Shrestha and Nik Woning for analyzing stomatal images. We thank the staff of Unifarm for regular crop management in the greenhouse, Sander van Delden for suggestions on making nutrient solutions for various greenhouse crops, Celine Nicole for help on light settings in the greenhouse, Xinyou Yin for discussion on estimating photosynthesis parameters, and Arjen vande Peppel for suggestions on measuring chlorophyll content. We thank Alejandro Morales, Jeremy Harbinson, Jan Snel, Hans Stigter, Jaap Molenaar, Ad de Koning, Dennis Medema, Celine Nicole, and Marcel Krijn for highly useful discussions. We also thank Enza Zaden, Deliflor, Nunhems/BASF, Rijk Zwaan, and Bayer Crop Science for providing seeds or plants.
Supplementary Material
The Supplementary Material for this article can be found online at: https://www.frontiersin.org/articles/10.3389/fpls.2022.860229/full#supplementary-material
Supplementary Table 1 | Ion concentrations of the nutrient solution.
Supplementary Table 2 | Stomatal pore length and guard cell width.
Supplementary Table 3 | Correlation coefficients and p-values for all focused traits (provided as a separate excel file).
Supplementary Figure 1 | Irradiance fluctuations measured in the greenhouse.
Supplementary Figure 2 | Distribution of greenhouse supplemental light.
Supplementary Figure 3 | Greenhouse climate conditions during the experiment.
Supplementary Figure 4 | Final stomatal conductance reached at low and high irradiance.
Supplementary Figure 5 | Dynamics of Rubisco carboxylation rate, electron transport rate, and transient nonstomatal and stomatal limitations during photosynthetic induction.
Supplementary Figure 6 | Leaf pigment contents and light absorptance.
Supplementary Figure 7 | Relationships between stomatal anatomical traits vs. parameters of stomatal conductance kinetics.
Supplementary Figure 8 | Time needed to reach 50% of the final pore area in high irradiance.
Supplementary Figure 9 | Kinetics of pore area opening of cucumber and chrysanthemum.
Supplementary Figure 10 | Ratio between the operating and maximum stomatal conductance.
Supplementary Figure 11 | Photosynthetic induction curves measured at different [CO2].
Supplementary Method 1 | Description of the FvCB model.
Supplementary Method 2 | Steps to solve the equation for stomatal pore area.
Supplementary Presentation 1 | Comparisons between the measured and predicted leaf net photosynthesis rates.
Footnotes
References
Acevedo-Siaca, L. G., Coe, R., Quick, W. P., and Long, S. P. (2021). Variation between rice accessions in photosynthetic induction in flag leaves and underlying mechanisms. J. Exp. Bot. 72, 1282–1294. doi: 10.1093/jxb/eraa520
Acevedo-Siaca, L. G., Coe, R., Wang, Y., Kromdijk, J., Quick, W. P., Long, S. P., et al. (2020). Variation in photosynthetic induction between rice accessions and its potential for improving productivity. New Phytol. 227, 1097–1108. doi: 10.1111/nph.16454
Adachi, S., Tanaka, Y., Miyagi, A., Kashima, M., Tezuka, A., Toya, Y., et al. (2019). High-yielding rice Takanari has superior photosynthetic response to a commercial rice Koshihikari under fluctuating light. J. Exp. Bot. 70, 5287–5297. doi: 10.1093/jxb/erz304
Allen, M. T., and Pearcy, R. W. (2000). Stomatal versus biochemical limitations to dynamic photosynthetic performance in four tropical rainforest shrub species. Oecologia 122, 479–486. doi: 10.1007/s004420050969
Caine, R. S., Yin, X., Sloan, J., Harrison, E. L., Mohammed, U., Fulton, T., et al. (2019). Rice with reduced stomatal density conserves water and has improved drought tolerance under future climate conditions. New Phytol. 221, 371–384. doi: 10.1111/nph.15344
Carvalho, S. M. P., and Heuvelink, E. (2003). Effect of assimilate availability on flower characteristics and plant height of cut Chrysanthemum: an integrated study. J. Hortic. Sci. Biotechnol. 78, 711–720. doi: 10.1080/14620316.2003.11511688
De Souza, A. P., Wang, Y., Orr, D. J., Carmo-Silva, E., and Long, S. P. (2020). Photosynthesis across African cassava germplasm is limited by Rubisco and mesophyll conductance at steady state, but by stomatal conductance in fluctuating light. New Phytol. 225, 2498–2512. doi: 10.1111/nph.16142
Deans, R. M., Brodribb, T. J., Busch, F. A., and Farquhar, G. D. (2019). Plant water-use strategy mediates stomatal effects on the light induction of photosynthesis. New Phytol. 222, 382–395. doi: 10.1111/nph.15572
Dow, G. J., Bergmann, D. C., and Berry, J. A. (2014). An integrated model of stomatal development and leaf physiology. New Phytol. 201, 1218–1226. doi: 10.1111/nph.12608
Drake, P. L., Froend, R. H., and Franks, P. J. (2013). Smaller, faster stomata: scaling of stomatal size, rate of response, and stomatal conductance. J. Exp. Bot. 64, 495–505. doi: 10.1093/jxb/ers347
Elliott-Kingston, C., Haworth, M., Yearsley, J. M., Batke, S. P., Lawson, T., and McElwain, J. C. (2016). Does size matter? Atmospheric CO2 may be a stronger driver of stomatal closing rate than stomatal size in taxa that diversified under low CO2. Front. Plant Sci. 7:1253. doi: 10.3389/fpls.2016.01253
Fanourakis, D., Giday, H., Milla, R., Pieruschka, R., Kjaer, K. H., Bolger, M., et al. (2015). Pore size regulates operating stomatal conductance, while stomatal densities drive the partitioning of conductance between leaf sides. Ann. Bot. 115, 555–565. doi: 10.1093/aob/mcu247
Farquhar, G. D., von Caemmerer, S., and Berry, J. A. (1980). A biochemical model of photosynthetic CO2 assimilation in leaves of C3 species. Planta 149, 78–90. doi: 10.1007/BF00386231
Flood, P. J., Harbinson, J., and Aarts, M. G. M. (2011). Natural genetic variation in plant photosynthesis. Trends Plant Sci. 16, 327–335. doi: 10.1016/j.tplants.2011.02.005
Franks, P. J., and Beerling, D. J. (2009). Maximum leaf conductance driven by CO2 effects on stomatal size and density over geologic time. Proc. Natl. Acad. Sci. U.S.A. 106, 10343–10347. doi: 10.1073/pnas.0904209106
Franks, P. J., and Farquhar, G. D. (2001). The effect of exogenous abscisic acid on stomatal development, stomatal mechanics, and leaf gas exchange in Tradescantia virginiana. Plant Physiol. 125, 935–942. doi: 10.1104/pp.125.2.935
Giday, H., Kjaer, K. H., Fanourakis, D., and Ottosen, C. O. (2013). Smaller stomata require less severe leaf drying to close: a case study in Rosa hydrida. J. Plant Physiol. 170, 1309–1316. doi: 10.1016/j.jplph.2013.04.007
Gu, J., Yin, X., Stomph, T.-J., Wang, H., and Struik, P. C. (2012). Physiological basis of genetic variation in leaf photosynthesis methylation and chromatin patterning among rice (Oryza sativa L.) introgression lines under drought and well-watered conditions. J. Exp. Bot. 63, 5137–5153. doi: 10.1093/jxb/ers170
Hetherington, A. M., and Woodward, F. I. (2003). The role of stomata in sensing and driving environmental change. Nature 424, 901–908. doi: 10.4135/9781446201091.n40
Hogewoning, S. W., Douwstra, P., Trouwborst, G., Van Ieperen, W., and Harbinson, J. (2010). An artificial solar spectrum substantially alters plant development compared with usual climate room irradiance spectra. J. Exp. Bot. 61, 1267–1276. doi: 10.1093/jxb/erq005
Huber, S. C., and Huber, J. L. (1992). Role of sucrose-phosphate synthase in sucrose metabolism in leaves. Plant Physiol. 99, 1275–1278. doi: 10.1104/pp.99.4.1275
Huber, S. C., Nielsen, T. H., Huber, J. L. A., and Pharr, D. M. (1989). Variation among species in light activation of sucrose-phosphate synthase. Plant Cell Physiol. 30, 277–285. doi: 10.1104/pp.108.4.1665
Hughes, J., Hepworth, C., Dutton, C., Dunn, J. A., Hunt, L., Stephens, J., et al. (2017). Reducing stomatal density in barley improves drought tolerance without impacting on yield. Plant Physiol. 174, 776–787. doi: 10.1104/pp.16.01844
Jackson, R. B., Woodrow, I. E., and Mott, K. A. (1991). Nonsteady-state photosynthesis following an increase in photon flux density (PFD): effects of magnitude and duration of initial PFD. Plant Physiol. 95, 498–503. doi: 10.1104/pp.95.2.498
Kaiser, E., Morales, A., and Harbinson, J. (2018). Fluctuating light takes crop photosynthesis on a rollercoaster ride. Plant Physiol. 176, 977–989. doi: 10.1104/pp.17.01250
Kaiser, E., Morales, A., Harbinson, J., Heuvelink, E., and Marcelis, L. F. M. (2020). High stomatal conductance in the tomato flacca mutant allows for faster photosynthetic induction. Front. Plant Sci. 11:1317. doi: 10.3389/fpls.2020.01317
Kaiser, E., Morales, A., Harbinson, J., Heuvelink, E., Prinzenberg, A. E., and Marcelis, L. F. M. (2016). Metabolic and diffusional limitations of photosynthesis in fluctuating irradiance in Arabidopsis thaliana. Sci. Rep. 6:31252. doi: 10.1038/srep31252
Kaiser, E., Morales, A., Harbinson, J., Kromdijk, J., Heuvelink, E., and Marcelis, L. F. M. (2015). Dynamic photosynthesis in different environmental conditions. J. Exp. Bot. 66, 2415–2426. doi: 10.1093/jxb/eru406
Kaiser, E., Zhou, D., Heuvelink, E., Harbinson, J., Morales, A., and Marcelis, L. F. M. (2017). Elevated CO2 increases photosynthesis in fluctuating irradiance regardless of photosynthetic induction state. J. Exp. Bot. 68, 5629–5640. doi: 10.1093/jxb/erx357
Kaiser, H., and Kappen, L. (2000). In situ observation of stomatal movements and gas exchange of Aegopodium podagraria L. in the understorey. J. Exp. Bot. 51, 1741–1749. doi: 10.1093/jexbot/51.351.1741
Kaiser, H., and Kappen, L. (2001). Stomatal oscillations at small apertures: indications for a fundamental insufficiency of stomatal feedback-control inherent in the stomatal turgor mechanism. J. Exp. Bot. 52, 1303–1313. doi: 10.1093/jxb/52.359.1303
Kardiman, R., and Ræbild, A. (2018). Relationship between stomatal density, size and speed of opening in Sumatran rainforest species. Tree Physiol. 38, 696–705. doi: 10.1093/treephys/tpx149
Koenig, D., Jiménez-Gómez, J. M., Kimura, S., Fulop, D., Chitwood, D. H., Headland, L. R., et al. (2013). Comparative transcriptomics reveals patterns of selection in domesticated and wild tomato. Proc. Natl. Acad. Sci. U.S.A. 110, 2–9. doi: 10.1073/pnas.1309606110
Kromdijk, J., Głowacka, K., Leonelli, L., Gabilly, S. T., Iwai, M., Niyogi, K. K., et al. (2016). Improving photosynthesis and crop productivity by accelerating recovery from photoprotection. Science 354, 857–862. doi: 10.1126/science.aai8878
Laisk, A. K. (1977). Kinetics of Photosynthesis and Photorespiration of C3 in Plants (in Russian). Moscow: Nauk.
Lawson, T., and Vialet-Chabrand, S. (2019). Speedy stomata, photosynthesis and plant water use efficiency. New Phytol. 221, 93–98. doi: 10.1111/nph.15330
Li, T., Heuvelink, E., and Marcelis, L. F. M. (2015). Quantifying the source-sink balance and carbohydrate content in three tomato cultivars. Front. Plant Sci. 6:416. doi: 10.3389/fpls.2015.00416
Liu, T., Barbour, M. M., Yu, D., Rao, S., and Song, X. (2021). Mesophyll conductance exerts a significant limitation on photosynthesis during light induction. New Phytol. 233, 360–372. doi: 10.1111/nph.17757
Marcelis, L. F. M. (1994). A simulation model for dry matter partitioning in cucumber. Ann. Bot. 74, 43–52. doi: 10.1093/aob/74.1.43
Marcelis, L. F. M., Kaiser, E., Van Westreenen, A., and Heuvelink, E. (2018). Sustainable crop production in greenhouses based on understanding crop physiology. Acta Hortic. 1227, 1–12. doi: 10.17660/ActaHortic.2018.1227.1
McAusland, L., Vialet-Chabrand, S., Davey, P., Baker, N. R., Brendel, O., and Lawson, T. (2016). Effects of kinetics of light-induced stomatal responses on photosynthesis and water-use efficiency. New Phytol. 211, 1209–1220. doi: 10.1111/nph.14000
McAusland, L., Vialet-Chabrand, S., Jauregui, I., Burridge, A., Hubbart-Edwards, S., Fryer, M. J., et al. (2020). Variation in key leaf photosynthetic traits across wheat wild relatives is accession dependent not species dependent. New Phytol. 228, 1767–1780. doi: 10.1111/nph.16832
McElwain, J. C., Yiotis, C., and Lawson, T. (2016). Using modern plant trait relationships between observed and theoretical maximum stomatal conductance and vein density to examine patterns of plant macroevolution. New Phytol. 209, 94–103. doi: 10.1111/nph.13579
Milla, R., De Diego-Vico, N., and Martín-Robles, N. (2013). Shifts in stomatal traits following the domestication of plant species. J. Exp. Bot. 64, 3137–3146. doi: 10.1093/jxb/ert147
Morales, A., Kaiser, E., Yin, X., Harbinson, J., Molenaar, J., Driever, S. M., et al. (2018). Dynamic modelling of limitations on improving leaf CO2 assimilation under fluctuating irradiance. Plant Cell Environ. 41, 589–604. doi: 10.1111/pce.13119
Mott, K. A., and Woodrow, I. E. (2000). Modelling the role of Rubisco activase in limiting non-steady-state photosynthesis. J. Exp. Bot. 51, 399–406. doi: 10.1093/jexbot/51.suppl_1.399
Muir, C. D., Hangarter, R. P., Moyle, L. C., and Davis, P. A. (2014). Morphological and anatomical determinants of mesophyll conductance in wild relatives of tomato (Solanum sect. Lycopersicon, sect. Lycopersicoides; Solanaceae). Plant Cell Environ. 37, 1415–1426. doi: 10.1111/pce.12245
Murakami, K., and Jishi, T. (2021). Appropriate time interval of PPFD measurement to estimate daily photosynthetic gain. Funct. Plant Biol. [Epub ahead of print]. doi: 10.1071/FP20323
Murray, M., Soh, W. K., Yiotis, C., Spicer, R. A., Lawson, T., and McElwain, J. C. (2020). Consistent relationship between field-measured stomatal conductance and theoretical maximum stomatal conductance in C3 woody angiosperms in four major biomes. Int. J. Plant Sci. 181, 142–154. doi: 10.1086/706260
Naumburg, E., and Ellsworth, D. S. (2002). Short-term light and leaf photosynthetic dynamics affect estimates of daily understory photosynthesis in four tree species. Tree Physiol. 22, 393–401. doi: 10.1093/treephys/22.6.393
Ort, D. R., Merchant, S. S., Alric, J., Barkan, A., Blankenship, R. E., Bock, R., et al. (2015). Redesigning photosynthesis to sustainably meet global food and bioenergy demand. Proc. Natl. Acad. Sci. U.S.A. 112, 8529–8536.
Parkhurst, D. F., and Mott, K. A. (1990). Intercellular diffusion limits to CO2 uptake in leaves: studies in air and helox. Plant Physiol. 94, 1024–1032. doi: 10.1104/pp.94.3.1024
Pearcy, R. W. (1953). Photosynthesis in plant life. J. Franklin Inst. 256, 599–600. doi: 10.1016/0016-0032(53)91189-2
Qu, M., Essemine, J., Xu, J., Ablat, G., Perveen, S., Wang, H., et al. (2020). Alterations in stomatal response to fluctuating light increase biomass and yield of rice under drought conditions. Plant J. 104, 1334–1347.
Sakoda, K., Yamori, W., Groszmann, M., and Evans, J. R. (2021). Stomatal, mesophyll conductance, and biochemical limitations to photosynthesis during induction. Plant Physiol. 185, 146–160. doi: 10.1093/plphys/kiaa011
Sakoda, K., Yamori, W., Shimada, T., Sugano, S. S., Hara-Nishimura, I., and Tanaka, Y. (2020). Higher stomatal density improves photosynthetic induction and biomass production in Arabidopsis under fluctuating light. Front. Plant Sci. 11:589603. doi: 10.3389/fpls.2020.589603
Salter, W. T., Merchant, A. M., Richards, R. A., Trethowan, R., and Buckley, T. N. (2019). Rate of photosynthetic induction in fluctuating light varies widely among genotypes of wheat. J. Exp. Bot. 70, 2787–2796. doi: 10.1093/jxb/erz100
Sassenrath-Cole, G. F., and Pearcy, R. W. (1992). The role of ribulose-1,5-bisphosphate regeneration in the induction requirement of photosynthetic CO2 exchange under transient light conditions. Plant Physiol. 99, 227–234. doi: 10.1104/pp.99.1.227
Schroeder, K. R., and Stimart, D. P. (2005). Comparison of stomatal density and postharvest transpiration between long- and short-lived cut flower genotypes of Antirrhinum majus L. J. Am. Soc. Hortic. Sci. 130, 742–746. doi: 10.21273/jashs.130.5.742
Shimadzu, S., Seo, M., Terashima, I., and Yamori, W. (2019). Whole irradiated plant leaves showed faster photosynthetic induction than individually irradiated leaves via improved stomatal opening. Front. Plant Sci. 10:1512. doi: 10.3389/fpls.2019.01512
Simkin, A. J., López-Calcagno, P. E., and Raines, C. A. (2019). Feeding the world: improving photosynthetic efficiency for sustainable crop production. J. Exp. Bot. 70, 1119–1140. doi: 10.1093/jxb/ery445
Slattery, R. A., Walker, B. J., Weber, A. P. M., and Ort, D. R. (2018). The impacts of fluctuating light on crop performance. Plant Physiol. 176, 990–1003. doi: 10.1104/pp.17.01234
Soleh, M. A., Tanaka, Y., Kim, S. Y., Huber, S. C., Sakoda, K., and Shiraiwa, T. (2017). Identification of large variation in the photosynthetic induction response among 37 soybean [Glycine max (L.) Merr.] genotypes that is not correlated with steady-state photosynthetic capacity. Photosynth. Res. 131, 305–315. doi: 10.1007/s11120-016-0323-1
Soleh, M. A., Tanaka, Y., Nomoto, Y., Iwahashi, Y., Nakashima, K., Fukuda, Y., et al. (2016). Factors underlying genotypic differences in the induction of photosynthesis in soybean [Glycine max (L.) Merr.]. Plant Cell Environ. 39, 685–693.
Stitt, M., and Quick, W. P. (1989). Photosynthetic carbon partitioning: its regulation and possibilities for manipulation. Physiol. Plant. 77, 633–641.
Tanaka, Y., Adachi, S., and Yamori, W. (2019). Natural genetic variation of the photosynthetic induction response to fluctuating light environment. Curr. Opin. Plant Biol. 49, 52–59. doi: 10.1016/j.pbi.2019.04.010
Taylor, S. H., Gonzalez-Escobar, E., Page, R., Parry, M. A., Long, S. P., and Carmo-Silva, E. (2022). Faster than expected Rubisco deactivation in shade reduces cowpea photosynthetic potential in variable light conditions. Nat. Plants 8, 118–124. doi: 10.1038/s41477-021-01068-9
Taylor, S. H., and Long, S. P. (2017). Slow induction of photosynthesis on shade to sun transitions in wheat may cost at least 21% of productivity. Philos. Trans. R. Soc. B Biol. Sci. 372:20160543. doi: 10.1098/rstb.2016.0543
Ticha, I. (1982). Photosynthetic characteristics during ontogenesis of leaves, VII. stomata density and sizes. Photosynthetica 16, 375–471.
Valladares, F., Allen, M. T., and Pearcy, R. W. (1997). Photosynthetic responses to dynamic light under field conditions in six tropical rainforest shrubs occuring along a light gradient. Oecologia 111, 505–514. doi: 10.1007/s004420050264
van Westreenen, A., Zhang, N., Douma, J. C., Evers, J. B., Anten, N. P. R., and Marcelis, L. F. M. (2020). Substantial differences occur between canopy and ambient climate: quantification of interactions in a greenhouse-canopy system. PLoS One 15:e0233210. doi: 10.1371/journal.pone.0233210
Vialet-Chabrand, S., Dreyer, E., and Brendel, O. (2013). Performance of a new dynamic model for predicting diurnal time courses of stomatal conductance at the leaf level. Plant Cell Environ. 36, 1529–1546. doi: 10.1111/pce.12086
Wang, Y. P., and Jarvis, P. G. (1993). Influence of shoot structure on the photosynthesis of Sitka spruce (Picea sitchensis). Funct. Ecol. 7, 433–451.
Wellburn, A. R. (1994). The spectral determination of chlorophylls a and b, as well as total carotenoids, using various solvents with spectrophotometers of different resolution. J. Plant Physiol. 144, 307–313. doi: 10.1016/S0176-1617(11)81192-2
Yamori, W., Kusumi, K., Iba, K., and Terashima, I. (2020). Increased stomatal conductance induces rapid changes to photosynthetic rate in response to naturally fluctuating light conditions in rice. Plant Cell Environ. 43, 1230–1240. doi: 10.1111/pce.13725
Yamori, W., Masumoto, C., Fukayama, H., and Makino, A. (2012). Rubisco activase is a key regulator of non-steady-state photosynthesis at any leaf temperature and, to a lesser extent, of steady-state photosynthesis at high temperature. Plant J. 71, 871–880. doi: 10.1111/j.1365-313X.2012.05041.x
Zhang, N., Van Westreenen, A., Evers, J. B., Anten, N. P. R., and Marcelis, L. F. M. (2020). Quantifying the contribution of bent shoots to plant photosynthesis and biomass production of flower shoots in rose (Rosa hybrida) using a functional-structural plant model. Ann. Bot. 126, 587–599. doi: 10.1093/aob/mcz150
Keywords: induction, genotypic variation, light fluctuations, modeling, photosynthesis, Rubisco activation, stomatal opening
Citation: Zhang N, Berman SR, Joubert D, Vialet-Chabrand S, Marcelis LFM and Kaiser E (2022) Variation of Photosynthetic Induction in Major Horticultural Crops Is Mostly Driven by Differences in Stomatal Traits. Front. Plant Sci. 13:860229. doi: 10.3389/fpls.2022.860229
Received: 22 January 2022; Accepted: 14 March 2022;
Published: 27 April 2022.
Edited by:
Carl-Otto Ottosen, Aarhus University, DenmarkReviewed by:
Hartmut Stützel, Leibniz University Hannover, GermanyRyo Matsuda, The University of Tokyo, Japan
Copyright © 2022 Zhang, Berman, Joubert, Vialet-Chabrand, Marcelis and Kaiser. This is an open-access article distributed under the terms of the Creative Commons Attribution License (CC BY). The use, distribution or reproduction in other forums is permitted, provided the original author(s) and the copyright owner(s) are credited and that the original publication in this journal is cited, in accordance with accepted academic practice. No use, distribution or reproduction is permitted which does not comply with these terms.
*Correspondence: Ningyi Zhang, bmluZ3lpLnpoYW5nQHd1ci5ubA==; Elias Kaiser, ZWxpYXMua2Fpc2VyQHd1ci5ubA==