- 1College of Agronomy, Qingdao Agricultural University, Qingdao, China
- 2Institute of Crop Science, Chinese Academy of Agricultural Sciences (CAAS)/National Key Facility for Crop Gene Resources and Genetic Improvement, Key Laboratory of Biology and Genetic Improvement of Triticeae Crops, Ministry of Agriculture, Beijing, China
- 3Hebei Key Laboratory of Crop Salt-Alkali Stress Tolerance Evaluation and Genetic Improvement/Cangzhou Academy of Agriculture and Forestry Sciences, Cangzhou, China
TIFY proteins play crucial roles in plant abiotic and biotic stress responses. Our transcriptome data revealed several TIFY family genes with significantly upregulated expression under drought, salt, and ABA treatments. However, the functions of the GmTIFY family genes are still unknown in abiotic stresses. We identified 38 GmTIFY genes and found that TIFY10 homologous genes have the most duplication events, higher selection pressure, and more obvious response to abiotic stresses compared with other homologous genes. Expression pattern analysis showed that GmTIFY10e and GmTIFY10g genes were significantly induced by salt stress. Under salt stress, GmTIFY10e and GmTIFY10g transgenic Arabidopsis plants showed higher root lengths and fresh weights and had significantly better growth than the wild type (WT). In addition, overexpression of GmTIFY10e and GmTIFY10g genes in soybean improved salt tolerance by increasing the PRO, POD, and CAT contents and decreasing the MDA content; on the contrary, RNA interference plants showed sensitivity to salt stress. Overexpression of GmTIFY10e and GmTIFY10g in Arabidopsis and soybean could improve the salt tolerance of plants, while the RNAi of GmTIFY10e and GmTIFY10g significantly increased sensitivity to salt stress in soybean. Further analysis demonstrated that GmTIFY10e and GmTIFY10g genes changed the expression levels of genes related to the ABA signal pathway, including GmSnRK2, GmPP2C, GmMYC2, GmCAT1, and GmPOD. This study provides a basis for comprehensive analysis of the role of soybean TIFY genes in stress response in the future.
Introduction
Environmental stresses affect both growth and yield in soybean (Bohnert et al., 1995). To adapt to environmental stresses, several regulatory pathways gradually formed during the evolution of plants (Zhu et al., 2011). In previous studies, TIFY proteins were found to respond to abiotic and biotic stresses through regulatory pathways (Thines et al., 2007; Ebel et al., 2018). Studying TIFY proteins were useful for protecting soybean (Glycine max) growth and yield under various environmental stresses.
TIFY proteins were defined with conservative amino acid (aa) sequence (TIF[F/Y] XG) (Vanholme et al., 2007). The TIFY family genes were divided into four subfamilies, including TIFY, Jasmonate ZIM domain (JAZ), PEAPOD (PPD), and ZIM-like (ZML) according to their specific domains (Bai et al., 2011). TIFY subfamily members contain only one TIFY domain; JAZ subfamily members have a C-terminal Jas (SLX2FX2KRX2RX5PY) domain (also named CCT_2 domain) in addition to the TIFY domain (Staswick, 2008); ZML subfamily members contain the CCT domain (CONSTANS, CO-like, and TOC1) and the GATA zinc finger domain (CX2CX20CX2C), except for the TIFY domain (Nishii et al., 2000); PPD subfamily members contain the N-terminal PPD domain, TIFY domain and the C-terminal Jas domain without PY motif (SLX2FX2KRX2RX5) (Chung et al., 2009).
In the early research, TIFY proteins could respond to biotic stresses, such as insects and pathogens by jasmonic acid (JA) signaling pathway (Thines et al., 2007; Barah and Bones, 2015; Thireault et al., 2015; Mao et al., 2017; Dhakarey et al., 2018). Recent studies have demonstrated that TIFY proteins play an important role in regulating plants resistance to abiotic stresses (Demianski et al., 2012; Zhu et al., 2013; Fu et al., 2017; Sun et al., 2017; Peethambaran et al., 2018; Meng et al., 2019; Luo et al., 2020; Zhao et al., 2020a). The Arabidopsis AtTIFY10a and AtTIFY10b genes and their wild soybean homologous genes GsTIFY10a, GsTIFY10b, and GsJAZ2 positively regulated the response to salt and alkali stresses (Zhu et al., 2013; Zhao et al., 2020a). Overexpression of GhJAZ2 in cotton plants can significantly enhance sensitivity to salt stress (Sun et al., 2017). During the seedling and reproductive stages of rice, overexpression of OsJAZ1 in rice can improve sensitivity to drought stress, while JAZ1 t-DNA inserted in mutant plants had higher drought resistance than wild type (WT) plants (Fu et al., 2017). The rice OsJAZ8 gene was confirmed to improve the salt tolerance of transgenic tobacco through the JA signaling pathway (Peethambaran et al., 2018). The hard wheat TdTIFY11a gene can improve salt tolerance when overexpressed in Arabidopsis (Ebel et al., 2018). Arabidopsis AtJAZ7 gene was identified to mediate drought tolerance through comparative proteomics and metabolomics analysis (Meng et al., 2019). Cotton GbJAZ1 gene was confirmed to interact with ABA-insensitive1 (ABI1) and involved in regulation the tolerance of salt and drought through the ABA signaling pathway (Luo et al., 2020).
Soybean is one of the most important commercial crops worldwide and an important source of vegetable protein and oil for humans. Salt stress is an important factor which could affect the growth and yield of soybean (Zhu et al., 2013). Studying salt stress-related genes and their functions are of great significance to soybean molecular breeding. After analyzing the transcriptome data in previous studies, we found that the expression levels of many TIFY family genes were significantly upregulated under drought, salt, and ABA treatments (Shi et al., 2018). In our study, we performed a genome-wide identification of the TIFY family genes in soybean and identified 38 GmTIFY genes. We analyzed the structure characteristics, expression patterns, duplication events, and physical and chemical properties of GmTIFY family genes. During transcriptome data analysis, we found six significantly upregulated genes under salt treatment, which were all GmTIFY10 and GmTIFY11 homologous genes in the JAZ subfamily. The gene function analysis of GmTIFY10e and GmTIFY10g showed that they have a positive regulatory effect on salt stress tolerance in Arabidopsis and soybean. Further analysis demonstrated that overexpression of GmTIFY10e and GmTIFY10g could influence the expression levels of ABA-related genes, which suggested that GmTIFY10e and GmTIFY10g may regulate the salt tolerance in plants by participating in ABA signaling pathway.
Materials and Methods
Screening and Identification of TIFY Genes
The nucleic acid and protein databases of Arabidopsis, rice, soybean, apple, and grape were downloaded from the Ensemble Plants database.1 The hidden Markov model (HMM) of TIFY domain (PF06200) was obtained from Pfam.2 We then used the hmm-search program HMMER3.1 (Prince and Pickett, 2002; Xia et al., 2017) to identify the TIFY HMM for the TIFY proteins in the resulting protein databases. The 18 Arabidopsis AtTIFY protein sequences were obtained from TAIR3 and used to search the TIFY proteins from rice, soybean, apple, and grape protein databases by the BLASTp program of basic local alignment search tool (BLAST; Wang et al., 2017). We compared the results of the two methods to confirm TIFY candidate genes in these species. These candidate genes were identified in their domains with SMART4 and CDD5 to ensure that the TIFY domain was in sequence (Letunic et al., 2002; Marchler-Bauer et al., 2002). Finally, the ExPASy6 ProtParam tool was used to query the physical and chemical properties of the GmTIFYs (Appel et al., 1994; Wang et al., 2020a).
Phylogenetic Tree Analysis of TIFY Proteins
The TIFY protein sequences of Arabidopsis, rice, soybean, apple, and grape were compared using ClustalW in the MEGA-X software. The maximum likelihood (ML) method was used to construct a phylogenetic tree for analyzing the phylogenetic relationship between TIFYs (Kumar et al., 2016; Leng et al., 2021). The bootstrap method was used with 1,000 replicates. The methods and parameters were the same as the Jones–Taylor–Thornton (JTT) model, gamma-distributed rates (G), and the gamma parameter 1.
Chromosomal Location, Gene Duplication, and Selective Pressure Analysis
The position information of the GmTIFY family genes was extracted from the GFF3 file of the soybean genome. The location and distribution of GmTIFY family genes were visualized on the chromosomes using Map Gene 2 Chromosomal (Jiangtao et al., 2015; Wang et al., 2020a).7
For gene duplication analysis, the TBtools software was used to identify the duplication events of the soybean genome and GmTIFY genes. The collinearity pairs of GmTIFY genes were extracted and used to visualize a synteny map with the CIRCOS software (Lestari et al., 2013).
The TIFY coding sequences were aligned using ClustalW software. The alignment results were converted to PAML format using EasyCodeML and a tree file in Newick format was built using MEGA-X. The selection pressure was estimated using the branch model of EasyCodeML. The ratio of non-synonymous to synonymous substitution rates (ω) was determined by the free-ratio model and the two-ratio model among the branches of the TIFY tree file (Gao et al., 2019).
Gene Structure, Motif, and Promoter Sequence Analysis
The motif information of the soybean GmTIFY proteins was analyzed using the MEME online tool (Bailey et al., 2009; Wang et al., 2019).8 The resulting files and soybean gene structure annotation files were imported into TBtools for visualization.
The 2,000 bp promoter sequences were submitted to the PlantCARE website9 to analyze the cis-acting elements of its family members (Guo et al., 2007; Su et al., 2020; Wang et al., 2020a). The resulting file was imported into GSDS10 for visualization.
Expression Patterns of GmTIFY Genes
The RNA-seq data of GmTIFY family members in different tissues and organs were downloaded from the Phytozome database.11 The transcriptome data of several abiotic stresses were obtained from previous studies (NCBI SRA accession: PRJNA694374; Shi et al., 2018). TBtools software was used to visualize the expression levels of GmTIFYs.
Plant Materials, Stress Treatments, and Real-Time Fluorescence Quantitative PCR
The soybean variety Zhonghuang39 was used for this study. The soybeans were planted in a greenhouse in a mixture of humus and vermiculite (humus: vermiculite = 1:1). Seven-day-old soybean seedlings were treated with 10% PEG6000 and 250 mM NaCl, respectively. The samples were collected at 0, 0.5, 1, 2, 4, 8, 12, and 24 h after treatments (Li et al., 2017; Zhang et al., 2019).
An RNA plant extraction kit (Zhuangmeng, Beijing, China) was used to extract total RNA from soybean leaves and TranscriptR All-in-One First-Strand cDNA Synthesis SuperMix (TransGen Biotech, Beijing, China) was used for reverse transcription. The primers designed by Primer Premier 5.0 software were listed in Supplementary Table 1. The eukaryotic elongation factor 1-β (GmELF1b) was used as the internal control (Jian et al., 2008). An Applied Biosystems 7500 Real-Time PCR System was used to perform RT-qPCR. The 2−ΔΔCT method was used to analyze the quantitative results analysis (Udvardi, 2008PC). Each experiment was performed with three biological replicates.
Subcellular Localization Assay
Pectinase and cellulase were used to lyse fresh Arabidopsis leaves and obtain Arabidopsis protoplasts. The gene coding regions were cloned into the 16318hGFP expression vector. The fusion expression vector GmTIFY10e-hGFP and GmTIFY10g-hGFP were transformed into Arabidopsis protoplasts mediated by PEG4000, respectively (He et al., 2016). After 18 h of incubation at 22°C in the dark, the GFP fluorescence signal was detected using a laser confocal microscope (Zeiss LSM 700, Germany; Riechmann et al., 2000).
Obtaining Transgenic Arabidopsis and Salt Stress Treatment
Arabidopsis (Col-0) seeds were sterilized with 75% alcohol for 15 min. Sterilized Arabidopsis seeds were sprinkled on ½ MS medium and maintained at 4°C for 4 days, after which they were moved to a growth incubator at 22°C under a 16 h light and 8 h dark cycle. When the seedlings grew to four leaves, they were transferred to a mixture of humus and vermiculite for subsequent experiments (Riechmann et al., 2000; Du et al., 2018).
The coding regions of the GmTIFY genes were subcloned into the pCAMBIA1302 vector. The constructed pCAMBIA1302-GmTIFY10e and pCAMBIA1302-GmTIFY10g were transformed into Arabidopsis using the floral dip method, respectively (Clough and Bent, 1998). Positive lines were selected on ½ MS medium plates containing hygromycin (35 mg/L) and were further verified using PCR. The same method was used until transgenic three generation (T3). The expression levels of transgenic lines were determined by RT-qPCR and three homozygous T3 lines with the highest expression levels were used for the subsequent phenotypic analysis (Li et al., 2017).
For the experiment of root growth, 5-day-old seedings were transferred to MS medium and MS medium with 125 mM NaCl for another 7 days, after which the lengths of primary root and fresh weights were measured (Wang et al., 2019). For salt treatment, 5-day-old seedlings were transferred to the soil, and then, 21-day-old seedlings were treated with 250 mM NaCl for 14 days (Wang et al., 2019). All experiments contained three independent replicates.
Obtaining Soybean Hairy Roots by Agrobacterium rhizogenes-Mediated (A. rhizogenes-Mediated)
To obtain the overexpression vector of GmTIFY genes, the coding regions of GmTIFY genes were ligated with the pCAMBIA3301 vector to obtain recombinant plasmids (Kereszt et al., 2007; Zhao et al., 2017). To obtain the RNA interference expression vector, a 546 bp interference fragment consisting of a 200 bp target fragment and its antisense sequence connected by 146 bp zeol dehydrogenase gene sequence was synthesized and inserted into pCAMBIA3301 (Wang et al., 2019).
The constructed overexpression vector, interference expression vector, and empty pCAMBIA3301 vector were transferred to the Bacillus rhizobacillus (B. rhizobacillus) strain K599, and the recombinant vector was transferred to the hypocotyl of soybean via the A. rhizogenes-mediated method (Wang et al., 2015). The injected plants were cultured under high humidity conditions in a greenhouse until hairy roots grew at the infected site. When the hairy root reached about 5 cm long, the hypocotyl was removed below 0.5–1 cm of the infection site. At the same time, the seedlings were transplanted in mixed soil and cultured in the greenhouse for 7 days (Wang et al., 2020a). The positive soybean plants were subjected to salt stress test.
Measurement of Physiological Indicators and Nitroblue Tetrazolium Staining
The leaves and roots of plants were used to determine physiological indicators under salt stress. A Physiological Index Test Kit (Cominbio, Suzhou, China) was used to test the contents of malondialdehyde (MDA), proline (PRO), catalase (CAT), and peroxidase (POD) in leaves and roots (Shi et al., 2018). The whole leaves and roots were soaked in nitroblue tetrazolium (NBT) for overnight staining. After staining, the samples were soaked in a decolorizing solution (30% glycerol and 70% ethanol) to decolorize the sample until it turned white (Du et al., 2018). All experiments were performed in three biological replicates.
Enrichment Analysis of Co-expression Genes
The co-expression genes were obtained from the Phytozome database. The enrichment analysis was performed by Database for Annotation, Visualization and Integrated Discovery (DAVID) online tools.12 R software was used to visualize the results of the enrichment analysis.
Statistical Analysis
One-way ANOVA test analysis was performed in Microsoft Excel 2007. Data were shown as means ± standard deviation (SD), with a p-value cutoff of 0.05 and 0.01. The method was used to analyze the RT-qPCR results and physiological indicators.
Results
Screening and Identification of GmTIFY Genes
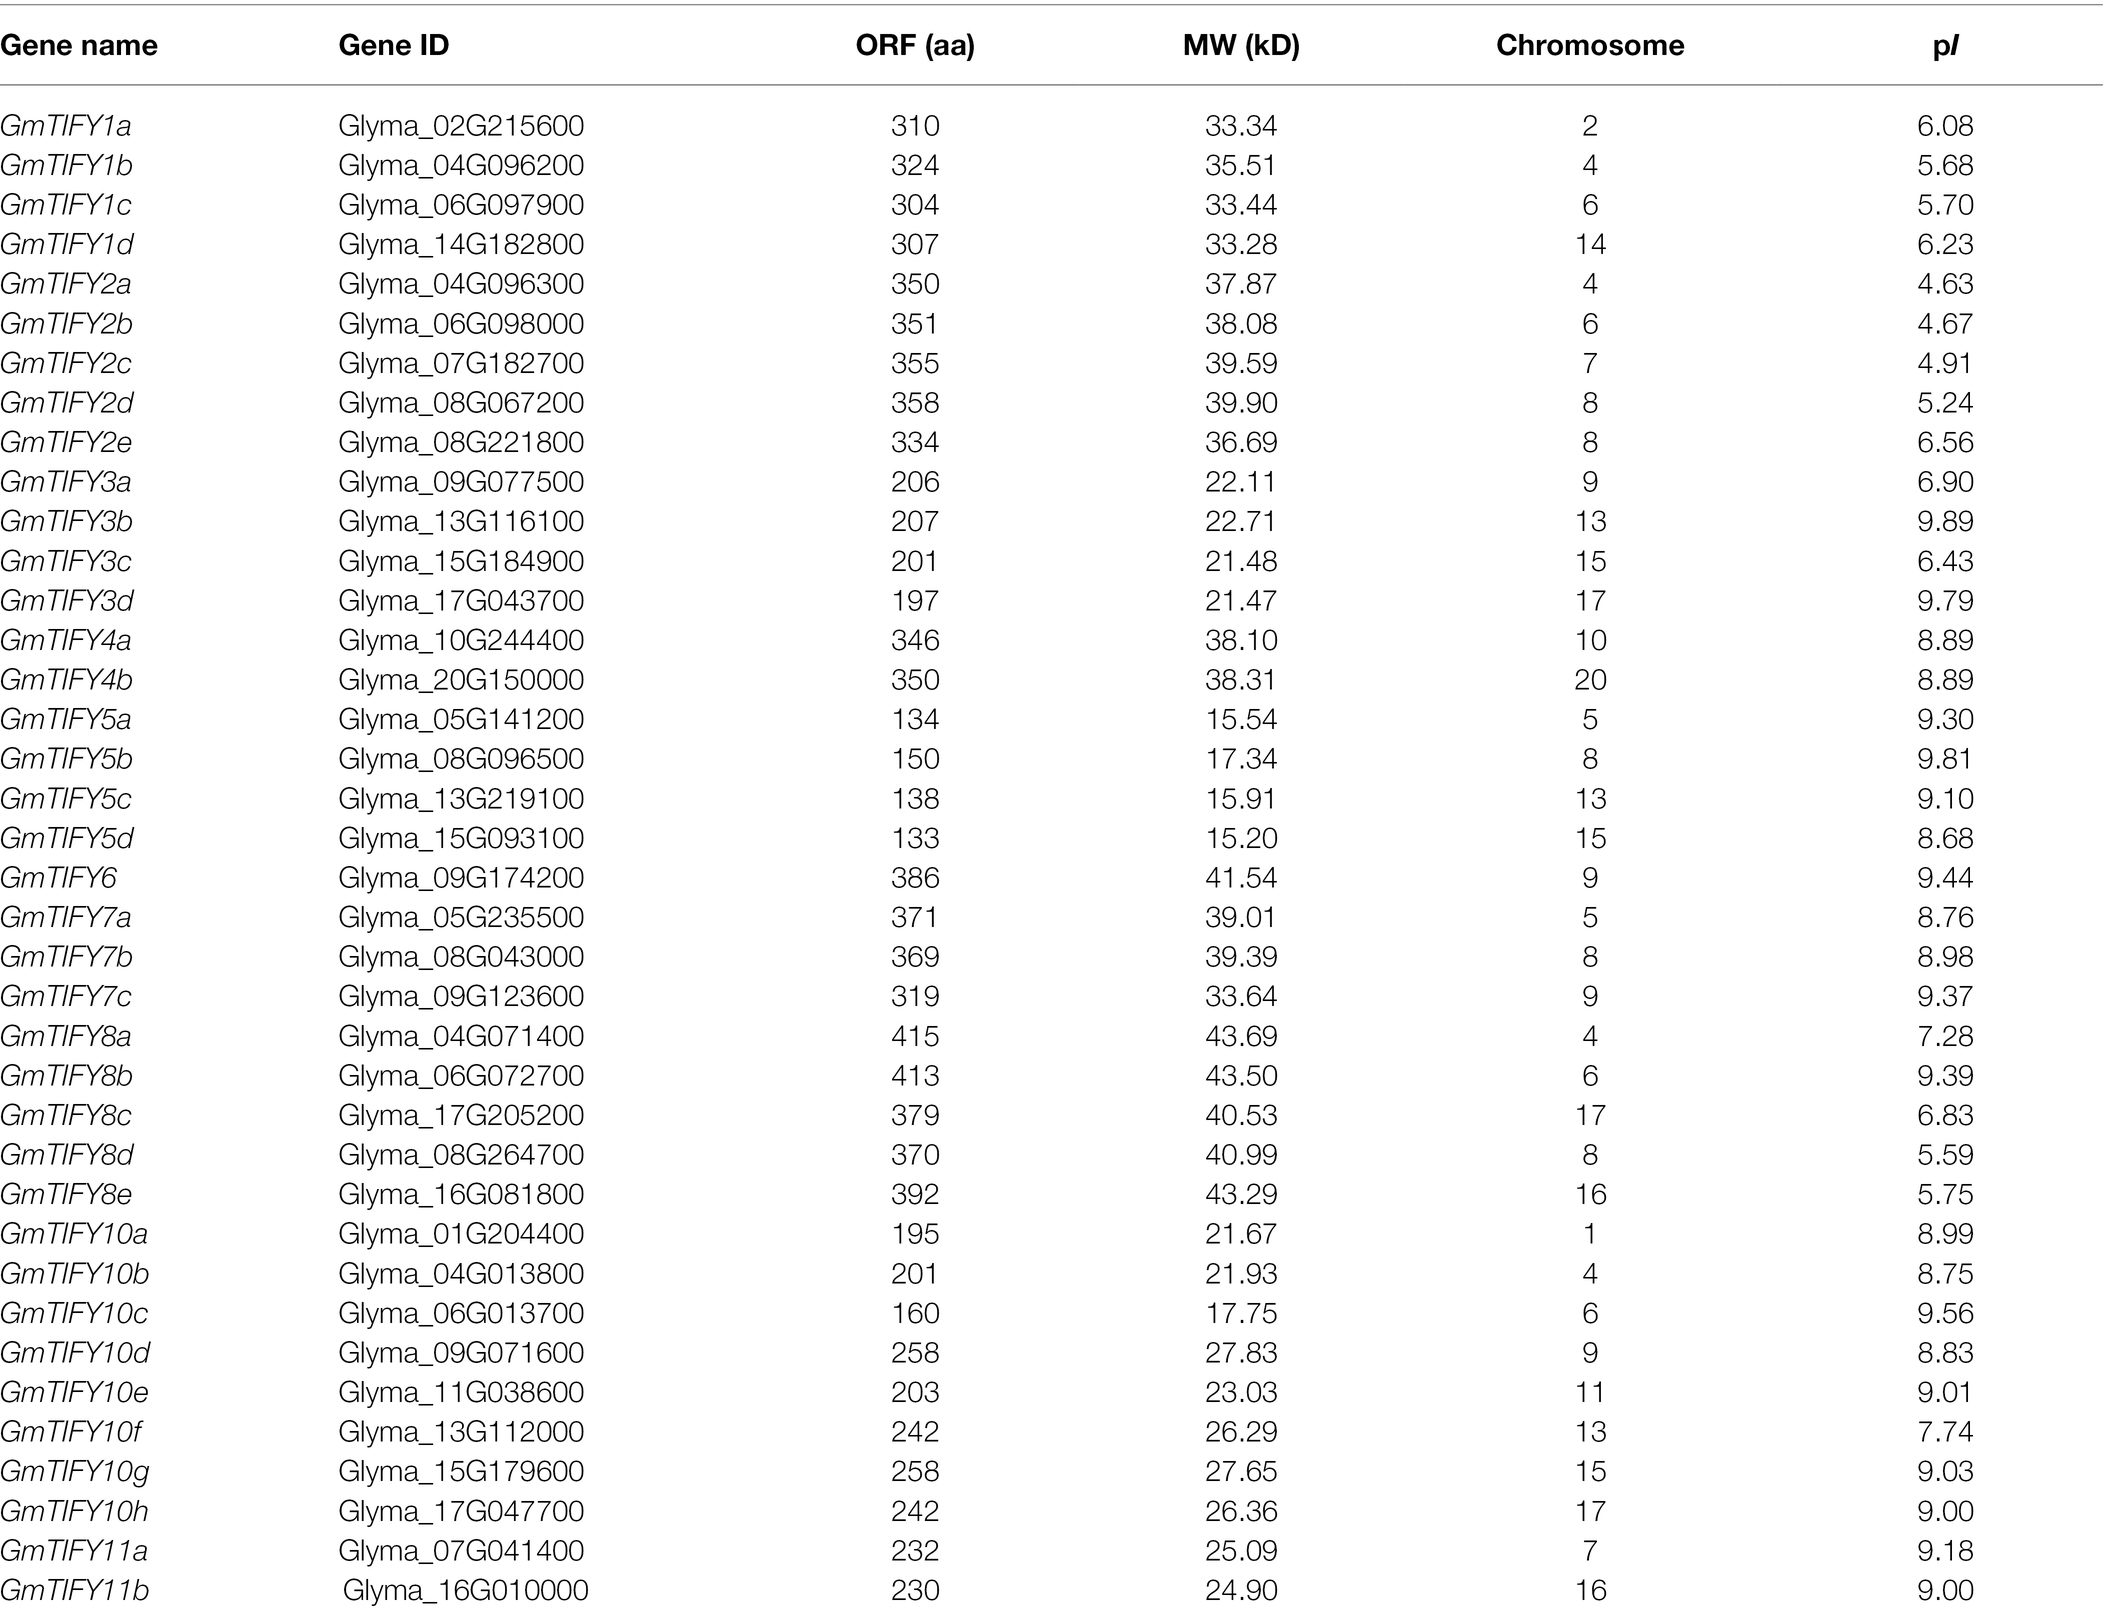
The BLASTp program and hmmsearch program were used to search for TIFY genes in databases of Arabidopsis, rice, soybean, apple, and grape. We then compared the results of two programs and identified the TIFY domain using SMART and CDD to confirm TIFY members in five species. Finally, 38 GmTIFY genes were identified in the soybean genome. The number of TIFY genes in Arabidopsis (18), rice (20), grape (19), and apple (30) are consistent with previous reports (Ye et al., 2009; Bai et al., 2011; Li et al., 2014). The GmTIFY genes were named according to their relationship with Arabidopsis and their location on the chromosomes (Table 1). The protein lengths, molecular weights (MV), and isoelectric points (pI) are provided in Table 1. In 38 GmTIFY genes, the coding sequences range from 133 (GmTIFY5d) to 415 aa (GmTIFY8a); the MW ranges from 15.20 (GmTIFY5d) to 43.69 kD (GmTIFY8a) and the pI ranges from 4.63 to 9.89.
Phylogenetic Analysis of GmTIFY Genes
To investigate the phylogenetic relationships of GmTIFYs, we constructed a phylogenetic tree using TIFY genes from Arabidopsis, rice, soybean, grape, and apple (Figure 1). The TIFY genes were divided into four subfamilies of TIFY, JAZ, ZIM, and PPD according to specific domains (Zhang et al., 2012). The JAZ subfamily contains the largest number of TIFY genes including 12 AtTIFY genes, 11 VvTIFY genes, 22 GmTIFY genes, 22 MdTIFY genes, and 16 OsTIFY genes. The ZIM subfamily contains three AtTIFY genes, five VvTIFY genes, nine GmTIFY genes, two MdTIFY genes, and two OsTIFY genes. The PPD and TIFY subfamilies have no genes in monocotyledon plants which is consistent with the previous research results (Zhang et al., 2012; Li et al., 2014). There are two AtTIFY genes, two VvTIFY genes, two GmTIFY genes, and two MdTIFY genes in PPD subfamily and one AtTIFY genes, one VvTIFY genes, five GmTIFY genes, and four MdTIFY genes in TIFY subfamily. Further analysis revealed that the number of TIFY genes in soybeans and apples was almost twice than that of Arabidopsis and grapes. This may result from more events of chromosomes doubling, fusion and rearrangement occurred in soybean and apple evolution. Interestingly, we found the expression levels of GmTIFYs were significantly upregulated in our previous transcriptome data of drought, salt, and ABA treatments which were all TIFY10 and TIFY11 homologous genes. The transgenic Arabidopsis lines of AtTIFY10a and AtTIFY10b showed higher salt tolerance than WT plants (Zhu et al., 2014). We speculated that the GmTIFY10 and GmTIFY11 homologous genes may be involved in responding to salt stress.
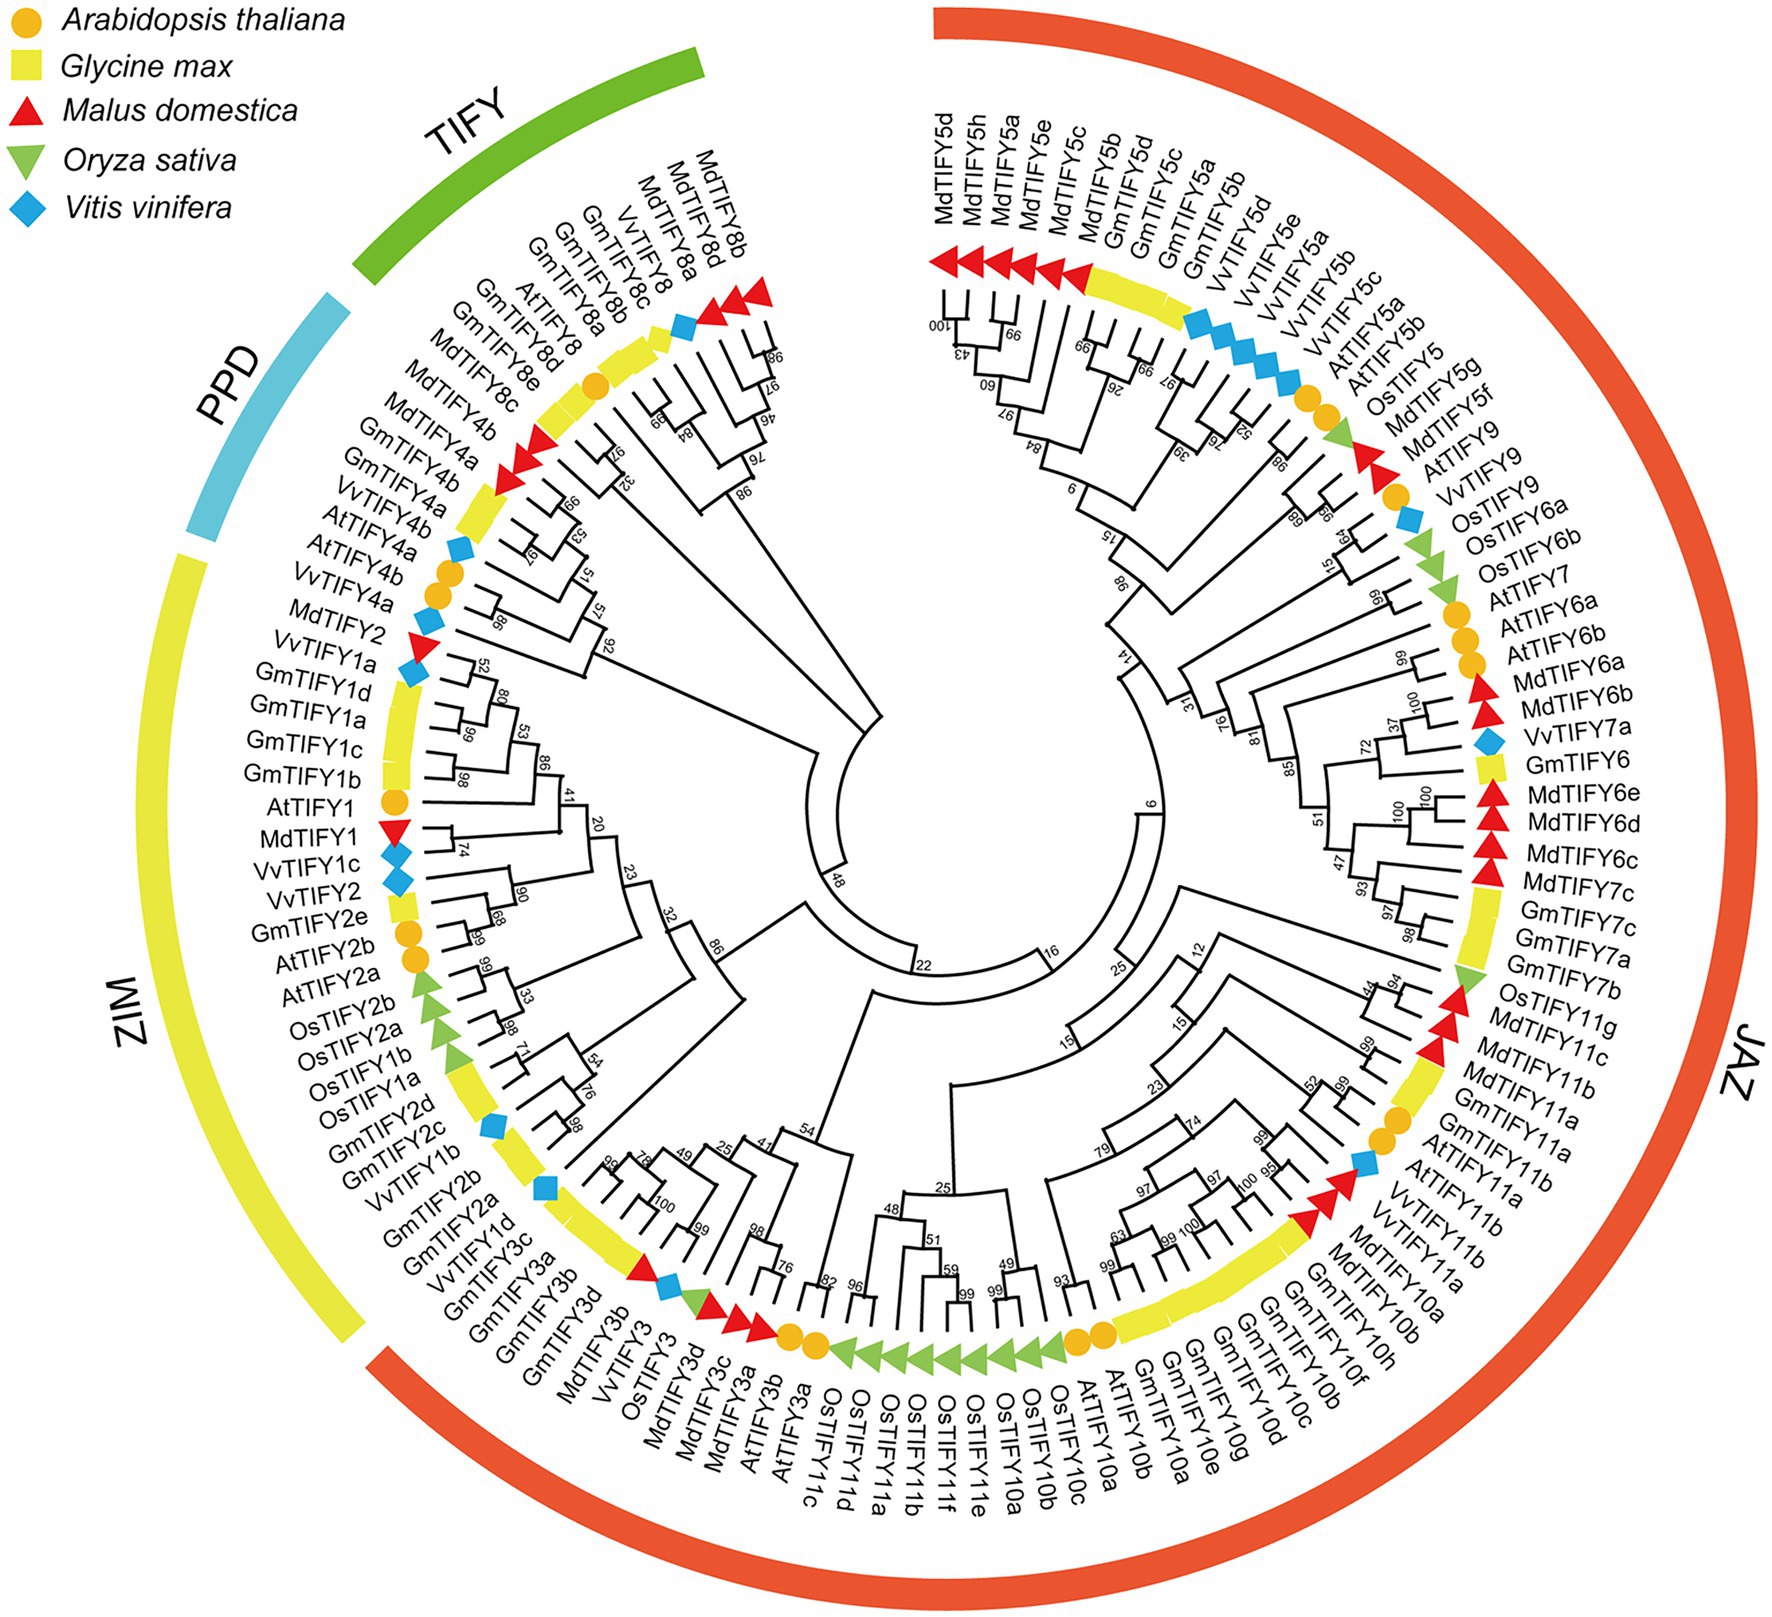
Figure 1. The phylogenetic tree of TIFY proteins from Arabidopsis, rice, grape, apple, and soybean. Multiple sequence alignment was performed by MEGA-X and the phylogenetic tree was constructed using the ML method. The TIFY, JAZ, PPD, and ZIM subfamilies are represented by different colors.
Chromosomal Location and Gene Duplication
In the soybean genome, 38 GmTIFY genes are irregularly distributed on 16 chromosomes (Figure 2). The duplication events analysis demonstrated that nine GmTIFY genes were singletons and 29 GmTIFY genes experienced gene duplication events, including eight genes with segmental duplication and 21 genes with dispersed duplication (Figure 3). The most duplication events occurred in the JAZ subfamily (29 times). Only one duplication event occurred in the PPD subfamily. Further analysis demonstrated that large segmental chromosome duplication events occurred between chromosomes 4/6 and chromosomes 10/20. The most duplication events were identified in the TIFY10 homologous genes in the JAZ subfamily (15 times).
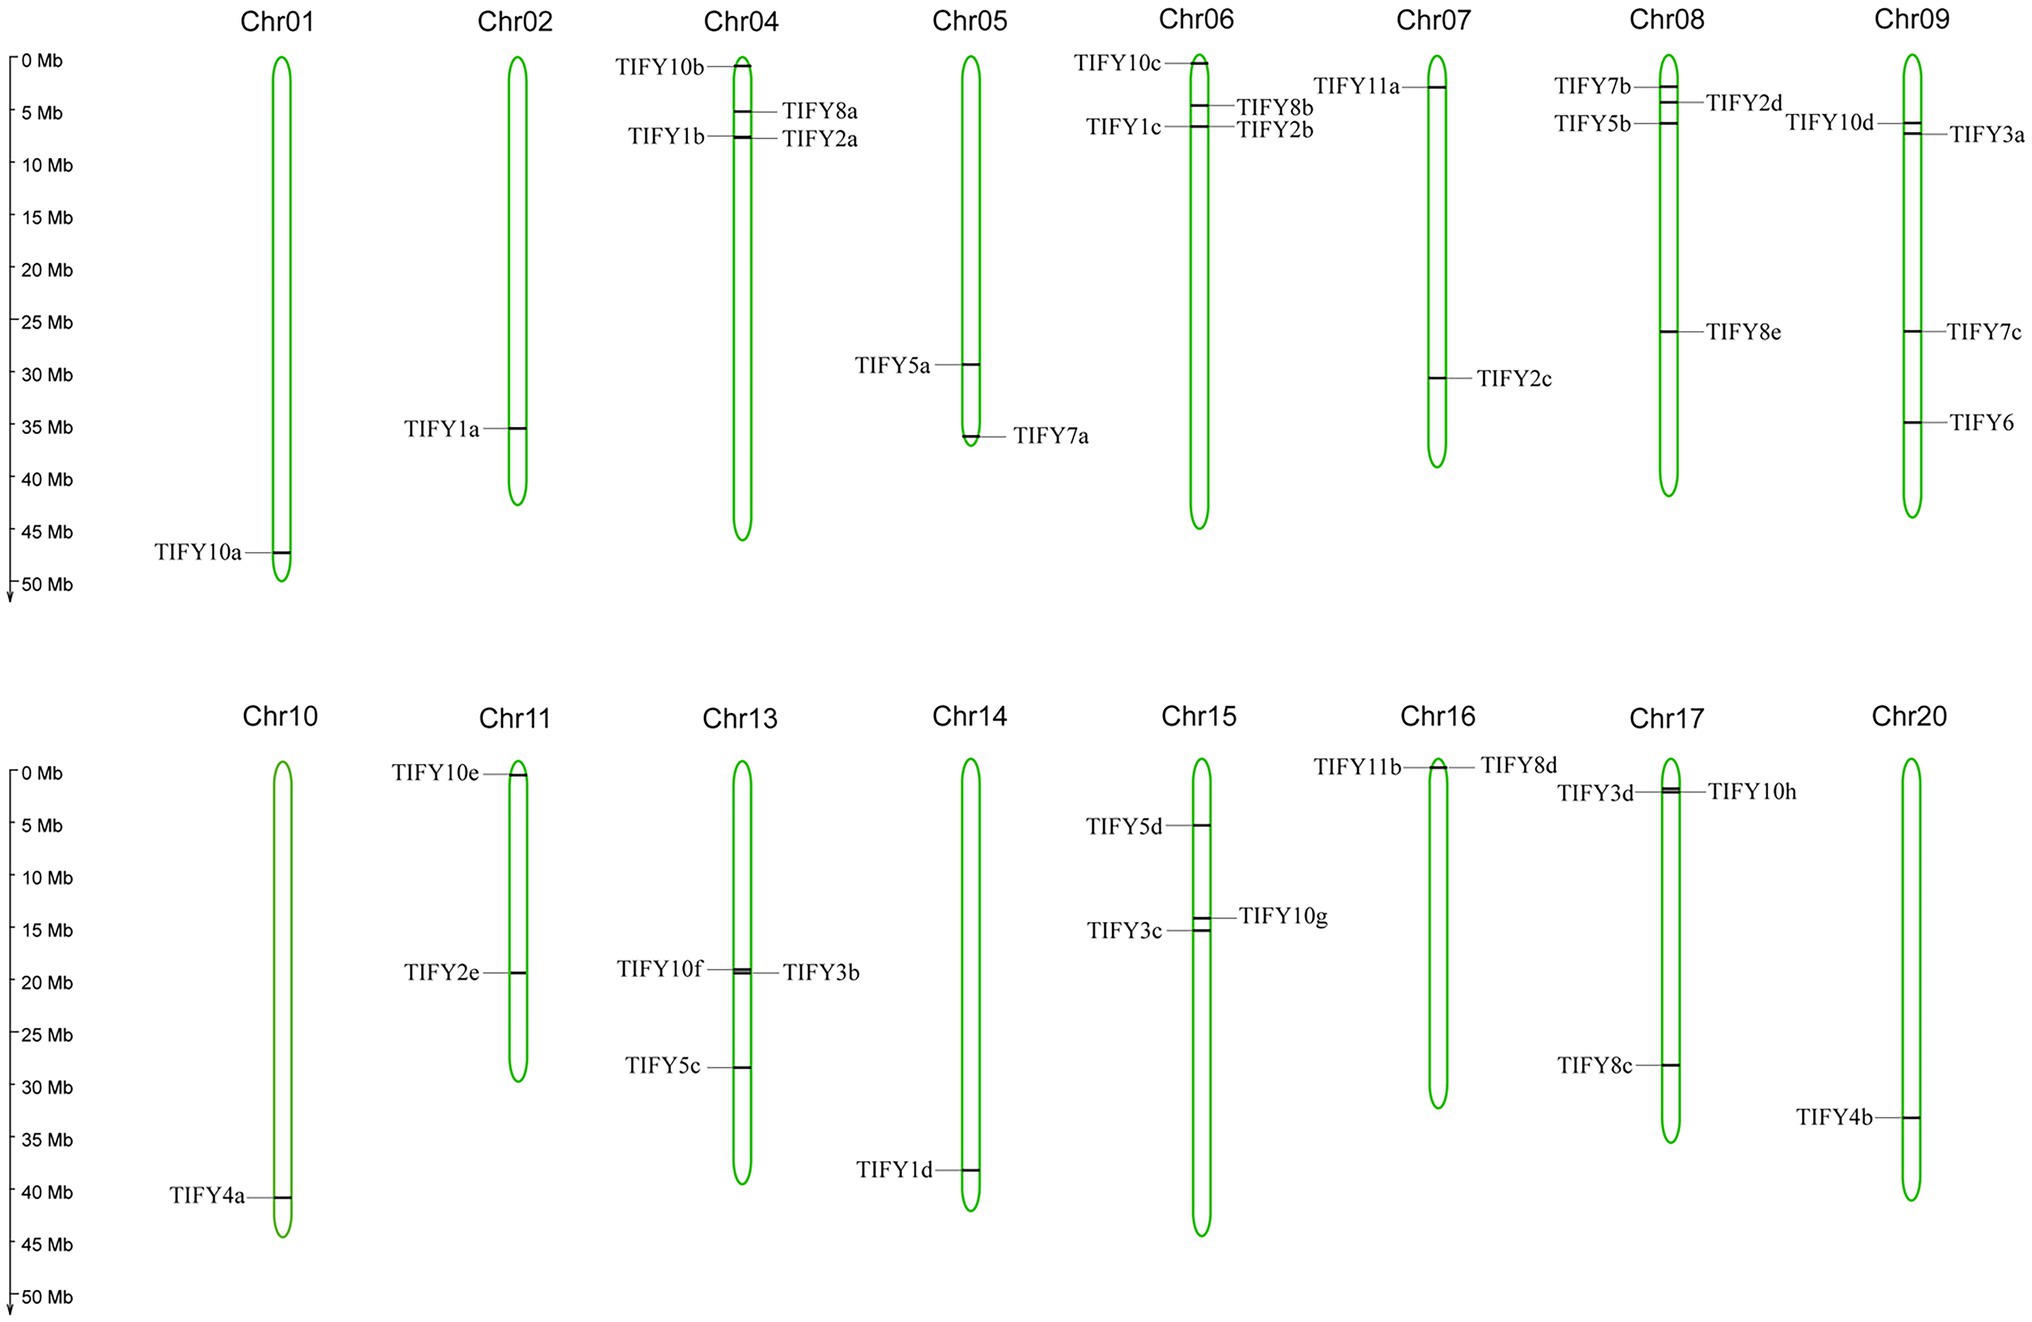
Figure 2. The location of 38 GmTIFY genes on the soybean chromosome. The scale bar on the left indicates the size of the chromosomes.
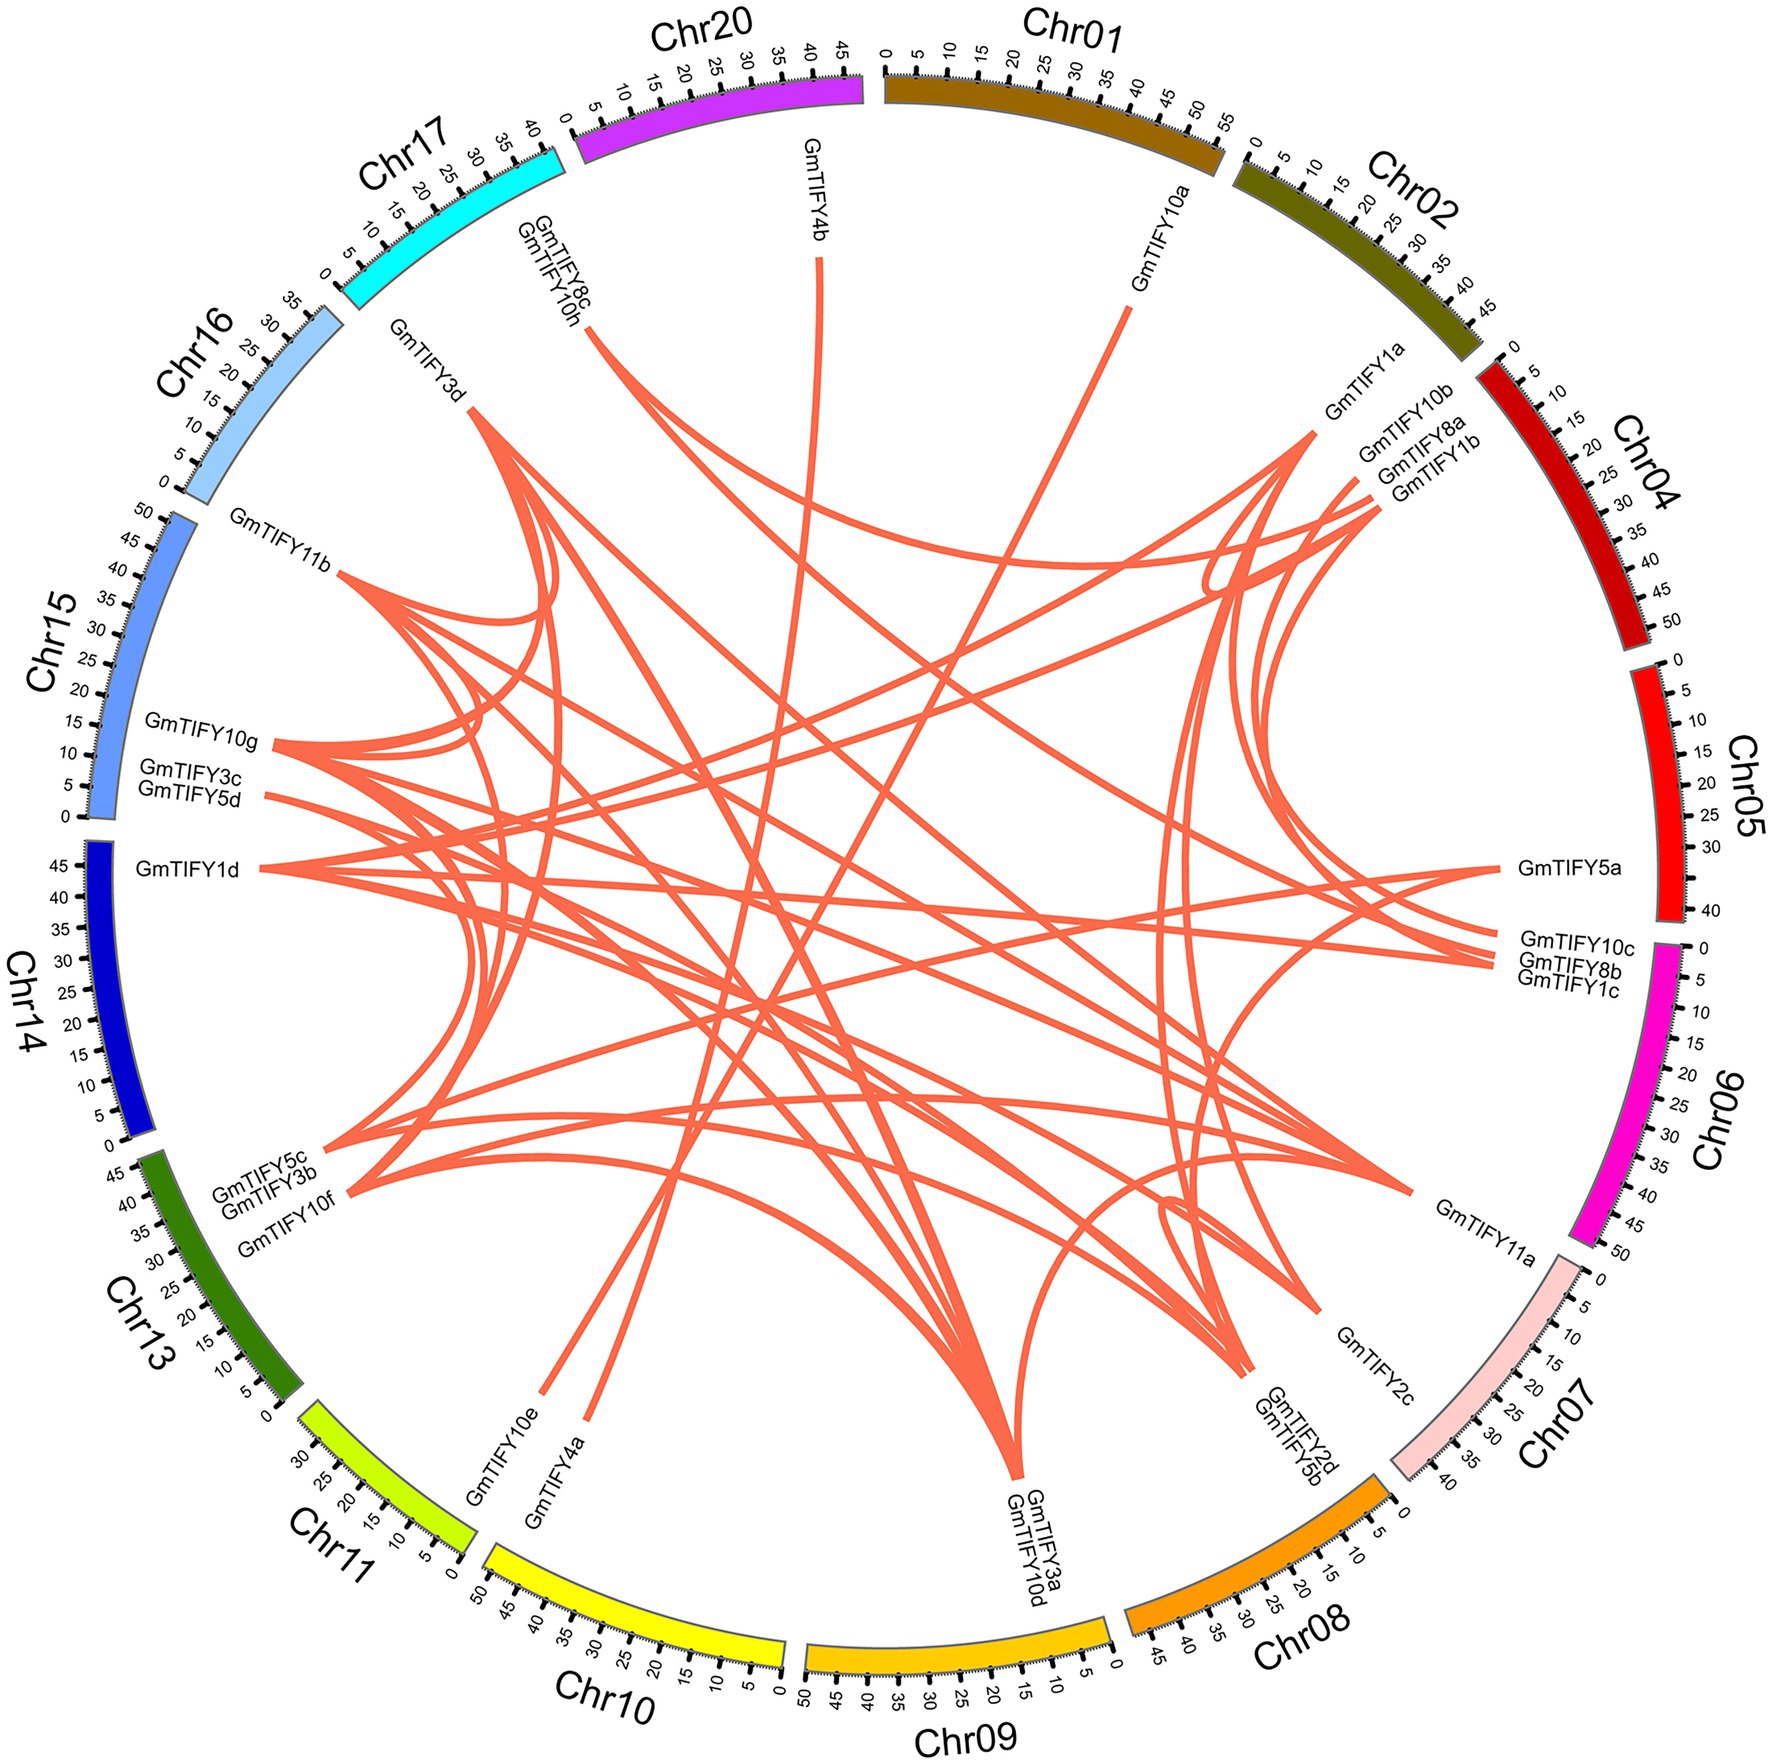
Figure 3. Distribution of segmentally duplicated GmTIFY genes on soybean chromosomes. Red lines indicate duplicated GmTIFY gene pairs.
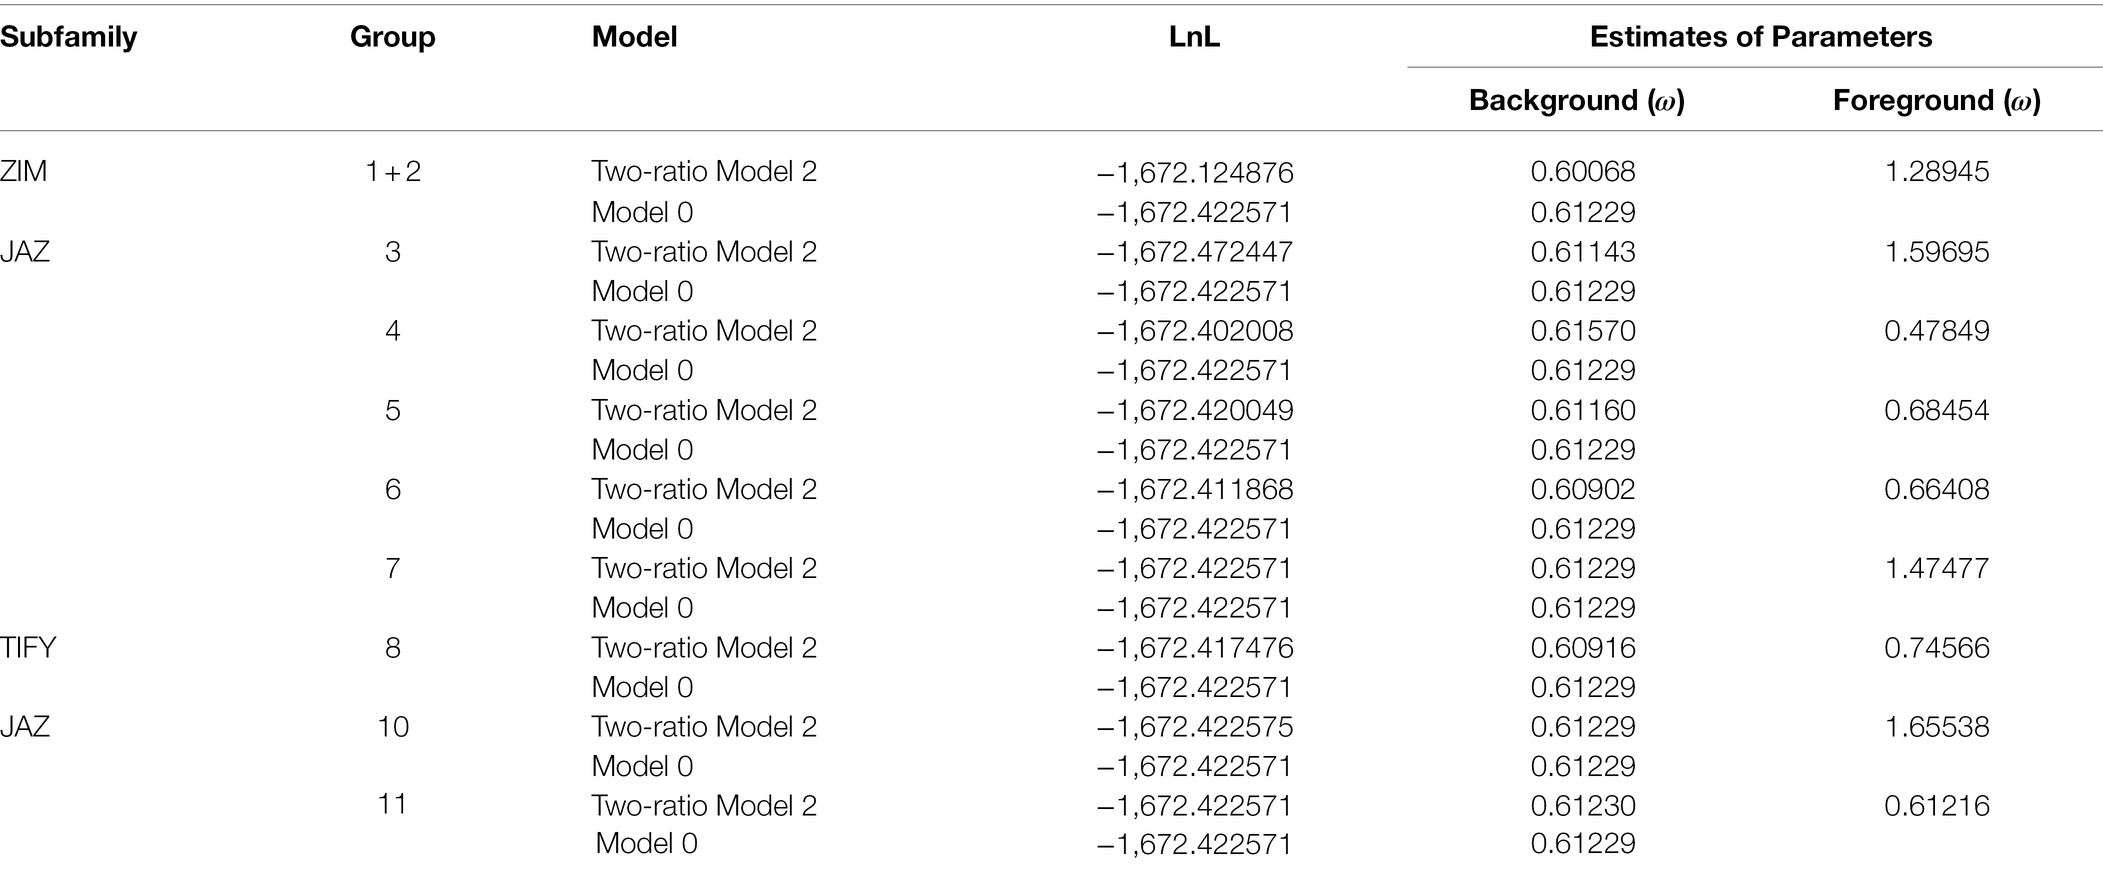
To determine the significance of GmTIFY family genes during evolution, the EasyCodeML software was used to test the selective pressure of GmTIFY genes including purification selection, positive selection, and negative selection (Table 2). Since the TIFY1 and TIFY2 homologous genes are always grouped together in the evolutionary tree, we calculated their total ω. The positive selection of GmTIFY1, GmTIFY2, GmTIFY3, GmTIFY7, and GmTIFY10 homologous genes exceeded 1, which indicated that these TIFY homologous genes experienced positive selection during their evolutionary history.
Gene Structure, Motif Composition, and cis-Element Analysis of GmTIFY Genes
The structural characteristics of GmTIFY family genescan be obtained by analyzing the phylogenetic tree, motifs, and positions of exons and introns (Figure 4). These results showed that genes belonging to the same phylogenetic group have similar motifs and exon/intron structures. According to previous studies of TIFY genes, GmTIFY family genes were divided into four subfamilies (TIFY, JAZ, PPD, and ZML) with different structural features. Five conserved motifs were found based on the analysis of TIFY protein sequences (Figure 4B). Motif 1 was identified as TIFY domain and distributed in all genes. Motif 2 (Jas domain) was contained by the JAZ and PPD subfamily genes. Motif 3 and 4 were identified as the sequence of CCT domain and the ZnF_GATA domain in ZIM subfamily, respectively. The PPD subfamily contains motif 1, 2, and 5, while motif 2 of the PPD subfamily lacks a PY motif which different from the original Jas domain. There was no PPD motif sequence information in the Pfam database. The conservative motif 5 domain sequence was constructed with PPD subfamily genes which were previously annotated in Arabidopsis, apples, and grapes. The motif 5 was confirmed with sequences from the report of earliest defined PPD genes (Bai et al., 2011). Conserved sequences were submitted to the MEME online tool to generate the domain logo (Figure 4D). Analysis of the promoters through PlantCARE website revealed that GmTIFY family genes contain many abiotic stresses responsive cis-elements, such as ABA-responsive element (ABRE), MYB banding site (MBS), and methyl jasmonate-responsive element (MeJA element) (Supplementary Figure 1).
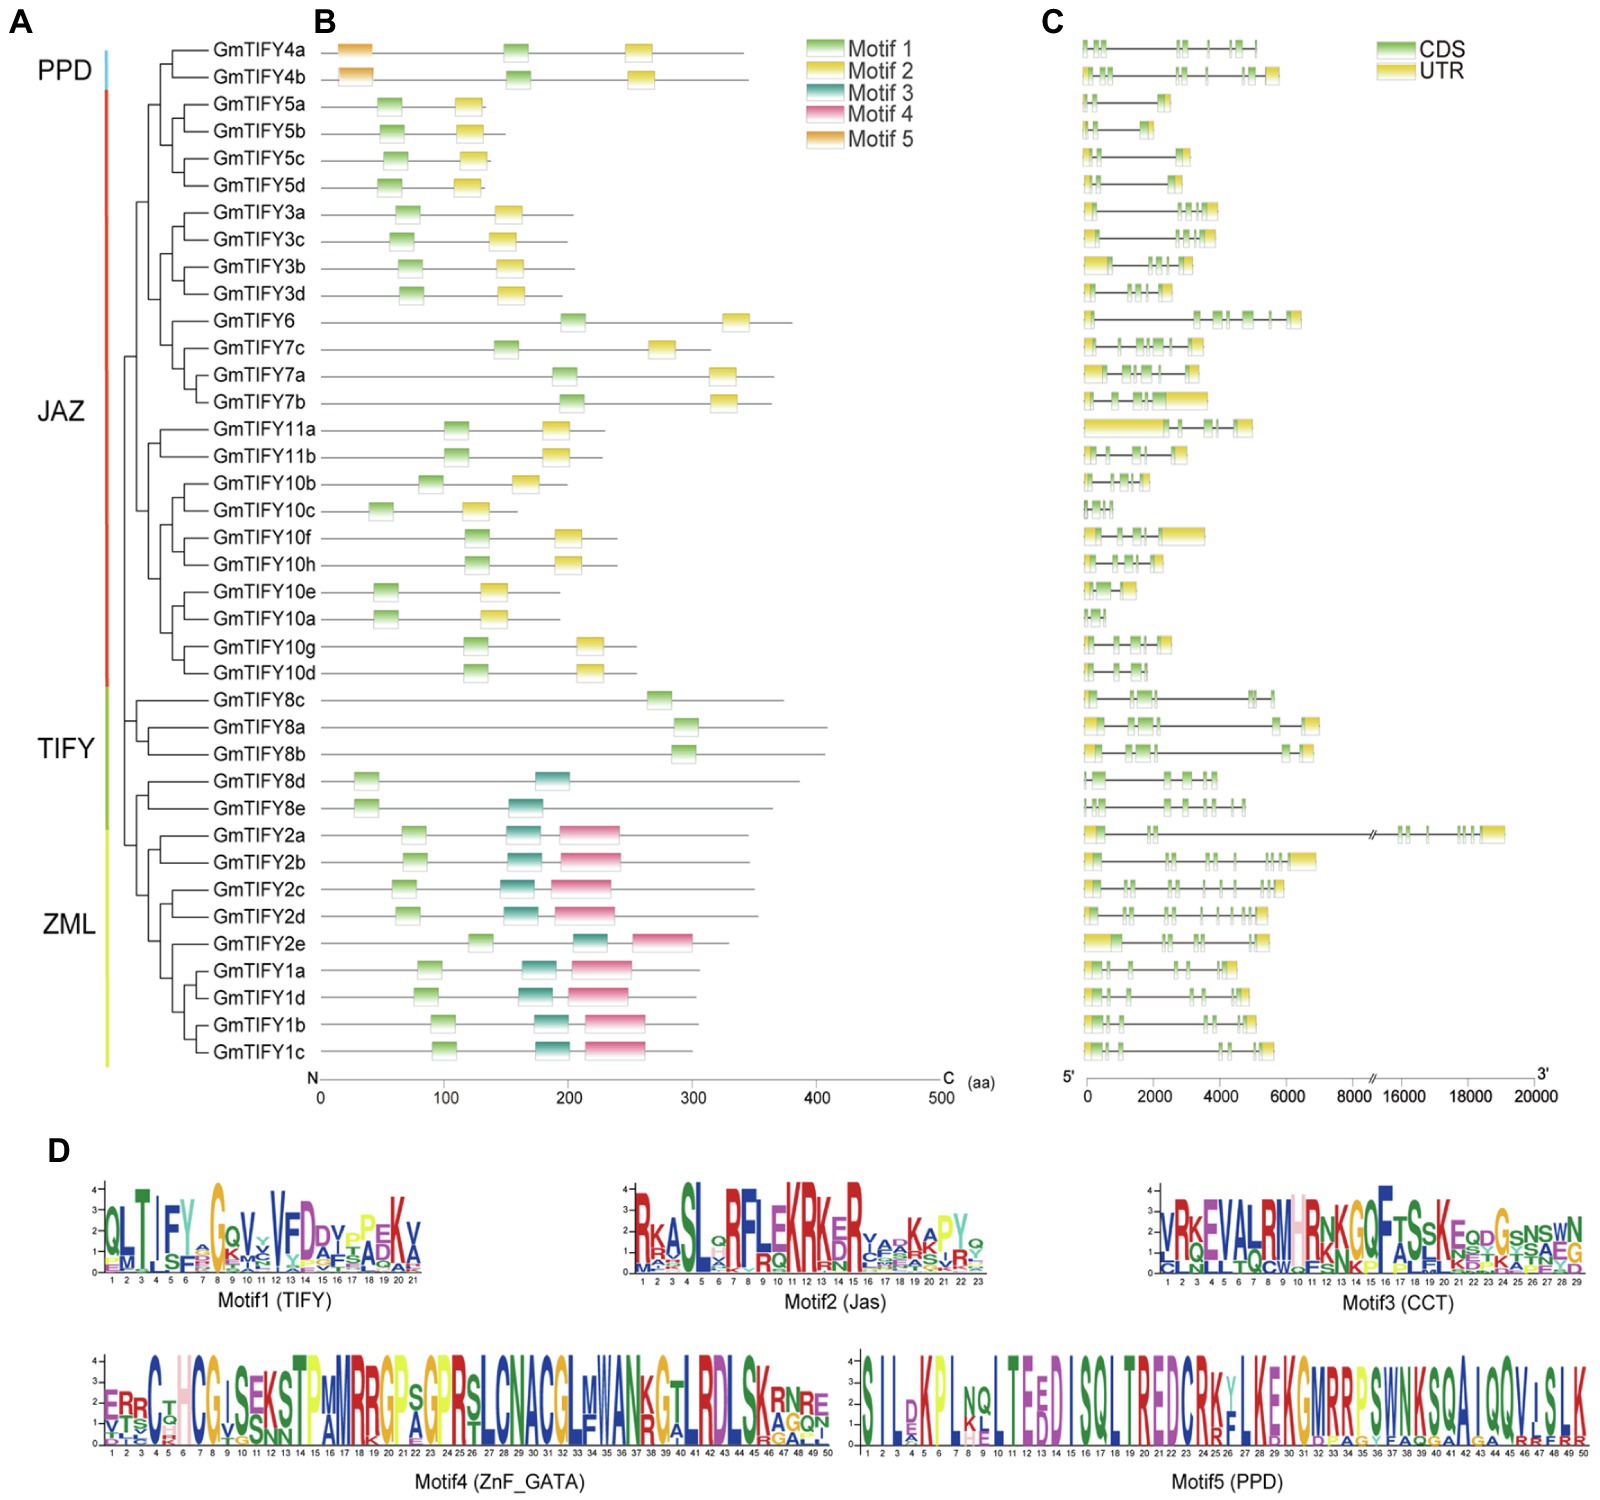
Figure 4. Phylogenetic relationships, conserved motifs, and gene structures of GmTIFY. (A) Phylogenetic tree of TIFY proteins from soybean constructed using the ML method. (B) Distribution of conserved motifs in GmTIFY proteins. Five putative motifs are indicated by colored boxes. (C) Exon/intron organization of GmTIFY genes. Green boxes represent exons and black lines represent introns. The upstream/downstream regions of GmTIFY genes are indicated by yellow boxes. The scale at the bottom is used to infer exons length. (D) Motif logos of five conservative motifs detected in GmTIFY proteins via MEME analysis.
Expression Patterns of GmTIFY Genes
To obtain the expression profiles of soybean GmTIFY genes in different tissues, RNA-seq data were downloaded from the Phytozome database and visualized by using the TBtools software (Figure 5). Results demonstrated that GmTIFY genes had significant expression differences in multiple tissues. The expression levels of most genes are relatively low in all tissues or are not even expressed. The homologous genes of TIFY3, TIFY5, TIFY10, and TIFY11 in the JAZ subfamily showed higher expression in the roots, stems, and leaves.
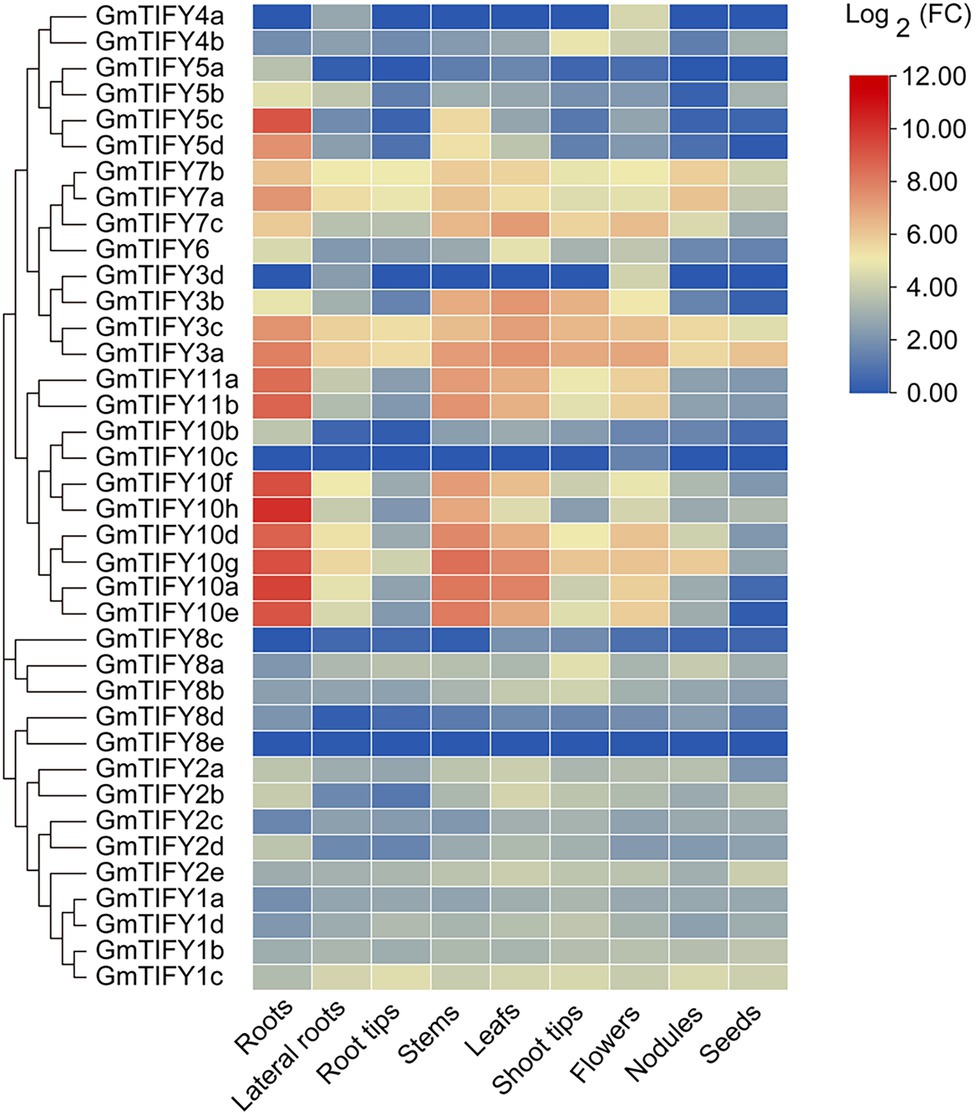
Figure 5. The expression profiles of 38 GmTIFY genes in different soybean tissues. The expression data of 38 GmTIFY genes in different tissues were obtained from the Phytozome database.
We analyzed the transcriptome data of GmTIFY genes under drought, salt and ABA treatment (Figure 6). Most TIFY10 and TIFY11 homologous genes significantly responded to salt treatment. From these homologous genes, six significantly upregulated candidate genes (GmTIFY10a, GmTIFY10e, GmTIFY10f, GmTIFY10g, GmTIFY11a, and GmTIFY11b) were selected and confirmed their expression level under drought and salt stress by RT-qPCR (Figure 7). The six genes were not significantly changed after drought treatment. After salt stress, the expression levels of six genes were significantly upregulated (>10-fold), especially GmTIFY10e and GmTIFY10g, which reached the peak at 1 h.
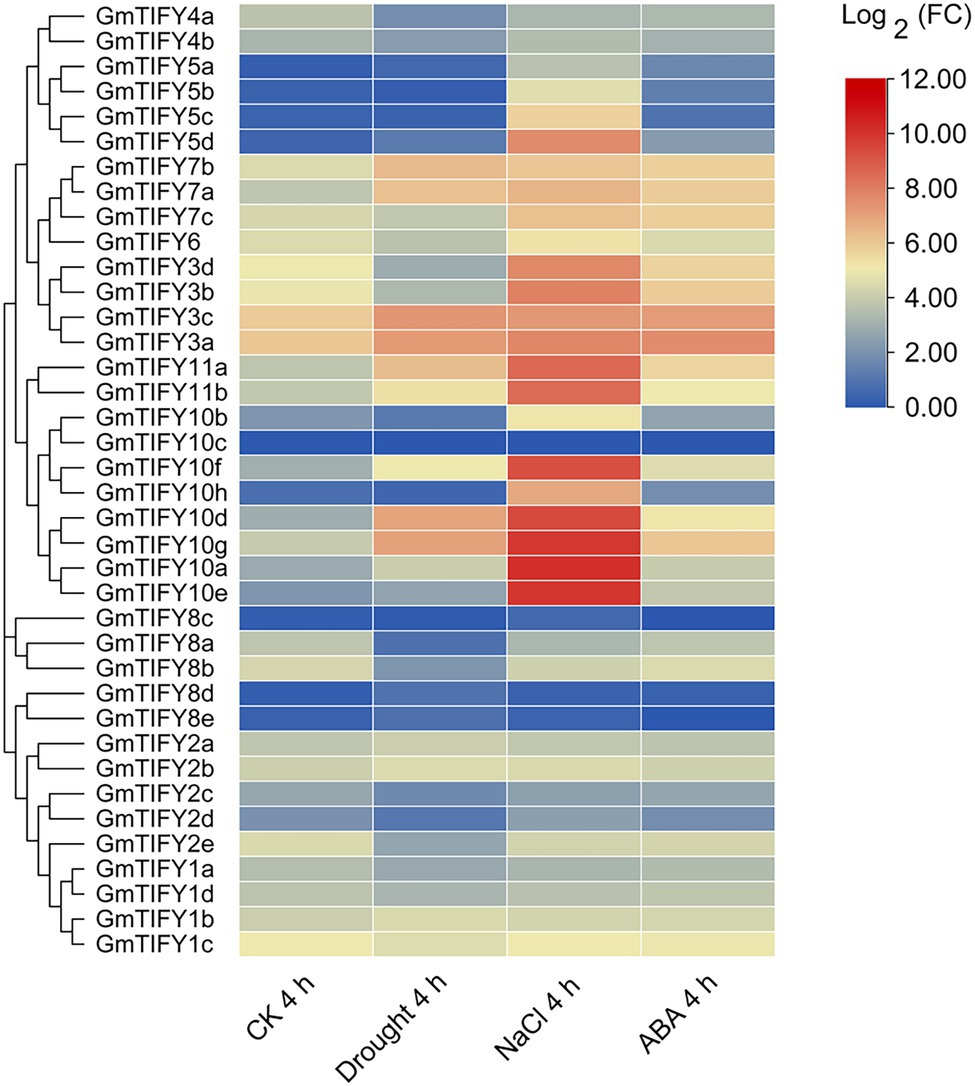
Figure 6. The expression profiles of 38 GmTIFY genes under different conditions including drought, salt and ABA treatments.
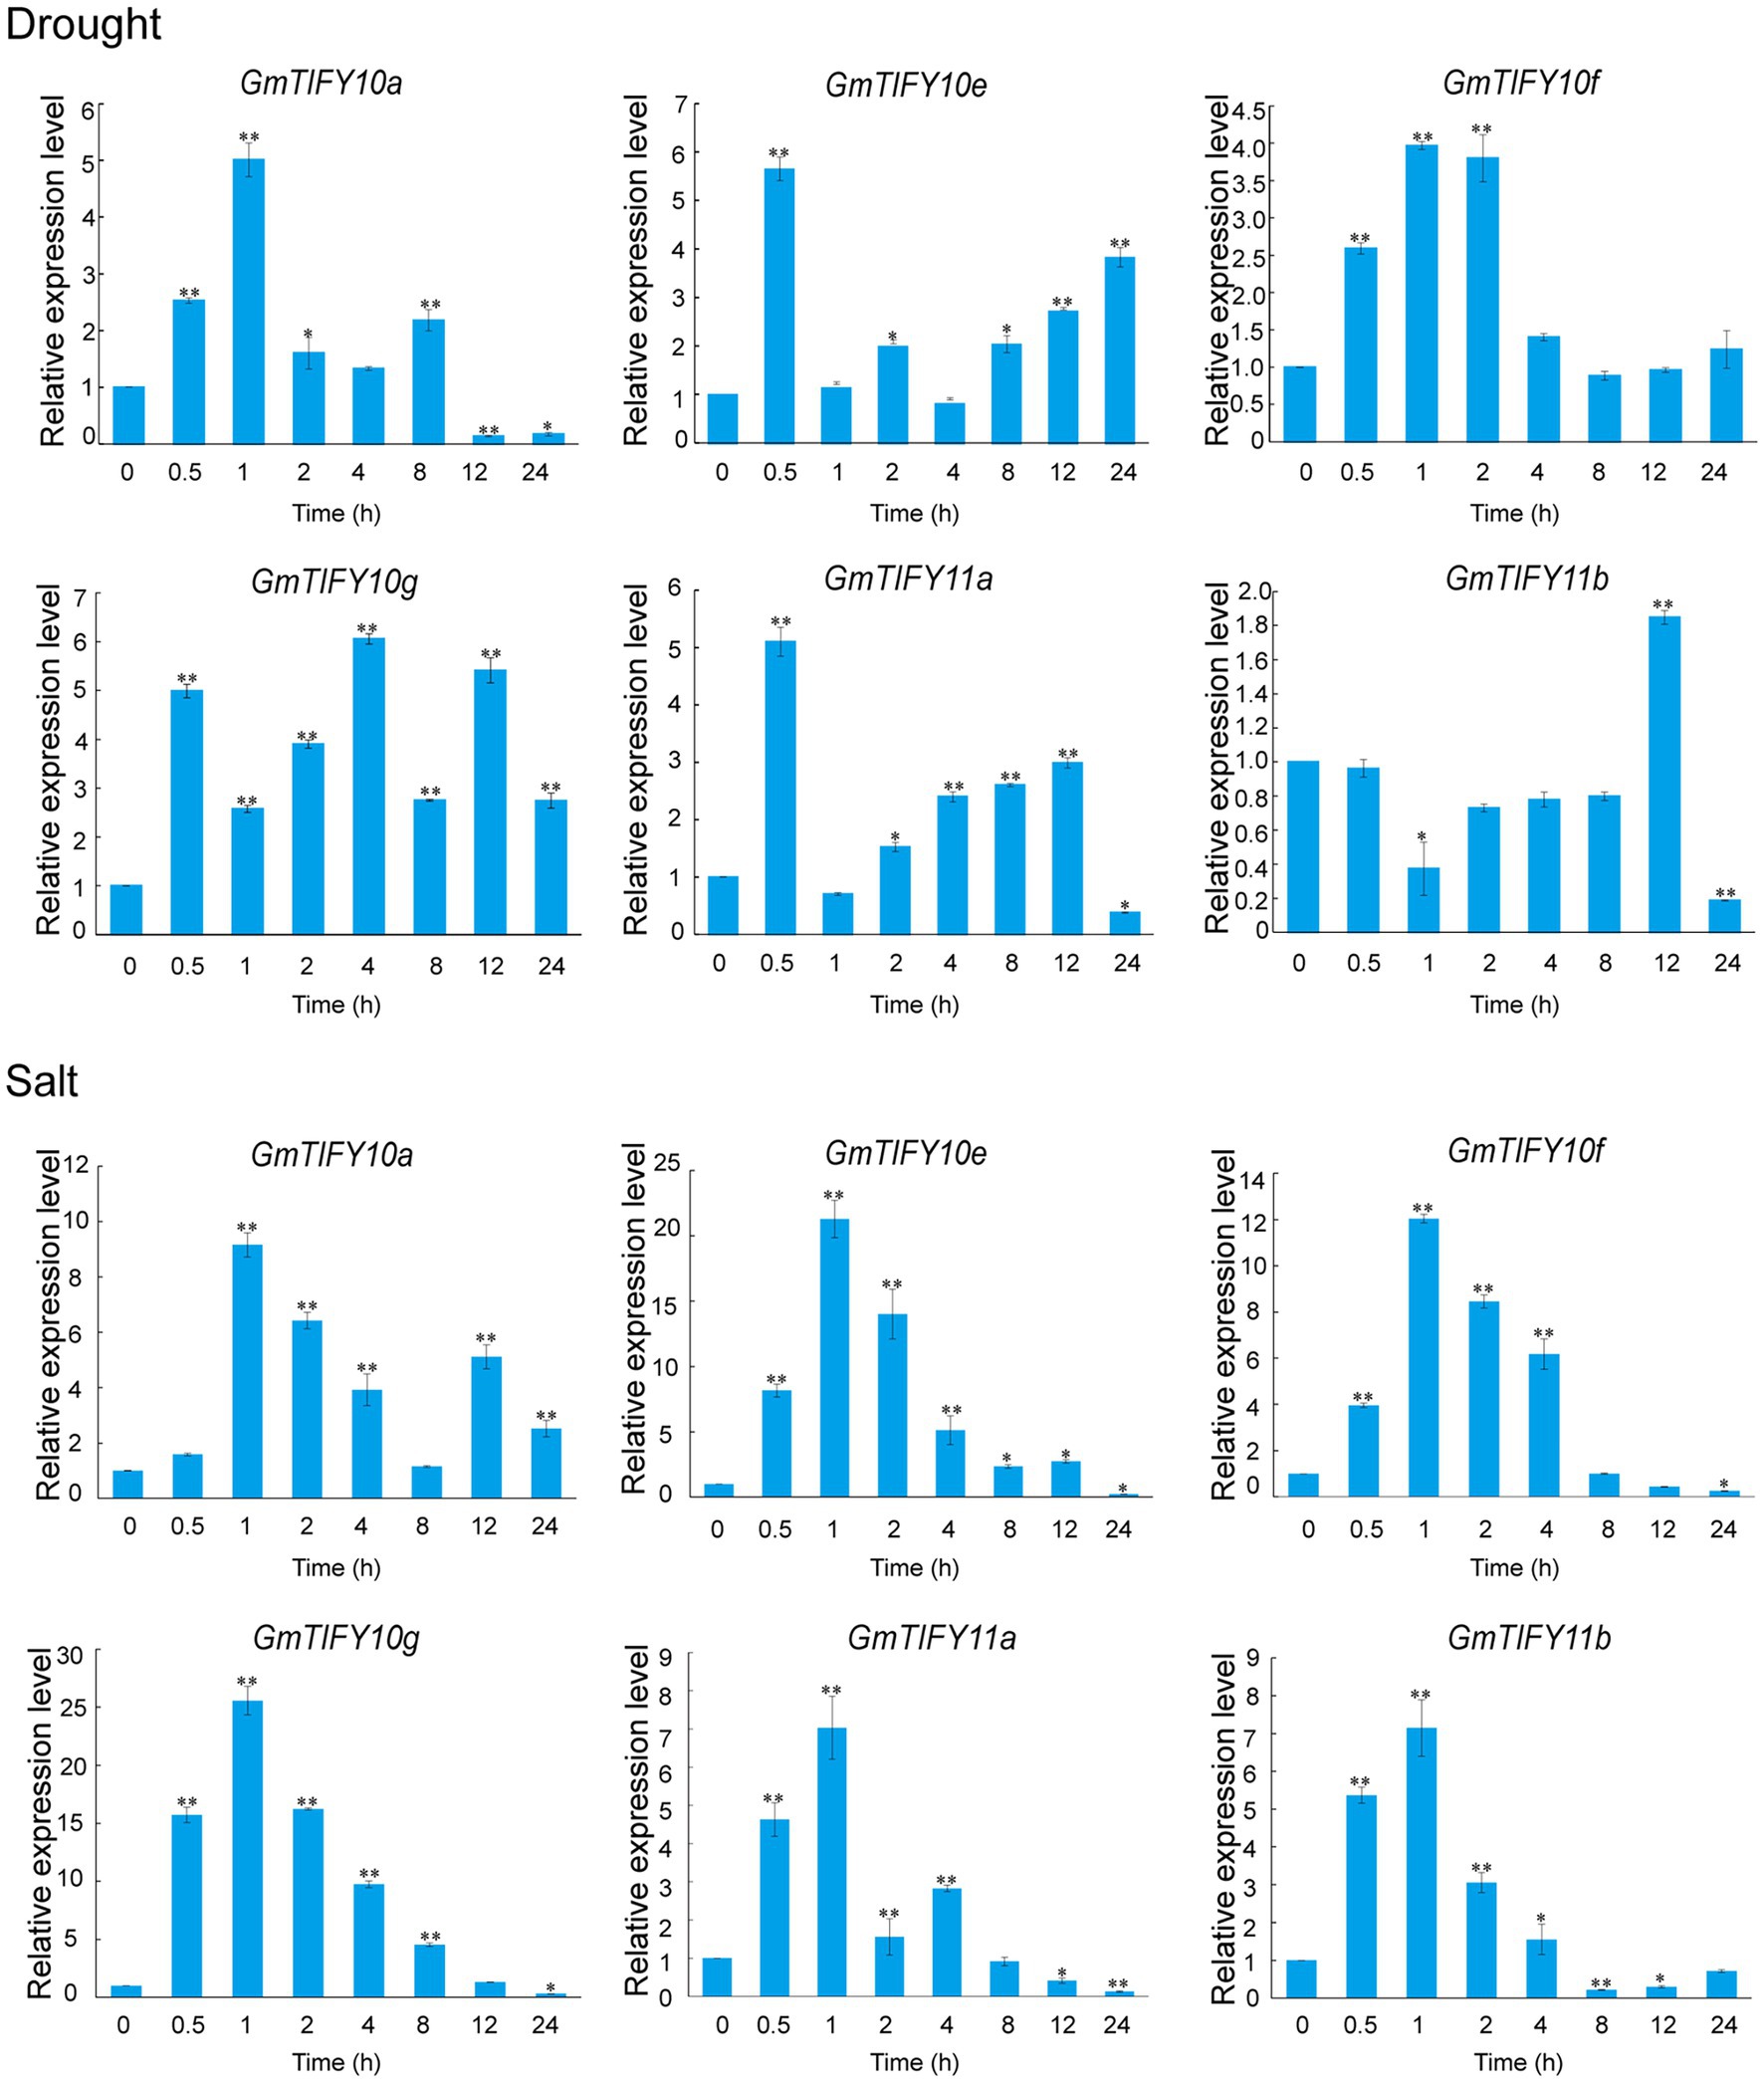
Figure 7. Expression patterns of GmTIFY genes under drought and salt stress conditions. Expression levels of six GmTIFY genes were measured using RT-qPCR at different times under drought and salt treatments. RT-qPCR data were normalized using GmELF1b as the reference gene and were displayed relative to 0 h. The x-axes show the duration of treatment, and the y-axes depict relative expression levels (error bars indicate SD). The data are shown as the means of three biological replicates ±SD. ANOVA test demonstrates that there are significant differences (*p < 0.05, **p < 0.01).
GmTIFY10e and GmTIFY10g Are Localized in the Nucleus
The results of the phylogenetic, duplication events, selective pressure, and expression profiles of GmTIFY genes indicated that GmTIFY10e and GmTIFY10g could play an important role in soybean. We selected GmTIFY10e and GmTIFY10g for further study, both of which significantly responded to salt stress. To determine the subcellular localization of GmTIFY10e and GmTIFY10g, we transformed the recombinant 16318hGFP vector linked to the GmTIFY10e and GmTIFY10g into Arabidopsis protoplasts using the PEG4000-mediated method, respectively (Figure 8). Both GmTIFY10e-hGFP and GmTIFY10g-hGFP fusion proteins are located in the nucleus.
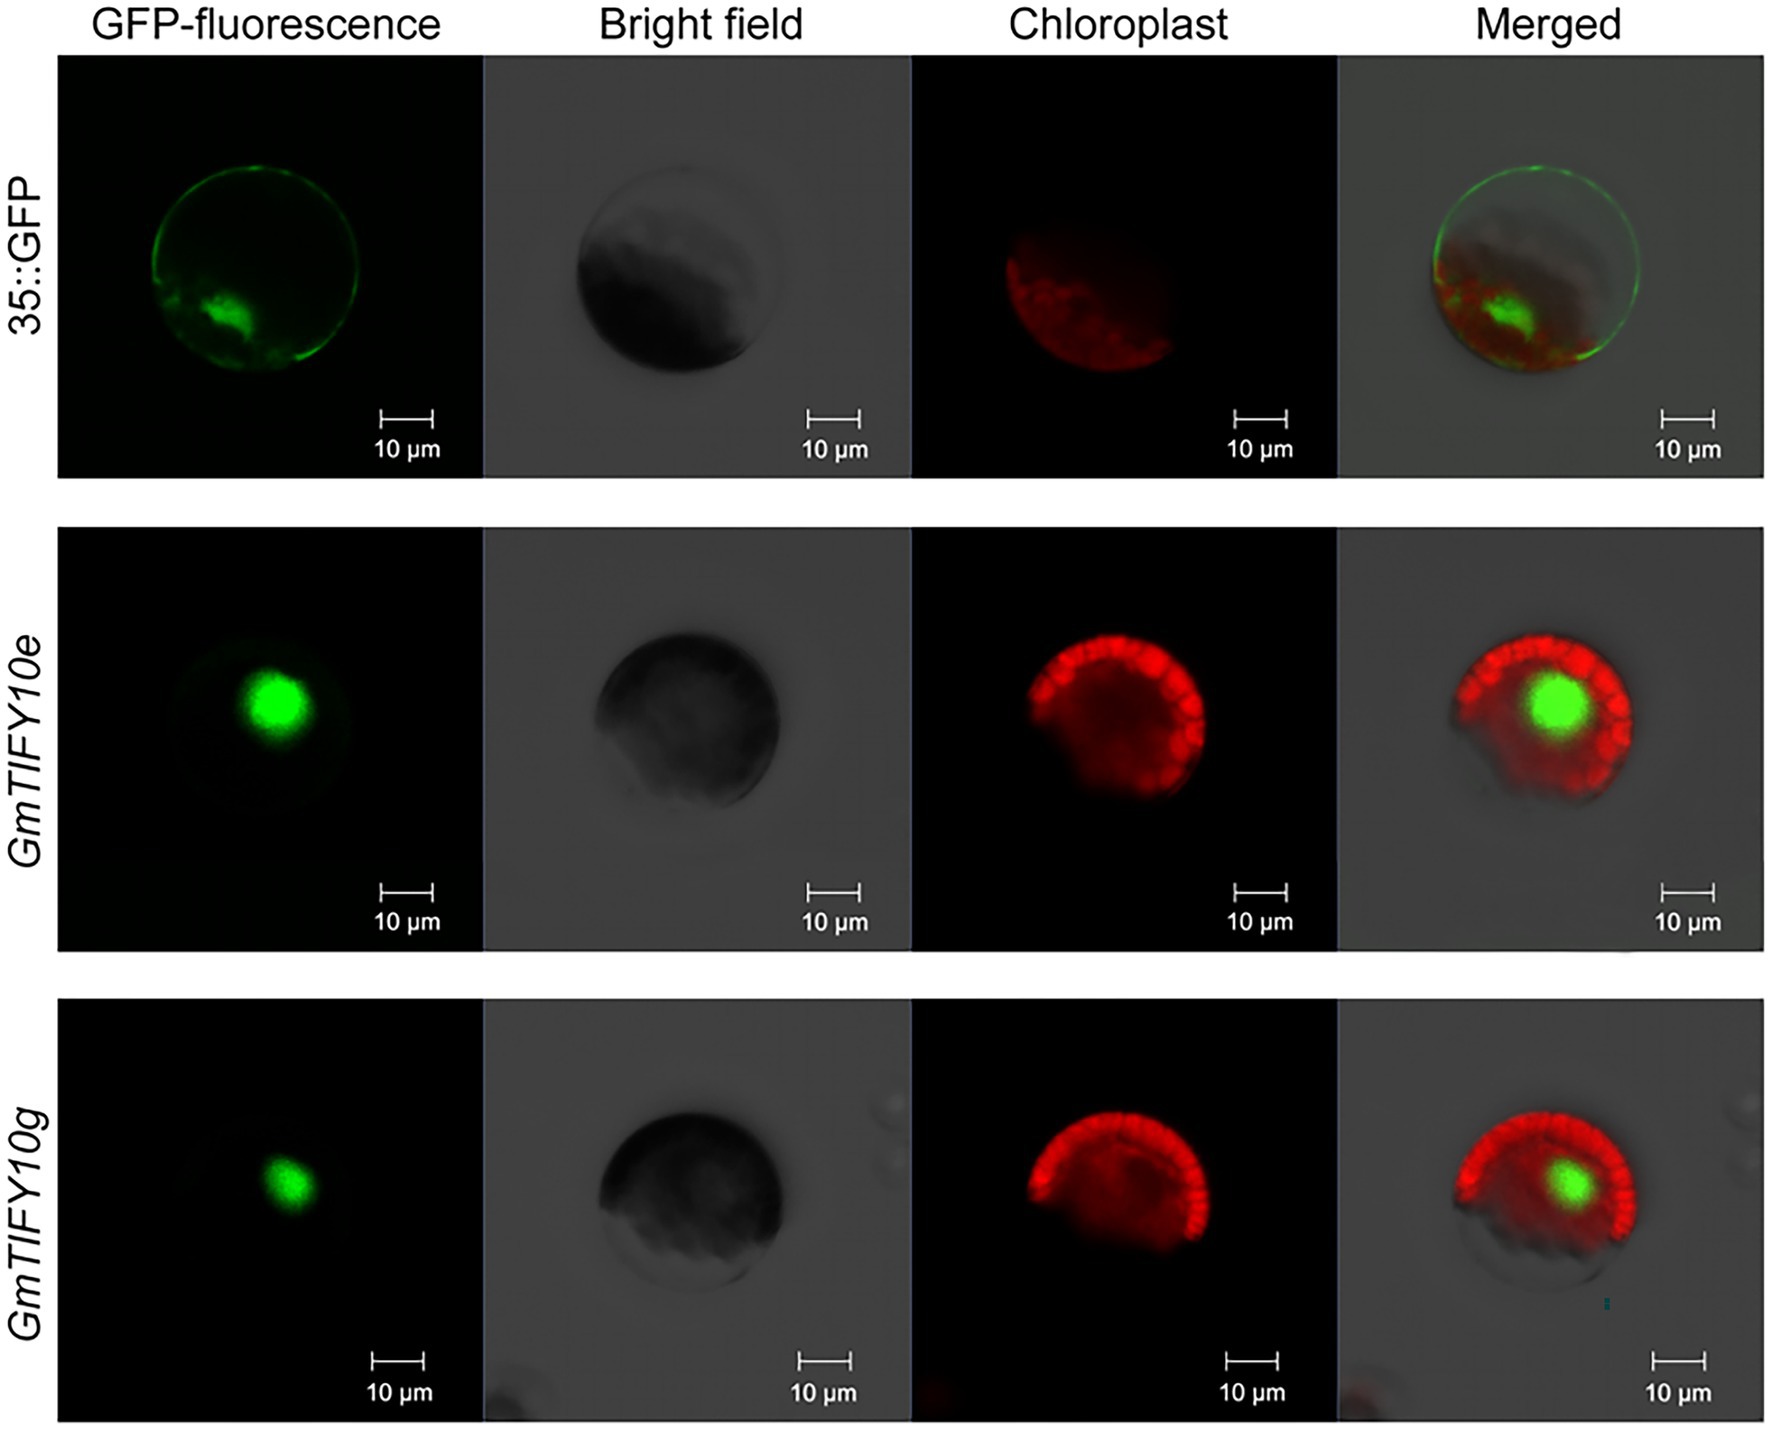
Figure 8. Subcellular localization of GmTIFY10e-hGFP and GmTIFY10g-hGFP fusion protein. 35S::16318hGFP was used as a control. The scale bar of 35S::16318hGFP, GmTIFY10e-hGFP and GmTIFY10g-hGFP indicates 10 μm.
GmTIFY10e and GmTIFY10g Can Improve Salt Tolerance in Transgenic Arabidopsis
To investigate the function of GmTIFY10e and GmTIFY10g in plant salt tolerance, we obtained transgenic Arabidopsis lines with high expression levels of GmTIFY10e and GmTIFY10g, respectively. For root length assay, the 5-day-old Arabidopsis plants were transferred to MS medium containing 125 mM NaCl and we calculated the primary root lengths and fresh weights. Under normal conditions, there was no significant difference between the WT plants and transgenic lines. However, the growth of the WT plants was significantly repressed when treated with 125 mM NaCl and the transgenic lines showed better growth than WT plants, with longer root lengths and heavier fresh weights (Figures 9A,C,D). To verify the salt tolerance of plants in soil, 21-day-old plants were subjected to salt stress (Figure 9B). There is no significant difference between the transgenic and WT plants under normal growth conditions. After 14 days of 250 mM NaCl treatment, the transgenic lines showed higher salt tolerance than WT, when WT is seriously wilted or even dead.
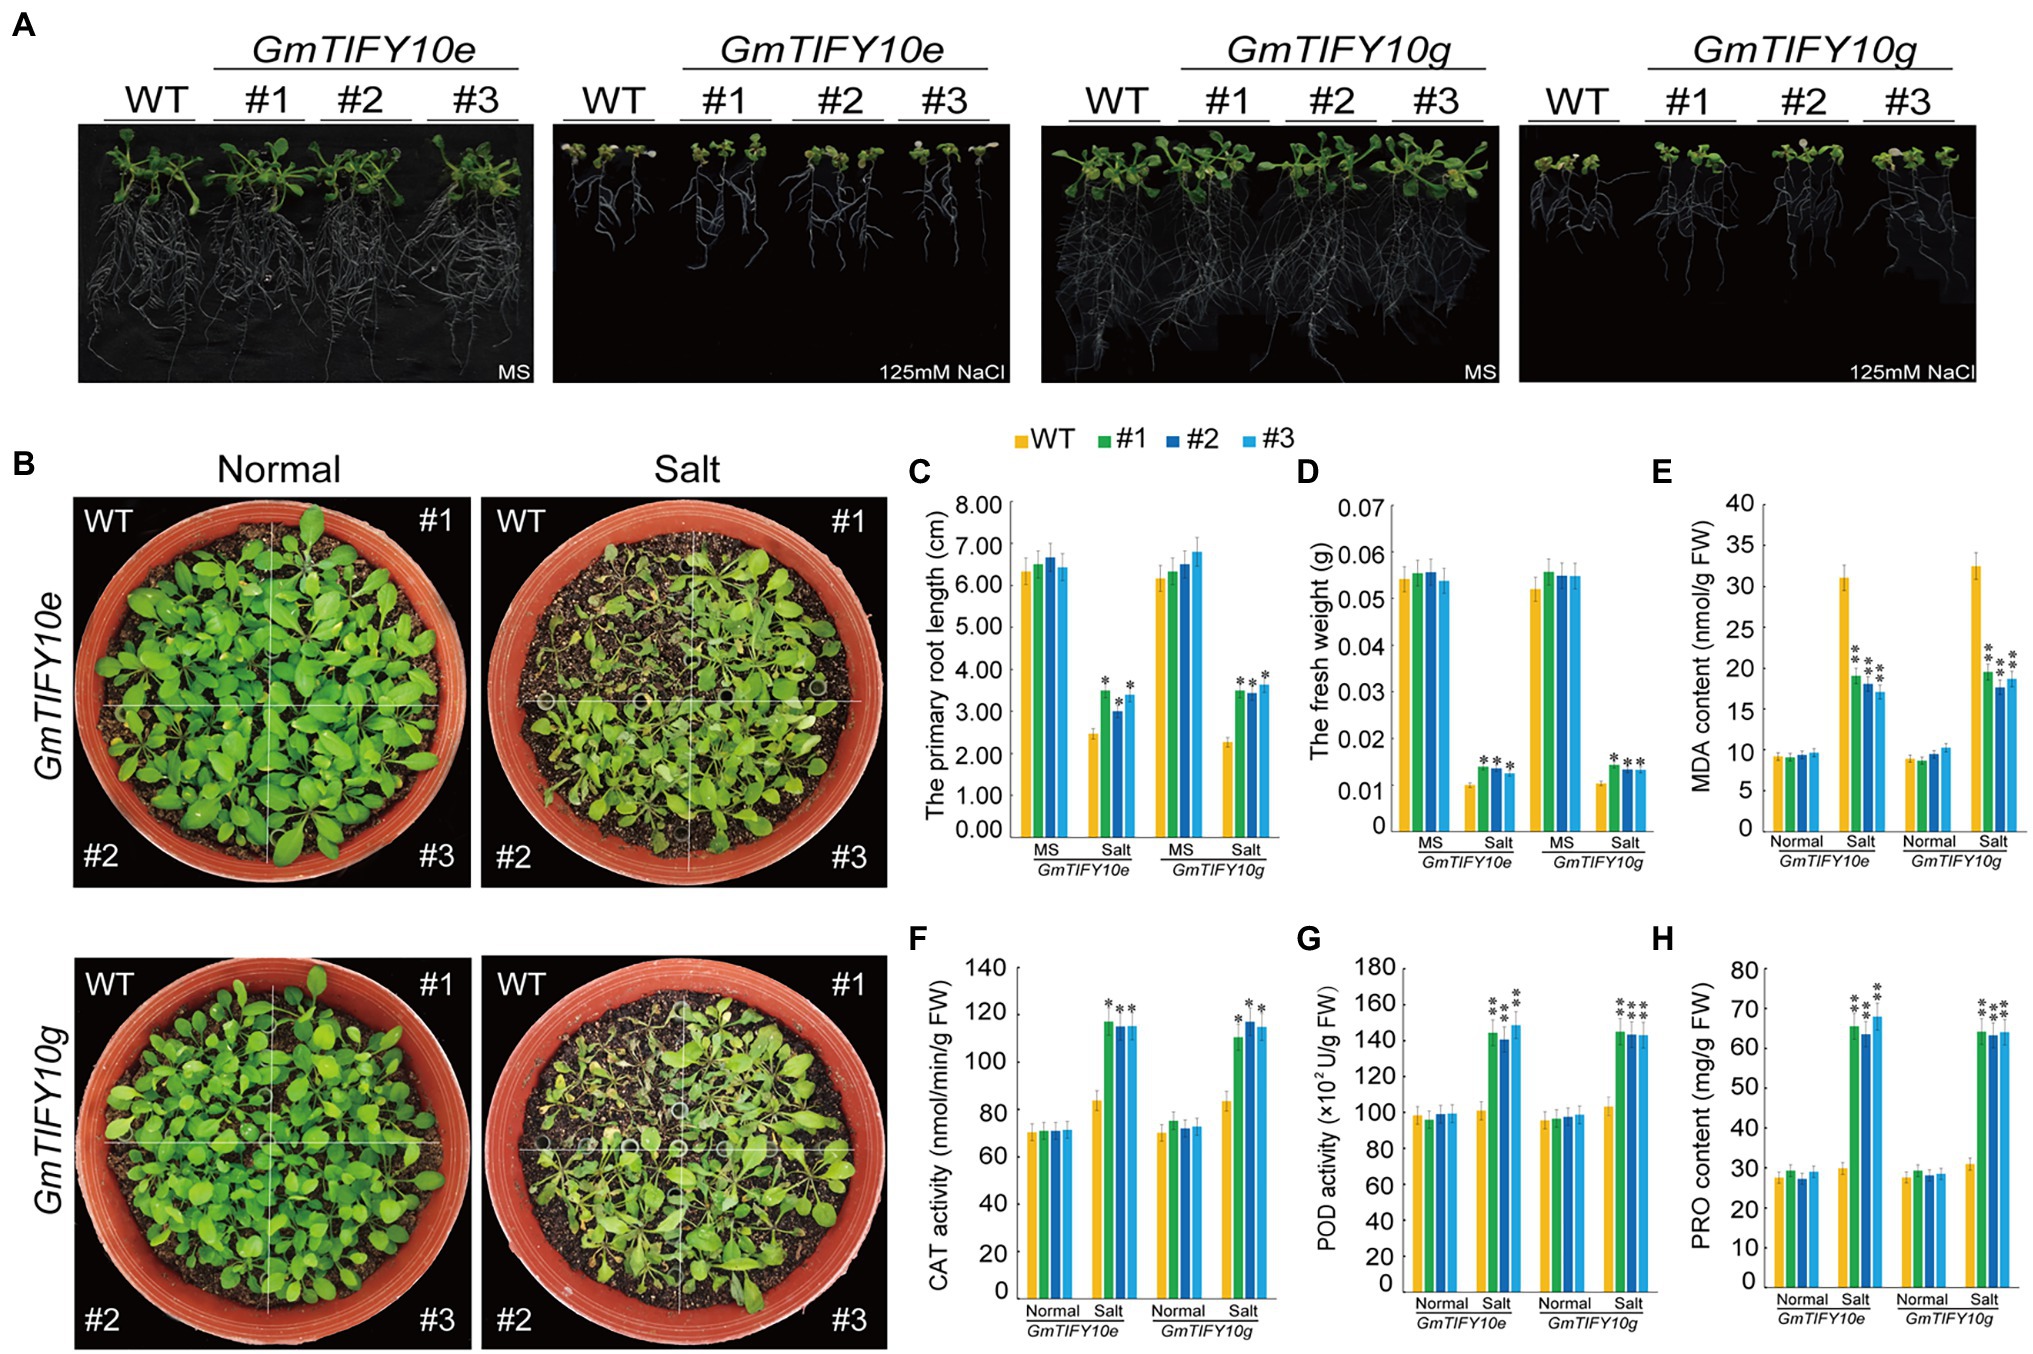
Figure 9. Overexpression of GmTIFY10e and GmTIFY10g in Arabidopsis plants enhanced tolerance to salt stress. (A) Phenotypic analysis of transgenic Arabidopsis lines and WT lines under normal and 125 mM NaCl treatment. The scale bar indicates 2 cm. (B) Phenotypes of WT and transgenic plants under salt stress. (C) The primary root length analysis of the transgenic Arabidopsis lines and WT plants under normal and 125 mM NaCl treatment. (D) The fresh weights of transgenic Arabidopsis lines and WT lines under normal and 125 mM NaCl conditions. (E–H) The leaf contents of MDA (E), CAT (F), POD (G), and PRO (H) in WT and transgenic plants under normal and salt stress. The data are shown as the means ± SD obtained from three biological replicates. ANOVA test demonstrates significant differences compared with WT (*p < 0.05, **p < 0.01).
Salt stress can reduce the scavenging function of reactive oxygen species (ROS) in cells (Raza et al., 2021). Accumulation of ROS will lead to membrane lipid peroxidation, forming MDA, and activating oxygen enzymatic scavenging system including CAT, POD (Mhamdi and Van Breusegem, 2018; Wang et al., 2021a; Youssef et al., 2021). At the same time, plant cells will accumulate a large number of PRO under stress to maintain normal cell swelling pressure, prevent excessive water loss of protoplasm and enhance the adaptability of plants to adversity (Wang et al., 2021b). We measured the MDA, PRO, CAT, and POD contents of transgenic and WT lines under normal and salt treatment conditions (Figures 9E–H). Compared with WT plants, the contents of PRO, CAT, and POD in the transgenic lines were significantly increased, while the MDA contents of the transgenic lines were significantly reduced. These results all indicated that GmTIFY10e and GmTIFY10g play a role in improving the tolerance of salt stress.
Overexpression of GmTIFY10e and GmTIFY10g Improve Salt Tolerance in Soybean Hairy Roots
To verify the function of GmTIFY10e and GmTIFY10g in response to salt stress in soybean, we obtained overexpressing plants (OE), empty vector plants (EV) and RNAi plants with A. rhizogenes-mediated transformation of soybean hairy roots and treated with 250 mM NaCl. RT-qPCR analysis demonstrated that the expression levels of OE plants were significantly higher than that of the EV, while the expression levels of RNAi plants were lower than that of the EV (Supplementary Figure 3). Phenotypic identification showed that there was no significant difference among the OE plants, RNAi plants, or EV plants under normal growth conditions. After 5 days treatment of salt, the leaves of the RNAi plants turned yellow and were more wilted than the EV plants. In the OE lines, only a few bottom leaves showed yellowing and wilting, which indicated significantly increased salt tolerance (Figures 10A,B). It indicated that overexpression of GmTIFY10e and GmTIFY10g improved the salt stress tolerance in soybean.
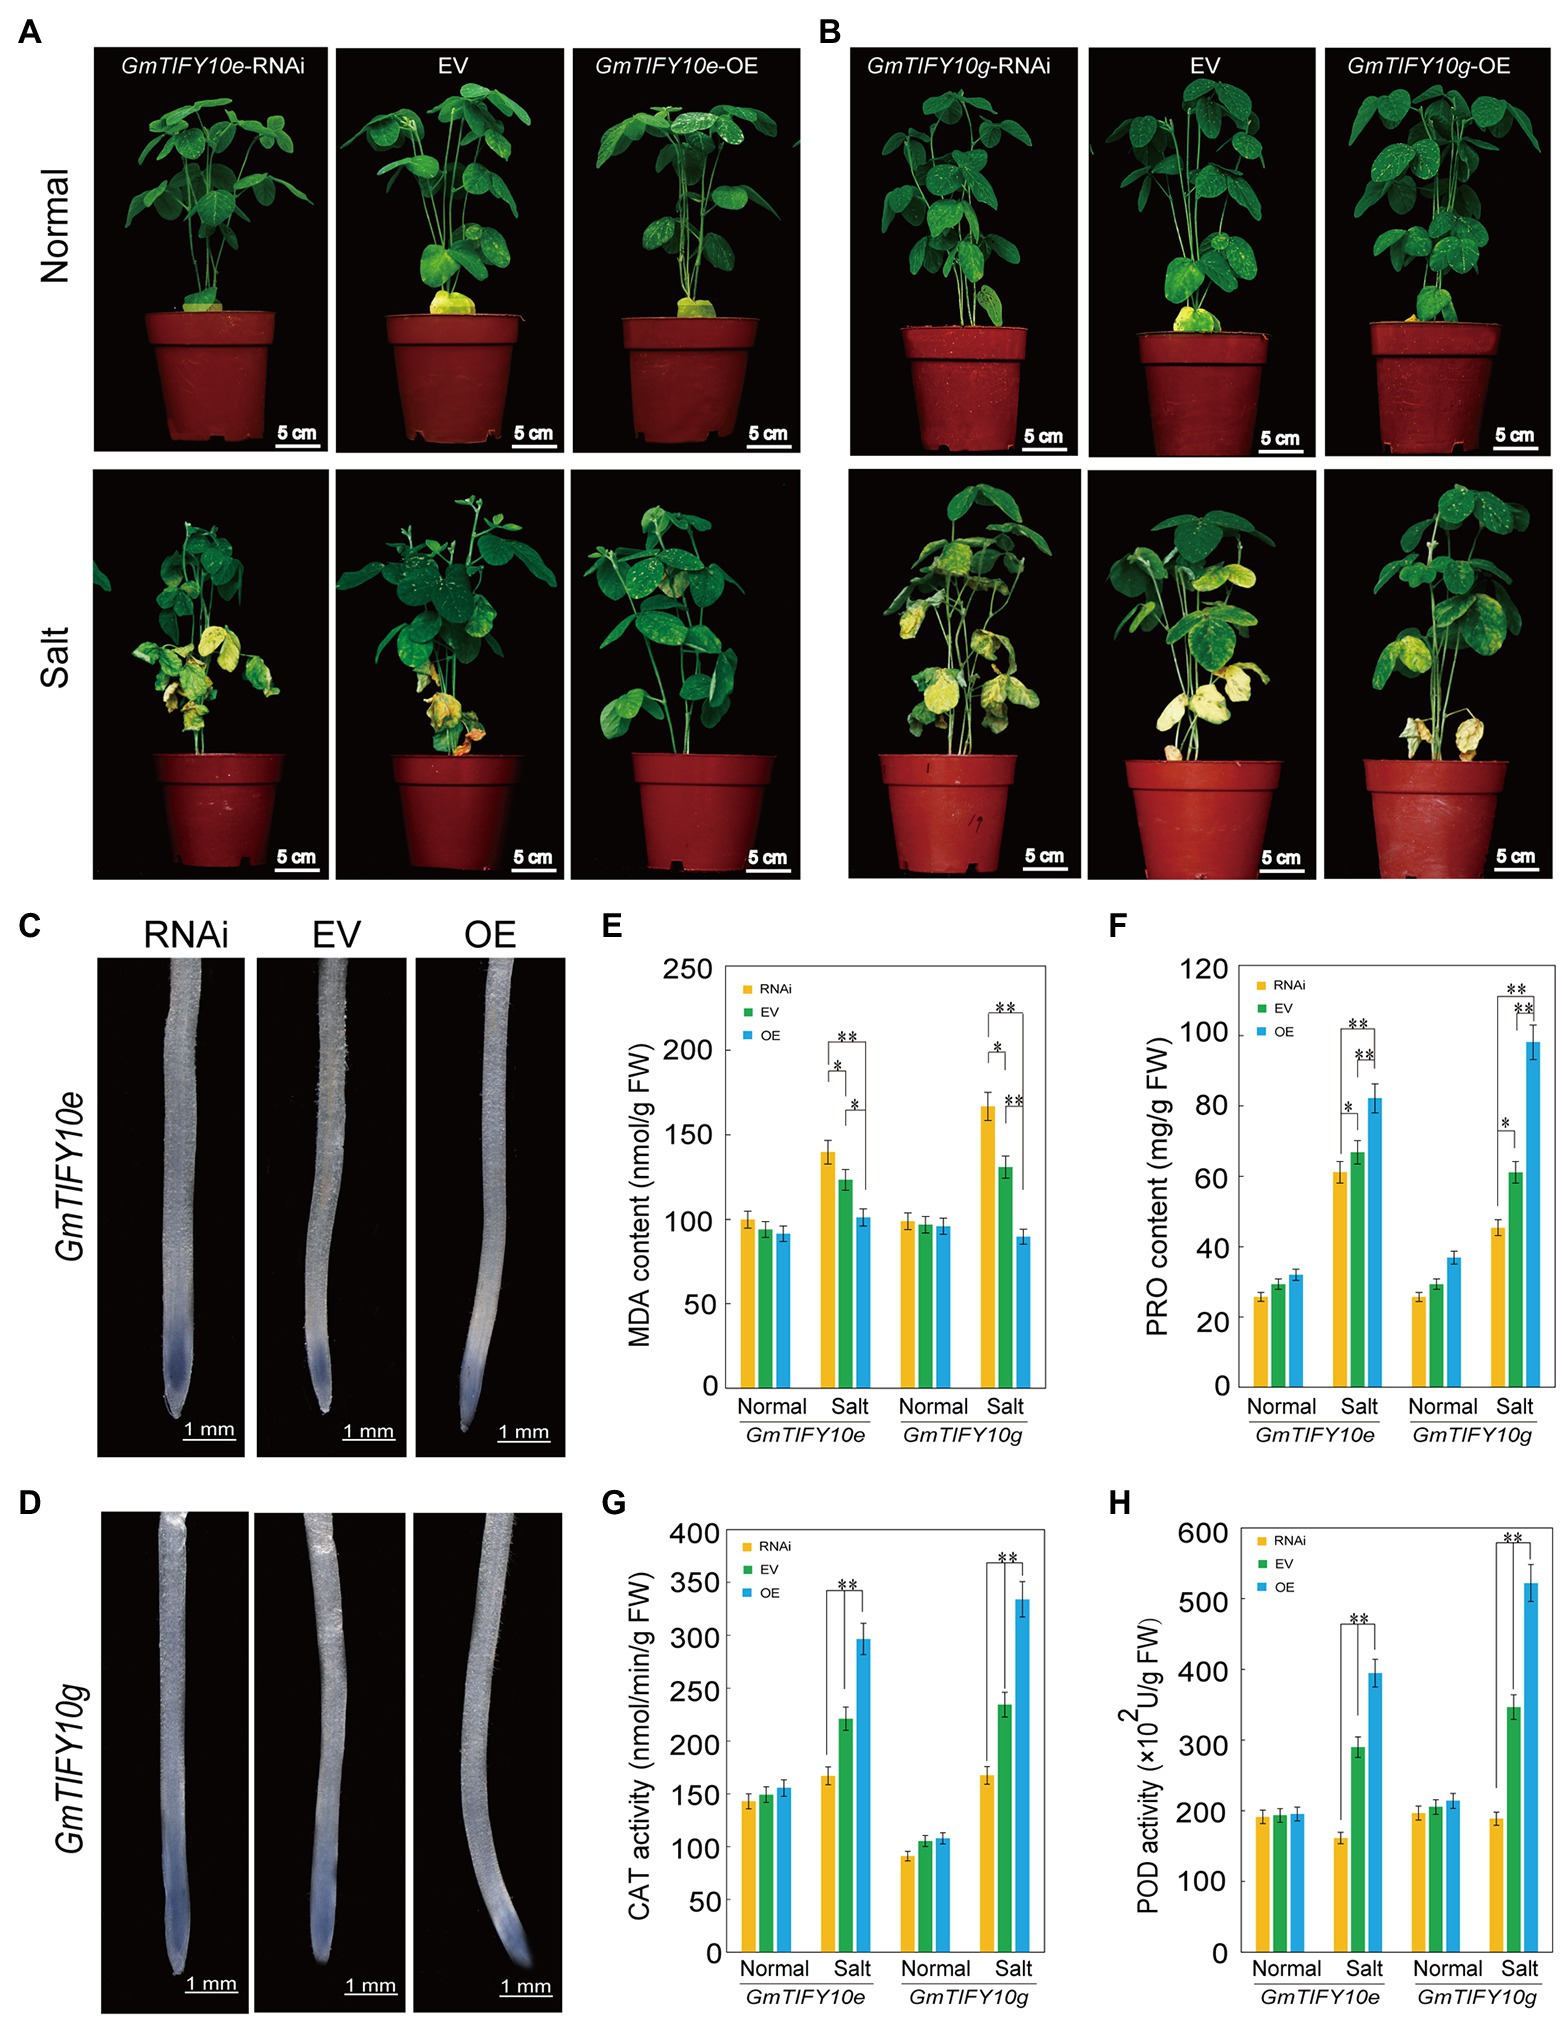
Figure 10. Analysis of the function of soybean GmTIFY10e and GmTIFY10g under normal and salt stress. (A,B) Phenotype analysis of EV and transgenic plants under normal and salt stress. The scale bar indicates 5 cm. (C,D) NBT staining of EV and transgenic plant roots under salt stress. The scale bar indicates 1 mm. (E–H) The MDA (E), PRO (F), CAT (G), and POD (H) contents of EV and transgenic plant leaves under normal and salt stress. The data are shown as the means ± SD obtained from three biological replicates. ANOVA test demonstrates that there are significant differences compared with EV (*p < 0.05, **p < 0.01).
Reactive oxygen species is the most important signal substance for plants to respond to abiotic stresses. A large amount of ROS will accumulate in plants under abiotic stresses. NBT staining can reveal the levels of ROS accumulation in plants (Figures 10C,D). We measured the levels of ROS accumulation of plants roots. After salt treatment, the staining levels of OE plants were significantly lighter than that of EV plants and the RNAi plants showed more significant NBT stains. The same results were obtained from staining the leaves of OE plants, RNAi plants, and EV plants (Supplementary Figures 4A,F).
We further measured the contents of MDA, PRO, CAT, and POD in the roots of OE plants, RNAi plants and EV plants (Figures 10E–H). Under normal growth conditions, the MDA, PRO, CAT, and POD contents in OE plants and RNAi plants were not significantly different than in EV plants. After salt treatment, the PRO, POD, and CAT contents in OE plants were significantly higher than in EV plants and RNAi plants, while the MDA content in OE plants was lower than in EV plants and RNAi plants. We obtained similar results by measuring the MDA, PRO, CAT, and POD contents of the leaves (Supplementary Figures 4C–F). These results further confirmed that overexpression of GmTIFY10e and GmTIFY10g can enhance salt stress tolerance in soybean, which is consistent with the results of transgenic Arabidopsis.
Overexpression of GmTIFY10e and GmTIFY10g Can Influence the Expression Levels of ABA-Related Genes
Previous transcriptome data demonstrated that the expression levels of GmTIFY10e and GmTIFY10g were upregulated under ABA treatment. Enrichment analysis of GmTIFY10e and GmTIFY10g co-expression genes demonstrated that GmTIFY10e and GmTIFY10g can participate in the JA signal pathway and the ABA signal pathway (Supplementary Figure 5). In previous studies, the JAZ proteins were identified to participate in the ABA-dependent signal pathway through the target protein MYC/MYB transcription factor or ABA signal receptor PYL4 (Fu et al., 2017; Luo et al., 2020). To study the possible mechanisms regulated by GmTIFY10e and GmTIFY10g during salt stress responses, we analyzed the expression levels of GmCAT1, GmPOD, and GmERF115 which were genes in the ABA-mediated osmotic stress signals, and the GmSnRK2, GmPP2C, and GmMYC2 which were key genes in the ABA signal transduction pathway (Figure 11). Under normal growth conditions, the expression levels of GmCAT1, GmPOD, and GmERF115 genes were higher in OE plants and were lower in RNAi plants compared to EV plants, while GmSnRK2, GmPP2C, and GmMYC2 were higher in RNAi plants. For salt stress, the expression levels of GmCAT1, GmPOD, and GmERF115 were significantly upregulated in OE plants and downregulated in RNAi plants, while GmSnRK2, GmPP2C, and GmMYC2 significantly upregulated in RNAi plants and downregulated in OE plants. These results indicated that GmTIFY10e and GmTIFY10g may be involved in responding to salt stress through the ABA regulation pathway.
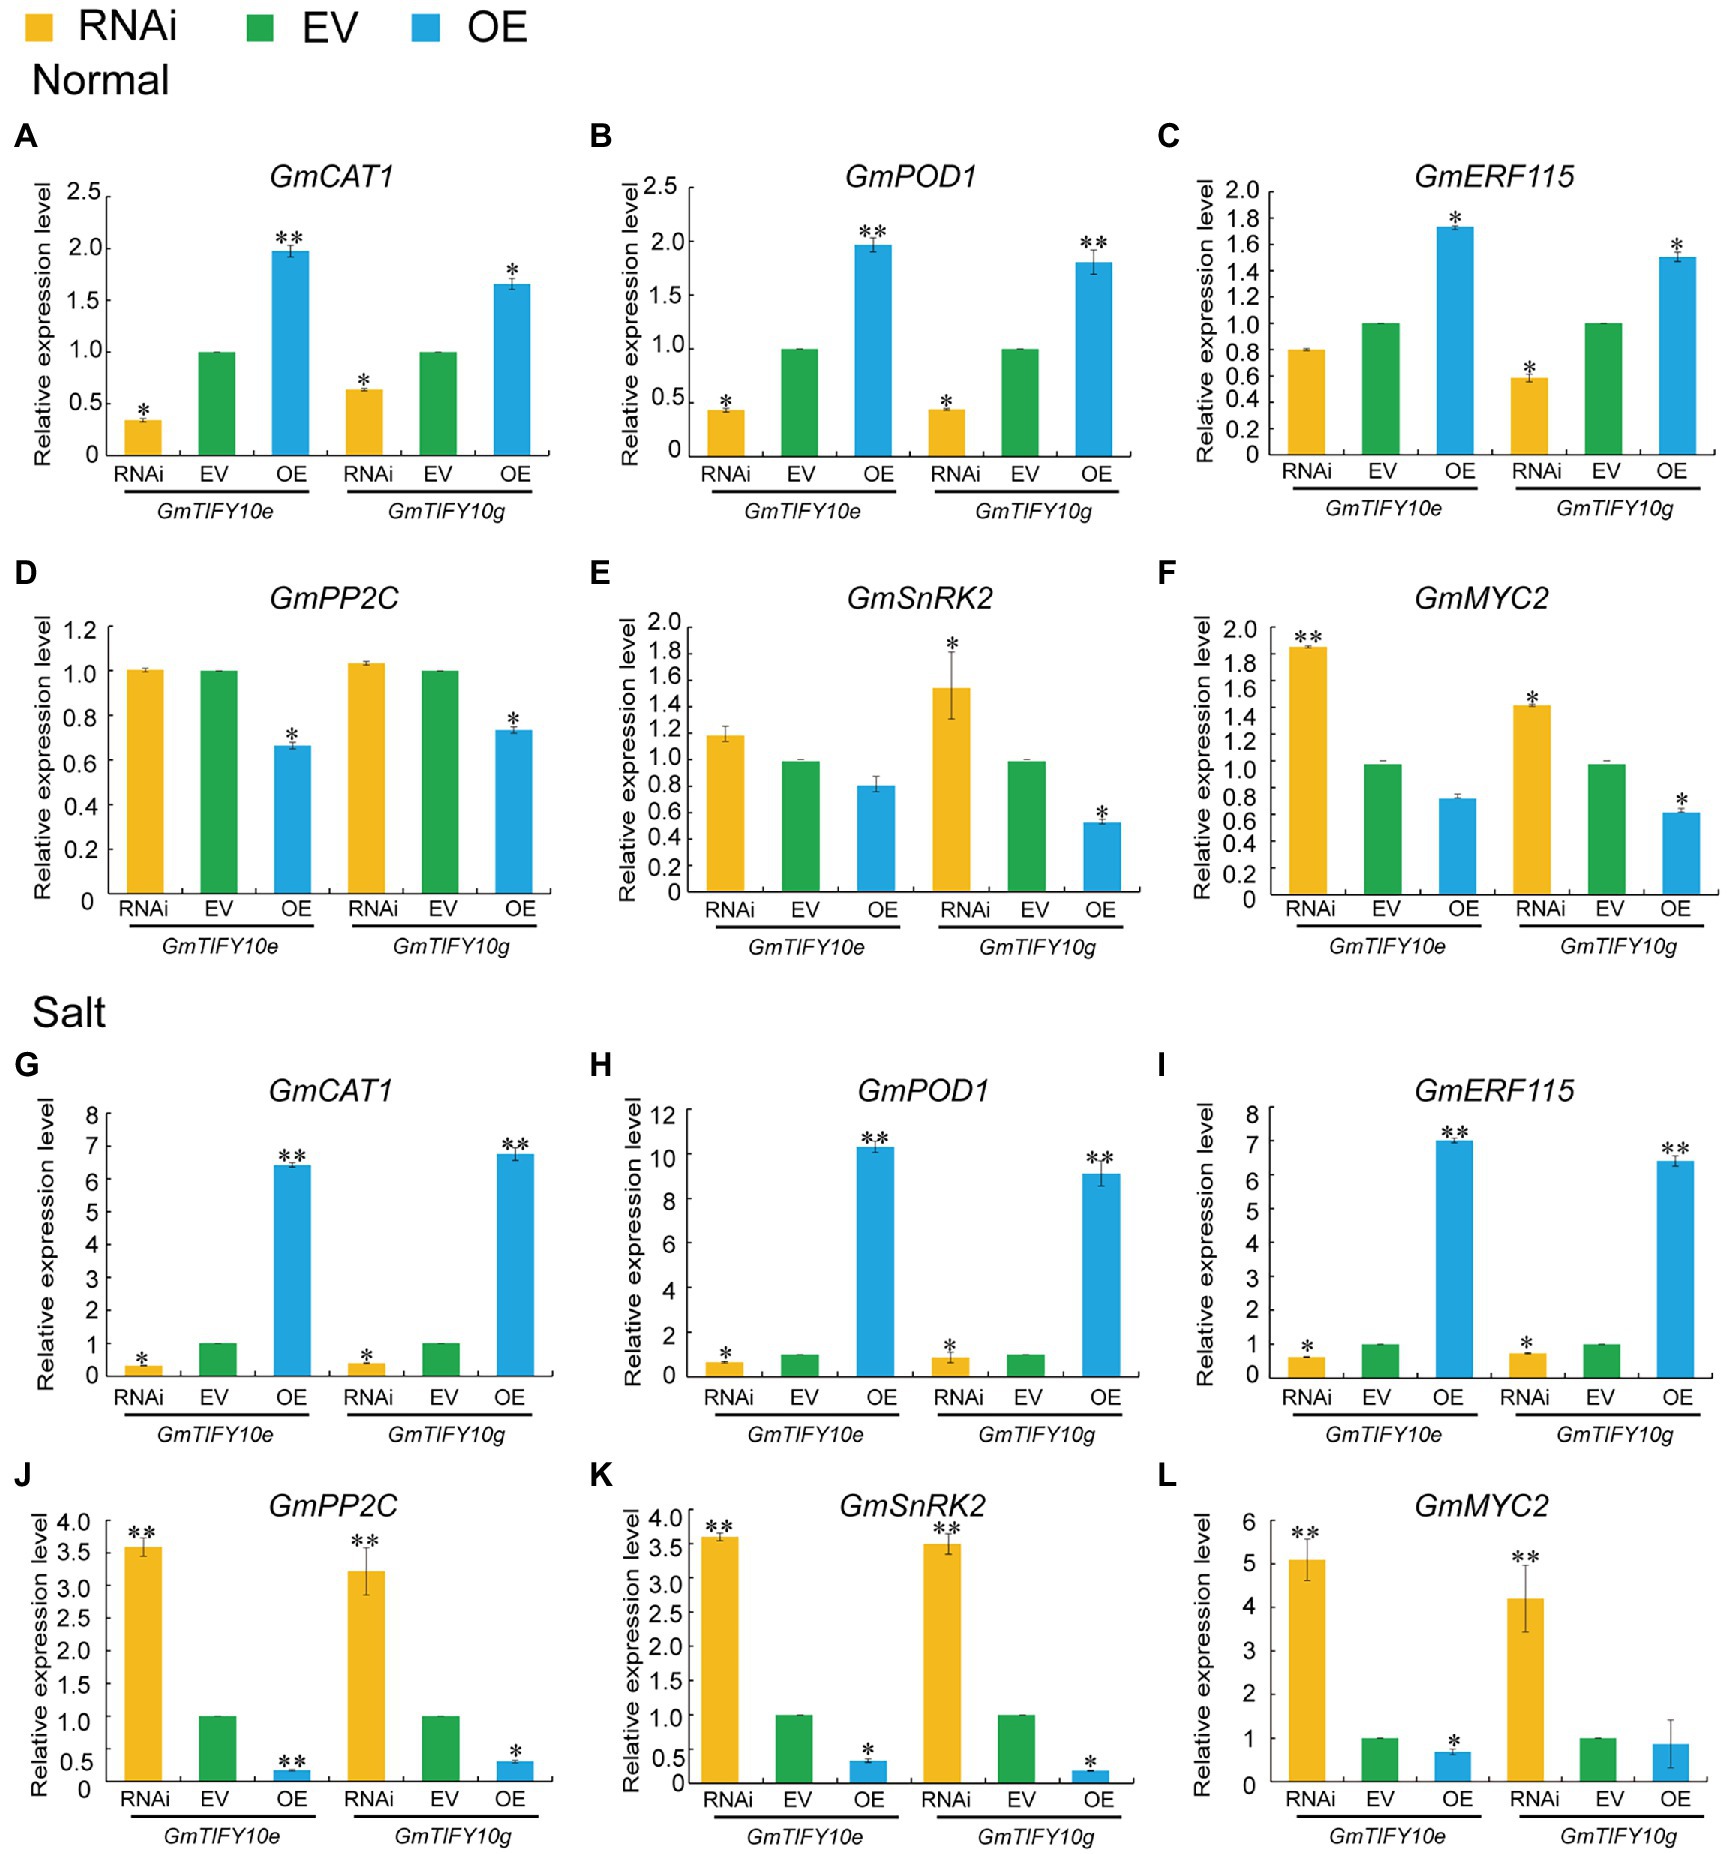
Figure 11. (A–F) The GmCAT1 (A), GmPOD (B), GmERF115 (C), GmPP2C (D), GmSnRK2 (E) and GmMYC2 (F) expression levels of EV and transgenic plants under normal conditions. (G–L) The GmCAT1 (G), GmPOD (H), GmERF115 (I), GmPP2C (J), GmSnRK2 (K) and GmMYC2 (L) expression levels of EV and transgenic plants under salt stress. Vertical bars indicate ±SD of three replicates. ANOVA test demonstrates that there are significant differences compared with EV (*p < 0.05, **p < 0.01).
Discussion
As a kind of specific plant proteins, TIFY proteins play an important role in the plant growth and response to environmental changes. However, the information about the expression and function of TIFY family in soybean are very limited. This study systematically identified and analyzed 38 GmTIFY genes and their responses to abiotic stresses in soybean. Our results confirmed that soybean GmTIFY10e and GmTIFY10g genes can positively regulate the salt stress tolerance in plants. AtTIFY10a and AtTIFY10b significantly improved tolerance to salt and alkali stresses in Arabidopsis plants (Zhu et al., 2014). In cotton, overexpression of TIFY10 homologous genes GaJAZ1 could significantly improve the tolerance to salt stress. In addition, the GaJAZ1 was confirmed to interact with GaMYC2 to repress expression of downstream genes related to ABA signaling pathways, affecting plant tolerance to salinity stress. Therefore, TIFY10 homologous genes may be involved in abiotic stresses tolerance, including salt tolerance (Zhao et al., 2020b).
ABA and ABA signaling pathway play important roles in regulating various stress responses (Stone et al., 2006; Nilson and Assmann, 2007; Sirichandra et al., 2009). ABA-related cis-elements can combine with transcription factors to regulate the expression of corresponding genes and regulate the sensitivity of plants to ABA signaling pathway (Kim et al., 2011). GmTIFY10e and GmTIFY10g have several ABA-related elements and its co-expression genes were involved in the ABA-activated signaling pathway and the JA signaling pathway (Supplementary Figures 1, 5). Transcriptome data demonstrated that the expression levels of GmTIFY10e and GmTIFY10g were upregulated under ABA treatment (Figure 6). These results indicated that these two genes may be related to ABA signaling pathway.
The tolerance of ABA to environmental stresses mainly depends on antioxidant protection system (Wu et al., 2021). Abiotic stresses can induce the production of H2O2 in plants. H2O2 can directly act on the negative regulatory factor PP2Cs of ABA signaling pathway and promote the expression of CAT1 and POD genes. The AtERF115 can mediate the ROS pathway and maintain the root stem and root growth through phytosulfokine (PSK) peptide incorporation (Kong et al., 2018). GmTIFY10e and GmTIFY10g could significantly affect the expression levels of GmCAT1, GmPOD, and GmERF115 genes under salt stress (Figures 11A–C, G–I). To further analyze the regulation mechanism of GmTIFY10e and GmTIFY10g, we measured the key genes of ABA signal transduction pathway, which mainly includes PP2Cs, SnRK2s, and MYCs. The JAZ protein participated in the ABA-dependent signal pathway through its target protein MYC/MYB transcription factor and can interact with the ABA signal receptor PYL4. In presence of ABA, it will combine with PYLs and inhibit the phosphatase of PP2Cs and inhibit the SnRK2s (Lackman et al., 2011; Fu et al., 2017; Luo et al., 2020; Wang et al., 2020b). Our results showed that overexpression of GmTIFY10e and GmTIFY10g in soybean could significantly decrease the expression levels of GmSnRK2, GmPP2C, and GmMYC2 genes compared with EV plants under salt stress (Figures 11J–L). Therefore, GmTIFY10e and GmTIFY10g maybe affect the salt stress tolerance through ABA pathway in plants.
Conclusion
We identified 38 GmTIFY genes in soybean genome, among which GmTIFY10e and GmTIFY10g were significantly upregulated by salt stress. Overexpression of GmTIFY10e and GmTIFY10g could improve the salt tolerance of transgenic plants by inhibiting the expression of key genes of ABA pathway. This research provides a basis for further study on how TIFY family members affect salt tolerance.
Data Availability Statement
The original contributions presented in the study are included in the article/Supplementary Material, and further inquiries can be directed to the corresponding authors.
Author Contributions
Z-SX coordinated the project, conceived and designed the experiments, and edited the manuscript. Y-LL performed the experiments and wrote the first draft. LZ, Z-SX, and J-HL revised the manuscript. L-GJ, Y-XL, Y-NK, Y-XW, T-FY, JC, Y-BZ, F-ZW, and MC contributed to data analysis and managed reagents. Y-ZM and J-HL contributed with valuable discussions. All authors contributed to the article and approved the submitted version.
Funding
This research was financially supported by the National Natural Science Foundation of China (31871624), the Agricultural Science and Technology Innovation Program (CAAS-ZDRW202109 and CAAS-ZDRW202002), Chinese Academy of Agricultural Sciences and the central government of Shandong Province guides the development of local science and technology (YDZX20203700002548), and Key R&D Projects of Shandong Province (2021LZGC014).
Conflict of Interest
The authors declare that the research was conducted in the absence of any commercial or financial relationships that could be construed as a potential conflict of interest.
Publisher’s Note
All claims expressed in this article are solely those of the authors and do not necessarily represent those of their affiliated organizations, or those of the publisher, the editors and the reviewers. Any product that may be evaluated in this article, or claim that may be made by its manufacturer, is not guaranteed or endorsed by the publisher.
Acknowledgments
We are grateful to Li-Juan Qiu and Shi Sun of the Institute of Crop Science, Chinese Academy of Agricultural Sciences (CAAS) for kindly providing soybean seeds. Also, we are grateful to Wen-Sheng Hou and Hui Zhang of the Institute of Crop Science, CAAS for kindly providing vectors and the protocol for high-efficiency A. rhizogenes-mediated transformation, respectively.
Supplementary Material
The Supplementary Material for this article can be found online at: https://www.frontiersin.org/articles/10.3389/fpls.2022.845314/full#supplementary-material
Footnotes
1. ^http://plants.ensembl.org/index.html
3. ^http://www.arabidopsis.org/
4. ^http://smart.embl-heidelberg.de/
5. ^https://www.ncbi.nlm.nih.gov/Structure/cdd/wrpsb.cgi
7. ^http://mg2c.iask.in/mg2c_v2.0/
9. ^http://bioinformatics.psb.ugent.be/webtools/plantcare/html/
10. ^http://gsds.cbi.pku.edu.cn/
References
Appel, R., Bairoch, A., and Hochstrasser, D. (1994). A new generation of information retrieval tools for biologists: the example of the ExPASy WWW server. Trends Biochem. Sci. 19, 258–260. doi: 10.1016/0968-0004(94)90153-8
Bai, Y., Meng, Y., Huang, D., Qi, Y., and Chen, M. (2011). Origin and evolutionary analysis of the plant-specific TIFY transcription factor family. Genomics 98, 128–136. doi: 10.1016/j.ygeno.2011.05.002
Bailey, T., Boden, M., Buske, F., Frith, M., Grant, C., Clementi, L., et al. (2009). MEME suite: tools for motif discovery and searching. Nucleic Acids Res. 37, W202–W208. doi: 10.1093/nar/gkp335
Barah, P., and Bones, A. (2015). Multidimensional approaches for studying plant defence against insects: from ecology to omics and synthetic biology. J. Exp. Bot. 66, 479–493. doi: 10.1093/jxb/eru489
Bohnert, H., Nelson, D., and Jensen, R. (1995). Adaptations to environmental stresses. Plant Cell 7, 1099–1111. doi: 10.2307/3870060
Chung, H., Niu, Y., Browse, J., and Howe, G. (2009). Top hits in contemporary JAZ: an update on jasmonate signaling. Phytochemistry 70, 1547–1559. doi: 10.1016/j.phytochem.2009.08.022
Clough, S., and Bent, A. (1998). Floral dip: a simplified method for Agrobacterium-mediated transformation of Arabidopsis thaliana. Plant J. 16, 735–743. doi: 10.1046/j.1365-313x.1998.00343.x
Demianski, A., Chung, K., and Kunkel, B. (2012). Analysis of Arabidopsis JAZ gene expression during Pseudomonas syringae pathogenesis. Mol. Plant Pathol. 13, 46–57. doi: 10.1111/j.1364-3703.2011.00727.x
Dhakarey, R., Raorane, M., Treumann, A., Peethambaran, P., Schendel, R., Sahi, V., et al. (2018). cpm2Corrigendum: Physiological and proteomic analysis of the rice mutant suggests a negative regulatory role of jasmonic acid in drought tolerance. Front. Plant Sci. 9:465. doi: 10.3389/fpls.2018.00465
Du, Y., Zhao, M., Wang, C., Gao, Y., Wang, Y., Liu, Y., et al. (2018). Identification and characterization of GmMYB118 responses to drought and salt stress. BMC Plant Biol. 18:320. doi: 10.1186/s12870-018-1551-7
Ebel, C., BenFeki, A., Hanin, M., Solano, R., and Chini, A. (2018). Characterization of wheat (Triticum aestivum) TIFY family and role of Triticum Durum TdTIFY11a in salt stress tolerance. PLoS One 13:e0200566. doi: 10.1371/journal.pone.0200566
Fu, J., Wu, H., Ma, S., Xiang, D., Liu, R., and Xiong, L. (2017). OsJAZ1 attenuates drought resistance by regulating JA and ABA signaling in rice. Front. Plant Sci. 8:2108. doi: 10.3389/fpls.2017.02108
Gao, F., Chen, C., Arab, D., Du, Z., He, Y., and Ho, S. (2019). EasyCodeML: a visual tool for analysis of selection using CodeML. Ecol. Evol. 9, 3891–3898. doi: 10.1002/ece3.5015
Guo, A., Zhu, Q., Chen, X., and Luo, J. (2007). GSDS: a gene structure display server. Hereditas 29, 1023–1026. doi: 10.1360/yc-007-1023
He, G., Xu, J., Wang, Y., Liu, J., Li, P., Chen, M., et al. (2016). Drought-responsive WRKY transcription factor genes TaWRKY1 and TaWRKY33 from wheat confer drought and/or heat resistance in Arabidopsis. BMC Plant Biol. 16:116. doi: 10.1186/s12870-016-0806-4
Jian, B., Liu, B., Bi, Y., Hou, W., Wu, C., and Han, T. (2008). Validation of internal control for gene expression study in soybean by quantitative real-time PCR. BMC Mol. Biol. 9:59. doi: 10.1186/1471-2199-9-59
Jiangtao, C., Yingzhen, K., Qian, W., Yuhe, S., Daping, G., Jing, L., et al. (2015). MapGene2Chrom, a tool to draw gene physical map based on Perl and SVG languages. Yi Chuan 37, 91–97. doi: 10.16288/j.yczz.2015.01.013
Kereszt, A., Li, D., Indrasumunar, A., Nguyen, C., Nontachaiyapoom, S., Kinkema, M., et al. (2007). Agrobacterium rhizogenes-mediated transformation of soybean to study root biology. Nat. Protoc. 2, 948–952. doi: 10.1038/nprot.2007.141
Kim, J. S., Mizoi, J., Yoshida, T., Fujita, Y., Nakajima, J., Ohori, T., et al. (2011). An ABRE promoter sequence is involved in osmotic stress-responsive expression of the DREB2A gene, which encodes a transcription factor regulating drought-inducible genes in Arabidopsis. Plant Cell Physiol. 52, 2136–2146. doi: 10.1093/pcp/pcr143
Kong, X., Tian, H., Yu, Q., Zhang, F., Wang, R., Gao, S., et al. (2018). PHB3 maintains root stem cell niche identity through ROS-responsive AP2/ERF transcription factors in Arabidopsis. Cell Rep. 22, 1350–1363. doi: 10.1016/j.celrep.2017.12.105
Kumar, S., Stecher, G., and Tamura, K. (2016). MEGA7: molecular evolutionary genetics analysis version 7.0 for bigger datasets. Mol. Biol. Evol. 33, 1870–1874. doi: 10.1093/molbev/msw054
Lackman, P., González-Guzmán, M., Tilleman, S., Carqueijeiro, I., Pérez, A., Moses, T., et al. (2011). Jasmonate signaling involves the abscisic acid receptor PYL4 to regulate metabolic reprogramming in Arabidopsis and tobacco. Proc. Natl. Acad. Sci. U. S. A. 108, 5891–5896. doi: 10.1073/pnas.1103010108
Leng, Z., Liu, Y., Chen, Z., Guo, J., Chen, J., Zhou, Y., et al. (2021). GmDUF4228 genome-wide analysis of the DUF4228 family in soybean and functional identification of in response to drought and salt stresses. Front. Plant Sci. 12:628299. doi: 10.3389/fpls.2021.628299
Lestari, P., Van, K., Lee, J., Kang, Y. J., and Lee, S. H. (2013). Gene divergence of homeologous regions associated with a major seed protein content QTL in soybean. Front. Plant Sci. 4:176. doi: 10.3389/fpls.2013.00176
Letunic, I., Goodstadt, L., Dickens, N., Doerks, T., Schultz, J., Mott, R., et al. (2002). Recent improvements to the SMART domain-based sequence annotation resource. Nucleic Acids Res. 30, 242–244. doi: 10.1093/nar/30.1.242
Li, W., Wang, T., Zhang, Y., and Li, Y. (2017). Overexpression of soybean miR172c confers tolerance to water deficit and salt stress, but increases ABA sensitivity in transgenic Arabidopsis thaliana. J. Exp. Bot. 68, 4727–4729. doi: 10.1093/jxb/erw404
Li, X., Yin, X., Wang, H., Li, J., Guo, C., Gao, H., et al. (2014). Genome-wide identification and analysis of the apple (Malus × domestica Borkh.) TIFY gene family. Tree Genet. Genomes 11:808. doi: 10.1007/s11295-014-0808-z
Luo, X., Li, C., He, X., Zhang, X., and Zhu, L. (2020). ABA signaling is negatively regulated by GbWRKY1 through JAZ1 and ABI1 to affect salt and drought tolerance. Plant Cell Rep. 39, 181–194. doi: 10.1007/s00299-019-02480-4
Mao, Y., Liu, Y., Chen, D., Chen, F., Fang, X., Hong, G., et al. (2017). Jasmonate response decay and defense metabolite accumulation contributes to age-regulated dynamics of plant insect resistance. Nat. Commun. 8:13925. doi: 10.1038/ncomms13925
Marchler-Bauer, A., Panchenko, A., Shoemaker, B., Thiessen, P., Geer, L., and Bryant, S. (2002). CDD: a database of conserved domain alignments with links to domain three-dimensional structure. Nucleic Acids Res. 30, 281–283. doi: 10.1093/nar/30.1.281
Meng, L., Zhang, T., Geng, S., Scott, P., Li, H., and Chen, S. (2019). Comparative proteomics and metabolomics of JAZ7-mediated drought tolerance in Arabidopsis. J. Proteome 196, 81–91. doi: 10.1016/j.jprot.2019.02.001
Mhamdi, A., and Van Breusegem, F. (2018). Reactive oxygen species in plant development. Development 145:dev164376. doi: 10.1242/dev.164376
Nilson, S., and Assmann, S. (2007). The control of transpiration. Insights from Arabidopsis. Plant Physiol. 143, 19–27. doi: 10.1104/pp.106.093161
Nishii, A., Takemura, M., Fujita, H., Shikata, M., Yokota, A., and Kohchi, T. (2000). Characterization of a novel gene encoding a putative single zinc-finger protein, ZIM, expressed during the reproductive phase in Arabidopsis thaliana. Biosci. Biotechnol. Biochem. 64, 1402–1409. doi: 10.1271/bbb.64.1402
Peethambaran, P., Glenz, R., Höninger, S., Shahinul Islam, S., Hummel, S., Harter, K., et al. (2018). Salt-inducible expression of OsJAZ8 improves resilience against salt-stress. BMC Plant Biol. 18:311. doi: 10.1186/s12870-018-1521-0
Prince, V., and Pickett, F. (2002). Splitting pairs: the diverging fates of duplicated genes. Nat. Rev. Genet. 3, 827–837. doi: 10.1038/nrg928
Raza, A., Su, W., Gao, A., Mehmood, S. S., Hussain, M. A., Nie, W., et al. (2021). Catalase (CAT) gene family in rapeseed (Brassica napus L.): genome-wide analysis, identification, and expression pattern in response to multiple hormones and abiotic stress conditions. Int. J. Mol. Sci. 22:4281. doi: 10.3390/ijms22084281
Riechmann, J., Heard, J., Martin, G., Reuber, L., Jiang, C., Keddie, J., et al. (2000). Arabidopsis transcription factors: genome-wide comparative analysis among eukaryotes. Science 290, 2105–2110. doi: 10.1126/science.290.5499.2105
Shi, W., Du, Y., Ma, J., Min, D., Jin, L., Chen, J., et al. (2018). The WRKY transcription factor GmWRKY12 confers drought and salt tolerance in soybean. Int. J. Mol. Sci. 19:4087. doi: 10.3390/ijms19124087
Sirichandra, C., Wasilewska, A., Vlad, F., Valon, C., and Leung, J. (2009). The guard cell as a single-cell model towards understanding drought tolerance and abscisic acid action. J. Exp. Bot. 60, 1439–1463. doi: 10.1093/jxb/ern340
Staswick, P. (2008). JAZing up jasmonate signaling. Trends Plant Sci. 13, 66–71. doi: 10.1016/j.tplants.2007.11.011
Stone, S., Williams, L., Farmer, L., Vierstra, R., and Callis, J. (2006). Keep on going, a ring E3 ligase essential for Arabidopsis growth and development, is involved in abscisic acid signaling. Plant Cell 18, 3415–3428. doi: 10.1105/tpc.106.046532
Su, H. G., Zhang, X. H., Wang, T. T., Wei, W. L., Wang, Y. X., Chen, J., et al. (2020). Genome-wide identification, evolution, and expression of GDSL-type esterase/lipase gene family in soybean. Front. Plant Sci. 11:726. doi: 10.3389/fpls.2020.00726
Sun, H., Chen, L., Li, J., Hu, M., Ullah, A., He, X., et al. (2017). The Jasmonate ZIM-domain gene family mediates JA signaling and stress response in cotton. Plant Cell Physiol. 58, 2139–2154. doi: 10.1093/pcp/pcx148
Thines, B., Katsir, L., Melotto, M., Niu, Y., Mandaokar, A., Liu, G., et al. (2007). JAZ repressor proteins are targets of the SCF(COI1) complex during jasmonate signalling. Nature 448, 661–665. doi: 10.1038/nature05960
Thireault, C., Shyu, C., Yoshida, Y., St Aubin, B., Campos, M., and Howe, G. (2015). Repression of jasmonate signaling by a non-TIFY JAZ protein in Arabidopsis. Plant J. 82, 669–679. doi: 10.1111/tpj.12841
Vanholme, B., Grunewald, W., Bateman, A., Kohchi, T., and Gheysen, G. (2007). The tify family previously known as ZIM. Trends Plant Sci. 12, 239–244. doi: 10.1016/j.tplants.2007.04.004
Wang, D., Liu, Y. X., Yu, Q., Zhao, S. P., Zhao, J. Y., Ru, J. N., et al. (2019). Functional analysis of the soybean GmCDPK3 gene responding to drought and salt stresses. Int. J. Mol. Sci. 20:5909. doi: 10.3390/ijms20235909
Wang, F., Chen, H., Li, Q., Wei, W., Li, W., Zhang, W., et al. (2015). GmWRKY27 interacts with GmMYB174 to reduce expression of GmNAC29 for stress tolerance in soybean plants. Plant J. 83, 224–236. doi: 10.1111/tpj.12879
Wang, F., Niu, H., Xin, D., Long, Y., Wang, G., Liu, Z., et al. (2021a). OsIAA18, an aux/IAA transcription factor gene, is involved in salt and drought tolerance in rice. Front. Plant Sci. 12:738660. doi: 10.3389/fpls.2021.738660
Wang, J., Ma, Z., Tang, B., Yu, H., Tang, Z., Bu, T., et al. (2021b). Tartary buckwheat (Fagopyrum tataricum) NAC transcription factors FtNAC16 negatively regulates of pod cracking and salinity tolerant. Int. J. Mol. Sci. 22. doi: 10.3390/ijms22063197
Wang, T. T., Yu, T. F., Fu, J. D., Su, H. G., Chen, J., Zhou, Y. B., et al. (2020a). Genome-wide analysis of the GRAS gene family and functional identification of GmGRAS37 in drought and salt tolerance. Front. Plant Sci. 11:604690. doi: 10.3389/fpls.2020.604690
Wang, Y., Qiao, L., Bai, J., Wang, P., Duan, W., Yuan, S., et al. (2017). Genome-wide characterization of Jasmonate-ZIM domain transcription repressors in wheat (Triticum aestivum L.). BMC Genomics 18:152. doi: 10.1186/s12864-017-3582-0
Wang, Z., Ren, Z., Cheng, C., Wang, T., Ji, H., Zhao, Y., et al. (2020b). Counteraction of ABA-mediated inhibition of seed germination and seedling establishment by ABA signaling terminator in Arabidopsis. Mol. Plant 13, 1284–1297. doi: 10.1016/j.molp.2020.06.011
Wu, H., Li, H., Zhang, W., Tang, H., and Yang, L. (2021). Transcriptional regulation and functional analysis of Nicotiana tabacum under salt and ABA stress. Biochem. Biophys. Res. Commun. 570, 110–116. doi: 10.1016/j.bbrc.2021.07.011
Xia, W., Yu, H., Cao, P., Luo, J., and Wang, N. (2017). Identification of TIFY family genes and analysis of their expression profiles in response to phytohormone treatments and melampsora larici-Populina infection in poplar. Front. Plant Sci. 8:493. doi: 10.3389/fpls.2017.00493
Ye, H., Du, H., Tang, N., Li, X., and Xiong, L. (2009). Identification and expression profiling analysis of TIFY family genes involved in stress and phytohormone responses in rice. Plant Mol. Biol. 71, 291–305. doi: 10.1007/s11103-009-9524-8
Youssef, M., Raafat, A., El-Yazied, A., Selim, S., Azab, E., Khojah, E., et al. (2021). Exogenous application of alpha-Lipoic acid mitigates salt-induced oxidative damage in sorghum plants through regulation growth, leaf pigments, ionic homeostasis, antioxidant enzymes, and expression of salt stress responsive genes. Plan. Theory 10. doi: 10.3390/plants10112519
Zhang, Y., Gao, M., Singer, S. D., Fei, Z., Wang, H., and Wang, X. (2012). Genome-wide identification and analysis of the TIFY gene family in grape. PLoS One 7:e44465. doi: 10.1371/journal.pone.0044465
Zhang, X., Zheng, W., Cao, X., Cui, X., Zhao, S., Yu, T., et al. (2019). GmSAP16 genomic analysis of stress associated proteins in soybean and the role of in abiotic stress responses in soybean. Front. Plant Sci. 10:1453. doi: 10.3389/fpls.2019.01453
Zhao, C., Pan, X., Yu, Y., Zhu, Y., Kong, F., Sun, X., et al. (2020a). Overexpression of a TIFY family gene, GsJAZ2, exhibits enhanced tolerance to alkaline stress in soybean. Mol. Breed. 40. doi: 10.1007/s11032-020-01113-z
Zhao, G., Song, Y., Wang, Q., Yao, D., Li, D., Qin, W., et al. (2020b). Gossypium hirsutum salt tolerance is enhanced by overexpression of JAZ1. Front. Bioeng. Biotechnol. 8:157. doi: 10.3389/fbioe.2020.00157
Zhao, S., Xu, Z., Zheng, W., Zhao, W., Wang, Y., Yu, T., et al. (2017). GmRAV03 genome-wide analysis of the RAV family in soybean and functional identification of involvement in salt and drought stresses and exogenous ABA treatment. Front. Plant Sci. 8:905. doi: 10.3389/fpls.2017.00905
Zhu, D., Bai, X., Luo, X., Chen, Q., Cai, H., Ji, W., et al. (2013). Identification of wild soybean (Glycine soja) TIFY family genes and their expression profiling analysis under bicarbonate stress. Plant Cell Rep. 32, 263–272. doi: 10.1007/s00299-012-1360-7
Zhu, D., Li, R., Liu, X., Sun, M., Wu, J., Zhang, N., et al. (2014). The positive regulatory roles of the TIFY10 proteins in plant responses to alkaline stress. PLoS One 9:e111984. doi: 10.1371/journal.pone.0111984
Keywords: soybean, TIFY, salt tolerance, ABA, transcription factor
Citation: Liu Y-L, Zheng L, Jin L-G, Liu Y-X, Kong Y-N, Wang Y-X, Yu T-F, Chen J, Zhou Y-B, Chen M, Wang F-Z, Ma Y-Z, Xu Z-S and Lan J-H (2022) Genome-Wide Analysis of the Soybean TIFY Family and Identification of GmTIFY10e and GmTIFY10g Response to Salt Stress. Front. Plant Sci. 13:845314. doi: 10.3389/fpls.2022.845314
Edited by:
Rohini Garg, Shiv Nadar University, IndiaReviewed by:
Bing-kai Hou, Shandong University, ChinaSatyabrata Nanda, Centurion University of Technology and Management, India
Copyright © 2022 Liu, Zheng, Jin, Liu, Kong, Wang, Yu, Chen, Zhou, Chen, Wang, Ma, Xu and Lan. This is an open-access article distributed under the terms of the Creative Commons Attribution License (CC BY). The use, distribution or reproduction in other forums is permitted, provided the original author(s) and the copyright owner(s) are credited and that the original publication in this journal is cited, in accordance with accepted academic practice. No use, distribution or reproduction is permitted which does not comply with these terms.
*Correspondence: Zhao-Shi Xu, eHV6aGFvc2hpQGNhYXMuY24=; Jin-Hao Lan, amluaGFvMjAwNUBxYXUuZWR1LmNu
†These authors have contributed equally to this work
 Ya-Li Liu1,2†
 Jun Chen
 Ming Chen
 You-Zhi Ma
 Zhao-Shi Xu