
95% of researchers rate our articles as excellent or good
Learn more about the work of our research integrity team to safeguard the quality of each article we publish.
Find out more
ORIGINAL RESEARCH article
Front. Plant Sci. , 21 March 2022
Sec. Plant Bioinformatics
Volume 13 - 2022 | https://doi.org/10.3389/fpls.2022.839044
This article is part of the Research Topic Approaches and Applications in Plant Genome Assembly and Sequence Analysis View all 13 articles
 Qiang Wu
 Dongxi Li*
Genomic copy number variations (CNVs) are among the most important structural variations of genes found to be related to the risk of individual cancer and therefore they can be utilized to provide a clue to the research on the formation and progression of cancer. In this paper, an improved computational gene selection algorithm called CRIA (correlation-redundancy and interaction analysis based on gene selection algorithm) is introduced to screen genes that are closely related to cancer from the whole genome based on the value of gene CNVs. The CRIA algorithm mainly consists of two parts. Firstly, the main effect feature is selected out from the original feature set that has the largest correlation with the class label. Secondly, after the analysis involving correlation, redundancy and interaction for each feature in the candidate feature set, we choose the feature that maximizes the value of the custom selection criterion and add it into the selected feature set and then remove it from the candidate feature set in each selection round. Based on the real datasets, CRIA selects the top 200 genes to predict the type of cancer. The experiments' results of our research show that, compared with the state-of-the-art related methods, the CRIA algorithm can extract the key features of CNVs and a better classification performance can be achieved based on them. In addition, the interpretable genes highly related to cancer can be known, which may provide new clues at the genetic level for the treatment of the cancer.
The occurrence of many diseases is associated with genome structural variations. Human genome variations include single nucleotide polymorphisms (SNPs), copy number variations (CNVs), etc. The copy number variations refer to the amplification, deletion, and more complex mutations in the genome of DNA fragments longer than 1 kb in length (Redon et al., 2006). SNPs account for 0.5% of the human genome, and nearly 12% of the human genome often undergoes copy number variations (Redon et al., 2006). Copy number variations have become an important genomic variation, and their role in the pathogenesis of complex human diseases is still being revealed.
The close relationship between CNVs and diseases has been widely recognized. Numerous studies have demonstrated that not a few human diseases involved copy number variations that could change the diploid status of particular locus of the genome (Zhang et al., 2016). The Flierl research team found that the higher vulnerability of Parkinson's disease and stress sensitivity of neuronal precursor cells carry an α-synuclein gene triplication (Flierl et al., 2014). Grangeon et al. (2021) discovered that early-onset cerebral amyloid angiopathy and Alzheimer Disease (AD) were related to an amyloid precursor protein (App) gene triple amplification. Breunis et al. (2008) reported that the copy number variations of FCGR2C gene promoted idiopathic thrombocytopenic purpura. Zheng et al. (2017) found that the low copy number of FCGR3B was associated with lupus nephritis in a Chinese population. And Pandey et al. (2015) revealed that there was both direct and indirect evidence suggesting abnormalities of glycogen synthase kinase (GSK)-3β and β-catenin in the pathophysiology of bipolar illness and possibly schizophrenia (SZ). Moreover, several neuro-developmental relevant genes, such as A2BP1, IMMP2, and AUTS2, were reported with mutational CNVs (Elia et al., 2010). In 2006, a research team composed of researchers from the United Kingdom, Japan, the United States, Canada and other countries studied 270 individuals in 4 groups of the HapMap project, and constructed the first-generation copy number variations map of the human genome, and obtained 144 CNVs region (about 12% of the size of the human genome). Among them, 285 CNVs regions were related to the occurrence of known diseases (Redon et al., 2006). Compared with SNPs, CNVs regions contained more DNA sequences, disease sites and functional elements, which could provide more clues for disease research. The publication of this map has become an important tool for studying the complex structural variations of the human genome and human diseases.
Cancer is a kind of diseases which involves uncontrolled abnormal cell growth and can spread to other tissues (Du and Elemento, 2015). The formation and development of cancer are also associated with copy number variations (Frank et al., 2007). Van Bockstal et al. (2020) discovered that HER2 gene amplification had a relationship with a bad result in invasive breast cancer and the amplification of heterogeneous HER2 had been described in 5–41% of breast cancer. The experimental results of Buchynska et al. (2019) shown that assessment of copy number variations of HER-2/neu, c-MYC and CCNE1 genes revealed their amplification in the tumors of 18.8, 25.0 and 14.3% of endometrial cancer patients, respectively. Heo et al. (2020) pointed out that CNVs were related to the mechanism of lung cancer development through a comparative experiment. Moreover, Tian et al. (2020) found that CNVs of CYLD, USP9X and USP11 were significantly associated with the risk of colorectal cancer. A latest global cancer burden data released by the International Agency for Research on Cancer(IARC) of the WHO showed that the number of patients with new cancer and cancer deaths in China ranked first around the world with 4.57 million patients with new cancer and 3 million cancer deaths, accounting for 23.7 and 30%, respectively. It is of great significance to investigate cancer causes and its treatment. Because the gene expression patterns in cancer tumor have high specificity (Liang et al., 2020), studying the relationship between these genetic information and cancer can provide a new idea for investigating the causes of cancer and help in early cancer diagnosis.
However, few studies have utilized machine learning (ML) or deep learning (DL) methods to use copy number variations data for the prediction of various cancer types. Zhang et al. (2016) used the mRMR and IFS methods to select 19 features from the 24,174 gene features of the copy number variations data set, which contained a total of 3,480 samples of 6 cancer types. They applied the Dagging algorithm with ten-fold cross-validation to classify cancer. But the accuracy of final result only reached 75%. Liang et al. (2020) used CNA_origin for cancer classification on the same data set. CNA_origin was an intelligent combined deep learning network, which was composed of two parts—a stacked autoencoder and a one-dimensional convolutional neural network with multiscale convolutional kernels. CNA_origin eventually had an overall accuracy of 83.81% on ten-fold cross-validation. But it could not identify which gene features were more important and more closely associated with cancer classification.
Here, we present an improved novel computational algorithm named CRIA, which can successfully classify cancer based on the information of gene CNVs levels from the same dataset. CRIA can not only effectively perform dimensionality reduction operation on high-dimensional gene CNVs data, which can improve the efficiency of the experiment, but also selects specific gene features closely related to cancer, making it clear which genes are more important in cancer classification. And the final results had higher classification accuracy than the state-of-the-art methods.
The rest sections of this paper are structured as follows: Section Background describes the theoretical background and related work. Section The Proposed Method-CRIA introduces the collection of CNVs dataset, the implementation details and performance of the proposed algorithm. Section Results and Discussions demonstrates the experimental results on CNVs dataset and the performance comparison with the recent methods. In section Conclusions, we summarize the conclusions and point out our future work.
In section Information Theory, we introduce some basic information theory knowledge, which is the core of our proposed algorithm. Before proposing our algorithm, we summarize some related work on gene selection methods and point out their drawbacks in section Related Work.
As early as 1948, Shannon's information theory had been proposed (Shannon, 2001), providing an effective method for measuring random variables' information. The entropy can be understood as a measure of the uncertainty of a random variable (Cover and Thomas, 1991). The greater the entropy of a random variable, the greater its uncertainty. If X = {x1, x2, …, xl} is a discrete random variable, its probability distribution is p(x) = P(X = x), x ∈ X. The entropy of X is defined as:
where p(xi) is the probability of xi. Here the base of log is 2 and specified that 0 log 0 = 0.
If Y = {y1, y2, …, ym} is a discrete random variable, p(xi, yj) is the joint probability of X and Y. Then, their joint entropy is defined as:
If the random variable X is in a given situation, the uncertainty measure of the variable Y can be defined by conditional entropy as follows:
where p(yj|xi) is the conditional probability of Y under the condition of X.
Definition 1: Mutual information (MI) (Cover and Thomas, 1991) is a measure of useful information in information theory. It can be regarded as the amount of information shared by two random variables. MI can be defined as:
Definition 2: Conditional mutual information (CMI) (Cover and Thomas, 1991) can be defined as the amount of information that shared by variables X and Y, if a discrete random variable Z = {z1, z2, …, zn} is known.
Definition 3: Joint mutual information (JMI) (Cover and Thomas, 1991) measures the amount of information shared by a joint random variable (X1, X2, ⋯Xq) and Y and it can be defined as:
Definition 4: Interaction gain (IG) had been introduced by Jakulin (2003), Jakulin and Bratko (2004) to measure the amount of information shared by three random variables at the same time. Mutual information can be regarded as a two-way interaction gain. IG is defined as follows:
The irrelevant features and redundant features existed in high-dimensional data will damage the performance of the learning algorithm and reduce the efficiency of the learning algorithm. Therefore, the dimensionality reduction of features is one of the most common methods of data preprocessing (Orsenigo and Vercellis, 2013) and its purpose is to reduce the training time of the algorithm and improve the accuracy of final results (Bennasar et al., 2015). In recent years, the research of gene selection methods based on mutual information has received wide attention from scholars. Best individual gene selection (BIF) (Chandrashekar and Sahin, 2014) is the simplest and fastest filtering gene selection algorithm, especially suitable for high-dimensional data.
Battiti utilized the mutual information (MI) between features and class labels [I(fi; c)] to measure the relevance and the mutual information between features [I(fi; fs)] to measure the redundancy (Battiti, 1994). He proposed the Mutual Information Gene selection (MIFS) criterion and it is defined as:
where F is the original feature set, ΩS is the selected feature subset, F − ΩS is the candidate feature subset and c is the class label. β is a configurable parameter to determine the trade–off between relevance and redundancy. However, β is set experimentally, which results in an unstable performance.
Peng et al. (2005) proposed the Minimum-Redundancy Maximum-Relevance (MRMR) criterion and its evaluation function is defined as:
where |ns| is the number of selected features.
Similarly, other gene selection methods that consider relevance between features and the class label and redundancy between features are concluded, such as Normalized Mutual Information Gene selection (NMIFS) and Conditional Mutual Information (CMI), and they were proposed by Estévez et al. (2009) and Liang et al. (2019) respectively. Their evaluation function are defined as follows:
where H(fi) is the information entropy and H(fi|c) is the conditional entropy.
Many gene selection algorithms based on information theory tend to use mutual information as a measure of relevance, which will bring a disadvantage that mutual information tends to select features with more discrete values (Foithong et al., 2012). Thus, the symmetrical uncertainty (Witten and Frank, 2002) (a normalized form of mutual information, SU) is adopted to solve this problem. The symmetrical uncertainty can be described as:
The SU can redress the bias of mutual information as much as possible and scale its values to [0,1] by penalizing inputs with large entropies. It will make the performance of gene selection better. Same as MI, for any two features fi1 and fi2, if SU(fi1; c) > SU(fi2; c), due to more information can be provided by the former, fi1 and c are more relevant. If SU(fi1; fs) > SU(fi2; fs), owing to the information shared by fi1 and fs being more and providing less information, fi1 and fs have greater redundancy.
Additionally, these gene selection algorithms mentioned above fail to take the feature interaction into consideration. After relevance and redundancy analysis, one feature deemed useless may interact with other features to provide more useful information. Especially in complicated biology systems, molecules interacting with each other, they work together to express physiological and pathological changes. If we only consider relevance and redundancy but ignore the feature interaction in data analysis, we may miss some useful features and affect the analysis results (Chen et al., 2015).
Sun et al. (2013), Zeng et al. (2015), and Gu et al. (2020), respectively proposed a gene selection method using dynamic feature weights: Dynamic Weighting-based Gene selection algorithm (DWFS), Interaction Weight based Gene selection algorithm (IWFS) and Redundancy Analysis and Interaction Weight-based gene selection algorithm (RAIW). All of them employ the symmetric uncertainty to measure the relevance between features and the class label, and exploit the three-dimensional interaction information (mentioned at Information Theory Definition 4) to measure the interaction between two features and the class label. The evaluation functions are defined as follow:
where w(fi) is the weight of each feature and its initial value is set to 1, α is a redundancy coefficient and the value is relevant to the number of dataset's features, fs is one of features in the selected feature subset. In each round, the feature weight w(fi) is updated by their interaction weight factors.
where denotes the feature weight of the previous round, I(fi; c|fs) is the conditional mutual information of fi and c when fs is given. I(fi; fs; c) is three-dimensional interaction information. However, we can find that although DWFS and IWFS take into account relevance and interaction, they ignore the redundancy between features. Correlation, redundancy and interaction are all taken into account by RAIW, but there is a no reasonable value for α in a specific dataset.
Furthermore, some other gene selection methods about three-way mutual information are listed and their evaluation function are defined as follows, such as Composition of Feature Relevance (CFR) (Gao et al., 2018a), Joint Mutual Information Maximization (JMIM) (Bennasar et al., 2015), Dynamic Change of Selected Feature with the class (DCSF) (Gao et al., 2018b) and Max-Relevance and Max-Independence (MRI) (Wang et al., 2017).
where I(fi, fs; c) is the joint mutual information of fi, fs and c. I(fs; c|fi) is the conditional mutual information of fs and c when fi is given. However, these algorithms only take into account three-way mutual information among features and the class label, and none of them considers relevance, redundancy and three-dimensional mutual information between features at the same time, which will affect the performance of these algorithms.
In section CNVs Dataset, we firstly introduce the collection of datasets and the process of data processing specifically. Subsequently, we redress other methods' shortcomings and propose an improved gene selection algorithm called CRIA in section The Proposed Algorithm and give it a specific implementation in section Algorithm Implementation. Finally, in section Verify the Performance of CRIA, we verify the performance of CRIA by comparing the experimental results of CRIA and other 8 algorithms on 5 datasets.
The datasets of copy number variations in different cancer types used in this paper comes from the cBioPortal for Cancer Genomics (http://cbio.mskcc.org/cancergenomics/pancan_tcga/, Release 2/4/2013) (Cerami et al., 2012; Ciriello et al., 2013; Gao et al., 2013). The copy number values in the dataset are generated by Affymetrix SNP 6.0 arrays for the set of samples in the cancer genome atlas (TCGA) study (Liang et al., 2020). The preprocessing analysis of the dataset is performed with GISTIC (Beroukhim et al., 2007). There are 11 cancer types in the cBioPortal database with the largest sample number was 847 and the smallest sample was 135. In order to avoid affecting the experimental results due to the large difference in the number of samples of cancer types, we only select six cancer types with more than 400 samples as our experimental data. The details of six cancer types are listed in Table 1, and totally there are 3480 samples in our experimental dataset.
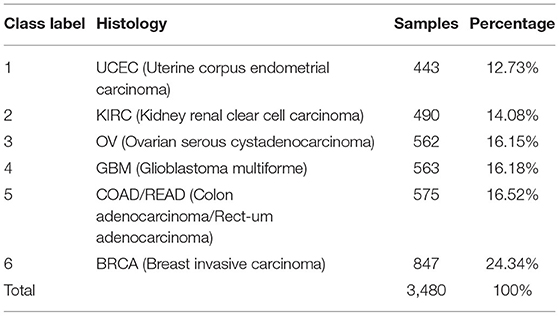
Table 1. The number of samples for each cancer type in this dataset.
In this dataset, each sample consists of labels for 24174 genetic cytobands. The CNV spectrum is divided into five regions/labels by setting four thresholds in cancer algorithm (Mermel et al., 2011). Then, the CNV values are discretized into 5 different values—“-2,” “-1,” “0,” “1,” “2,” where “-2” denotes the deletion of both copies (possibly homozygous deletion), “−1” means the deletion of one copy (possibly heterozygous deletion), “0” corresponds to exactly two copies, i.e., no gain/loss (diploid), “1” denotes a low-level copy number gain and “2” means a high-level copy number amplification (Ciriello et al., 2013).
The CNVs values are preprocessed to the range of [−1,1] with Equation (23).
where val is the value of gene copy number variations of each sample, |val|max is the maximum absolute value of gene CNVs among samples and val′ is the recalculated value.
In section Related Work, we analyze the 11 gene selection methods and point out their shortcomings. In view of the defects of these algorithms, we propose an improved gene selection algorithm to redress their shortcomings: Correlation-Redundancy and Interaction Analysis based gene selection algorithm (CRIA). This method uses the symmetric uncertainty (SU) to measure the correlation between features and the class label and the redundancy among features. In addition, copula entropy is introduced to measure the feature interaction information. Different from the three-way interaction of DWFS, IWFS and RAIW, the proposed algorithm considers the interaction between the candidate feature and the entire set of selected features, instead of being limited to the three-dimensional interaction.
As we know, Shannon's definition of mutual information aims at a pair of random variables, and it measures the correlation between two random variables. Therefore, naturally, many researchers have tried to study how to extend the definition of mutual information from two variables to multivariate situations. In 2011, Ma and Sun published a paper (Ma and Sun, 2011), which contributed to the entropy of information theory. They defined a new concept of entropy in that paper, called Copula Entropy. Copula Entropy is defined on a set of random variables and conformed to symmetry. Therefore, it is a multivariate extension of mutual information, which can be utilized to measure the full-order, non-linear correlation among random variables. They proved the equivalence between copula entropy and the concept of mutual information, which was, mutual information was equal to negative copula entropy (Ma and Sun, 2011).
The copula entropy of is defined as:
where are random variables with marginal functions and copula density .
Thus, we can use interaction factor IFCRIA, which is defined in Equation (25) to measure the interaction between the candidate feature and the selected feature subset. The meaning of IFCRIA is that, after adding a random candidate feature fi into the selected feature subset ΩS, the amount of interaction information increased relative to the original selected feature subset. So, the bigger value of IFCRIA, the bigger value of interaction between fi and ΩS. In each round of calculation, we are supposed to choose the variable that maximizes the IFCRIA value.
Where c is the target class label.
Integrating the correlation between the features and the class label and the redundancy between features that we improved, and the interaction factor we proposed, we can define the evaluation criterion of a candidate feature as follows:
For the equation (26), we can see that the proposed algorithm can take into account the relevance between the candidate feature and the class label, redundancy and multi-dimensional interaction among the candidate feature and the selected features at the same time. The formula SU(fi, c) can denote the relevance and calculates the redundancy. Also, the formula denotes the interaction among the features.
According to the definition of copula entropy and Equation (24), there is a theorem.
Theorem 1: The mutual information of random variables is equivalent to their negative copula entropy (Ma and Sun, 2011):
According to Theorem 1, the value of copula entropy can be calculated by the MI of multivariates. The definition of mutual information extended from two variables to multivariate is described as follows:
where Xm = {x1, x2, …, xm−1, xm} = {Xm−1, xm}.
According to the Equation (28), we have:
Therefore,
According to Equation (26), (27) and (30), we have:
Let ΩS = {f1, f2, …, fm}, Since,
Therefore,
The general flow chart of the proposed algorithm is presented in Figure 1 we can see that an original feature set F is first given, from which we select the main effect feature that maximizes the value of (12). Then the main feature is put into the selected feature subset ΩS. For each feature in the candidate feature set, after conducting correlation and redundancy analysis, we are next supposed to use (25) to perform interaction analysis on it. Choose the feature that maximizes the value of (33), which then is put into the selected feature set. If the number of the selected features meets the threshold condition, the above steps will be executed again, otherwise the program ends directly.
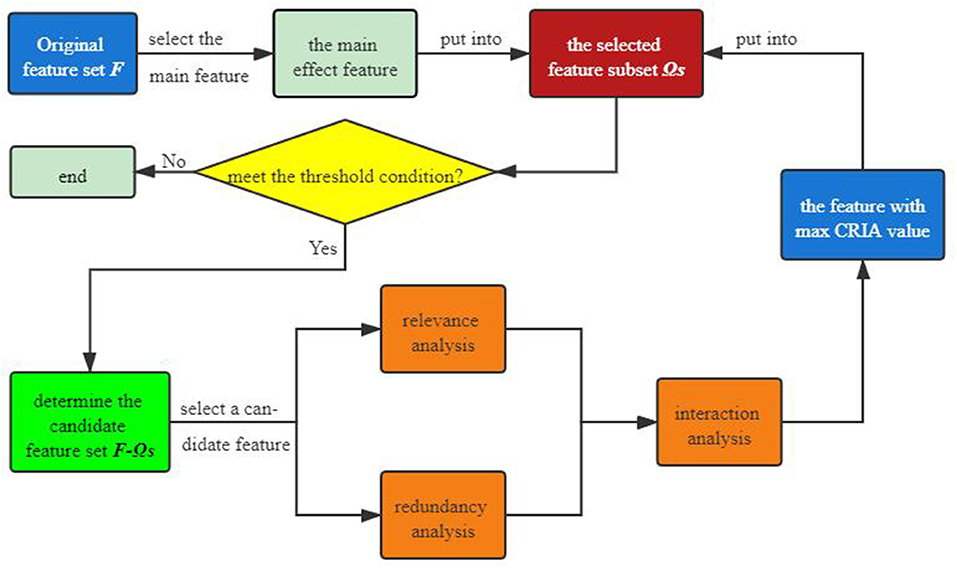
Figure 1. General flow chart of the proposed algorithm.
We propose a gene selection method based on correlation-redundancy and interaction analysis. The pseudo code of CRIA algorithm is described as follows.
Here, for the CNVs dataset, we set the value of the threshold M to be 200 to reduce the calculation time and avoid curse of dimensionality. In addition, we need to control the number of selected features to be same as the method proposed by Zhang et al. (2016).
The CRIA algorithm consists of two stages:
Stage 1 (lines 1–7): In this part, the selected feature subset ΩS and the original feature set F are first initialized. For each feature in the original feature set fi, the symmetrical uncertainty SU(fi; c) between fi and class label c is calculated. The feature whose value of symmetrical uncertainty with class label is the maximum is selected out and added into the selected features subset ΩS, which we name “the main effect feature.”
Stage 2 (lines 8-18): The second stage mainly calculates the correlation measure SU(fi; c) and the redundancy measure . Then the interaction value IFCRIA between ΩS, fi and c is updated. JCRIA(fi) is calculated and the feature with the maximum value is added into the selected feature subset ΩS. This procedure terminates until the number of selected features is no less than predefined threshold M.
According to Algorithm 1, when the size of the feature subset reaches the set threshold M, the procedure will be terminated. The value of the threshold setting should be determined by different datasets. A small M can reduce the amount of calculation but may also lose many effective features that are useful; a large M will increase the amount of calculation but may improve the accuracy of final result (Foithong et al., 2012). Actually, when the threshold exceeds a certain value, the accuracy of the final result will not only not increase, but may decrease, and it will bring computational complexity. The selected features are ranked according to the value of the evaluation function JCRIA(fi) from largest to smallest.
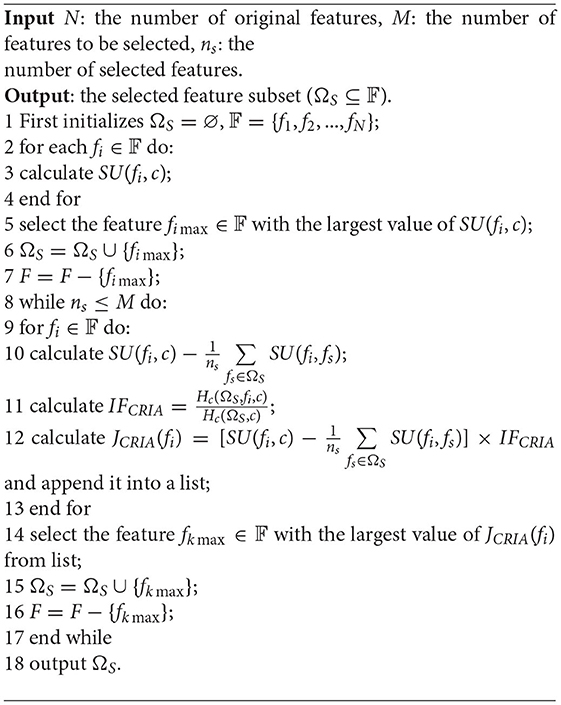
Algorithm 1. CRIA: correlation-redundancy and interaction analysis based gene selection algorithm.
Eight gene selection algorithms—JMIM (Bennasar et al., 2015), mRMR (Peng et al., 2005), DWFS (Sun et al., 2013), IWFS (Zeng et al., 2015), RAIW (Gu et al., 2020), CFR (Gao et al., 2018a), DCSF (Gao et al., 2018b), and MRI (Wang et al., 2017) are used to compare with CRIA to examine the performance of our proposed method.
The datasets used in validation experiment come from Arizona State University (ASU) datasets (Li et al., 2017), which include four biological data and one other type of data (digit recognition). They are all high-dimensional data. The smallest feature number is 2000 and the largest feature number is 9182 among them. The specific details of these datasets are shown in Table 2. We only use minimum description length method (Fayyad and Irani, 1993) for gene selection and utilize it to convert these numerical features.
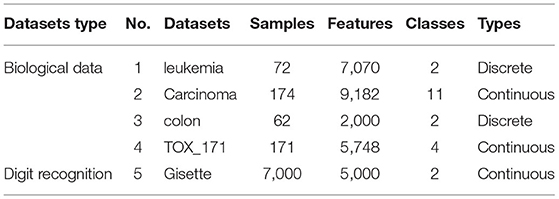
Table 2. Datasets for comparison between CRIA algorithm and other algorithms.
The number of features N used in the experiment is reduced to 50 and three classifiers—IB1, J48 and Naïve Bayes are exploited. The parameters of the classifiers are set to the default parameters of Waikato Environment for Knowledge Analysis (WEKA) (Hall et al., 2009). We use 10 times of ten-fold cross-validation to avoid the influence of randomness on experimental results. Then mean value and Standard Deviation (STD) are taken as the comparison indices of performance of each algorithm and STD is defined as follows:
where nrun is the number of times of our experiments, here we set nrun = 10, ACC is the classification accuracy, u represents the average value of ACC, and N denotes the number of samples. The bigger ACC, the better performance, and the smaller STD, the higher stability.
The comparison results between the proposed algorithm and other gene selection algorithms are shown in Tables 3–5. As shown in Table 3, for the five data sets in the experiment, we can see that the classification results of CRIA in four data sets are better than other eight algorithms, which ranking first, except TOX_171, ranking fourth. Compared with other algorithms, the average accuracy of CRIA is increased by 2.42–5.08%. In Table 4, CRIA also outperforms the other 8 algorithms on four data sets except TOX_171, on which the experimental results of CRIA ranking third. The biggest improved rate of the proposed algorithm is 10.05% and the smallest one is 3.73%. From Table 5, we can find that the results of CRIA on the three data sets are superior to other algorithms, ranking first. However, on the datasets of Carcinoma and TOX_171, compared with the maximum values, the experimental accuracies of CRIA are slightly decreased by 0.50 and 1.71%, ranking second and third respectively. From the perspective of average accuracy, CRIA's result is better than other algorithms, and it is improved by 2.11–8.67%.
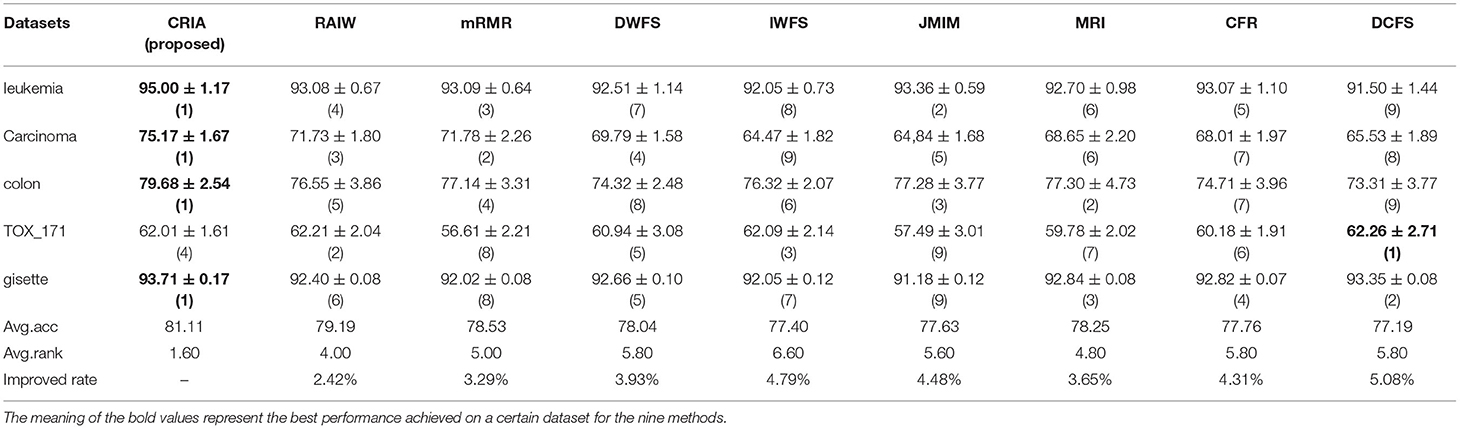
Table 3. Comparision (mean ± std.dev.) of performance between CRIA and other 8 algorithms with J48 classifier.
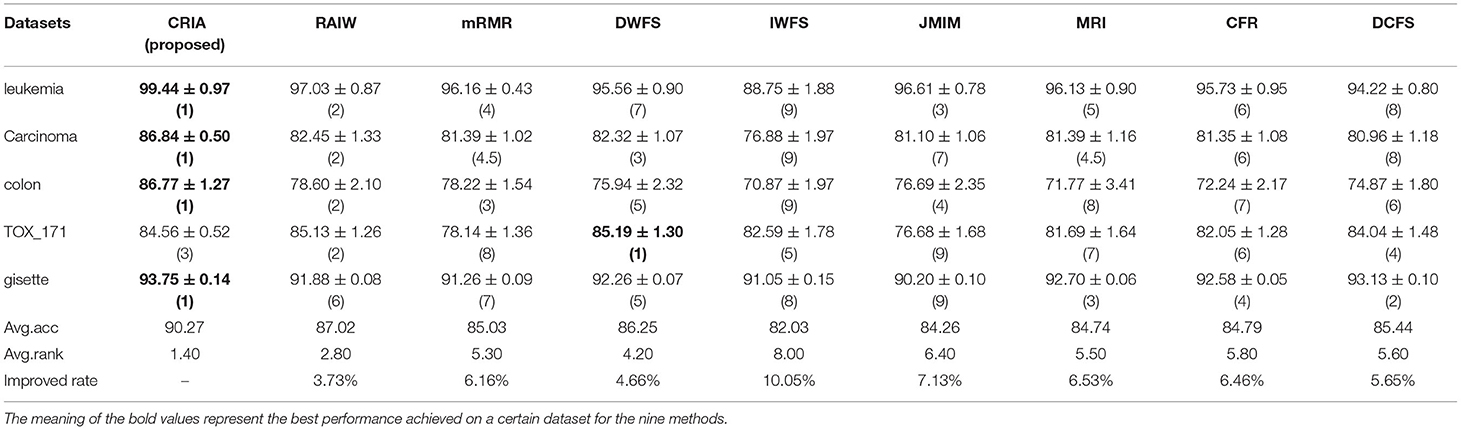
Table 4. Comparision (mean ± std.dev.) of performance between CRIA and other 8 algorithms with IB1 classifier.
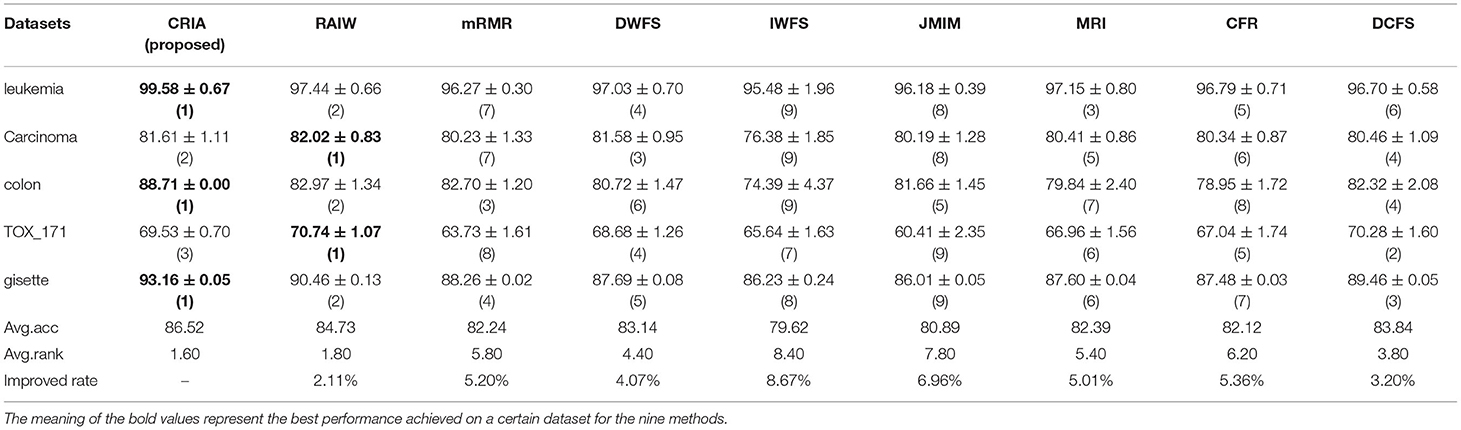
Table 5. Comparision (mean ± std.dev.) of performance between CRIA and other 8 algorithms with Naïve Bayes classifier.
Four evaluation metrics—precision, recall, accuracy and F1-score are utilized to evaluate the performance of the corresponding method and values of these criteria are defined as equation (35).
where TP, TN, FP, and FN denotes the numbers of true positives, true negatives, false positives, and false negatives respectively.
As mentioned in section Evaluation Metrics of Experimental Results, each sample is represented by 24,174 features, each of which indicates the expression level of genes. The 24174 feature genes are sorted by CRIA value in descending order. However, we only select the top 200 features in this work for the consideration of computational time and curse of dimensionality. The top 15 key feature genes chosen by CRIA defined by equation (26) are listed in Table 6.
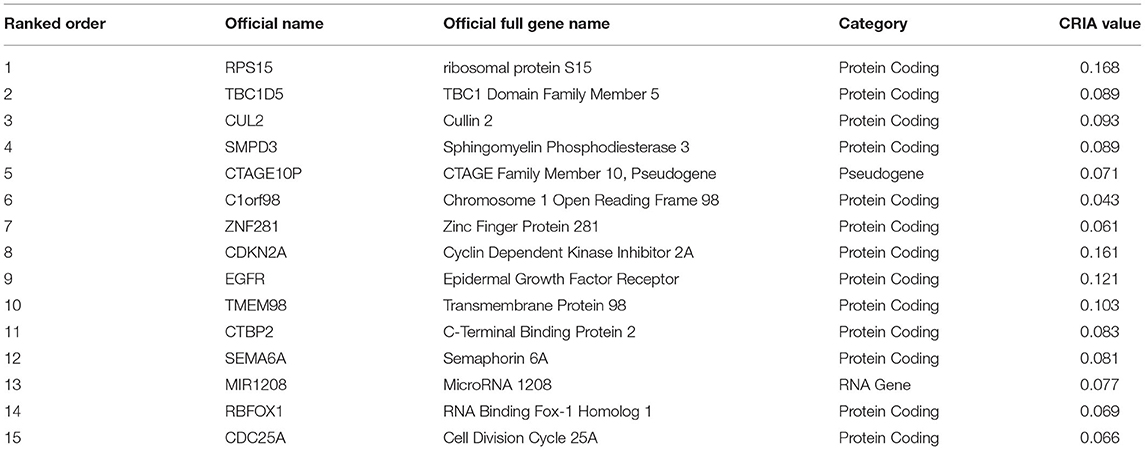
Table 6. The top 15 feature genes chosen by CRIA defined as equation (26).
We use the Incremental Gene selection (IFS) (Yang et al., 2019) to determine the optimal feature set. The first 200 features are added one by one to a feature subset in order. Each time a feature is added, a classifier is trained and examined. So, 200 classifiers are constructed. We use the criteria of accuracy to evaluate the performance of all the 200 classifiers and then we choose the classifier with the highest accuracy as the final one. The corresponding feature subset that the final classifier used is deemed to be the optimal feature set.
In this paper, three commonly used classifiers are adopted to verify the generalization performance of the proposed gene selection method on different classifiers. ten-fold cross-validation is used to evaluate our algorithm with the selected features. The complete data set is randomly split into 10 parts of approximately equal size. The three classifiers are trained 10 times; nine of the 10 subsets are used as the training datasets, and the remaining one is the test dataset. The average values of accuracy for each classifier are calculated and the IFS results are shown in Figure 2. Here, we name our methods as CRIA_CatBoost, CRIA_SVM and CRIA_LightGBM. From Figure 2, it can be seen that the highest accuracy of 86.90% for CRIA_CatBoost method followed by 86.41% for CRIA_LightGBM and 85.98% for CRIA_SVM method, with only using the CNVs of 131 genes, 138 genes and 122 genes respectively.
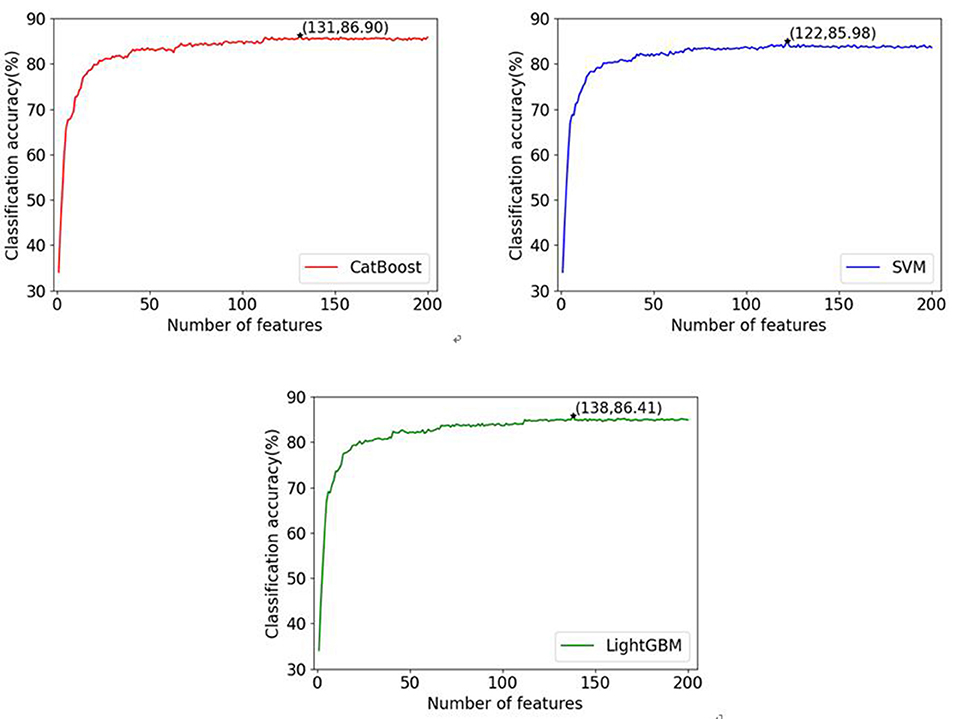
Figure 2. Classification accuracies of three classifiers (CatBoost, LightGBM and SVM) with different numbers of features during the IFS procedure. The top 200 feature genes are selected by CRIA method.
For the different classifiers used in this work, after determining the optimal numbers of features according to the CRIA and IFS results, the classification performance can be further analyzed. The average values of three metrics-precision, recall and F1-score defined in Equation (35) on 10 test datasets are listed in Table 7.
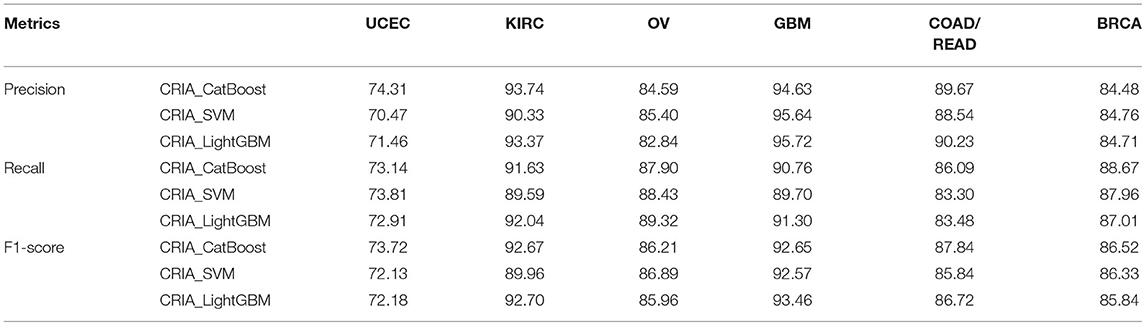
Table 7. Average performance of precision, recall and F1-score on 10 test datasets with three classifiers via ten-fold cross-validation (%).
After selecting important features, we use three common classifiers—CatBoost, SVM and LightGBM to predict cancer samples. The performance of our methods are compared with other two classification methods published before whose experimental dataset is the same as ours. Liang et al. (2020) used a method called CNA_origin which was composed of a stacked autoencoder and an one-dimensional convolutional neural network. The 24,174 gene features were extracted to 100 genes by the autoencoder, and then these 100 gene features were put into the 1D CNN for classification (Liang et al., 2020). A computationally method for cancer types classification proposed by Zhang et al. (2016) was named as mRMR_Dagging here because there was no specific method name given by authors. It first used mRMR and IFS to select 19 of the 24,174 genes as classification features, and then used the Dagging algorithm to give the final results.
In Table 8, it can be seen that if the results of our methods are superior to CNA_origin and mRMR_Dagging, they are marked in bold. Similarly, if the largest of CNA_origin and mRMR_Dagging results is better than our method, it is also marked in bold. Table 8 demonstrated that the performance of our methods is superior to CNA_origin and mRMR_Dagging for UCEC, KIRC, GBM, and COADREAD. For UCEC, the recall and F1-score of our methods (CRIA_Cat- Boost, CRIA_SVM and CRIA_LightGBM) are all superior to CNA_origin and mRMR_Dagging. The best precision of our methods is 0.12 percentage points higher than mRMR_Dagging. SVM and LightGBM are slightly worse than mRMR_Dagging with reductions of 5.28 and 3.82% in precision respectively. For KIRC, the precision and F1-score are all superior to CNA_origin and mRMR_Dagging except the F1-score of SVM, which performs slightly worse than the CNA_origin with reductions of 2.61%. Compared with the best, CNA_origin, the recall of our methods are decreased by 4.77% for CatBoost, 7.15% for SVM and 4.30% for LightGBM. For OV, compared with CNA_origin, the recall of our methods is at least increased by 1.36%. The precision and F1-score are slightly worse than CNA_origin, with reductions at most of 8.40, and 2.37%, respectively. For GBM and COADREAD, our methods are better than CNA_origin and mRMR_Dagging on all evaluation indicators. Compared with the best of the other two algorithms, the worst precision of our methods is increased by 1.64 and 8.53%, respectively, the worst recall is increased by 4.39 and 12.86%, respectively, and the worst F1-score is increased by 4.58 and 10.76%, respectively. For BRCA, the worst among our methods performs slightly worse than the best CNA_origin algorithm, with reductions of 3.57% in precision, 6.09% in recall and 4.66% in F1-score respectively.
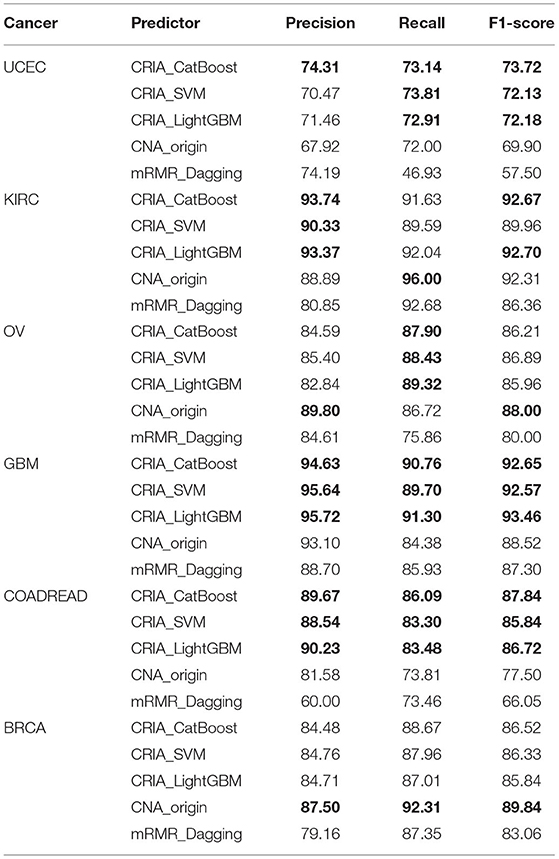
Table 8. Performance comparison of the proposed algorithm predictions with those of other methods (%).
In addition, the macro-average results of four evaluation metrics: accuracy, precision, recall and F1-score are used to assess our methods and the other two algorithms on the datasets of six types of cancers. The results can be seen in Figure 3. For accuracy, our methods have mean values of 86.90% for CatBoost, 86.41% for LightGBM and 85.98% for SVM respectively, which are increased by 3.69, 3.10, and 2.59% compared with CNA_origin. For precision, the average values of our methods are 86.61, 86.39, and 85.86%, which are increased by 3.49, 3.23, and 2.59%, respectively compared with the best among CNA_origin and mRMR_Dagging. For recall, our methods' mean values are 86.37, 86.01, and 85.47%, which are 2.92, 2.56 and 2.02 percentage points higher than CNA_origin, respectively. For F1-score, compared with our methods, whose average values are 86.60, 86.14, and 85.62%, CNA_origin is decreased by 3.71, 3.19, and 2.60%, respectively.
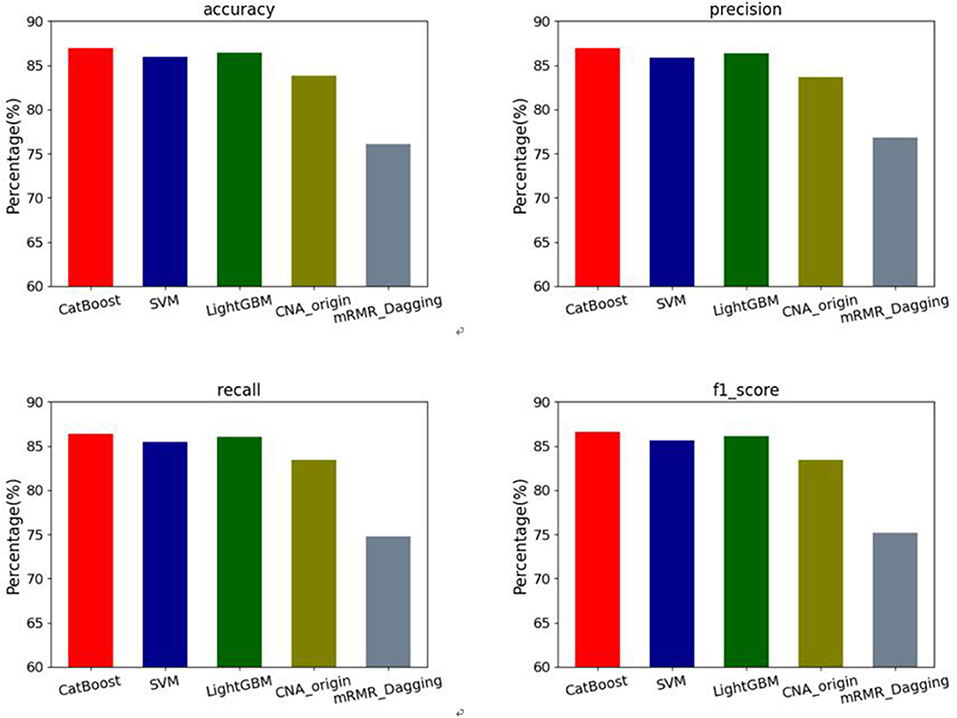
Figure 3. Performance comparison of 4 evaluation metrics: accuracy, precision, recall and F1-score among our methods and the other two algorithms (CNA_origin and mRMR_Dagging).
In order to study the relationship between the classes, we also summarize the confusion matrices in Figure 4 for class predictions using our methods. From Figure 4, we can find that there existed a high error rate when predicting the samples of UCEC. Regardless of whether it is CRIA_CatBoost, CRIA_SVM or CRIA_LightGBM, more than 10% of the UCEC samples are incorrectly predicted as OV and BRCA. In Figure 4A, 14.00% of UCEC samples are predicted as OV, while 11.06% of UCECsamples are predicted to be BRCA. In Figure 4B, 14.45 and 11.74% of UCEC samples are predicted as OV and BRCA respectively. In Figure 4C, 13.32 and 12.42% of UCEC samples are predicted as OV and BRCA respectively. The reasons may be that UCEC, OV and BRCA are hormone-dependent tumors and they relate closely in tumorigenesis. The 16 and 27 risk regions were identified by an independent genome-wide association study (GWAS) on endometrial cancer and ovarian cancer, respectively (Glubb et al., 2020). Studies have shown that mutations in breast cancer susceptibility genes (BRCA1, BRCA2) have a relationship in hereditary ovarian cancer. Mutations at either end of the BRCA1 gene increase a person's risk of breast cancer, and its probability is higher than ovarian cancer. However, mutations in the middle of the BRCA1 gene put a person at a higher risk of ovarian cancer than breast cancer (Shi et al., 2017). In addition, there is also a study indicated that UCEC, OV and BRCA all have a relationship with the changes in estrogen and estrogen receptors (Rodriguez et al., 2019).

Figure 4. Confusion matrices on the test groups: (A) CRIA_CatBoost; (B) CRIA_SVM; (C) CRIA_LightGBM.
In this paper, we introduce a gene selection algorithm—CRIA. We firstly apply this algorithm to 5 datasets and verify the effective performance of CRIA through comparison with other eight gene selection algorithms. The proposed algorithm can select features which are closely related to the class label. Then, we use this algorithm to select 200 genes that have a close relationship with cancer types from 24,174 genes features based on the value of copy number variations in the samples, and then combine three common classifiers—CatBoost, SVM and LightGBM to predict the type of cancer. Our experimental results show that our methods have higher accuracies than the state-of-the-art methods for solving this problem. Our research has a certain degree of interpretability for cancer-related researches at the genetic level. As we all know, cancer is closely related to gene structural variations and the appearance of cancer is often accompanied by abnormalities in the deoxyribonucleic acid (DNA) sequence. Because CNVs is one of the most crucial structural variations of genes, studying the relationship between cancers and CNVs is of great significance. Many studies have tried to utilize the genetic information of cancers to predict cancer type, which can provide significant guidance for patient care and cancer therapy in promptly.
The future direction of this work can continue to develop from two aspects. First of all, because we only use the datasets of six cancer types and the total number of samples is only 3,480 in this paper, by collecting data sets of other cancer types and optimizing the proposed algorithm, we can continue to conduct further research in the field of cancer classification based on copy number variations. Moreover, integrating non-CNVs features for the samples can be taken into consideration. In addition to using CNVs for cancer prediction, we can also apply other genetic information for cancer prediction, or combine several biomarkers to reduce the error rate of classification as much as possible.
The original contributions presented in the study are included in the article/supplementary material, further inquiries can be directed to the corresponding author/s.
QW conducted the experiments and wrote the manuscript. DL conceived and provided the main direction of the manuscript and guided the writing and modification of this manuscript. Both authors read and approved the manuscript.
This work was supported by the National Natural Science Foundation of China (Grant No. 11571009) and Applied Basic Research Programs of Shanxi Province (Grant No. 201901D111086).
The authors declare that the research was conducted in the absence of any commercial or financial relationships that could be construed as a potential conflict of interest.
All claims expressed in this article are solely those of the authors and do not necessarily represent those of their affiliated organizations, or those of the publisher, the editors and the reviewers. Any product that may be evaluated in this article, or claim that may be made by its manufacturer, is not guaranteed or endorsed by the publisher.
Battiti, R. (1994). Using mutual information for selecting features in supervised neural net learning. IEEE Trans. Neural Netw. 5, 537–550. doi: 10.1109/72.298224
Bennasar, M., Hicks, Y., and Setchi, R. (2015). Gene selection using Joint Mutual Information Maximisation. Expert Syst. Appl. 42, 8520–8532. doi: 10.1016/j.eswa.2015.07.007
Beroukhim, R., Getz, G., Nghiemphu, L., Barretina, J., Hsueh, T., Linhart, D., et al. (2007). Assessing the significance of chromosomal aberrations in cancer: Methodology and app- lication to glioma. Proc. Natl. Acad. Sci. 104, 20007–20012. doi: 10.1073/pnas.0710052104
Breunis, W. B., van Mirre, E., Bruin, M., Geissler, J., de Boer, M., Peters, M., et al. (2008). Copy number variation of the activating FCGR2C gene predisposes to idiopathic thrombocytopenic purpura. Blood 111, 1029–1038. doi: 10.1182/blood-2007-03-079913
Buchynska, L. G., Brieieva, O. V., and Iurchenko, N. P. (2019). Assessment of HER-2/neu, α-MYC and CCN- E1 gene copy number variations and protein expression in endometrial carcinomas. Exp. Oncol. 41. doi: 10.32471/exp-oncology.2312-8852.vol-41-no-2.12973
Cerami, E., Gao, J., Dogrusoz, U., Gross, B. E., Sumer, S. O., Aksoy, B. A., et al. (2012). The cBio cancer genomics portal: an open platform for exploring multidimensional cancer geno- mics data: figure 1. Cancer Discov. 2, 401–404. doi: 10.1158/2159-8290.CD-12-0095
Chandrashekar, G., and Sahin, F. (2014). A survey on gene selection methods. Comput. Electr. Eng. 40, 16–28. doi: 10.1016/j.compeleceng.2013.11.024
Chen, Z., Wu, C., Zhang, Y., Huang, Z., Ran, B., Zhong, M., et al. (2015). Gene selection with redundancy-complementariness dispersion. Knowl. Based Syst. 89, 203–217. doi: 10.1016/j.knosys.2015.07.004
Ciriello, G., Miller, M. L., Aksoy, B. A., Senbabaoglu, Y., Schultz, N., and Sander, C. (2013). Emerging landscape of oncogenic signatures across human cancers. Nat. Genet. 45, 1127–1133. doi: 10.1038/ng.2762
Cover, T. M., and Thomas, J. A. (1991). Elements of Information Theory. New York, NY: John Wiley and Sons.
Du, W., and Elemento, O. (2015). Cancer systems biology: embracing complexity to develop better anticancer therapeutic strategies. Oncogene 34, 3215–3225. doi: 10.1038/onc.2014.291
Elia, J., Gai, X., Xie, H. M., Perin, J. C., Geiger, E., Glessner, J. T., et al. (2010). Rare structural variants found in attention-deficit hyperactivity disorder are preferentially associated with neurodevelopmen- tal genes. Mol. Psychiatry 15, 637–646. doi: 10.1038/mp.2009.57
Estévez, P. A., Tesmer, M., Perez, C. A., and Zurada, J. A. (2009). Normalized Mutual Information Gene selection. IEEE Trans. Neural Netw.20, 189–201. doi: 10.1109/TNN.2008.2005601
Fayyad, U. M., and Irani, K. B. (1993). “Multi-Interval Discretization of Continuous-Valued Attributes for Classification Learning,” in Pro-ceedings of International Joint Conference on Artificial Intel- ligence, pp 1022–1027
Flierl, A., Oliveira Luís, M. A., Falomir-Lockhart Lisandro, J., Mak Sally, K., Hesley, J., Soldner, F., et al. (2014). Higher vulnerability and stress sensitivity of neuronal precursor cells carrying an alpha-synuclein gene triplication. PLoS ONE 9, e112413. doi: 10.1371/journal.pone.0112413
Foithong, S., Pinngern, O., and Attachoo, B. (2012). Feature subset selection wrapper based on mutual information and rough sets. Expert Syst. Appl. 39, 574–584. doi: 10.1016/j.eswa.2011.07.048
Frank, B., Bermejo, J. L., Hemminki, K., Sutter, C., Wappenschmidt, B., Meindl, A., et al. (2007). Copy number variant in the candidate tumor suppressor gene MTUS1 and familial breast cancer risk. Carcinogenesis 28, 1442–1445. doi: 10.1093/carcin/bgm033
Gao, J., Aksoy, B. A., Dogrusoz, U., Dresdner, G., Gross, B., Sumer, S. O., et al. (2013). Integrative analysis of complex cancer genomics and clinical profiles using the Cbioportal. Sci. Signaling 6, pl1–pl1. doi: 10.1126/scisignal.2004088
Gao, W., Hu, L., and Zhang, P. (2018b). Class-specific mutual information variation for gene selection. Pattern Recogn. 79, 328–339. doi: 10.1016/j.patcog.2018.02.020
Gao, W., Hu, L., Zhang, P., and He, J. (2018a). Gene selection considering the composition of feature relevancy. Pattern Recogn. Lett. 112, 70–74. doi: 10.1016/j.patrec.2018.06.005
Glubb, D. M., Thompson, D. J., Aben, K. K., Alsulimani, A., Amant, F., Annibali, D., et al. (2020). Cross-cancer genome-wide association study of endometrial cancer and epithelial ovarian cancer identifies genetic risk regions associated with risk of both cancers. Cancer Epidemiol. Biomarkers Prev. 30, 217–28. doi: 10.1158/1055-9965.EPI-20-0739
Grangeon, L., Cassinari, K., Rousseau, S., Croisile, B., Formaglio, M., Moreaud, O., et al. (2021). Early-onset cerebral amyloid angiopathy and alzheimer disease related to an app locus triplication. Neurol. Genet. 7, e609–e609. doi: 10.1212/NXG.0000000000000609
Gu, X., Guo, J., Li, C., and Xiao, L. (2020). A gene selection algorithm based on redundancy analysis and interaction weight. Appl. Intell. 51, 2672–2686. doi: 10.1007/s10489-020-01936-5
Hall, M., Frank, E., Holmes, G., Pfahringer, B., Reutemann, P., and Witten, I. H. (2009). The WEKA data mining software: an update. SIGKDD Explor Newsl. 11, 10–18. doi: 10.1145/1656274.1656278
Heo, Y., Heo, J., Han, S., Kim, W. J., Cheong, H. S., and Hong, Y. (2020). Difference of copy number variation in blood of patients with lung cancer. Int. J. Biol. Markers 36, 3–9. doi: 10.1177/1724600820980739
Jakulin, A. (2003). Attribute Interactions in Machine Learning (Master thesis). Computer and Information Science, University of Ljubljana.
Jakulin, A., and Bratko, I. (2004). “Testing the significance of attribute interactions,” in Proceedings of the Twenty-first international conference on Machine learning - ICML'04. Banff, AL: ACM Press. pp. 409–416.
Li, J., Cheng, K., Wang, S., Morstatter, F., Trevino, R. P., Tang, J., et al. (2017). Gene selection: a data perspective. ACM Comput. Surv. 50, 1–45. doi: 10.1145/3136625
Liang, J., Hou, L., Luan, Z., and Huang, W. (2019). Gene selection with conditional mutual information considering feature interaction. Symmetry 11, 858. doi: 10.3390/sym11070858
Liang, Y., Wang, H., Yang, J., Li, X., Dai, C., Shao, P., et al. (2020). A deep learning framework to predict tumor tissue-of-origin based on copy number alteration. Front. Bioeng. Biotech. 8, 701. doi: 10.3389/fbioe.2020.00701
Ma, J., and Sun, Z. (2011). Mutual information is copula entropy. Tsinghua Sci. Technol. 16, 51–54. doi: 10.1016/S1007-0214(11)70008-6
Mermel, C. H., Schumacher, S. E., Hill, B., Meyerson, M. L., Beroukhim, R., and Getz, G. (2011). GISTIC2.0 facilitates sensitive and confident localization of the targets of focal somatic copy-number al teration in human cancers. Genome Biol. 12, 4. doi: 10.1186/gb-2011-12-4-r41
Orsenigo, C., and Vercellis, C. (2013). A comparative study of non-linear manifold learning methods for cancer microarray data classification. Expert Syst. Appl. 40, 2189–2197. doi: 10.1016/j.eswa.2012.10.044
Pandey, G. N., Rizavi, H. S., Tripathi, M., and Ren, X. (2015). Region-specific dysregulation of glycogen synthase kinase-3β and β-catenin in the postmortem brains of subjects with bipolar disorder and schizophrenia. Bipolar Disord. 17, 160–171. doi: 10.1111/bdi.12228
Peng, H., Long, F., and Ding, C. (2005). Gene selection based on mutual information criteria of max-dependency, max-relevance, and min-redundancy. IEEE T. Pattern Anal. 27, 1226–1238. doi: 10.1109/TPAMI.2005.159
Redon, R., Ishikawa, S., Fitch, K. R., Feuk, L., Perry, G. H., Andrews, T. D., et al. (2006). Global variation in copy number in the human genome. Nature 444, 444–454. doi: 10.1038/nature05329
Rodriguez, A. C., Blanchard, Z., Maurer, K. A., and Gertz, J. (2019). Estrogen signaling in endometrial cancer: a key oncogenic pathway with several open questions. HORM. CANC. 10, 51–63. doi: 10.1007/s12672-019-0358-9
Shannon, C. E. (2001). A mathematical theory of communication. SIGMOBILE Mob. Comput. Commun. Rev. 5, 3–55. doi: 10.1145/584091.584093
Shi, T., Wang, P., Xie, C., Yin, S., Shi, D., Wei, C., et al. (2017). BRCA1 and BRCA2 mutations in ovarian cancer patients from China: ethnic-related mutations in BRCA1 associated with an increased risk of ovarian cancer: BRCA1/2 mutation in Chinese ovarian cancer. Int. J. Cancer 140, 2051–2059. doi: 10.1002/ijc.30633
Sun, X., Liu, Y., Xu, M., Chen, H., Han, J., and Wang, K. (2013). Gene selection using dynamic weights for classification. Knowl. Based Syst. 37, 541–549. doi: 10.1016/j.knosys.2012.10.001
Tian, T., Bi, H., Liu, Y., Li, G., Zhang, Y., Cao, L., et al. (2020). Copy number variation of ubiquitin- specific proteases genes in blood leukocytes and colorectal cancer. Cancer Biol. Ther. 21, 637–646. doi: 10.1080/15384047.2020.1750860
Van Bockstal, M. R., Agahozo, M. C., van Marion, R., Atmodimedjo, P. N., Sleddens, H. F. B. M., Dinjens, W. N. M., et al. (2020). Somatic mutations and copy number variations in breast cancers with heterogeneous HER2 amplification. Mol. Oncol. 14, 671–685. doi: 10.1002/1878-0261.12650
Wang, J., Wei, J. M., Yang, Z., and Wang, S. Q. (2017). Gene selection by Maximizing Independent Classification Information. IEEE Trans. Knowl. Data Eng. 29, 828–841. doi: 10.1109/TKDE.2017.2650906
Witten, I. H., and Frank, E. (2002). Data mining: practical machine learning tools and techniques with Java implementations. SIGMOD Rec. 31, 76–77. doi: 10.1145/507338.507355
Yang, Y., Song, S., Chen, D., and Zhang, X. (2019). Discernible neighborhood counting based incremental gene selection for heterogeneous data. Int. J. Mach. Learn. Cybern. 11, 1115–1127. doi: 10.1007/s13042-019-00997-4
Zeng, Z., Zhang, H., Zhang, R., and Yin, C. (2015). A novel gene selection method considering feature interaction. Pattern Recogn. 48, 2656–2666. doi: 10.1016/j.patcog.2015.02.025
Zhang, N., Wang, M., Zhang, P., and Huang, T. (2016). Classification of cancers based on copy number variation landscapes. Biochim. Biophys. Acta, Gen. Subj. 1860, 2750–2755. doi: 10.1016/j.bbagen.2016.06.003
Keywords: gene selection, correlation-redundancy analysis, interaction analysis, copula entropy, copy number variations (CNVs), cancers prediction
Citation: Wu Q and Li D (2022) CRIA: An Interactive Gene Selection Algorithm for Cancers Prediction Based on Copy Number Variations. Front. Plant Sci. 13:839044. doi: 10.3389/fpls.2022.839044
Received: 19 December 2021; Accepted: 19 January 2022;
Published: 21 March 2022.
Edited by:
Weihua Pan, Agricultural Genomics Institute at Shenzhen (CAAS), ChinaReviewed by:
Lin Wang, Tianjin University of Science and Technology, ChinaCopyright © 2022 Wu and Li. This is an open-access article distributed under the terms of the Creative Commons Attribution License (CC BY). The use, distribution or reproduction in other forums is permitted, provided the original author(s) and the copyright owner(s) are credited and that the original publication in this journal is cited, in accordance with accepted academic practice. No use, distribution or reproduction is permitted which does not comply with these terms.
*Correspondence: Dongxi Li, ZHhsaTA0MjZAMTI2LmNvbQ==
Disclaimer: All claims expressed in this article are solely those of the authors and do not necessarily represent those of their affiliated organizations, or those of the publisher, the editors and the reviewers. Any product that may be evaluated in this article or claim that may be made by its manufacturer is not guaranteed or endorsed by the publisher.
Research integrity at Frontiers
Learn more about the work of our research integrity team to safeguard the quality of each article we publish.