 Weicai Song
 Chuxuan Ji
 Zimeng Chen
 Haohong Cai
 Xiaomeng Wu
 Chao Shi
 Shuo Wang
95% of researchers rate our articles as excellent or good
Learn more about the work of our research integrity team to safeguard the quality of each article we publish.
Find out more
ORIGINAL RESEARCH article
Front. Plant Sci. , 10 February 2022
Sec. Plant Systematics and Evolution
Volume 13 - 2022 | https://doi.org/10.3389/fpls.2022.832884
This article is part of the Research Topic Evolution of Crop Genomes and Epigenomes View all 13 articles
Musa (family Musaceae) is monocotyledonous plants in order Zingiberales, which grows in tropical and subtropical regions. It is one of the most important tropical fruit trees in the world. Herein, we used next-generation sequencing technology to assemble and perform in-depth analysis of the chloroplast genome of nine new Musa plants for the first time, including genome structure, GC content, repeat structure, codon usage, nucleotide diversity and etc. The entire length of the Musa chloroplast genome ranged from 167,975 to 172,653 bp, including 113 distinct genes comprising 79 protein-coding genes, 30 transfer RNA (tRNA) genes and four ribosomal RNA (rRNA) genes. In comparative analysis, we found that the contraction and expansion of the inverted repeat (IR) regions resulted in the doubling of the rps19 gene. The several non-coding sites (psbI–atpA, atpH–atpI, rpoB–petN, psbM–psbD, ndhf–rpl32, and ndhG–ndhI) and three genes (ycf1, ycf2, and accD) showed significant variation, indicating that they have the potential of molecular markers. Phylogenetic analysis based on the complete chloroplast genome and coding sequences of 77 protein-coding genes confirmed that Musa can be mainly divided into two groups. These genomic sequences provide molecular foundation for the development and utilization of Musa plants resources. This result may contribute to the understanding of the evolution pattern, phylogenetic relationships as well as classification of Musa plants.
Musaceae is a small family of Zingiberales in monocotyledonous plants, mostly distributed in tropical regions in Australia, Africa, and Asia. It is closest to Strelitziaceae, Lowiaceae, and Heliconiaceae in phylogenetic position (Kress et al., 2001). Three genera are commonly recognized within Musaceae. Ensete is a small genus with eight to nine species found in Madagascar, sub-Saharan Africa and Asia, Musella is a monotypic genus native to southwest China (Li et al., 2010). While most species of the family, which occur mainly in Southeast Asia, are classified into the Musa group (Häkkinen and Väre, 2008). Musa grow in tropical and subtropical regions and is one of the most important tropical fruit trees in the world. According to molecular analysis, wild Musa species are reclassified into two groups, Musa L. sect. Musa (by merging Eumusa with Rhodochlamys) and Musa sect. Callimusa, including the previously classified M. sect. Australimusa and M. sect. Ingentimusa (Häkkinen, 2013). Banana fiber has become one of the high potential biological resources in new material field due to it’ s characteristics such as sustainability, low cost and environmental friendliness (Pappu et al., 2015; Vishnuvarthanan et al., 2019). For example, the leaf fibers of abaca (Musa textilis) are ideal raw materials for manufacturing specialty paper (del Río and Gutiérrez, 2006). Many organs of Musa plants are being used in various fields. Banana peels not only have effect in purifying Cr(III), Cr(VI), Cu(II), and radioactive substances (uranium and thorium) in water (Pakshirajan et al., 2013; Oyewo et al., 2016), but also were used as a new type of bio-sorbent to adsorb aflatoxins and ochratoxin A (Shar et al., 2016). Tree trunks and leaves can be used as precursors for the production of adsorbents for the purification of various pollutants (Ahmad and Danish, 2018). The dry biomass of banana pseudo stem can remove the reactive blue 5G (RB5G) dye (Jarvis and López-Juez, 2013). At the same time, many parts of banana can be used to produce industrial raw materials, such as ethanol, polyhydroxy butyrate (PHB), etc. (Oberoi et al., 2011; Ingale et al., 2014; Naranjo et al., 2014). Banana starch also plays an important role in the food, pharmaceutical, and cosmetic industries (Ramírez-Hernández et al., 2017; Arias et al., 2021; Taweechat et al., 2021; Thanyapanich et al., 2021).
Chloroplasts are an energy converter that provides energy for higher plants and algae, which are a unique structure of plant cells. At the same time, chloroplasts play a vital role in many functions of plant growth, including starch storage, sugar synthesis, the production of several amino acids, lipids, vitamins and pigments, essential sulfur and nitrogen metabolic pathways (Jarvis and López-Juez, 2013; Martin et al., 2013; Nielsen et al., 2016). In angiosperms, chloroplast (cp) genome is mainly a circular structure with the length is between 120–180 kb (Provan et al., 2001). The chloroplast genome is a circular double-stranded structure, which is divided into four parts, two of which are called single-copy regions, including a large single-copy region (LSC) and a small single-copy region (SSC) (Kolodner and Tewari, 1979), and the other two almost identical regions separating the single-copy regions are called inverted repeat sequences A and B (IRa, IRb) (Wicke et al., 2011). Compared with the nuclear and mitochondrial genomes, the chloroplast genome is relatively conserved in gene structure and composition (Asaf et al., 2017a). With the rapid development of Next Generation Sequencing (NGS), the National Center for Biotechnology Information (NCBI) database provides more and more chloroplast genomes, enabling people to have a better understanding of the relationship between chloroplast structure and genetic evolution, which also heavily facilitated the research of chloroplast genomes (Yang et al., 2014; Li et al., 2017; Amiryousefi et al., 2018b). The polymorphic sites of the chloroplast genome can be used to develop reliable and stable molecular markers, which will help us to study population genetics and phylogeny (Ahmed et al., 2013; Sheng et al., 2021).
The relatively conservative chloroplast genome is an ideal research method for studying genetic relationship identification. It is of great significance to analyze the chloroplast genome of Musa, including structural characteristics, phylogenetic relationships and population genetics. As a supplementary technology, chloroplast sequencing not only provide part of the genetic diversity information about Musa germplasm resources, but also clarifies the genes and potential functions of Musa plants. So far, the complete chloroplast sequences of Musa plants have been obtained in Musa acuminata (Martin et al., 2013), Musa balbisiana (Shetty et al., 2016), Musa beccarii (Feng et al., 2020) and Musa ornate (Liu et al., 2018) and so forth. Here, we reported the complete chloroplast genomes of nine Musa species, which was the first comprehensive comparison of these nine species. We compared the structure and content patterns of nine Musa chloroplast genomes; explored the sequence differences in nine Musa cp genomes; detected simple sequence repeats (SSR) and long repeats; calculated codon usage bias and putative RNA editing site. We also studied the genetic variation between Musa species, including inverted repeat (IR) contraction/expansion; gene duplication and loss during evolution; the ratio of non-synonymous (Ka) to synonymous substitutions (Ks), which may help uncover the genetic relationship between Musa species. We also performed phylogenetic analyses using chloroplast genome sequences from other related species to further determine the taxonomy of Musa genus. These results perfect the existing genetic information of Musa species and provide a valuable reference for the DNA molecular research of Musa species. Application of these results will help assess the genetic variation and phylogenetic relationships between closely related species and support the development of wild germplasm resources.
In this study, the nine species of Musa were collected from Plant Germplasm and Genomics Center, Kunming Institute of Botany, the Chinese Academy of Sciences, and was approved by Kunming Institute of Botany and local policy. The voucher specimen and DNA were deposited at Qingdao University of Science and Technology (specimen code BJ210253-BJ210261). Total genomic DNA was extracted from fresh leaves using modified CTAB (Porebski et al., 1997). According to the manufacturer’s protocol, the Illumina TruSeq Library Preparation Kit (Illumina, San Diego, CA, United States) was used to prepare approximately 500 bp of paired-end libraries for DNA inserts. These libraries were sequenced on the Illumina HiSeq 4000 platform in Novogene (Beijing, China), generating raw data of 150 bp paired-end reads. About 3 Gb high quality, 2 × 150 bp pair-end raw reads were obtained and were used to assemble the complete chloroplast genome of Musa.
Trimmomatic 0.39 software were used preprocessed the raw data (Bolger et al., 2014), including removal of adapter sequences and other sequences introduced in the sequencing, removing low-quality and over-N-base reads, etc. The quality of newly produced clean short reads was assessed using FASTQC v0.11.9 and MULTIQC software (Ewels et al., 2016), and high-quality data with Phred scores averaging above 35 were screened out. According to the reference sequence (Musa balbisiana), the chloroplast-like (cp) reads were isolated from clean reads by BLAST (Shetty et al., 2016). Short reads were de novo assembled into long contigs using SOAPdenovo 2.04 (Luo et al., 2012) by setting kmer values of 35, 44, 71, and 101. Furthermore, the long-contigs was expanded and gap-filed using Geneious ver 8.1 (Muraguri et al., 2020), which forms the whole chloroplast genome. The complete chloroplast genome was further validated and calibrated by using de novo splicing script NOVOplsty 4.2 (Dierckxsens et al., 2017). In addition, GeSeq (Tillich et al., 2017) was used to annotate the de novo assembled genomes, RNAmmer (Lagesen et al., 2007) was used to validate rRNA genes with default settings, and tRNAscanSE ver 1.21 (Lowe and Eddy, 1997) was applied to detect tRNA genes with default settings. Finally, we compared the results with the reference sequence and corrected the misannotated genes by GB2Sequin (Lehwark and Greiner, 2019) in an artificial way. The circular map of the genomes was drawn by using Organellar Genome DRAW (OGDRAW) (Lohse et al., 2007). The nine newly assembled Musa chloroplasts genomes were deposited in GenBank with the accession numbers NC_056826 - NC_056834.
Chloroplast Microsatellites or simple sequence repeats (SSRs) were detected in the perl script MISA (Beier et al., 2017). The basic repeat setting of SSRs was determined: ten for mononucleotide, five for dinucleotide, four for trinucleotide and three for tetranucleotide pentanucleotide hexanucleotide. The REPuter tool (Kurtz et al., 2001) was applied to analyze forward (F), reverse (R), complement (C), and palindromic (P) oligonucleotide repeats. The following parameters were used to identify repeats with: (1) hamming distance equal to 3; (2) minimal repeat size set to 30 bp; and (3) maximum computed repeats set to 300 bp. Relative synonymous codon usage (RSCU) and amino acid frequency in the protein coding gene region were determined by MEGA-X (Kumar et al., 2018). The putative RNA editing sites in 35 genes were investigated in the coding gene using PREP-cp (Predictive RNA Editors for Plants chloroplast) (Mower, 2009).
We compared and analyzed the basic features of nine chloroplast genomes using Geneious software, including calculating the length of the region sequence, GC content in different regions, and the proportions of different sequences. The junction sites of various regions of the chloroplast genome were analyzed in IRscope (Amiryousefi et al., 2018a) to visualize the expansion and contraction of reverse repeats (IR). We used KaKs_Calculator 2.0 software (Wang et al., 2010) to calculate the rate values of Ks (synonymous substitution) and Ka (non-synonymous substitution) with the YN method. Shuffle-LAGAN mode alignment program in mVISTA (Brudno et al., 2003) was used to evaluate structural similarity for the nine species, with the annotation of M. balbisiana as the reference.
The complete chloroplast genomic sequences from 17 species of Musa (nine sequences newly generated and eight species obtained from GenBank) were performed for phylogenetic analyses (Supplementary Table 8). Heliconia collinsiana (accession number NC_020362) and Ravenala madagascariensis (accession number NC_022927) were downloaded from the NCBI (National Center of Biotechnology Information) as an outgroup of the evolutionary tree. Multiple sequence alignment was aligned using MAFFT and GTR-GAMMA (GTR + G) model was selected using model test applying the Bayesian information criterion (BIC) (Posada and Crandall, 1998). All InDels were excluded from the alignment sequence to construct a phylogenetic tree based on only substitutions. The maximum likelihood (ML) trees were conducted by MEGA-X and 1,000 bootstrap replicates were set to evaluate the branch support values. Finally, the 79 protein-coding genes from the 19 species were also extracted to reconstructed ML trees using the same methods.
Genome-skimming data were generated about 3.2–5.7 GB by the Illumina HiSeq 2500 in each of the sequenced Musa species. The complete chloroplast genomes of these nine species were typical circular double-stranded structures and ranged from 167,975 bp (Musa jackeyi) to 172,653 bp (Musa rubinea) (Table 1). All nine sequence presented the quadripartite structure, including large single copy (LSC) region, the small single copy (SSC) region and a pair of inverted repeat (IR) regions. The length of the LSC region ranged between 88,330 and 89,997 bp, with the GC content of 34.8–35.2%. The length of the SSC region was distributed between 10,773 and 11768 bp. The GC content of SSC regions was similar in nine species, ranging from 30.1% in M. rubinea to 31.2% in Musa laterita. 33,864–35,522 bp was the length range of the IR region of nine Musa species, which contains 39.5–40.0% GC content. The complete chloroplast genome sequences of the nine Musa species were provided in GenBank (under accession number NC_056826–NC_056834).
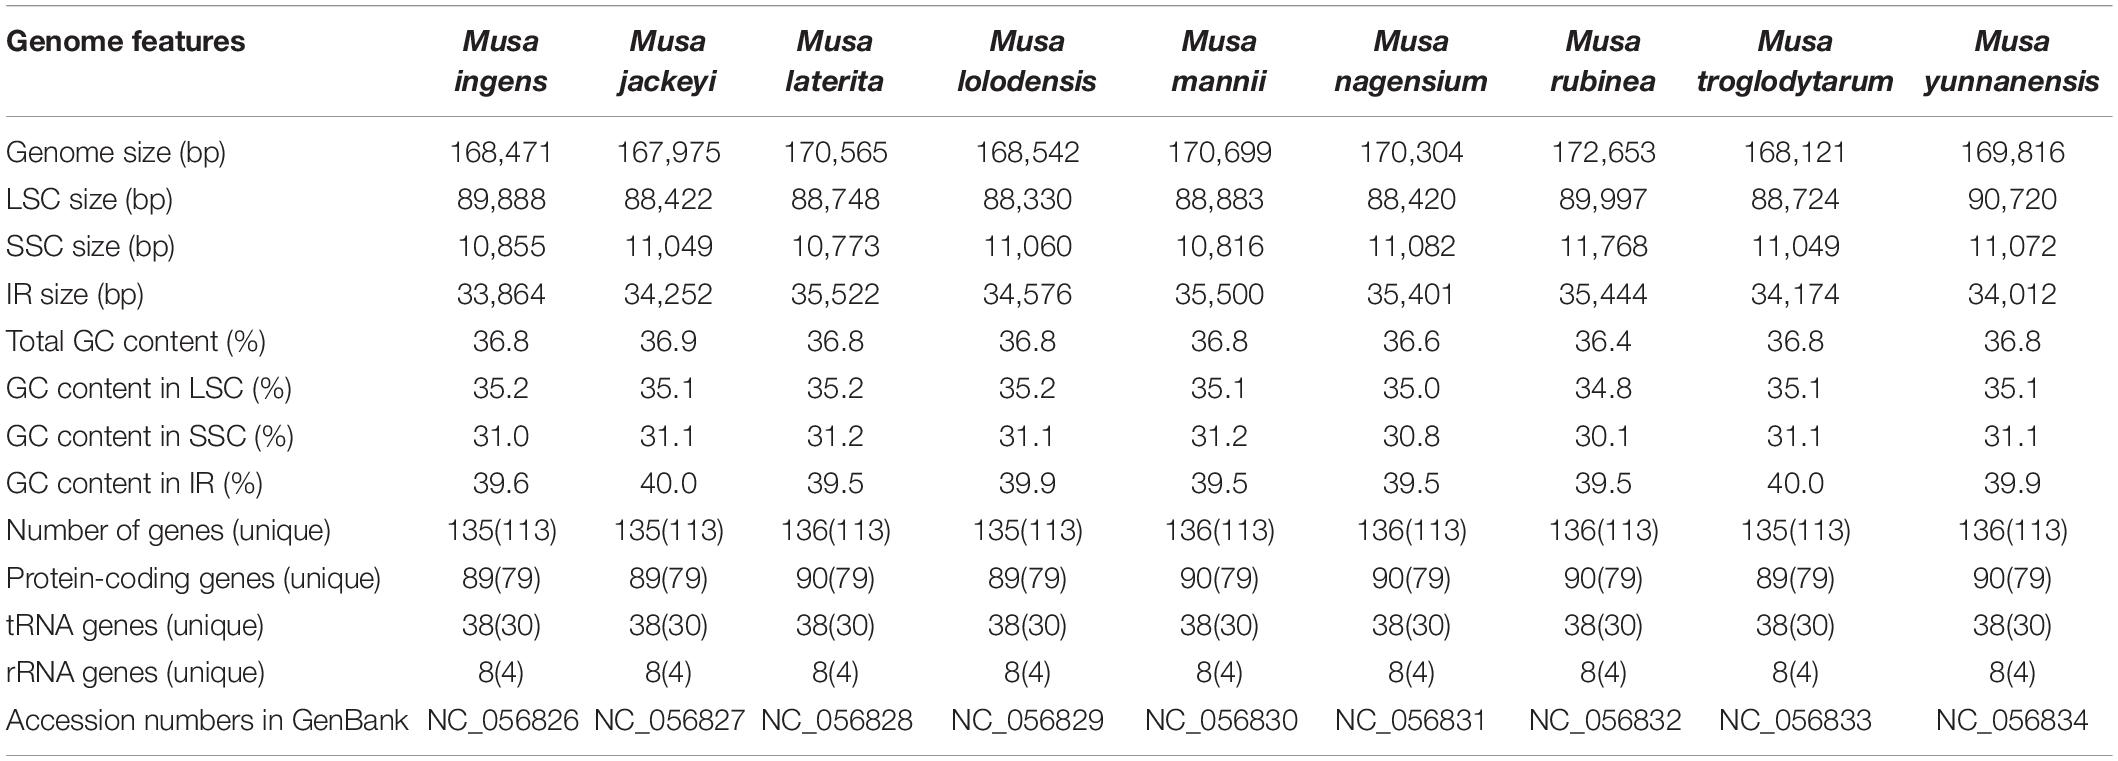
Table 1. Chloroplast genome features of nine species of Musa.
Although the length of the chloroplast genomes of the nine species was some different, the analyses of the genetic composition showed that they have some similarities. The positions of the genes were visualized in Figure 1. A total of 135 functional genes were predicted in all nine Musa. sps, including 113 unique genes comprising 79 protein-coding genes, 30 transfer RNA (tRNA) genes and four ribosomal RNA (rRNA) genes. These genes, represented by Musa nagensium, can be roughly divided into three categories: photosynthesis-related genes, chloroplast self-replication genes, and other genes (Table 2). Among the genes, 18 intron-containing genes (ICG) were found, covering 12 protein-coding genes and 6 tRNA genes (Supplementary Table 1). Among these ICG, ycf3, and clpP possessed two introns, respectively, while the rest of ICG contained only one intron. The rps12 gene has trans-splicing, and its 3′-end is duplicated in the IRs region, while its 5′-end is present in the LSC region. As a regional demarcation gene, the ndhA gene starts at the IRs region and ends at the SSC region.
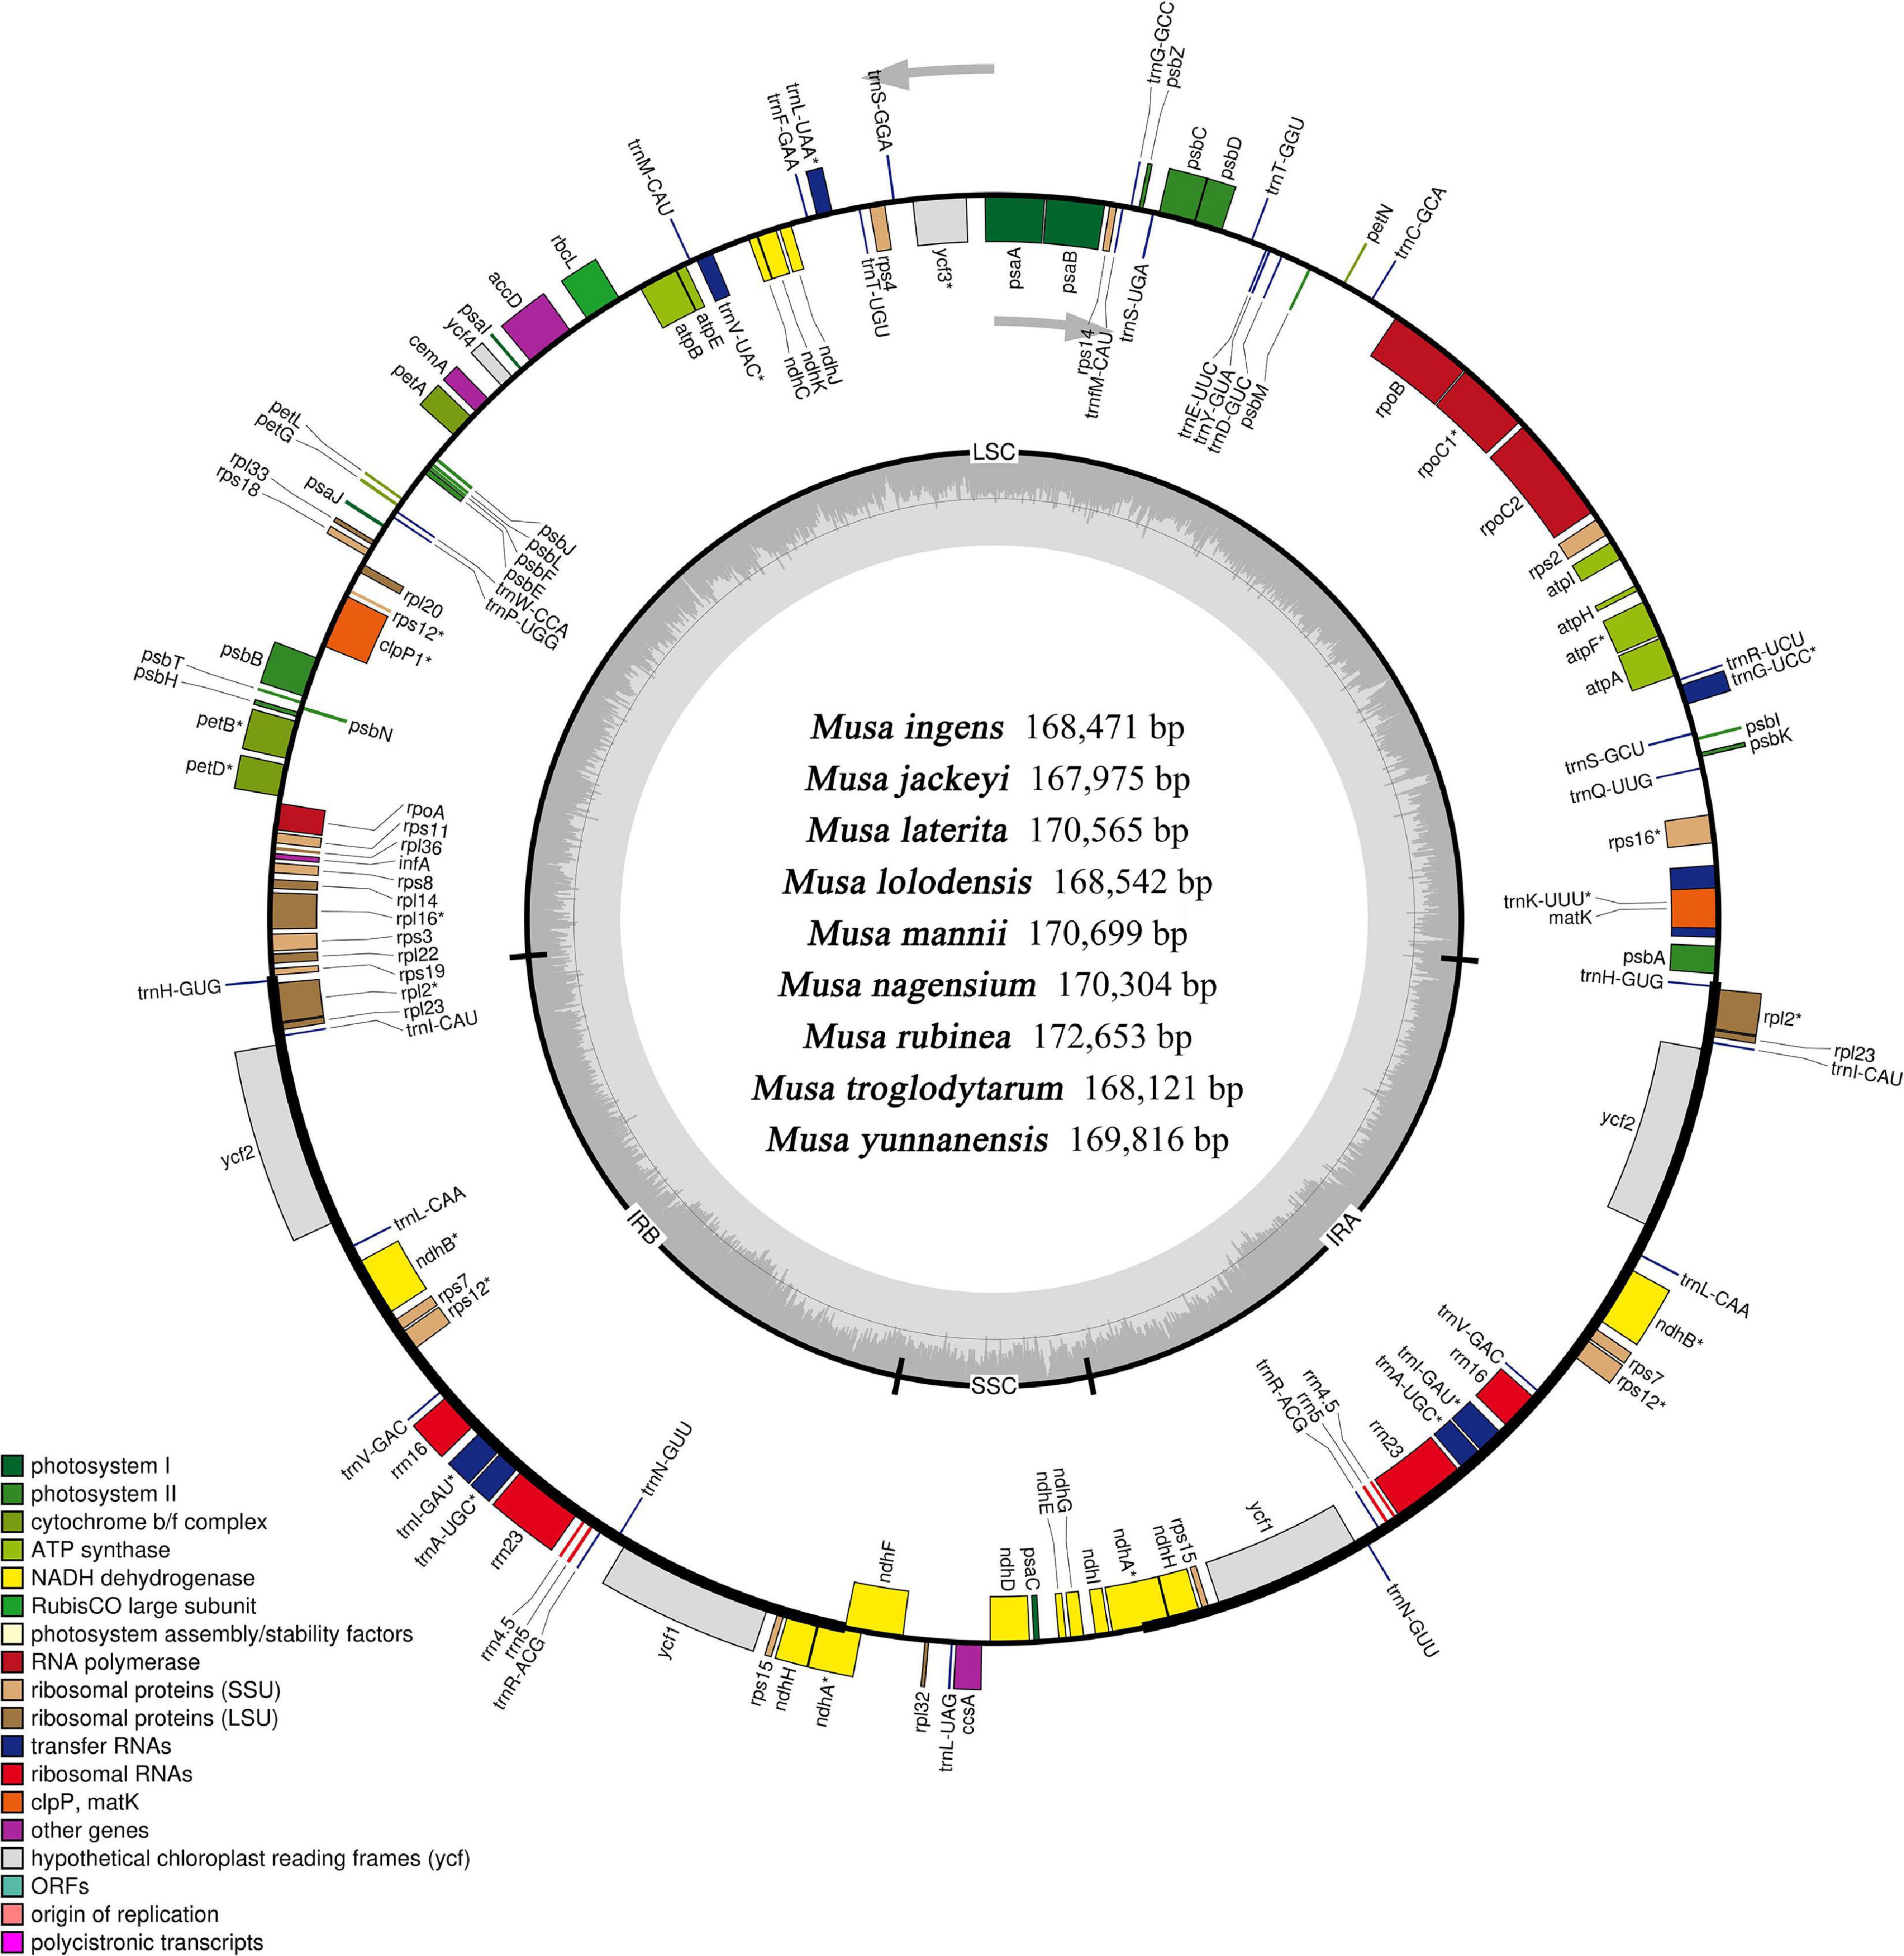
Figure 1. Complete genome map of the chloroplast genome of Musa. The inner gray ring is divided into four areas, Clockwise, and they are: small single-copy region (SSC), inverted repeat sequences B (IRb), large single-copy region (LSC), and inverted repeat sequences A (Ira). The genes in the outer ring region are transcribed clockwise, while those in the inner ring are transcribed counterclockwise. The inner ring dark gray indicates the GC content, the light gray reaction AT content. In the lower left is a legend that classifies chloroplast genes according to their functions.
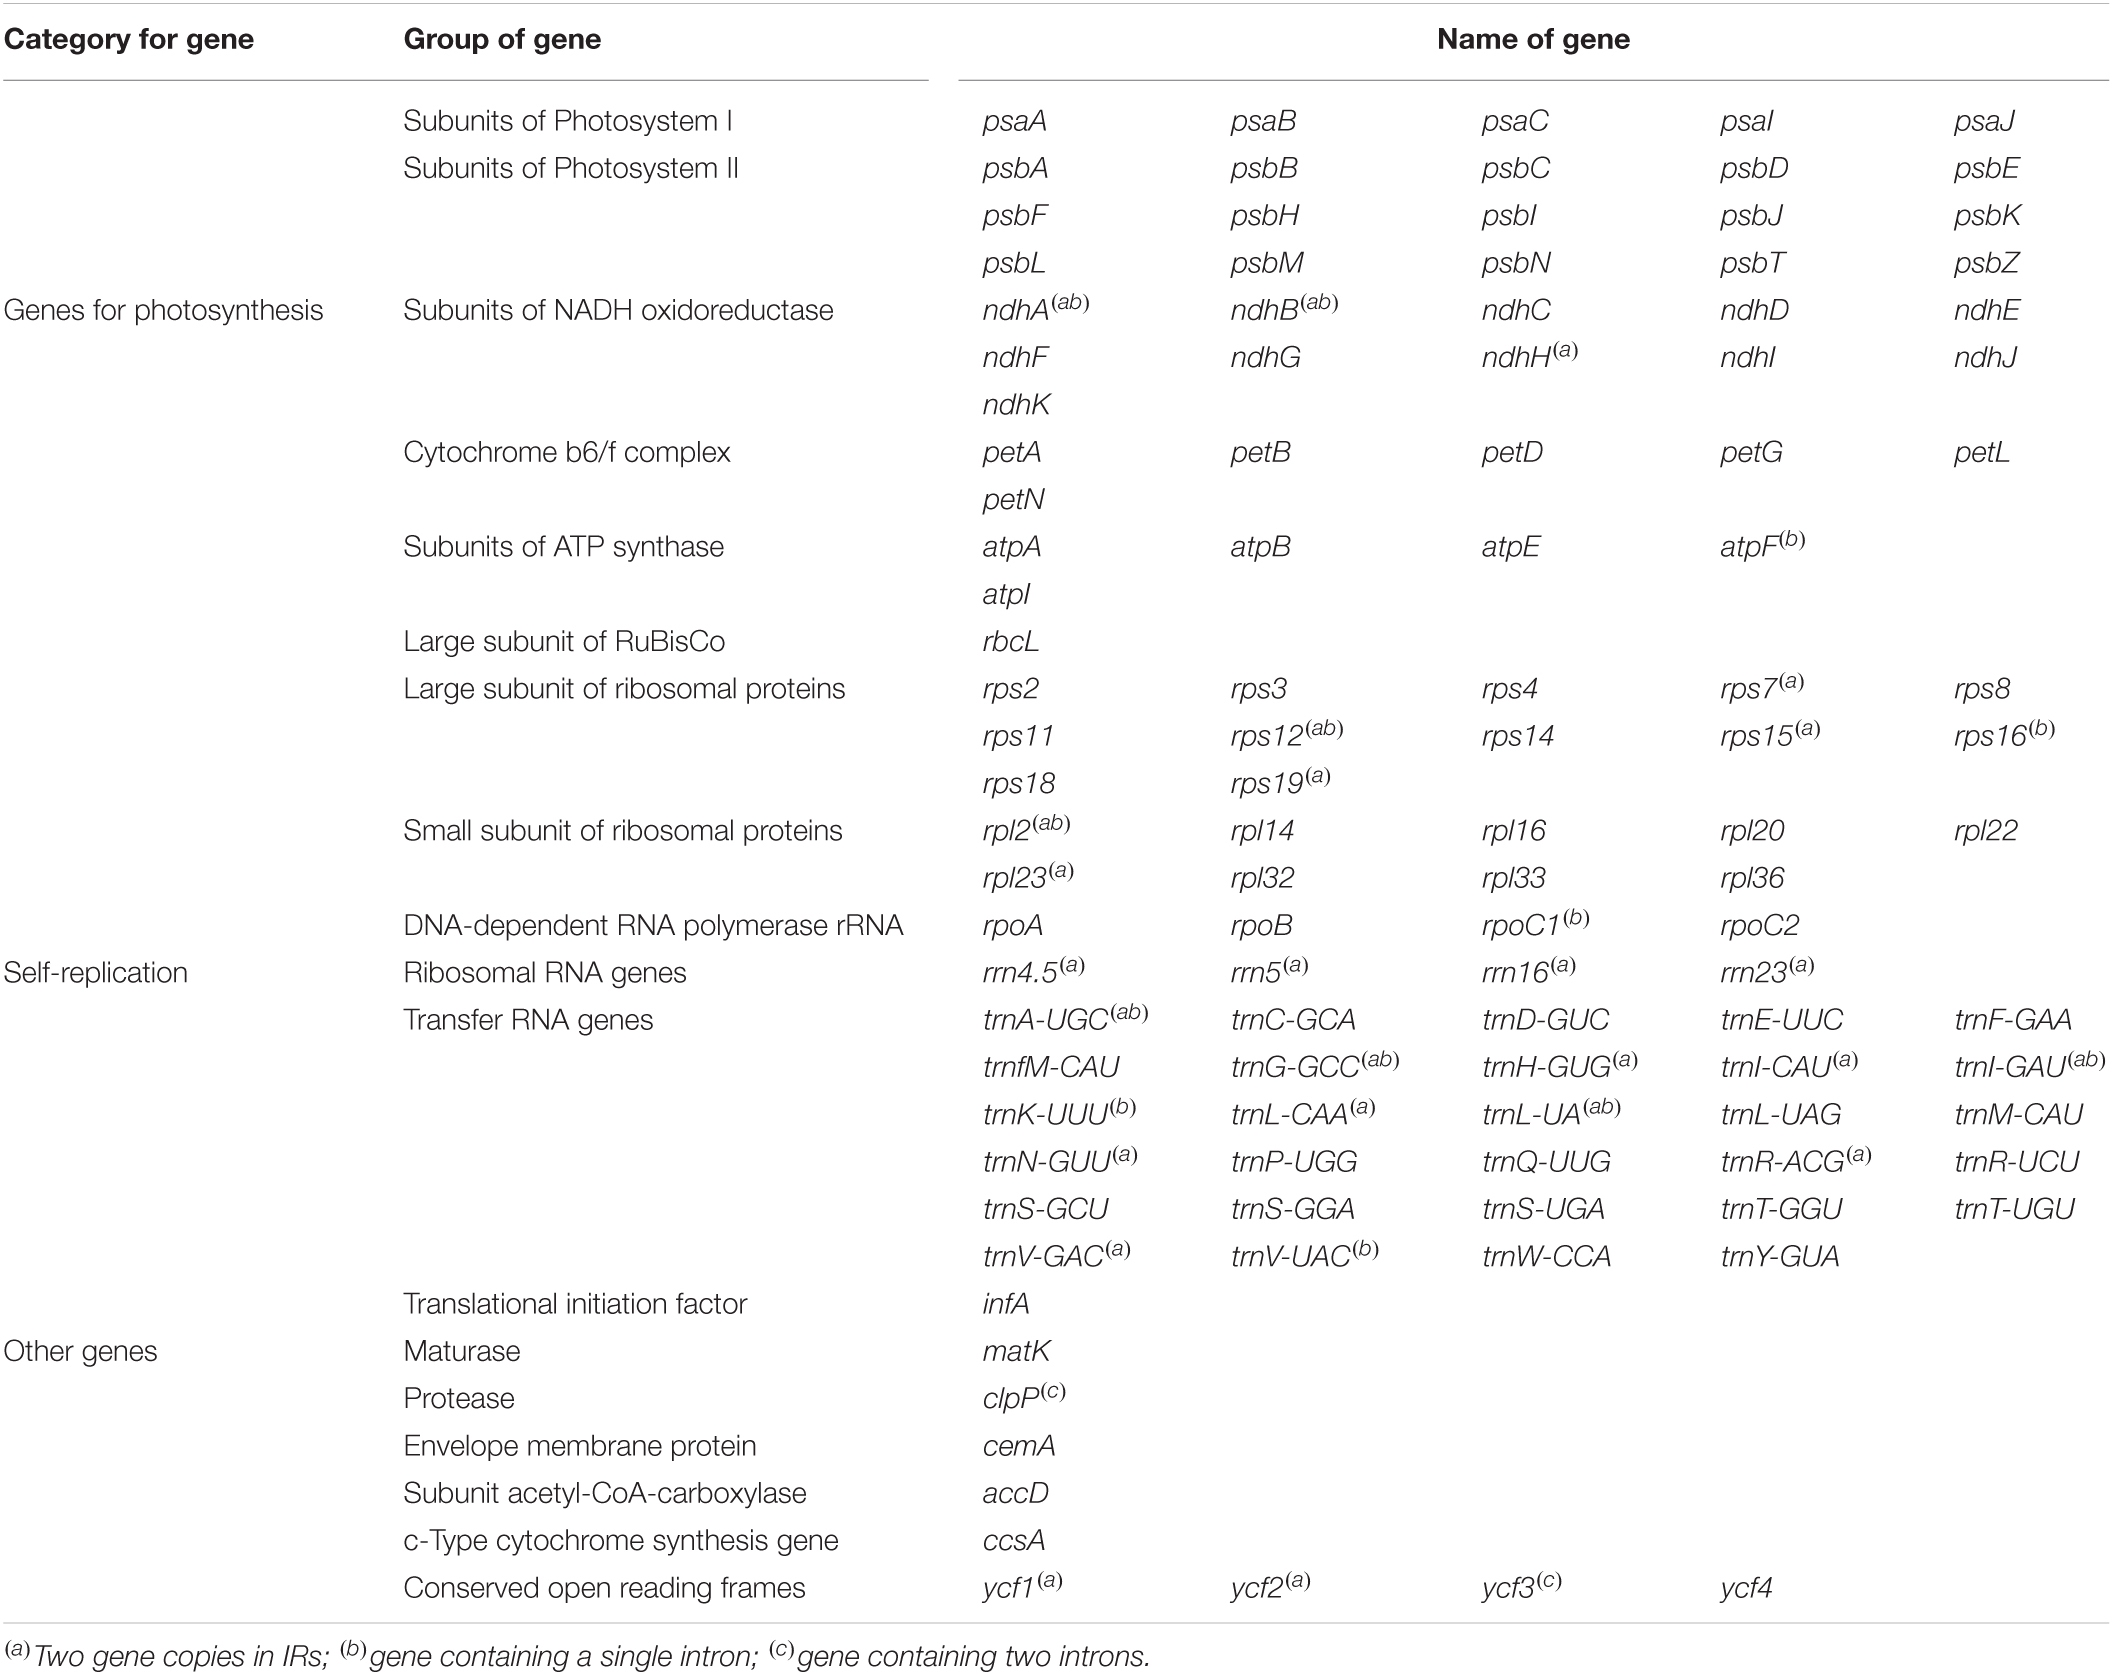
Table 2. List of predicted genes in the Musa chloroplast genome.
In this study, we analyzed the codon usage bias and relative synonymous codon usage (RSCU) based on the protein coding gene of Musa’s chloroplast genome, and a total of 28,690–29,360 codons were identified (Supplementary Table 2). Analysis showed that codons containing A or T instead of C or G at the 3′-end of the codon have a higher encoding rate. The RSCU of codons containing A/T at the 3′-end was mainly greater than 1, and the codons containing C or G at the 3′-end mostly have RSCU ≤ 1. In addition, there were 29 codons with RSCU values greater than 1, 2 of them were equal to 1, and 30 of them are less than 1. Among them, AUU (4.15–4.24%, Isoleucine), AAA (4.15–4.36%, Lysine), and GAA (4.21–4.39%, Glutamic acid) were the most frequently used codons, while UGC (0.30–0.31%, Cysteine) and CGC (0.31–0.33%, Arginine) had the lowest usage rates. In addition, most amino acids possessed at least two synonymous codons, except for methionine (AUG) and tryptophan (UGG), which had no codon usage preference since they only have one coding codon. Among all codons with an RSCU value greater than 1, the vast majority of codons presented a higher A/T appreciation in the third codon. Overall, we found that the nine Musa species have high similarities in codon usage and amino acid frequency. This result is very common in the chloroplast genome of higher plants (Gichira et al., 2017).
The ratio of non-synonymous (Ka) to synonymous substitutions (Ks), Ka/Ks, has been widely used to evaluate the natural selection pressure and evolution rates of nucleotides in genes (Li et al., 1985). The results of the statistical neutrality test indicated that 77 protein-coding genes were relatively stable during the evolution process, but two genes (ycf1 and ycf2) were under positive selection (Supplementary Table 3). The Ka/Ks ratio of the ycf2 gene of the nine species in Musa are all greater than 1 (2.66–5.22). Except for the Ka/Ks ratio of the ycf1 gene of Musa mannii (0.9), that of the other eight species are also all positive selection status (1.16–2.29).
In order to gain a deeper insight into the RNA metabolism of Musa species, we used PREP to predict 74–77 post-transcriptional RNA editing modifications of 26 protein-coding genes (Supplementary Table 4). Most RNA editing sites were located in ndhB (11 editing sites, 14.3–14.8%), while ndhD (5–7 editing sites, 6.6–9.2%), ndhF (6–7 editing sites, 7.8–9.4%), and rpoB (5–6 editing sites, 6.7–8.0%) also had a great portion of editing sites. The types of RNA editing sites reported here were all C to U and all affect a single site. All changes occurred in the first or second nucleotides of the codon. Among the amino acid conversions caused by RNA editing sites, the transformation of serine to leucine accounted for one-third of the total.
Our research revealed that all nine Musa species have ndhA genes that spanned the SSC and IRa regions (Figure 2). Only the ndhA gene of Musa yunnanensis was longer in the SSC region than in the IRa region. In comparison, the length of the ndhA gene of the remaining eight species were not much different in the SSC and IRa regions. We speculated that this may be due to the expansion of the IRa region of M. yunnanensis. Primarily, at the junction of LSC/IRb (JLB), the rpl2 gene was located in the IRb region, while the rpl2 genes of Musa ingens and M. yunnanensis spanned the LSC and the IRb region. According to the distribution of rps19 gene, nine Musa species can be roughly divided into three categories. The rps19 gene of M. laterita, M. mannii, M. nagensium, and M. rubinea in the first category were entirely located in the IR region, 100–131 bp apart from LSC/IRb and IRa/LSC. The second type of species (M. jackeyi, Musa lolodensis, and Musa troglodytarum) were where the rps19 gene was situated at the junction of LSC/IRb and were 18–19 bp away from the IRb region. Moreover, the rps19 genes were entirely located in the IRb region (M. ingens and M. yunnanensis), suggesting that this phenomenon may occur with the contraction IRb area. However, at the junction of IRa/LSC (JLA), M. yunnanensis processed two rps19 genes, so we speculated that rps19 was deleted in M. ingens.
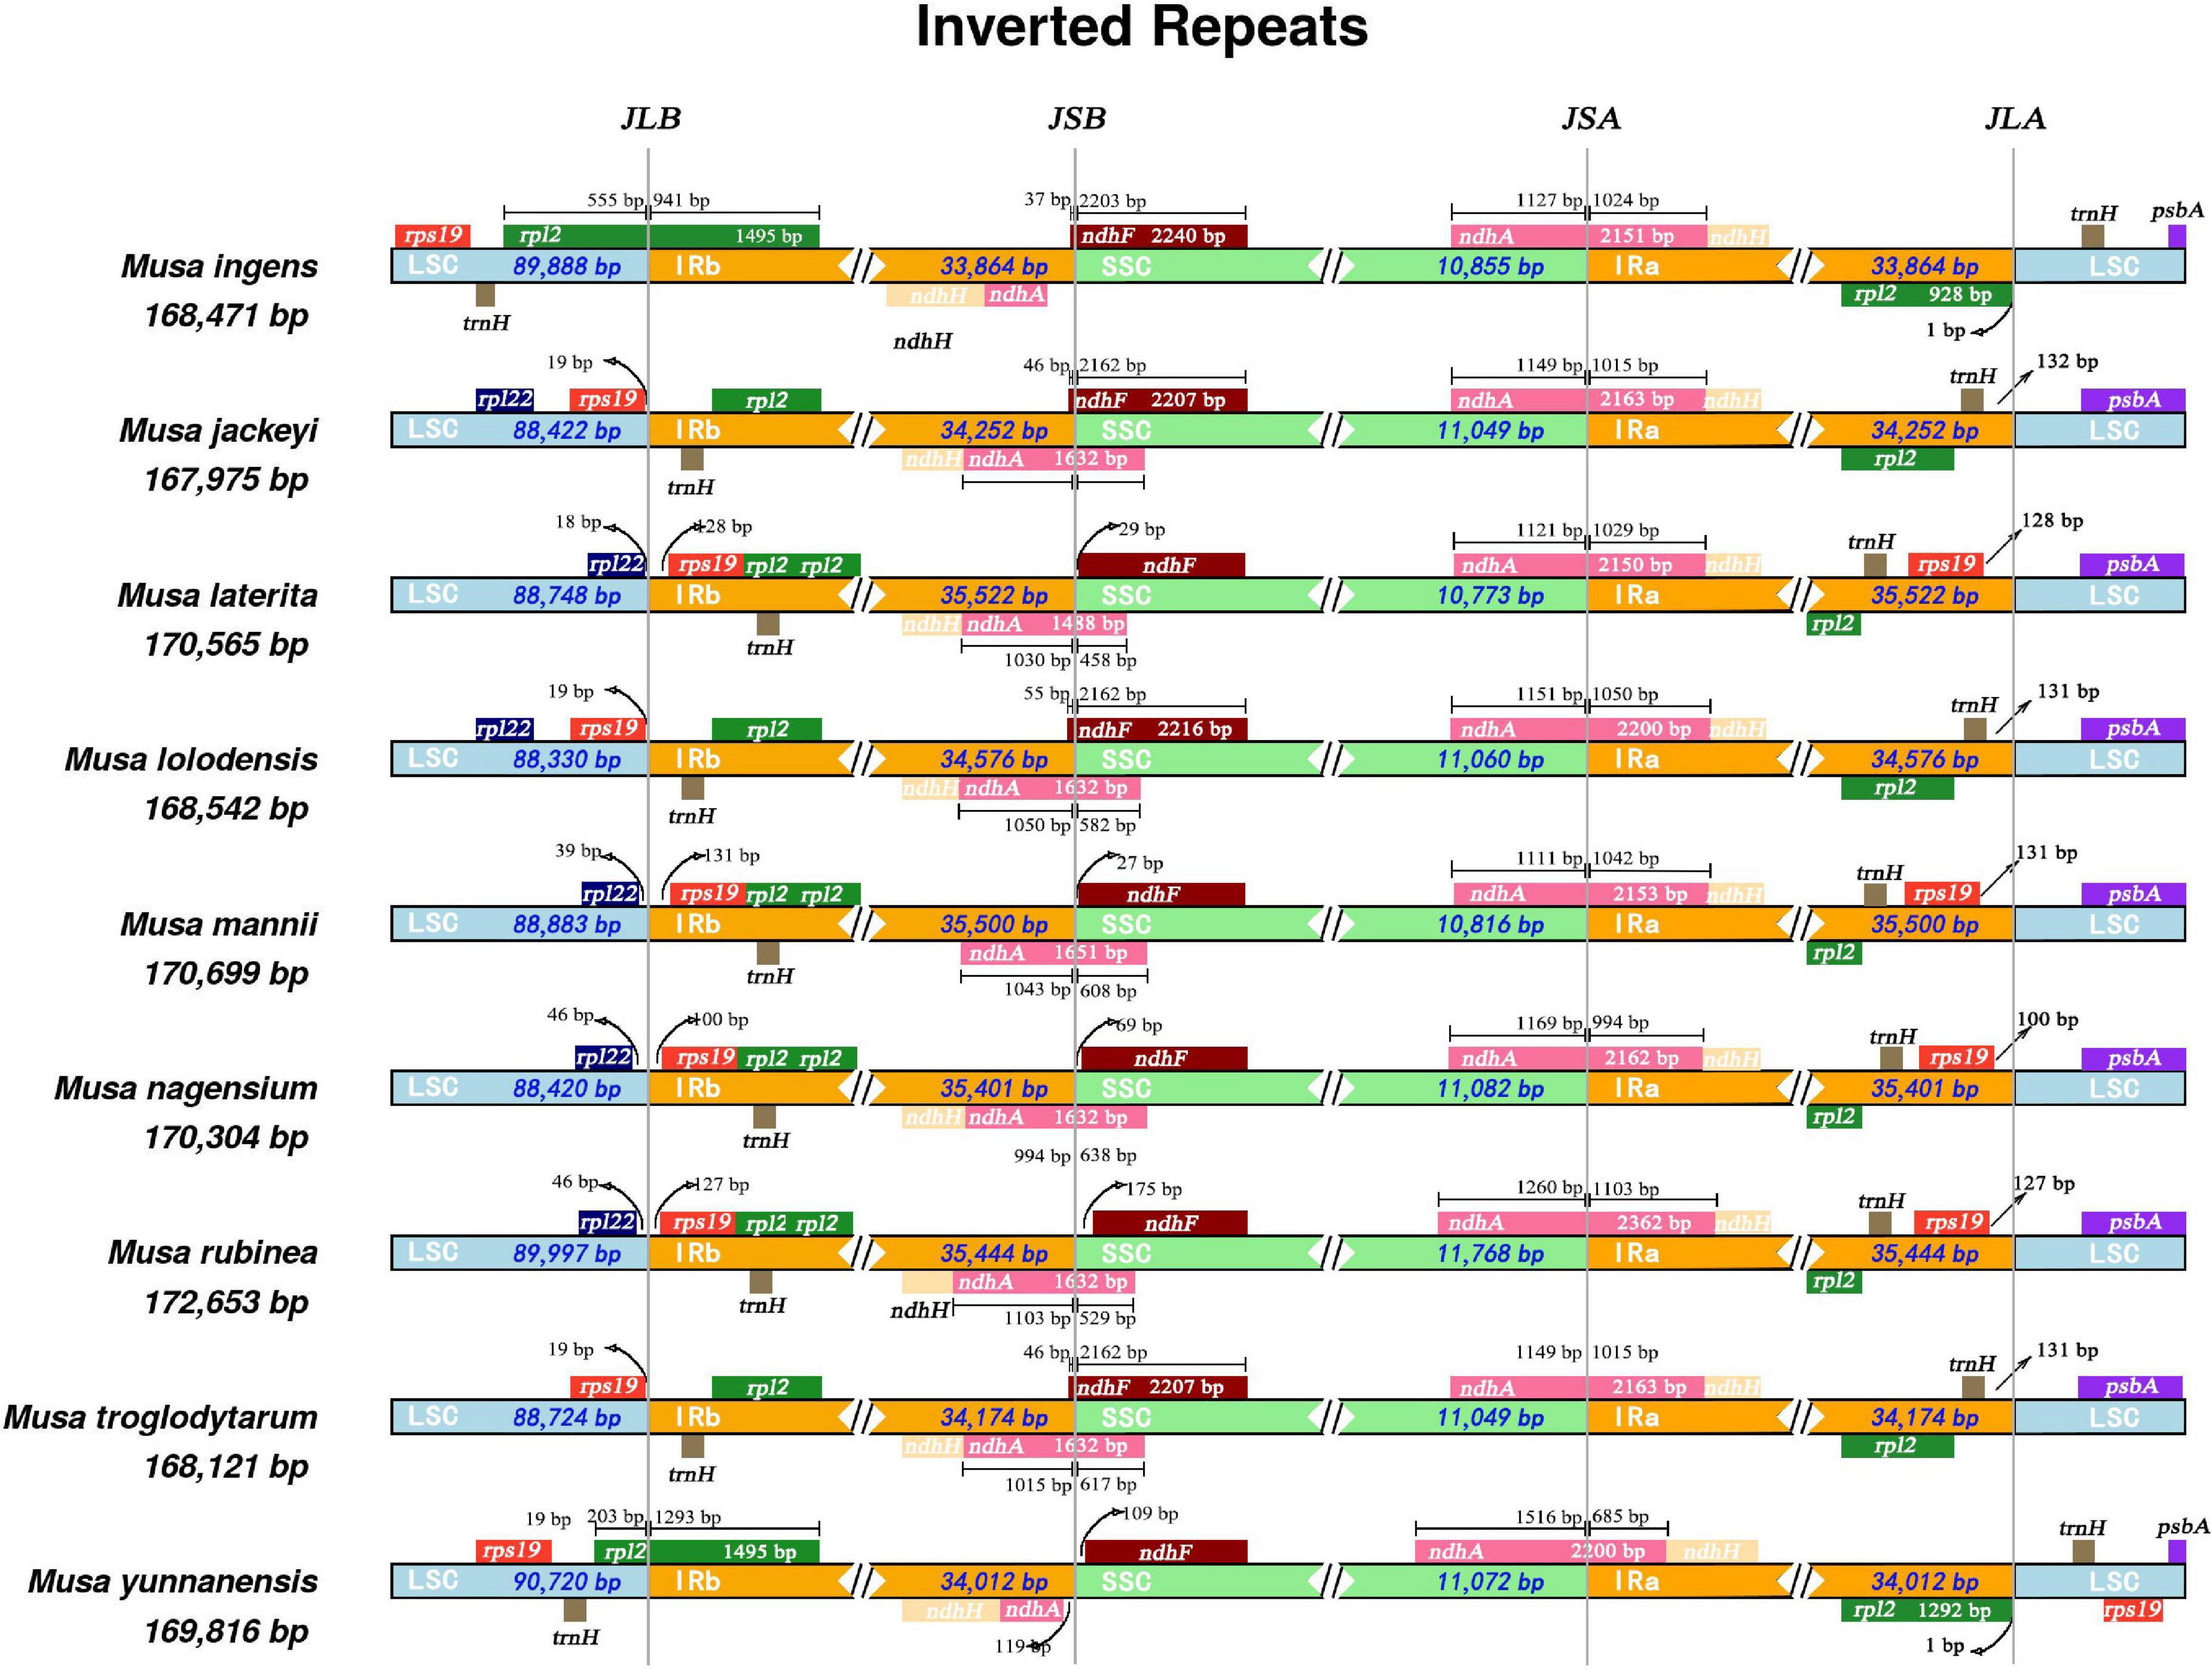
Figure 2. Comparison of SSC, LSC, IRB, and IRB boundary regions in the chloroplast genomes of nine species of Musa. Comparative analysis of junction sites in Musa chloroplast genomes. The coordinate position of the start or end of each gene from the corresponding junction is shown with arrows. All the genes those integrate from one region of chloroplast genome to another region are shown with the T bar above or below. The T bars show the length of base pair for which the integration of genes has been occur. JLA (IRa/LSC), JLB (IRb/LSC), JSA (SSC/IRa), and JSB (IRb/SSC) denote the junction sites between each corresponding two regions on the genome.
This study counted all the interspersed repetitive sequences in the Musa chloroplast genome with a repeat unit length of more than 30 bp. At the same time, we detected four types of repeats, including forward repeats (F), inverted repeats (R), complementary repeats (C), and palindromic repeats (P) (Supplementary Table 5). Repeat analysis showed 50–170 forward duplications, 0–26 inverted duplications, 0–13 complementary repeats and 37–140 palindromic repeats in nine Musa species (Figure 3A). The length of the repetitive sequence varied from species to species, but most of the repetitive sequence length existed in the range of 30–50 bp (40.76–82.1%) (Figure 3B). Compared with the LSC and SSC regions, the IR region contained most of the repetitive sequences, and the chloroplast genome regions also shared most of the repetitive sequences. Among them, the repetitive sequences in the IR region of M. nagensium accounted for the highest proportion of all repetitive sequences (96.3%), and the IR region of M. troglodytarum had the lowest proportion of repetitive sequences (60%) (Figure 3C).
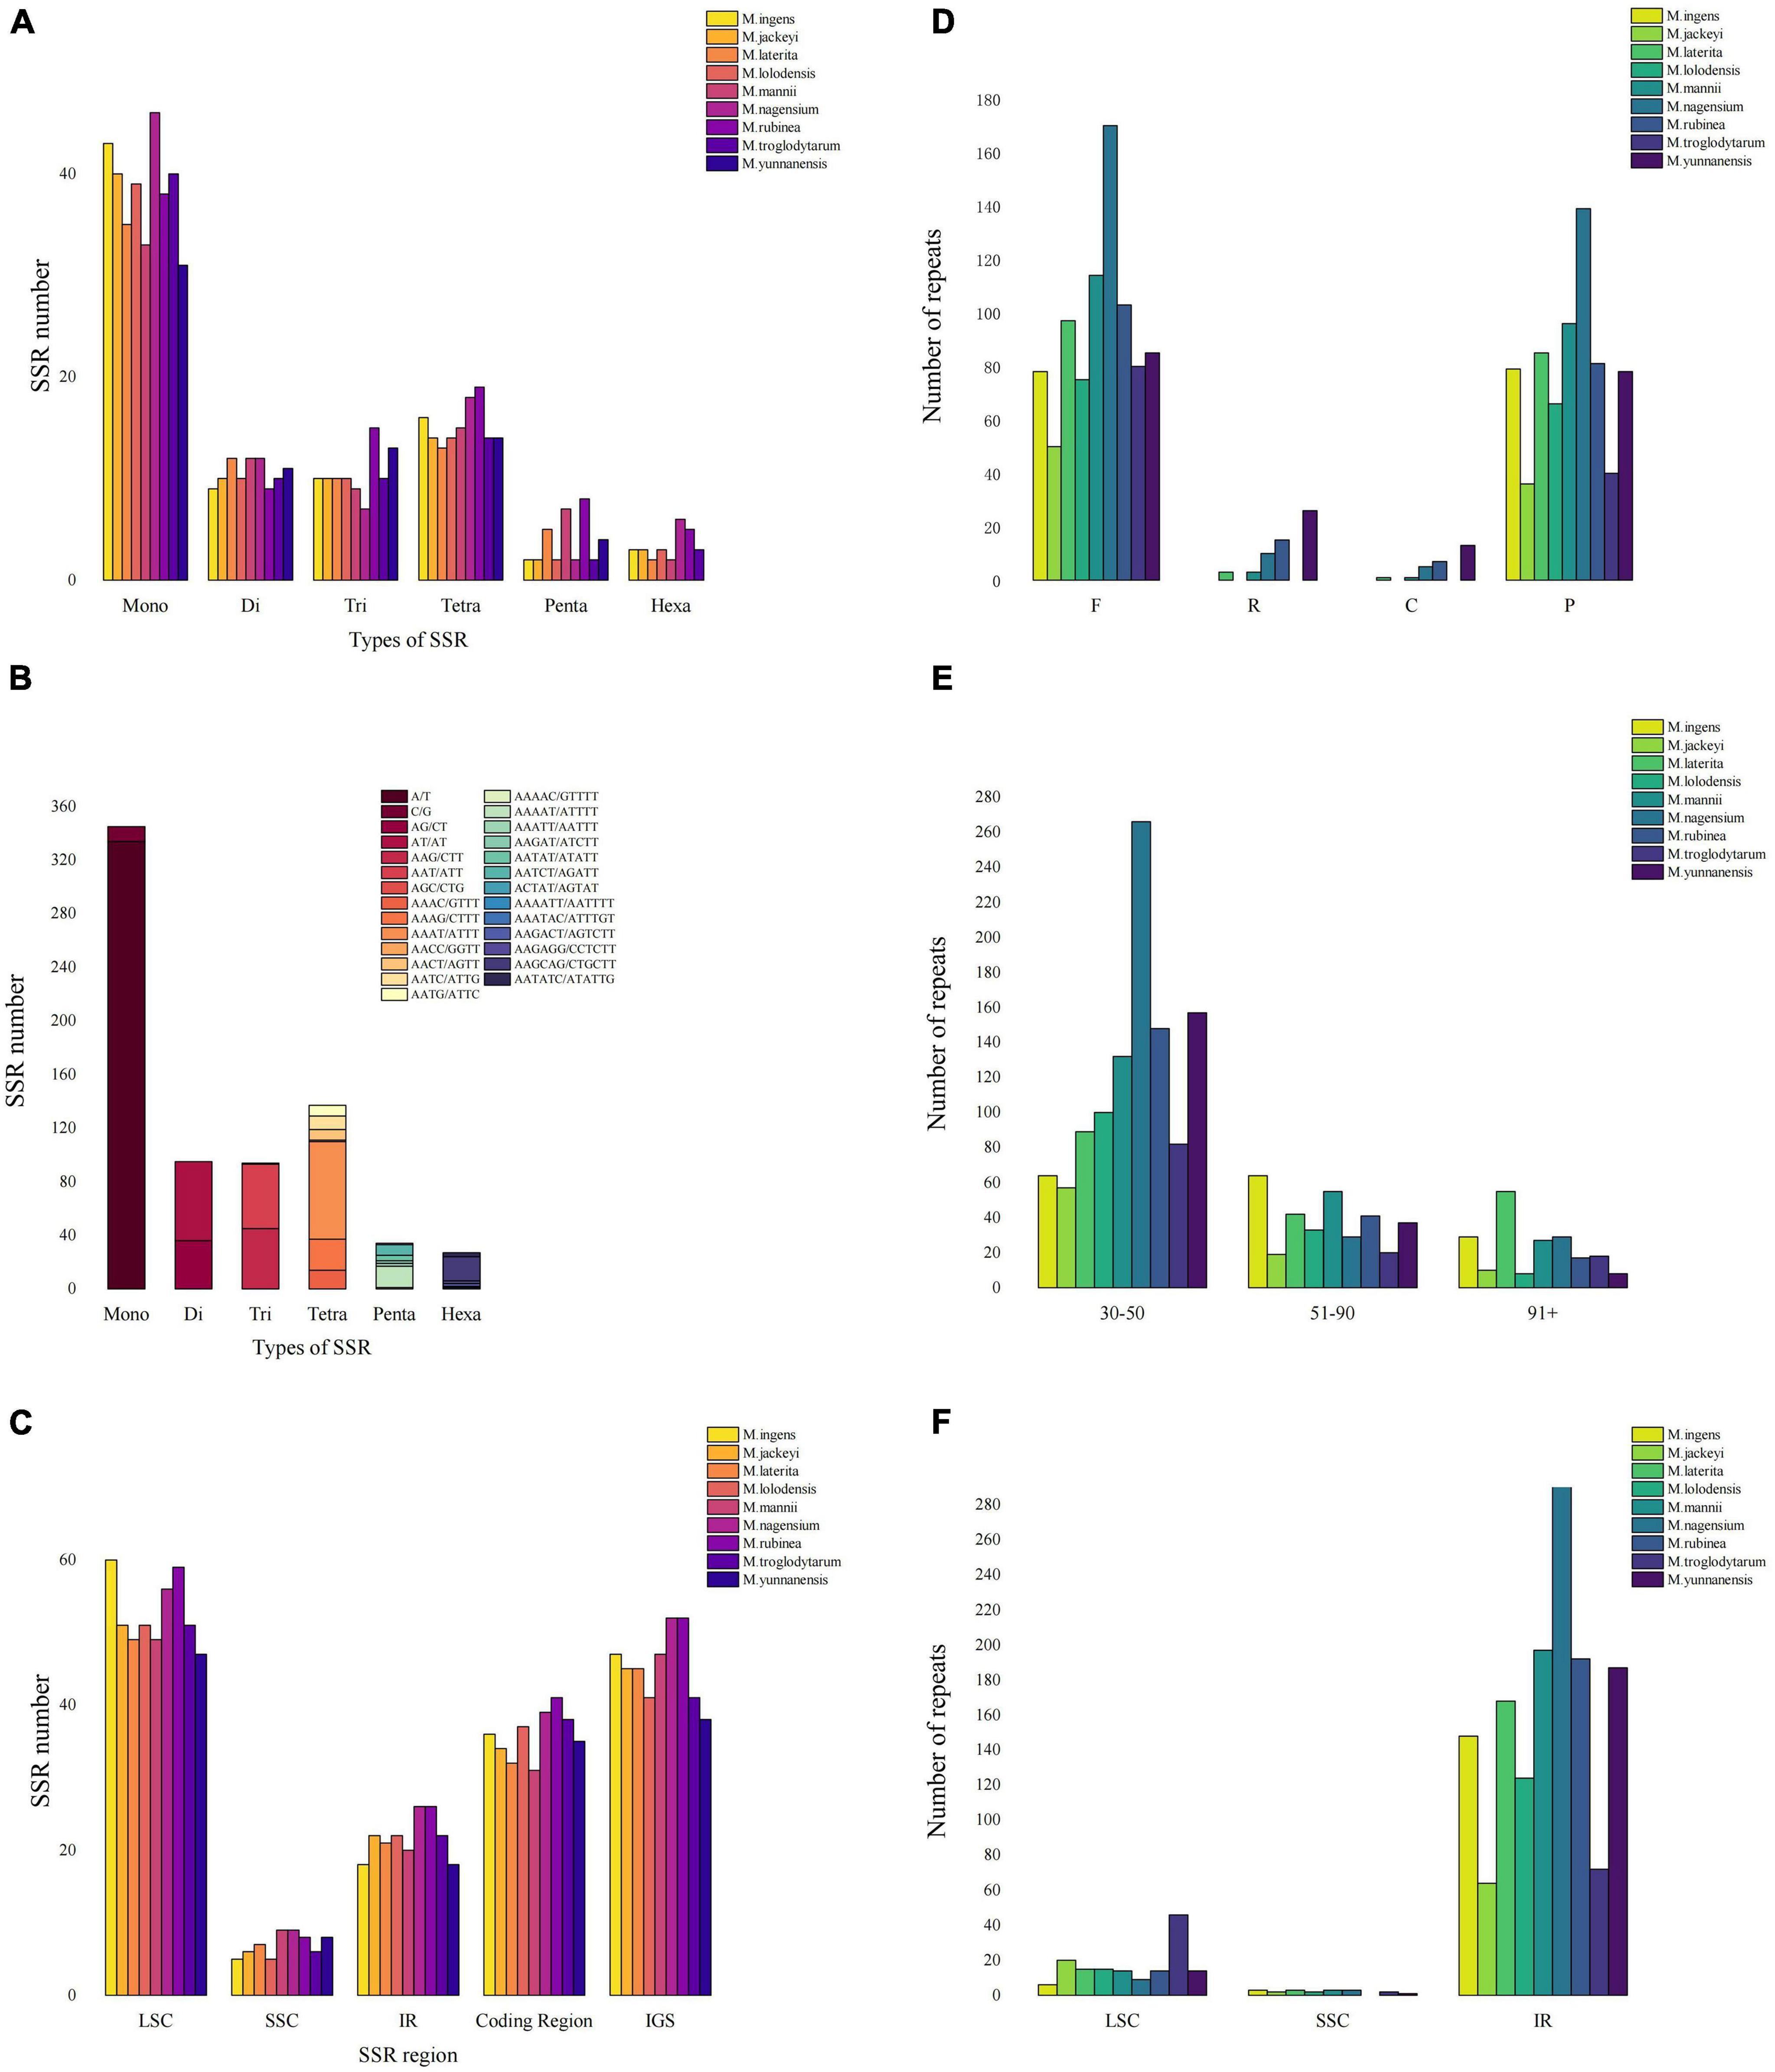
Figure 3. Comparison of microsatellites and long repeats in the chloroplast genomes of Musa species. (A) The number of SSRs of different types of SSR for nine Musa species. (B) Details in SSR types among nine Musa species. (C) The number of SSR markers in the LSC/SSC/IR region along with coding region and IGS. (D) Number of four long repeat sequences in nine species: complement repeats. F represents forward repeats, P represents palindromic repeats, R represents reverse repeats, C represents complement repeats. (E) Number of long repeat sequences with different lengths in nine species. (F) The distribution of long repeats in LSC, SSC and IR regions.
We analyzed the simple sequence repeats (SSRs) in the chloroplast genomes of nine Musa species (Figure 3D). A total of six types of SSR (mono-/di-/tri-/tetra-/penta-/hexa-nucleotide repeats) were detected, the first four microsatellites accounted for 86.17–94.52%, and the penta- or hexanucleotide repeats was very small (no more than 8) or even non-existent (Figure 3E). In the MISA analysis, the number of SSRs detected in the nine Musa species was 73–93. At the same time, the distribution of SSR in the LSC region (61.54–72.29%) was higher than that in the IR region (21.69–28.57%) and SSC region (6.02–11.54%) (Figure 3F). Analysis revealed that SSRs were mainly distributed in the non-coding areas (51.9–60.26%). The number of SSRs in the coding region of M. rubinea (41) were the largest, while that of M. mannii (31) was the lowest.
Using M. Balbisiana as a reference, we used the DnaSP6 to detect single nucleotide polymorphisms (SNPs) in the chloroplast genomes of nine Musa species (Table 3). Through analysis, we divided these nine species into two groups. The first group contained four species (M. ingens, M. jackeyi, M. lolodensis, and M. troglodytarum). In comparison, the second group comprised five species (M. laterita, M. mannii, M. nagensium, M. rubinea, and M. yunnanensis). Among them, 1,419–1,459 SNPs were detected in the first group of four species, and 628–716 SNP sites were seen in the second group. We found that the distribution of SNPs of the nine species in the LSC region is not much different, and the SNP of each species accounted for the highest proportion in the LSC region (61.17–65.29%) (Supplementary Table 6). However, in the statistics of SNP content in the IR region, the ratio of the first group (16.30–19.97%) was slightly lower than that of the second group (21.85–22.62%), and the proportion of SNP in the SSC region was slightly higher (the first group: 15.45–21.04%, the second group: 14.16–14.59%). The mutation frequencies of the corresponding LSC, SSC, and IR regions of the first group were 1.020–1.035, 1.846–1.953, and 0.448–0.487%, respectively, while the second group was 0.452–0.497, 0.876–1.281, and 0.155–0.202%. We also analyzed the insertions and deletions of the chloroplast genomes of nine species, which found they have similar rules in SNPs. 126–160 insertions were detected in nine species, respectively. The detection rates of LSC, SSC and IR were 61.90–67.42, 3.79–14.81, and 20.99–30.60%. The deletion mainly occurred in the LSC region (the first group: 58.66–66.64%, the second group: 59.09–66.04%), followed by the IR region (the first group: 26.06–30.60%, the second group 16.39–24.82%), and finally, the SSC region (the first group: 9.84–15.08%, the second group: 13.21–22.13%).
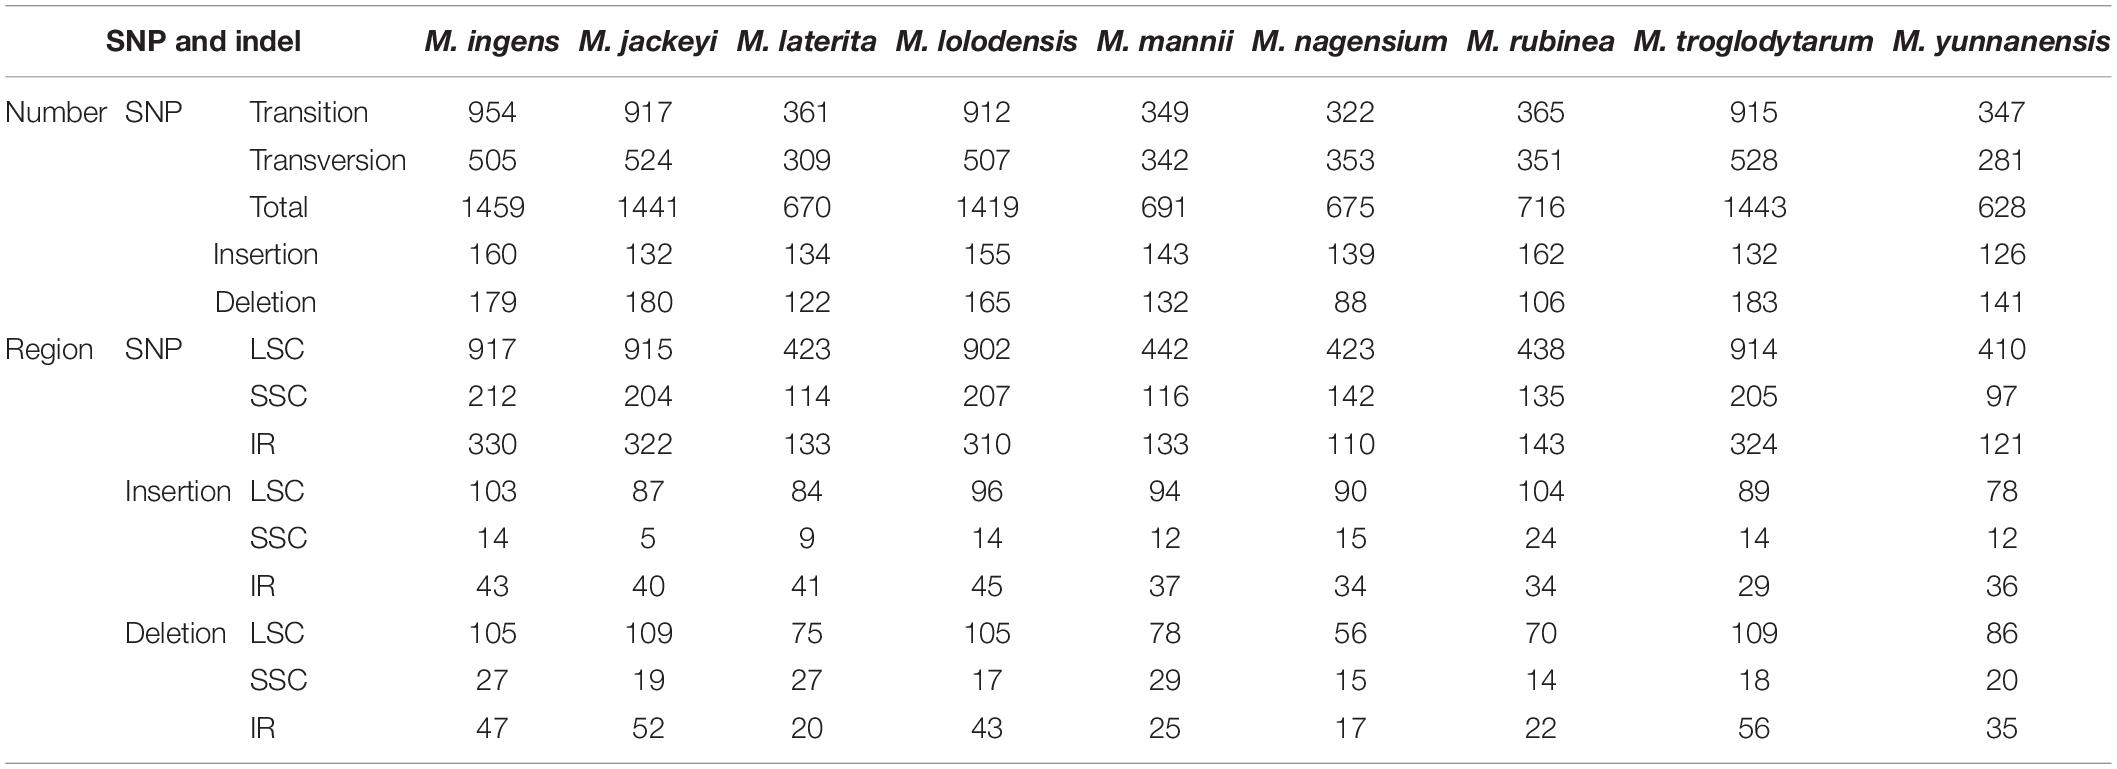
Table 3. Details of single nucleotide polymorphisms (SNP) and InDel sites in large single-copy region (LSC), small single-copy region (SSC), and inverted repeat (IR) regions in the complete chloroplast genomes of nine Musa species.
To study the level of sequence polymorphism, we used DnaSP6 and mVISTA programs to calculate the genetic differences between nine Musa plants and compared the whole chloroplast genomes (Figure 4) with reference sequence of M. balbisiana set. In this study, the IR region variation of the Musa chloroplast genome was lower than that of LSC and SSC. In the coding region, the ycf1, accD, and ycf2 of were quite different from each other. In general, non-coding regions were more susceptible to mutations than coding regions. Chloroplast genome of Musa is also consistent with this characteristic, and high variable regions are mainly found in IGS, such as psbI–atpA, atpH–atpI, rpoB–petN, psbM–psbD, ndhF–rpl32, psaC–ndhE, and ndhG-ndhI. These hot spots can be applied to DNA barcode encoding and phylogenetic analysis of Musa genus. With the rapid development of the chloroplast genome, comparing the differences in chloroplast genome sequences of different taxa can, it not only effectively screen out information-rich DNA fragments, but also promote the development of species identification and population diversity. The nucleotide variation (Pi) of nine species ranged from 0 to 0.08264, with an average value of 0.00792 (Supplementary Table 7). The average Pi of the SSC area was 0.01188, the average Pi of the LSC area was 0.00862, and the average Pi of the IR area was 0.00502. It can be seen that inverted repeats were more conservative than the single copy regions, and the coding regions were more conservative than the non-coding regions (Figure 5).
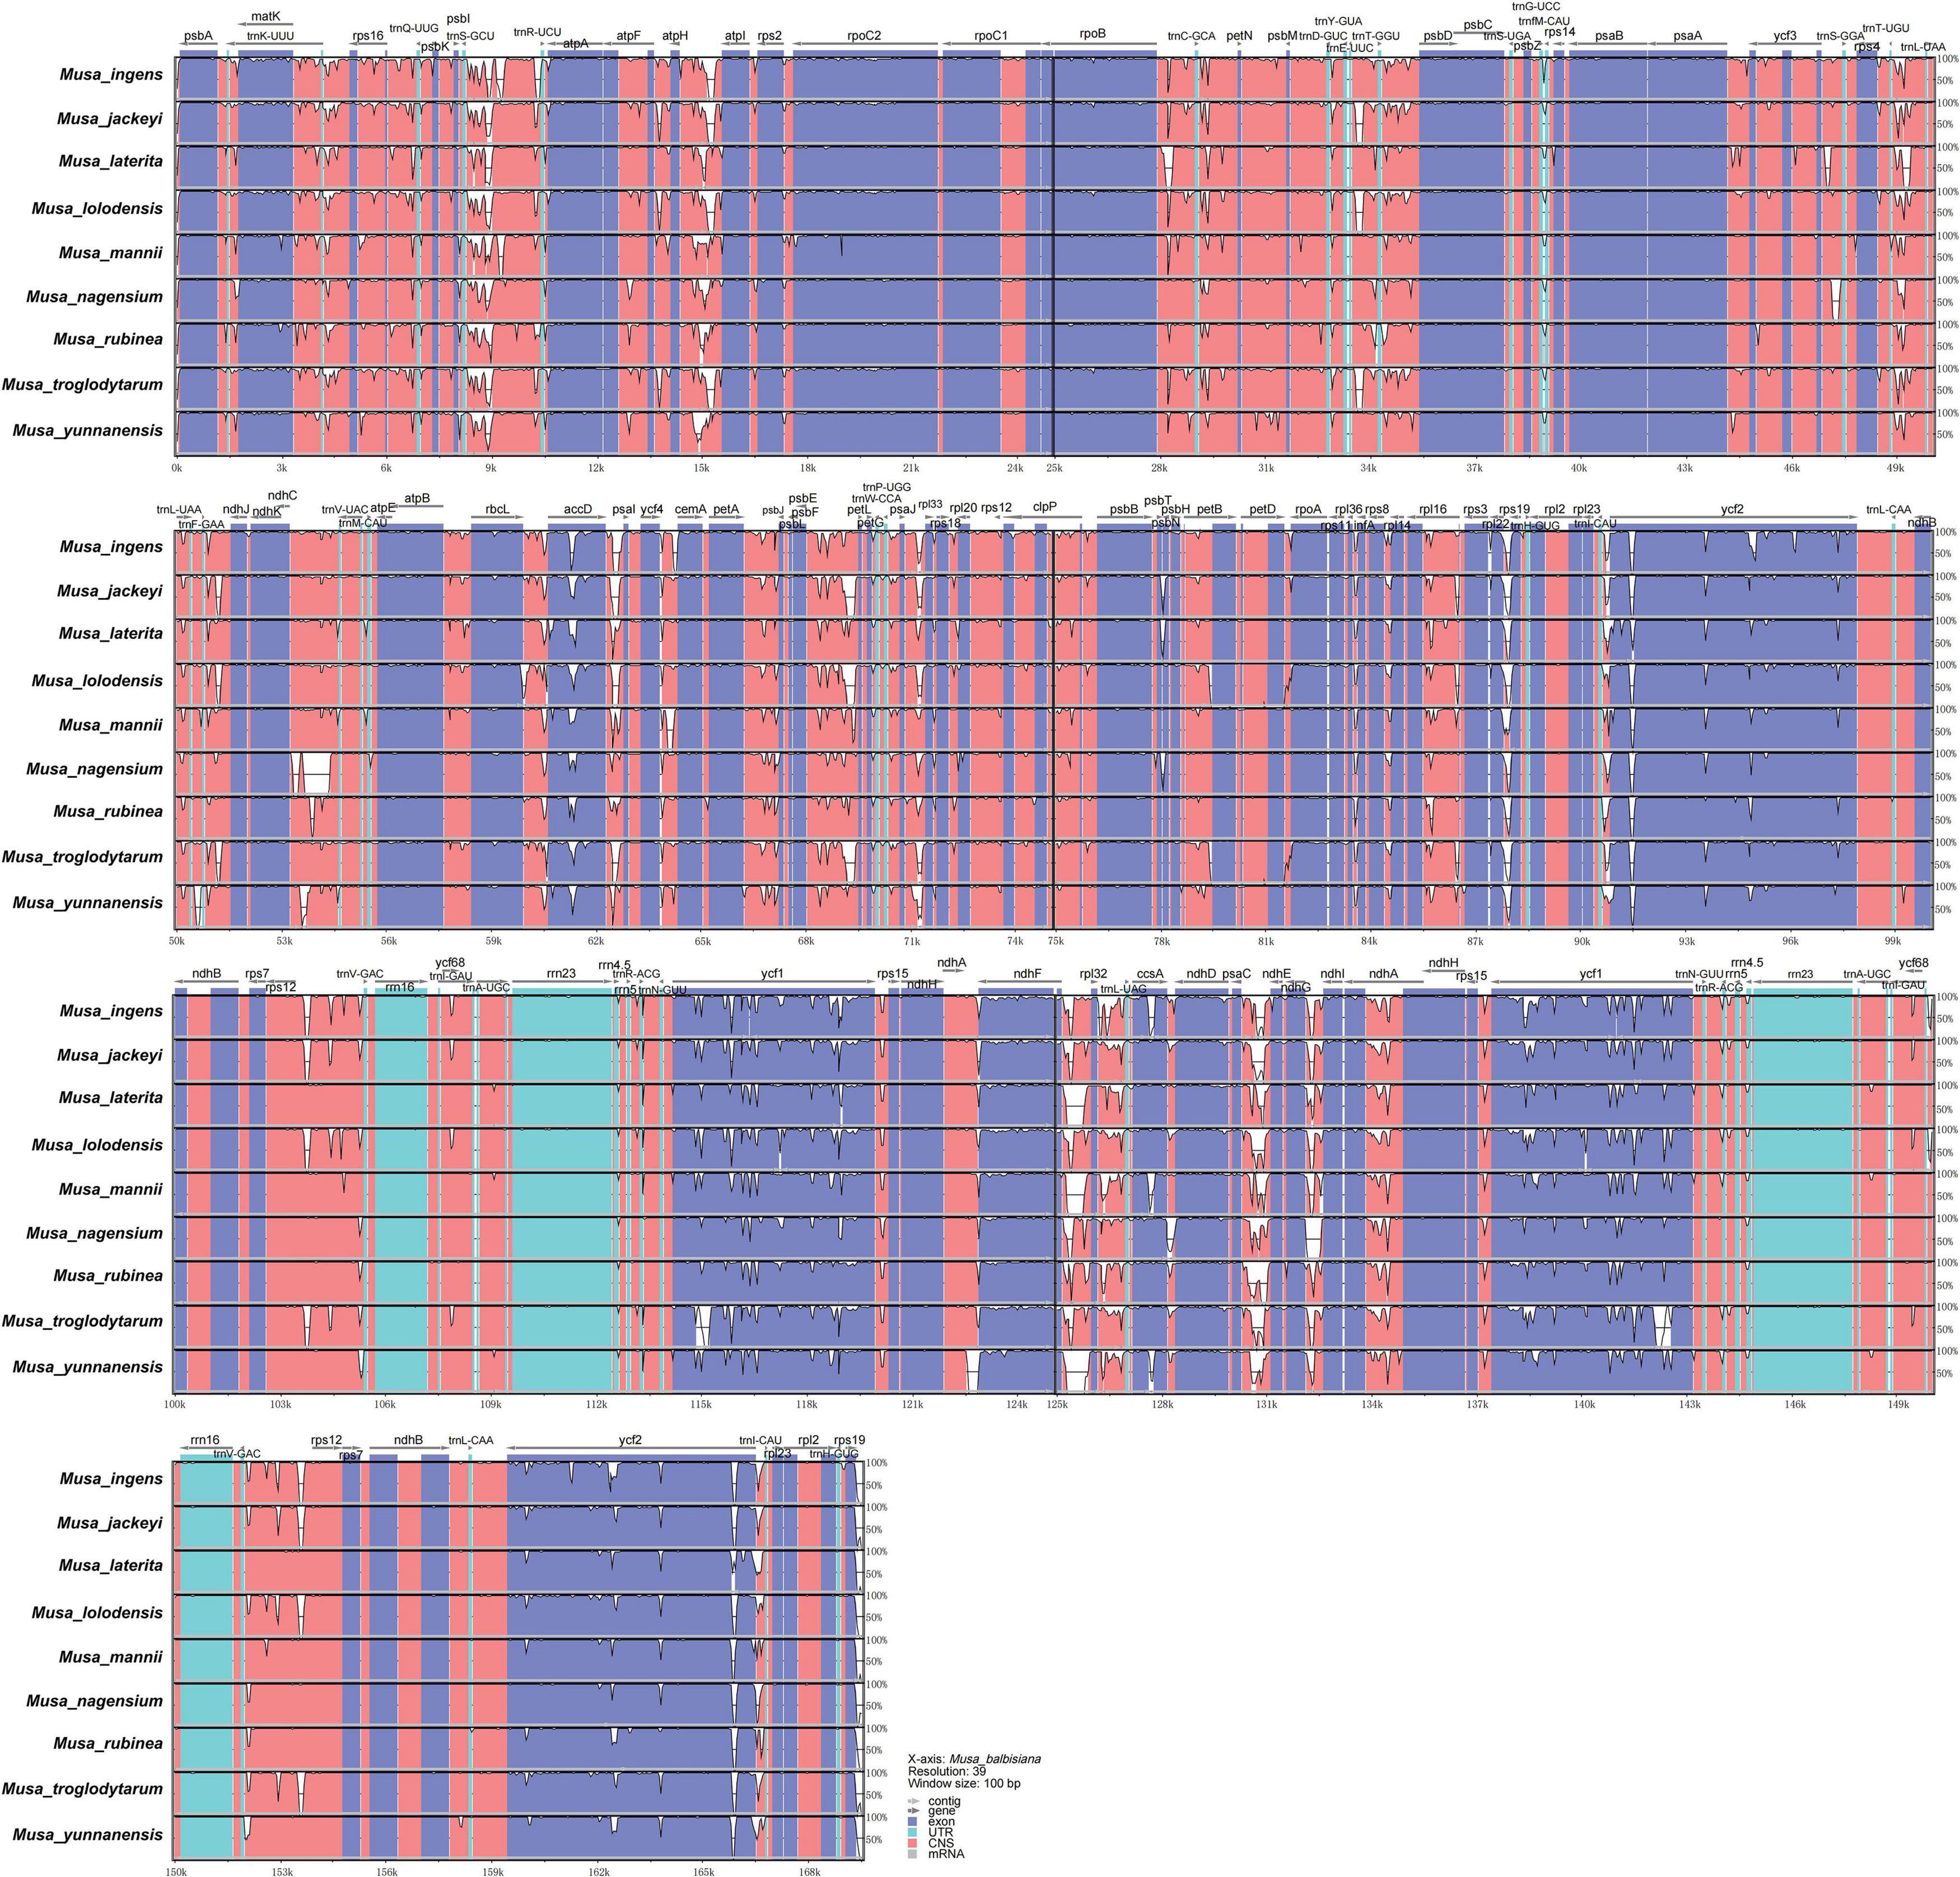
Figure 4. mVISTA map of chloroplast genome of nine species of Musa. Sequence identity plot comparing the chloroplast genome of nine Musa species. The vertical scale indicates the percentage of identity, ranging from 50 to 100%. The horizontal axis indicates the coordinates within the chloroplast genome. Genome regions are color-coded as protein-coding, rRNA, tRNA, intron, and conserved non-coding sequences (CNS).
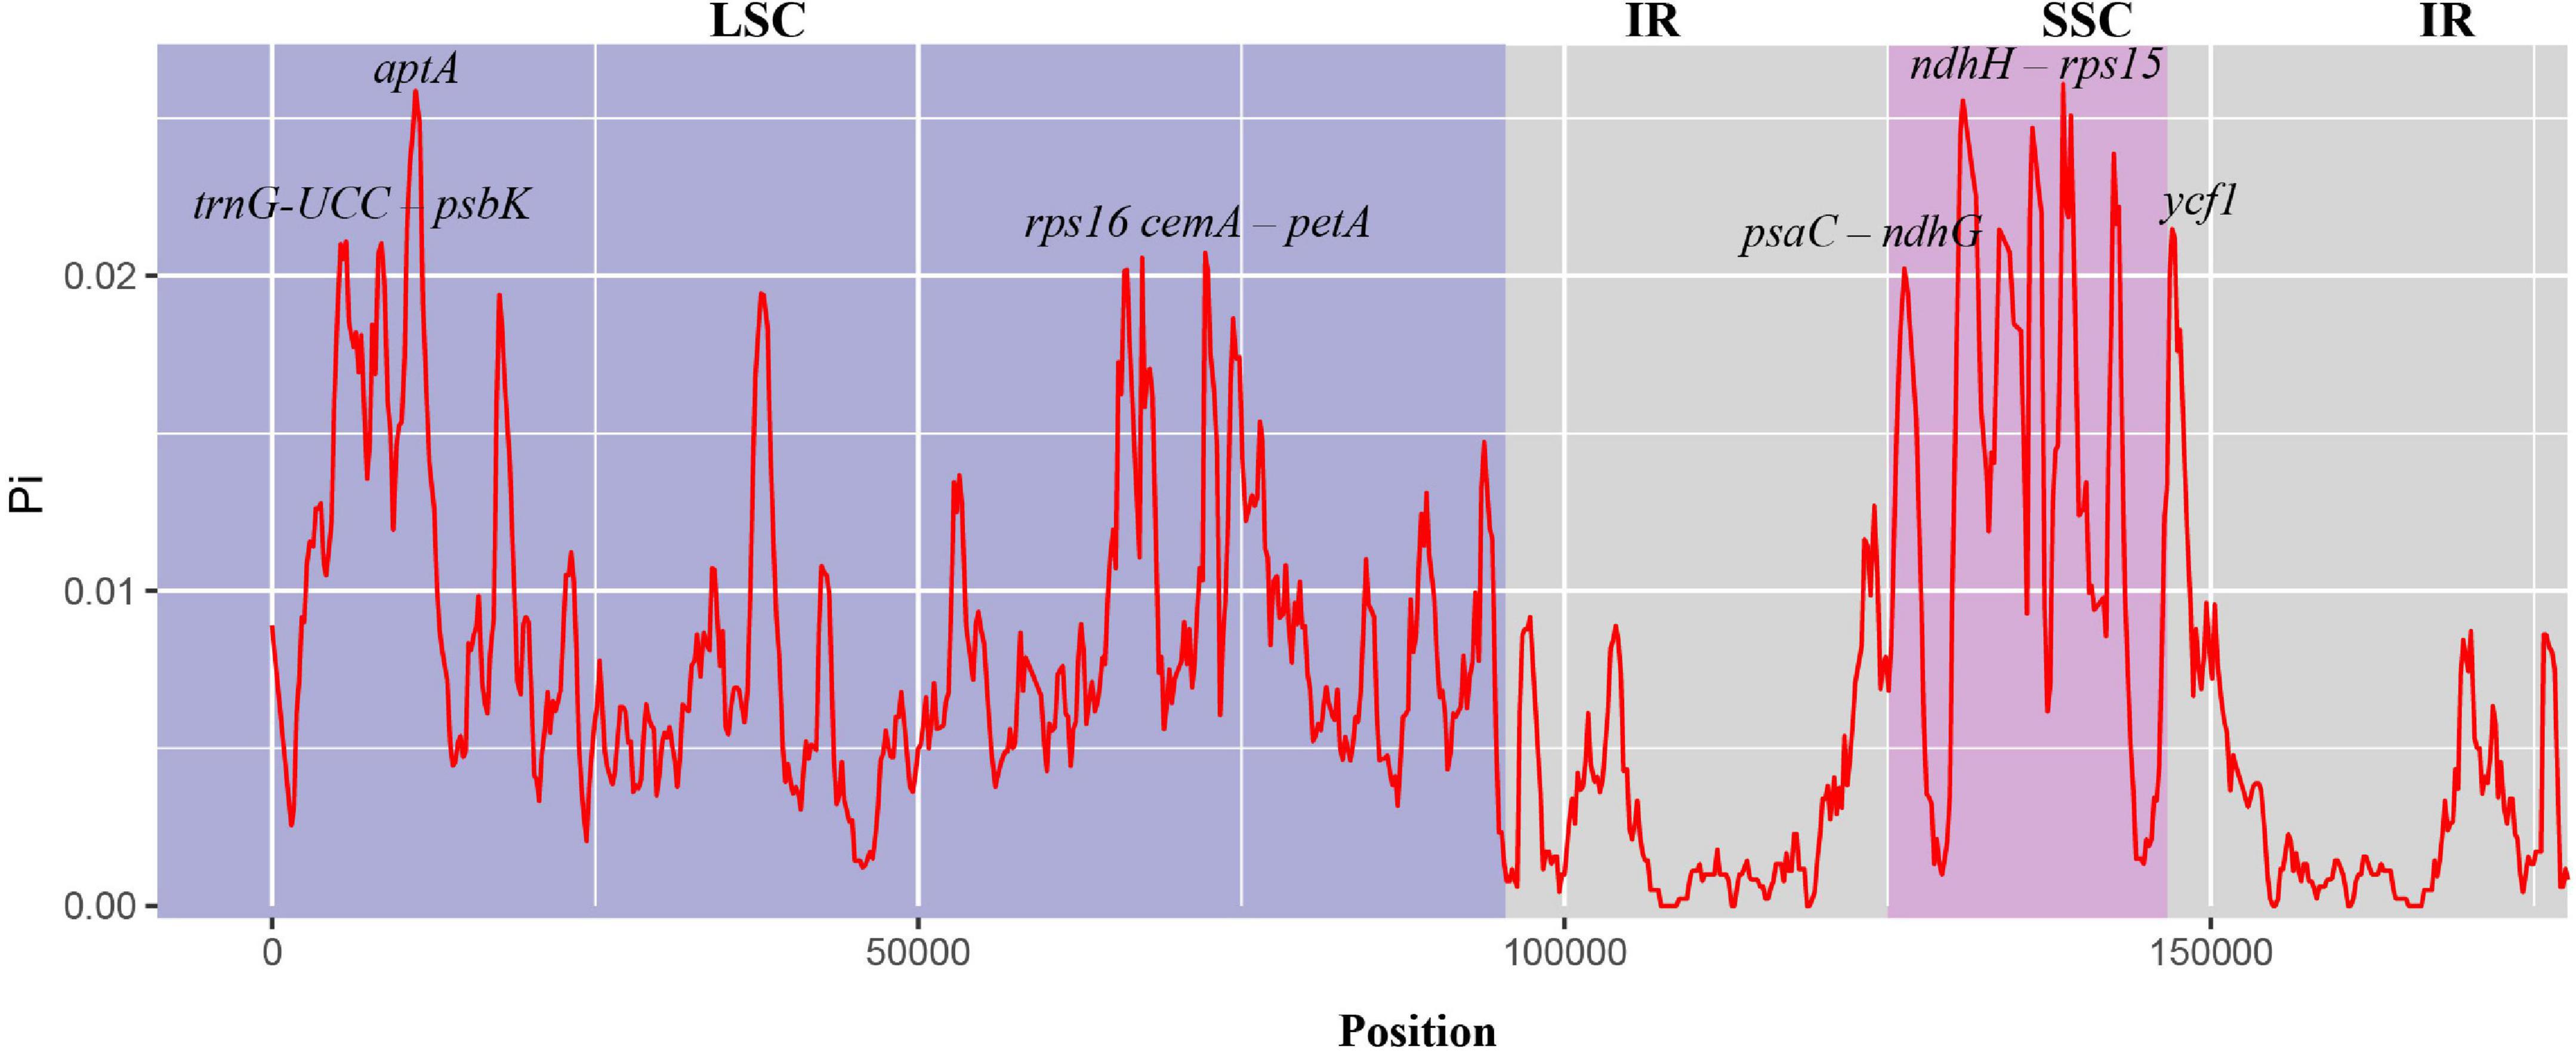
Figure 5. Nucleotide diversity in chloroplast genomes of nine species of Musa. The abscissa represents the position, and the red line represents the average of the nucleotide variations of the nine species (Pi).
To further understand the phylogenetic status of Musa plants and their relationship with other closely related species, the chloroplast whole genome and the shared protein-coding genes of 22 Zingiberales plants (including 18 Musa species) were used to constructed phylogenetic tree using maximum-likelihood (ML) method and bootstrap with 1,000 times iteration (Figure 6). The 22 Zingiberales plants were clustered as a large group, including many important crops, such as abaca (M. textilis), an excellent raw material for making specialty paper, and the primary sources of high-quality fiber-Abacá and Chinese dwarf banana, which was regarded as an essential Chinese medicinal material and rare ornamental plant, etc. The bootstrap values for almost all relationships inferred from all chloroplast genome data were very high. The results of the evolutionary tree we constructed can be divided into approximately four parts, which are M. mannii–M. yunnanensis, M. balbisiana–Musa formobisiana, Musa coccinea–M. troglodytarum and outgroups. In third part of the two evolutionary trees, there is a slight divergence, the Figure 6A showed that M. textilis and the sub-branches containing M. beccarii, M. lolodensis, M. jackeyi, and M. troglodytarum had sister relationship, and Figure 6B indicated that M. textilis and M. beccarii were sister species. Musa lasiocarpa is closer to Ensete glaucum of outgroups than to other 17 Musa species. The phylogenetic tree of nine Musa plants showed that Musa L. sect. Musa and Musa sect. Callimusa had a sister relationship, which was further verifying the latest Musa species classification (Weiner et al., 2019).
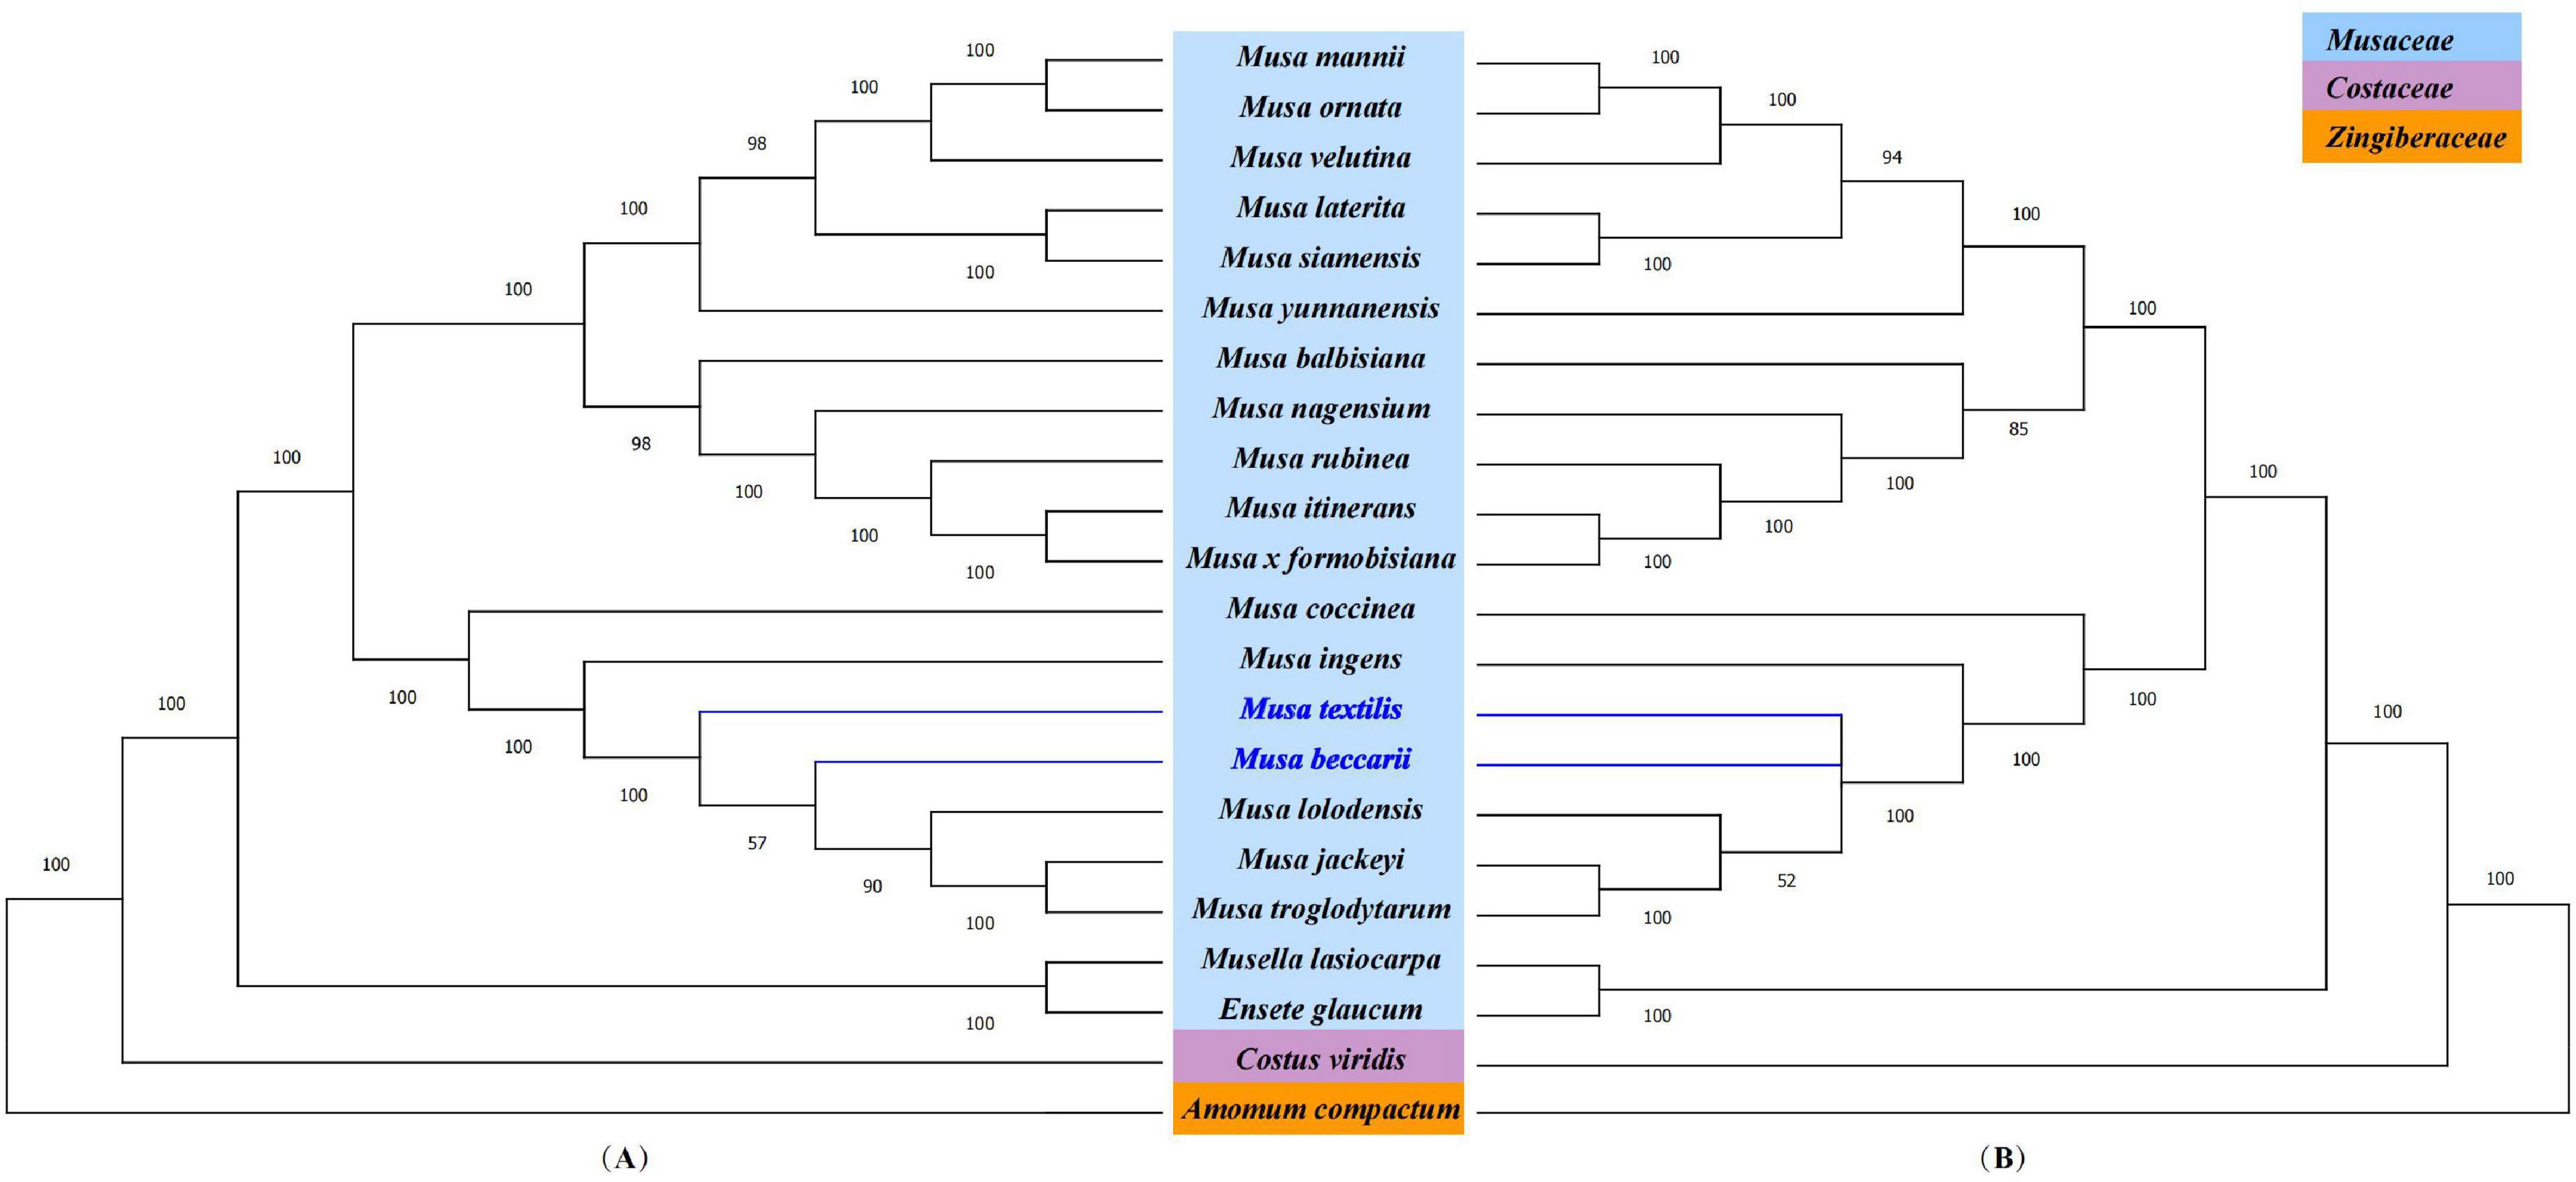
Figure 6. Phylogenetic analysis. (A) Phylogenetic tree based on the complete chloroplast genome. (B) Phylogenetic tree based on shared protein-coding genes. Costus viridis and Amomum compactum were selected as out groups. Numbers at branch nodes are bootstrap values.
The chloroplast genome of angiosperms has made essential contributions to the study of phylogeny and the analysis of evolutionary relationships in phylogeny (Lee et al., 2019). The rich information in the chloroplast genome is very suitable as a DNA barcoding for species identification (Millen et al., 2001). However, among the 86 species belonging to Musa genus, there was very little analysis of complete chloroplast genomes. At this stage, only the complete chloroplast genomes of few species have been reported (Martin et al., 2013; Shetty et al., 2016; Liu et al., 2018; Feng et al., 2020), herein, we have added nine Musa species. The chloroplast genomes of most land plants are highly conserved, while during the evolution of angiosperms, one of the most fluid chloroplast genes, infA, was discovered (Millen et al., 2001). The chlB, chlL, accD, ycf1, ycf68, infA, ycf15, ycf2, rpl22, rps16, rpl23, ndhF, chlN, and trnP (GGG) genes in the plastid genome of some angiosperms were observed to be missing (Liaud et al., 1990; Liu and Xue, 2005; Jansen et al., 2007; Sheng et al., 2021). Among them, the deletion of four genes [chlB, chlL, chlN and trnP (GGG)] represents the homomorphism of flowering plants (Shahzadi et al., 2020). The deletions of the above four genes were found in the chloroplast genomes of all nine Musa species, including the missing of ycf15 and ycf68. M. laterita, M. mannii, M. nagensium, M. rubinea, and M. yunnanensis all had two rps19 genes, but only one in the chloroplast genomes of the other four species. This phenomenon is consistent with the classification of previous studies that the first five Musa sps. belong to Musa L. sect. Musa, and the last four species belong to Musa sect. Callimusa (Jiang et al., 2017).
Codon usage bias helped revealing the interaction between the chloroplast genome and its nuclear genome (Yang Y. et al., 2018). In many previous studies, the codons for leucine and isoleucine are the most common codons in the chloroplast, and the codons for cysteine are the least (Asaf et al., 2017b; Yang Y. et al., 2018; Shahzadi et al., 2020). The nine Musa species in this study also meet this feature. In the chloroplast genome of angiosperms, most codons showed higher A/T preference in the third codon. Our results followed this trend, and this phenomenon was also observed in Forsythia suspensa (Tian et al., 2018), Epipremnum aureum (Abdullah et al., 2020), Zingibereae sp. (Saina et al., 2018a), two Artemisia species (Piot et al., 2018), and other species. The main reason for this situation may be related to the abundance of A or T in the IR region (Chen et al., 2015).
Long repeats (LR) were essential when analyzing genome reorganization, rearrangement, and phylogeny, or inducing substitutions and insertions in the chloroplast genome (Chumley et al., 2006). We detected 86–324 LRs in nine Musa species, most of which were located in the IR region. This phenomenon was different from some species (Tian et al., 2018; Abdullah et al., 2020; Zhu et al., 2021). The IR regions of Musa sp. stabilizes plastid chromosomes through a repair mechanism induced by homologous recombination (Maréchal and Brisson, 2010). At the same time, our analysis shows that the proportion of LRs of M. laterita, M. mannii, M. nagensium, M. rubinea, and M. yunnanensis in the IR regions were greater than that of the other four species, which also may play a role in the genetic diversity and evolution of different Musa branches.
In the chloroplast genome, SSR was considered an important role in population genetics and phylogenetic analysis (Terrab et al., 2006). The number of SSRs were detected in the nine Musa species ranged from 73 to 93. The distribution of SSRs in the LSC region was higher than that in the IR and SSC region. At the same time, analysis shows that SSRs were mainly distributed in non-coding regions. These results were supported by previous studies on the chloroplast genome of angiosperms (Kim et al., 2009; Xu et al., 2012; Cheng et al., 2017). The SSRs analysis in this study showed that single nucleotide SSRs (A/T) had the highest content among the nine Musa plants, reaching 334, and mono-/di-/tri-/tetra-nucleotide repeats accounted for 86.17–94.52%, the penta- or hexanucleotide repeats were very few. The AT content in the chloroplast genome of nine Musa plants were higher than the GC content, and SSRs shows a strong AT bias, which was a common phenomenon in the chloroplast genome of higher plants (Kuang et al., 2011; Lei et al., 2016). Repetitive sequences played a vital role in generating insertion mutations and substitution mutations (McDonald et al., 2011). Previous studies have shown widespread substitutions and deletions in the LSC and SSC regions of the chloroplast genome (Ahmed et al., 2012).
The IR/LSC boundary position was not fixed during the evolution of angiosperms but can expand and contract moderately (Ahmed et al., 2012). The large inverted repeat sequence may be directly related to the structural conservation of the chloroplast genome (Palmer and Thompson, 1982). In some angiosperms, the expansion or contraction of IR is usually accompanied by the change of gene position. For example, the ycf1 gene often is pseudogene because it crosses the boundary between LSC–IR and SSC–IR (Saina et al., 2018b; Yang Z. et al., 2018; Shahzadi et al., 2020). In our research, we divided these nine species into three categories based on the location of rps19 gene. In contrast, the M. yunnanensis in the third category and the four species in the first category belong to Musa L. sect. Musa, the three species in the second category and the M. ingens in the third category all belong to Musa sect. Callimusa. In the chloroplast genome of M. yunnanensis, we speculated that two rps19 genes appear in the LSC region due to the contraction of the IR region. In contrast, the ndhB gene remained in the IR region, thus evolving into a part of Musa sect. Callimusa. The shrinkage or expansion of the IR region was one of the essential features for understanding the evolution and structure of the chloroplast genome (Jiang et al., 2017).
The SNP distributions of the nine species were very similar. The SNPs of each species account for the highest proportion in the LSC region. Except for M. nagensium, the SNPs of the other species in the IR region were more than the SSC region. We also analyzed the insertions and deletions of the chloroplast genomes of nine species, and the results found that they have similar rules as SNPs. In that case, it is possible to predict mutation hot spots and better study population genetics and analyze the phylogenetic relationship of species (Du et al., 2017; Keller et al., 2017).
Ka/Ks is used to assess nucleotides’ natural selection pressure and evolution rate, which is a meaningful marker in species evolution (Li et al., 1985). In our study, Ks was much higher than Ka, which means that the evolution of Musa species was relatively slow. Only two genes (ycf1 and ycf2) were under positive selection, and this was also somewhat different from the species of the Zingiberaceae (Liang and Chen, 2021). Consistent with many previous studies, the evolution of photosynthesis genes was slower than other types of protein-coding genes (Wicke et al., 2011; Saina et al., 2018a; Tian et al., 2018). Genes under positive selection often inserted many repetitive amino acid sequences to varying degrees, which may be evidence of adaptation to new ecological conditions or the result of co-evolution (Piot et al., 2018).
The chloroplast genome sequence contains highly variable regions. Finding more regions with a higher evolution rate is helpful to distinguish closely related species or genus, which is of great significance to the study of DNA barcodes (Dong et al., 2012). The chloroplast genomes contained two huge genes, ycf1 and ycf2, which were indispensable chloroplast genes in higher plants (Drescher et al., 2000). The proteins that control transcription play an important role in cell survival. In the chloroplast genomes of most flowering plants, the accD gene encodes the β-carboxyl transferase subunit of acetyl-CoA carboxylase, which is essential for plant leaf development (Kode et al., 2005). Since they are all protein-coding genes, they may provide information about the evolution of Musa plants. Our comparative analysis identified several non-coding sites (psbI–atpA, atpH–atpI, rpoB–petN, psbM–psbD, ndhf-rpl32, psaC-ndhE, and ndhG-ndhI) and three genes (ycf1, ycf2, and accD). These mutation hotpots with high nucleotide diversity were particularly suitable for Musa genus’ further molecular phylogeny and population genetics research.
In recent years, many studies have used protein-coding regions or chloroplast whole-genome sequence for phylogenetic analysis (Henriquez et al., 2014). The results of this study revealed the genetic relationship between Musa plants. It is generally believed that Musa genus includes Musa sect. Rhodochlamys, Musa sect. Eumusa, Musa sect. Australimusa, and Musa sect. Ingentimusa (Cheesman, 1947). Currently, the Musa genus is divided into two sections, Musa L. sect. Musa and Musa sect. Callimusa (Häkkinen, 2013). At the same time, the 19 unlinked nuclear genes confirmed the close relationship of Australimusa and Callimusa sections and showed that Eumusa and Rhodochlamys sections are not reciprocally monophyletic (Christelov et al., 2011). Our analysis revealed that Musa sect. Rhodochlamys and Musa sect. Eumusa were sisterly related to Musa sect. Australimusa and Musa sect. Ingentimusa. This result further verified that Musa L. sect. Musa included Musa sect. Rhodochlamys and Musa sect. Eumusa, and Musa sect. Callimusa comprised Musa sect. Australimusa and Musa sect. Ingentimusa. Based on the evolutionary tree, we also found that M. lasiocarpa is a basal species in the genus of Musa (Novák et al., 2014), which will help to deduce the time of origin of Musa. In addition, the results we obtained were different from previous studies (Liu et al., 2018; Feng et al., 2020). For example, the findings of their results concluded that M. textilis was the sister group of M. balbisiana and M. beccarii was closer to the roots of the evolutionary tree than Musa itinerans, which may be related to the other genomic regions and species collected. At present, the phylogenetic analysis of Musa species we have done was based on the complete chloroplast genome and protein-coding genes were the most comprehensive, which provided a theoretical foundation and technical support for the development and utilization of Musa plants resources.
In this study, we reported and compared the complete chloroplast genomes of nine Musa species in the first time, greatly increasing the available molecular sequences for this genus. The complete chloroplast genomes of these nine species were typical circular double-stranded quadripartite structure and ranged from 167,975 to 172,653 bp in the length. We analyzed the sequences of the chloroplast genomes of nine Musa species, such as the sequence length of each region, the number of different types of genes, and the types of intron genes. Codon bias analysis presented an extensively preferences for codons containing A/T at the 3′ end, especially for those who showed RSCU greater than one. We detected most of repetitive sequence existed in range of 30–50 bp. As shown in Ka/Ks evaluation, 77 of protein-coding genes was relatively stable during evolution process, while two genes (ycf1 and ycf2) were under positive selection. Our research also revealed that all nine Musa species have ndhA genes that spanned the SSC and IRa regions, and notably, the rps19 gene was entirely located in the IRb regions, suggesting that this phenomenon may occur with the contraction IRb area. SNP and InDels analysis divided nine Musa species into two groups in terms of the abundance and distribution of nucleotide polymorphic phenomenon, which was further confirmed by the phylogenetic tree. In summary, comparing the chloroplast genomes of Musa can deepen our understanding of the evolution of the Musaceae and may be suitable for the phylogenetic analysis and classification of Musa genus.
The original contributions presented in the study are publicly available. The data that support the findings of this study are openly available in the Genbank database at https://www.ncbi.nlm.nih.gov/ under accession number NC_056826 - NC_056834.
CJ and CS: conceptualization. HC, XW, and SW: data curation. SW: formal analysis. CS and SW: funding acquisition. CJ, HC, and XW: investigation. WS: methodology. WS, CS, and SW: project administration. WS and ZC: software, visualization, and writing – review and editing. CS: supervision. HC and XW: validation. WS and CJ: writing – original draft. All authors contributed to the article and approved the submitted version.
This work was supported by the National Natural Science Foundation of China (No. 31801022) and Shandong Province Natural Science Foundation of China (No. ZR2019BC094). We are thankful to Beijing-based Novogene for their NGS service that was instrumental to the execution of the project.
The authors declare that the research was conducted in the absence of any commercial or financial relationships that could be construed as a potential conflict of interest.
All claims expressed in this article are solely those of the authors and do not necessarily represent those of their affiliated organizations, or those of the publisher, the editors and the reviewers. Any product that may be evaluated in this article, or claim that may be made by its manufacturer, is not guaranteed or endorsed by the publisher.
The Supplementary Material for this article can be found online at: https://www.frontiersin.org/articles/10.3389/fpls.2022.832884/full#supplementary-material
Supplementary Table 1 | Intron details.
Supplementary Table 2 | Codon usage details all nine Musa species.
Supplementary Table 3 | Ka/Ks raw data all nine Musa species.
Supplementary Table 4 | RNA editing sites raw data of all nine Musa species.
Supplementary Table 5 | Detail of SSR and long repeats.
Supplementary Table 6 | SNP and InDels statistics.
Supplementary Table 7 | Raw data of Pi values.
Supplementary Table 8 | Information of species in phylogenetic tree.
Abdullah, Mehmood, F., Shahzadi, I., Waseem, S., Mirza, B., Ahmed, I., et al. (2020). Chloroplast genome of Hibiscus rosa-sinensis (Malvaceae): Comparative analyses and identification of mutational hotspots. Genomics 112, 581–591. doi: 10.1016/j.ygeno.2019.04.010
Ahmad, T., and Danish, M. (2018). Prospects of banana waste utilization in wastewater treatment: a review. J. Environ. Manag. 206, 330–348. doi: 10.1016/j.jenvman.2017.10.061
Ahmed, I., Biggs, P. J., Matthews, P. J., Collins, L. J., Hendy, M. D., and Lockhart, P. J. (2012). Mutational dynamics of aroid chloroplast genomes. Genome Biol. Evol. 4, 1316–1323. doi: 10.1093/gbe/evs110
Ahmed, I., Matthews, P. J., Biggs, P. J., Naeem, M., Mclenachan, P. A., and Lockhart, P. J. (2013). Identification of chloroplast genome loci suitable for high-resolution phylogeographic studies of Colocasia esculenta (L.) Schott (Araceae) and closely related taxa. Mol. Ecol. Res. 13, 929–937. doi: 10.1111/1755-0998.12128
Amiryousefi, A., Hyvönen, J., and Poczai, P. (2018a). IRscope: an online program to visualize the junction sites of chloroplast genomes. Bioinformatics 34, 3030–3031. doi: 10.1093/bioinformatics/bty220
Amiryousefi, A., Hyvönen, J., and Poczai, P. (2018b). The chloroplast genome sequence of bittersweet (Solanum dulcamara): Plastid genome structure evolution in Solanaceae. PLoS One 13:69. doi: 10.1371/journal.pone.0196069
Arias, D., Rodríguez, J., López, B., and Méndez, P. (2021). Evaluation of the physicochemical properties of pectin extracted from Musa paradisiaca banana peels at different pH conditions in the formation of nanoparticles. Heliyon 7:59. doi: 10.1016/j.heliyon.2021.e06059
Asaf, S., Khan, A. L., Khan, M. A., Imran, Q. M., Kang, S. M., Al-Hosni, K., et al. (2017a). Comparative analysis of complete plastid genomes from wild soybean (Glycine soja) and nine other Glycine species. PLoS One 12:182281. doi: 10.1371/journal.pone.0182281
Asaf, S., Waqas, M., Khan, A. L., Khan, M. A., Kang, S. M., Imran, Q. M., et al. (2017b). The complete chloroplast genome of wild rice (Oryza minuta) and its comparison to related species. Front. Plant Sci. 8:304. doi: 10.3389/fpls.2017.00304
Beier, S., Thiel, T., Münch, T., Scholz, U., and Mascher, M. (2017). MISA-web: A web server for microsatellite prediction. Bioinformatics 33, 2583–2585. doi: 10.1093/bioinformatics/btx198
Bolger, A. M., Lohse, M., and Usadel, B. (2014). Trimmomatic: A flexible trimmer for Illumina sequence data. Bioinformatics 30, 2114–2120. doi: 10.1093/bioinformatics/btu170
Brudno, M., Malde, S., Poliakov, A., Do, C. B., Couronne, O., Dubchak, I., et al. (2003). Glocal alignment: Finding rearrangements during alignment. Bioinformatics 19:5. doi: 10.1093/bioinformatics/btg1005
Cheesman, E. E. (1947). Classification of the Bananas: The Genus Musa L. Kew Bullet. 2:106. doi: 10.2307/4109207
Chen, J., Hao, Z., Xu, H., Yang, L., Liu, G., Sheng, Y., et al. (2015). The complete chloroplast genome sequence of the relict woody plant metasequoia glyptostroboides. Front. Plant Sci. 6:1–11. doi: 10.3389/fpls.2015.00447
Cheng, H., Li, J., Zhang, H., Cai, B., Gao, Z., Qiao, Y., et al. (2017). The complete chloroplast genome sequence of strawberry (Fragaria × ananassa Duch.) and comparison with related species of Rosaceae. PeerJ 2017:e3919. doi: 10.7717/peerj.3919
Christelov, P., Valrik, M., Hibov, E., De Langhe, E., and Doleel, J. (2011). A multi gene sequence-based phylogeny of the Musaceae (banana) family. BMC Evol. Biol. 11:103. doi: 10.1186/1471-2148-11-103
Chumley, T. W., Palmer, J. D., Mower, J. P., Fourcade, H. M., Calie, P. J., Boore, J. L., et al. (2006). The complete chloroplast genome sequence of Pelargonium × hortorum: Organization and evolution of the largest and most highly rearranged chloroplast genome of land plants. Mol. Biol. Evol. 23, 2175–2190. doi: 10.1093/molbev/msl089
del Río, J. C., and Gutiérrez, A. (2006). Chemical composition of abaca (Musa textilis) leaf fibers used for manufacturing of high quality paper pulps. J. Agricult. Food Chem. 54, 4600–4610. doi: 10.1021/JF053016N
Dierckxsens, N., Mardulyn, P., and Smits, G. (2017). NOVOPlasty: De novo assembly of organelle genomes from whole genome data. Nucleic Acids Res. 45:e18. doi: 10.1093/nar/gkw955
Dong, W., Liu, J., Yu, J., Wang, L., and Zhou, S. (2012). Highly variable chloroplast markers for evaluating plant phylogeny at low taxonomic levels and for DNA barcoding. PloS One 7:1–9. doi: 10.1371/journal.pone.0035071
Drescher, A., Stephanie, R., Calsa, T., Carrer, H., and Bock, R. (2000). The two largest chloroplast genome-encoded open reading frames of higher plants are essential genes. Plant J. 22, 97–104. doi: 10.1046/j.1365-313X.2000.00722.x
Du, Y. P., Bi, Y., Yang, F. P., Zhang, M. F., Chen, X. Q., Xue, J., et al. (2017). Complete chloroplast genome sequences of Lilium: Insights into evolutionary dynamics and phylogenetic analyses. Sci. Rep. 7, 1–10. doi: 10.1038/s41598-017-06210-2
Ewels, P., Magnusson, M., Lundin, S., and Käller, M. (2016). MultiQC: Summarize analysis results for multiple tools and samples in a single report. Bioinformatics 32, 3047–3048. doi: 10.1093/bioinformatics/btw354
Feng, H., Chen, Y., Xu, X., Luo, H., Wu, Y., and He, C. (2020). The complete chloroplast genome of Musa beccarii. Mitochon. DNA Part B: Res. 5, 2384–2385. doi: 10.1080/23802359.2020.1775513
Gichira, A. W., Li, Z., Saina, J. K., Long, Z., Hu, G., Gituru, R. W., et al. (2017). The complete chloroplast genome sequence of an endemic monotypic genus Hagenia (Rosaceae): Structural comparative analysis, gene content and microsatellite detection. PeerJ 2017:2846. doi: 10.7717/peerj.2846
Häkkinen, M. (2013). Reappraisal of sectional taxonomy in Musa (Musaceae). Taxon 62, 809–813. doi: 10.12705/624.3
Häkkinen, M., and Väre, H. (2008). Typification and check-list of Musa L. names (Musaceae) with nomenclatural notes. Adansonia 30, 63–112. doi: 10.5281/zenodo.5190398
Henriquez, C. L., Arias, T., Pires, J. C., Croat, T. B., and Schaal, B. A. (2014). Phylogenomics of the plant family Araceae. Mol. Phylogenet. Evol. 75, 91–102. doi: 10.1016/j.ympev.2014.02.017
Ingale, S., Joshi, S. J., and Gupte, A. (2014). Production of bioethanol using agricultural waste: Banana pseudo stem. Braz. J. Microbiol. 45, 885–892. doi: 10.1590/s1517-83822014000300018
Jansen, R. K., Cai, Z., Raubeson, L. A., Daniell, H., Depamphilis, C. W., Leebens-Mack, J., et al. (2007). Analysis of 81 genes from 64 plastid genomes resolves relationships in angiosperms and identifies genome-scale evolutionary patterns. Proc. Nat. Acad. Sci. USA 104, 19369–19374. doi: 10.1073/pnas.0709121104
Jarvis, P., and López-Juez, E. (2013). Biogenesis and homeostasis of chloroplasts and other plastids. Nat. Rev. Mol. Cell Biol. 14, 787–802. doi: 10.1038/nrm3702
Jiang, D., Zhao, Z., Zhang, T., Zhong, W., Liu, C., Yuan, Q. J., et al. (2017). The chloroplast genome sequence of Scutellaria baicalensis provides insight into intraspecific and interspecific chloroplast genome diversity in Scutellaria. Genes 8, 1–13. doi: 10.3390/genes8090227
Keller, J., Rousseau-Gueutin, M., Martin, G. E., Morice, J., Boutte, J., Coissac, E., et al. (2017). The evolutionary fate of the chloroplast and nuclear rps16 genes as revealed through the sequencing and comparative analyses of four novel legume chloroplast genomes from Lupinus. DNA Res. 24, 343–358. doi: 10.1093/dnares/dsx006
Kim, Y. K., Park, C. W., and Kim, K. J. (2009). Complete chloroplast DNA sequence from a Korean endemic genus, Megaleranthis saniculifolia, and its evolutionary implications. Mol. Cells 27, 365–381. doi: 10.1007/s10059-009-0047-6
Kode, V., Mudd, E. A., Iamtham, S., and Day, A. (2005). The tobacco plastid accD gene is essential and is required for leaf development. Plant J. 44, 237–244. doi: 10.1111/j.1365-313X.2005.02533.x
Kolodner, R., and Tewari, K. K. (1979). Inverted repeats in chloroplast DNA from higher plants. Proc. Nat. Acad. Sci. 76, 41–45. doi: 10.1073/PNAS.76.1.41
Kress, W. J., Prince, L. M., Hahn, W. J., and Zimmer, E. A. (2001). Unraveling the evolutionary radiation of the families of the Zingiberales using morphological and molecular evidence. Syst. Biol. 50, 926–944. doi: 10.1080/106351501753462885
Kuang, D. Y., Wu, H., Wang, Y. L., Gao, L. M., Zhang, S. Z., and Lu, L. (2011). Complete chloroplast genome sequence of Magnolia kwangsiensis (Magnoliaceae): Implication for DNA barcoding and population genetics. Genome 54, 663–673. doi: 10.1139/g11-026
Kumar, S., Stecher, G., Li, M., Knyaz, C., and Tamura, K. (2018). MEGA X: Molecular evolutionary genetics analysis across computing platforms. Mol. Biol. Evol. 35, 1547–1549. doi: 10.1093/molbev/msy096
Kurtz, S., Choudhuri, J. V., Ohlebusch, E., Schleiermacher, C., Stoye, J., and Giegerich, R. (2001). REPuter: The manifold applications of repeat analysis on a genomic scale. Nucleic Acids Res. 29, 4633–4642. doi: 10.1093/nar/29.22.4633
Lagesen, K., Hallin, P., Rødland, E. A., Stærfeldt, H. H., Rognes, T., and Ussery, D. W. (2007). RNAmmer: Consistent and rapid annotation of ribosomal RNA genes. Nucleic Acids Res. 35, 3100–3108. doi: 10.1093/nar/gkm160
Lee, H. O., Joh, H. J., Kim, K., Lee, S. C., Kim, N. H., Park, J. Y., et al. (2019). Dynamic chloroplast genome rearrangement and DNA barcoding for three Apiaceae species known as the medicinal herb “bang-poong.”. Int. J. Mol. Sci. 20:2196. doi: 10.3390/ijms20092196
Lehwark, P., and Greiner, S. (2019). GB2sequin - A file converter preparing custom GenBank files for database submission. Genomics 111, 759–761. doi: 10.1016/j.ygeno.2018.05.003
Lei, W., Ni, D., Wang, Y., Shao, J., Wang, X., Yang, D., et al. (2016). Intraspecific and heteroplasmic variations, gene losses and inversions in the chloroplast genome of Astragalus membranaceus. Sci. Rep. 6, 1–13. doi: 10.1038/srep21669
Li, L. F., Häkkinen, M., Yuan, Y. M., Hao, G., and Ge, X. J. (2010). Molecular phylogeny and systematics of the banana family (Musaceae) inferred from multiple nuclear and chloroplast DNA fragments, with a special reference to the genus. Musa. Mol. Phylogenet. Evol. 57, 1–10. doi: 10.1016/j.ympev.2010.06.021
Li, P., Zhang, S., Li, F., Zhang, S., Zhang, H., Wang, X., et al. (2017). A phylogenetic analysis of chloroplast genomes elucidates the relationships of the six economically important Brassica species comprising the triangle of U. Front. Plant Sci. 8:1–13. doi: 10.3389/fpls.2017.00111
Li, W. H., Wu, C. I., and Luo, C. C. (1985). A new method for estimating synonymous and nonsynonymous rates of nucleotide substitution considering the relative likelihood of nucleotide and codon changes. Mol. Biol. Evol. 2, 150–174. doi: 10.1093/OXFORDJOURNALS.MOLBEV.A040343
Liang, H., and Chen, J. (2021). Comparison and phylogenetic analyses of nine complete chloroplast genomes of Zingibereae. Forests 12:710. doi: 10.3390/f12060710
Liaud, M. F., Zhang, D. X., and Cerff, R. (1990). Differential intron loss and endosymbiotic transfer of chloroplast glyceraldehyde-3-phosphate dehydrogenase genes to the nucleus. Proc. Nat. Acad. Sci. USA 87, 8918–8922. doi: 10.1073/PNAS.87.22.8918
Liu, J., Gao, C. W., and Niu, Y. F. (2018). The complete chloroplast genome sequence of flowering banana, Musa ornata. Mitochon. DNA Part B: Res. 3, 962–963. doi: 10.1080/23802359.2018.1507647
Liu, Q., and Xue, Q. (2005). Comparative studies on codon usage pattern of chloroplasts and their host nuclear genes in four plant species. J. Genet. 84, 55–62. doi: 10.1007/BF02715890
Lohse, M., Drechsel, O., and Bock, R. (2007). OrganellarGenomeDRAW (OGDRAW): A tool for the easy generation of high-quality custom graphical maps of plastid and mitochondrial genomes. Curr. Genet. 52, 267–274. doi: 10.1007/s00294-007-0161-y
Lowe, T. M., and Eddy, S. R. (1997). tRNAscan-SE: a program for improved detection of transfer RNA Genes in Genomic Sequence. Nucleic Acids Res. 25, 955–964. doi: 10.1093/nar/25.5.955
Luo, R., Lam, T.-W., Liu, B., Xie, Y., Li, Z., Huang, W., et al. (2012). SOAPdenovo2: an empirically improved memory-efficient short-read de novo assembler. GigaScience 1, 1–6. doi: 10.1186/2047-217X-1-18
Maréchal, A., and Brisson, N. (2010). Recombination and the maintenance of plant organelle genome stability. New Phytol. 186, 299–317. doi: 10.1111/j.1469-8137.2010.03195.x
Martin, G., Baurens, F. C., Cardi, C., D’Hont, A., and Aury, J. M. (2013). The complete chloroplast genome of banana (musa acuminata, zingiberales): insight into plastid monocotyledon evolution. PLoS One 8:67350. doi: 10.1371/journal.pone.0067350
McDonald, M. J., Wang, W. C., Huang, H., and Leu, J. Y. (2011). Clusters of Nucleotide substitutions and insertion/deletion mutations are associated with repeat sequences. PLoS Biol. 9:e1000622. doi: 10.1371/journal.pbio.1000622
Millen, R. S., Olmstead, R. G., Adams, K. L., Palmer, J. D., Lao, N. T., Heggie, L., et al. (2001). Many parallel losses of infa from chloroplast DNA during angiosperm evolution with multiple independent transfers to the nucleus. Plant Cell 13, 645–658. doi: 10.1105/tpc.13.3.645
Mower, J. P. (2009). The PREP suite: Predictive RNA editors for plant mitochondrial genes, chloroplast genes and user-defined alignments. Nucleic Acids Res. 37, 12–14. doi: 10.1093/nar/gkp337
Muraguri, S., Xu, W., Chapman, M., Muchugi, A., Oluwaniyi, A., Oyebanji, O., et al. (2020). Intraspecific variation within Castor bean (Ricinus communis L.) based on chloroplast genomes. Indus. Crops Prod. 155:112779. doi: 10.1016/J.INDCROP.2020.112779
Naranjo, J. M., Cardona, C. A., and Higuita, J. C. (2014). Use of residual banana for polyhydroxybutyrate (PHB) production: Case of study in an integrated biorefinery. Waste Manag. 34, 2634–2640. doi: 10.1016/j.wasman.2014.09.007
Nielsen, A. Z., Mellor, S. B., Vavitsas, K., Wlodarczyk, A. J., Gnanasekaran, T., Perestrello Ramos, H., et al. (2016). Extending the biosynthetic repertoires of cyanobacteria and chloroplasts. Plant J. 87, 87–102. doi: 10.1111/tpj.13173
Novák, P., Høibová, E., Neumann, P., Koblížková, A., Doležel, J., and Macas, J. (2014). Genome-wide analysis of repeat diversity across the family Musaceae. PLoS One 9:98918. doi: 10.1371/journal.pone.0098918
Oberoi, H. S., Vadlani, P. V., Saida, L., Bansal, S., and Hughes, J. D. (2011). Ethanol production from banana peels using statistically optimized simultaneous saccharification and fermentation process. Waste Manag. 31, 1576–1584. doi: 10.1016/j.wasman.2011.02.007
Oyewo, O. A., Onyango, M. S., and Wolkersdorfer, C. (2016). Application of banana peels nanosorbent for the removal of radioactive minerals from real mine water. J. Environ. Radioact. 164, 369–376. doi: 10.1016/j.jenvrad.2016.08.014
Pakshirajan, K., Worku, A. N., Acheampong, M. A., Lubberding, H. J., and Lens, P. N. L. (2013). Cr (III) and Cr(VI) removal from aqueous solutions by cheaply available fruit waste and algal biomass. Appl. Biochem. Biotechnol. 3, 498–513. doi: 10.1007/S12010-013-0202-6
Palmer, J. D., and Thompson, W. F. (1982). Chloroplast DNA rearrangements are more frequent when a large inverted repeat sequence is lost. Cell 29, 537–550. doi: 10.1016/0092-8674(82)90170-2
Pappu, A., Patil, V., Jain, S., Mahindrakar, A., Haque, R., and Thakur, V. K. (2015). Advances in industrial prospective of cellulosic macromolecules enriched banana biofibre resources: A review. Int. J. Biol. Macromol. 79, 449–458. doi: 10.1016/j.ijbiomac.2015.05.013
Piot, A., Hackel, J., Christin, P. A., and Besnard, G. (2018). One-third of the plastid genes evolved under positive selection in PACMAD grasses. Planta 247, 255–266. doi: 10.1007/s00425-017-2781-x
Porebski, S., Bailey, L. G., and Baum, B. R. (1997). Modification of a CTAB DNA extraction protocol for plants containing high polysaccharide and polyphenol components. Plant Mol. Biol. Rep. 1, 8–15. doi: 10.1007/BF02772108
Posada, D., and Crandall, K. A. (1998). MODELTEST: testing the model of DNA substitution. Bioinformatics 14, 817–818. doi: 10.1093/BIOINFORMATICS/14.9.817
Provan, J., Powell, W., and Hollingsworth, P. M. (2001). Chloroplast microsatellites: New tools for studies in plant ecology and evolution. Trends Ecol. Evol. 16:2097. doi: 10.1016/S0169-5347(00)02097-8
Ramírez-Hernández, A., Aparicio-Saguilán, A., Reynoso-Meza, G., and Carrillo-Ahumada, J. (2017). Multi-objective optimization of process conditions in the manufacturing of banana (Musa paradisiaca L.) starch/natural rubber films. Carbohyd. Polym. 157, 1125–1133. doi: 10.1016/j.carbpol.2016.10.083
Saina, J. K., Gichira, A. W., Li, Z. Z., Hu, G. W., Wang, Q. F., and Liao, K. (2018a). The complete chloroplast genome sequence of Dodonaea viscosa: comparative and phylogenetic analyses. Genetica 146, 101–113. doi: 10.1007/s10709-017-0003-x
Saina, J. K., Li, Z. Z., Gichira, A. W., and Liao, Y. Y. (2018b). The complete chloroplast genome sequence of tree of heaven (Ailanthus altissima (mill.) (Sapindales: Simaroubaceae), an important pantropical tree. Int. J. Mol. Sci. 19:929. doi: 10.3390/ijms19040929
Shahzadi, I., Abdullah, Mehmood, F., Ali, Z., Ahmed, I., and Mirza, B. (2020). Chloroplast genome sequences of Artemisia maritima and Artemisia absinthium: Comparative analyses, mutational hotspots in genus Artemisia and phylogeny in family Asteraceae. Genomics 112, 1454–1463. doi: 10.1016/j.ygeno.2019.08.016
Shar, Z. H., Fletcher, M. T., Sumbal, G. A., Sherazi, S. T. H., Giles, C., Bhanger, M. I., et al. (2016). Banana peel: an effective biosorbent for aflatoxins. Food Addit. Contam. Part A Chem. Anal. Control Expo. Risk Assess. 33, 849–860. doi: 10.1080/19440049.2016.1175155
Sheng, J., Yan, M., Wang, J., Zhao, L., Zhou, F., Hu, Z., et al. (2021). The complete chloroplast genome sequences of five Miscanthus species, and comparative analyses with other grass plastomes. Indus. Crops Prod. 162:113248. doi: 10.1016/j.indcrop.2021.113248
Shetty, S. M., MdShah, M. U., Makale, K., Mohd-Yusuf, Y., Khalid, N., and Othman, R. Y. (2016). Complete chloroplast genome sequence of musa balbisiana corroborates structural heterogeneity of inverted repeats in wild progenitors of cultivated bananas and plantains. Plant Genome 9:89. doi: 10.3835/PLANTGENOME2015.09.0089
Taweechat, C., Wongsooka, T., and Rawdkuen, S. (2021). Properties of banana (Cavendish spp.) starch film incorporated with banana peel extract and its application. Molecules 26:51406. doi: 10.3390/molecules26051406
Terrab, A., Paun, O., Talavera, S., Tremetsberger, K., Arista, M., and Stuessy, T. F. (2006). Genetic diversity and population structure in natural populations of Moroccan Atlas cedar (Cedrus atlantica; Pinaceae) determined with cpSSR markers. Am. J. Bot. 93, 1274–1280. doi: 10.3732/ajb.93.9.1274
Thanyapanich, N., Jimtaisong, A., and Rawdkuen, S. (2021). Functional properties of Banana starch (Musa spp.) and its utilization in cosmetics. Molecules 26:26123637. doi: 10.3390/molecules26123637
Tian, N., Han, L., Chen, C., and Wang, Z. (2018). The complete chloroplast genome sequence of Epipremnum aureum and its comparative analysis among eight Araceae species. PLoS One 13:e0192956. doi: 10.1371/journal.pone.0192956
Tillich, M., Lehwark, P., Pellizzer, T., Ulbricht-Jones, E. S., Fischer, A., Bock, R., et al. (2017). GeSeq - Versatile and accurate annotation of organelle genomes. Nucleic Acids Res. 45, W6–W11. doi: 10.1093/nar/gkx391
Vishnuvarthanan, M., Dharunya, R., Jayashree, S., Karpagam, B., and Sowndharya, R. (2019). Environment-friendly packaging material: banana fiber/cowdung composite paperboard. Environ. Chem. Lett. 17, 1143–1429. doi: 10.1007/s10311-019-00879-9
Wang, D., Zhang, Y., Zhang, Z., Zhu, J., and Yu, J. (2010). KaKs_Calculator 2.0: a toolkit incorporating gamma-series methods and sliding window strategies. Genom. Proteom. Bioinform. 8, 77–80. doi: 10.1016/S1672-0229(10)60008-3
Weiner, I., Shahar, N., Marco, P., Yacoby, I., and Tuller, T. (2019). Solving the riddle of the evolution of shine-dalgarno based translation in chloroplasts. Mol. Biol. Evol. 36, 2854–2860. doi: 10.1093/molbev/msz210
Wicke, S., Schneeweiss, G. M., dePamphilis, C. W., Müller, K. F., and Quandt, D. (2011). The evolution of the plastid chromosome in land plants: Gene content, gene order, gene function. Plant Mol. Biol. 76, 273–297. doi: 10.1007/s11103-011-9762-4
Xu, Q., Xiong, G., Li, P., He, F., Huang, Y., Wang, K., et al. (2012). Analysis of complete nucleotide sequences of 12 Gossypium chloroplast genomes: Origin and evolution of Allotetraploids. PLoS One 7:e37128. doi: 10.1371/journal.pone.0037128
Yang, J. B., Li, D. Z., and Li, H. T. (2014). Highly effective sequencing whole chloroplast genomes of angiosperms by nine novel universal primer pairs. Mol. Ecol. Res. 14, 1024–1031. doi: 10.1111/1755-0998.12251
Yang, Y., Zhu, J., Feng, L., Zhou, T., Bai, G., Yang, J., et al. (2018). Plastid genome comparative and phylogenetic analyses of the key genera in fagaceae: Highlighting the effect of codon composition bias in phylogenetic inference. Front. Plant Sci. 9:1–13. doi: 10.3389/fpls.2018.00082
Yang, Z., Zhao, T., Ma, Q., Liang, L., and Wang, G. (2018). Comparative genomics and phylogenetic analysis revealed the chloroplast genome variation and interspecific relationships of Corylus (Betulaceae) species. Front. Plant Sci. 9:927. doi: 10.3389/fpls.2018.00927
Keywords: Musa, chloroplast genome, genetic structure, comparative analysis, phylogenetic analysis, interspecific relationships
Citation: Song WC, Ji CX, Chen ZM, Cai HH, Wu XM, Shi C and Wang S (2022) Comparative Analysis the Complete Chloroplast Genomes of Nine Musa Species: Genomic Features, Comparative Analysis, and Phylogenetic Implications. Front. Plant Sci. 13:832884. doi: 10.3389/fpls.2022.832884
Received: 10 December 2021; Accepted: 07 January 2022;
Published: 10 February 2022.
Edited by:
Wei Hu, Institute of Tropical Bioscience and Biotechnology, Chinese Academy of Tropical Agricultural Sciences (CATAS), ChinaReviewed by:
Jin Xu, Chinese Academy of Inspection and Quarantine (CAIQ), ChinaCopyright © 2022 Song, Ji, Chen, Cai, Wu, Shi and Wang. This is an open-access article distributed under the terms of the Creative Commons Attribution License (CC BY). The use, distribution or reproduction in other forums is permitted, provided the original author(s) and the copyright owner(s) are credited and that the original publication in this journal is cited, in accordance with accepted academic practice. No use, distribution or reproduction is permitted which does not comply with these terms.
*Correspondence: Chao Shi, Y2hzaDExMTFAYWxpeXVuLmNvbQ==; Shuo Wang, c2h1b3dhbmdAcXVzdC5lZHUuY24=
Disclaimer: All claims expressed in this article are solely those of the authors and do not necessarily represent those of their affiliated organizations, or those of the publisher, the editors and the reviewers. Any product that may be evaluated in this article or claim that may be made by its manufacturer is not guaranteed or endorsed by the publisher.
Research integrity at Frontiers
Learn more about the work of our research integrity team to safeguard the quality of each article we publish.