- 1Department of Architecture Engineering, Kunming University, Kunming, China
- 2College of Tourism and Geographic Sciences, Yunnan Normal University, Kunming, China
- 3State Key Laboratory of Water Resources and Hydropower Engineering Science, Wuhan University, Wuhan, China
- 4Yunnan Institute of Water & Hydropower Engineering Investigation, Design and Research, Kunming, China
The expansion of rubber (Hevea brasiliensis) cultivation plantation over the past few decades has been significantly explosive in Xishuangbanna, southwest China. More and more evidences concerning the expansion of rubber plantations lead to the negative influence to local regional hydrology. It is vital to explore the impact of climate change and rubber (Hevea brasiliensis) plantation expansion on reference evapotranspiration (ET0) for the sustainable and efficient use of regional water resources. In this study, the spatiotemporal variation of ET0 as well as its relationship in rubber plantations area in Xishuangbanna from 1970–2017 were analyzed by using trend, correlation and contribution analysis. The results showed that the rubber plantation was 12,768 ha yr–1 from 1990 to 2017 in Xishuangbanna, and nearly 40.8% of new rubber plantations expanded above 900 m in altitude from 2000 to 2017. Sunshine duration and average relative humidity were the key meteorological factors that affect ET0 in Xishuangbanna, with the sensitivity coefficient of 0.51 and 0.35, respectively. The multiyear relative change of ET0 in Xishuangbanna was 9.18%, and the total contribution of major climate factors was 7.87% during 1970 and 2017. The average relative humidity in the plantation area decreases, which directly leads to the increase of ET0. The amount of ET0 change from 2000 to 2017 affected by climate change increased at 3.13 mm/10a, whereas it was 2.17 mm/10a affected by the expansion of rubber plantations by quantitative separation. ET0 was significantly affected by climate change but intensified by the expansion of rubber plantation.
Introduction
Evapotranspiration (ET) is one of the most important elements in the water cycle of ecosystem and a key factor in the regional water balance. Reference evapotranspiration (ET0) is considered as a crucial factor in hydrological and climate research. The detail of ET0 has an important practical significance for analyzing the influence of climate and rubber plantation expansion on regional water resources planning, agricultural planting structure adjustment, and ecological environment protection (Jiao et al., 2020; Xiang et al., 2020; Yang et al., 2021).
Climate and land use and cover change (LUCC) have a strong influence on ET0 (Odongo et al., 2019; Zhang et al., 2019; Hu et al., 2021). However, few studies attempted to assess the impact of climate change and commercial agricultural activities such as deforestation. Deforestation is considered as an important anthropogenic process affecting climate and hydrology.
Natural forests and agricultural farming have given ways to commercial agriculture in many areas (Fox, 2012), often in the form of tree plantations such as rubber. Driving by rubber price, expansion rubber plantations have been exploded. Rubber is likely to continue to be one of the fastest-growing land cover types in the world in the coming decades because of their increasing product demand (Warren-Thomas et al., 2015). Furthermore, rubber plantations that expand from traditional areas to uplands with serious negative impacts on the local hydrological cycle cause its high water demand (Tan et al., 2011; Ling et al., 2021).
Meteorological variables such as temperature, wind speed, rainfall, and solar radiation lead to changes in ET0. Changes in ET0 under climate change depend on these meteorological variables and their interactions.
Decreases in sunshine duration, average relative humidity, wind speed, and saturated water vapor pressure can lead to decreases in ET0 (Abtew et al., 2015; Wang et al., 2017). The increase in temperature would lead to the decrease of ET (Fu et al., 2009; Zhang et al., 2013; Pan et al., 2019).
However, changes in meteorological variables are not evenly distributed on the Earth. Globally, for example, RH increased by 0.5%–2.0% per decade over most of the United States, India, and China during the period 1976–2004. There is significant increase in ETo at cold and dry steppe sites (Ghafouri-Azar et al., 2018; Ahmad et al., 2019; D’Andrea et al., 2019; Hwang et al., 2019; You et al., 2019), whereas ET0 decreases in humid regions such as Iran and most parts of China (Xu et al., 2018; Nouri and Bannayan, 2019) which include the Yangtze River Delta (Xu et al., 2017). Despite the significant impact of ET0 on water resources and ecology, there is very limited knowledge on ET0 changes and causes of changes in the tropics area (Pour et al., 2020).
Chen and Huo (2016) used a demeteorological factor trend method to assess the impact of climate change on ET0 in the Heihe River Basin. Hu et al. (2021) proved that the expansion of rice area because of human activities was an important factor influencing the change in ET0 by trend, correlation, and contribution analyses. Some studies have been conducted on the trends and effects of ET0 in southwest China. For instance, sunshine duration, wind speed, and relative humidity are the main factors influencing ET of reference crops in southwest China. ET0 increases in spring, autumn, and winter because relative humidity decreases, and ET0 decreases in summer because sunshine duration decreases (Zhang Q. W. et al., 2016). However, the influence of climate on ET0 in rubber plantation areas is not clear.
Xishuangbanna, an important rubber plantation area in the southwest China since 1950s. Driven by rising prices, the expansion of rubber plantations led to dramatic changes in land use and cover change and they were expanded to higher altitude mountains resulting in a dramatic reduction and fragmentation of natural forest area. Furthermore, rubber plantation expansions caused changes in regional microclimate such as temperature increase, humidity decrease, rainfall decrease, and drought (Gong and Ling, 1996; Qiu, 2009; Lin et al., 2016; Ma et al., 2019; Chiarelli et al., 2020).
In general, there are few studies on the effects of afforestation and other human activities on ET0, especially in areas of large expansions of rubber forests. There is a need to systematically explore the effects of increasing rubber forest plantation areas on ET0.
Most of the available studies on spatial and temporal changes in ET0 of southwest China have focused on trend studies (Shen et al., 2017; Liu et al., 2018) with quantitative analysis of sensitivity coefficients and contributions of meteorological factors to ET0. However, few studies separate the effects of climate change and rubber plantation expansion on regional ET0.
It is important to figure out the impact of climate change under natural conditions and the expansion of rubber forest area caused by human activities on regional ET0 changes.
Thus, we took Xishuangbanna as the study area to conduct these studies: (1) to identify and extract rubber plantations information from 1990 to 2017 using Landsat TM/ETM/OLI images as the basic remote sensing data to analyze the spatial and temporal expansion pattern of rubber plantation; (2) to calculate ET0 to combine the daily meteorological observation data from 1970 to 2017 at each meteorological station in the study area with Penman–Monteith formula. We also use sensitivity and contribution analysis to determine the main meteorological influencing factors affected ET0 in Xishuangbanna; and (3) to isolate the effects of climate change and rubber plantation expansion on regional ET0 changes after compared with the control area not affected by rubber expansion planting.
Materials and Methods
Study Area
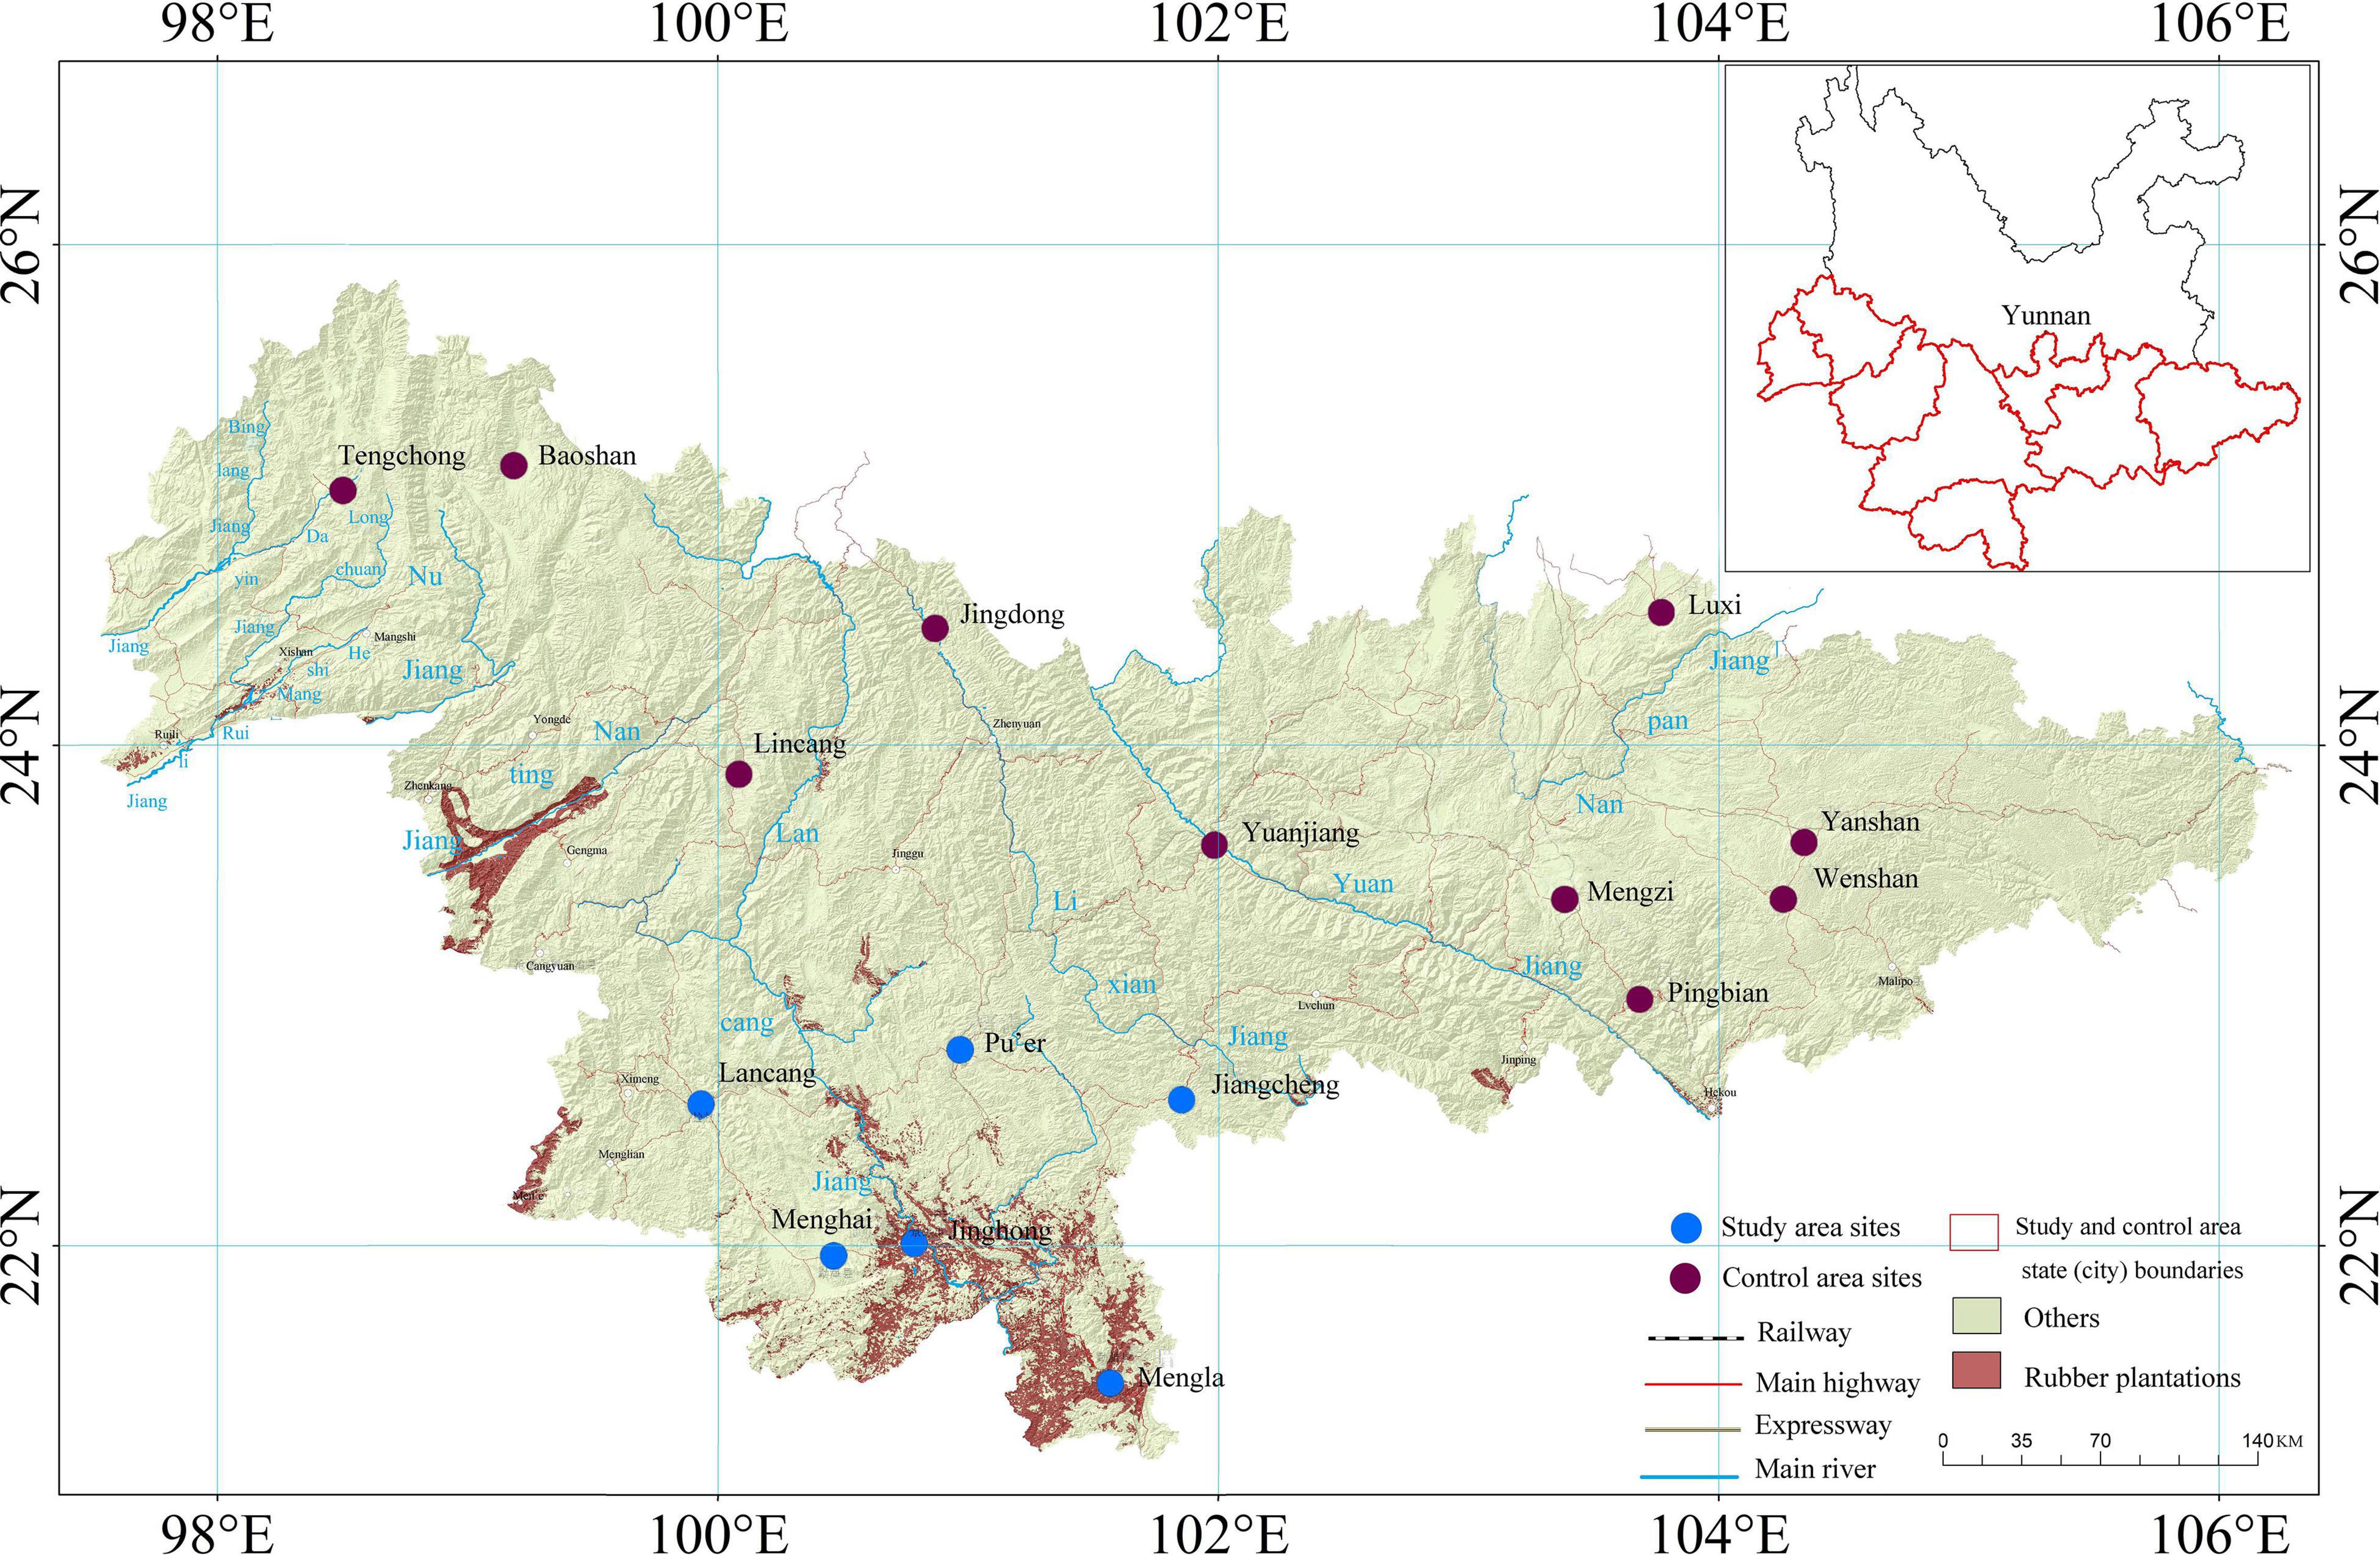
Xishuangbanna is located in the southwest China, Yunnan Province (N 21°10′−22°40′, E 99°55′−101°50′). Its total area is 1.97 × 10⁴ km2 including 3 prefecture-level cities: Menghai, Mengla, and Jinghong (Zhou et al., 2021). Xishuangbanna is located in the longitudinal valley with a mountainous area of more than 95% and is a low-latitude mountainous area which is controlled and influenced by the warm and humid monsoon with humid, high temperature, and calm wind (Zhang, 1963), as shown in Figure 1.
The temperature is 18°C–22°C, with an annual average temperature of 21.5°C. The annual average duration of sunshine is 1,853.4 h, and the annual average precipitation is 1,599.5 mm. The average relative humidity is about 86% (Ling, 2021).
Data
Landsat TM/ETM/OLI images were used as the base remote sensing data. The data source was USGS data platform1 with a spatial resolution of 30 m by containing multiple spectral bands. The Landsat data level 1 products were used after geometrically corrected and preprocessed using ENVI 5.5 software. The elevation DEM data from the geospatial data cloud platform (see text footnote 1), spatial resolution is 30 m, mainly used to extract slope, slope direction and elevation.
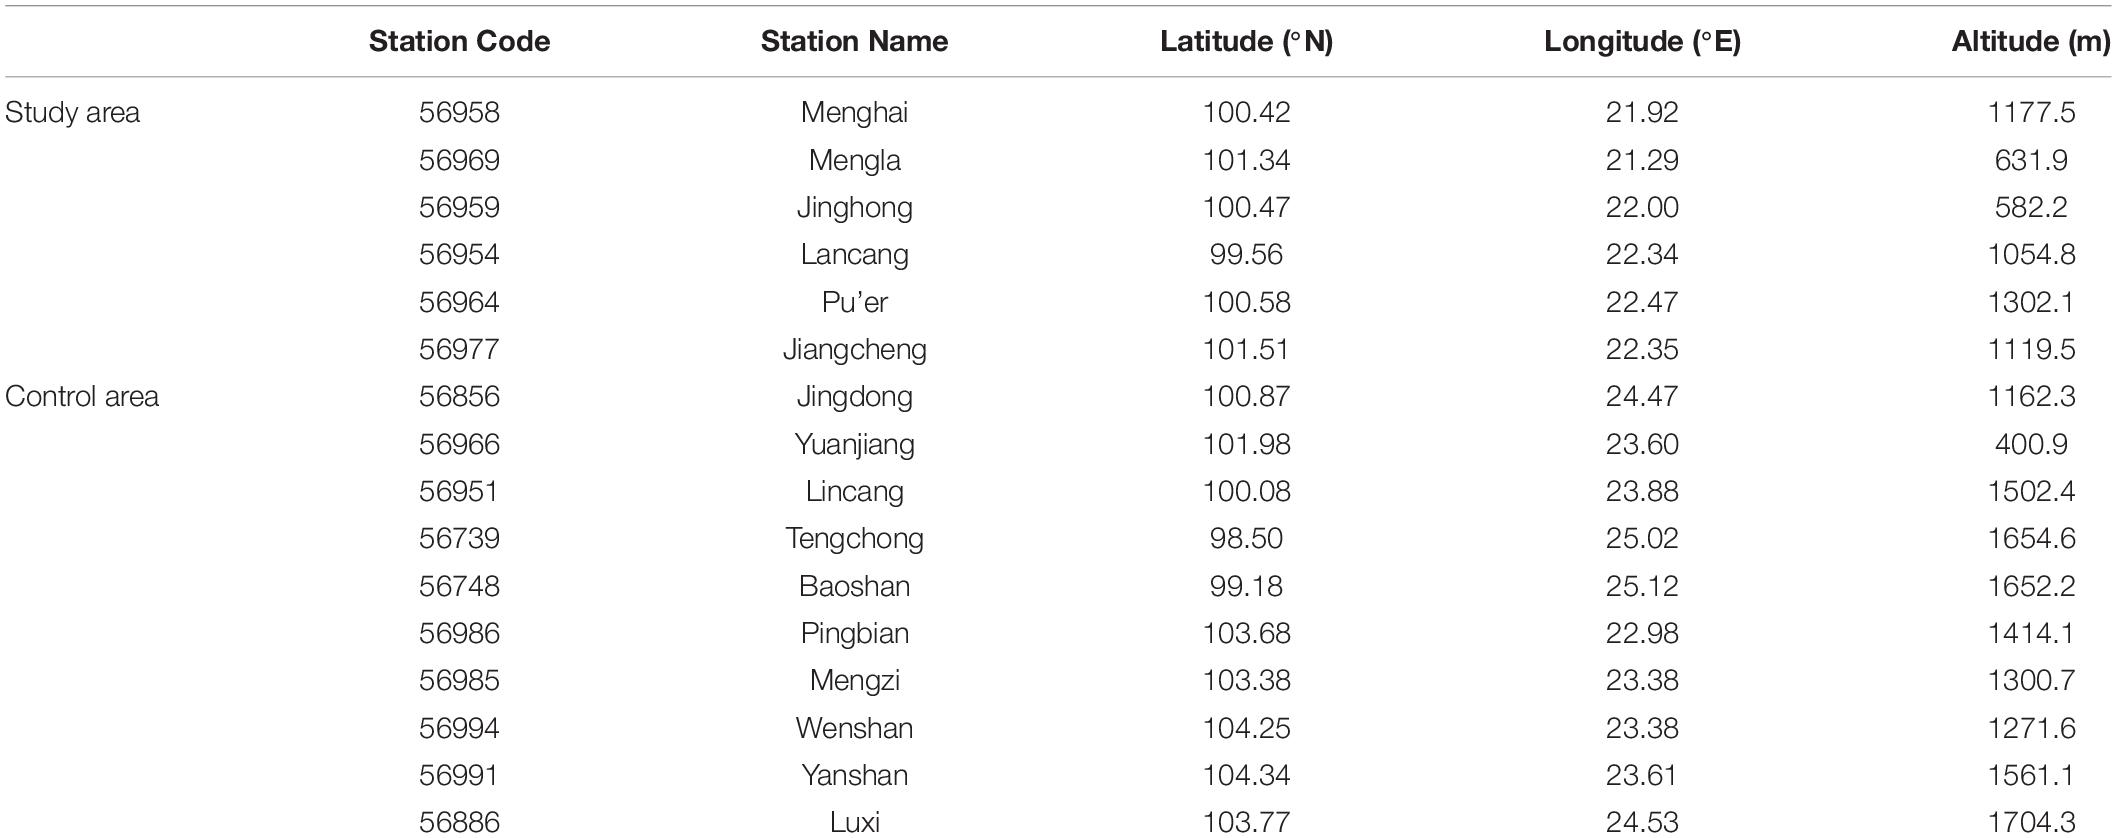
The meteorological data include (1) the daily meteorological data from 1970 to 2017 of 6 typical meteorological stations including Menghai, Mengla, Jinghong, Lancang, Jiangcheng, and Pu’er in rubber plantation areas of Xishuangbanna; (2) the daily meteorological data from 1970 to 2017 from 10 typical stations in southwest Yunnan, including Jingdong, Yuanjiang, Lincang, Tengchong, Baoshan, Pingbian, Mengzi, Wenshan, Yanshan, and Luxi which share the same climate control area, as shown in Table 1.
Methods
Identification and Extraction of Rubber Plantation
We use the object-oriented classification method to extract rubber plantations in a hierarchy of typical time windows from February to March by combining the topography of Xishuangbanna and rubber plantation phenology features by ArcGIS 10.2 (Liang et al., 2015; Liu et al., 2017). The remote sensing data on February 22, 1990, February 25, 2000, February 22, 2010, and February 27, 2017 were selected to extract the information of rubber plantation in Xishuangbanna to obtain its spatial distribution in the corresponding years. The detailed scheme is shown in Figure 2.
The Calculation of ET0
The FAO-56 Penman–Monteith equation (Allen et al., 1998) is as follows:
where ET0 is the reference evapotranspiration, mm/d; G is the soil heat flux in the study area, MJ/m2⋅day; Rn is the net canopy surface radiation, MJ/m2⋅day; u2 is the mean wind speed at 2m, m/s; T is the mean air temperature, °C; ea is the actual water vapor pressure, kPa; es is the saturated water vapor pressure, kPa; γ is the hygrometer constant, kPa/°C; and Δ is the saturated water vapor pressure-temperature slope, kPa/°C.
Line Trend Analysis and Manne-Kendall Test
The linear regression model is used to estimate the trend of time series change. The fitting equation is (Ye et al., 2014) as follows:
where y is the corresponding value of ET0 (or season) and other climatic factors; a is the tendency rate of the trend, and the positive (or negative) value of a represents the increasing (or decreasing) trend of variable y; b is intercept; and t is time series (years). Significance of ET0 trend assessed using nonparametric M-K test (Li et al., 2016; Feng et al., 2017; Fu, 2018).
Combined with M-K trend method for analysis (Yavuz, 2018):
where ETj is the value of jth data, sgn is the defined sign function; n is the length of the time series, when n ≥ 8, the statistic S approximately obeys normal distribution (Mann, 1945; Kendall, 1975), Var(S) is the variance of the statistic S; the significance of the trend is tested at α significance level; when the confidence level α = 0.05, 0.1, that is | Z| > 1.96, 1.645, it means that the time series is significant and weakly significant, respectively; when | Z| < 1.645, it means that the time series change is not significant.
The statistics constitute the positive time series UF curve. Based on the same steps, the inverse series statistic is obtained using the time series reversal sample (k = n,n-1,…,1), when the two curves UF and UB intersect within the confidence interval. The intersection point is a mutation point if the UF statistic is outside of the confidence interval (with 95% confidence level).
Sensitivity Analysis and Contribution Rate of Meteorological Factors
The influence of meteorological factors on ET0 can be quantified by sensitivity (McCuen, 1974; Beven, 1979; Goyal, 2004; Jia et al., 2016):
where SVi is the sensitivity coefficient; Vi is a meteorological element; ± SVi indicates that ET0 increases (or decreases) as Vi value increases; and —SVi— indicates the sensitivity of Vi to ET0.
Contribution of meteorological element Vi to ET0 change (Yin et al., 2010, 2020):
where ConVi is the contribution of meteorological element Vi to the change of ET0, %; RCVi is the multiyear relative change of Vi, %; av is the average value of meteorological factor Vi for many years; n is time series, year; trend is the annual change rate of meteorological factor Vi.
The total contribution of each meteorological factor to the change of ET0 is as follows:
where ConET0 is the total contribution of meteorological elements to ET0; ConTA, ConWS, ConRH, and ConSD represent the contribution of air temperature, wind speed, average relative humidity, and solar radiation to ET0 change.
Assessment of ET0 Change in Rubber Plantation Expansion
To quantify the contribution of climate change and rubber plantation expansion to ET0, the following analyses were conducted in the study and control areas:
(1) We propose a hypothesis that the area of rubber plantations in the study area did not change during this period, and then, any change in ET0 in the area is caused by climate change, as ΔET0 = ΔEToclimate and ΔET0rubber = 0; (2)We assume that the area under rubber plantations in the study area did not change during this period, and then, any change in ET0 in the area is caused by climate change.
Therefore, since the impact of climate change on ET0 in a region is the same, the impact of rubber plantation expansion on ET0 in that region can be identified quantitatively by eliminating the impact of climate change on ET0 in that region (Li, 2017; Li et al., 2017; Hu et al., 2021).
where ΔET0 is the annual change of ET0; ΔET0s is stationary ET0 (recalculated using the detrended data series); ΔET0 climate and ΔET0 rubber are the change of ET0 affected by climate change and expansion of rubber plantation, respectively.
Results and Analysis
Changes of Rubber Plantation Area in Xishuangbanna
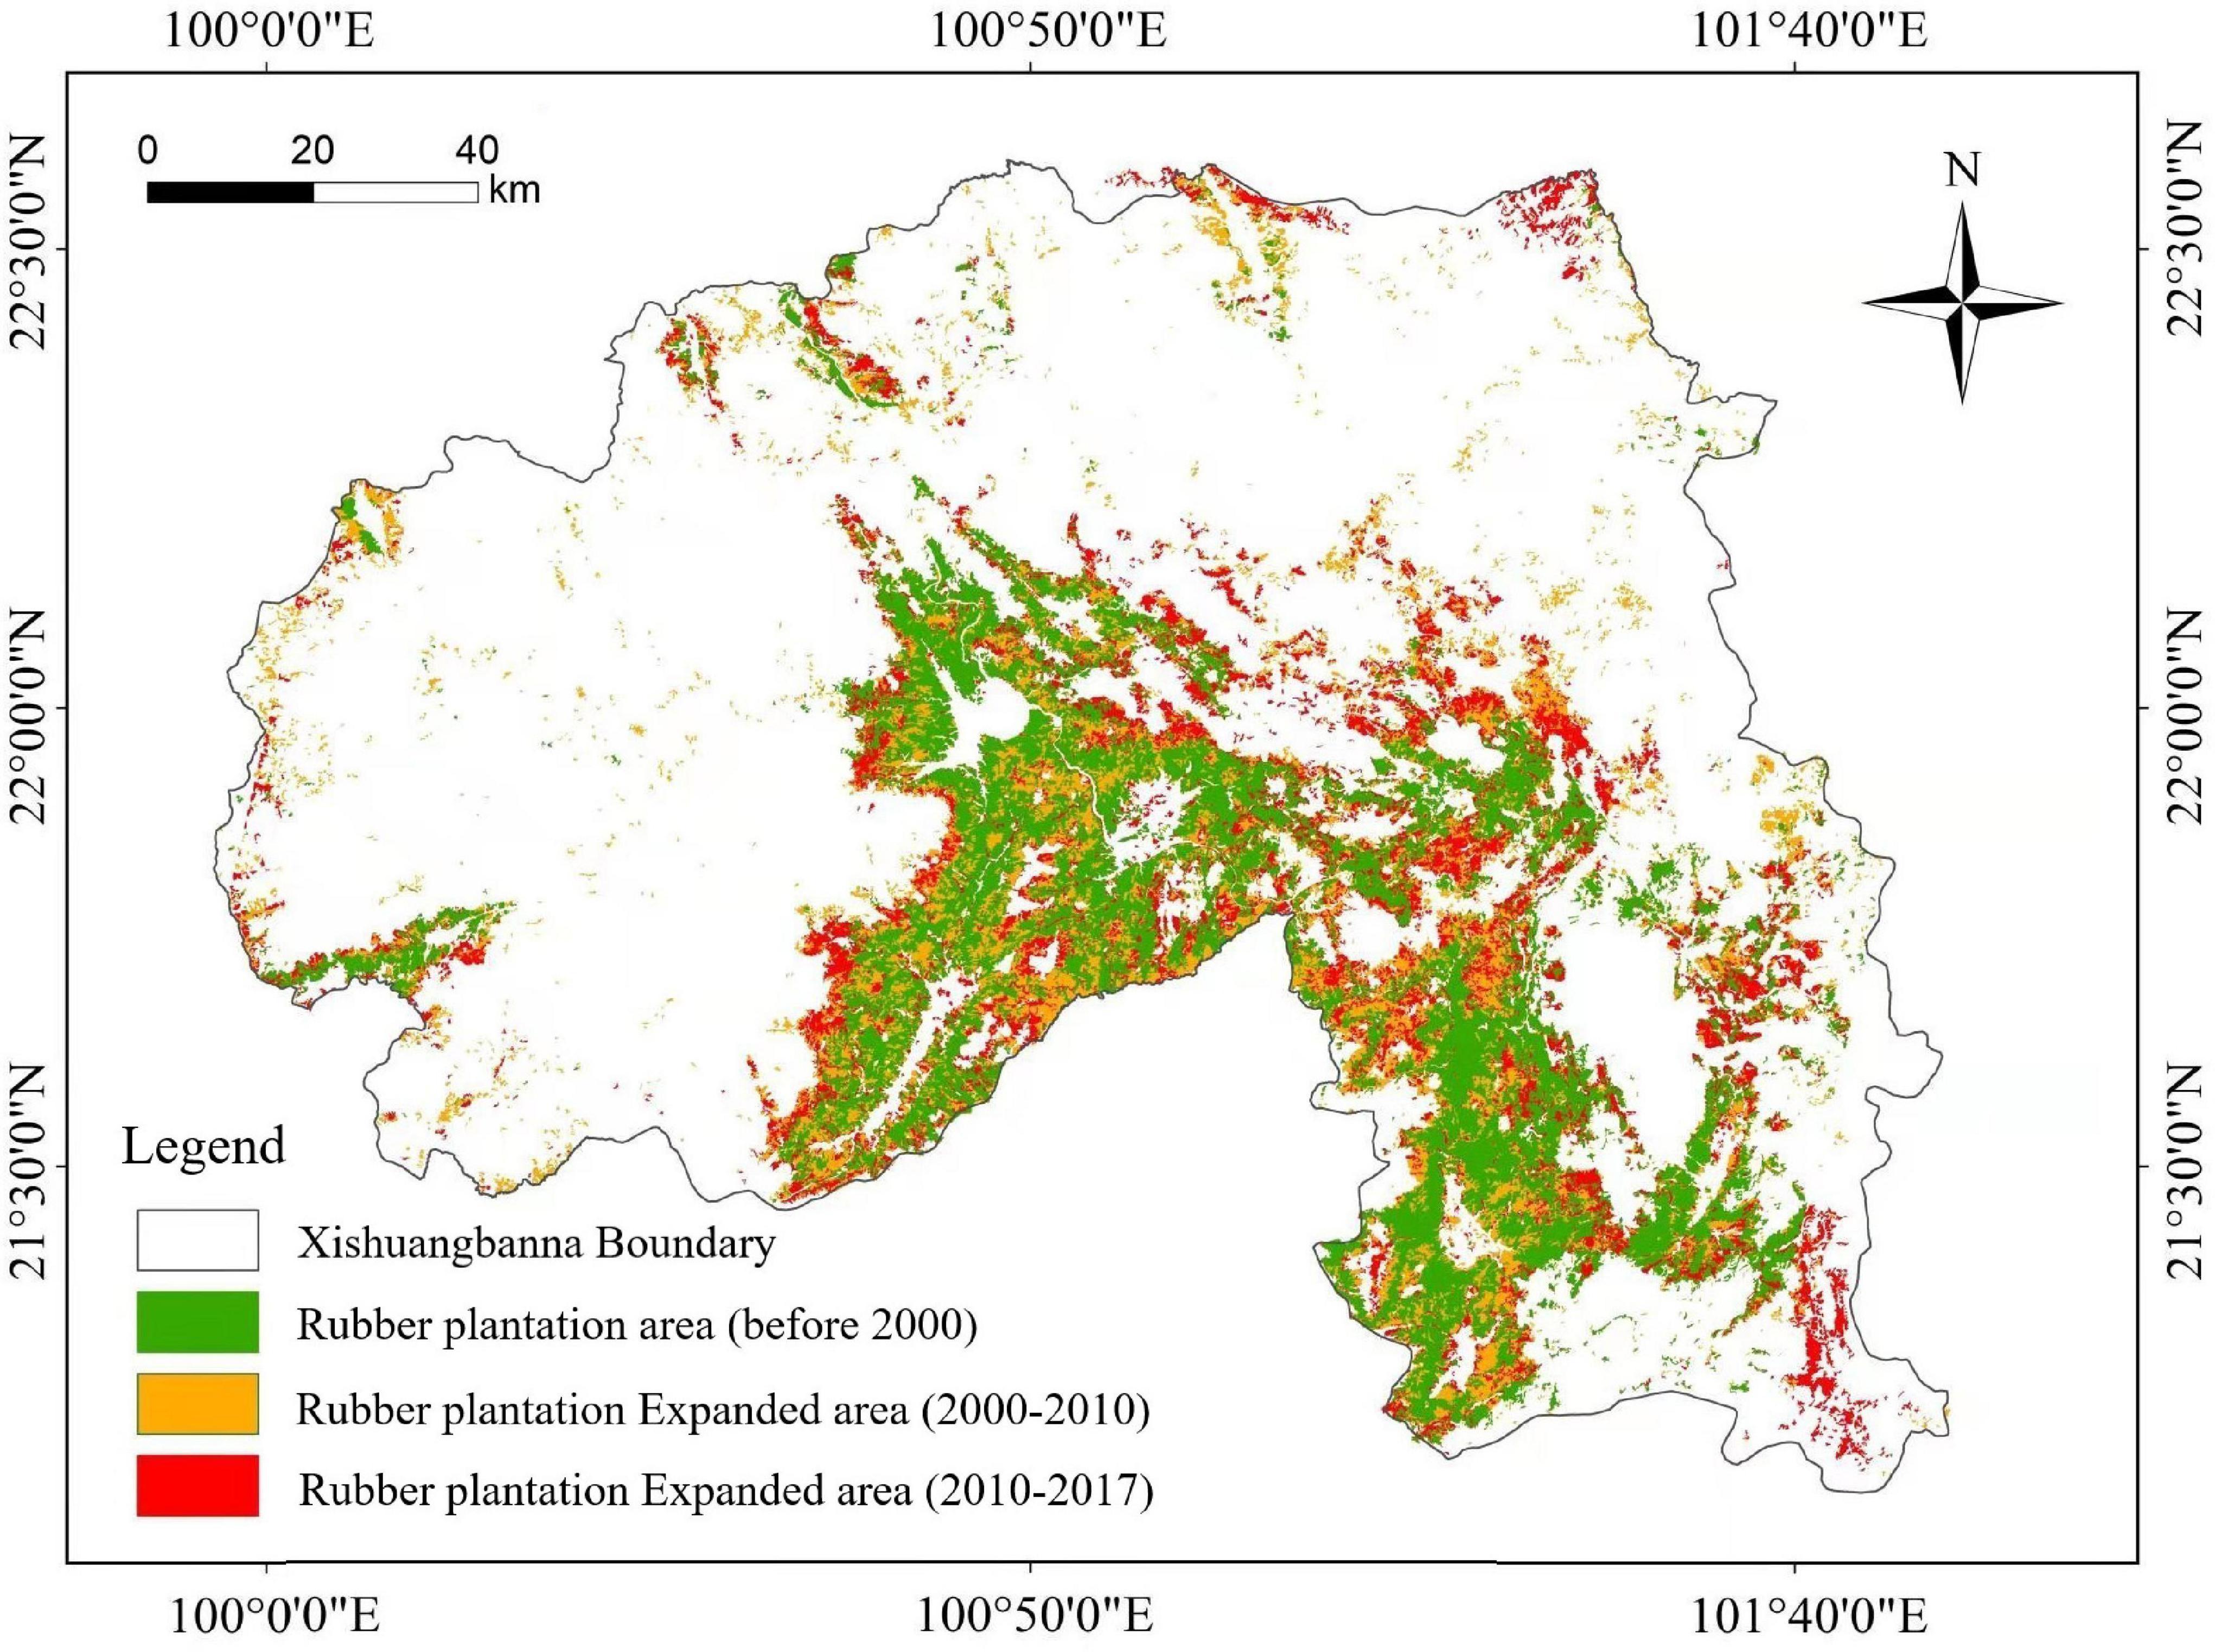
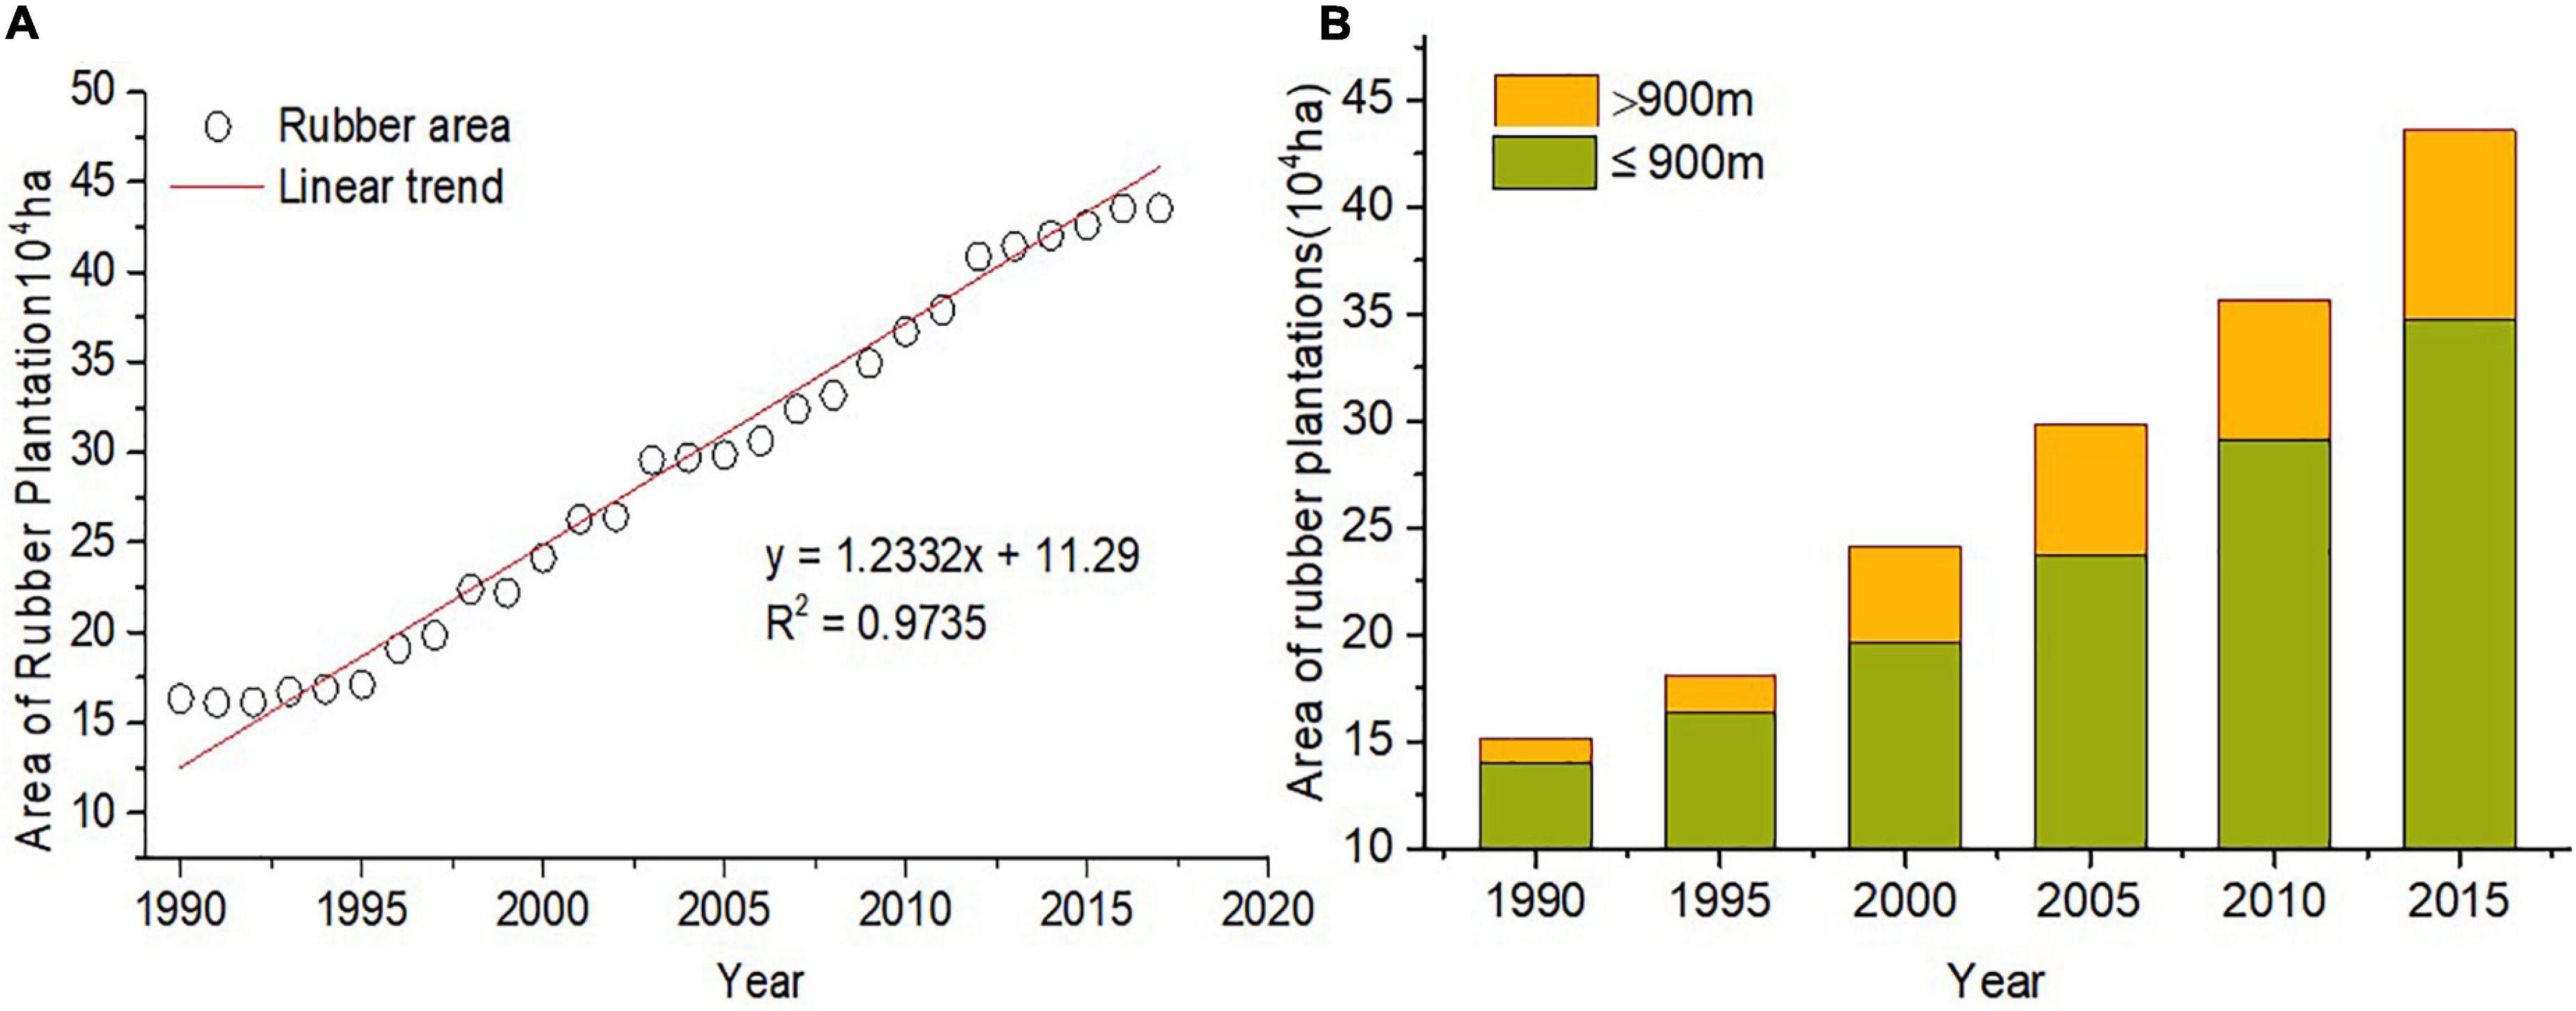
The accuracy of land cover categories from 1990 to 2017 was 87.2% and the Kappa coefficient was 0.85. The distribution of rubber plantations in Xishuangbanna from 1990 to 2017 was plotted according to the optimal partition scale of 100, shape index of 0.6, and tightness index of 0.9 in Xishuangbanna, as shown in Figure 3. The rubber plantation area was 121,164 ha in 1990, increased to 211,357 ha in 2000, 404,552 ha in 2010, and reached 465,904 ha in 2017, which accounts for 6.38%, 11.12%, 21.29%, and 24.52% of the land area in Xishuangbanna, respectively.
Rubber plantation was 12,768 ha yr–1 from 1990 to 2017 in Xishuangbanna. The growth rate was the largest from 2005 to 2010 when the plantation areas were expanded to uplands. About 87.43% of new rubber plantations were below 900 m in altitude from 1990 to 2000. Nevertheless, there are nearly 40.8% of new rubber plantations shifted to above 900 m in altitude from 2000 to 2017, as is shown in Figure 4.
Spatiotemporal Changes in ET0
Analyzing the ET0 at 6 typical meteorological stations in Xishuangbanna from 1970 to 2017, the maximum value was 1,274.66 mm, the minimum value was 1,073.34 mm, and the average value was 1,169.19 mm. The maximum daily ET0 in Xishuangbanna was about 3.5 mm/day. The ET0 of each site showed an increasing trend by M-K test, as shown in Figure 5.
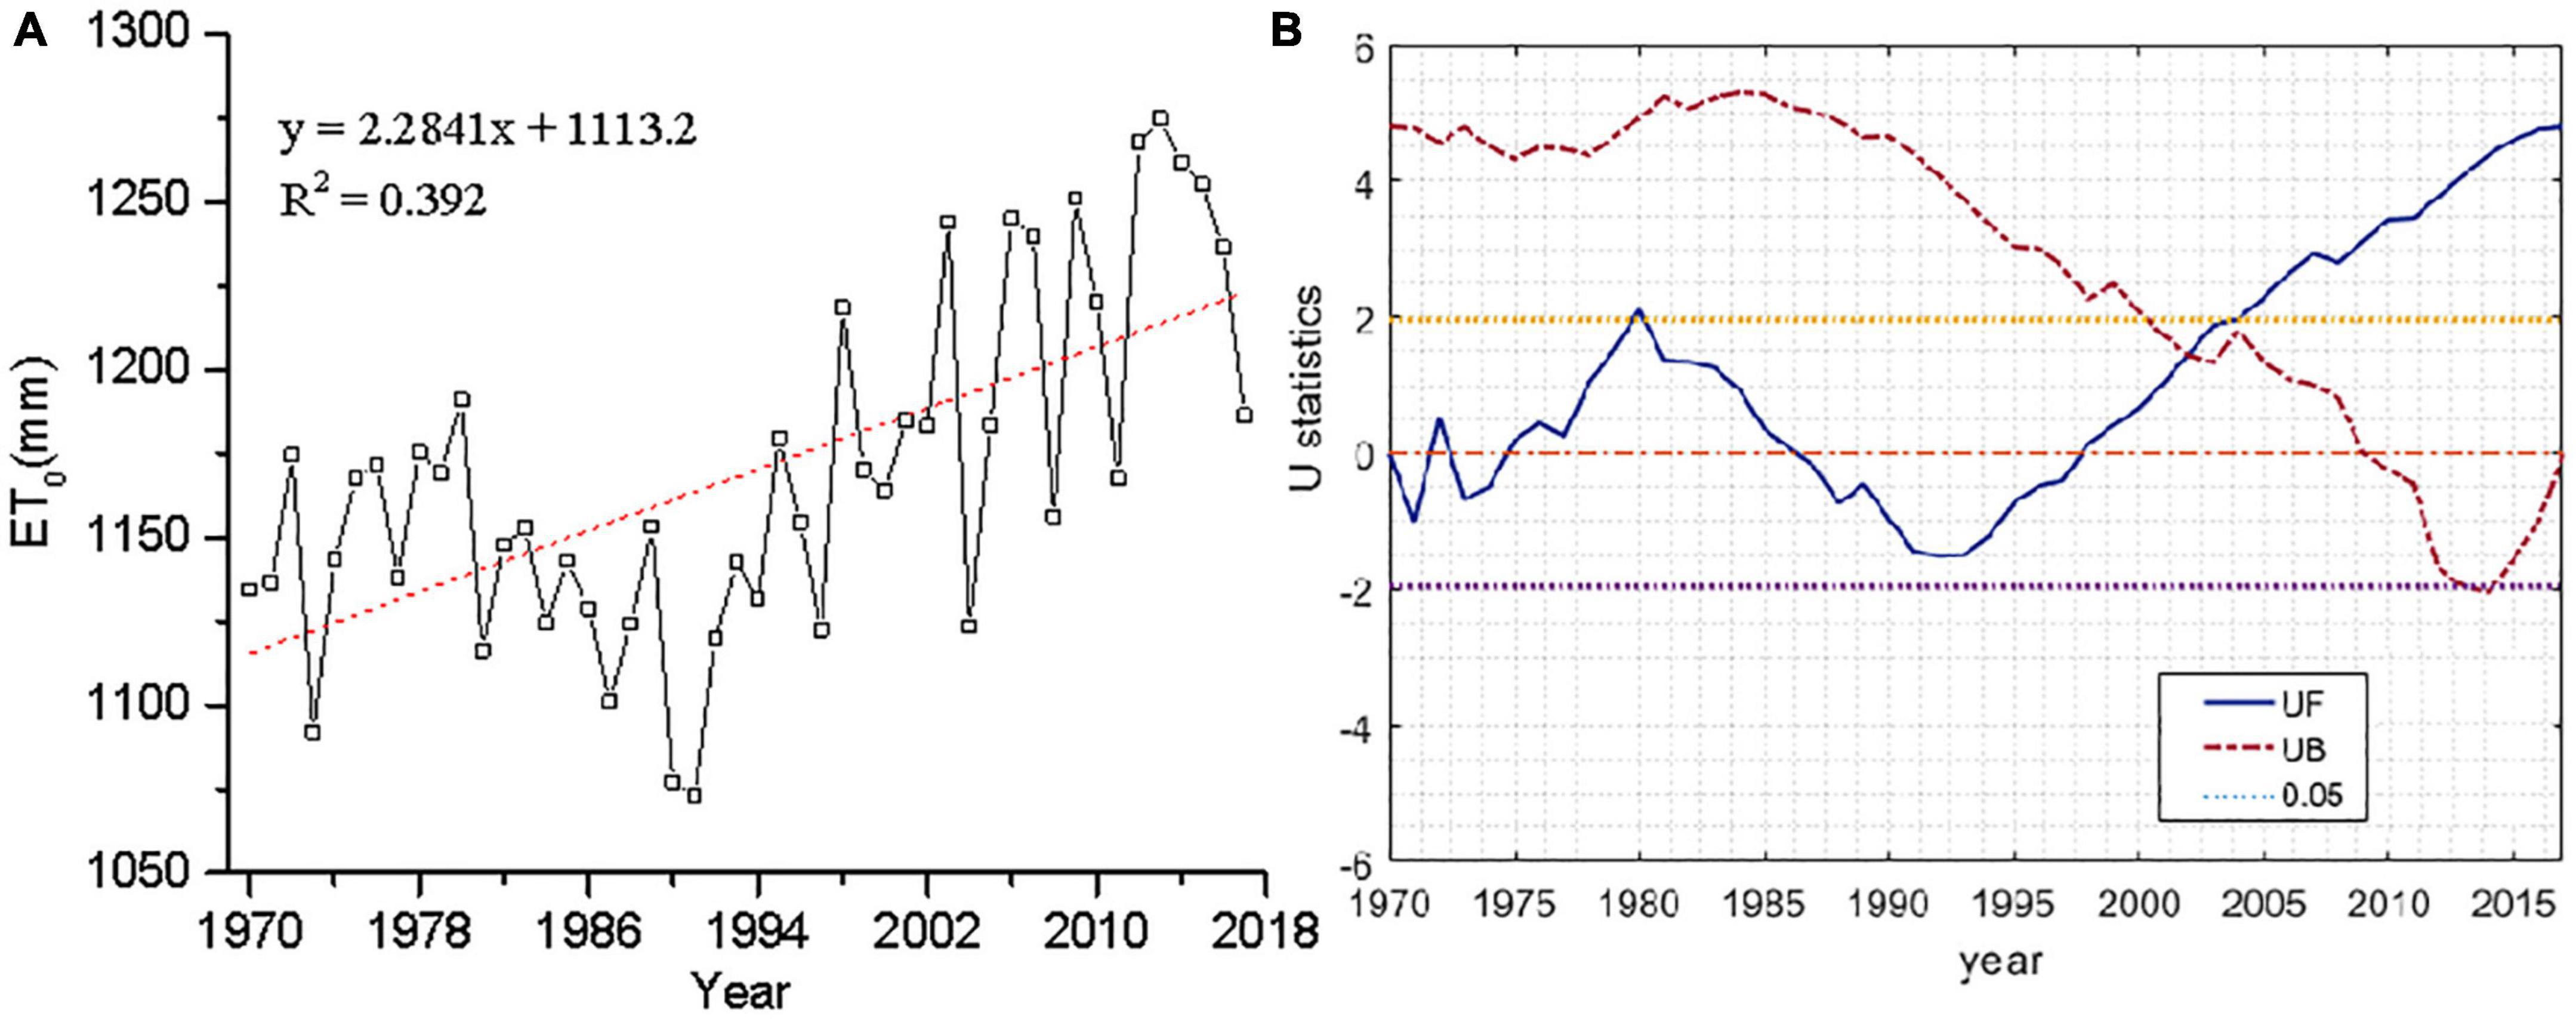
Figure 5. Interannual variation (A) and Manne-Kendall (M-K) mutation analysis (B) of ET0 in Xishuangbanna.
The interannual variation trend of ET0 in Xishuangbanna increased with a trend of 22.84 mm/10a from 1970 to 2017. The abrupt year of ET0 in Xishuangbanna was 2002 by M-K test. It indicates a significant upward change of ET0 in 2002, as shown in Table 2.
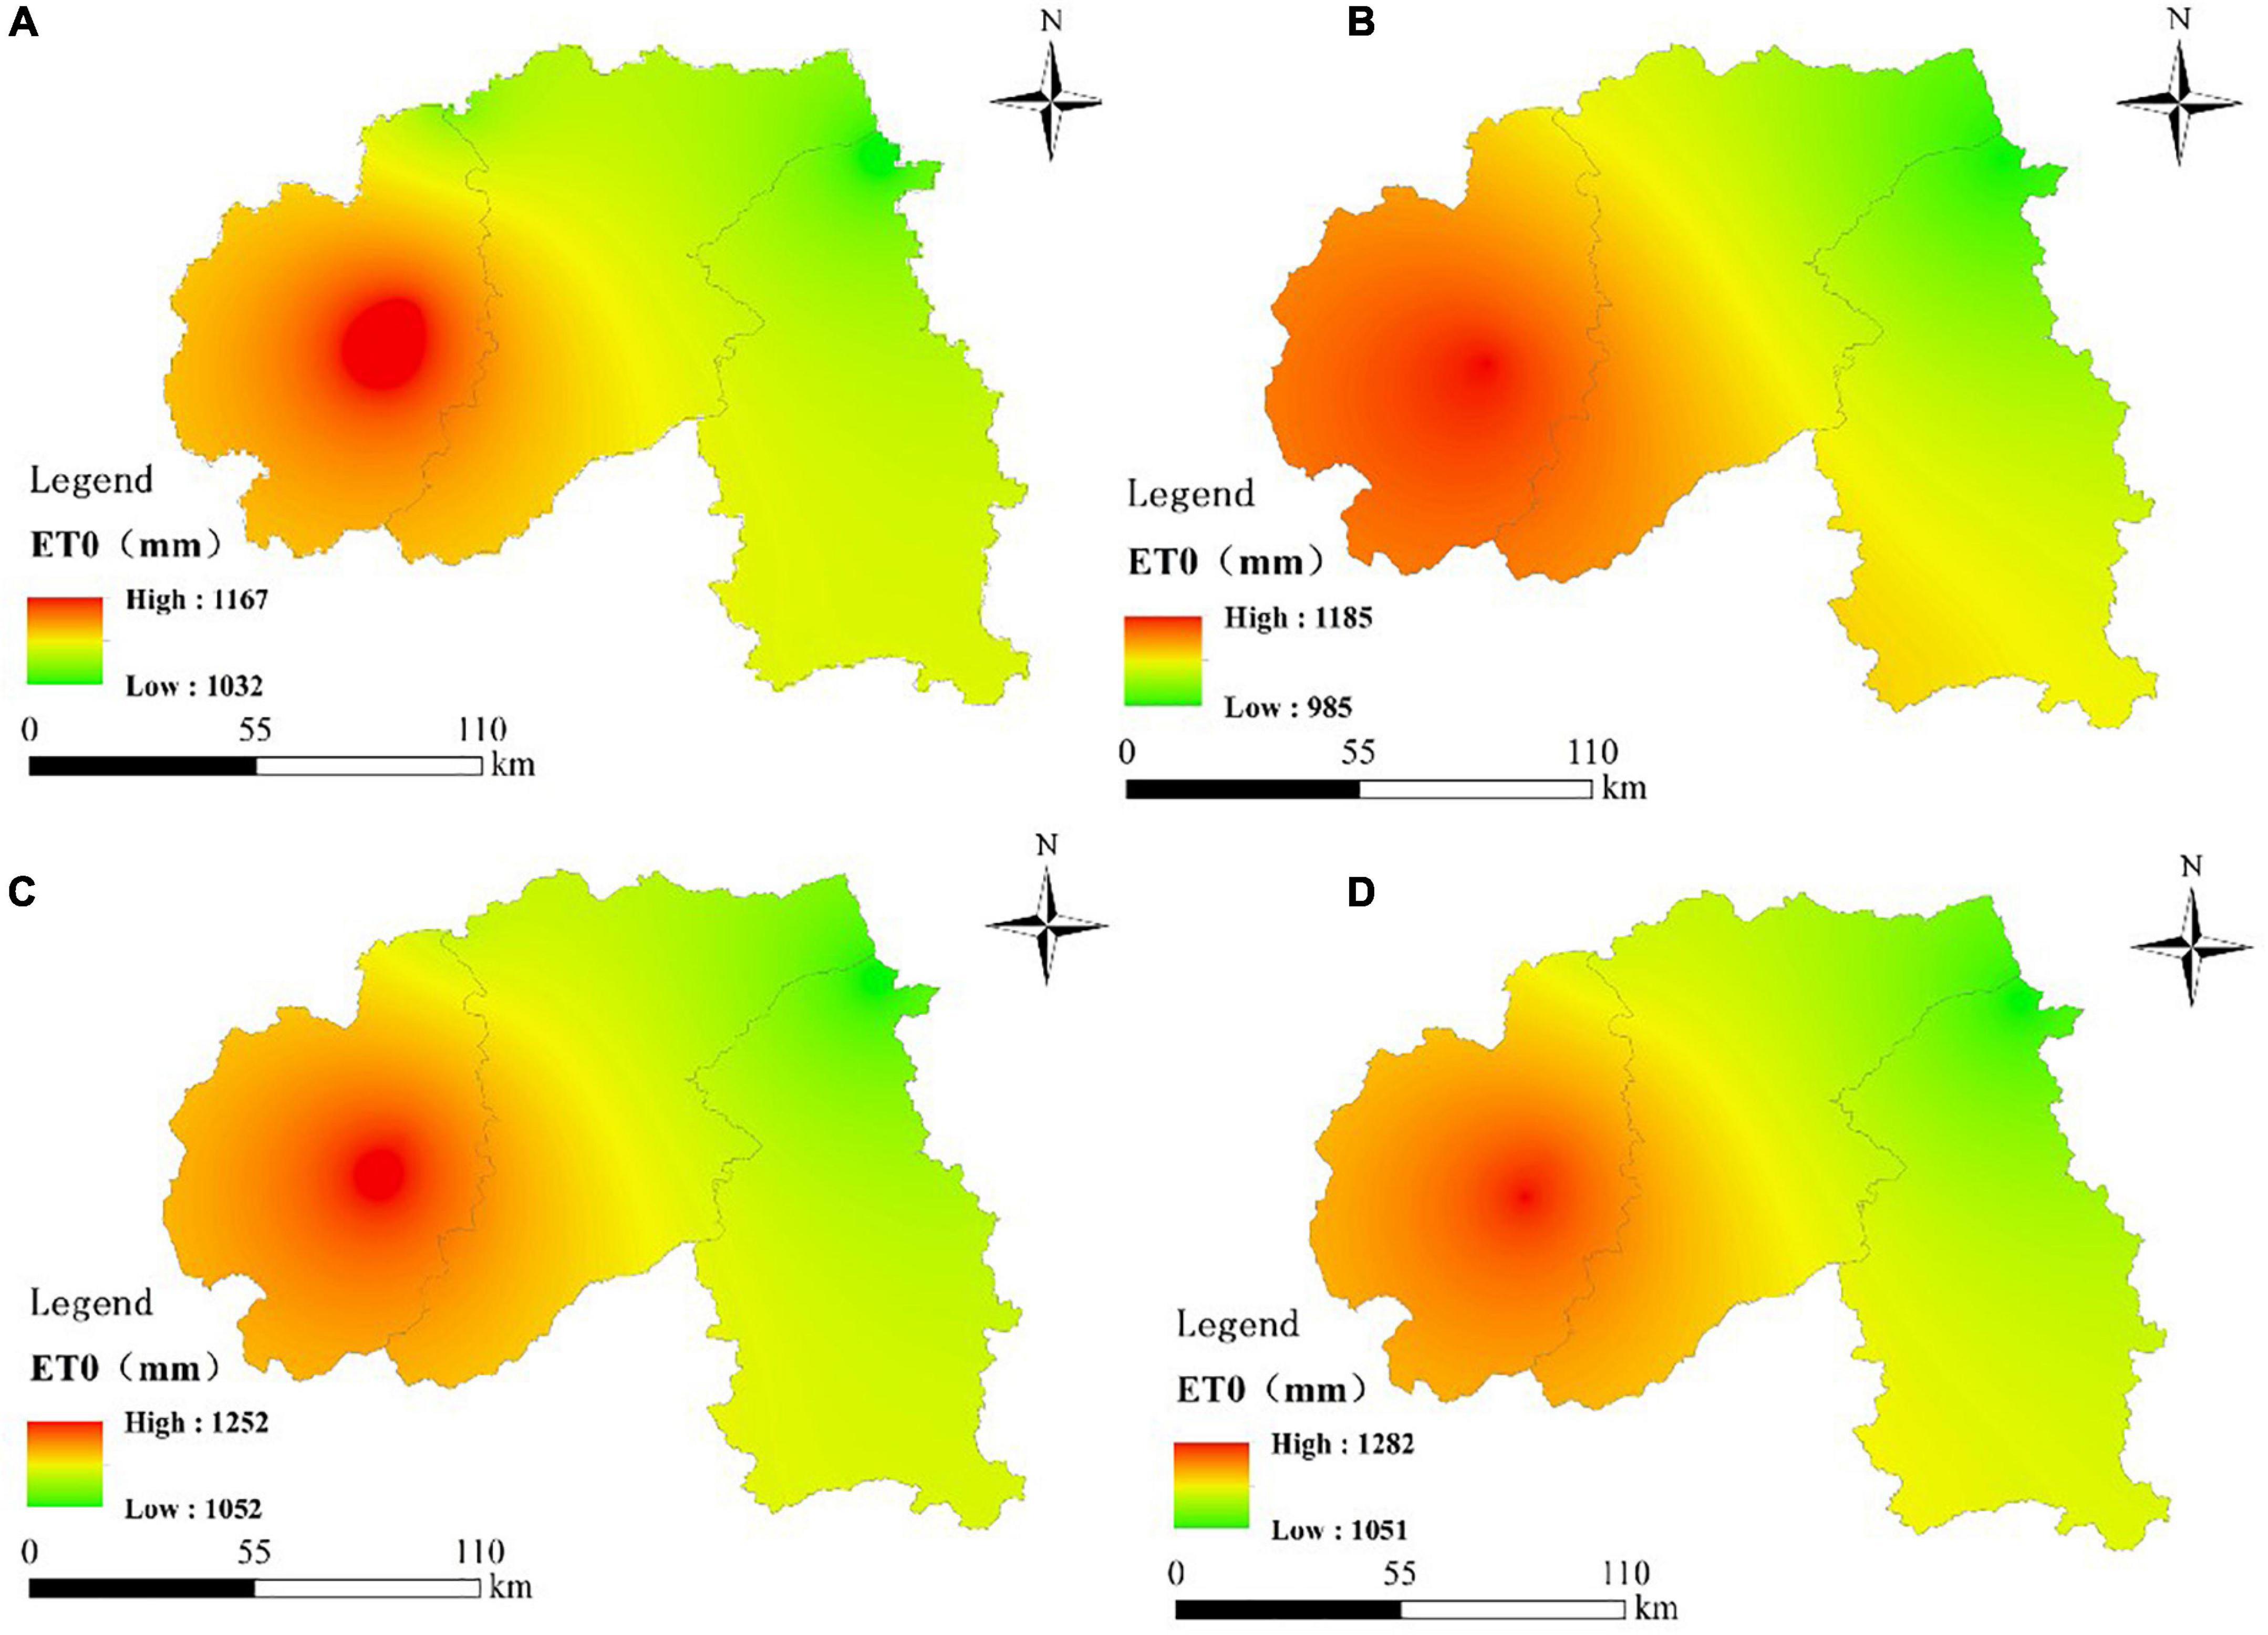
The spatial distribution of ET0 in Xishuangbanna from 1970 to 2017 is shown in Figure 6. The distribution is different in each period. The areas with high ET0 value mainly concentrated in Menghai County in the southwest, which shows high in the southwest and low in the northeast. The range of ET0 changes in Xishuangbanna did not change much in 1970–1990 and 1991–2000 (Figures 6A,B), while the ET0 values increased significantly and the area of high ET0 value expanded after 2000 (Figures 6C,D). The ET0 in Xishuangbanna from 1970 to 2017 showed an increasing trend. Meanwhile, the high ET0 area gradually increased.
Characterization of Meteorological Elements in Rubber Plantation Areas in Xishuangbanna
The meteorological elements in the planting area of Xishuangbanna region from 1970 to 2017 are shown in Table 3. Precipitation in Xishuangbanna decreased at a rate of 0.018mm yr–1. Jinghong had the most obvious precipitation reduction. Sunshine duration increased at a rate of 0.012h d–1yr–1, and the average relative humidity changed at a rate of 0.258%yr–1. Xishuangbanna is a calm wind area with a slight increase in the change rate of wind speed. The average change rate of wind speed is 0.004 m s–1 yr–1. The maximum temperature in Xishuangbanna increased at a rate of 0.029°C yr–1. Menghai was the area with the most significant increase in maximum temperature. The lowest temperature increased at a rate of 0.042°C yr–1, and Pu’er is the most obviously lowest temperature increased. Temperature, sunshine duration, and average wind speed increased, whereas average relative humidity and precipitation decreased in Xishuangbanna from 1970 to 2017, as shown in Table 3.
Attribution Analysis of ET0 Change of in Xishuangbanna
Correlation Analysis Between ET0 of Meteorological Stations and Annual Mean Meteorological Elements
According to formula (1), we selected six meteorological factors for correlation analysis with the annual ET0 in the rubber plantation area of Xishuangbanna, as shown in Table 4.

Table 4. Linear correlation coefficient between ET0 of each station and annual mean meteorological elements.
In the past 47 years, the annual mean ET0 in Xishuangbanna was significantly positively correlated with Tmax and sunshine duration, the correlation coefficients of 0.35–0.73 and 0.37–0.86. It was significantly negatively correlated with RH, and the correlation coefficients of 0.52−0.88 (shown in Table 4). In addition to Tmax, sunshine duration and average relative humidity in Menghai, Jinghong, and Pu’er were negatively correlated with precipitation with correlation coefficients of 0.29, 0.07, and 0.37, respectively. The ET0 decreased because the more precipitation leads to higher average relative humidity and less sunshine duration. Menghai, Jinghong, and Lancang were significantly and positively correlated with wind speed with the correlation coefficients of 0.49, 0.59, and 0.12, respectively. The greater the wind speed, the more increase of ET0.
Sensitivity Analysis of ET0 to Each Meteorological Element
The ET0 in Xishuangbanna showed an increasing trend influenced by the changes in each meteorological factor during 1970 and 2017. The extent to ET0 affected by changes in meteorological factors was quantified by analyzing individual factor sensitivities (Dong et al., 2019).
The sensitivity coefficients of different station meteorological variables on ET0 variation in Xishuangbanna region are shown in Table 5. The effects of temperature, wind speed, and sunshine duration on ET0 variation were positive, whereas the effects of average relative humidity on ET0 variation were relatively negative. Sunshine duration is the most sensitive meteorological factor for ET0 changes in the region with a mean sensitivity coefficient of 0.51. The mean wind speed is 0.09, which is the lowest factor.
All the meteorological factors showed positive contributions to the ET0 among which sunshine duration had the largest contribution and then followed by average relative humidity, whereas wind speed had the lowest contribution because of its low sensitivity coefficient to ET0.
As shown in Table 6, the contribution of each meteorological factor to ET0 was positive during 47 years in which the contribution of sunshine duration was the highest about 3.41. Then, average relative humidity is 1.65. Wind speed had relative high variations but the low sensitivity coefficient to ET0 that the total contribution was 1.34. Totally, the annual relative variation of ET0 and the main meteorological factors contributed is 9.18% and 7.87% in Xishuangbanna.
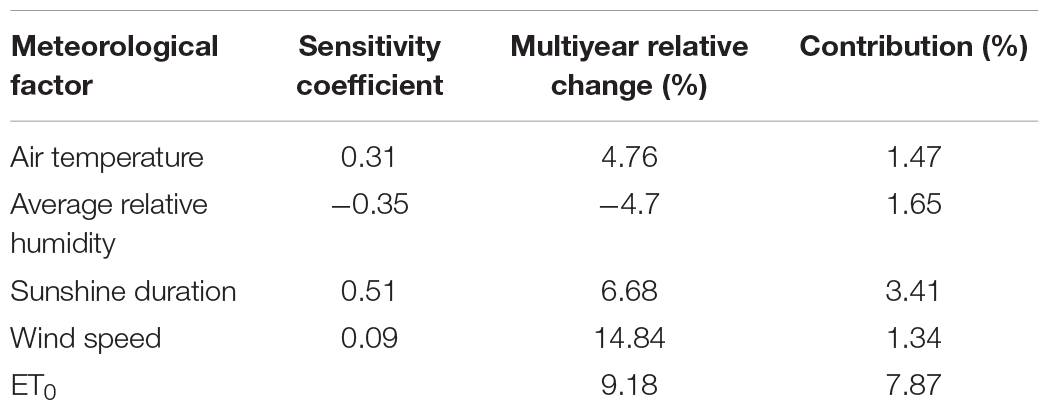
Table 6. Sensitivity coefficient of meteorological elements in Xishuangbanna, their relative changes over the years and their contributions to ET0 change.
Response of Climate Change and Rubber Plantation Expansion to ET0
Average relative humidity and sunshine duration are the key influential meteorological factors that affect ET0 in Xishuangbanna by sensitivity and contribution analysis. It can be inferred that rising sunshine duration and decreasing average relative humidity caused the increase of ET0 in Xishuangbanna from 1970 to 2017. The increase in sunshine duration promotes evaporation rate whereas the decrease in average relative humidity characterizes the decrease in water vapor content in the subsurface.
A significant trend of increasing ET0 in 2000 which was coupled with rubber plantation expansion by M-K analysis of ET0 in Xishuangbanna. Hence, the changes in average relative humidity and sunshine duration in Xishuangbanna after 2000 were analyzed to discuss the effects of climate change and rubber plantation expansion on ET0.
As shown in Figure 7, the average relative humidity in Xishuangbanna for 47 years showed a decreasing trend. During 2000, it was 1.08%/10a from 1970 to 2000 and 1.97%/10a from 2000 to 2017 with a significant decrease trend of 45.18% in average relative humidity. The decreasing trend of sunshine duration averaged 18.5h/10a from 1970 to 2000, which shows an upward trend averaged 7.44h/10a, and an increase trend of 59.78% from 2000 to 2017.
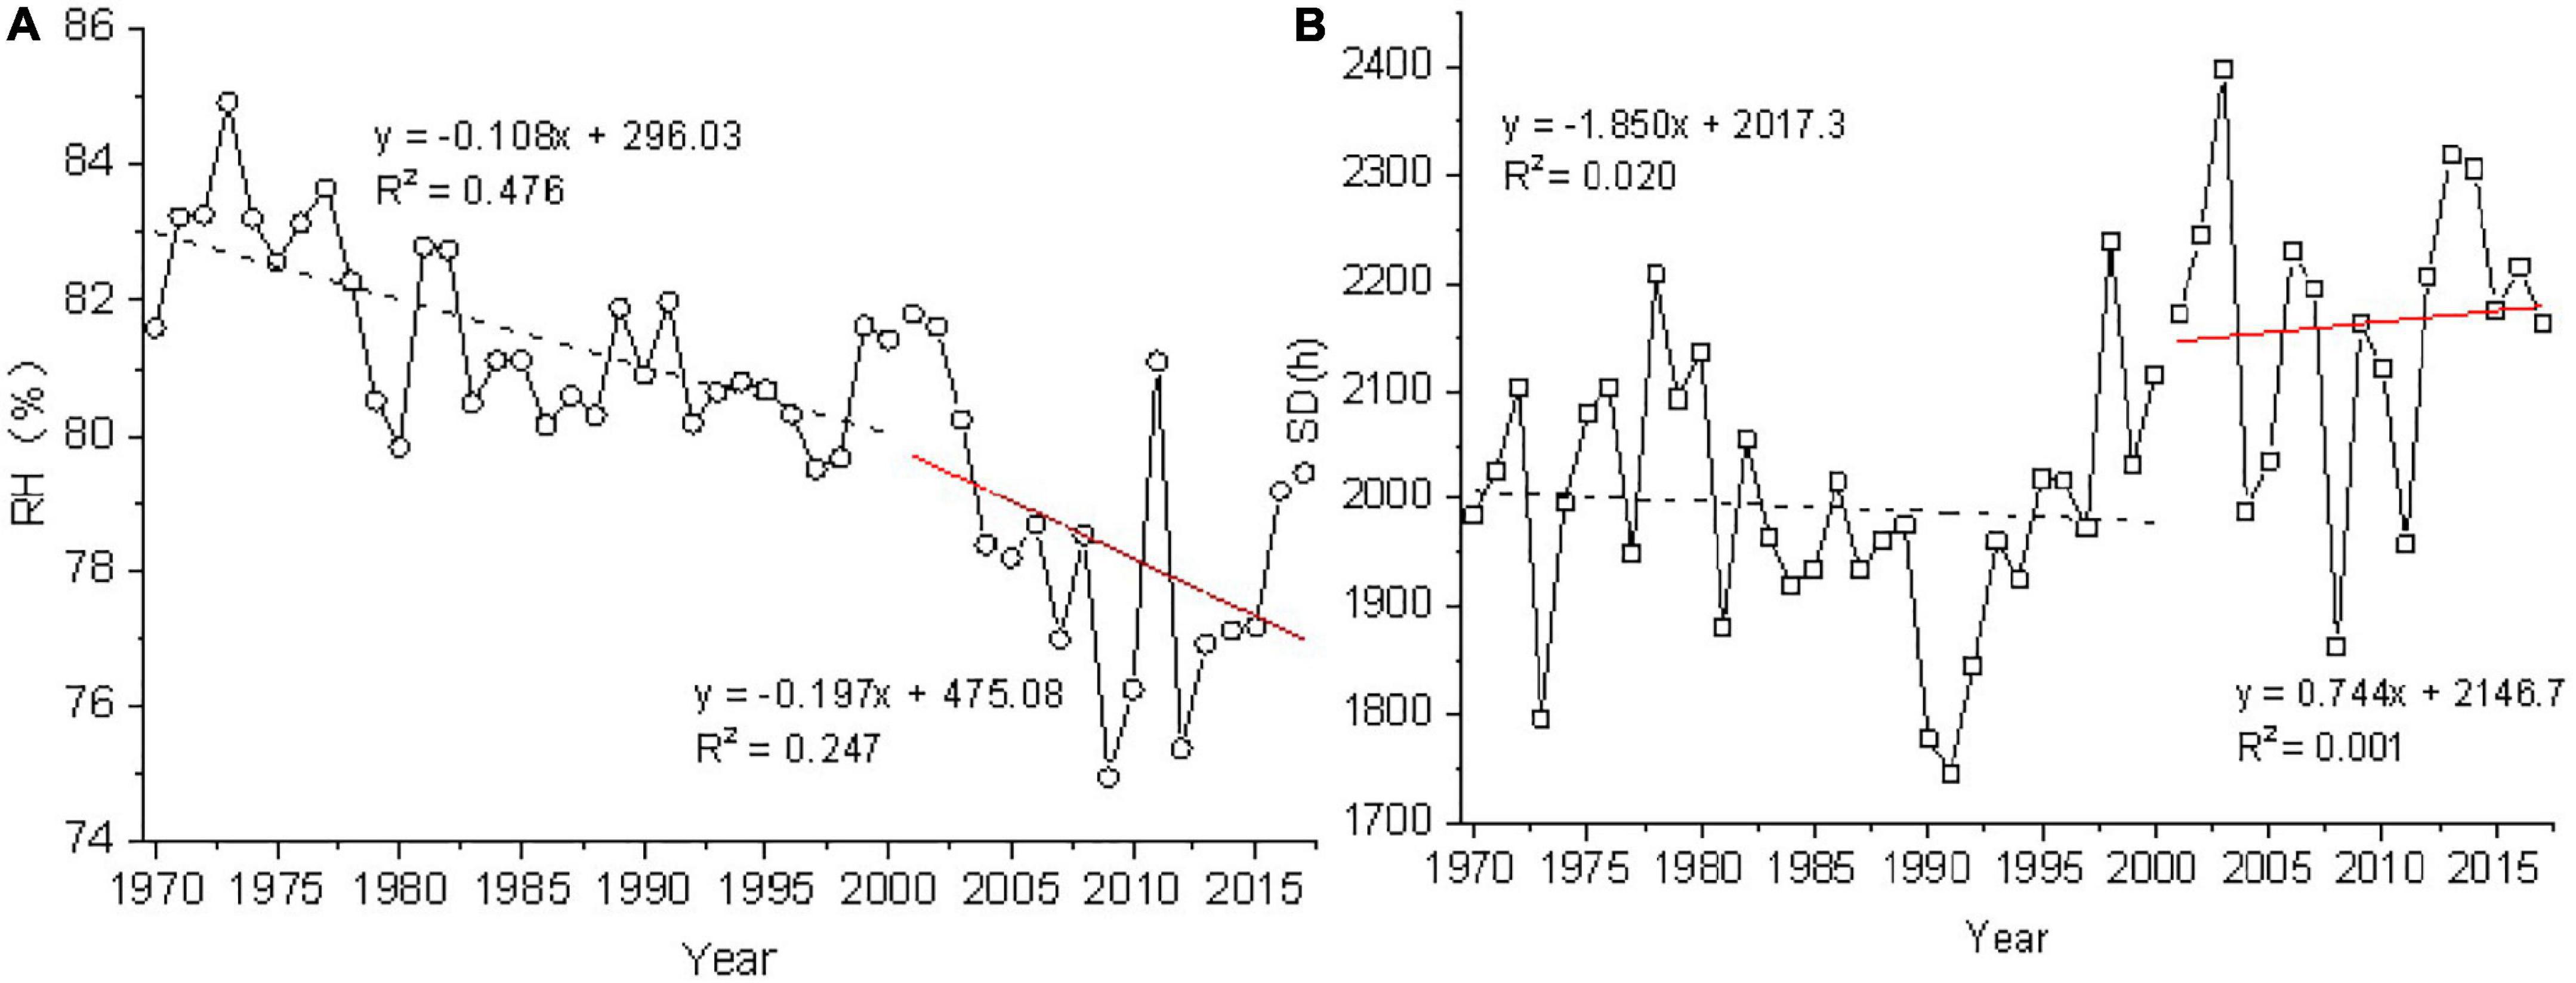
Figure 7. Interannual variation trend of average relative humidity (A) and sunshine duration (B) in rubber plantation area of Xishuangbanna.
To analyze the influence of climate and rubber plantation expansion on ET0 changes in Xishuangbanna. The control areas such as Jingdong, Lincang, Baoshan, and Yanshan in the same climate area without were affected by the wide expansion of rubber plantations for comparative.
Calculation of ET0 under rubber plantation expansion and climate change using Equations (12) and (13), as shown in Figure 8:
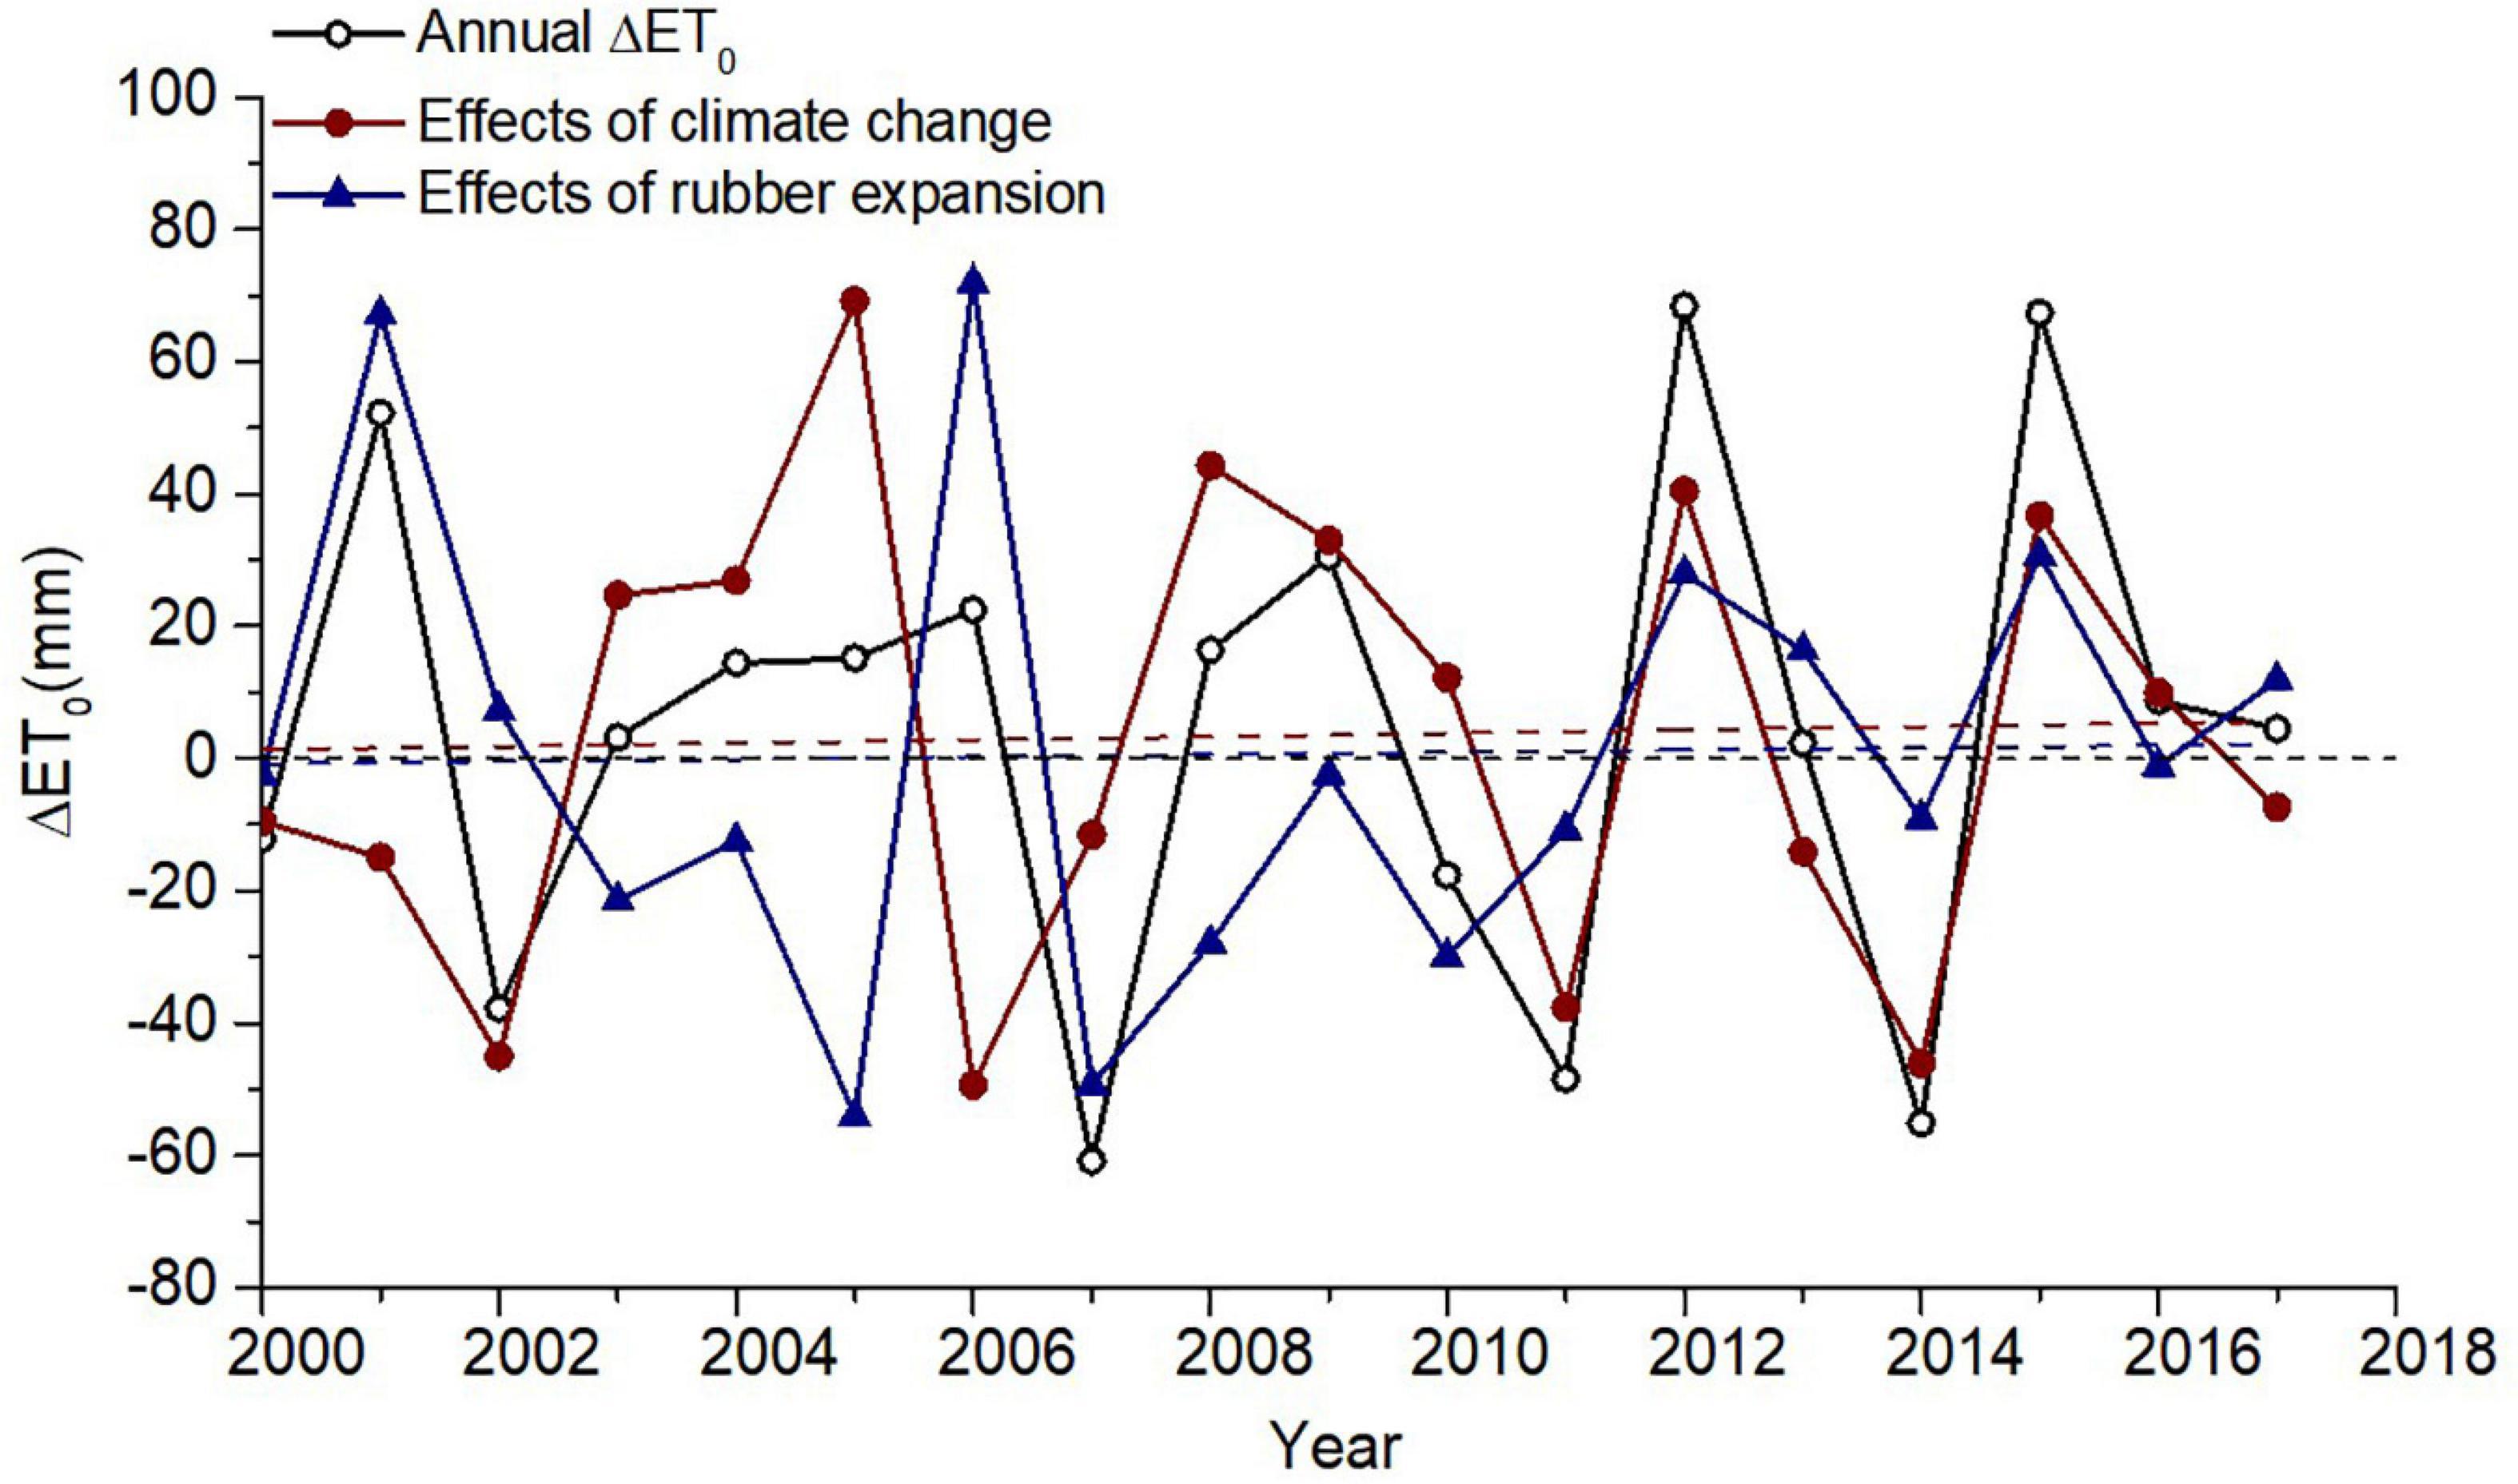
Figure 8. Fluctuation of the impact of climate change and rubber plantation expansion on the annual mean ET0 change in Xishuangbanna.
We compared the ET0 change from 2000 to 2017, and ET0 in the control region increased at a rate of 3.13 mm/10a due to climate change. However, ET0 in Xishuangbanna increased at a rate of 2.17 mm/10a due to the expansion of rubber plantation (the effect of climate change on ET0 in Xishuangbanna has been removed). The results indicated that even the effect of rubber plantation expansion on ET0 in Xishuangbanna from 2000 to 2017 was less than that of climate change, but rubber plantation expansion exacerbated the increase of ET0.
However, rubber plantation expansion had a greater impact on ET0 than climate change in some periods. For example, rubber plantations in Xishuangbanna showed a sharp growth due to the continuous increase in international rubber prices before 2011 (Chen et al., 2016). After that, the influence of climate change on ET0 became gradually dominated after 2011. Generally, the effects of climate change and rubber plantation expansion on ET0 in Xishuangbanna during 2000 and 2017 were dynamically changed and coacted.
Discussion
ET0 Changes by the Influenced of Meteorological Elements
Precipitation showed a decreasing trend especially in Jinghong, Jiangcheng, and Pu’er. The sunshine duration increased at most of stations except Jiangcheng. The average relative humidity decreased. The wind speed showed a less increasing trend. The average maximum and minimum temperature also increased. Zhao et al. (2012) indicated the temperature increase in Xishuangbanna (annual average temperature 0.013°C/a; annual average ground temperature 0.007°C/a); Peng et al. (2020) also proved temperature increase and precipitation decrease in Xishuangbanna from 1961 to 2016.
ET0 in Xishuangbanna showed increase from 1970 to 2017 due to the average relative humidity decreased and sunshine duration increased (Zuo et al., 2012; Xie and E, 2014; Abtew et al., 2015). Influenced by the differences in geographical and temporal scales, Kousari and Ahani (2012) found that ET0 has an increasing trend in Iran. Chaouche et al. (2010) also proved ET0 increased in the Mediterranean region which are consistent with the results of our study. However, Wang et al. (2017) studied 1961–2013 in China with a decreasing ET0.
ET0 Changes by the Influenced of Rubber Plantation Expansion
With the close international cooperation and growing demand for rubber trade, the rubber plantation in Xishuangbanna has increased rapidly with 39.68% compared to the pre-2000 period. Indeed, it has been expanded to higher altitude mountain where is the natural forest retaining area (Xu et al., 2014; Chambon et al., 2016; Chen et al., 2016). Natural forest was replaced and the coverage rate decreased from 69.0 to 43.6%.
The dramatic expansion of rubber plantations has altered the local and regional water balance, which led to changes in the regional microclimate. The ET0 changes with the microclimate of the area.
Rubber, the native to the Amazon rainforest, has a well-developed root system and xylem conduits. The root-water extraction moves from shallow to deep soil layers as the seasons and soil moisture zone change (Liu et al., 2013, 2014; Zeng et al., 2019).
Compared with secondary forests, rubber trees have higher ET and higher demand for water resources (Lin et al., 2018; Ma et al., 2019; Ling et al., 2021).
The expansion of a single rubber forest plantation has contributed to the continuous reduction of the natural forest area and the intensification of habitat fragmentation, which in turn led to regional soil erosion (Liu, 2015; Guillaume et al., 2016), a decrease in the ability to contain water (Ma et al., 2019; Zou et al., 2020), a decrease in relative air humidity, a decrease in fog days, and a gradual shift in climate from hot and humid to hot and dry, accelerating the formation of climate extremes in Xishuangbanna (Gong and Ling, 1996; Martius et al., 2004; Qiu, 2010; Chen et al., 2016; Peng et al., 2020) and causing negative ecohydrological effects such as a shortage of regional water resources (Guardiola-Claramonte et al., 2008; Ziegler et al., 2009; Zhou et al., 2011).
People live in the rubber plantation area experience a rare water shortage and the rivers seasonal breakdowns (He et al., 2007; Li et al., 2008; Chiarelli et al., 2020; Ling et al., 2021). Xishuangbanna is well-known clam wind and foggy area. Fog precipitation is a very important source of moisture and nutrients. Currently, the fog days decreased, the duration of fog is shorter and fog water content decreased by the impact of human activities in Xishuangbanna (Gong and Ling, 1996; Huang et al., 2001). The decrease of relative humidity leads to the increase of ET0.
Contributions of Climate Change and Rubber Plantation Expansion to ET0 Trends
There are significant differences in ET0 sensitivity to climate variables in different regions and under different climatic conditions (Zeng et al., 2010; Chen and Huo, 2011). The positive contribution of rising sunshine duration and decreasing average relative humidity in Xishuangbanna caused the increase of ET0 over the past 47 years. Lakshman and Gicy (2006) and Yin et al. (2010) studied that the solar radiation in the humid–semihumid zone plays more important role. Sunshine duration is the most important factor that affects ET0 in our study area, followed by the average relative humidity and temperature. The results are consistent with Cao et al. (2015) and Zhang W. W. et al. (2016) who found that the dominant factor of ET0 variation in mainland and southwest China is sunshine duration. However, temperature is the most sensitive factor to ET0 in northeast China whereas solar radiation is most sensitive in northwest China.
Based on assessment of ET0 change in rubber plantation expansion, the effects of climate change and rubber plantation expansion on ET0 were partitioned. The conclusion that climate change and rubber plantation expansion in the study area have the same influence on ET0 changes. Rubber plantation expansion exacerbated the change in ET0. Li et al. (2017) quantified the effects of land use and climate change on ET in China.
Climate change was more significant than LUCC change in influencing ET in China during the period 2001 and 2013. Jia et al. (2016) proved that average relative humidity and sunshine duration were sensitive factors for the change of ET0. The decrease of sunshine duration led to the decreased ET0. The effects of irrigation and climate change on ET0 were 49.97% and 50.03%, respectively. Han et al. (2014) suggested that ET0 decreased in Jingtai irrigation district because of irrigation change regional climatic factors such as wind speed decreased and average relative humidity increased. Rubber plantation expansion also changes ET0 due to changes in regional microclimate.
Conclusion
In this paper, we analyzed the spatial and temporal characteristics of rubber plantations and ET0 in Xishuangbanna, Yunnan Province from 1970 to 2017, and we also analyzed the relationship between ET0, rubber plantation area, and climate change. The conclusions are as follows:
(1) The ET0 increased with 22.84 mm/10a from 1970 to 2017. The spatial distribution of ET0 was higher in the southwest and lower in the northeast, whereas the ET0 values increased significantly and the area of high ET0 expanded after 2000. Rubber plantation was 12,768 ha yr–1 from 1990 to 2017 in Xishuangbanna. The growth rate was the largest from 2005 to 2010 in the plantation areas expanded to uplands.
(2) Average relative humidity and sunshine duration are the key meteorological factors that affect ET0 in Xishuangbanna. The multiyear relative change of ET0 in Xishuangbanna in 47a was 9.18%, which showed an increasing trend and the total contribution of the main climate factors to it was 7.87%.
(3) Climate change and rubber plantation expansion in Xishuangbanna increased ET0. Rubber plantation expansion decreased the average relative humidity which intensified the increase of ET0.
Due to the extremely complex mechanisms of land surface–atmosphere interactions, it is difficult to directly distinguish the effects of rubber plantation expansion from climate change on ET0. In addition, meteorological station data inevitably bring some errors and uncertainties. Although the independent effects of climate change and rubber plantation expansion on ET0 were calculated separately, climate change and rubber plantation expansion interact with each other. The climate change factors influence the boundary of rubber plantation expansion, which also affects the regional climate (Ellison et al., 2012). The interaction between regional climate, rubber plantation expansion, and energy (water) balance needs to be studied by adding more regional surface models to provide more theoretical supporting. However, it can support for the negative hydroecological effects such as local water resources shortage caused by the expansion of rubber plantations.
Data Availability Statement
The original contributions presented in the study are included in the article/supplementary material, further inquiries can be directed to the corresponding author.
Author Contributions
ZL: conceptualization, methodology, software, investigation, writing—original draft preparation, and writing—reviewing and editing. ZS: conceptualization, supervision, and writing—reviewing and editing. SG: visualization, software, and investigation. TW: software and validation. WZ: data curation and methodology. GF: software and writing—reviewing and editing. All authors contributed to the article and approved the submitted version.
Funding
This study was supported by grants from the Ministry of Science and Technology of the People’s Republic of China (Nos. 2021YFC0863700, 2019YFA0706200, and 2021ZD0201900), the National Natural Science Foundation of China (Nos. 81761128036, 82171514, and 81901352), and the PKU-Baidu Fund (No. 2020BD011).
Conflict of Interest
The authors declare that the research was conducted in the absence of any commercial or financial relationships that could be construed as a potential conflict of interest.
Publisher’s Note
All claims expressed in this article are solely those of the authors and do not necessarily represent those of their affiliated organizations, or those of the publisher, the editors and the reviewers. Any product that may be evaluated in this article, or claim that may be made by its manufacturer, is not guaranteed or endorsed by the publisher.
Footnotes
References
Abtew, W., Obeysekera, J., and Iricanin, N. (2015). Pan evaporation and potential evapotranspiration trends in South Florida. Hydrol. Process. 25, 958–969. doi: 10.1002/hyp.7887
Ahmad, M.-D., Kirby, J. M., and Cheema, M. J. M. (2019). Impact of agricultural development on evapotranspiration trends in the irrigated districts of Pakistan: evidence from 1981 to 2012. Water Int. 44, 51–73. doi: 10.1080/02508060.2019.1575110
Allen, R. G., Pereira, L. S., Raes, D., and Smith, M. (1998). Crop Evapotranspiration: Guidelines for Computing Crop Water Requirements, FAO Irrigation and Drainage Paper56. Rome: FAO.
Beven, K. A. (1979). Sensitivity analysis of the Penman-Monteith actual evapotranspiration estimates. J. Hydrol. 44, 169–190. doi: 10.1016/0022-1694(79)90130-6
Cao, W., Duan, C. F., and Shen, S. H. (2015). Interdecadal transition and causes of potential evapotranspiration change in Mainland China from 1971 to 2010. Acta Ecol. Sin. 35, 5085–5094. doi: 10.5846/stxb201309022184
Chambon, B., Ruf, F., Kongmanee, C., and Angthong, S. (2016). Can the cocoa cycle model explain the continuous growth of the rubber (Hevea brasiliensis) sector for more than a century in Thailand? J. Rural Stud. 44, 187–197. doi: 10.1016/j.jrurstud.2016.02.003
Chaouche, K., Neppel, L., Dieulin, C., Pujol, N., Ladouche, B., Martin, E., et al. (2010). Analyses of precipitation, temperature and evapotranspiration in a French Mediterranean region in the context of climate change. C. R. Géosci. 342, 234–243. doi: 10.1016/j.crte.2010.02.001
Chen, H. F., Yi, Z. F., Schmidt-Vogt, D., Ahrends, A., Beckschäfer, P., Kleinn, C., et al. (2016). Pushing the Limits: the Pattern and Dynamics of Rubber Monoculture Expansion in Xishuangbanna, SW China. PLoS One 11:e0150062. doi: 10.1371/journal.pone.0150062
Chen, S., and Huo, Z. (2011). Quantitative analysis of the causes of evapotranspiration variation of reference crops during the growing season in northwest China [J]. Acta Geogr. Sin. 66, 407–415.
Chen, S. L., and Huo, Z. L. (2016). Research on the effect of climate change on reference evapotranspiration in the Heihe River Basin during the last 53 years (in Chinese with English abstract). China Rural Water Hydropower 5, 81–91.
Chiarelli, D. D., Passera, C., Rulli, M. C., Rosa, L., and D’Odorico, P. (2020). Hydrological consequences of natural rubber plantations in Southeast Asia. Land Degrad. Dev. 31, 2060–2073. doi: 10.1002/ldr.3591
D’Andrea, M. F., Rousseau, A. N., Bigah, Y., Gattinoni, N. N., and Brodeur, J. C. (2019). Trends in reference evapotranspiration and associated climate variables over the last 30 years(1984–2014) in the Pampa region of Argentina. Theor. Appl. Climatol. 136, 1371–1386. doi: 10.1007/s00704-018-2565-7
Dong, Y. X., Wang, H. X., Liu, H. J., and Zhao, R. X. (2019). Change trend and sensitivity analysis of reference crop evapotranspiration under climate change in Guanzhong Area. Water Sav. Irrig. 288, 117–123.
Ellison, D. N., Futter, M., and Bishop, K. (2012). On the forest cover–water yield debate: from demand-to supply-side thinking. Glob. Chang. Biol. 18, 806–820. doi: 10.1111/j.1365-2486.2011.02589.x
Feng, Y., Cui, N. B., Zhao, L., Gong, D., and Zhang, K. (2017). Spatiotemporal variation of reference evapotranspiration during 1954–2013 in Southwest China. Q. Int. 441, 129–139. doi: 10.1016/j.quaint.2017.01.023
Fox, J. (2012). “The production of forests, Tree cover transitions in Northern Thailand, Northern Laos, and Southern China,” in The Social Life of Forests, eds S. Hecht, K. Morrison, and C. Padoch (Chicago, IL:, University of Chicago Press).
Fu, G., Charles, S. P., and Yu, J. (2009). A critical overview of pan evaporation trends over the last 50 years. Clim. Chang. 97, 193–214. doi: 10.1007/s10584-009-9579-1
Fu, J. (2018). Estimation of Vegetation Ecological Water Demand and Its Spatio-Temporal Differentiation in Humid Region of South China. Changsha: Hunan Normal University.
Ghafouri-Azar, M., Bae, D. H., and Kang, S. U. (2018). Trend analysis of long-term reference evapotranspiration and its components over the Korean Peninsula. Water 10:1373. doi: 10.3390/w10101373
Goyal, R. K. (2004). Sensitivity of evapotranspiration to global warming: a case study of arid zone of Rajasthan(India). Agric. Water Manage. 69, 1–11. doi: 10.1016/j.agwat.2004.03.014
Guardiola-Claramonte, M., Troch, P. A., Ziegler, A. D., Giambelluca, T. W., Vogler, J. B., and Nullet, M. A. (2008). Local hydrologic effects of introducing non-native vegetation in a tropical catchment. Ecohydrology 1, 13–22. doi: 10.1002/eco.3
Guillaume, T., Holtkamp, A. M., Damris, M., Brümmer, B., and Kuzyakov, Y. (2016). Soil degradation in oil palm and rubber plantations under land resource scarcity. Agric. Ecosyst. Environ. 232, 110–118. doi: 10.1016/j.agee.2016.07.002
Han, S., Xu, D., Wang, S., and Yang, Z. Y. (2014). Water requirement with irrigation expansion in Jingtai Irrigation District, Northwest China: the need to consider irrigation—induced local changes in evapotranspiration demand. J. Irrig. Drain. Eng. 140:04013009. doi: 10.1061/(ASCE)IR.1943-4774.0000671
He, Y. L., Zhang, Y. P., and Yang, X. B. (2007). Characteristics of climate change in tropical inland China during the past 40 years. Sci. Geogr. Sin. 499–505.
Hu, X. H., Chen, M. T., Liu, D., Li, D., Jin, L., Liu, S. H., et al. (2021). Reference evapotranspiration change in Heilongjiang Province, China from 1951 to 2018: the role of climate change and rice area expansion. Agric. Water Manage. 253:106912. doi: 10.1016/j.agwat.2021.106912
Huang, Y. R., Shen, Y., Huang, Y. S., and Tan, Y. Z. (2001). Influence of urbanization on radiation fog in Xishuangbanna. Plateau Meteorol. 186–190.
Hwang, J. H., Azam, M., Jin, M. S., Kang, Y. H., Lee, J. E., Latif, M., et al. (2019). Spatiotemporal trends in reference evapotranspiration over South Korea. Paddy Water Environ. 18, 235–259. doi: 10.1007/s10333-019-00777-4
Jia, Y., Cui, N. B., Wei, X. P., Hu, X. T., Gong, D. Z., and Feng, Y. (2016). Impact of Climate Change and Irrigation on the Reference Crop Evapotranspiration in Dujiangyan Irrigated Area. J. Sichuan Univ. 48, 69–79.
Jiao, Y. Q., Wang, Q., Jiang, F., and Zhao, L. X. (2020). Evolution trend of reference crop evapotranspiration and its main influencing factors in China. China Rural Water Hydropower 30–34.
Kendall, M. G. (1975). Rank Correlation Methods. London: Charles Griffin. doi: 10.1111/j.2044-8317.1956.tb00172.x
Kousari, M. R., and Ahani, H. (2012). An investigation on reference crop evapotranspiration trend from 1975 to 2005 in Iran. Int. J. Climatol. 32, 2387–2402. doi: 10.1002/joc.3404
Lakshman, N., and Gicy, M. K. (2006). Performance evaluation of reference evapotranspiration equations across a range of Indian climates. J. Irrig. Drain. Eng. 132, 238–249. doi: 10.1061/(ASCE)0733-9437(2006)132:3(238)
Li, G. (2017). Response of Evapotranspiration to Climate and Land Use/Cover Change and Correction of Model Heterogeneity Error. Nanjing: Nanjing University of Information Science and Technology.
Li, G., Zhang, F. M., and Jing, Y. S. (2017). Response of evapotranspiration to changes in land use and land cover and climate in China during 2001–2013. Sci. Total Environ. 596-597, 256–265. doi: 10.1016/j.scitotenv.2017.04.080
Li, Z. J., Ma, Y. X., Li, H. M., Peng, M. C., and Liu, W. J. (2008). Relationship between land use/cover change and landform in Xishuangbanna, China. Chin. J. Plant Ecol. 32, 1091–1103.
Li, Z. W., Xu, X. L., and Yu, B. F. (2016). Quantifying the impacts of climate and human activities on water and sediment discharge in a karst region of southwest China. J. Hydrol. 542, 836–849. doi: 10.1016/j.jhydrol.2016.09.049
Liang, S. Z., Chen, J. S., Wu, B. F., and Chen, G. (2015). Application of object - oriented decision tree model to extract information of rubber forest. J. Remote Sens. 19, 488–489.
Lin, Y. X., Grace, J., Zhao, W., Dong, Y. X., Zhang, X., Zhou, L. G., et al. (2018). Water-use efficiency and its relationship with environmental and biological factors in a rubber plantation. J. Hydrol. 563, 273–282. doi: 10.1016/j.jhydrol.2018.05.026
Lin, Y. X., Zhang, Y. P., Zhao, W., Zhang, X., Dong, Y. X., Fei, X. H., et al. (2016). Comparison of transpiration characteristics of rubber plantations at different ages. Chin. J. Ecol. 35, 855–863.
Ling, Z. (2021). Spatial-temporal Variation Characteristics and Prediction Model of Evapotranspiration of Rubber Plantation in Xishuangbanna. Kunming: Yunnan Normal University.
Ling, Z., Shi, Z. T., Gu, S. X., Peng, H. Y., Feng, G. J., and Huo, H. (2021). Energy balance and evapotranspiration characteristics of rubber tree (Hevea brasiliensis) plantations in Xishuangbanna, Southwest of China. Appl. Ecol. Environ. Res. (in press). doi: 10.3390/w14030295
Liu, C. L., Zhang, J., Li, Y. Y., Chen, Y. L., and Yang, X. C. (2017). Information extraction and spatial-temporal pattern expansion monitoring of rubber forest in Xishuangbanna. Fujian For. Sci. Technol. 44, 43–50.
Liu, W. J., Li, J. T., Lu, H. Y., Wang, P. J., Luo, Q. P., Liu, W. Y., et al. (2014). Vertical patterns of soil water acquisition by non-native rubber trees (Hevea brasiliensis) in Xishuangbanna, Southwest China. Ecohydrology 7, 1234–1244. doi: 10.1002/eco.1456
Liu, W. J., Luo, Q. P., Li, J. T., Wang, P. Y., Lu, H. J., Liu, W. Y., et al. (2013). The effects of conversion of tropical rainforest to rubber plantation on splash erosion in Xishuangbanna, SW China. Hydrol. Res. 46, 168–174. doi: 10.2166/nh.2013.109
Liu, X. J. (2015). Analysis of Economic Driving Forces of Land Use Change in Xishuangbanna Based on Farmers’ Income. Kaifeng: Henan University.
Liu, Y., Cui, N. B., Li, G., Luo, W. Q., Liao, G. L., and Wang, L. T. (2018). Analysis on the causes of seasonal reference evapotranspiration change in Southwest China in recent 56 years. Water Sav. Irrig. 54–59.
Ma, X., Lacombe, G., Harrison, R., Xu, J., and Van Noordwijk, M. (2019). Expanding rubber plantations in Southern China: evidence for hydrological impacts. Water 11:651. doi: 10.3390/w11040651
Mann, H. B. (1945). Nonparametric tests against trend. Econometrica 13, 245–259. doi: 10.2307/1907187
Martius, C., Höfer, H., Garcia, M. V. B., Römbke, J., Förster, B., and Hanagarth, W. (2004). Microclimate in agroforestry systems in central Amazonia: Does canopy closure matter to soil organisms? Agrofor. Syst. 60, 291–304. doi: 10.1023/B:AGFO.0000024419.20709.6c
McCuen, R. H. (1974). A sensitivity and error analysis of procedures used for estimating evaporation. Water Resour. Bull. 10, 486–498. doi: 10.1111/j.1752-1688.1974.tb00590.x
Nouri, M., and Bannayan, M. (2019). Spatiotemporal changes in aridity index and reference evapotranspiration over semi-arid and humid regions of Iran: trend, cause, and sensitivity analyses. Theor. Appl. Climatol. 136, 1073–1084. doi: 10.1007/s00704-018-2543-0
Odongo, V. O., van Oel, P. R., van der Tol, C., and Su, Z. (2019). Impact of land use and land cover transitions and climate on evapotranspiration in the lake Naivasha Basin, Kenya. Sci. Total Environ. 682, 19–30. doi: 10.1016/j.scitotenv.2019.04.062
Pan, Q., Shikano, I., Hoover, K., Liu, T.-X., and Felton, G. W. (2019). Enterobacter ludwigii, isolated from the gut microbiota of Helicoverpa zea, promotes tomato plant growth and yield without compromising anti-herbivore defenses. Arthropod Plant Interact. 13, 271–278. doi: 10.1007/s11829-018-9634-9
Peng, H. Y., Shi, Z. T., and Tong, S. Y. (2020). Climatological characteristics and influencing factors of fog in Xishuangbanna area. Geogr. Res. 39, 1907–1919.
Pour, S. H., Wahab, A. K. A., Shahid, S., and Ismail, Z. B. (2020). Changes in reference evapotranspiration and its driving factors in peninsular Malaysia. Atmos. Res. 246:105096. doi: 10.1016/j.atmosres.2020.105096
Qiu, J. (2010). China drought highlights future climate threats. Nature 465, 142–143. doi: 10.1038/465142a
Shen, G. Z., Wang, L., Yu, H., and Wei, Q. (2017). Spatial and temporal distribution and cause analysis of reference crop evapotranspiration in Hengduan Mountains under changing environment. China Rural Water Hydropower 40–45+51.
Tan, Z. H., Zhang, Y. P., Song, Q. H., Liu, W. J., Deng, X. B., Tang, J. W., et al. (2011). Rubber plantations act as water pumps in tropical China. Geophys. Res. Lett. 38:L24406. doi: 10.1029/2011GL050006
Wang, Z. L., Xie, P. W., Lai, C. G., Chen, X. H., Wu, X. S., Zeng, Z. Y., et al. (2017). Spatiotemporal variability of reference evapotranspiration and contributing climatic factors in China during 1961–2013. J. Hydrol. 544, 97–108. doi: 10.1016/j.jhydrol.2016.11.021
Warren-Thomas, E., Dolman, P. M., and Edwards, D. P. (2015). Increasing Demand for Natural Rubber Necessitates a Robust Sustainability Initiative to Mitigate Impacts on Tropical Biodiversity. Conserv. Lett. 8, 230–241. doi: 10.1111/conl.12170
Xiang, K. Y., Li, Y. I., Horton, R., and Feng, H. (2020). Similarity and difference of potential evapotranspiration and reference crop evapotranspiration: a review. Agric. Water Manage. 232:106043. doi: 10.1016/j.agwat.2020.106043
Xie, H., and E, C. Y. (2014). Temporal and spatial characteristics and influencing factors of reference evapotranspiration over the Tibetan Plateau. J. Qinghai Norm. Univ. 30, 52–59. doi: 10.16229/j.cnki.issn1001-7542.2014.04.009
Xu, J., Grumbine, R. E., and Beckschäfer, P. (2014). Landscape transformation through the use of ecological and socioeconomic indicators in Xishuangbanna, Southwest China, Mekong Region. Ecol. Indic. 36749–36756. doi: 10.1016/j.ecolind.2012.08.023
Xu, S., Yu, Z., Yang, C., Ji, X., and Zhang, K. (2018). Trends in evapotranspiration and their responses to climate change and vegetation greening over the upper reaches of the Yellow River Basin. Agric. For. Meteorol. 263, 118–129. doi: 10.1016/j.agrformet.2018.08.010
Xu, Y., Xu, Y., Wang, Y., Wu, L., Li, G., and Song, S. (2017). Spatial and temporal trends of reference crop evapotranspiration and its influential variables in Yangtze River Delta, eastern China. Theor. Appl. Climatol. 130, 945–958. doi: 10.1007/s00704-016-1928-1
Yang, L., Liu, H. J., Tang, X. P., Gao, Z. Z., and Feng, D. X. (2021). Change trend and sensitivity analysis of reference crop evapotranspiration under climate change in Ningjin County, Hebei Province. J. Irrig. Drain. 40, 97–105.
Yavuz, S. G. (2018). Multiple Şen-innovative trend analyses and partial Mann-Kendall test. J. Hydrol. 566, 685–704. doi: 10.1016/j.jhydrol.2018.09.034
Ye, X. C., Li, X. H., Liu, J., Xu, C. Y., and Qi, Z. (2014). Variation of reference evapotranspiration and its contributing climatic factors in the Poyang Lake catchment, China. Hydrol. Process. 28, 6151–6162. doi: 10.1002/hyp.10117
Yin, Y. H., Wu, S. H., and Chen, G. (2010). Attribution analyses of potential evapotranspiration changes in China since the 1960s. Theor. Appl. Climatol. 101, 19–28. doi: 10.1007/s00704-009-0197-7
Yin, Y. H., Wu, S. H., and Dai, E. R. F. (2020). Attribution of spatio-temporal variation of potential evapotranspiration in China from 1971 to 2008. Chin. Sci. Bull. 55, 2226–2234.
You, G., Arain, M. A., Wang, S., Lin, N., Wu, D., McKenzie, S., et al. (2019). Trends of actual and potential evapotranspiration based on Bouchet’s complementary concept in a cold and arid steppe site of Northeastern Asia. Agric. For. Meteorol. 279:107684. doi: 10.1016/j.agrformet.2019.107684
Zeng, H. H., Liu, W. J., Wu, J. E., and Zhu, X. A. (2019). Water use strategies of plants in rubber plantation in Xishuangbanna area. Chin. J. Ecol. 38, 88–97. doi: 10.13292/j.1000-4890.201902.036
Zeng, L. H., Song, K. S., Zhang, B., and Wang, Z. M. (2010). Sensitivity analysis of reference crop evapotranspiration to main meteorological factors in Northeast China. Chin. J. Agrometeorol. 31, 11–18.
Zhang, D., Liu, X., and Hong, H. (2013). Assessing the effect of climate change on reference evapotranspiration in China. Stoch. Environ. Res. Risk Assess. 27, 1871–1881. doi: 10.1007/s00477-013-0723-0
Zhang, K. Y. (1963). Preliminary analysis of climate characteristics and its forming factors in southern Yunnan. Acta Meteorol. Sin. 218–230.
Zhang, L., Traore, S., Cui, Y., Luo, Y., Zhu, G., Liu, B., et al. (2019). Assessment of spatiotemporal variability of reference evapotranspiration and controlling climate factors over decades in China using geospatial techniques. Agric. Water Manage. 213, 499–511. doi: 10.1016/j.agwat.2018.09.037
Zhang, Q. W., Cui, N. B., Feng, Y., Gong, D. Z., and Hu, X. T. (2016). China southwest five provinces reference crop evapotranspiration quantity changes of time and space analysis. J. Irrig. Drain. 35, 80–87.
Zhang, W. W., Wang, Y., and Zhang, G. B. (2016). Temporal and spatial characteristics and causes of reference crop evapotranspiration in Southwest China during 1960-2013. Chin. Agric. Sci. Bull. 32, 135–141.
Zhao, J. B., Zhang, Y. P., Song, F. Q., Xu, Z. F., and Xiao, L. Y. (2012). Long-term trends of heat factors in Xishuangbanna tropical botanical garden. J. Nanjing For. Univ. 36, 48–52.
Zhou, W., Wu, Z. L., He, G. C., Lu, C., and Jie, M. (2011). Rubber planting and drinking water shortage: the case of Guniu Village, Xishuangbanna. Chin. J. Ecol. 30, 1570–1574. doi: 10.13292/j.1000-4890.2011.0188
Zhou, Y., Liu, S. L., Xie, M. M., Sun, Y. X., and An, Y. (2021). Dynamics of regional vegetation changes under the disturbance of human activities: a case study of Xishuangbanna. Acta Ecol. Sin. 41, 565–574. doi: 10.5846/stxb201904030645
Ziegler, A. D., Fox, J. M., and Xu, J. (2009). The rubber juggernaut. Science 324, 1024–1025. doi: 10.1126/science.1173833
Zou, X., Chen, C. F., and Liu, W. J. (2020). Effects of rubber planting on soil aggregates and physicochemical properties in xishuangbanna. Chin. J. Soil Sci. 51, 597–605.
Keywords: climate change, rubber plantation, sensitivity coefficient, contribution rate, reference evapotranspiration
Citation: Ling Z, Shi Z, Gu S, Wang T, Zhu W and Feng G (2022) Impact of Climate Change and Rubber (Hevea brasiliensis) Plantation Expansion on Reference Evapotranspiration in Xishuangbanna, Southwest China. Front. Plant Sci. 13:830519. doi: 10.3389/fpls.2022.830519
Received: 07 December 2021; Accepted: 17 January 2022;
Published: 03 March 2022.
Edited by:
Zhihan Lv, Uppsala University, SwedenReviewed by:
Bo Liu, Yangzhou University, ChinaLei Zhang, North China University of Water Conservancy and Electric Power, China
Copyright © 2022 Ling, Shi, Gu, Wang, Zhu and Feng. This is an open-access article distributed under the terms of the Creative Commons Attribution License (CC BY). The use, distribution or reproduction in other forums is permitted, provided the original author(s) and the copyright owner(s) are credited and that the original publication in this journal is cited, in accordance with accepted academic practice. No use, distribution or reproduction is permitted which does not comply with these terms.
*Correspondence: Zhengtao Shi, c2hpemhlbmd0YW9AMTYzLmNvbQ==
 Zhen Ling1
 Zhengtao Shi