 Hong-Yun Zeng
 He-Nan Bao
 Yi-Li Chen
 Nan Yao
95% of researchers rate our articles as excellent or good
Learn more about the work of our research integrity team to safeguard the quality of each article we publish.
Find out more
ORIGINAL RESEARCH article
Front. Plant Sci. , 07 April 2022
Sec. Plant Pathogen Interactions
Volume 13 - 2022 | https://doi.org/10.3389/fpls.2022.824585
This article is part of the Research Topic Lipid Metabolism and Membrane Structure in Plant Biotic Interactions View all 6 articles
Ceramide synthases (CSs) produce ceramides from long-chain bases (LCBs). However, how CSs regulate immunity and cell death in Arabidopsis thaliana remains unclear. Here, we decipher the roles of two classes of CS, CSI (LAG1 HOMOLOG 2, LOH2) and CSII (LOH1/3), in these processes. The loh1-2 and loh1-1 loh3-1 mutants were resistant to the bacterial pathogen Pseudomonas syringae pv maculicola (Psm) DG3 and exhibited programmed cell death (PCD), along with increased LCBs and ceramides, at later stages. In loh1-2, the Psm resistance, PCD, and sphingolipid accumulation were mostly suppressed by inactivation of the lipase-like proteins ENHANCED DISEASE SUSCEPTIBILITY 1 (EDS1) and PHYTOALEXIN DEFICIENT 4 (PAD4), and partly suppressed by loss of SALICYLIC ACID INDUCTION DEFICIENT 2 (SID2). The LOH1 inhibitor fumonisin B1 (FB1) triggered EDS1/PAD4-independent LCB accumulation, and EDS1/PAD4-dependent cell death, resistance to Psm, and C16 Cer accumulation. Loss of LOH2 enhances FB1-, and sphinganine-induced PCD, indicating that CSI negatively regulates the signaling triggered by CSII inhibition. Like Cer, LCBs mediate cell death and immunity signaling, partly through the EDS1/PAD4 pathway. Our results show that the two classes of ceramide synthases differentially regulate EDS1/PAD4-dependent PCD and immunity via subtle control of LCBs and Cers in Arabidopsis.
Free long-chain bases (LCBs), the simplest form of sphingolipids, are synthesized de novo from serine and palmitoylcoenzyme A. In Arabidopsis (Arabidopsis thaliana), LCBs can be bound to a fatty acid (FA) through an amide linkage to produce ceramides (Cers) by the three Cer synthases (CSs) LAG1 HOMOLOG 1–3 (LOH1–3). The different CSs determine the varied chemical compositions of Cers. LOH1 and LOH3 are classified as class II CS enzymes (CSII) and prefer very-long-chain acyl-CoA and trihydroxy LCB as substrates. LOH2 is classified as CSI and prefers palmitoyl-CoA and dihydroxy LCB as substrates (Markham et al., 2011; Luttgeharm et al., 2015, 2016; Supplementary Figure 1). In plants, Cers can be modified to form three other groups of sphingolipids: hydroxyceramides (hCers), glucosylceramides (GlcCers), and glycosylinositolphosphoceramides (GIPCs; Dunn et al., 2004).
Besides being the common backbone of all sphingolipids, free LCBs also act as second messengers in multiple processes, such as regulation of stomatal closure (Worrall et al., 2008; Guo et al., 2012), freezing tolerance (Huang et al., 2017), autophagy (Zheng et al., 2018), programmed cell death (PCD; Shi et al., 2007), and immunity (Magnin-Robert et al., 2015; Liu et al., 2019). PCD is essential for normal growth and development as well as responses to a variety of biotic and abiotic stresses in plants (Locato and De Gara, 2018). Plant sphingolipid-associated PCD shares common features with the hypersensitive response cell death (Berkey et al., 2012), a commonly observed form of PCD triggered by avirulent pathogen infection (Locato and De Gara, 2018).
Genetic studies have revealed the importance of different CSs. The strong insertion mutant alleles loh1-2, loh2-1, loh2-2, and loh3-2, and the knockdown insertion alleles loh1-1 and loh3-1 exhibit a normal phenotype under standard growth conditions (Markham et al., 2011). The loh1-2 loh3-2 double mutant is embryo-lethal, but some loh1-1 loh3-1 mutant seeds survive and germinate into plants that develop smaller leaves; these leaves also senesce early (Markham et al., 2011). When grown under short-day conditions for 8–10 weeks, loh1-2 mutant plants spontaneously develop yellow lesions, which form suddenly (within a few days), starting with the oldest leaves (Ternes et al., 2011). In addition, 6-week-old loh1-2 plants accumulate elevated levels of free trihydroxy sphingoids (another name for LCBs) as well as Cer and GlcCer species with C16 FA backbones, suggesting that higher amounts of free trihydroxy sphingoids or C16-Cer species trigger the spontaneous cell death phenotype observed in loh1 mutants (Ternes et al., 2011). However, no obvious phenotype is observed in the loh3 single mutants, possibly due to the lower expression level of LOH3, compared with that of LOH1 (Ternes et al., 2011). Overexpression of LOH2, but not of LOH1 or LOH3, also induces PCD (Luttgeharm et al., 2015). We recently discovered that the onset of cell death induced by LOH2 overexpression requires ENHANCED DISEASE SUSCEPTIBILITY 1 (EDS1) and PHYTOALEXIN DEFICIENT 4 (PAD4; Zeng et al., 2021), which are crucial components in salicylic acid (SA) biosynthesis and regulation of cell death (Lapin et al., 2020).
Fumonisin B1 (FB1), a potent inhibitor of CSs, is a powerful tool to explore the multiple functions of sphingolipids in plants (Zeng et al., 2020). In Arabidopsis, LOH1 has the highest Ki for FB1 when compared with LOH2 and LOH3, reflecting its sensitivity to FB1 (Luttgeharm et al., 2016). FB1 triggers the rapid accumulation of LCBs, especially the two main LCBs sphinganine (d18:0) and phytosphingosine (t18:0; Shi et al., 2007; Tsegaye et al., 2007; Saucedo-Garcia et al., 2011; Yanagawa et al., 2017). Prolonged exposure to FB1 causes excessive 16:0-sphingolipid biosynthesis (Markham et al., 2011). The loh2-1 and loh2-2 mutants are sensitive to FB1 (Mase et al., 2013), and lines overexpressing LOH2 or LOH3 are resistant to FB1 (Luttgeharm et al., 2015). Moreover, FB1 treatment results in the accumulation of SA (Abbas et al., 1994; Zhang et al., 2015), and SA promotes FB1-induced cell death (Zhang et al., 2015). FB1-mediated PCD in protoplasts was reported to be dependent on PAD4 and SA (Asai et al., 2000).
Free LCBs (such as d18:0 and t18:0) induce PCD in Arabidopsis (Shi et al., 2007). Tobacco (Nicotiana tabacum) BY-2 cell cultures challenged with d18:0 enter a death process (Lachaud et al., 2010). Arabidopsis MITOGEN ACTIVATED PROTEIN KINASE 6 (MPK6) appears to transduce the d18:0-induced PCD signal (Saucedo-Garcia et al., 2011). In addition, LCBs contribute to plant resistance against bacterial pathogens. Indeed, PATHOGENESIS RELATED-1 (PR1) is more highly expressed in loh1 plants and FB1-treated wild-type plants than in untreated wild type (Ternes et al., 2011; Zhang et al., 2015). t18:0 LCBs accumulate upon Pseudomonas syringae pv. tomato DC3000 infection (Peer et al., 2010), and regulate plasmodesmata functions and cell-to-cell communication through PLASMODESMATA-LOCATED PROTEIN 5 (PDLP5) at plasmodesmata membranes (Liu et al., 2019). Hence, even though their roles in plant immunity are still largely unknown, CSs appear to be important in immunity and cell death, acting by tapping into the LCB pool for their substrates.
Here, we demonstrate that CSII prevents the activation of immunity and PCD by repressing EDS1/PAD4 signaling, while CSI negatively regulates the immunity and PCD induced by the loss of CSII function, possibly by removing over-accumulated LCBs.
Two Arabidopsis (Arabidopsis thaliana) ecotypes, Columbia-0 (Col-0) and Wassilewskija (Ws), were used in this study. The loh1-1 and loh3-1 mutants were in the Ws background; all other mutants were in the Col-0 background. The pad4-1, eds1-2, sid2-1, loh1-2, loh2-2, loh3-2, and loh1-1 loh3-1 mutants were described previously (Markham et al., 2011; Bi et al., 2014; Zeng et al., 2021). The stable transgenic lines LOH2 A, pad4-1 LOH2 A, eds1-2 LOH2 A, sid2-1 LOH2 A, and eds1-2 EDS1pro:EDS1-GFP were described previously (Zeng et al., 2021). The double mutants loh1-2 loh2-2, loh1-2 pad4-1, loh1-2 eds1-2, and loh1-2 sid2-1 were generated by crossing the loh1-2 mutant with the loh2-2, pad4-1, eds1-2, and sid2-1 single mutants, respectively. Plants were grown at 22°C, 60% relative humidity, and 60 μE m−2 s−1 (FSL, LED T8 22W) under a 16-h light/8-h dark cycle on soil (Jiffy, Netherlands).
The stable transgenic line eds1-2 EDS1pro:EDS1-GFP was used to monitor green fluorescent protein (GFP) fluorescence. The leaves from 3-week-old seedlings after FB1 or LCB treatment were observed with a laser scanning confocal microscope (LSM-880, Carl Zeiss, Germany). The excitation/emission wavelengths were 488/500–530 nm for GFP. All images were obtained with the same laser parameters.
The culture and infection of virulent strain Pseudomonas syringae pv. maculicola ES4326 strain DG3 (PsmDG3) was performed as previously described (Guttman and Greenberg, 2001). Briefly, the third to fifth leaves of 3- or 4-week-old plants were infiltrated with PsmDG3 at an OD600 of 0.001 [1.08 × 10⁷ colony forming units (cfu)/ml] or 10 mM MgSO4 (mock). For bacterial growth assays, at least 30 plants per line were tested and 6–24 independent leaf disks collected at 0, 2, or 3 days post-inoculation (dpi). The leaf disks were ground in 200 μl 10 mM MgSO4, and serial dilutions were plated on King’s B medium (King et al., 1954) with 100 μg/ml streptomycin and 50 μg/ml kanamycin. Bacterial cfu were counted 2 days after incubation at 28°C.
For benzothiadiazole (BTH) treatments, 3-week-old seedlings grown on soil were sprayed with 300 μM BTH (ECG4310, Wako) prepared from a 100-mM stock solution in acetone or with 0.3% acetone (for mock treatment). For salicylic acid (SA) treatment, 3-week-old seedlings grown on soil were sprayed with 200 μM SA (S7401, Sigma) prepared from a 200-mM stock solution in ethanol or with 0.1% ethanol (mock). Samples were collected at the indicated time points in Figures 1C–E and Supplementary Figure 5.
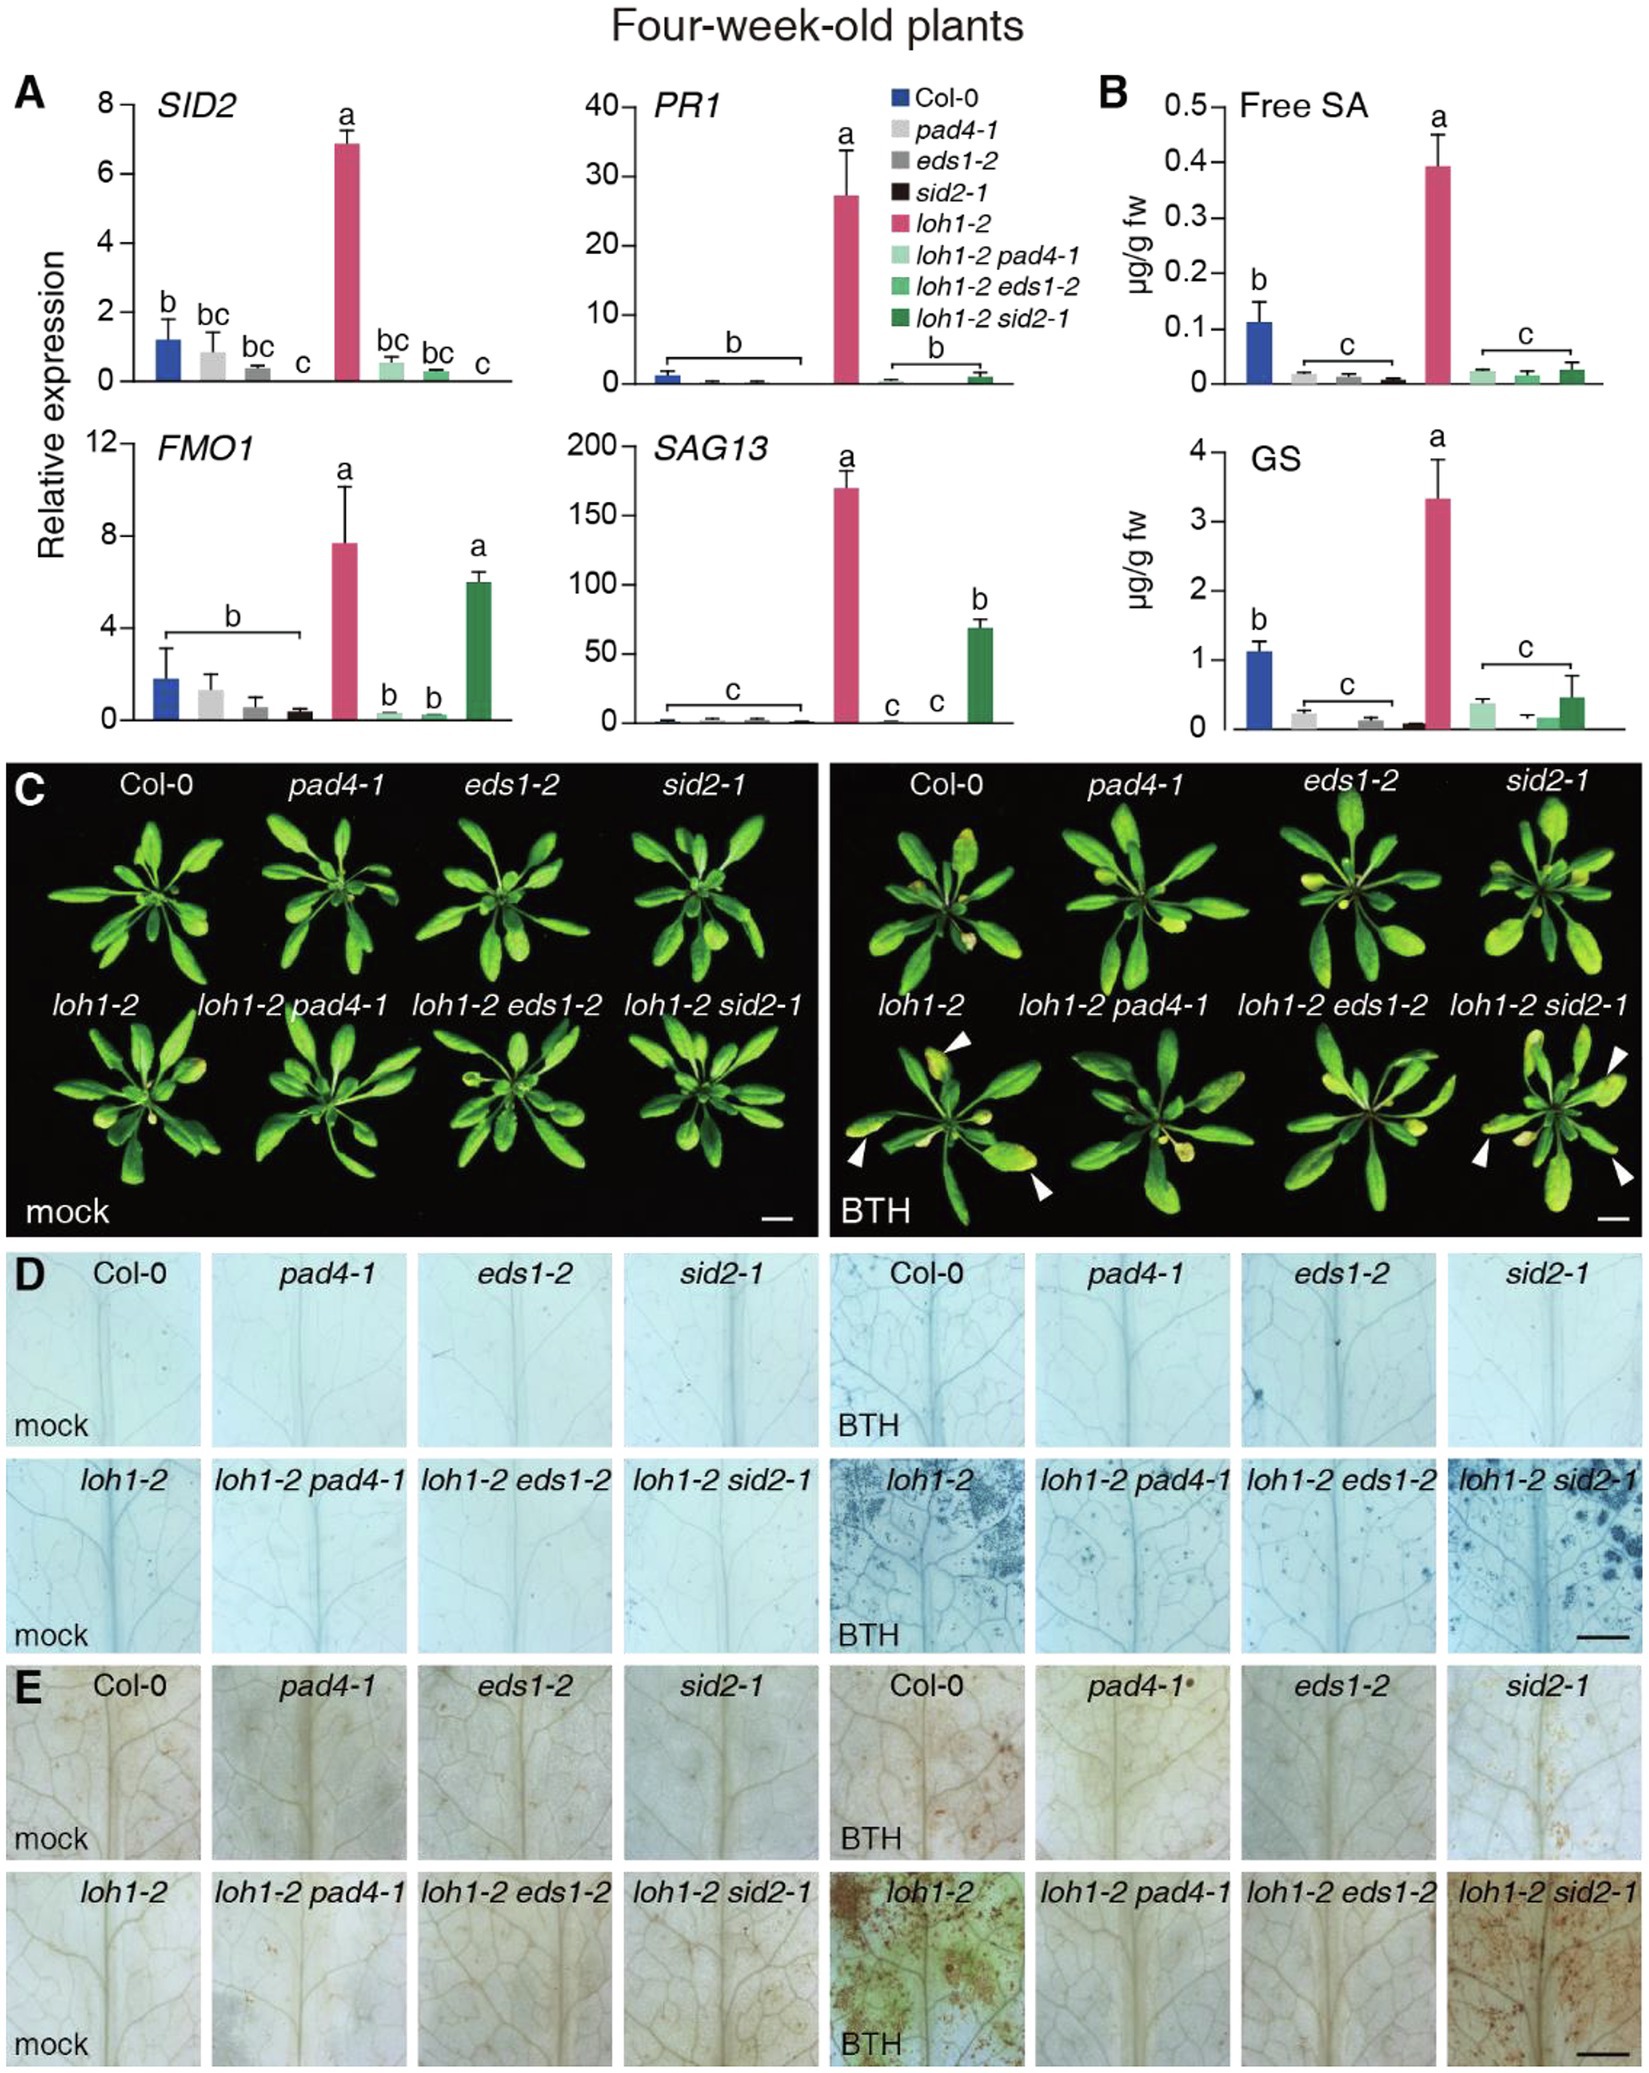
Figure 1. Effect of the pad4-1, eds1-2, and sid2-1 mutations on benzothiadiazole (BTH) treatment in loh1-2. (A) Relative transcript levels of SALICYLIC ACID INDUCTION DEFICIENT 2 (SID2), PATHOGENESIS RELATED-1 (PR1), FLAVIN-DEPENDENT MONOOXYGENASE 1 (FMO1), and SENESCENCE-ASSOCIATED GENE 13 (SAG13) in 4-week-old plants. ACT2 served as the internal control. Values were normalized to Col-0 levels (set to 1). (B) Free salicylic acid (SA) and glucosylated SA (GS) levels were measured in the indicated plants. (C) Representative images of plants (inflorescence stems were removed before we photographed the plants) treated with BTH. Three-week-old plants were sprayed with 300 μM BTH and observed 1 week later. White arrowheads indicate cell death lesions. Bar = 1 cm. (D) Trypan blue staining of leaves from (C). Bar = 1 mm. (E) DAB staining of leaves from (C). Bar = 1 mm. Values are means ± SE from triplicate biological repeats; different letters indicate significant differences, as determined by Fisher’s PLSD (p < 0.05) in (A,B). At least, 40 plants per line were tested each time in (C) and at least 12 leaves per line were stained each time in (D,E). All experiments were conducted at least three times using independent samples.
For fumonisin B1 (FB1) treatment, the third to fifth leaves of 3-week-old plants grown on soil were infiltrated with 10 μM FB1 prepared from a 1 mM stock solution containing 10% methanol or with 0.1% methanol (mock). Samples were collected at the indicated time points in Figures 2A–F, 3, 4D and Supplementary Figures 9,10, 11A–C.
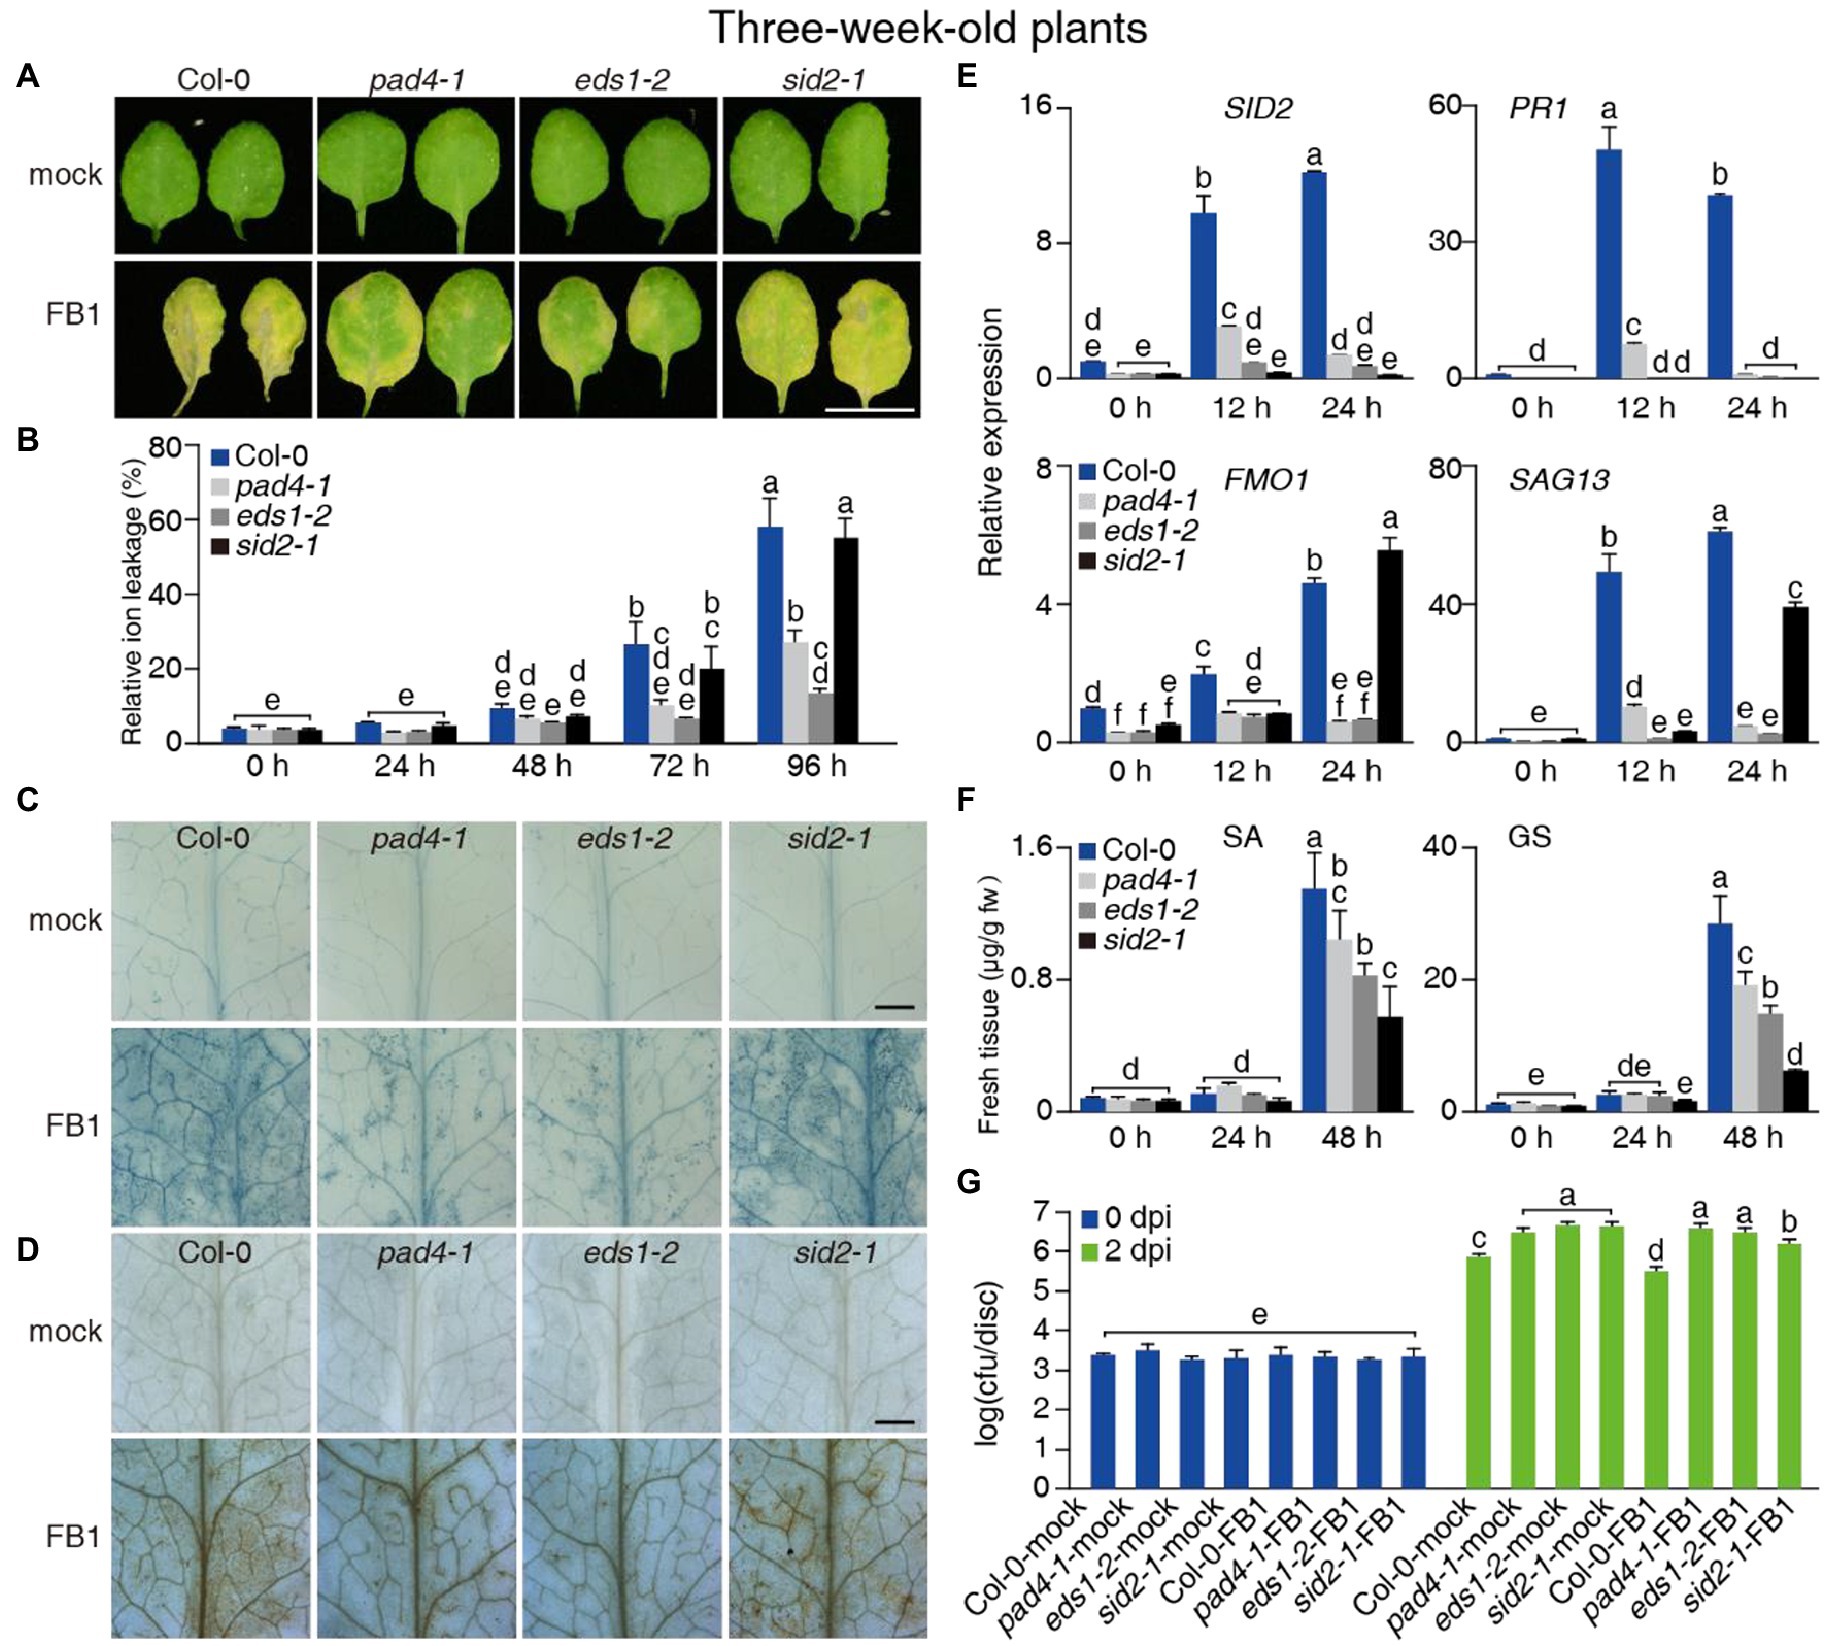
Figure 2. Effect of the pad4-1, eds1-2, and sid2-1 mutations on FB1-triggered cell death and resistance to PsmDG3. (A–F) Three-week-old Col-0, pad4-1, eds1-2, and sid2-1 plants were treated with mock or 10 μM FB1. (A) Representative images of detached leaves 4 days after treatment. Bar = 1 cm. (B) Relative ion leakage detection of plants 24–96 h after treatments. (C,D) Trypan blue (C) and DAB (D) staining of plants 3 days after treatments. Bars in (C,D) = 1 mm. (E) Relative transcript levels for SID2, PR1, FMO1, and SAG13 in plants 12 and 24 h after 10 μM FB1 treatments. ACT2 served as internal control. Values were normalized to Col-0 levels (set to 1). (F) Free SA and GS levels in plants 24 and 48 h after 10 μM FB1 treatments. (G) Growth of PsmDG3 in FB1-treated plants 2 dpi. The plants were sprayed with 0.5 mM FB1 1 day before PsmDG3 inoculation. Values are means ± SE from triplicate biological repeats in (B,E,F), six biological replicates at 0 dpi and 24 biological replicates at 2 dpi in (G). Different letters indicate significant differences assessed among all genotypes/time points, as determined by Fisher’s PLSD (p < 0.05; B,E–G). At least 30 plants per line were tested each time in (A,B,G), at least 12 leaves per line were stained each time in (C,D). All experiments were conducted at least three times independently.
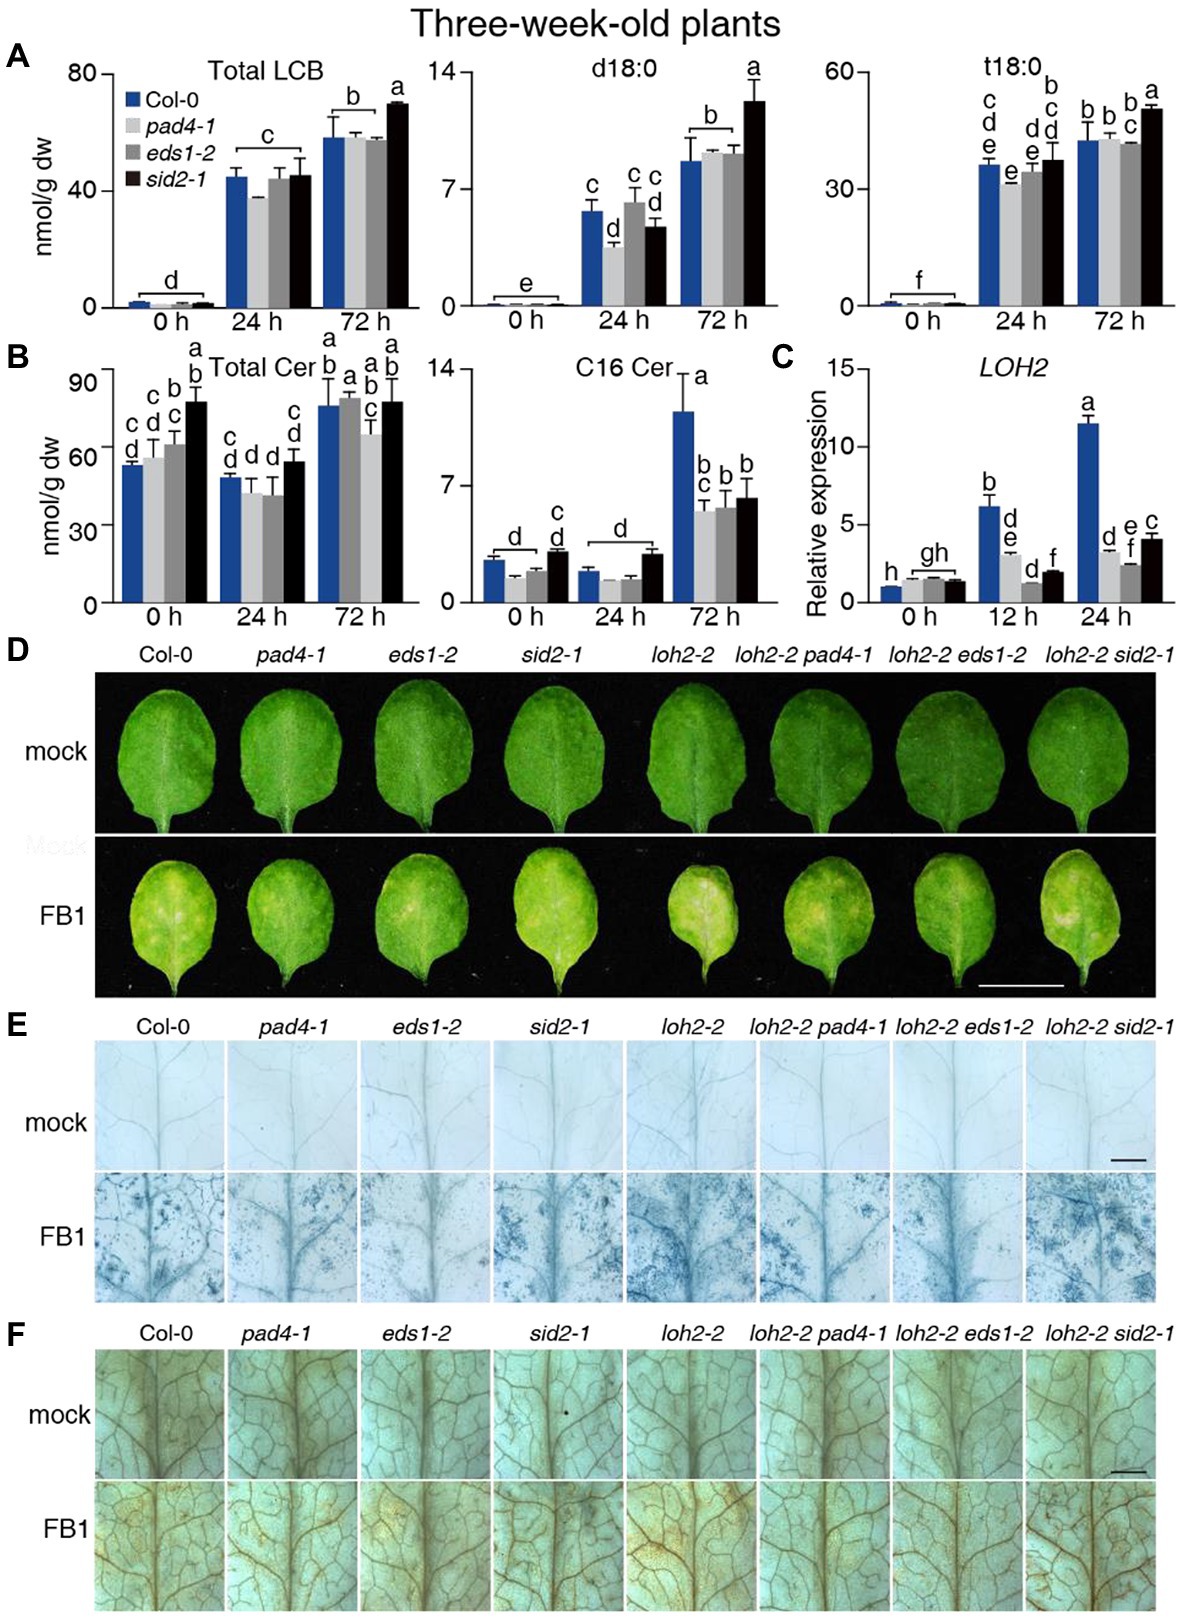
Figure 3. Sphingolipid profile of 3-week-old Col-0, pad4-1-, eds1-2-, and sid2-1-plants upon FB1 treatment. (A) Total contents of LCB, d18:0, and t18:0. (B) Total contents of Cer and C16 Cer. (C) Relative LOH2 transcript levels in plants before (0 h), 12 or 24 h post 10 μM FB1 treatment. ACT2 served as the internal control. Values were normalized to Col-0 levels (set to 1). (D) The phenotype of plants 2 days post-FB1 treatment. Bar = 1 cm. (E) Trypan blue staining of leaves from (D). Bar = 1 mm. (F) DAB staining of leaves from (D). Bar = 1 mm. Values are means ± SE from triplicate biological repeats in (A–C). Different letters indicate significant differences between all genotypes/time points, as determined by Fisher’s PLSD (p < 0.05). At least 30 plants per line were tested each time in (D) and at least 12 leaves per line were stained each time in (E,F). The experiments were repeated three times using independent samples.
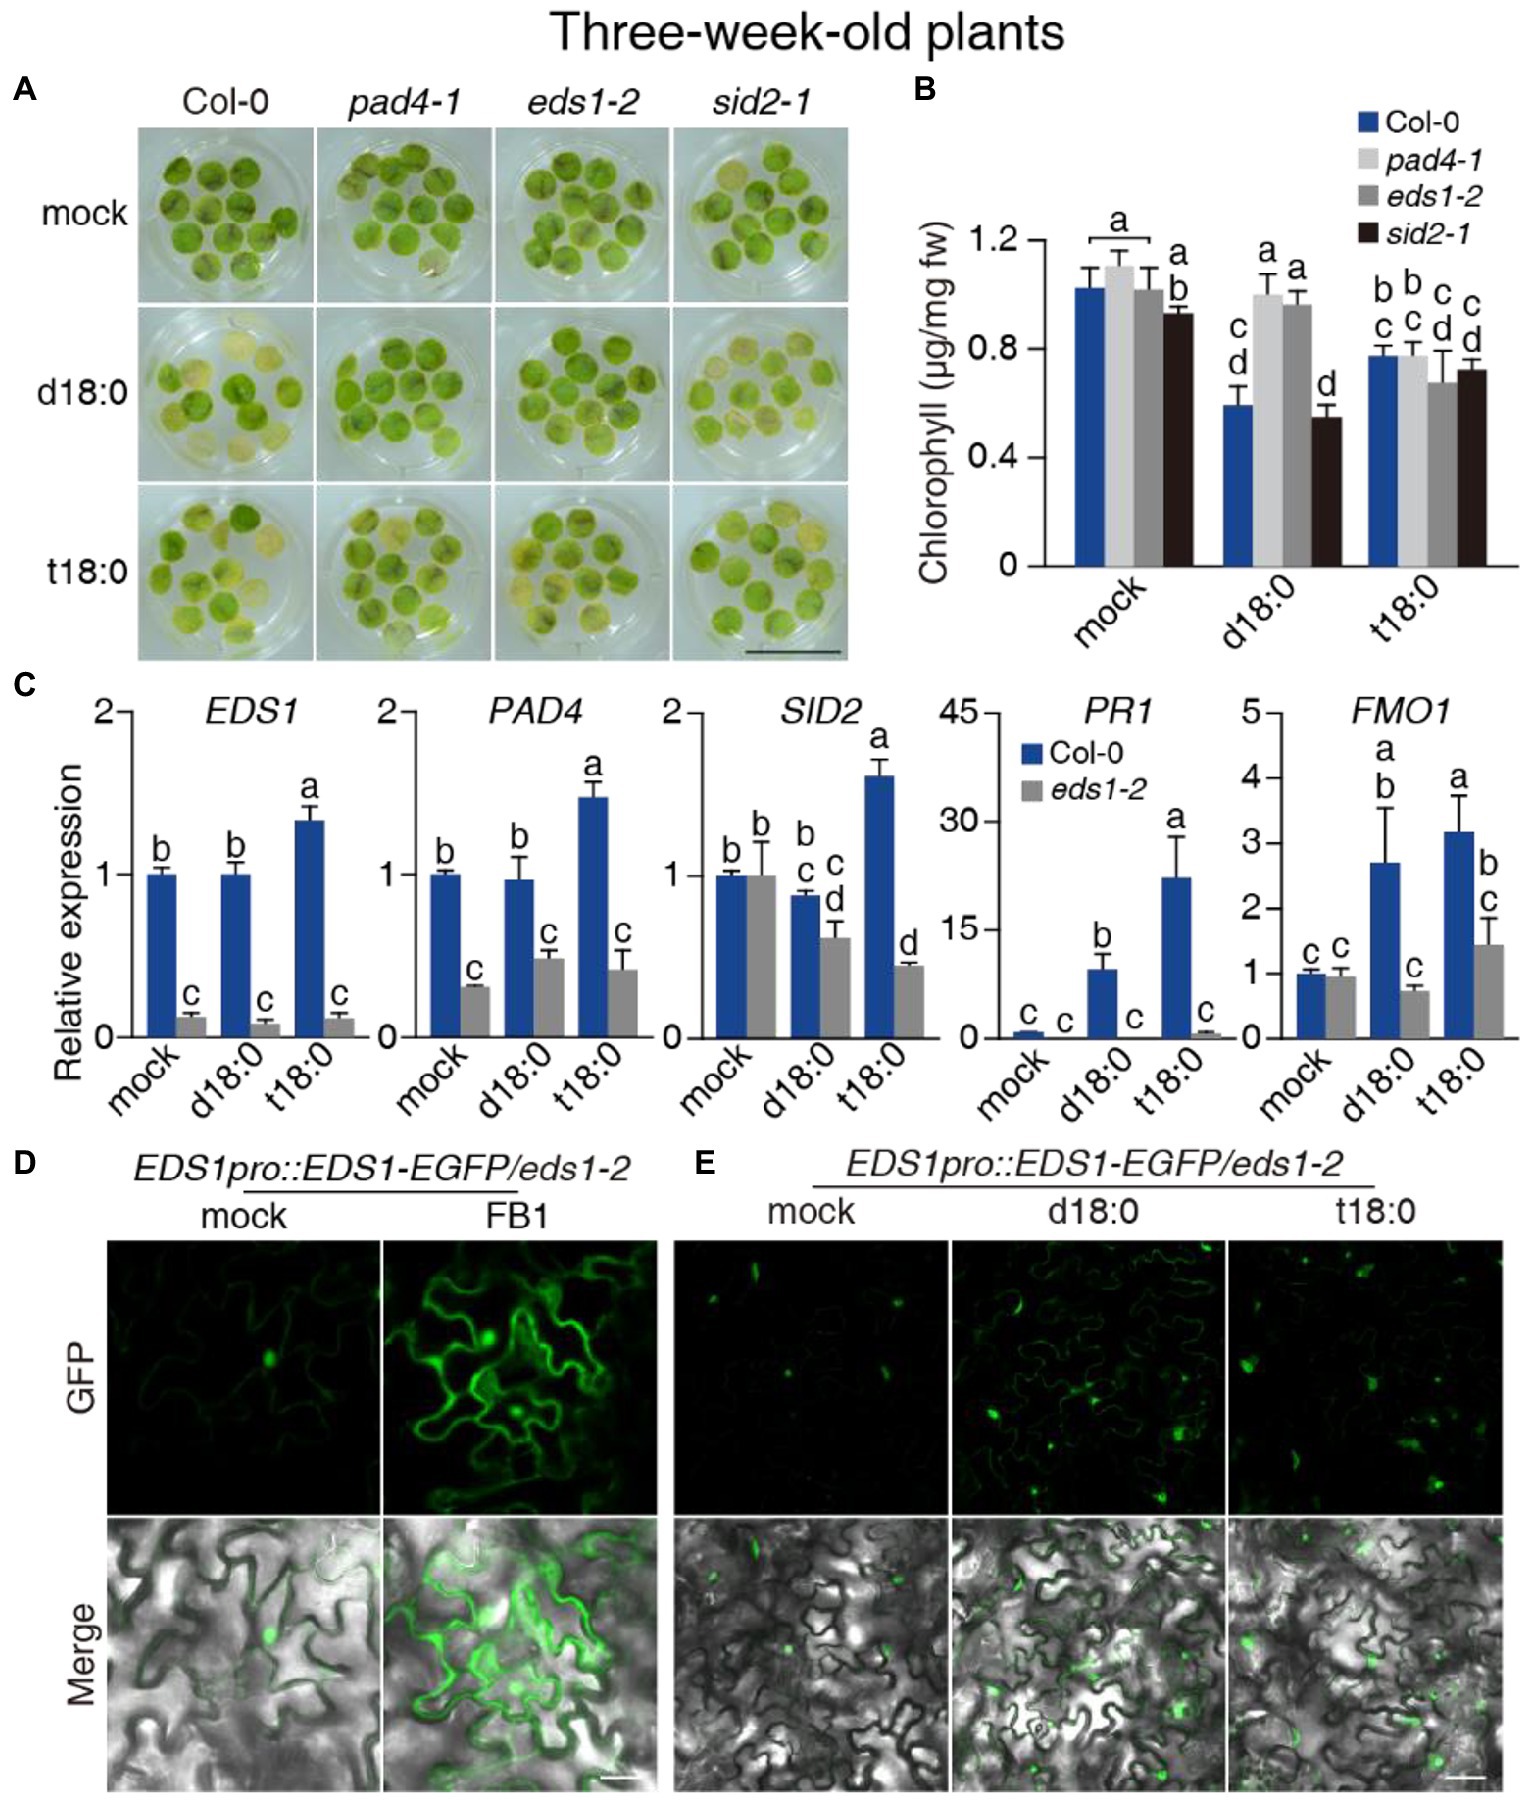
Figure 4. Effect of the pad4-1, eds1-2, and sid2-1 mutations on LCB-induced cell death and immunity and the response of EDS1 protein to LCBs. (A) Representative images of detached leaf disks 5 days after 100 μM LCBs (d18:0 or t18:0) treatment. At least 36 leaf disks per line were test each time. Bar = 1 cm. (B) Chlorophyll content 5 days after treatment from (A). (C) Relative transcript levels for EDS1, PAD4, SID2, PR1, and FMO1 in 3-week-old plants 24 h after 0.5% ethanol (mock) treatment or treatment with 100 μM d18:0 or t18:0. ACT2 served as the internal control. Values were normalized to Col-0 levels (set to 1). (D,E) EDS1 protein accumulated in FB1-treated (D) and LCB-treated (E) 3-week-old eds1-2 EDS1pro:EDS1-EGFP transgenic plants. A representative confocal live epidermal cell image was shown from at least 30 leaves per line. Bar = 20 μm. Values are means ± SE from triplicate biological repeats in (B,C). Different letters indicate significant differences between all genotypes/treatments, as determined by Fisher’s PLSD (p < 0.05) in (B,C). All experiments were conducted at least three times using independent samples.
For treatment with LCB sphingolipids shown in Figures 4A,B, leaf disks were collected from the third to fifth leaves of 3-week-old plants grown on soil. The leaf discs were placed in the wells of 12-well plates containing 100 μM LCB (d18:0 or t18:0) prepared from a 20 mM stock solution in ethanol or 0.5% ethanol (mock). The 12-well plates were incubated in the greenhouse. In Figures 4C,E, the third to fifth leaves of 3-week-old plants grown on soil were infiltrated with 100 μM LCB (d18:0 or t18:0) or 0.5% methanol (mock). In Supplementary Figures 11D–I, the third to fifth leaves of 3-week-old plants grown on soil were infiltrated with 1 mM LCB (d18:0 or t18:0) or 0.1% methanol (mock).
For combined treatments with BTH and FB1, 3-week-old plants grown on soil were sprayed with 300 μM BTH or 0.3% acetone (mock), followed by infiltration of the third to fifth leaves of the same plants with 10 μM FB1 24 h later. Samples were collected at the indicated time points in Supplementary Figure 9.
For combined treatments with FB1 and PsmDG3, 3-week-old plants grown on soil were sprayed with 0.5 μM FB1 or 0.005% methanol (mock), followed by inoculation of the third to fifth leaves of the same plants with PsmDG3 at an OD600 of 0.001 24 h later. Samples were collected at the indicated the time points in Figure 2G.
Trypan blue staining and 3,3′-diaminobenzidine (DAB) staining were performed as described (Zeng et al., 2021). Briefly, the leaves were harvested at the indicated time points in Figures 1–3, 5, 6, and Supplementary Figures 2, 4, 5, 11 into solution containing 2.5 mg/ml trypan blue (Sigma-Aldrich), 25% (v/v) lactic acid, 25% (v/v) water-saturated phenol, 25% (v/v) glycerol, and 25% (v/v) distilled water, or into distilled water (pH 5.5) containing 1 mg/ml DAB (Sigma-Aldrich). The detached leaves were observed under a fluorescence microscope with a charge-coupled device (CCD) camera (AxioCam HRc; Carl Zeiss).
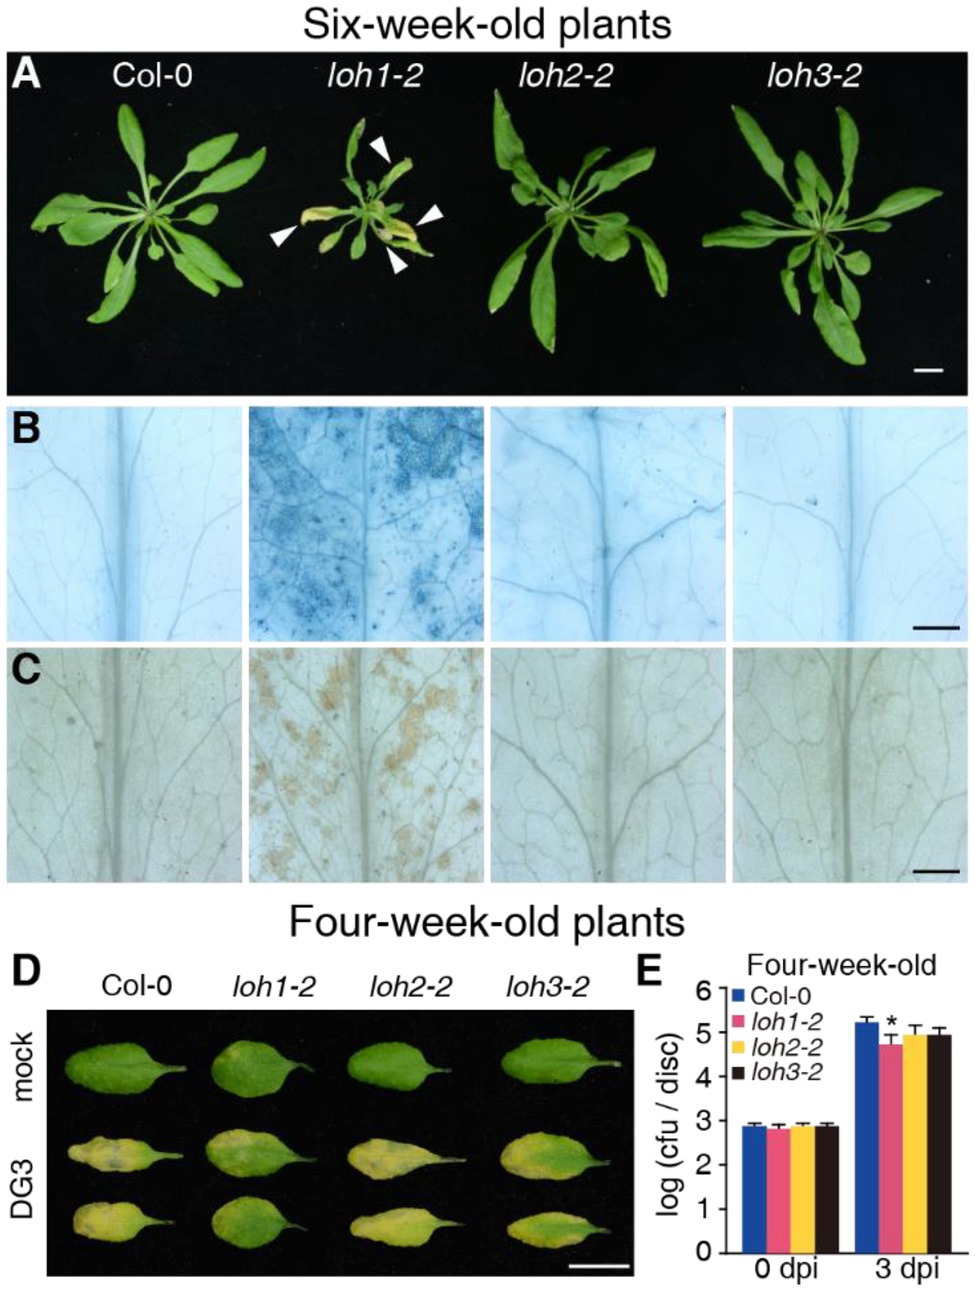
Figure 5. Defense responses of Col-0, loh1-2, loh2-1, and loh3-2 plants. (A) Growth phenotypes of 6-week-old plants (inflorescence stems were removed before we photographed the plants). Bar = 1 cm. White arrowheads indicate cell death lesions. (B) Trypan blue staining of leaves from (A). Bar = 1 mm. (C) 3,3′-diaminobenzidine (DAB) staining of leaves from (A). Bar = 1 mm. (D) The rosette leaves from 4-week-old plants were inoculated with PsmDG3, and the pictures of leaves were taken 3 days after inoculation. Bar = 1 cm. (E) Growth of PsmDG3 in leaves from 4-week-old plants in (D). Trypan blue (B) and DAB staining (C) of untreated leaves. At least 12 leaves per line were stained each time in (B,C), and at least 30 plants per line were tested each time in (D,E). Values are means ± SE from six biological replicates at 0 days post-infection (dpi) and 24 biological replicates at 3 dpi in (E). Significant differences between Col-0 and loh1-2, loh2-2, or loh3-2 were determined by Student’s t-test (*p < 0.05) in (E). The experiments were conducted three times independently.
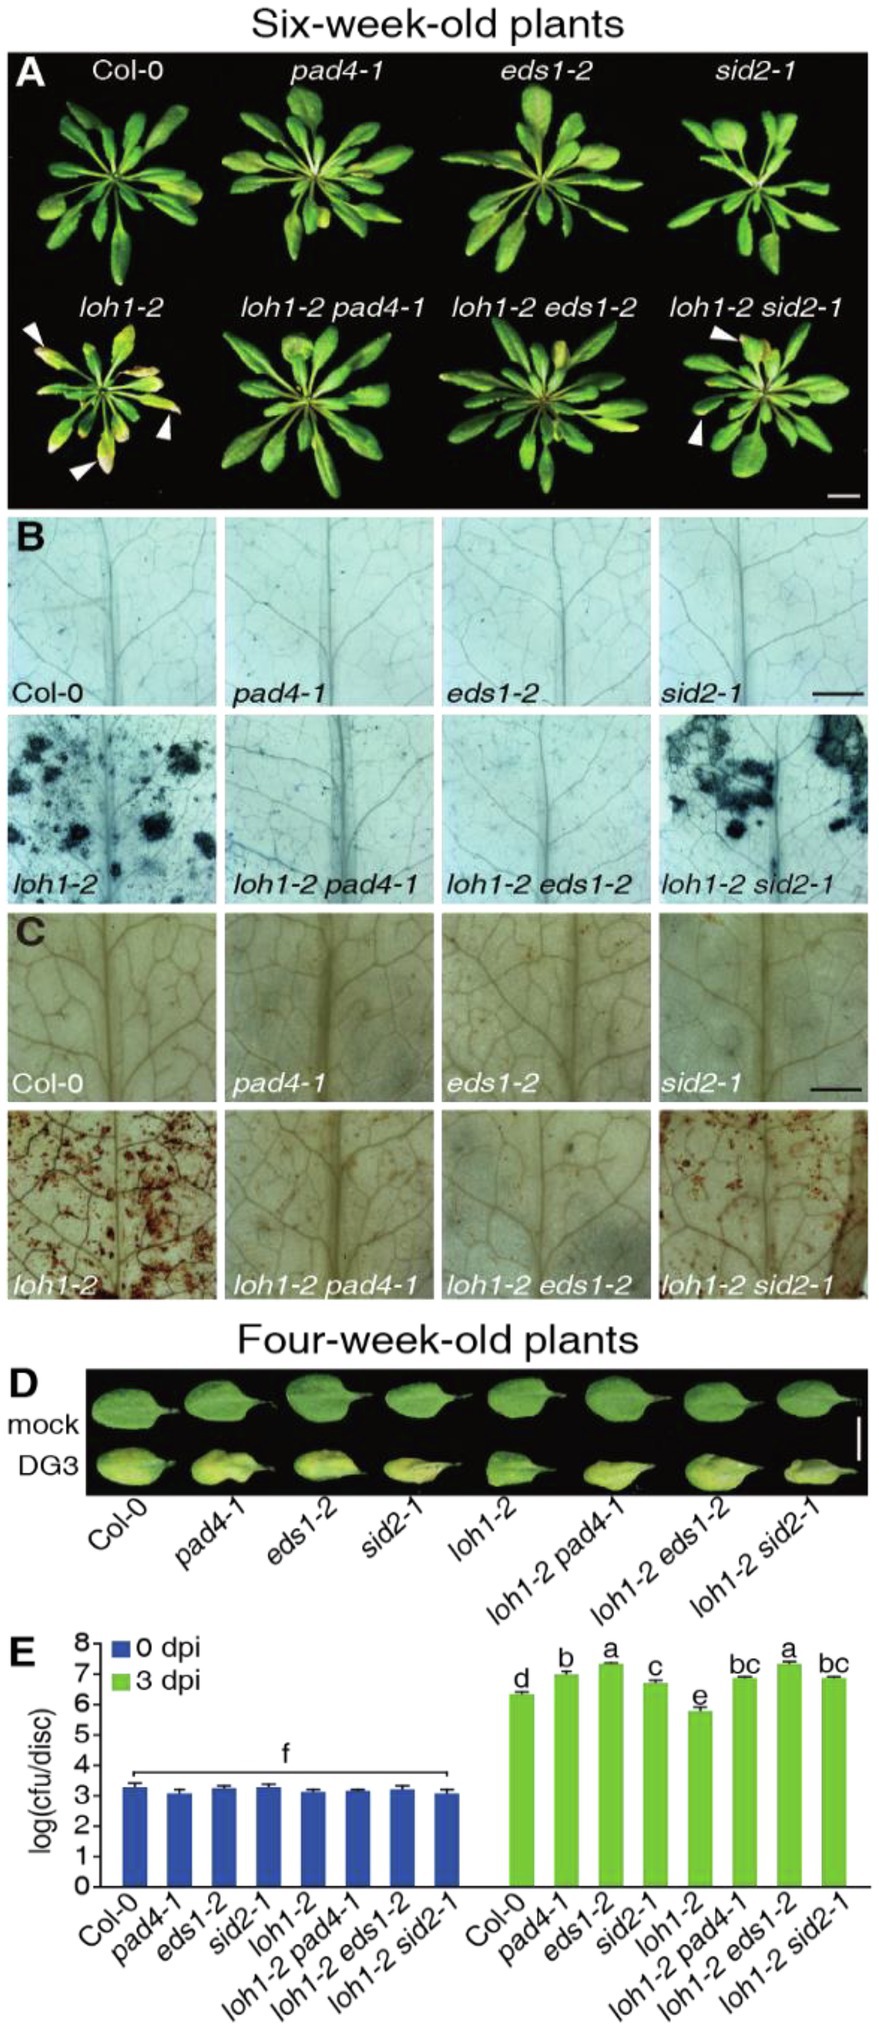
Figure 6. Effect of the pad4-1, eds1-2, and sid2-1 mutations on the immune response and cell death caused by loh1-2. (A) Growth phenotypes of 6-week-old plants (inflorescence stems were removed before we photographed the plants). White arrowheads indicate cell death lesions. Bar = 1 cm. (B) Trypan blue staining of leaves from (A). Bar = 1 mm. (C) DAB staining of leaves from (A). Bar = 1 mm. (D) The rosette leaves from 4-week-old plants were inoculated with PsmDG3, and the pictures of leaves were taken 3 days after inoculation. Bar = 1 cm. (E) Growth of PsmDG3 in leaves from (D). Trypan blue (B) and DAB staining (C) of untreated leaves. At least 12 leaves per line were stained each time in (B,C). At least, 30 plants per line were tested each time in (D,E). Values are means ± SE from six biological replicates at 0 dpi and 24 biological replicates at 3 dpi in (E). Different letters indicate significant differences assessed among all genotypes/time points, as determined by Fisher’s protected least significant difference (PLSD; p < 0.05) in (E). The experiments were conducted three times using independent samples.
Samples for sphingolipid analysis were prepared and the components of sphingolipids were determined as described previously (Zeng et al., 2021). Briefly, sphingolipid was extracted from about 100 mg of leaves by the lower phase of isopropanol/hexane/water (55, 20, and 25, v/v/v) with internal standards (C17 base D-erythro-sphingosine, d18:1 C12:0-ceramide, d18:1 C12:0-glucosylceramide, and ganglioside GM1). Analyses of LCBs (where values for total LCBs are given, these are endogenous free LCBs), Cers, hCers, and GlcCers were performed using an ultrafast liquid chromatograph (UFLC LC-20A, Shimadzu), with a 2 × 150 mm Luna 3-μm column (Phenomenex) for C8 separation, coupled to a quadrupole time-of-flight (AB Sciex Triple TOF 5600). The raw mass spectrometry (MS) data (wiff.scan files) were collected with Analyst 1.6.1 software (Applied Biosystems) and peaks for individual sphingolipids were assigned based on elution time and fragments of known standards. Analyses of GIPCs were performed using a high-performance liquid chromatograph (HPLC 1200SL, Agilent) coupled to a Triple Quad (6410, Agilent) with a 2 × 150 mm Luna 3-μm column (Phenomenex) for C8 separation.
Total RNA was extracted with a Plant RNA kit (R4151-02; Magen) and reverse-transcribed into first-strand cDNA using the Prime Script RT Reagent Kit (RR047A; Takara). Real-time PCR was performed using the SYBR Premix Ex TaqII kit (RR820A; Takara) on a LightCycler480 system (Roche) with the following conditions: initial denaturation at 95°C for 30 s, followed by 40 cycles of PCR (denaturing, 95°C for 5 s; annealing, 60°C for 30 s; extension, and 72°C for 20 s). Relative transcript levels were determined by applying the 2-△△CT method and using ACT2 as reference (Livak and Schmittgen, 2001). Primers used in this study are listed in Supplementary Table 6.
Salicylic acid and glucosylated SA (GS) were extracted and measured by liquid chromatography–mass spectrometry (LC–MS) as described previously (Zeng et al., 2021). The powdered samples (50 mg) were sealed in microcentrifuge tubes containing 500 μl of extraction buffer (isopropanol: water: concentrated HCl; 2:1:0.002; v/v/v) with internal standards [10 ng D4-SA (OlChemim)]. The samples were analyzed by LC–MS (LC model no. UFLC-XR, Shimadzu) coupled with a quadrupole TripleTOF 5600+ System (AB SCIEX) using a Luna C18 column (150 × 2.1 mm, 2.6 μm, Phenomenex).
Electrolyte leakage was determined as previously described (Yang et al., 2019). Briefly, the third to fifth leaves of 3-week-old rosettes were collected into 50-ml tubes at the indicated time points in Figure 2B and Supplementary Figure 9B. The conductivity of the solution was measured after adding 10 ml deionized water and gentle agitation at room temperature for 1 h. Afterward, the solution with the leaf was boiled in a boiling water bath for more than 10 min and cooled to room temperature before measuring total electrolyte strength. Relative electrolyte leakage was calculated by comparing the leaked ionic strength with the corresponding total ionic strength.
Results are expressed as means ± SE. Significant differences were determined by ANOVA post-hoc tests in conjunction with Fisher’s protected least significant difference (PLSD) test (p < 0.05) using different letters or determined by Student’s t-test (*p < 0.05, **p < 0.05, and ns indicates no significance difference). The number of biological replicates is given in the legends.
Sequence data from this article can be found in the Arabidopsis Genome Initiative or the GenBank/EMBL data libraries under accession numbers: At3g48090 (EDS1), At3g52430 (PAD4), At1g74710 (SID2), At1g19250 (FMO1), At2g29350 (SAG13), At2g14610 (PR1), At3g25540 (LOH1), At3g19260 (LOH2), At1g13580 (LOH3), and At3g18780 (ACT2).
We obtained the strong loss-of-function mutant alleles loh1-2, loh2-2, and loh3-2 for phenotypic analysis. When grown under normal conditions for 3–4 weeks, loh1-2, loh2-2, and loh3-2 mutant plants were indistinguishable from the wild-type Col-0 (Supplementary Figures 2A,D). We observed no cell death phenotype in 3-week-old loh mutant plants, based on trypan blue and diaminobenzidine staining, with some cell death in 4-week-old loh1 plants (Supplementary Figure 2). Unexpectedly, loh1-2 plants exhibited clear senescence and cell death phenotypes after growth for 6 weeks under normal conditions, while Col-0, loh2-2, and loh3-2 plants did not (Figures 5A–C), although previous studies reported loh1-2 only developed spontaneous cell death when grown under short-day conditions (Markham et al., 2011; Ternes et al., 2011).
We next investigated whether LOHs are required for plant immunity. To evaluate the potential involvement of LOHs during infection with PsmDG3, which was derived from Psm strain ES4326 (Liang et al., 2003), we measured relative LOH transcript levels in wild-type plants infected with PsmDG3. LOH1 and LOH2 expression was slightly upregulated 24 h after infection, while LOH2 and LOH3 expression strongly increased 48 h after infection (Supplementary Figure 3A). Following challenge of 4-week-old wild-type and mutant plants with PsmDG3, only the loh1-2 mutant, but not loh2-2 or loh3-2, was resistant to PsmDG3 infection relative to wild type (Figures 5D,E). Prior to PsmDG3 infection, the relative transcript levels of the defense-associated gene PR1 were already higher in loh1-2 compared with Col-0, loh2-2, and loh3-2, while PR1 transcript levels rose to equally high levels in all genotypes following PsmDG3 infection (Supplementary Figure 3B), indicating that the resistance seen in loh1-2 in response to PsmDG3 is associated with the pre-activation of defense-associated gene expression.
We also tested the weak but viable loh1-1 loh3-1 double mutant for phenotyping. As previously reported (Markham et al., 2011), 5-week-old loh1-1 loh3-1 mutants showed senescence and cell death phenotypes (Supplementary Figures 4A–C). Upon PsmDG3 infection, 3-week-old loh1-1 loh3-1 plants were more resistant to the pathogen (Supplementary Figure 4D) and supported less bacterial growth (Supplementary Figure 4E) than the wild type. These results indicate that knocking down LOH1 and LOH3 triggers plant cell death and confers resistance to PsmDG3 infection.
We recently showed that cell death induced by LOH2 overexpression requires the crucial immune components EDS1 and PAD4 (Zeng et al., 2021). We therefore evaluated their potential involvement, as well as that of SID2, in the cell death and immune responses seen in loh1-2 by generating double mutants. The pad4-1 and eds1-2 mutants mostly suppressed the cell death phenotype of loh1-2 and the sid2-1 mutant only partially suppressed this phenotype (Figures 6A–C). In agreement, the pad4-1, eds1-2, and sid2-1 mutants largely abolished the resistance exhibited by the loh1-2 mutant against PsmDG3 infection, as evidenced by the higher bacterial growth obtained in these double mutants (Figures 6D,E).
We next tested the transcript levels of defense-associated genes in wild-type and loh mutant plants. The expression of SID2, PR1, and FLAVIN-DEPENDENT MONOOXYGENASE 1 (FMO1), a EDS1/PAD4-dependent and SA-independent gene (Cui et al., 2017), as well as the cell death marker SENESCENCE-ASSOCIATED GENE 13 (SAG13) reached higher levels in the loh1-2 single and loh1-1 loh3-1 double mutant relative to their respective wild-type plants (Col-0 for loh1-2 and Ws for loh1-1 loh3-1; Figure 1A; Supplementary Figure 4F). In addition, SID2 and PR1 transcript levels, which are regulated by EDS1/PAD4 and SA, were sharply lower in loh1-2 pad4-1, loh1-2 eds1-2, and loh1-2 sid2-1 double mutants compared with wild type (Figure 1A). By contrast, transcript levels of FMO1 and SAG13 were much lower than wild type in loh1-2 pad4-1 and loh1-2 eds1-2 double mutants, but not in the loh1-2 sid2-1 double mutant (Figure 1A), indicating that the cell death phenotype observed in loh1-2 is EDS1/PAD4-dependent and partly SA-dependent. The loh1-2 single mutant accumulated higher levels of SA and GS, but the pad4-1, eds1-2, or sid2-1 mutants did not, either on their own or in combination with loh1-2, which was consistent with the SID2 transcript levels measured in these mutants (Figures 1A,B).
We next asked whether the pre-activation of SA-signaling induced the cell death phenotype of loh1-2. Accordingly, we treated plants harboring the loh1-2 mutation with SA or the SA-analog BTH. SA and BTH treatment resulted in cell death in loh1-2, but not in loh2-2 or loh3-2 (Supplementary Figure 5). Similarly, BTH induced cell death in the loh1-2 single and the loh1-2 sid2-1 double mutant; this effect was largely suppressed in the pad4-1 loh1-2 and eds1-2 loh1-2 double mutants (Figures 1C–E). These results indicated that SA promotes the development of cell death in loh1-2 mutants.
To investigate the roles of EDS1 and PAD4 in the regulation of sphingolipid metabolism during the initiation and execution of cell death in loh1-2, we used 3- and 6-week-old plants. The levels of total LCBs, Cer, hCer, and GlcCer in 3-week-old plants harboring the loh1-2 mutation were comparable to the wild type (Supplementary Figure 6A). Individual LCBs and C16 Cer slightly accumulated over wild-type levels in loh1-2 single or double mutant plants. We measured lower levels of C22, C24, and C26 Cer in loh1-2 single and double mutant plants compared with the wild type (Supplementary Figures 6B,C). The contents of Cers with LCB moieties in loh1-2 single and double mutant plants were similar to those of the wild type (Supplementary Figure 6D). We determined that most sphingolipid components do not change in the loh1-2 single or double mutant plants, except for several VLCF-sphingolipids (Supplementary Table 1).
By contrast, total LCBs, Cer, and hCer accumulated to high levels in 6-week-old loh1-2, but not in pad4-1 loh1-2 and eds1-2 loh1-2, and to high or intermediate levels in sid2-1 loh1-2, while GlcCer and GIPC contents in loh1-2-single and double mutant plants were similar to wild type (Figures 7A,B; Supplementary Figure 7A). We detected high levels of LCBs, especially d18:0 and t18:0, in loh1-2 and loh1-2 sid2-1, but not in loh1-2 pad4-1 or loh1-2 eds1-2 (Figure 7A; Supplementary Figure 7B). LCF Cer and VLCF Cer accumulated in the loh1-2 single mutant, but their accumulation was mostly lost in loh1-2 pad4-1, loh1-2 eds1-2, and loh1-2 sid2-1 plants (Figure 7B; Supplementary Figure 7B; Supplementary Table 2). The marked accumulation of Cer species with LCB moieties (d18:0 and t18:0 Cers) in loh1-2 decreased in loh1-2 pad4-1 and loh1-2 eds1-2 double mutants (Supplementary Figure 7C; Supplementary Table 2).
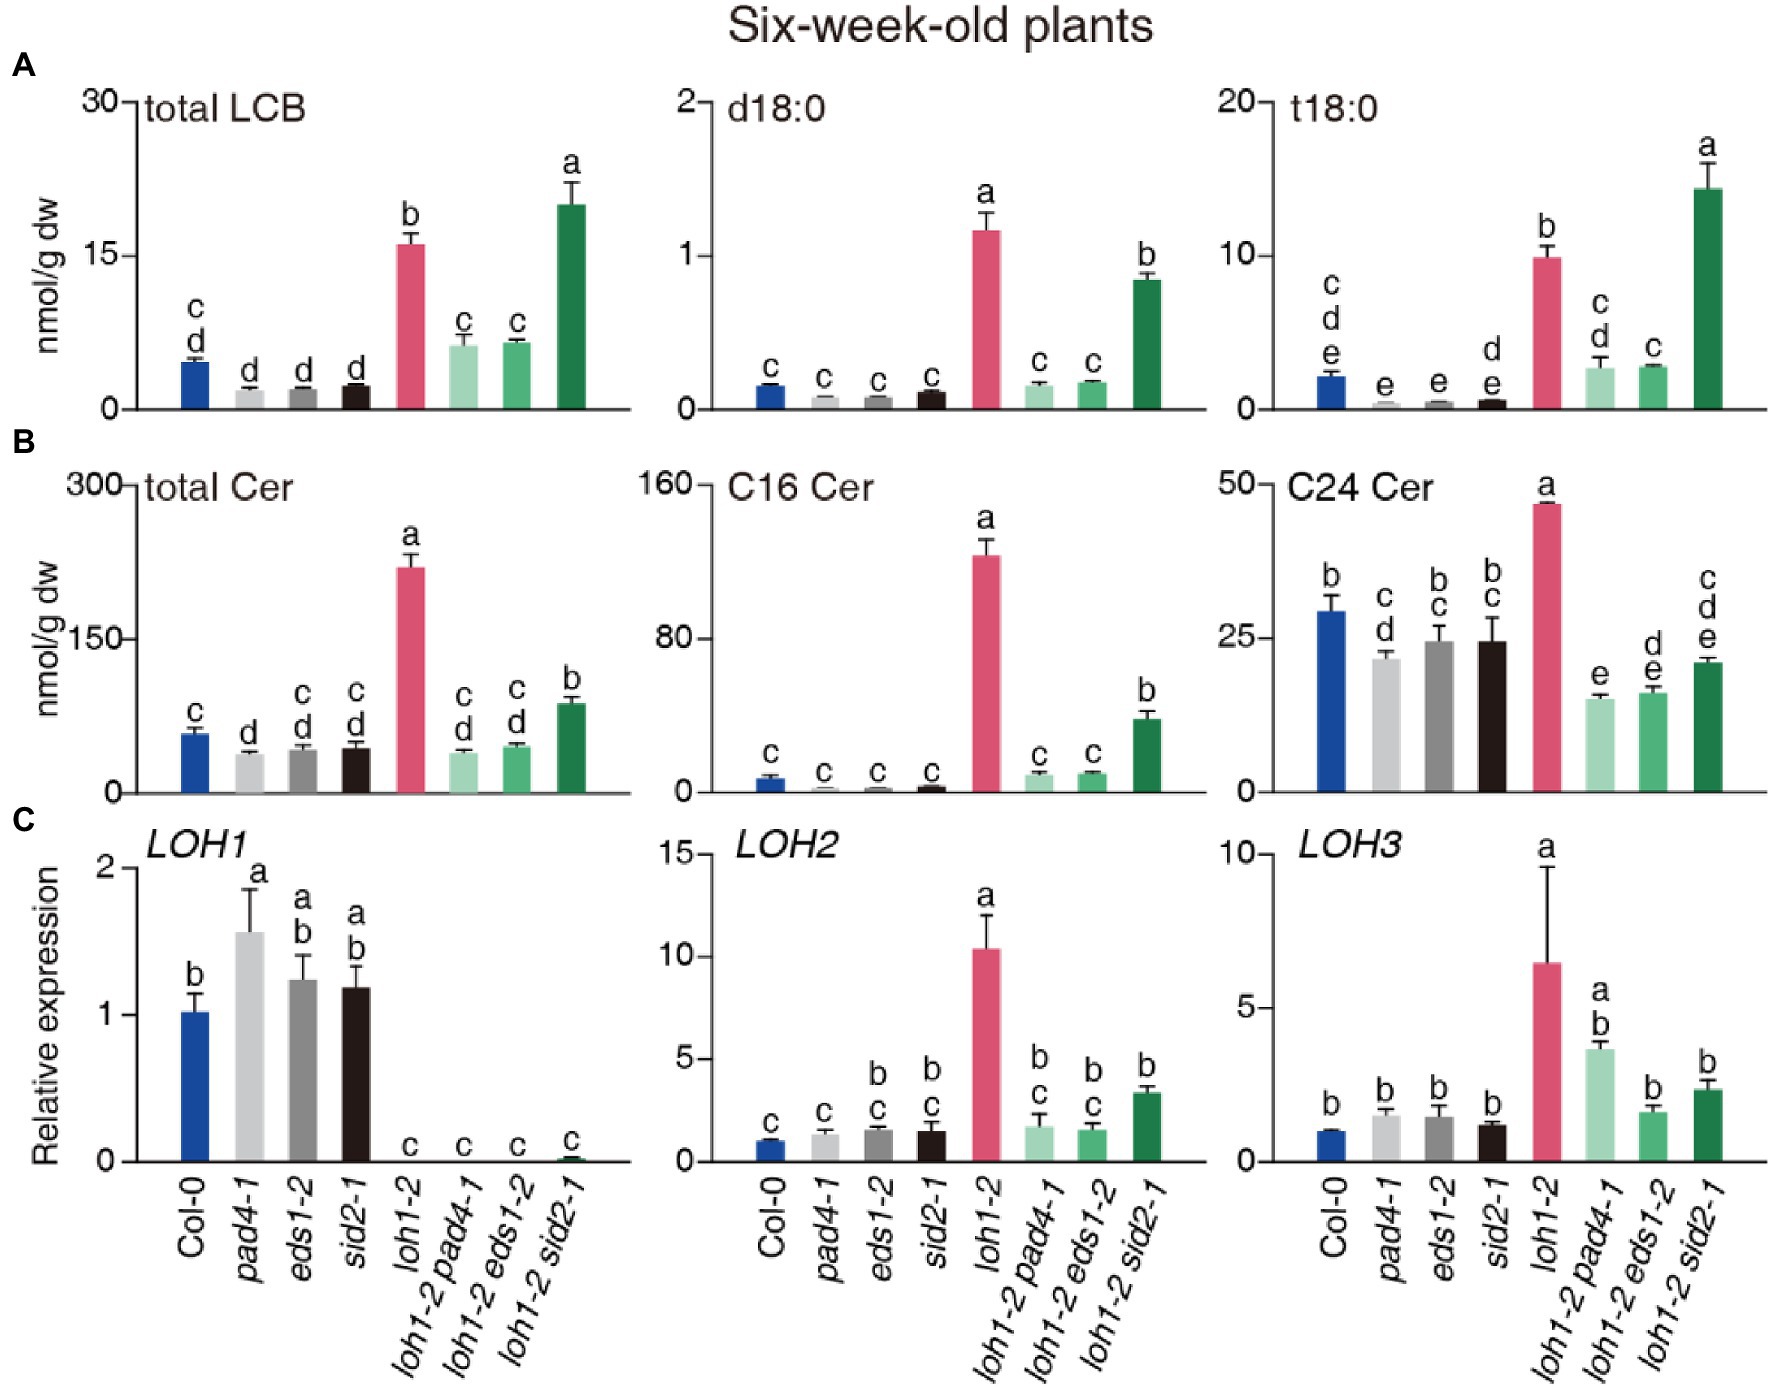
Figure 7. Total sphingolipid profile of 6-week-old Col-0, pad4-1, eds1-2, sid2-1, loh1-2, loh1-2 pad4-1, loh1-2 eds1-2, and loh1-2 sid2-1 plants. Sphingolipids were extracted and detected by HPLC-ESI-TOF-MS/MS. (A) Total contents of total LCB, d18:0, and t18:0. (B) Total contents of total Cer, C16 Cer, and C24 Cer. (C) Relative transcript levels for LOH1, LOH2, and LOH3 in uninfected plants. ACT2 served as internal control. Values are means ± SE from triplicate biological repeats in (A–C). Different letters indicate significant differences between genotypes, as determined by Fisher’s PLSD (p < 0.05). The experiments in (A–C) were conducted three times using independent samples.
We then asked whether the high levels of LCF Cer and VLCF Cer might be associated with LOH2 and LOH3 activity. First, we determined that LOH2 and LOH3 transcript levels are higher in the loh1-2 single mutant relative to the wild type and double mutants (Figure 7C), indicating that loss of LOH1 resulted in the induction of LOH2 and LOH3. We also detected higher transcript levels for LOH2 in the loh1-1 loh3-1 double mutant in the Ws background (Supplementary Figure 4F). Since we observed accumulation of C16 Cer in loh1-1, we tested whether the high accumulation of LCF Cer seen in LOH2-overexpressing plants increased resistance to PsmDG3 infection. Indeed, LOH2 overexpression (LOH2 A plants) enhanced plant resistance to PsmDG3 infection, but this effect was abrogated by the pad4-1, eds1-2, or sid2-1 mutations (Supplementary Figures 8A,B), indicating that LCF Cer induces plant resistance through PAD4, EDS1, and SA.
A previous study reported that FB1 inhibits LOH activity, especially LOH1 (Markham et al., 2011; Luttgeharm et al., 2016). Here, we asked whether PAD4 and EDS1 were required for plant responses to FB1. We infiltrated the leaves of 3-week-old wild-type, pad4-1, and eds1-2 plants with FB1. As shown in Figure 2A, pad4-1 and eds1-2 infiltrated leaves were much greener than wild type at 4 days after FB1 treatment. In agreement with the leaf color, relative ion leakage was lower in pad4-1 and eds1-2 at 72 and 96 h after FB1 infiltration, compared with the wild type (Figure 2B). Trypan blue and DAB staining showed more limited cell death in FB1-treated pad4-1 and eds1-2 leaves, compared with treated wild-type leaves (Figures 2C,D).
To further elucidate the association between FB1 tolerance phenotypes seen in pad4-1 and eds1-2 mutants and the PAD4/EDS1-dependent signaling pathways, we analyzed the transcript levels of SID2, PR1, FMO1, and SAG13 by RT-qPCR. The eds1-2 and pad4-1 single mutants significantly blocked the FB1-induced transcription of SID2, FMO1, and PR1 at 12 and 24 h after FB1 treatment compared with wild-type plants (Figure 2E). We next measured endogenous SA levels in wild-type and mutant rosettes treated with FB1 for 24 or 48 h. Consistent with previous findings (Zhang et al., 2015), FB1 treatment induced SA levels in rosettes from the wild type and the pad4-1 and eds1-2 mutants relative to their respective controls after 48 h (Figure 2F). SA and GS levels were lower in pad4-1 or eds1-2 mutants and much lower in the sid2-1 mutant compared with the wild type (Figure 2F). To investigate the role of SA in FB1-induced cell death, we pretreated plants with BTH 1 day before FB1 treatment. BTH treatment enhanced the FB1-sensitivity of wild-type and sid2-1 mutant plants, but not of pad4-1 or eds1-2 mutant plants (Supplementary Figures 9A,B). These findings indicated that FB1 activates the SA pathway, partly through PAD4 and EDS1, to enhance cell death.
We asked whether FB1 also induced plant immunity via EDS1, PAD4, or SA in plants. To test this hypothesis, we pretreated 3-week-old plants with FB1 1 day before PsmDG3 inoculation. To largely avoid FB1-induced cell death, which would interfere with our tests, we used a lower concentration of FB1 (0.5 μM) rather than the one we used in other experiments (10 μM). Compared with controls, FB1 substantially induced resistance in Col-0 plants, but not in pad4-1, eds1-2, and sid2-1 plants, as evidenced by the obtained cfu values, confirming the role of PAD4, EDS1, and SA in FB1-induced immunity (Figure 2G). Notably, combining this result with the observation that the FB1-induced cell death phenotype of sid2-1 was not prominent, it seems that SA contributes more to FB1-induced immunity than FB1-induced cell death.
We next detected and analyzed the changes in the sphingolipid profiles of wild-type and mutant plants after infiltration with FB1 for different periods. Total LCBs increased 26-fold in wild-type plants 24 and 72 h after FB1 treatment (Figure 3A), while we observed weak changes in Cer, hCer, or GlcCers levels (Figure 3B; Supplementary Figure 10B). Moreover, d18:0, d18:1, t18:0, and t18:1 content increased remarkably over controls, with t18:0 and d18:0 contributing the most in both the wild type and the mutants (Figure 3A; Supplementary Figure 10A). However, we detected little or no significant difference in the LCB content between wild-type and mutant plants for each time point (Figure 3A). Furthermore, the total Cer, C24 Cer, and C26 Cer contents increased slightly, while C16 Cer substantially increased in the wild type at 72 h post-treatment (Figure 3B; Supplementary Figure 10C). In addition, C16 Cer contents were much lower in the pad4-1, eds1-2, and sid2-1 mutants compared with the wild type 72 h after FB1 treatment (Figure 3B). As with Cers, we detected higher levels of LCF hCer in the wild type compared with the mutants (Supplementary Tables 3–5). For Cer species with LCB moieties, the strong accumulation of d18:0 induced by FB1 treatment decreased by ~50% in pad4-1, eds1-2, and sid2-1 mutants compared with the wild type (Supplementary Figure 10D; Supplementary Tables 3–5). Consistent with this, high levels of LOH2 expression in the wild type were significantly suppressed in pad4-1, eds1-2, and sid2-1 mutants (Figure 3C). These results aligned with our recent finding that LCF Cers accumulate in an EDS1/PAD4-dependent manner (Zeng et al., 2021).
We then investigated the role of LOH2 in FB1-induced cell death. The loh2-2 plants exhibited stronger phenotypes after FB1 treatment than wild-type, loh1-1, and loh3-2 plants (Supplementary Figures 11A–C). LOH2 likely prevents FB1-induced cell death by eliminating the effect of its substrate, d18:0. This hypothesis was confirmed by infiltrating wild-type and loh2-2 plants with d18:0 (Supplementary Figures 11D–F). Indeed, loh2-2 exhibited a more serious cell death phenotype than wild type after d18:0 treatment (Supplementary Figures 11D–F). Since LOH1 prefers t18:0 as a substrate, we also infiltrated the loh1-2 mutant with t18:0. No obvious difference was observed in the mutant compared with wild type after t18:0 treatment (Supplementary Figures 11G–I).
To rule out any involvement of LOH2 in FB1-induced cell death, we crossed loh2-2 to the pad4-1, eds1-2, and sid2-1 mutants. When compared with wild type, all loh2-2-containing plants showed more serious cell death phenotypes. However, the loh2-2 pad4-1 and loh2-2 eds1-2 double mutants displayed fewer signs of cell death than the loh2-2 single mutant (Figures 3D–F). This result implied that, besides preventing FB1-induced cell death through LOH2 during the later period, EDS1 and PAD4 mainly promote LCB-induced cell death, since LCBs (d18:0 and t18:0) accumulated in FB1-treated plants.
We next exposed pad4-1, eds1-2, and sid2-1 mutant plants to the d18:0 and t18:0 for phenotypic analysis. Since LCB treatments induced little cell death in wild-type plants (Supplementary Figures 11D–I), we treated detached leaf disks from the plants in 100 μM LCB rather than infiltrating the leaves with LCBs. As shown in Figure 4A, wild-type and sid2-1 plants exhibited senescence phenotypes after treatment for 5 days. Unlike wild-type and sid2-1 plants, the pad4-1 and eds1-2 plants remained green after treatment with d18:0 (Figure 4A). However, no significant difference was observed among the mutants after the t18:0 treatment (Figure 4B), indicating that EDS1 and PAD4 mainly regulate cell death triggered by d18:0, but not t18:0.
To investigate how LCBs mediate downstream signaling, we measured the transcript levels of EDS1 and PAD4-regulated genes upon d18:0 and t18:0 treatments. After d18:0 treatment for 24 h, only the expression levels of PR1 and FMO1 were elevated in wild type (Figure 4C). In the mutant plants treated with t18:0, besides PR1 and FMO1, expression of EDS1, PAD4, and SID2 were also induced (Figure 4C). The induction of these genes by d18:0 or t18:0 was largely compromised in eds1-2 mutants (Figure 4C), suggesting that both d18:0- and t18:0-induced immunity required the EDS1 signaling pathway. To test whether LCBs regulated EDS1 turnover as well, we made stable transgenic plants expressing EDS1-GFP in the eds1-2 mutant background (eds1-2 EDS1pro:EDS1-GFP) for FB1 and LCB treatments. As shown in Figures 4D,E, EDS1 protein accumulated in both the nucleus and the cytoplasm upon treatment with FB1 or LCBs, indicating that LCBs mediate downstream signaling in both the nucleus and the cytoplasm.
The precise control of LCBs and Cers is crucial for plants to survive and balance immunity in the face of pathogen attacks. Disruption of LCB/Cer homeostasis often causes growth inhibition, PCD, or activation of immune responses in plants (Zeng et al., 2020). CSs regulate the balance between LCBs and Cers, primarily by consuming LCB to synthesize Cer. Arabidopsis has two kinds of CSs that produce Cers with varied chemical compositions (Markham et al., 2011; Luttgeharm et al., 2016). However, how these two classes of CSs differentially regulate PCD, as well as immunity, through LCB and Cer metabolism in Arabidopsis remains largely unknown. Here, we characterize the contribution of various CSs to LCB levels and plant defense against a virulent pathogen. In wild type (Figure 8, left panel), CSI and CSII enzymes maintain normal levels of LCBs. In the absence of CSII (Figure 8, middle panel), LCBs accumulate, resulting in the activation of immunity and cell death via EDS1/PAD4. In this case, CSI partially compensates for the loss of CSII by using the accumulating LCBs as substrates. However, when both CSI and CSII are missing (Figure 8, right panel), higher levels of LCBs accumulate, leading to stronger phenotypes. These findings contribute to our understanding of the complex network behind Cer biosynthesis that determines plant cell fate and immunity.
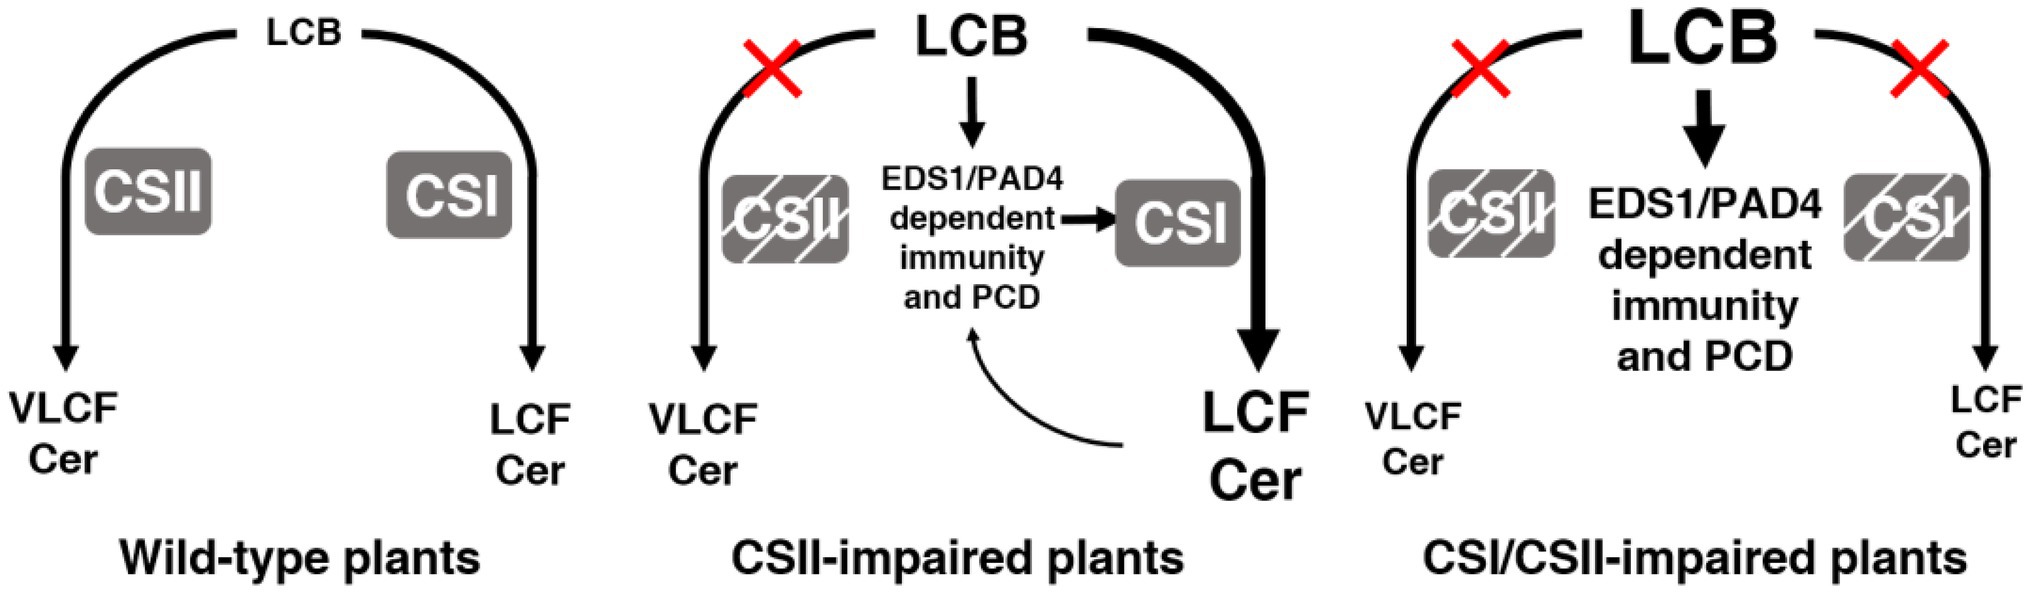
Figure 8. The roles of Cers in plant immunity and cell death. Model summarizing the roles of CSI and CSII in immunity and cell death. In wild type, normal levels of LCBs are maintained by the action of CSI and CSII. With the loss of CSII, LCBs accumulate, and EDS1/PAD4 act downstream to trigger immunity and cell death, while CSI partially compensates for the loss of CSII by consuming LCBs. With the loss of both CSI and CSII, higher levels of LCBs result in stronger phenotypes.
LAG1 HOMOLOG 1 and LOH3 (CSII) and LOH2 (CSII) appear to exert opposite effects on growth and cell death regulation (Markham et al., 2011; Ternes et al., 2011; Luttgeharm et al., 2015). We found that loss of LOH1 triggers the accumulation of LCBs, resulting in EDS1-, PAD4-, and SA-dependent cell death and immunity, but overexpression of LOH2 promotes the accumulation of C16 Cers, initiating EDS1-, PAD4-, and SA-dependent cell death and immunity. In this study, we discovered resistance to a virulent strain of Psm and cell death phenotypes at later stages of growth under our growth conditions for strong loh1 mutants and the weak loh1-1 loh3-1 double mutants (Figure 5; Supplementary Figures 2, 4). Plants from the strong loh1-2 allele were reported to exhibit no obvious visible phenotypes when grown in long-day conditions (Markham et al., 2011), and only showed early senescence under short-day conditions (Ternes et al., 2011). One possible reason is that the loh1-2 phenotype is sensitive to environmental conditions. Likewise, the neutral ceramidase 1 (ncer1) T-DNA insertion mutant was first reported to have no visible phenotypes, although it accumulates hCers (Li et al., 2015), but was later described to exhibit developmentally controlled cell death (Zienkiewicz et al., 2019). Another sphingolipid-related mutant, accelerated cell death 5 (acd5), also shows phenotypes that are modulated by the environment. For example, the acd5 phenotypes depend on the age of the plants (Bi et al., 2014) and are enhanced by SA but suppressed by abscisic acid (ABA) and sodium chloride treatment (Yang et al., 2019). The fact that SA or BTH induces cell death in the loh1-2 mutant background (Figure 1; Supplementary Figure 5) suggests that SA affects the initiation of cell death in loh1-2, as it does in acd5. Indeed, cultivation conditions influence the phenotypes displayed by the SA mutant collection (Pluharova et al., 2019).
The accumulation of sphingolipids in the loh1-2 mutant (Figure 7; Supplementary Figures 6,7), accompanied by a cell death phenotype, was also reminiscent of the acd5 mutant (Bi et al., 2014). However, unlike acd5, which has a similar sphingolipid profile to wild type at the early growth stage, loh1-2 mutant seedlings contained less C24 Cers than the wild type (Supplementary Figure 6; Supplementary Table 1), confirming the role of LOH1 in the biosynthesis of VLCF Cers. Interestingly, LCBs accumulated to normal levels in young loh1-2 seedlings (Supplementary Figure 6), indicating that the cell death phenotype in the mutant is triggered by high LCB levels, which accumulate later in development (Figure 7). Older loh1-2 pad4-1 and loh1-2 eds1-2 double mutant plants shared sphingolipid profiles similar to those of the wild type (Figure 7), suggesting that EDS1 and PAD4 control the initiation of cell death or the accumulation of LCBs. This is supported by a recent finding that deletion of EDS1 or SID2 reduces LCB contents in FA hydroxylase (fah1, fah2) and loh2 triple mutants, even though the exact mechanism is still unknown (König et al., 2021). However, this hypothesis cannot explain why the pad4-1, eds1-2, and sid2-1 mutants show almost no effect on the LCB accumulation induced by FB1 treatment (Figure 3; Supplementary Figure 10; Supplementary Tables 3–5). We hypothesize that in loh1-2 mutant plants, LCB levels are kept in check when EDS1 or PAD4 is absent, while FB1-treated plants experience a rise in LCB levels that is too fast to mitigate. In support of this idea, the sid2-1 mutant minimized the rise of LCB levels in the loh1-2 background but not when exposed to FB1 (Figures 3A, 7A).
The lack of LCF Cer in loh2-1 mutants did not result in visible developmental phenotypes under normal growth conditions (Markham et al., 2011; Ternes et al., 2011; Luttgeharm et al., 2015; Figures 5A–C; Supplementary Figure 2), or in a resistant phenotype upon infection by PsmDG3 (Figures 5D,E), indicating that maintaining normal levels of LCF Cer is not essential for plant growth or pathogen resistance. This may be due to the low concentration of d18:0 and d18:1, the main substrates of LCF Cer (Luttgeharm et al., 2015). However, high levels of LCF Cer induce cell death (Zeng et al., 2021) and enhance plant immunity against PsmDG3 through EDS1, PAD4, and SA (Supplementary Figure 8). Therefore, both the resistance and cell death phenotypes of loh1-2 or LOH2-overexpression lines are associated with EDS1 and PAD4 signaling.
Long-chain base biosynthesis is regulated by the serine palmitoyl-CoA transferase complex and its regulators, orosomucoid-like proteins (Gonzalez-Solis et al., 2020). The availability of LCBs from CS activities also controls LCB homeostasis. The cell death phenotype seen in loh1 mutants or upon treatment with FB1 appears to be due to the extremely high accumulation of LCBs (Shi et al., 2007; Markham et al., 2011; Ternes et al., 2011), since FB1-triggered cell death can be effectively impaired by disrupting the serine palmitoyl-CoA transferase complex (Zeng et al., 2020) and LCBs induce PCD (Shi et al., 2007; Saucedo-Garcia et al., 2011). However, the contribution of LCF Cer to cell death cannot be completely excluded in these cases, since LCF Cers also accumulate in loh1 mutants and plants subjected to long-term FB1 exposure (Markham et al., 2011; Ternes et al., 2011).
Based on the observation that the rise in LCF Cer species 3 days after FB1 treatment was suppressed in the pad4-1, eds1-2, and sid2-1 mutants (Figures 3A–C), we speculate that EDS1, PAD4, and SA promote LCF Cer accumulation to relieve high LCB toxicity to a certain extent during the later period of FB1-elicited cell death. This is consistent with the observations that LOH2-overexpressing plants are more resistant to FB1 (Luttgeharm et al., 2015) despite showing a cell death phenotype in normal conditions, and that loss of LOH2 aggravates FB1- and d18:0-induced cell death (Mase et al., 2013; Figure 3; Supplementary Figure 11). Notably, pre-activation of the SA pathway significantly enhances FB1-induced cell death (Supplementary Figure 9). In line with the dual roles of SA in FB1-induced cell death, sid2 mutants shared similar cell death phenotypes with wild type during the later period following FB1 treatment (Figures 2A,B). SA has well-known dual roles in effector-triggered cell death (Zavaliev et al., 2020), and it will be very interesting to investigate whether a high level of SA alters sphingolipid metabolism to affect the outcome of effector-triggered cell death.
Several stress response proteins, such as MPK6 and PDLP5, were reported to bind to LCB to trigger cell death or immunity (Saucedo-Garcia et al., 2011; Liu et al., 2019). Regulation of enzyme activity by LCBs was observed previously, as with the calcium-dependent kinase CPK3, which can be activated by d18:0, leading to cell death in plants (Lachaud et al., 2013). However, no protein has been reported to regulate both LCB- and Cer-induced cell death until now. EDS1 was reported to participate in the induction of cell death in response to both abiotic and biotic stress (Rustérucci et al., 2001; Ochsenbein et al., 2006; Straus et al., 2010; Wituszynska et al., 2015). We discovered here that, like C16 Cer (Zeng et al., 2021), LCBs regulate the signaling cascade downstream of EDS1 and PAD4. In addition, treatment with FB1, d18:0, or t18:0 elevates EDS1 protein levels in the nucleus and the cytoplasm (Figure 4), possibly leading to transcriptional activation of downstream genes via nucleus-localized EDS1 while accelerating senescence and cell death via cytoplasm-localized EDS1. Whether LCBs directly or indirectly regulate EDS1 and/or PAD4 to induce immunity and cell death remains unknown. As we showed in Figure 4, d18:0 and t18:0 LCBs act differently in EDS1/PAD4-regulated cell death and immunity. It will be very interesting to pursue the molecular mechanisms underlying the distinct functions of d18:0 and t18:0.
In this study, we focused on the roles of LOHs in plant defense against a virulent pathogen, PsmDG3. SA and EDS1 signaling, which have well-known functions in basic immunity (Lapin et al., 2020), are involved in the defense response that occurs due to loss of LOH1. Alteration of LCBs or Cers induces PCD in plants (Berkey et al., 2012; Ali et al., 2018; Huby et al., 2020). One important question is whether LCBs or Cers engage in the hypersensitive response (HR) or HR cell death in plants. However, we lack evidence that sphingolipid-associated cell death is a form of HR cell death. Moreover, the role of sphingolipids in effector-triggered immunity (ETI)-associated HR is also unclear. Infection with avirulent bacteria, such as Pst (avrRpm1), triggers de novo synthesis of t18:0 from d18:0 in Arabidopsis (Peer et al., 2010). However, application of t18:0 LCB produced little or no effect on avrRpm1-triggered cell death (Glenz et al., 2019). Interestingly, d18:0 strongly reduced HR and reactive oxygen species production upon challenge with Pst AvrRPM1 (Magnin-Robert et al., 2015). Inoculation with PsmES4326 carrying avrRpt2 or avrRpm1 elicited the normal HR in the ceramide-accumulation mutant acd5 plants, compared with that in wild type (Greenberg et al., 2000), indicating that Cers may also not be essential for ETI. Hence, the PCD-promoting function of LCBs and Cers seem to be negligible in rapid ETI–HR during plant–pathogen interactions. Instead, moderate accumulation of LCBs or Cers may mainly induce plant defense responses through SA and EDS1 signaling without causing PCD. When the accumulation of LCBs or Cers is out of control, plant overactivate SA and EDS1 signaling, leading to PCD without pathogen infection. Since high levels of SA inhibited HR cell death and simultaneous accumulation of nuclear and cytoplasmic EDS1 do not trigger cell death in ETI (Garcia et al., 2010; Zavaliev et al., 2020), alteration of LCBs or Cers may repress HR cell death rather than enhance it. Therefore, it seems that alteration of LCBs and Cers could mainly induce basal resistance, although more evidence is need to test this hypothesis.
The author responsible for distribution of materials integral to the findings presented in this article in accordance with the policy described in the Instructions for Authors is: NY (eWFvbmFuQG1haWwuc3lzdS5lZHUuY24=).
The datasets presented in this study can be found in online repositories. The names of the repository/repositories and accession number(s) can be found in the article/Supplementary Material.
H-YZ and NY conceived and designed the experiments, analyzed the data, and wrote the manuscript. H-YZ, H-NB, Y-LC, D-KC, KZ, S-KL, LY, and Y-KL performed the experiments. NY contributed to reagents, materials, and analysis tools. All authors contributed to the article and approved the submitted version.
This work was supported by the National Natural Science Foundation of China (32070196 and 31771357), the Natural Science Foundation of Guangdong Province (2019B1515120088 and 2017A030311005), and Sun Yat-sen University (Project 33000-31143406).
The authors declare that the research was conducted in the absence of any commercial or financial relationships that could be construed as a potential conflict of interest.
All claims expressed in this article are solely those of the authors and do not necessarily represent those of their affiliated organizations, or those of the publisher, the editors and the reviewers. Any product that may be evaluated in this article, or claim that may be made by its manufacturer, is not guaranteed or endorsed by the publisher.
We thank Edgar Cahoon (University of Nebraska at Lincoln) for providing LOH2 A seeds, Jean-Denis Faure (Institut National de la Recherche Agronomique-AgroParisTech, France) for the loh1-1 loh3-1 mutant seeds, Jean Greenberg (University of Chicago) for providing pad4-1 and sid2-1 seeds, and Yiji Xia (Hong Kong Baptist University) for providing eds1-2 seeds.
The Supplementary Material for this article can be found online at: https://www.frontiersin.org/articles/10.3389/fpls.2022.824585/full#supplementary-material
Abbas, H. K., Tanaka, T., Duke, S. O., Porter, J. K., Wray, E. M., Hodges, L., et al. (1994). Fumonisin- and AAL-toxin-induced disruption of sphingolipid metabolism with accumulation of free sphingoid bases. Plant Physiol. 106, 1085–1093. doi: 10.1104/pp.106.3.1085
Ali, U., Li, H., Wang, X., and Guo, L. (2018). Emerging roles of sphingolipid signaling in plant response to biotic and abiotic stresses. Mol. Plant 11, 1328–1343. doi: 10.1016/j.molp.2018.10.001
Asai, T., Stone, J. M., Heard, J. E., Kovtun, Y., Yorgey, P., Sheen, J., et al. (2000). Fumonisin B1–induced cell death in Arabidopsis protoplasts requires jasmonate-, ethylene-, salicylate-dependent signaling pathways. Plant Cell 12, 1823–1835. doi: 10.2307/3871195
Berkey, R., Bendigeri, D., and Xiao, S. (2012). Sphingolipids and plant defense/disease: the "death" connection and beyond. Front. Plant Sci. 3:68. doi: 10.3389/fpls.2012.00068
Bi, F. C., Liu, Z., Wu, J. X., Liang, H., Xi, X. L., Fang, C., et al. (2014). Loss of ceramide kinase in Arabidopsis impairs defenses and promotes ceramide accumulation and mitochondrial H2O2 bursts. Plant Cell 26, 3449–3467. doi: 10.1105/tpc.114.127050
Cui, H., Gobbato, E., Kracher, B., Qiu, J., Bautor, J., and Parker, J. E. (2017). A core function of EDS1 with PAD4 is to protect the salicylic acid defense sector in Arabidopsis immunity. New Phytol. 213, 1802–1817. doi: 10.1111/nph.14302
Dunn, T. M., Lynch, D. V., Michaelson, L. V., and Napier, J. A. (2004). A post-genomic approach to understanding sphingolipid metabolism in Arabidopsis thaliana. Ann. Bot. 93, 483–497. doi: 10.1093/aob/mch071
Garcia, A. V., Blanvillain-Baufume, S., Huibers, R. P., Wiermer, M., Li, G., Gobbato, E., et al. (2010). Balanced nuclear and cytoplasmic activities of EDS1 are required for a complete plant innate immune response. PLoS Pathog. 6:e1000970. doi: 10.1371/journal.ppat.1000970
Glenz, R., Schmalhaus, D., Krischke, M., Mueller, M. J., and Waller, F. (2019). Elevated levels of phosphorylated sphingobases do not antagonize sphingobase- or fumonisin b1-induced plant cell death. Plant Cell Physiol. 60, 1109–1119. doi: 10.1093/pcp/pcz033
Gonzalez-Solis, A., Han, G., Gan, L., Li, Y., Markham, J. E., Cahoon, R. E., et al. (2020). Unregulated sphingolipid biosynthesis in gene-edited Arabidopsis ORM mutants results in nonviable seeds with strongly reduced oil content. Plant Cell 32, 2474–2490. doi: 10.1105/tpc.20.00015
Greenberg, J. T., Silverman, F. P., and Liang, H. (2000). Uncoupling salicylic acid-dependent cell death and defense-related responses from disease resistance in the Arabidopsis mutant acd5. Genetics 156, 341–350. doi: 10.2745/dds.10.199
Guo, L., Mishra, G., Markham, J. E., Li, M., Tawfall, A., Welti, R., et al. (2012). Connections between sphingosine kinase and phospholipase D in the abscisic acid signaling pathway in Arabidopsis. J. Biol. Chem. 287, 8286–8296. doi: 10.1074/jbc.M111.274274
Guttman, D. S., and Greenberg, J. T. (2001). Functional analysis of the type III effectors AvrRpt2 and AvrRpm1 of pseudomonas syringae with the use of a single-copy genomic integration system. Mol. Plant Microbe Interact. 14, 145–155. doi: 10.1094/MPMI.2001.14.2.145
Huang, X., Zhang, Y., Zhang, X., and Shi, Y. (2017). Long-chain base kinase1 affects freezing tolerance in Arabidopsis thaliana. Plant Sci. 259, 94–103. doi: 10.1016/j.plantsci.2017.03.009
Huby, E., Napier, J. A., Baillieul, F., Michaelson, L. V., and Dhondt-Cordelier, S. (2020). Sphingolipids: towards an integrated view of metabolism during the plant stress response. New Phytol. 225, 659–670. doi: 10.1111/nph.15997
King, E. O., Ward, M. K., and Raney, D. E. (1954). Two simple media for the demonstration of pyocyanin and fluorescin. J. Lab. Clin. Med. 44, 301–307.
König, S., Gömann, J., Zienkiewicz, A., Zienkiewicz, K., Meldau, D., Herrfurth, C., et al. (2021). Sphingolipid-induced programmed cell death is a salicylic acid and EDS1-dependent phenotype in Arabidopsis fatty acid hydroxylase (fah1, fah2) and ceramide synthase (loh2) triple mutants. Plant Cell Physiol. 63, 317–325. doi: 10.1093/pcp/pcab174
Lachaud, C., Da Silva, D., Cotelle, V., Thuleau, P., Xiong, T. C., Jauneau, A., et al. (2010). Nuclear calcium controls the apoptotic-like cell death induced by d-erythro-sphinganine in tobacco cells. Cell Calcium 47, 92–100. doi: 10.1016/j.ceca.2009.11.011
Lachaud, C., Prigent, E., Thuleau, P., Grat, S., Da Silva, D., Briere, C., et al. (2013). 14-3-3-regulated Ca(2+)-dependent protein kinase CPK3 is required for sphingolipid-induced cell death in Arabidopsis. Cell Death Differ. 20, 209–217. doi: 10.1038/cdd.2012.114
Lapin, D., Bhandari, D. D., and Parker, J. E. (2020). Origins and immunity networking functions of EDS1 family proteins. Annu. Rev. Phytopathol. 58, 253–276. doi: 10.1146/annurev-phyto-010820-012840
Li, J., Bi, F. C., Yin, J., Wu, J. X., Rong, C., Wu, J. L., et al. (2015). An Arabidopsis neutral ceramidase mutant ncer1 accumulates hydroxyceramides and is sensitive to oxidative stress. Front. Plant Sci. 6:460. doi: 10.3389/fpls.2015.00460
Liang, H., Yao, N., Song, J. T., Luo, S., Lu, H., and Greenberg, J. T. (2003). Ceramides modulate programmed cell death in plants. Genes Dev. 17, 2636–2641. doi: 10.1101/gad.1140503
Liu, N. J., Zhang, T., Liu, Z. H., Chen, X., Guo, H. S., Ju, B. H., et al. (2019). Phytosphinganine affects plasmodesmata permeability via facilitating PDLP5-stimulated callose accumulation in Arabidopsis. Mol. Plant 13, 128–143. doi: 10.1016/j.molp.2019.10.013
Livak, K. J., and Schmittgen, T. D. (2001). Analysis of relative gene expression data using real-time quantitative PCR and the 2(-Delta Delta C(T)) method. Methods 25, 402–408. doi: 10.1006/meth.2001.1262
Locato, V., and De Gara, L. (2018). Programmed cell death in plants: an overview. Methods Mol. Biol. 1743, 1–8. doi: 10.1007/978-1-4939-7668-3_1
Luttgeharm, K. D., Cahoon, E. B., and Markham, J. E. (2016). Substrate specificity, kinetic properties and inhibition by fumonisin B1 of ceramide synthase isoforms from Arabidopsis. Biochem. J. 473, 593–603. doi: 10.1042/BJ20150824
Luttgeharm, K. D., Chen, M., Mehra, A., Cahoon, R. E., Markham, J. E., and Cahoon, E. B. (2015). Overexpression of Arabidopsis ceramide synthases differentially affects growth, sphingolipid metabolism, programmed cell death, mycotoxin resistance. Plant Physiol. 169, 1108–1117. doi: 10.1104/pp.15.00987
Magnin-Robert, M., Le Bourse, D., Markham, J., Dorey, S., Clement, C., Baillieul, F., et al. (2015). Modifications of sphingolipid content affect tolerance to hemibiotrophic and necrotrophic pathogens by modulating plant defense responses in Arabidopsis. Plant Physiol. 169, 2255–2274. doi: 10.1104/pp.15.01126
Markham, J. E., Molino, D., Gissot, L., Bellec, Y., Hematy, K., Marion, J., et al. (2011). Sphingolipids containing very-long-chain fatty acids define a secretory pathway for specific polar plasma membrane protein targeting in Arabidopsis. Plant Cell 23, 2362–2378. doi: 10.1105/tpc.110.080473
Mase, K., Ishihama, N., Mori, H., Takahashi, H., Kaminaka, H., Kodama, M., et al. (2013). Ethylene-responsive AP2/ERF transcription factor MACD1 participates in phytotoxin-triggered programmed cell death. Mol. Plant Microbe Interact. 26, 868–879. doi: 10.1094/MPMI-10-12-0253-R
Ochsenbein, C., Przybyla, D., Danon, A., Landgraf, F., Gobel, C., Imboden, A., et al. (2006). The role of EDS1 (enhanced disease susceptibility) during singlet oxygen-mediated stress responses of Arabidopsis. Plant J. 47, 445–456. doi: 10.1111/j.1365-313X.2006.02793.x
Peer, M., Stegmann, M., Mueller, M. J., and Waller, F. (2010). Pseudomonas syringae infection triggers de novo synthesis of phytosphingosine from sphinganine in Arabidopsis thaliana. FEBS Lett. 584, 4053–4056. doi: 10.1016/j.febslet.2010.08.027
Pluharova, K., Leontovycova, H., Stoudkova, V., Pospichalova, R., Marsik, P., Kloucek, P., et al. (2019). "salicylic acid mutant collection" as a tool to explore the role of salicylic acid in regulation of plant growth under a changing environment. Int. J. Mol. Sci. 20:6365. doi: 10.3390/ijms20246365
Rustérucci, C., Avi, D. H., Holt, B. F., Dangl, J. L., and Parker, J. E. (2001). The disease resistance signaling components EDS1 and PAD4 are essential regulators of the cell death pathway controlled by LSD1 in Arabidopsis. Plant Cell 13, 2211–2224. doi: 10.2307/3871503
Saucedo-Garcia, M., Guevara-Garcia, A., Gonzalez-Solis, A., Cruz-Garcia, F., Vazquez-Santana, S., Markham, J. E., et al. (2011). MPK6, sphinganine and the LCB2a gene from serine palmitoyltransferase are required in the signaling pathway that mediates cell death induced by long chain bases in Arabidopsis. New Phytol. 191, 943–957. doi: 10.1111/j.1469-8137.2011.03727.x
Shi, L., Bielawski, J., Mu, J., Dong, H., Teng, C., Zhang, J., et al. (2007). Involvement of sphingoid bases in mediating reactive oxygen intermediate production and programmed cell death in Arabidopsis. Cell Res. 17, 1030–1040. doi: 10.1038/cr.2007.100
Straus, M. R., Rietz, S., Loren, V., van Themaat, E., Bartsch, M., and Parker, J. E. (2010). Salicylic acid antagonism of EDS1-driven cell death is important for immune and oxidative stress responses in Arabidopsis. Plant J. 62, 628–640. doi: 10.1111/j.1365-313X.2010.04178.x
Ternes, P., Feussner, K., Werner, S., Lerche, J., Iven, T., Heilmann, I., et al. (2011). Disruption of the ceramide synthase LOH1 causes spontaneous cell death in Arabidopsis thaliana. New Phytol. 192, 841–854. doi: 10.1111/j.1469-8137.2011.03852.x
Tsegaye, Y., Richardson, C. G., Bravo, J. E., Mulcahy, B. J., Lynch, D. V., Markham, J. E., et al. (2007). Arabidopsis mutants lacking long chain base phosphate lyase are fumonisin-sensitive and accumulate trihydroxy-18:1 long chain base phosphate. J. Biol. Chem. 282, 28195–28206. doi: 10.1074/jbc.M705074200
Wituszynska, W., Szechynska-Hebda, M., Sobczak, M., Rusaczonek, A., Kozlowska-Makulska, A., Witon, D., et al. (2015). Lesion simulating disease 1 and enhanced disease susceptibility 1 differentially regulate UV-C-induced photooxidative stress signalling and programmed cell death in Arabidopsis thaliana. Plant Cell Environ. 38, 315–330. doi: 10.1111/pce.12288
Worrall, D., Liang, Y. K., Alvarez, S., Holroyd, G. H., Spiegel, S., Panagopulos, M., et al. (2008). Involvement of sphingosine kinase in plant cell signalling. Plant J. 56, 64–72. doi: 10.1111/j.1365-313X.2008.03579.x
Yanagawa, D., Ishikawa, T., and Imai, H. (2017). Synthesis and degradation of long-chain base phosphates affect fumonisin B1-induced cell death in Arabidopsis thaliana. J. Plant Res. 130, 571–585. doi: 10.1007/s10265-017-0923-7
Yang, Y. B., Yin, J., Huang, L. Q., Li, J., Chen, D. K., and Yao, N. (2019). Salt enhances disease resistance and suppresses cell death in ceramide kinase mutants. Plant Physiol. 181, 319–331. doi: 10.1104/pp.19.00613
Zavaliev, R., Mohan, R., Chen, T., and Dong, X. (2020). Formation of NPR1 condensates promotes cell survival during the plant immune response. Cell 182, 1093.e18–1108.e18. doi: 10.1016/j.cell.2020.07.016
Zeng, H., Li, C., and Yao, N. (2020). Fumonisin B1: A tool for exploring the multiple functions of sphingolipids in plants. Front. Plant Sci. 11:600458. doi: 10.3389/fpls.2020.600458
Zeng, H. Y., Liu, Y., Chen, D. K., Bao, H. N., Huang, L. Q., Yin, J., et al. (2021). The immune components ENHANCED DISEASE SUSCEPTIBILITY 1 and PHYTOALEXIN DEFICIENT 4 are required for cell death caused by overaccumulation of ceramides in Arabidopsis. Plant J. 107, 1447–1465. doi: 10.1111/tpj.15393
Zhang, X., Wu, Q., Cui, S., Ren, J., Qian, W., Yang, Y., et al. (2015). Hijacking of the jasmonate pathway by the mycotoxin fumonisin B1 (FB1) to initiate programmed cell death in Arabidopsis is modulated by RGLG3 and RGLG4. J. Exp. Bot. 66, 2709–2721. doi: 10.1093/jxb/erv068
Zheng, P., Wu, J. X., Sahu, S. K., Zeng, H. Y., Huang, L. Q., Liu, Z., et al. (2018). Loss of alkaline ceramidase inhibits autophagy in Arabidopsis and plays an important role during environmental stress response. Plant Cell Environ. 41, 837–849. doi: 10.1111/pce.13148
Zienkiewicz, A., Gömann, J., König, S., Herrfurth, C., Liu, Y. T., Meldau, D., et al. (2019). Disruption of Arabidopsis neutral ceramidases 1 and 2 results in specific sphingolipid imbalances triggering different phytohormone-dependent plant cell death programs. New Phytol. 226, 170–188. doi: 10.1111/nph.16336
Keywords: Arabidopsis thaliana, cell death, ceramide synthases, immunity, salicylic acid, sphingolipid
Citation: Zeng H-Y, Bao H-N, Chen Y-L, Chen D-K, Zhang K, Liu S-K, Yang L, Li Y-K and Yao N (2022) The Two Classes of Ceramide Synthases Play Different Roles in Plant Immunity and Cell Death. Front. Plant Sci. 13:824585. doi: 10.3389/fpls.2022.824585
Edited by:
Jyoti Shah, University of North Texas, United StatesReviewed by:
Ashis Kumar Nandi, Jawaharlal Nehru University, IndiaCopyright © 2022 Zeng, Bao, Chen, Chen, Zhang, Liu, Yang, Li and Yao. This is an open-access article distributed under the terms of the Creative Commons Attribution License (CC BY). The use, distribution or reproduction in other forums is permitted, provided the original author(s) and the copyright owner(s) are credited and that the original publication in this journal is cited, in accordance with accepted academic practice. No use, distribution or reproduction is permitted which does not comply with these terms.
*Correspondence: Nan Yao, eWFvbmFuQG1haWwuc3lzdS5lZHUuY24=
Disclaimer: All claims expressed in this article are solely those of the authors and do not necessarily represent those of their affiliated organizations, or those of the publisher, the editors and the reviewers. Any product that may be evaluated in this article or claim that may be made by its manufacturer is not guaranteed or endorsed by the publisher.
Research integrity at Frontiers
Learn more about the work of our research integrity team to safeguard the quality of each article we publish.