
94% of researchers rate our articles as excellent or good
Learn more about the work of our research integrity team to safeguard the quality of each article we publish.
Find out more
ORIGINAL RESEARCH article
Front. Plant Sci., 31 March 2022
Sec. Plant Bioinformatics
Volume 13 - 2022 | https://doi.org/10.3389/fpls.2022.819822
 Xia Yang1
 Xiaolei Yu1Xiaoying Zhang1Hua Guo1Zhimei Xing1Liuwei Xu1Jia Wang2Yuyan Shen2Jie Yu2Pengfei Lv2Yuefei Wang1Mengyang Liu1
 Xiaoxuan Tian1*
Radix Paeoniae Rubra (Chishao), a typical multi-origin Chinese medicinal material, originates from the dried roots of Paeonia lactiflora or P. veitchii. The previous study suggested that these two commonly used Chishao showed variation in their chemical compositions and clinical efficacies. Therefore, accurate identification of different Chishao species was of great significance for the guide of clinical medication, and timely treatment of patients. In this study, the chloroplast genome sequences of P. lactiflora and P. veitchii were obtained by next-generation sequencing (NGS) technology, and then the hypervariable regions were selected to design two mini-barcode candidates for species identification. Combined with DNA metabarcoding technology, we performed qualitative and quantitative analysis on the artificially mixed samples of P. lactiflora and P. veitchii and evaluated the identification ability of these mini-barcode candidates. Furtherly, the mini-barcode with good performance was applied to distinguish the Chinese patent medicine “cerebral thrombosis tablets” containing Chishao. The results indicated that the chloroplast genomes of P. lactiflora and P. veitchii were 152,750 and 152,527 bp, respectively. As published previously, they exhibited a typical quadripartite structure including a large single-copy region (LSC), a small single-copy region (SSC) and a pair of inverted repeat regions (IRs). The nucleotide polymorphism analysis revealed seven variable protein-coding regions as petL, psaI, psbJ, rpl16, ycf1b, psaC, and ndhF, and two mini-barcodes were developed from ycf1b and ndhF respectively. The result suggested that both two mini-barcodes performed well distinguishing P. lactiflora from P. veitchii. Besides, P. lactiflora was the only raw material of Chishao in all collected “cerebral thrombosis tablets” samples. In general, this study has established a method to realize the qualitative and quantitative identification of Chishao as multi-origin Chinese medicinal materials, which can be applied to Chinese patent medicines containing Chishao.
Chinese medicinal materials are used as raw materials for various Chinese medicinal products, generally derived from animals, plants and minerals. One medicinal herb that originated from more than one species of plants, is called multi-origin Chinese herbal medicines in the Chinese Pharmacopeia, which occupies a large proportion of Chinese medicine products. However, studies have shown that the chemical components of multi-origin Chinese medicines are frequently different due to the utilization of different species. For example, phenolic pigments and essential oils represent the main chemical components of Curcuma (Yang et al., 2006), but their content varies amongst different plant parts and different plant species.
Chishao, the dried roots of Paeonia lactiflora Pall or P. veitchii Lynch belonging to Ranunculaceae, possesses various medicinal properties. According to classical medical literature in China, Chishao is bitter in taste and slightly cold in nature, with the function of clearing heat, cooling the blood, eliminating silt, and relieving pain (National Pharmacopoeia Committee, 2015). Modern studies have demonstrated that Chishao has wide pharmacological activities, including anti-tumor, liver protection, anti-thrombotic, anti-inflammatory, cardiovascular, and cerebrovascular protection (Jin et al., 2012; Wang et al., 2012; Xu et al., 2014; Huang et al., 2016; Lin et al., 2016; Xie et al., 2017; Liu et al., 2019; Tu et al., 2019). Currently, over 150 chemical components have been isolated and identified from Chishao (Liang et al., 2013). Besides monoterpene glycoside as the primary active compound, it also contains phenolic acids, triterpenes, flavonoids, volatile oil, etc., (Tanaka et al., 2000; Parker et al., 2016; Jiang et al., 2020).
The results of qualitative and quantitative chemical analyses indicate that, although the chemical compositions of Chishao species are similar generally, the content of phenolic acids from two species is rather different (Xu et al., 2009). In addition, according to Parker et al. (2016), P. lactiflora has greater potential for anti-inflammatory, antiviral, antibacterial, and antioxidant therapeutic activities compared to P. veitchii. Therefore, the accurate identification of the original plant is one of the important factors for the quality control of Chishao and is highly effective for the safety of clinical applications. Currently, multilateral approaches including microscopic, chromatographic, and mass spectrometry analyses have been widely used to authenticate and distinguish Chishao in complex samples (Xu et al., 2009; Shi et al., 2016), but these methods are either time-consuming or complicated in operation. DNA barcoding, an established molecular technique for taxonomic identification in biodiversity studies and product authentication, has been applied to the authentication studies of Chishao (Kim et al., 2016). However, the DNA barcoding technology based on the traditional Sanger sequencing method is only suitable for objects of a single source (Frézal and Leblois, 2008), which is seen as helpless for traditional Chinese medicine products containing multiple herbal medicines. Therefore, the development of a molecular method for the authentication of Chishao within herbal products is urgently needed. DNA metabarcoding is an approach merging next-generation sequencing technologies with DNA barcoding, which enables sensitive high-throughput multispecies identification based on DNA extraction from complex Chinese medicine (Taberlet et al., 2012; Cheng et al., 2014).
As herbs DNA degradation occurs during the medicine processing, the DNA fragments in extraction are frequently too short to be the template for “standard” DNA barcoding amplification (Gao et al., 2019). DNA mini-barcodes with significantly reduced length barcode sequences (100–250 bp) have been introduced to improve PCR amplification success of samples with degraded DNA (Meusnier et al., 2008; Hajibabaei and McKenna, 2012; Raime and Remm, 2018). This approach seems suitable for the authentication of heavily processed materials with severe DNA degradation (Song et al., 2017). However, the chosen DNA region should have sufficient variable sites and DNA genetic stability, which could ensure identification efficiency (Leray et al., 2013; Govender et al., 2019).
The chloroplast genome has been widely accepted as a valuable source of data for understanding evolutionary biology (Xu et al., 2017). The nature of the chloroplast genome, including its small size, conserved structure and gene content, moderate evolutionary rate and variations among gene loci, has rendered this genome more useful in molecular evolutionary analyses and phylogenetic reconstruction than mitochondrial and nuclear genomes (Drouin et al., 2008; Daniell et al., 2016; Park et al., 2018; Biju et al., 2019; Li et al., 2020). In previous research, Yu et al. (2020) had developed specific DNA mini-barcode from chloroplast genomes, and integrated them with DNA metabarcoding technology to differentiate Senna medicinal materials qualitatively and quantitatively.
In this study, we (1) sequenced, assembled, and annotated the complete chloroplast genome sequence of P. lactiflora and P. veitchii from our herbal materials, and compared them with those reported previously in terms of genome size, gene structure and guanine-cytosine (GC) content (Zhang et al., 2016; Samigullin et al., 2018; Lee et al., 2019; Gao et al., 2020), and then search for hypervariable regions in protein-coding sequences to design mini-barcodes; (2) to combine the mini-barcode with DNA metabarcoding method to examine whether the former could be used for the qualitative and quantitative analysis of P. lactiflora and P. veitchii; (3) take “cerebral thrombosis tablets” as an example to confirm the applicability of designed mini-barcode in proprietary Chinese medicines.
The standard products of P. lactiflora and P. veitchii were purchased from the National Drug Standard Substance Management Platform, China. P. lactiflora and P. veitchii were artificially mixed in different proportions to obtain seven experimental mixtures before extraction. The details of these mixed samples were shown in Supplementary Table 1. In addition, seven different batches of Chinese patent medicine “cerebral thrombosis tablets” containing Chishao were purchased from Tianjin Tong Ren Tang Group Co., Ltd., (lot number AP11023, AP11014, AP11024, AP11025, and AP11027) and Tonghua Xindongri Co., Ltd., (lot number 20190103 and 20190102). The details of samples information were shown in Supplementary Table 2.
Following the manufacturer’s protocol, the Plant Genomic DNA Kit (TIANGEN BIOTECH Co., Ltd., Beijing, China) was used to extract the genomic DNA from P. lactiflora and P. veitchii. 50–100 mg of ground powder was added to a centrifuge tube containing 700 μl of 65°C pre-warmed GP1 buffer (add mercaptoethanol to the pre-warmed GP1 to make a final concentration of 0.1% before the experiment) and vortexed for 15 s, and then incubated in water bath at 65°C during 20 min after which 700 μl of chloroform was added to each sample and mixed by vortexing for 15 s, and centrifuged at 12,000 rpm for 5 min. The supernatants were transferred to a new 1.5 ml centrifuge tube and 700 μl of GP2 buffer was added and briefly vortexed. The solution was transferred into the adsorption column CB3 (adsorption column was placed in the collection tube) and centrifuged at 12,000 rpm (∼13,400 × g) for 30 s. After the filtrate in the collection tube was discarded, the adsorption column was returned to the collection tube. The 500 μl of GD buffer was added to the adsorption column CB3, centrifuged at 12,000 rpm (∼13,400 × g) for 30 s. After the filtrate was discarded, we added 600 μl of PW buffer to adsorption column CB3, centrifuge at 12,000 rpm (∼13,400 × g) for 30 s, discarded the filtrate (this step was repeated two times), and then placed the adsorption column back into the collection tubes. Centrifuge for 2 min at 12,000 rpm (∼13,400 × g) and discard the filtrate. The adsorption column CB3 was placed at room temperature for a few minutes to thoroughly dry the residual wash liquid in the adsorbent material. The adsorption column CB3 was transferred to a new centrifuge tube, and 50–200 μl of TE buffer was added to the middle of the adsorption membrane in suspension, kept at room temperature for 2 min, and centrifuged at 12,000 rpm (∼13,400 × g) for 2 min to obtain DNA solution. DNA extractions were carried out in a dedicated pre-PCR laboratory, and PCR mixes were set up in a dedicated no-DNA laboratory to minimize the risk of contamination. The laboratory and the equipment were UV sterilized. Genomic DNA concentrations were determined by the measurement of optical density at 260 nm (OD260) using a NanoDrop™ spectrophotometer (Thermo Scientific, United States) and the purity was evaluated by measurement of the OD260/OD280 ratio. The sequencing library was generated using Truseq Nano DNA HT Sample preparation Kit (Illumina United States) following the manufacturer’s recommendations. The library was sequenced on Illumina HiSeq X Ten platform (Novogene, Nanjing, China) and 150 bp paired-end reads were generated.
Clean reads were obtained from raw reads by removing adapter sequences, reads containing N (N denotes not determined base information), and low-quality reads (reads with Qphred ≤ 20 bases accounting for more than 50% of the entire read length). The clean reads 6,021,633 and 6,072,563 were generated, respectively, from P. lactiflora and P. veitchii genomic DNA and used in the subsequent analysis. The chloroplast genome sequence of P. rockii (NCBI accession number: NC_037772) was used as the reference sequence, and clean reads of P. lactiflora and P. veitchii were mapped to the reference genome using Bowtie 2 (Langmead and Salzberg, 2012) software under the default parameters. And then we selected a consensus sequence with a deeper coverage (1–2 kb) as the seed sequence. Subsequently, the clean reads of P. lactiflora and P. veitchii were de novo assembled separately using NOVOPlasty 3.7.2 (Dierckxsens et al., 2017) software. The parameters were set as: insert size = 350, read length = 150, type = chloro, gene range = 10,000–20,000, k-mer = 39. The chloroplast genome sequences were annotated by the online program GeSeq (Tillich et al., 2017), followed by manual corrections of the start and stop codons based on the previously published chloroplast genome of Paeonia. The boundaries of tRNA genes were further detected using tRNAscan-SE online search serve (Lowe and Chan, 2016). Finally, the chloroplast genome maps were drawn using OGDRAW (Lohse et al., 2007).
Simple sequence repeats (SSRs) were identified by MISA with minimum repeat numbers of 10, 5, 4, 3, 3, and 3 for mono-, di-, tri-, tetra-, penta-, and hexanucleotides, respectively. Repeat sequences (forward, reverse, palindromic, and complement repeats) in the two Chishao species were analyzed through REPuter1, with the following setting: sequence identity was 90%, the Hamming distance was 3, and the minimum repeat size was 30 bp. Then, the contraction and expansion of the IR regions at the junctions of four main parts (LSC/IRb/SSC/IRa) of the chloroplast genomes were inspected and plotted with IRscope.
Two Chishao chloroplast genomes were compared with the previously reported chloroplast genomes in terms of genome size, genome structure and GC content. In addition, sequence alignment of amplicon regions (trimming primers) was performed using Geneious software. The phylogenetic analysis of these genes was constructed in MEGA-X software using the neighbor-joining (NJ) cluster algorithm. Evolutionary distances were calculated using the Kimura 2-parameter model and 1,000 replicate bootstrap tests, and P. jishanensis T. Hong and W. Z. Zhao was chosen as the outgroup (Sang and Zhang, 1999; Pan et al., 2007).
We failed to find suitable conserved regions within long non-protein coding region, on the other hand, the short non-protein coding fragments did not contain enough information for species discrimination. Therefore, the protein-coding region was finally chosen to design primers for molecular identification. In our experiment, the protein-coding genes of the two chloroplast genomes were, respectively, extracted and aligned using PhyloSuite_v1.1.15 (Zhang et al., 2020). A sliding window analysis was performed using DNASP software version 6.11.01 (Rozas et al., 2017) to evaluate nucleotide diversity (Pi) and select hypervariable regions as candidates for mini-barcode development with the following parameters: window length 100 bp and step size 25 bp. Then, the primers were designed with Primer Premier 6.0. Finally, we used Oligo7.0 (Rychlik, 2007) to evaluate the characteristics of the selected primers. Primers that were likely to have hairpin structures, primer dimers, or excessive annealing temperature were abandoned.
Genomic DNA was extracted from the mixtures of P. lactiflora and P. veitchii and from Chinese patent medicine samples using the Plant Genomic DNA Kit (TIANGEN BIOTECH Co., Ltd., Beijing, China) as described above. PCR assays were carried out in 25 μl reaction volumes containing 12.5 μl 2 × Gflex buffer (Takara Dalian, China), 0.5 μl Tks Gflex DNA Polymerase (Takara Dalian, China), 2 μl DNA template, 0.5 μl of each tagged primer, and 9 μl ddH2O, and with the following program settings: initial denaturing at 98°C for 1 min, followed by 30 cycles of 98°C for 10 s, 55°C for 15 s, 68°C for 30 s with a final extension at 68°C for 5 min. The negative PCR controls were analyzed in parallel with the samples to monitor for possible contamination. PCR products (including negative controls) were separated on 2% agarose gels and stained by ethidium bromide at 110 V for 30 min to determine the length of the amplified product fragments and estimate the concentration. Subsequently, to reduce the cost of independent library construction for each sample, the PCR products were mixed in equimolar concentrations for NGS PCR-free library construction. The library was sequenced on an Illumina HiSeq X Ten platform (Novogene, Nanjing, China), generating PE150 reads. To distinguish amplicons originating from the different samples, barcode oligonucleotides of 8 bp in length were ligated to each side of the primers, as shown in Supplementary Tables 3, 4.
The fastq-multx (Aronesty, 2013) was used to split the generated data into each sample. Primer sequences were trimmed by Cutadapt (Kechin et al., 2017). Subsequently, DADA2 (Callahan et al., 2016) package was used to control the sequence quality, and the parameters are set as maxEE = c (2, 2), minLen = 110, truncLen = c (120, 120). The base quality decreases when the sequence length was greater than 120 bp, so this part of the sequence was truncated (Supplementary Figure 1). Guessing error models, dereplication, denoising of paired-end reads, chimera removal, and creation of Amplicon Sequence Variants (ASVs) were performed with the DADA2 R package. ASV sequences with a total number of reads coverage less than 1,000 across all samples, which may be caused by sequencing errors or PCR mismatches, were filtered out (Caporaso et al., 2011). Then, the obtained ASV representative sequences were aligned with the P. lactiflora and P. veitchii reference region for species identification.
For P. lactiflora and P. veitchii, the total length of the circular chloroplast genome was determined to be 152,750 and 152,527 bp, containing an SSC region of 16,971 or 17,006 bp, and an LSC region of 84,417 and 84,243 bp, separated by 2 copies of an IR of 25,680 or 25,639 bp, respectively (Figure1). The GC contents of two chloroplast genomes were 38.4%, with IR regions having higher GC content (43.1% and 43.2% in P. lactiflora and P. veitchii, respectively) than LSC (36.7% in both species) and SSC regions (32.7% in both species). Both chloroplast genomes encoded 111 predicted genes, as 77 protein-coding genes, 4 transfer RNA (tRNA) genes, and 30 ribosomal RNA (rRNA) genes. Nineteen genes were duplicated in the IR regions, including 8 protein-coding genes, 7 tRNA genes and 4 rRNA genes. There were 17 intron-containing genes, 15 of which contained a single intron, while two genes contained two introns. Information of these genes were shown in Supplementary Table 5.
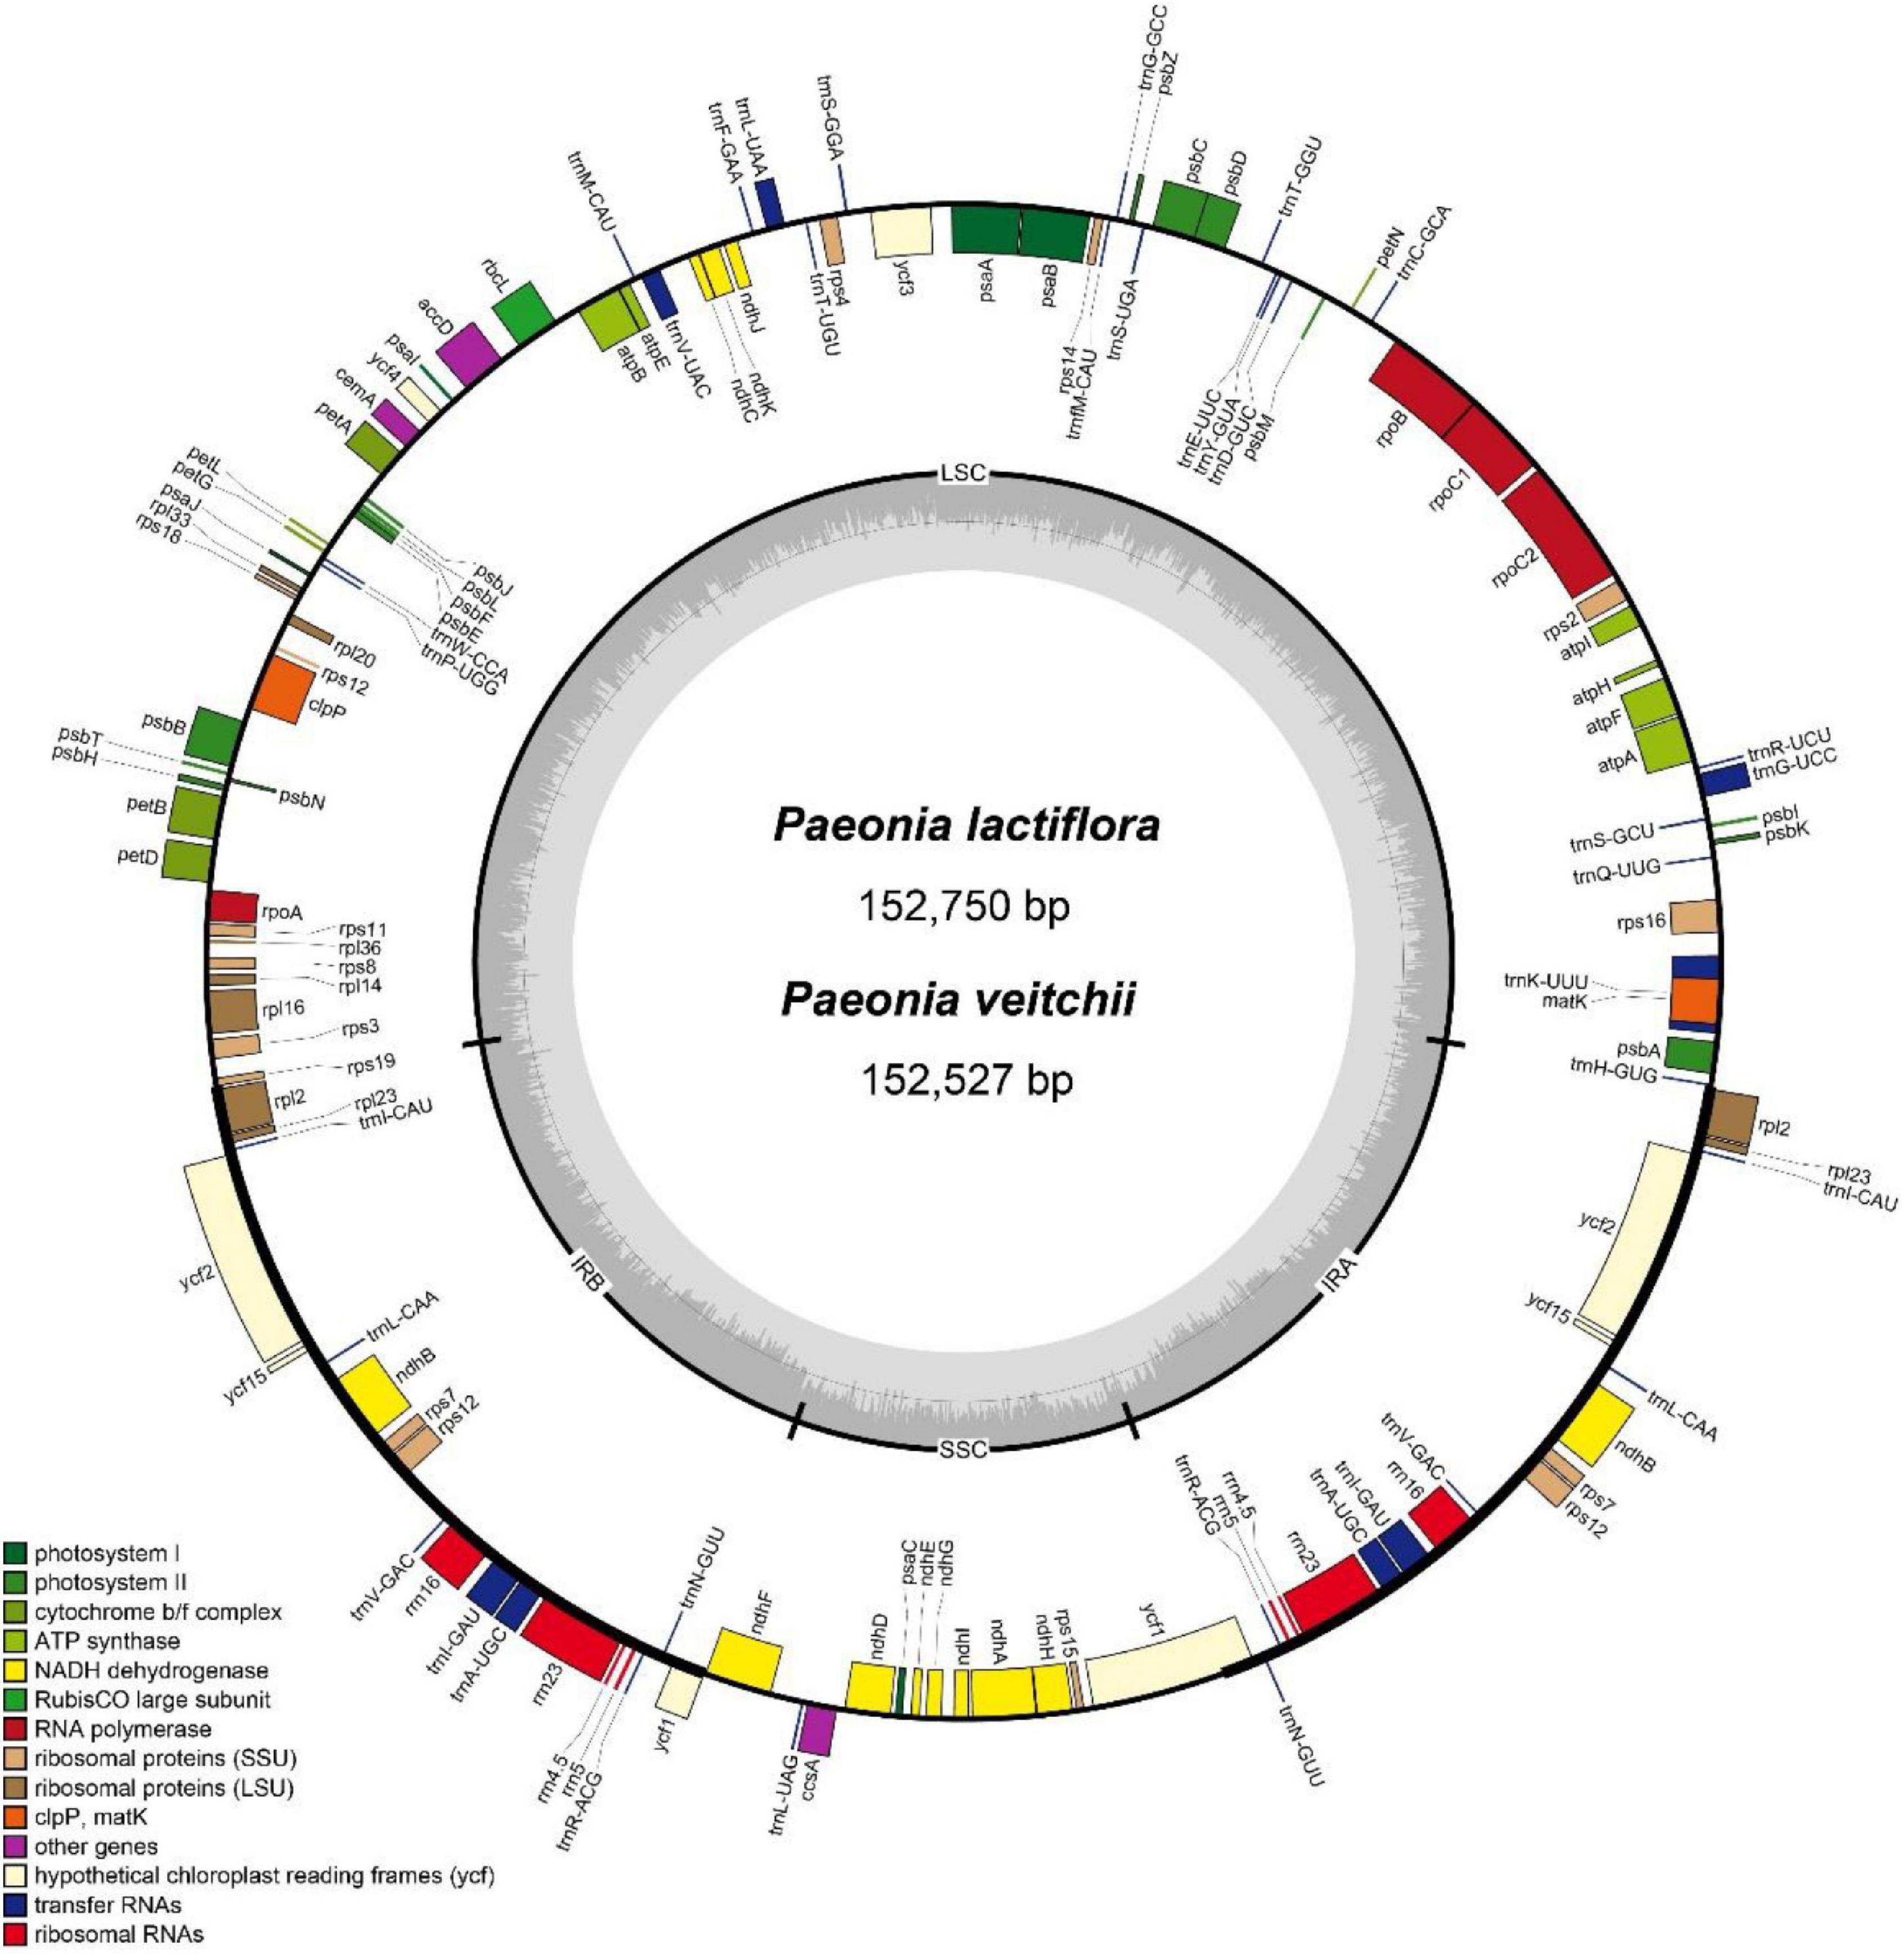
Figure 1. Gene map of the complete chloroplast genomes of Paeonia lactiflora and Paeonia veitchii in this study. Genes on the inside of the circle are transcribed clockwise, whereas those outside are transcribed counter-clockwise. The darker and lighter gray in the inner circle corresponds to GC content and AT content respectively.
The IR/LSC and IR/SSC borders of the P. lactiflora and P. veitchii chloroplast genomes were compared (Figure 2). In two chloroplast genomes, the rps19 gene crossed the LSC and IRb regions, with 8 bp extension into the IRb region. The ndhF gene crossed the IRb/SSC boundary in P. veitchii and formed a partial overlapping region with the ycf1 pseudogenes, however, in P. lactiflora, the ndhF gene was totally located in the SSC region. Two chloroplast genomes had similar SSC/IRa and IRa/LSC borders: the ycf1 gene crosses the SSC/IRa boundary, most of which was located in the SSC region. On the other hand, the rpl2 gene was in the IRa region and the psbA gene in the LSC region, and the trnH gene spanned the junction between IRa and LSC regions.
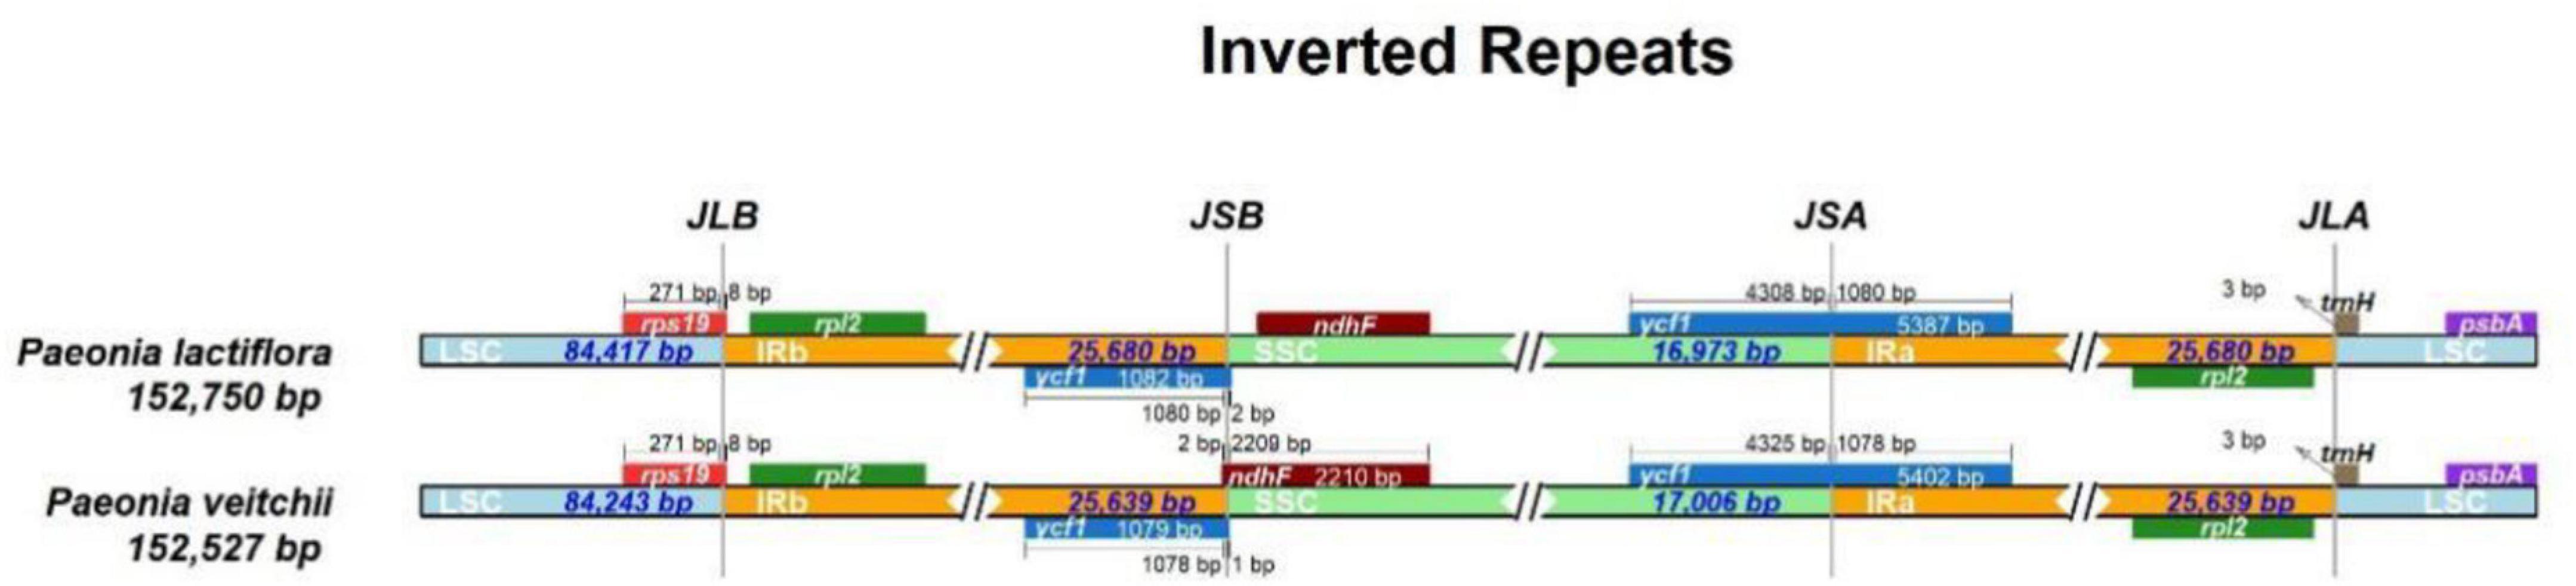
Figure 2. Comparison of the LSC, IR, and SSC junction positions between Paeonia lactiflora and Paeonia veitchii.
As molecular marker candidates for analyzing the genetic diversity and population structure, SSRs were made up of abundant tandem repeat sequences consisting of 1–6 bp units. We have identified 57 and 69 SSRs sites in the chloroplast genomes of P. lactiflora and P. veitchii, respectively. All these SSRs found were shorter than 18 bp. The number of mononucleotide SSRs sites was the richest (35 and 42 in P. lactiflora and P. veitchii, respectively), and most of them were A/T (Table 1). This result was congruent with the previous observation that chloroplast genome SSRs were generally composed of A/T, and rarely C/G (Kuang et al., 2011). The second abundant SSRs were dinucleotide repeats, followed by trinucleotide repeats, while hexanucleotide repeats were not found.

Table 1. Types and numbers of SSRs in the chloroplast genomes of Paeonia lactiflora and Paeonia veitchii.
Three types of long repeat sequences, namely forward repeat, reverse repeat and palindromic repeat, were found in the P. lactiflora chloroplast genome, while only the first and third ones were found in P. veitchii. The majority of these repeats were mainly forward and palindromic types with lengths mainly in the range of 30–39 bp in both Chishao species (Figure 3).
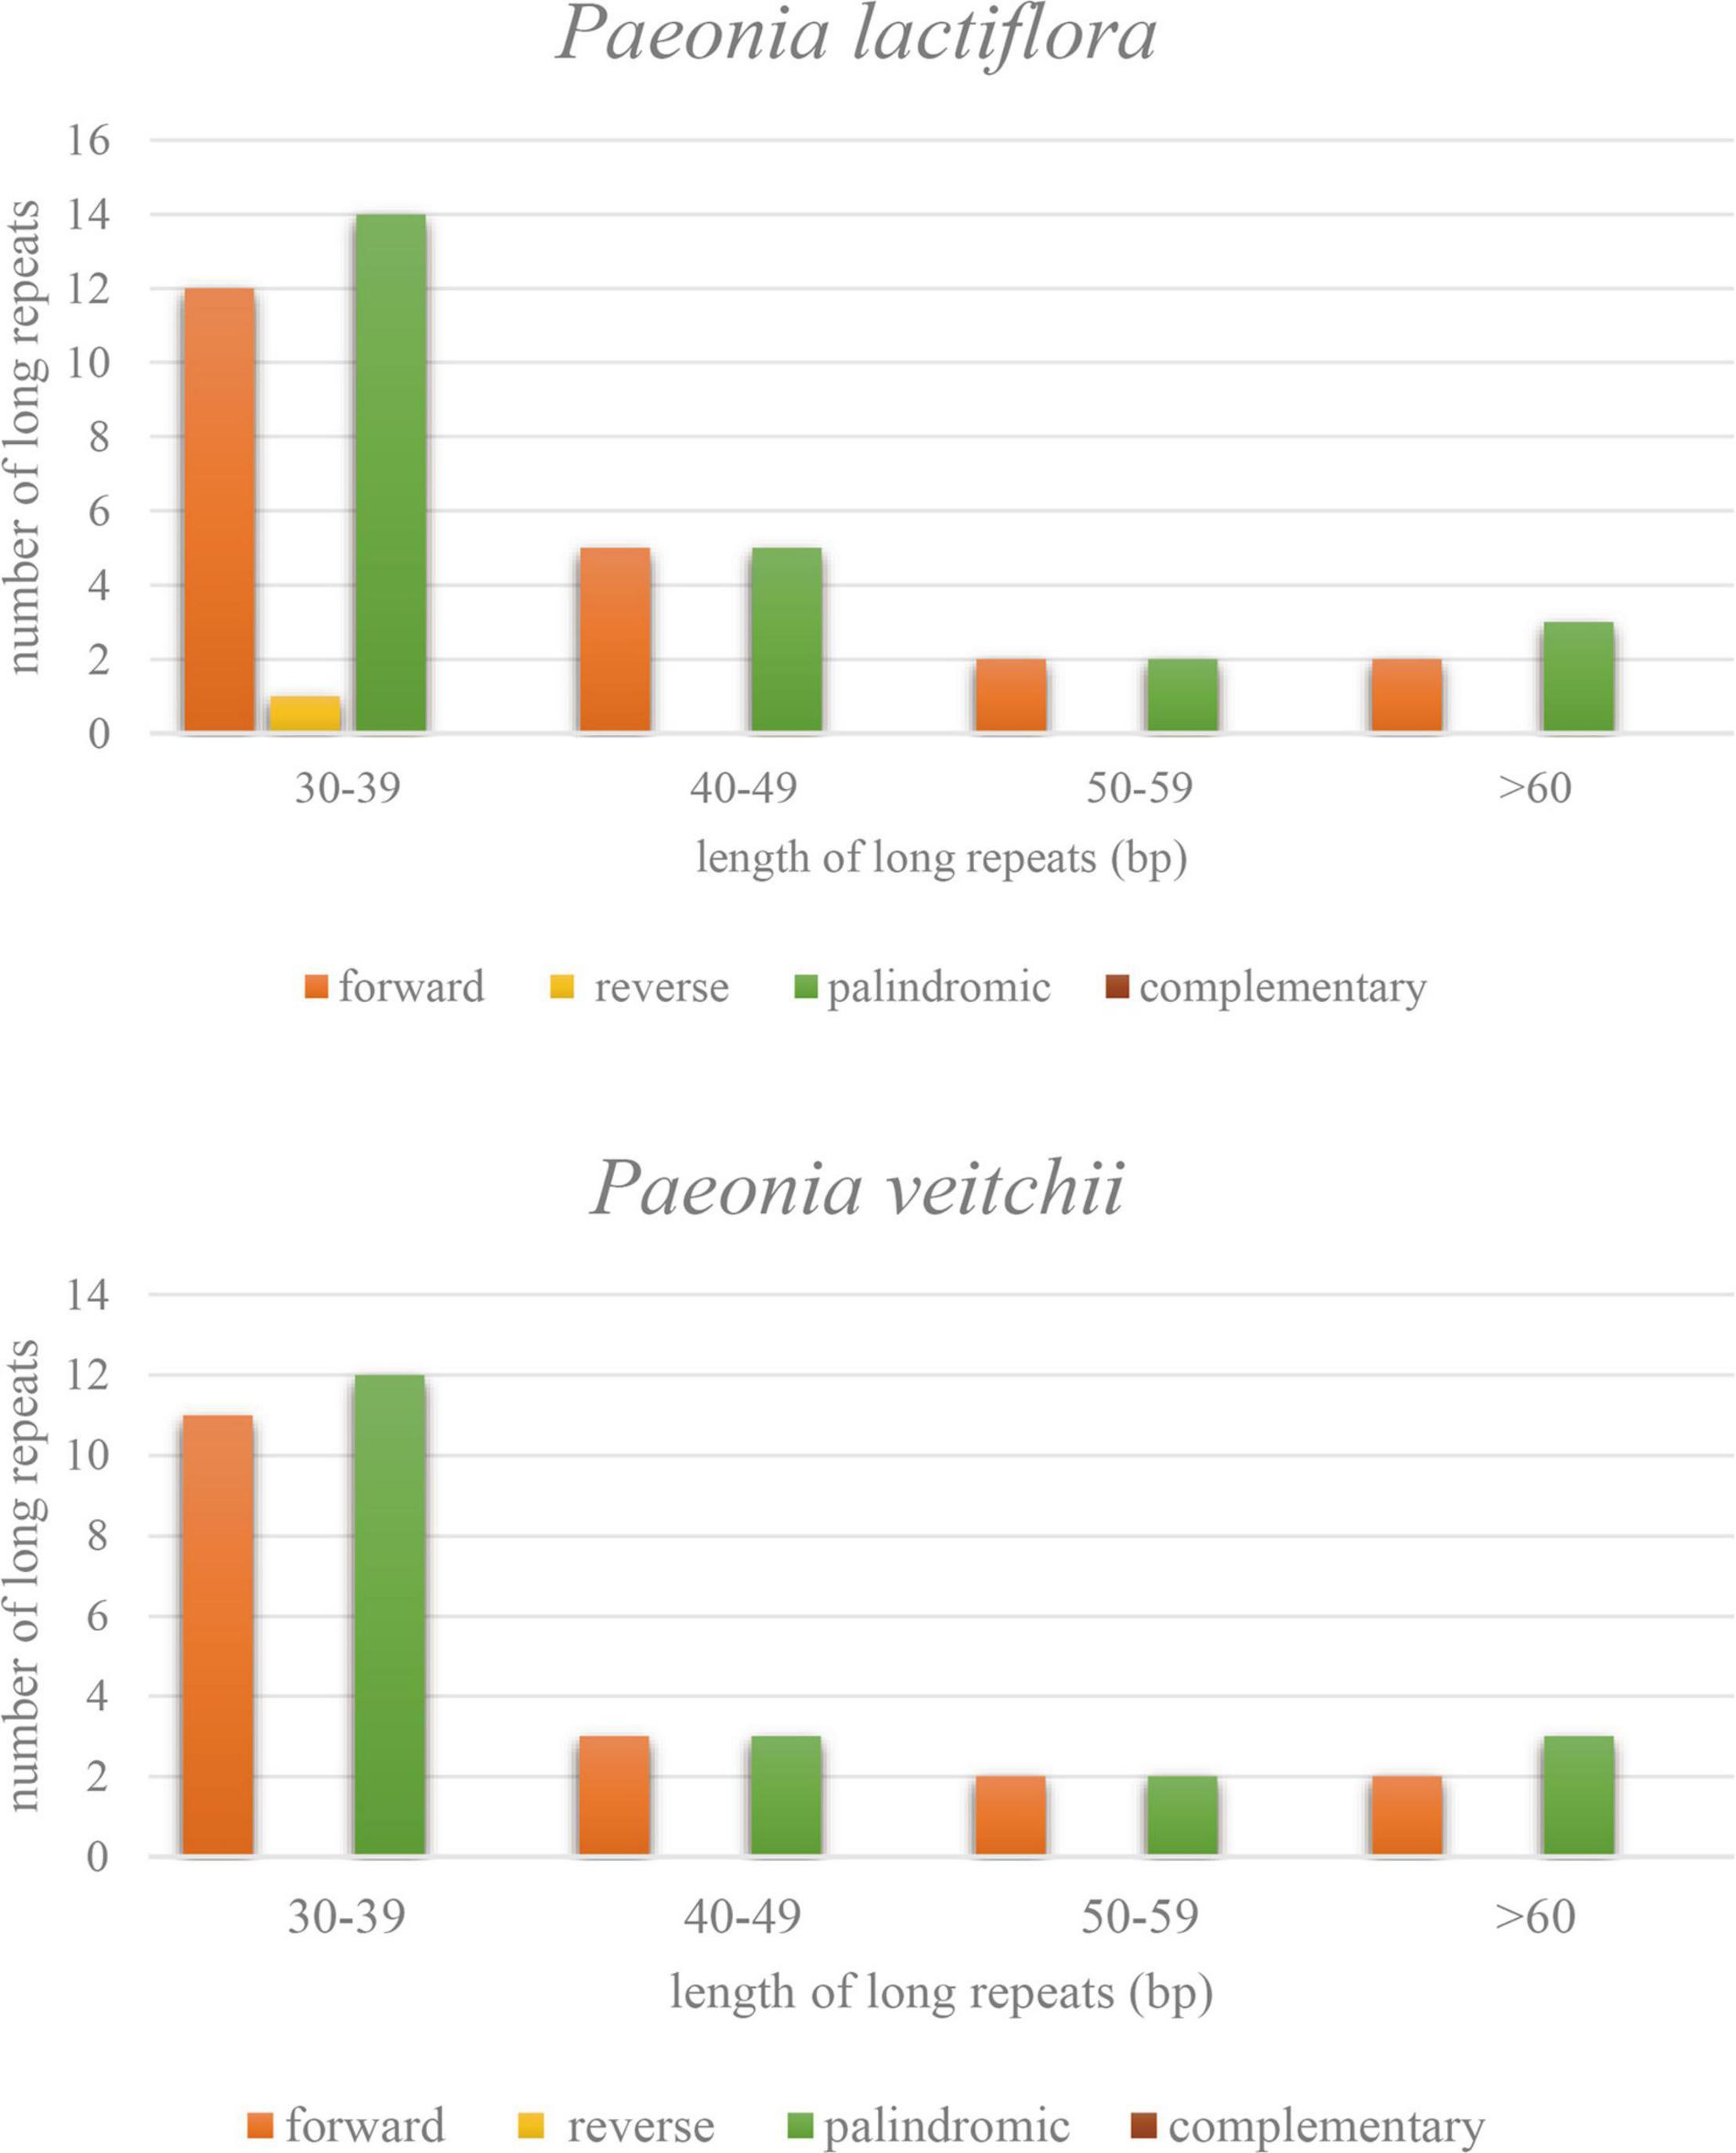
Figure 3. Types and numbers of long repeat sequences in the chloroplast genomes of Paeonia lactiflora and Paeonia veitchii.
Furthermore, all published five P. lactiflora and three P. veitchii complete chloroplast genomes in GenBank database were simultaneously taken into consideration for comparative analyses (Zhang et al., 2016; Samigullin et al., 2018; Lee et al., 2019; Gao et al., 2020; Tables 2, 3). The result showed that the two Chishao chloroplast genomes exhibited high similarity with previously published data in genome size and structure, gene number, as well as GC content.
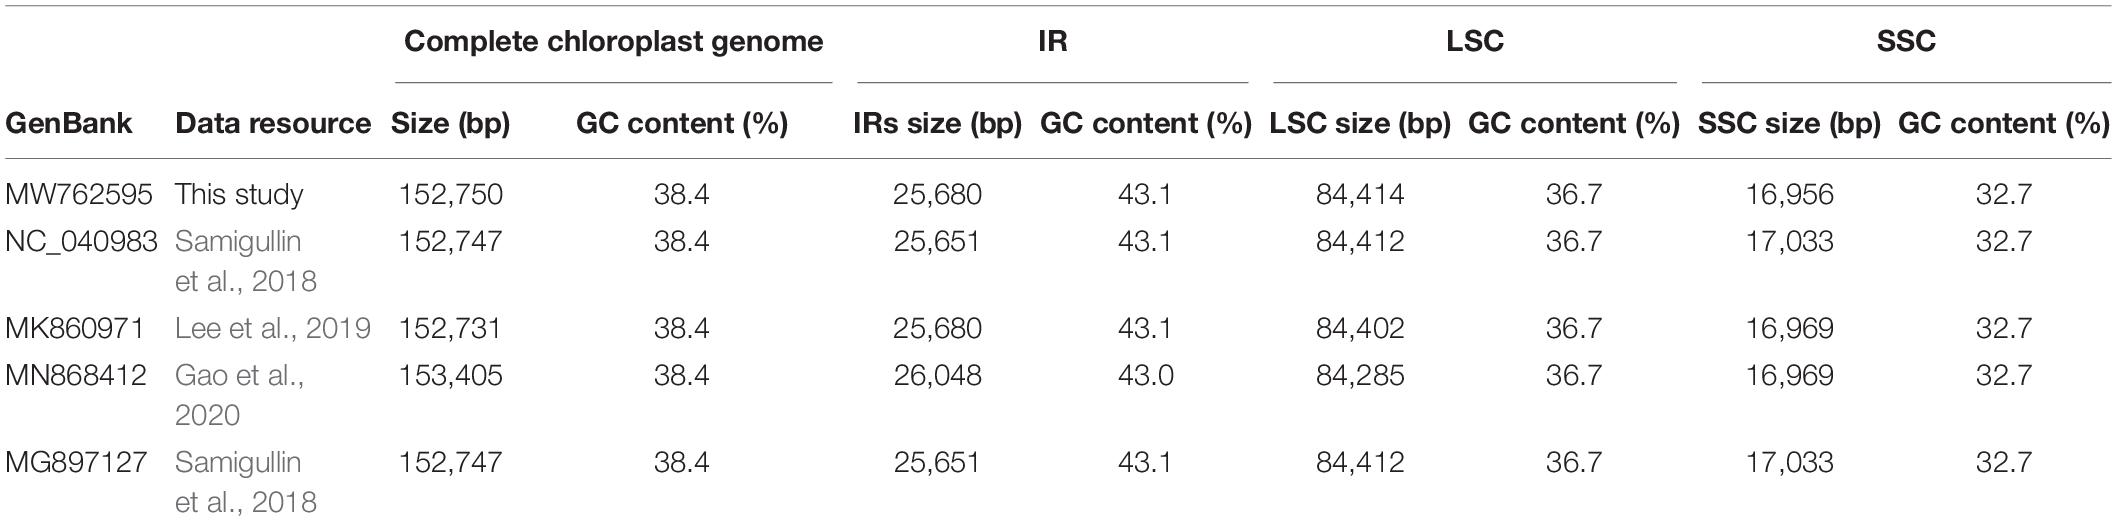
Table 2. A summary of the complete chloroplast genome, IR, LSC and SSC length (bp) and GC content of Paeonia lactiflora.
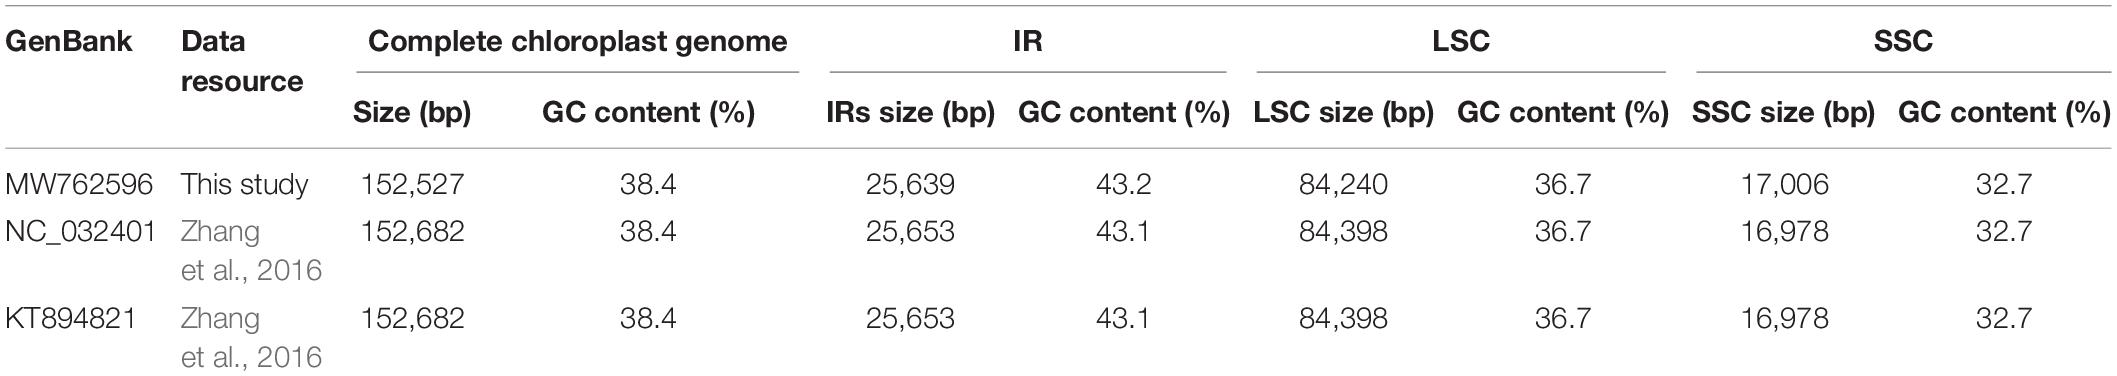
Table 3. A summary of the complete chloroplast genome, IR, LSC and SSC length (bp) and GC content of Paeonia veitchii.
Highly variable DNA regions of chloroplast genomes could be used to distinguish between closely related species (Jiao et al., 2019). In this study, a total of 77 protein-coding genes shared between two Chishao species were used to estimate nucleotide diversity. Nucleotide diversity values (Pi) varied from 0 to 0.01075, with an average of 0.00135, indicating a mild divergence between two genomes in general. However, as shown in Figure 4, seven loci showing remarkably higher Pi values (>0.004), as pstL (0.01075), psaI (0.00926), psbJ (0.00833), rpll (0.0049), ycf1b (0.0046), pasC (0.00412), and ndhF (0.00408), were suitable for mini-barcode design. Considering the limitation of barcode length, primer conservation, primer physical and chemical properties, two primer pairs were successfully designed on the ycf1b and ndhF regions finally (Table 4). The two amplicons of CS-ycf1b and CS-ndhF were 223 and 250 bp in length respectively, and each had four variable positions.
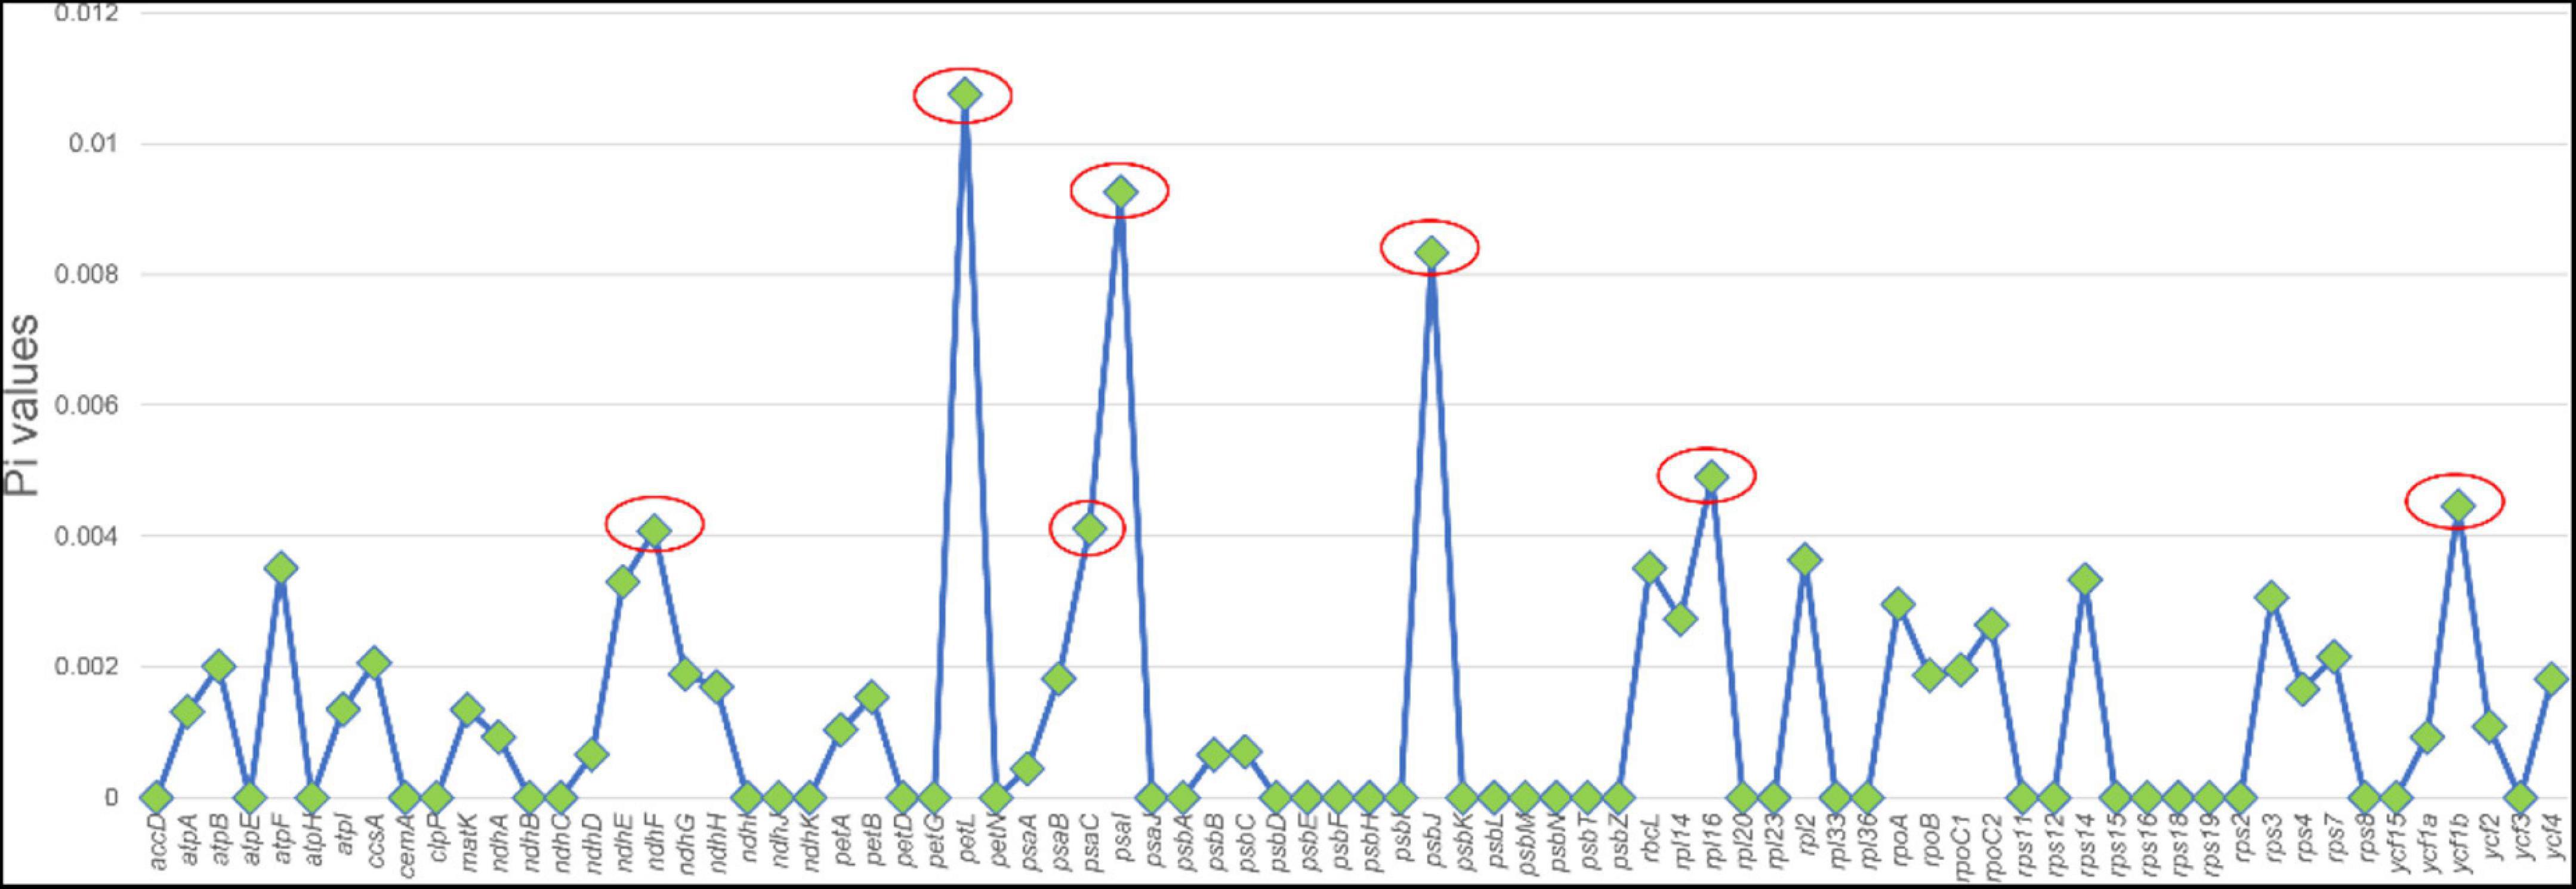
Figure 4. Nucleotide diversity of different regions between Paeonia lactiflora and Paeonia veitchii chloroplast genome in this study. The x-axis shows chloroplast genome regions and the y-axis shows nucleotide diversity.
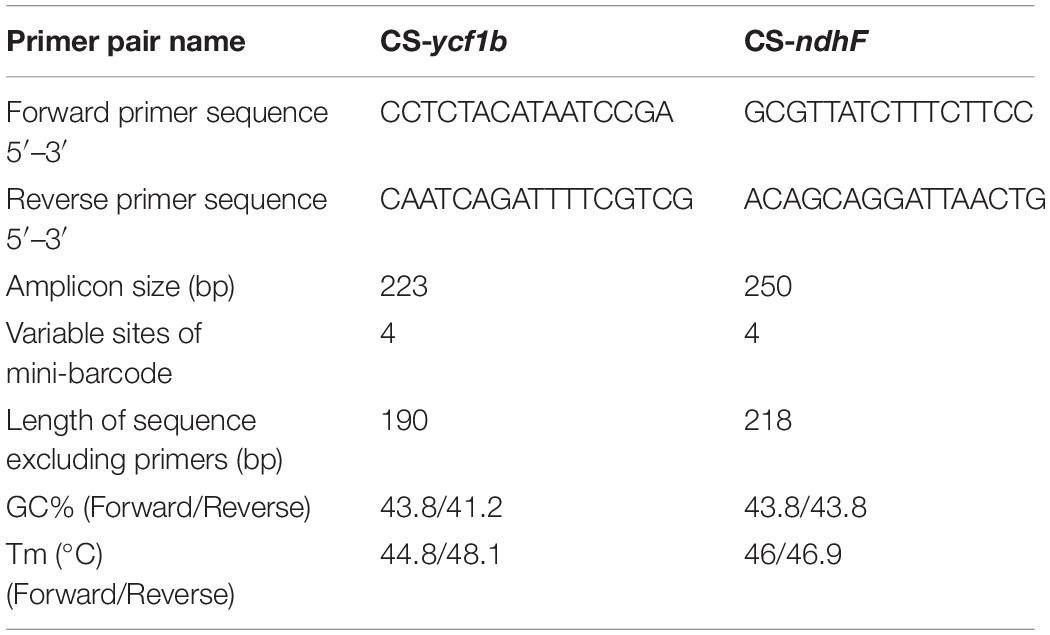
Table 4. Primer information of two mini-barcodes.
Within all available chloroplast genome sequences of two Chishao species, CS-ycf1b and CS-ndhF amplicon regions (primers trimmed) were extracted in Geneious. Neighbor Joining (NJ) was applied for constructing gene trees (Molloy and Warnow, 2018). As shown in Figure 5, all individuals from the same species clustered together and two species formed monophyletic clades with 100% bootstrap support based on either marker gene tree.
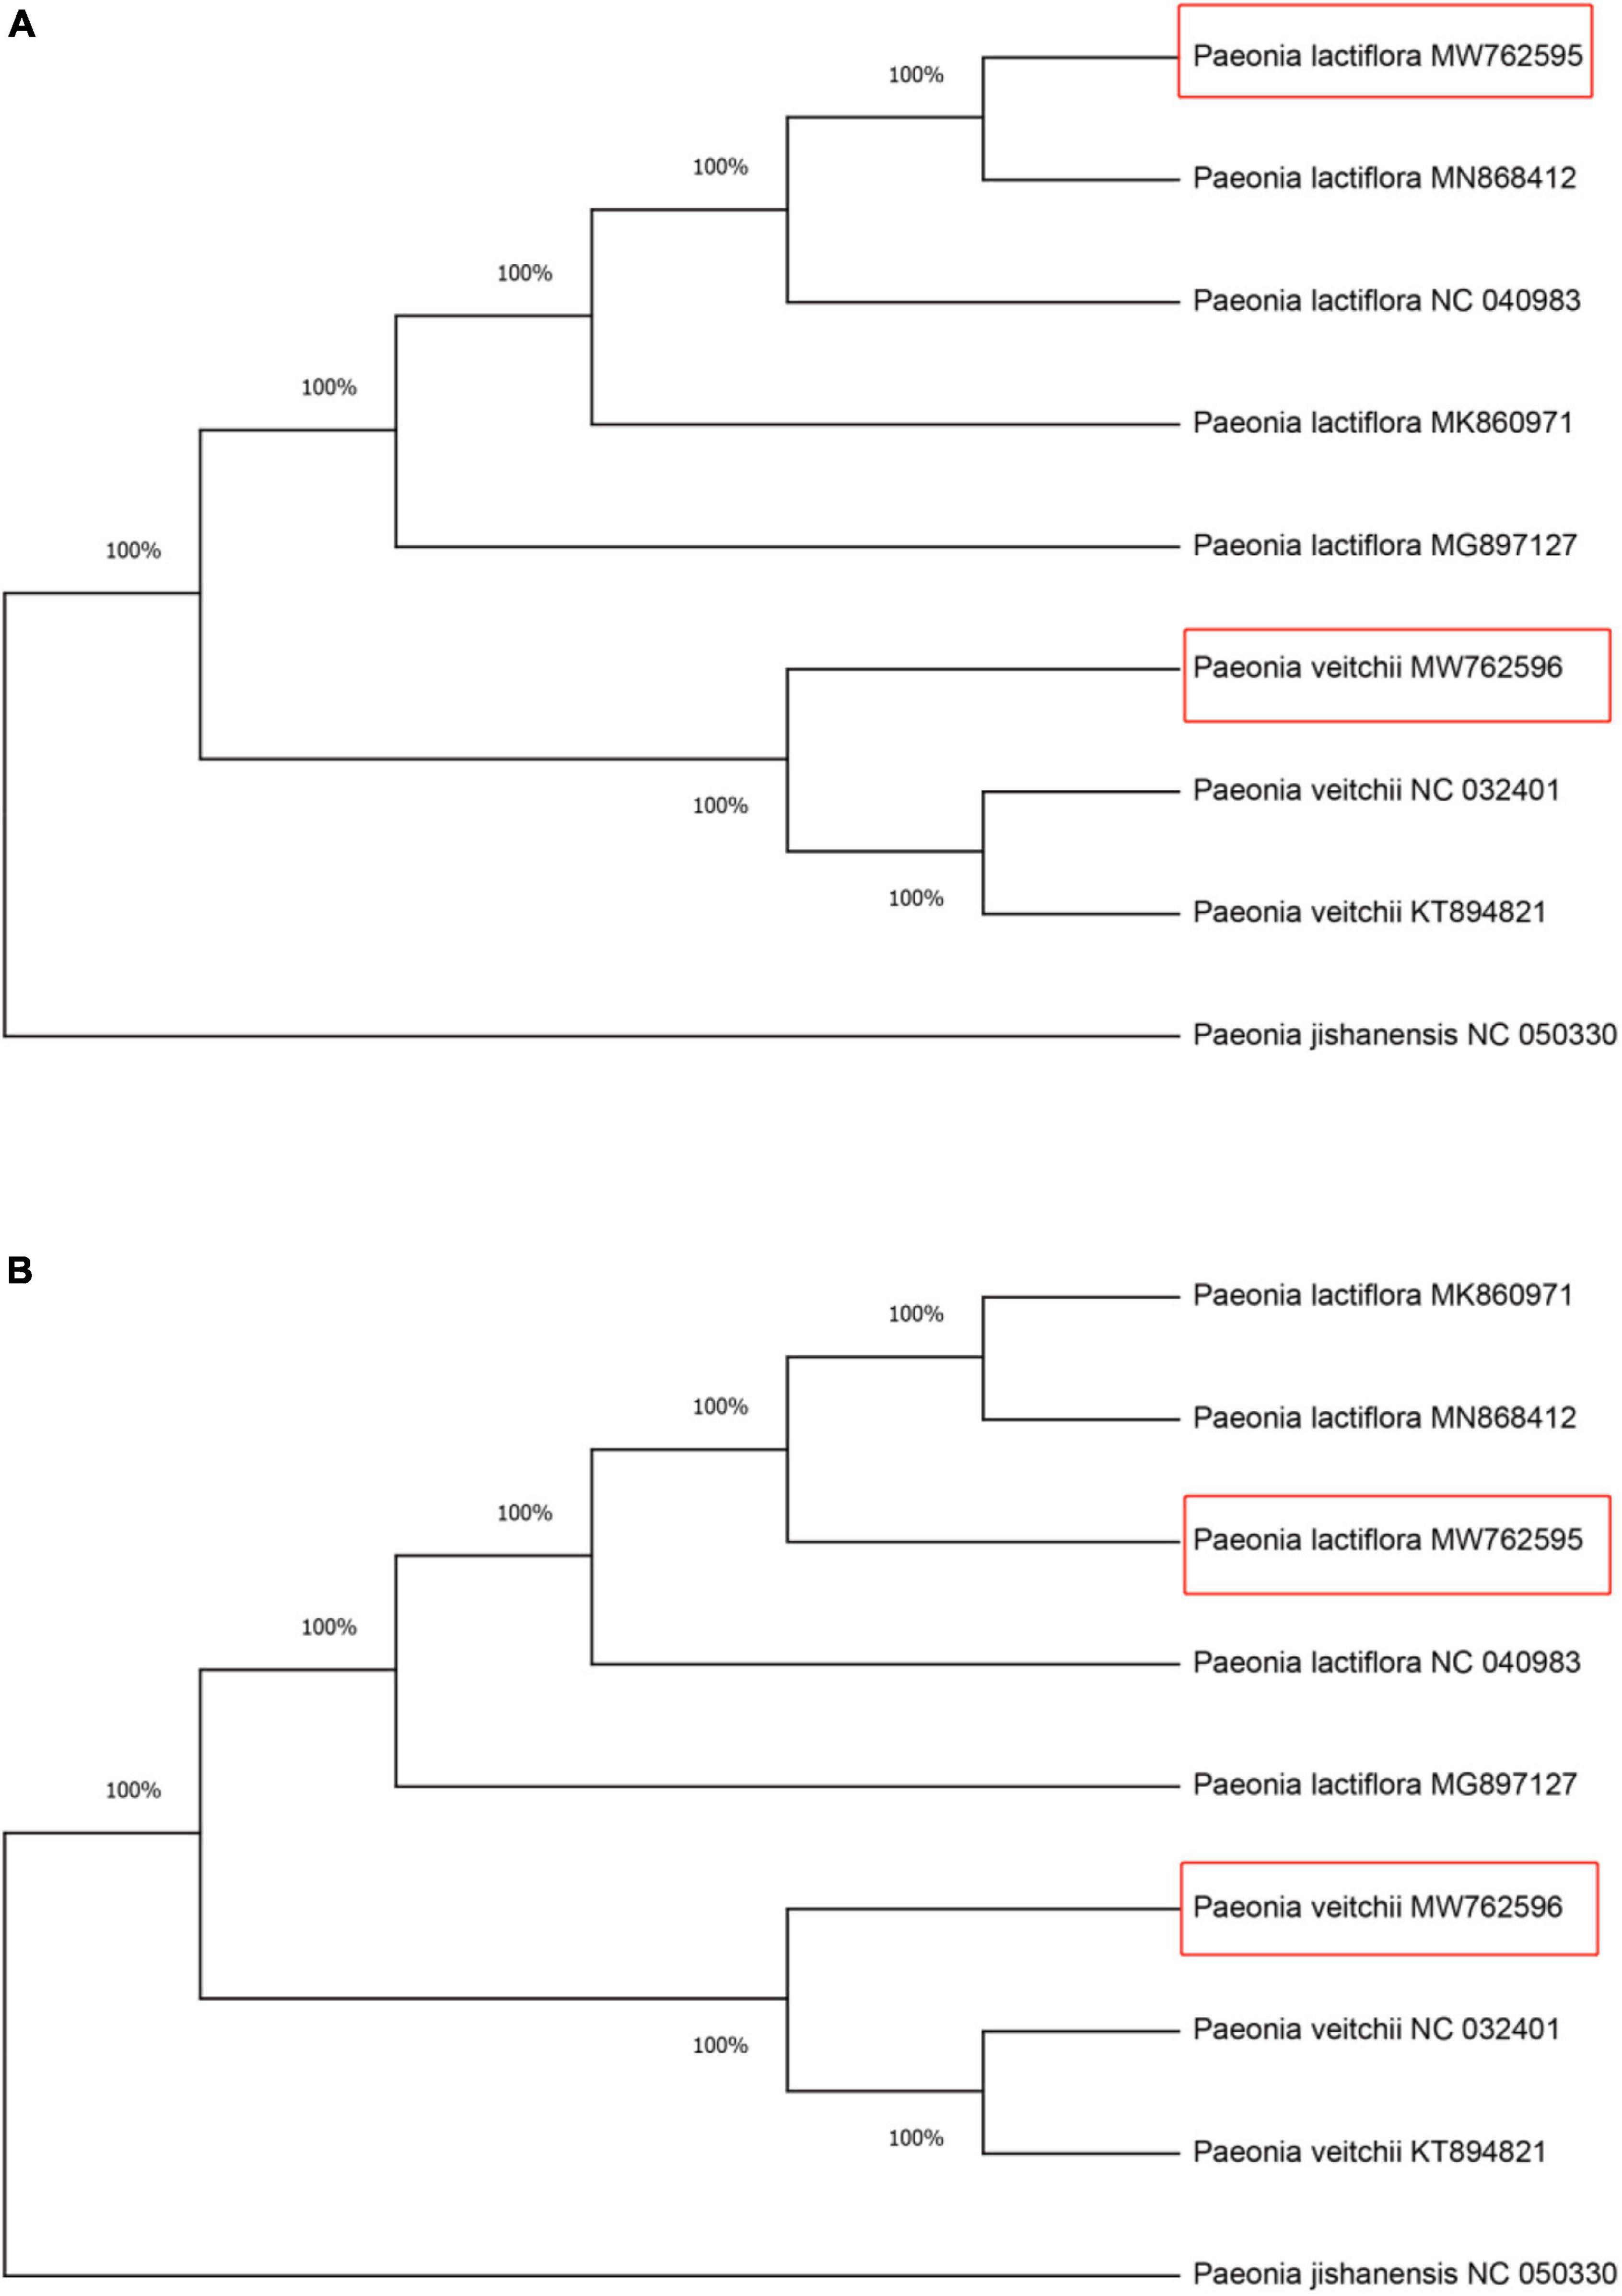
Figure 5. Neighbor-Joining (NJ) tree of the Chishao species based on primers CS-ycf1b and CS-ndhF amplified sequences. (A) Primer CS-ycf1b; (B) Primer CS-ndhF. Numbers beside nodes indicate statistical support for individual clades (percent), based on 1,000 bootstrap replicates of the data. Red boxes represent the assembled and annotated chloroplast genomes of Paeonia lactiflora and Paeonia veitchii in this study. Paeonia jishanensis was used as the outgroup. The GenBank accession numbers were listed following the species name.
As the validation of our newly designed primer pairs CS-ycf1b and CS-ndhF, all samples were successfully amplified in seven experimental mixtures (Supplementary Figure 2). All PCR amplicons were sequenced, generating a total of 14,852,184 clean reads after filtering out adaptor sequences, ambiguous reads and low-quality reads. For all three experimental repeats, based on similarity, the amplification products of CS-ycf1b were clustered into 6 ASVs, while three of them were assigned as P. lactiflora (yASV2, yASV3 and yASV6) and three as P. veitchii (yASV1, yASV4 and yASV5). The amplification products of CS-ndhF were clustered into 5 ASVS, and one of them was assigned as P. lactiflora (nASV1) and the others as P. veitchii (Supplementary Table 6).
Subsequently, we performed the correlation analysis between the species biomass proportion and species reads proportion in seven mixtures to assess the quantitative capacity of the mini-barcodes. As shown in Figure 6, results were repeatable between replicates from the same DNA extractions for both Chishao species, and a positive correlation between the sequence read counts and real proportion of individuals was illustrated. The species reads proportion for primer CS-ycf1b was more closely related to the species biomass proportion relative to primer CS-ndhF. This implied that the mini-barcode of primer CS-ycf1 seems have relatively better quantitative ability (P. lactiflora: R2 = 0.9932; P. veitchii: R2 = 0.9925) (Figure 7).
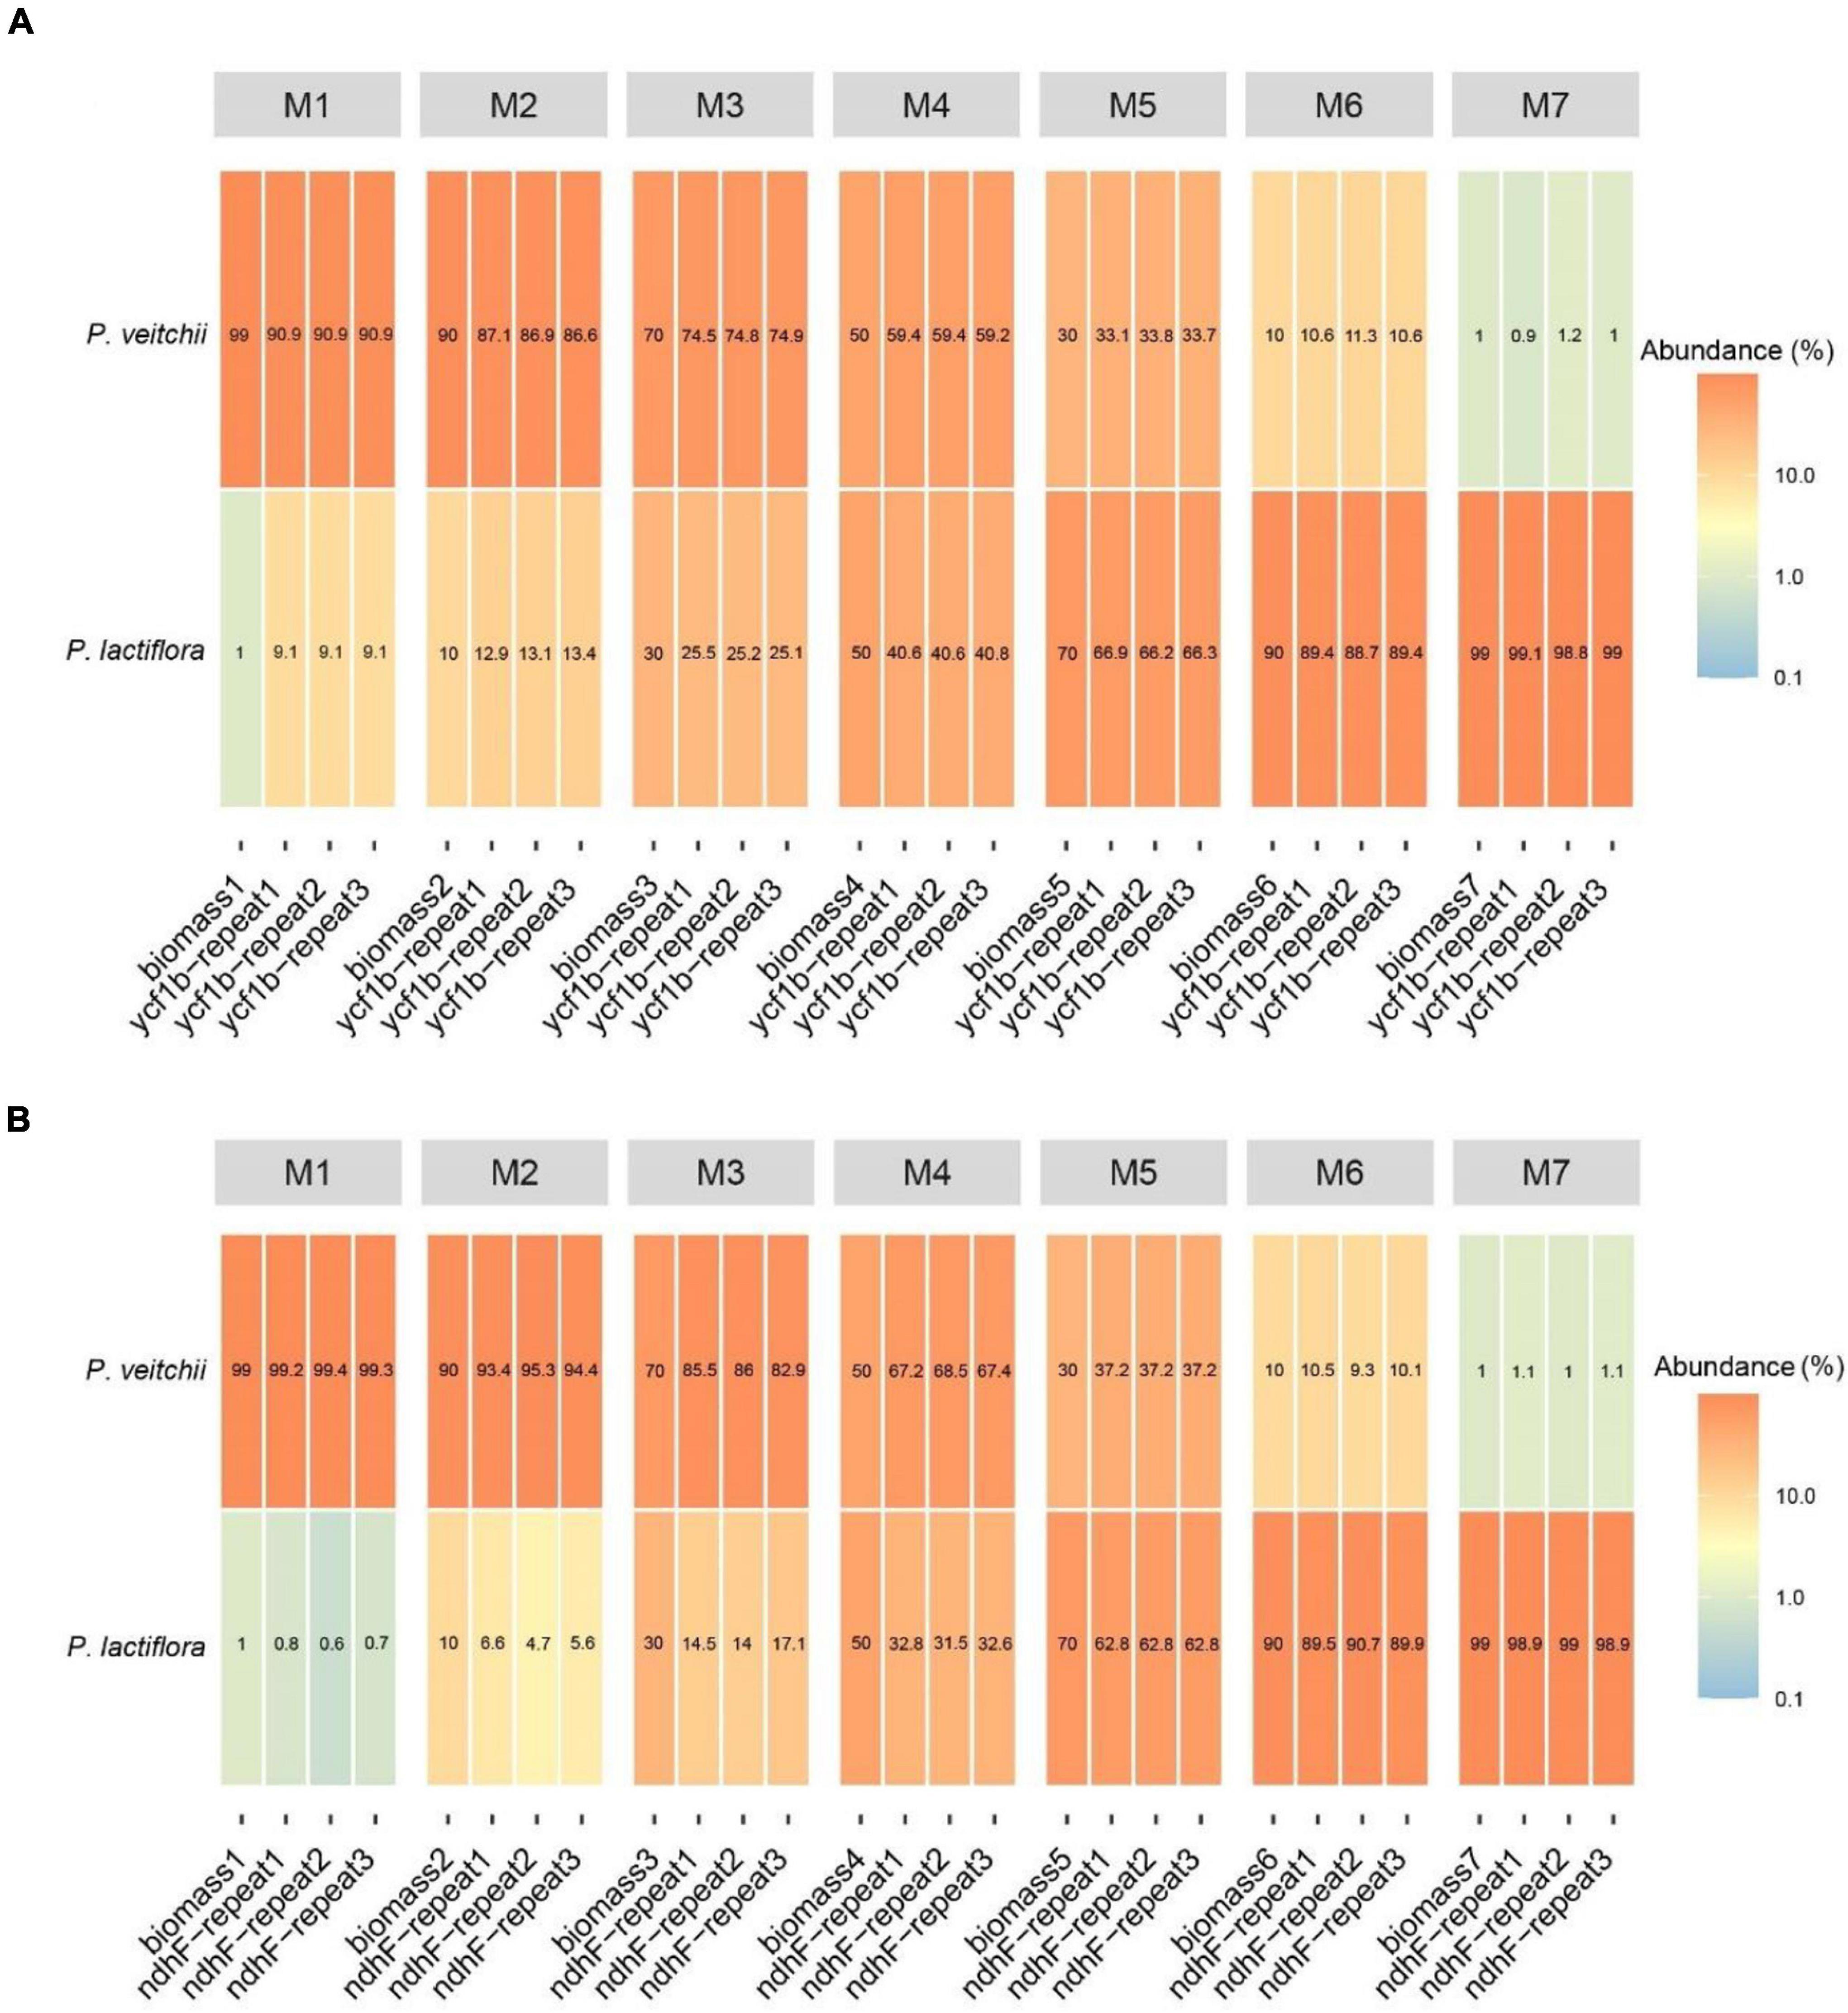
Figure 6. Heatmap of reads abundance of two pairs of different primers in seven experimental mixtures (A) Primer CS-ycf1b; (B) Primer CS-ndhF.
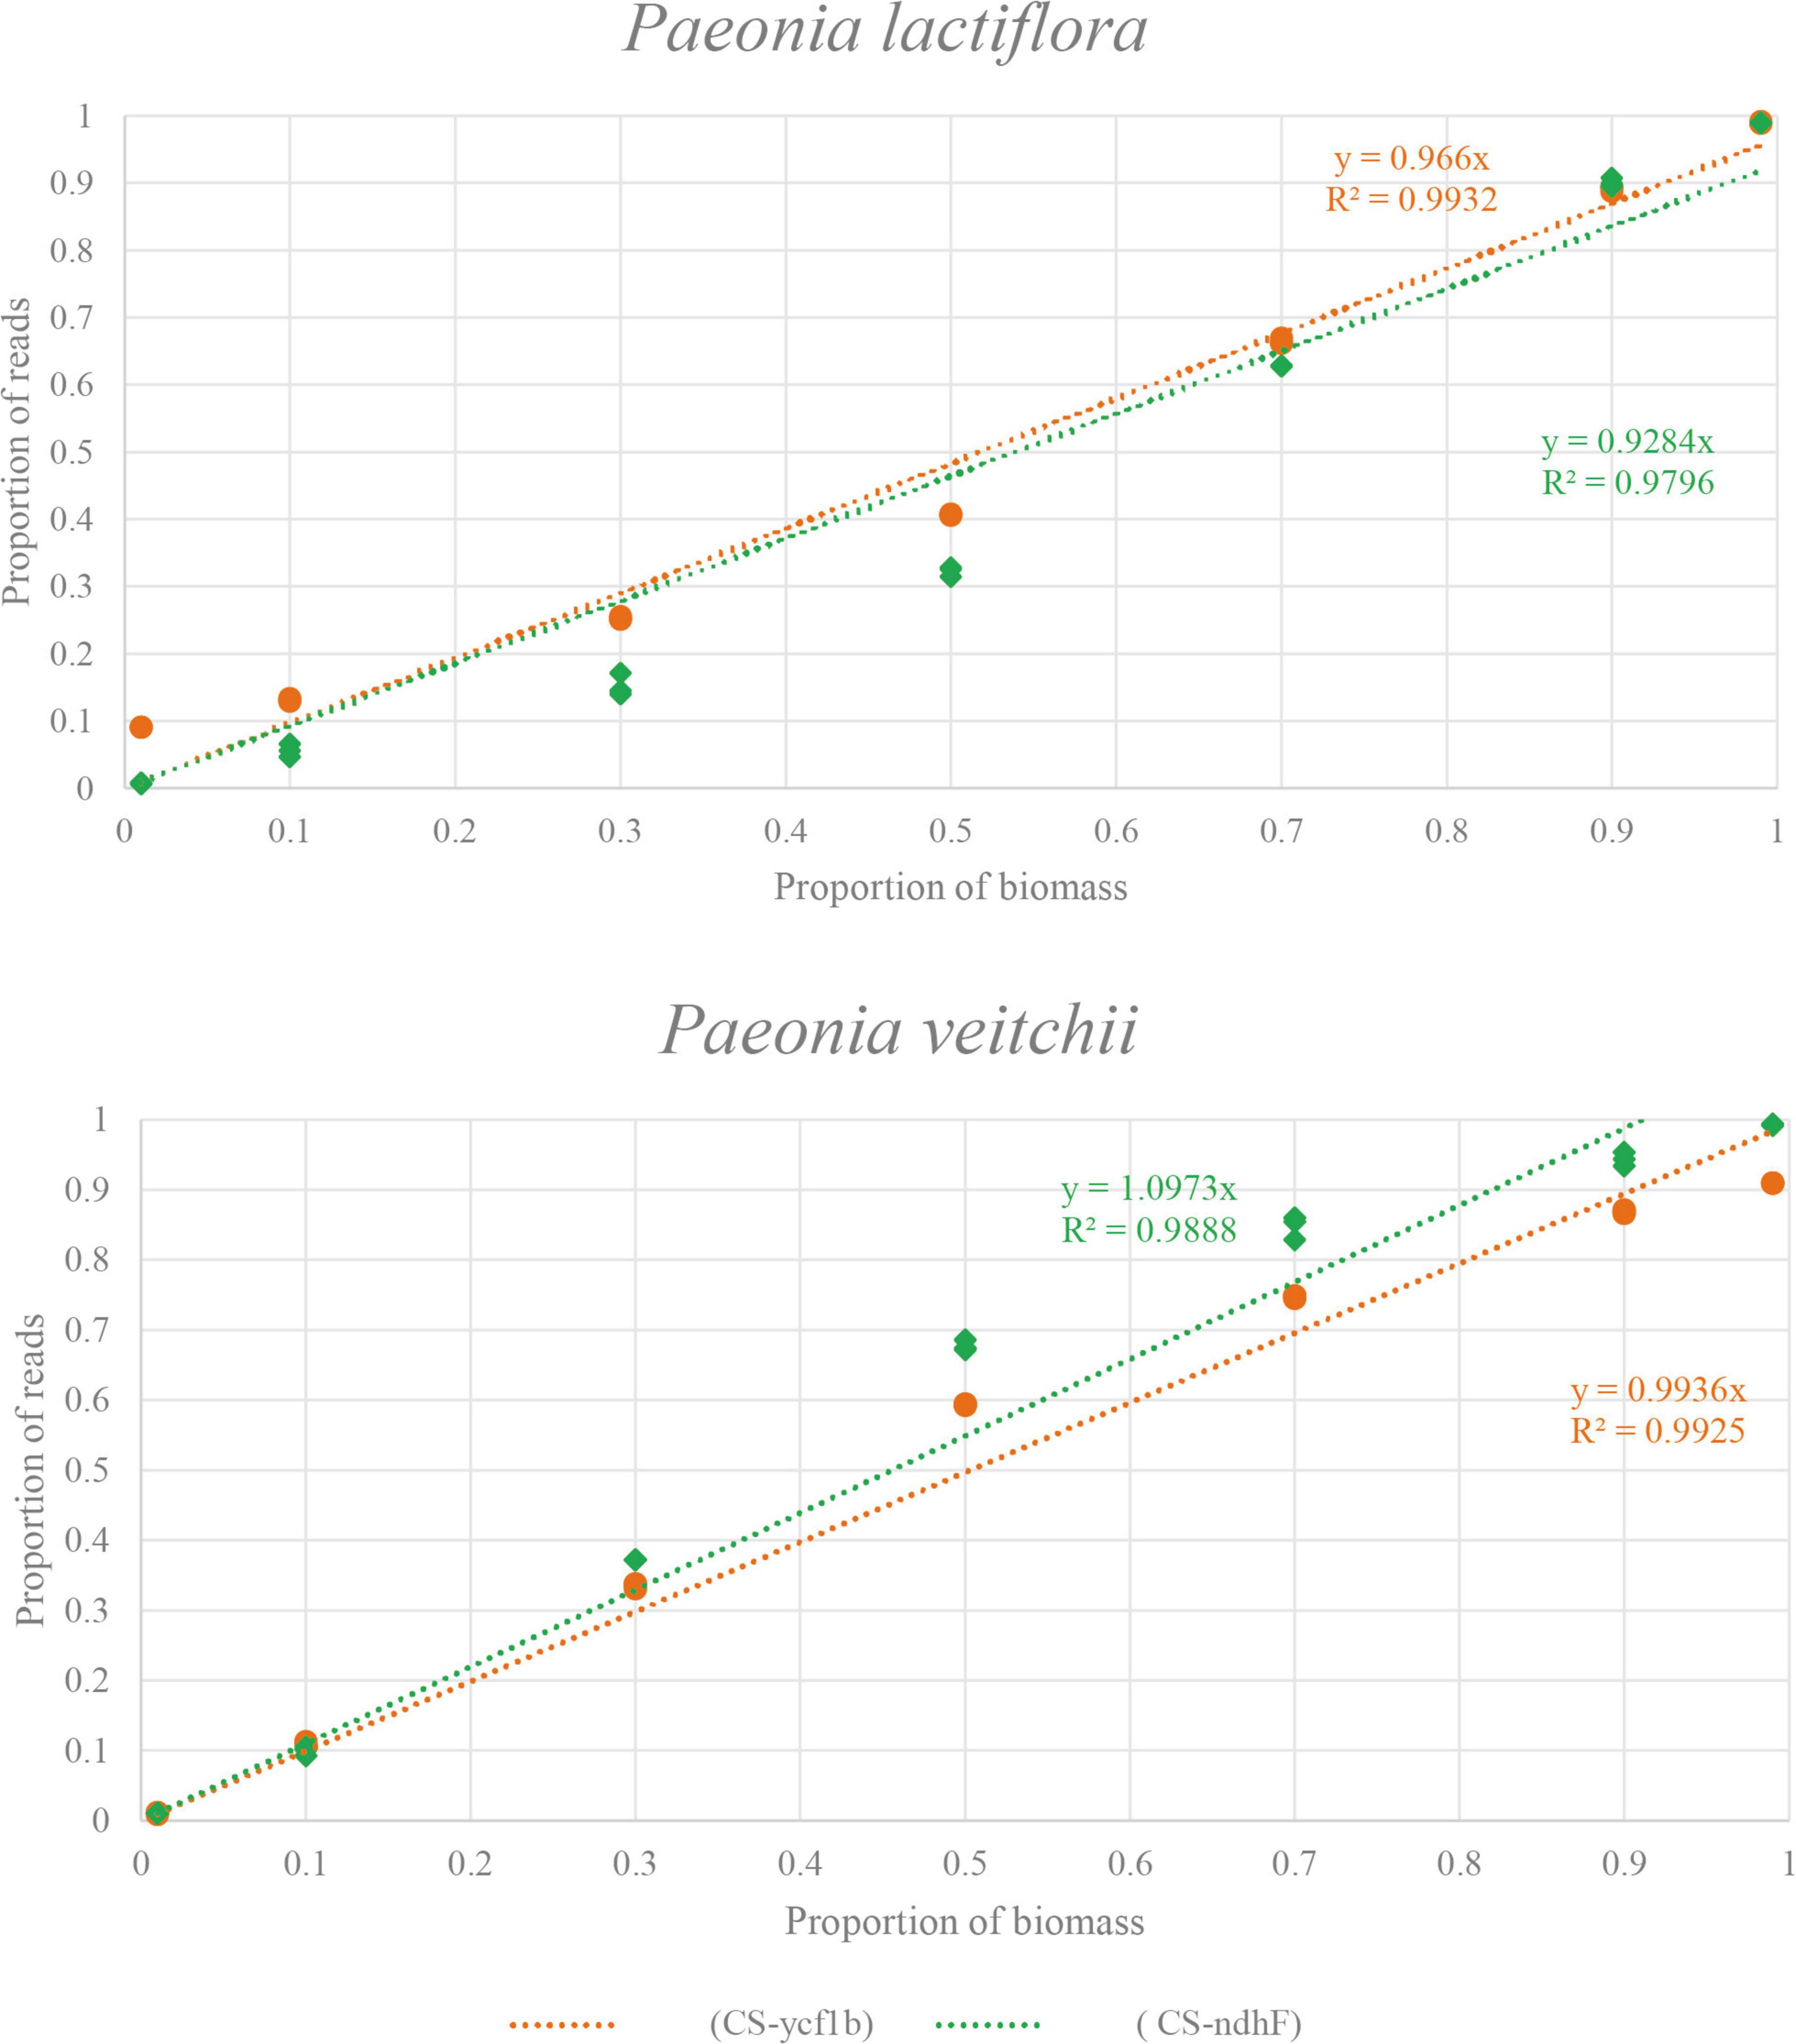
Figure 7. The relationship between biomass and read counts of the products amplified by two primer pairs (CS-ycf1b and CS-ndhF) in two species. X-axis, the proportion of biomass; Y-axis, the proportion of reads.
To examine the practicability of our mini-barcode in Chinese patent medicine, DNA was extracted from seven batches of “cerebral thrombosis tablets” and was then subjected to PCR amplification by using specific primers CS-ycf1. We found that all samples showed successful PCR amplification (Supplementary Figure 3). The PCR amplicons obtained were sequenced and Illumina sequencing generated a total of 2,359,378 high-quality filtered reads, which were clustered into 9 ASVs, and all of which were identified as P. lactiflora (Figure 8). Interestingly, the composition of ASVs varied much among 7 samples, and indicated the subspecies level biodiversity of Chishao, which may also affect medicine effection and need more exploration in future.
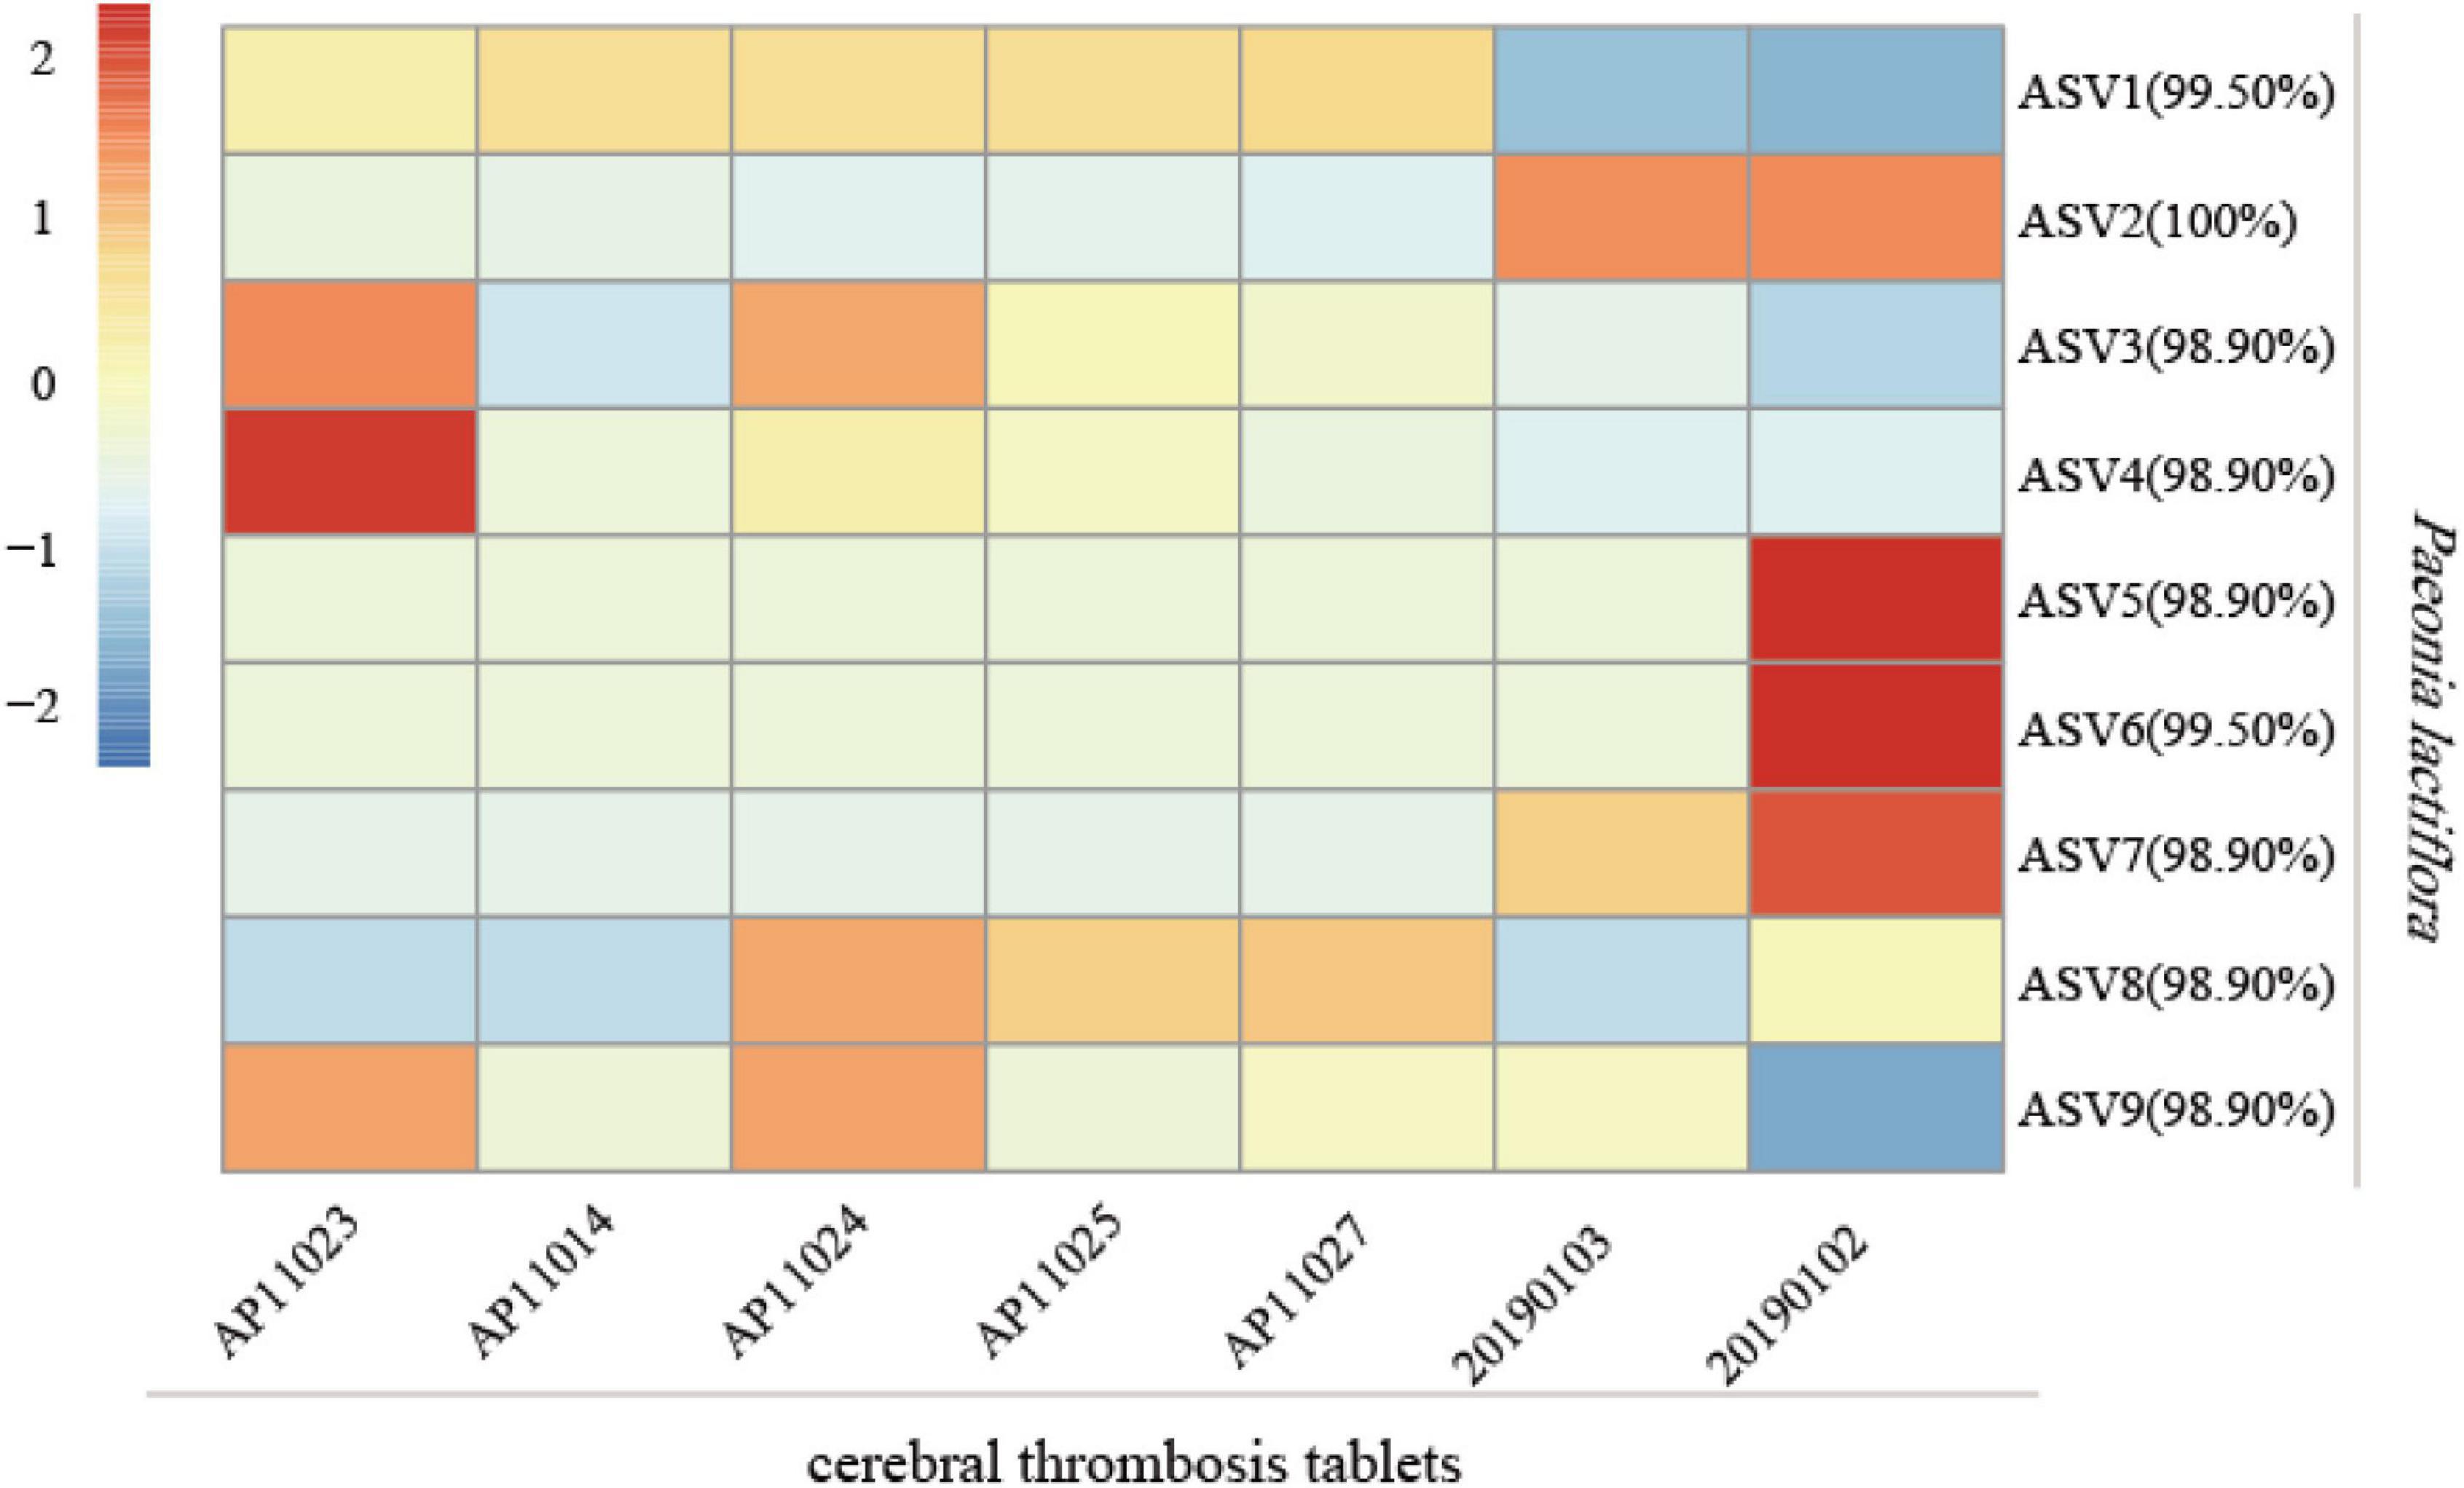
Figure 8. Analysis of the species of Chishao in 7 batches of Chinese patent medicine “cerebral thrombosis tablets.” The read counts of sequencing data were normalized by Z-Score normalization. The formula for Z-Score was (X- mu)/sigma, where X was the read counts of each sample, mu and sigma were the mean value and standard deviation, respectively. The legend indicated the Z-score for each sample. The percentage besides amplicon sequence variants (ASV) number in the figure denoted the similarity between the representative sequences of ASV and the reference sequence.
Limit of detection (LOD), is defined as the minimum amount or concentration of the analyte in the tested sample, which can be reliably detected. The main findings from our assessment of detection sensitivity and accuracy associated with the mixture of P. lactiflora and P. veitchii constructed by the metabarcoding experiment were that we could detect species with biomass percentages as low as 1% of the total sample mass. Given that the lowest theoretical detection limits were not tested in our study, we may be able to detect Chishao species with less biomass than we reported.
Besides, limit of quantification (LOQ) is defined as the lowest amount or concentration of the analyte in the tested sample, which can be quantitatively determined with an acceptable degree of accuracy and precision. In our research, quantitative data obtained for the seven experimental mixtures showed a linear relationship between the sequence read counts and real biomass proportion of individuals in the 100 mg of sample mixtures. In general, the primer CS-ycf1 exhibited better correlation coefficient than primer CS-ndhF (P. lactiflora: R2 = 0.9796; P. veitchii: R2 = 0.9888).
It’s worth noting that, the primer CS-ndhF was found to have an amplification bias toward P. veitchii (e.g., M3 and M4). On the other hand, for primer pairs CS-ycf1, the quantified result of M1 showed quite high variation between theoretic value and measure value, although the tested value of M7 was close to the theoretic value, and for CS-ndhF, the tested values for M7 and M1 were both close to the theoretical values, indicating there should be no error in the preparation of given species biomass in our experiment. In addition, the sequencing results of the three replicates were highly reproducible, which showed good reliability of the experimental results. Our potential explanation for the observed proportion bias was that many factors operating during PCR amplification and sequencing, as well as the processing of metabarcoding data (chimeric sequences, contaminants, and clustering algorithms) can alter the correspondence between the percentage of reads retrieved and the species abundance (Elbrecht and Leese, 2015; Piñol et al., 2015; Matesanz et al., 2019).
The manufacturing and processing of Chinese medicine products (e.g., cooking, high pressure, pH modification, grinding or drying) could result in varying degrees of DNA degradation, which may affect the quantity and quality of DNA extracted from these products and reduce amplification efficiency. One of the current progress in identifying plant taxa in DNA degraded samples was the use of mini-barcodes (Shokralla et al., 2015). There were many types of Chinese patent medicines containing Chishao, such as tablets, capsules, and pills. Here we selected “cerebral thrombosis tablets” commonly used in the market for the validation experiment. “cerebral thrombosis tablets” contains Chishao and nine other ingredients as follows: Carthamus tinctorius (Honghua), Angelica sinensis (Danggui), Whitmania pigra Whitman (Shuizhi), Prunus persica (Taoren), Ligusticum chuanxiong hort (Chuanxiong), Salvia miltiorrhiza (Danshen), Eupolyphaga seu Steleophaga (Tubiechong), Cornu Saigae Tataricae powder (Lingyangjiao), Bovis Calculus Artifactus powder (Niuhuang). During the medicine preparation, Chishao was ground into a fine powder (80 mesh), mixed with other materials into granules, and finally pressed into tablets. In this study, our results revealed that the primer pair CS-ycf1b could successfully amplify the nucleotide signature region to identify the Chishao from tablets even if the Chishao was processed in various ways.
In this study, based on the chloroplast genome data, the qualitative and quantitative identification of multi-origin Chinese herbal medicine Chishao was achieved by specific mini-barcode in combination with DNA metabarcoding method. Subsequently, the mini-barcode of primer CS-ycf1b was found useful for identifying processed Chinese patent medicine containing Chishao acquired in markets. Overall, we provided a research example for the identification of multi-origin herbal medicine within complex samples, which was exemplary for the subsequent application of the method.
The original contributions presented in the study are publicly available. This data can be found here: National Center for Biotechnology Information (NCBI) BioProject database under accession number PRJNA788072.
XT and XYu conceived the study. XYu and XZ performed the experiment. XYa assembled, annotated, and analyzed the plastomes. XYa drafted the manuscript. HG, ZX, and LX provided input to the manuscript. YW and XT revised the manuscript. JW, YS, JY, PL, and ML coordinated the related research works. All authors read and approved the final manuscript.
This work is supported by the grants from National Natural Science Foundation of China (81873192).
JW, YS, JY, and PL were employed by the company Tianjin Tongrentang Group Co., Ltd.
The remaining authors declare that the research was conducted in the absence of any commercial or financial relationships that could be construed as a potential conflict of interest.
All claims expressed in this article are solely those of the authors and do not necessarily represent those of their affiliated organizations, or those of the publisher, the editors and the reviewers. Any product that may be evaluated in this article, or claim that may be made by its manufacturer, is not guaranteed or endorsed by the publisher.
We would like to thank the technical team of Tianjin University of Traditional Chinese Medicine Research Institute and Science and Technology Commissioner of Tianjin Project.
The Supplementary Material for this article can be found online at: https://www.frontiersin.org/articles/10.3389/fpls.2022.819822/full#supplementary-material
LSC, large single-copy region; IR, inverted repeats region; SSC, small single-copy region; ASV, amplicon sequence variant.
Aronesty, E. (2013). Comparison of sequencing utility programs. Open Bioinform. J. 7, 1–8. doi: 10.2174/1875036201307010001
Biju, V. C., P R, S., Vijayan, S., Rajan, V. S., Sasi, A., Janardhanan, A., et al. (2019). The complete chloroplast genome of Trichopus zeylanicus, and phylogenetic analysis with dioscoreales. Plant Genome 12, 1–11. doi: 10.3835/plantgenome2019.04.0032
Callahan, B. J., McMurdie, P. J., Rosen, M. J., Han, A. W., Johnson, A. J. A., and Holmes, S. P. (2016). DADA2: high-resolution sample inference from illumina amplicon data. Nat. Methods 13, 581–583. doi: 10.1038/nmeth.3869
Caporaso, J. G., Lauber, C. L., Walters, W. A., Berg-Lyons, D., Lozupone, C. A., Turnbaugh, P. J., et al. (2011). Global patterns of 16S rRNA diversity at a depth of millions of sequences per sample. Proc. Natl. Acad. Sci. U.S.A. 108(Suppl. 1), 4516–4522. doi: 10.1073/pnas.1000080107
Cheng, X., Su, X., Chen, X., Zhao, H., Bo, C., Xu, J., et al. (2014). Biological ingredient analysis of traditional Chinese medicine preparation based on high-throughput sequencing: the story for liuwei dihuang wan. Sci. Rep. 4:5147. doi: 10.1038/srep05147
Daniell, H., Lin, C.-S., Yu, M., and Chang, W.-J. (2016). Chloroplast genomes: diversity, evolution, and applications in genetic engineering. Genome Biol. 17:134. doi: 10.1186/s13059-016-1004-2
Dierckxsens, N., Mardulyn, P., and Smits, G. (2017). NOVOPlasty: de novo assembly of organelle genomes from whole genome data. Nucleic Acids Res. 45:e18. doi: 10.1093/nar/gkw955
Drouin, G., Daoud, H., and Xia, J. (2008). Relative rates of synonymous substitutions in the mitochondrial, chloroplast and nuclear genomes of seed plants. Mol. Phylogenet. Evol. 49, 827–831. doi: 10.1016/j.ympev.2008.09.009
Elbrecht, V., and Leese, F. (2015). Can DNA-based ecosystem assessments quantify species abundance? Testing primer bias and biomass–sequence relationships with an innovative metabarcoding protocol. PLoS One 10:e0130324. doi: 10.1371/journal.pone.0130324
Frézal, L., and Leblois, R. (2008). Four years of DNA barcoding: current advances and prospects. Infect. Genet. Evol. 8, 727–736. doi: 10.1016/j.meegid.2008.05.005
Gao, C., Wang, Q., Ying, Z., Ge, Y., and Cheng, R. (2020). Molecular structure and phylogenetic analysis of complete chloroplast genomes of medicinal species Paeonia lactiflora from Zhejiang province. Mitochondrial DNA B Resour. 5, 1077–1078. doi: 10.1080/23802359.2020.1721372
Gao, Z., Liu, Y., Wang, X., Wei, X., and Han, J. (2019). DNA mini-barcoding: a derived barcoding method for herbal molecular identification. Front. Plant Sci. 10:987. doi: 10.3389/fpls.2019.00987
Govender, A., Groeneveld, J., Singh, S., and Willows-Munro, S. (2019). The design and testing of mini-barcode markers in marine lobsters. PLoS One 14:e0210492. doi: 10.1371/journal.pone.0210492
Hajibabaei, M., and McKenna, C. (2012). DNA mini-barcodes. Methods Mol. Biol. 858, 339–353. doi: 10.1007/978-1-61779-591-6_15
Huang, Y.-Q., Ma, X., Wang, J., Zhao, Y.-L., Wang, J.-B., Chen, Z., et al. (2016). Therapeutic efficacy and safety of paeoniae radix rubra formulae in relieving hyperbilirubinemia induced by viral hepatitis: a meta-analysis. Front. Pharmacol. 7:63. doi: 10.3389/fphar.2016.00063
Jiang, H., Li, J., Wang, L., Wang, S., Nie, X., Chen, Y., et al. (2020). Total glucosides of paeony: a review of its phytochemistry, role in autoimmune diseases, and mechanisms of action. J. Ethnopharmacol. 258:112913. doi: 10.1016/j.jep.2020.112913
Jiao, L., Lu, Y., He, T., Li, J., and Yin, Y. (2019). A strategy for developing high-resolution DNA barcodes for species discrimination of wood specimens using the complete chloroplast genome of three Pterocarpus species. Planta 250, 95–104. doi: 10.1007/s00425-019-03150-1
Jin, S. N., Wen, J. F., Wang, T. T., Kang, D. G., Lee, H. S., and Cho, K. W. (2012). Vasodilatory effects of ethanol extract of radix paeoniae rubra and its mechanism of action in the rat aorta. J. Ethnopharmacol. 142, 188–193. doi: 10.1016/j.jep.2012.04.035
Kechin, A., Boyarskikh, U., Kel, A., and Filipenko, M. (2017). CutPrimers: a new tool for accurate cutting of primers from reads of targeted next generation sequencing. J. Comput. Biol. 24, 1138–1143. doi: 10.1089/cmb.2017.0096
Kim, W. J., Ji, Y., Choi, G., Kang, Y. M., Yang, S., and Moon, B. C. (2016). Molecular identification and phylogenetic analysis of important medicinal plant species in genus Paeonia based on rDNA-ITS, matK, and rbcL DNA barcode sequences. Genet. Mol. Res. 15, 1–12. doi: 10.4238/gmr.15038472
Kuang, D.-Y., Wu, H., Wang, Y.-L., Gao, L.-M., Zhang, S.-Z., and Lu, L. (2011). Complete chloroplast genome sequence of Magnolia kwangsiensis (Magnoliaceae): implication for DNA barcoding and population genetics. Genome 54, 663–673. doi: 10.1139/g11-026
Langmead, B., and Salzberg, S. L. (2012). Fast gapped-read alignment with bowtie 2. Nat. Methods 9, 357–359. doi: 10.1038/nmeth.1923
Lee, M., Park, J. H., Gil, J., Lee, J., and Lee, Y. (2019). The complete chloroplast genome of Paeonia lactiflora Pall. (Paeoniaceae). Mitochondrial DNA B Resour. 4, 2715–2716. doi: 10.1080/23802359.2019.1644548
Leray, M., Yang, J. Y., Meyer, C. P., Mills, S. C., Agudelo, N., Ranwez, V., et al. (2013). A new versatile primer set targeting a short fragment of the mitochondrial COI region for metabarcoding metazoan diversity: application for characterizing coral reef fish gut contents. Front. Zool. 10:34. doi: 10.1186/1742-9994-10-34
Li, L., Jiang, Y., Liu, Y., Niu, Z., Xue, Q., Liu, W., et al. (2020). The large single-copy (LSC) region functions as a highly effective and efficient molecular marker for accurate authentication of medicinal Dendrobium species. Acta Pharm. Sin. B 10, 1989–2001. doi: 10.1016/j.apsb.2020.01.012
Liang, J., Xu, F., Zhang, Y.-Z., Huang, S., Zang, X.-Y., Zhao, X., et al. (2013). The profiling and identification of the absorbed constituents and metabolites of paeoniae radix rubra decoction in rat plasma and urine by the HPLC-DAD-ESI-IT-TOF-MS(n) technique: a novel strategy for the systematic screening and identification of absorbed constituents and metabolites from traditional Chinese medicines. J. Pharm. Biomed. Anal. 83, 108–121. doi: 10.1016/j.jpba.2013.04.029
Lin, M.-Y., Chiang, S.-Y., Li, Y.-Z., Chen, M.-F., Chen, Y.-S., Wu, J.-Y., et al. (2016). Anti-tumor effect of radix paeoniae rubra extract on mice bladder tumors using intravesical therapy. Oncol. Lett. 12, 904–910. doi: 10.3892/ol.2016.4698
Liu, X., Chen, K., Zhuang, Y., Huang, Y., Sui, Y., Zhang, Y., et al. (2019). Paeoniflorin improves pressure overload-induced cardiac remodeling by modulating the MAPK signaling pathway in spontaneously hypertensive rats. Biomed. Pharmacother. 111, 695–704. doi: 10.1016/j.biopha.2018.12.090
Lohse, M., Drechsel, O., and Bock, R. (2007). OrganellarGenomeDRAW (OGDRAW): a tool for the easy generation of high-quality custom graphical maps of plastid and mitochondrial genomes. Curr. Genet. 52, 267–274. doi: 10.1007/s00294-007-0161-y
Lowe, T. M., and Chan, P. P. (2016). tRNAscan-SE On-line: integrating search and context for analysis of transfer RNA genes. Nucleic. Acids Res. 44 W54–W57. doi: 10.1093/nar/gkw413
Matesanz, S., Pescador, D. S., Pías, B., Sánchez, A. M., Chacón-Labella, J., Illuminati, A., et al. (2019). Estimating belowground plant abundance with DNA metabarcoding. Mol. Ecol. Resour. 19, 1265–1277. doi: 10.1111/1755-0998.13049
Meusnier, I., Singer, G. A. C., Landry, J.-F., Hickey, D. A., Hebert, P. D. N., and Hajibabaei, M. (2008). A universal DNA mini-barcode for biodiversity analysis. BMC Genomics 9:214. doi: 10.1186/1471-2164-9-214
Molloy, E. K., and Warnow, T. (2018). Statistically consistent divide-and-conquer pipelines for phylogeny estimation using NJMerge. Algorithms Mol. Biol. 14:14. doi: 10.1186/s13015-019-0151-x
National Pharmacopoeia Committee (2015). Pharmacopoeia of the People’s Republic of China. Part 1. Beijing: Chinese medicines and Technology Press, 188–189
Pan, J., Zhang, D., and Sang, T. (2007). Molecular phylogenetic evidence for the origin of a diploid hybrid of Paeonia (Paeoniaceae). Am. J. Bot. 94, 400–408. doi: 10.3732/ajb.94.3.400
Park, I., Yang, S., Kim, W. J., Noh, P., Lee, H. O., and Moon, B. C. (2018). The complete chloroplast genomes of six Ipomoea Species and indel marker development for the discrimination of authentic pharbitidis semen (Seeds of I. nil or I. purpurea). Front. Plant Sci. 9:965. doi: 10.3389/fpls.2018.00965
Parker, S., May, B., Zhang, C., Zhang, A. L., Lu, C., and Xue, C. C. (2016). A pharmacological review of bioactive constituents of Paeonia lactiflora pallas and Paeonia veitchii lynch. Phytother. Res. 30, 1445–1473. doi: 10.1002/ptr.5653
Piñol, J., Mir, G., Gomez-Polo, P., and Agustí, N. (2015). Universal and blocking primer mismatches limit the use of high-throughput DNA sequencing for the quantitative metabarcoding of arthropods. Mol. Ecol. Resour. 15, 819–830. doi: 10.1111/1755-0998.12355
Raime, K., and Remm, M. (2018). Method for the identification of taxon-specific k-mers from chloroplast genome: a case study on tomato plant (Solanum lycopersicum). Front. Plant Sci. 9:6. doi: 10.3389/fpls.2018.00006
Rozas, J., Ferrer-Mata, A., Sánchez-DelBarrio, J. C., Guirao-Rico, S., Librado, P., Ramos-Onsins, S. E., et al. (2017). DnaSP 6: DNA sequence polymorphism analysis of large data sets. Mol. Biol. Evol. 34, 3299–3302. doi: 10.1093/molbev/msx248
Rychlik, W. (2007). OLIGO 7 primer analysis software. Methods Mol. Biol. 402, 35–60. doi: 10.1007/978-1-59745-528-2_2
Samigullin, T. H., Logacheva, M. D., Degtjareva, G. V., Efimov, S. V., and Vallejo-Roman, C. M. (2018). Complete plastome sequence of Paeonia lactiflora Pall. (Paeoniaceae: Saxifragales). Mitochondrial DNA B Resour. 3, 1110–1111. doi: 10.1080/23802359.2018.1501311
Sang, T., and Zhang, D. (1999). Reconstructing hybrid speciation using sequences of low copy nuclear genes: hybrid origins of five Paeonia species based on adh gene phylogenies. Sys. Bot. 24, 148–163. doi: 10.2307/2419546
Shi, Y.-H., Zhu, S., Ge, Y.-W., Toume, K., Wang, Z., Batkhuu, J., et al. (2016). Characterization and quantification of monoterpenoids in different types of peony root and the related Paeonia species by liquid chromatography coupled with ion trap and time-of-flight mass spectrometry. J. Pharm. Biomed. Anal. 129, 581–592. doi: 10.1016/j.jpba.2016.07.031
Shokralla, S., Hellberg, R. S., Handy, S. M., King, I., and Hajibabaei, M. (2015). A DNA mini-barcoding system for authentication of processed fish products. Sci. Rep. 5:15894. doi: 10.1038/srep15894
Song, M., Dong, G.-Q., Zhang, Y.-Q., Liu, X., and Sun, W. (2017). Identification of processed Chinese medicinal materials using DNA mini-barcoding. Chin. J. Nat. Med. 15, 481–486. doi: 10.1016/S1875-5364(17)30073-0
Taberlet, P., Coissac, E., Pompanon, F., Brochmann, C., and Willerslev, E. (2012). Towards next-generation biodiversity assessment using DNA metabarcoding. Mol. Ecol. 21, 2045–2050. doi: 10.1111/j.1365-294X.2012.05470.x
Tanaka, T., Kataoka, M., Tsuboi, N., and Kouno, I. (2000). New monoterpene glycoside esters and phenolic constituents of Paeoniae radix, and increase of water solubility of proanthocyanidins in the presence of paeoniflorin. Chem. Pharm. Bull. (Tokyo) 48, 201–207. doi: 10.1248/cpb.48.201
Tillich, M., Lehwark, P., Pellizzer, T., Ulbricht-Jones, E. S., Fischer, A., Bock, R., et al. (2017). GeSeq – versatile and accurate annotation of organelle genomes. Nucleic. Acids Res. 45, W6–W11. doi: 10.1093/nar/gkx391
Tu, J., Guo, Y., Hong, W., Fang, Y., Han, D., Zhang, P., et al. (2019). The regulatory effects of paeoniflorin and Its derivative paeoniflorin-6’-O-benzene sulfonate CP-25 on inflammation and immune diseases. Front. Pharmacol. 10:57. doi: 10.3389/fphar.2019.00057
Wang, R., Xiong, A.-Z., Teng, Z.-Q., Yang, Q.-W., Shi, Y.-H., and Yang, L. (2012). Radix paeoniae rubra and radix paeoniae alba attenuate CCl4-induced acute liver injury: an ultra-performance liquid chromatography-mass spectrometry (UPLC-MS) based metabolomic approach for the pharmacodynamic study of traditional Chinese medicines (TCMs). Int. J. Mol. Sci. 13, 14634–14647. doi: 10.3390/ijms131114634
Xie, P., Cui, L., Shan, Y., and Kang, W.-Y. (2017). Antithrombotic effect and mechanism of radix paeoniae rubra. Biomed. Res. Int. 2017:9475074. doi: 10.1155/2017/9475074
Xu, C., Dong, W., Li, W., Lu, Y., Xie, X., Jin, X., et al. (2017). Comparative analysis of six Lagerstroemia complete chloroplast genomes. Front. Plant Sci. 8:15. doi: 10.3389/fpls.2017.00015
Xu, S., Yang, L., Tian, R., Wang, Z., Liu, Z., Xie, P., et al. (2009). Species differentiation and quality assessment of radix paeoniae rubra (Chi-shao) by means of high-performance liquid chromatographic fingerprint. J. Chromatogr. A 1216, 2163–2168. doi: 10.1016/j.chroma.2008.04.064
Xu, X., Li, F., Zhang, X., Li, P., Zhang, X., Wu, Z., et al. (2014). In vitro synergistic antioxidant activity and identification of antioxidant components from Astragalus membranaceus and Paeonia lactiflora. PLoS One 9:e96780. doi: 10.1371/journal.pone.0096780
Yang, F. Q., Wang, Y. T., and Li, S. P. (2006). Simultaneous determination of 11 characteristic components in three species of curcuma rhizomes using pressurized liquid extraction and high-performance liquid chromatography. J. Chromatogr. A 1134, 226–231. doi: 10.1016/j.chroma.2006.09.048
Yu, X., Tan, W., Gao, H., Miao, L., and Tian, X. (2020). Development of a specific mini-barcode from plastome and its application for qualitative and quantitative identification of processed herbal products using DNA metabarcoding technique: a case study on senna. Front. Pharmacol. 11:585687. doi: 10.3389/fphar.2020.585687
Zhang, D., Gao, F., Jakovlić, I., Zou, H., Zhang, J., Li, W. X., et al. (2020). PhyloSuite: an integrated and scalable desktop platform for streamlined molecular sequence data management and evolutionary phylogenetics studies. Mol. Ecol. Resour. 20, 348–355. doi: 10.1111/1755-0998.13096
Keywords: radix Paeoniae Rubra, chloroplast genome, mini-barcode, metabarcoding, Chinese patent medicine
Citation: Yang X, Yu X, Zhang X, Guo H, Xing Z, Xu L, Wang J, Shen Y, Yu J, Lv P, Wang Y, Liu M and Tian X (2022) Development of Mini-Barcode Based on Chloroplast Genome and Its Application in Metabarcoding Molecular Identification of Chinese Medicinal Material Radix Paeoniae Rubra (Chishao). Front. Plant Sci. 13:819822. doi: 10.3389/fpls.2022.819822
Received: 22 November 2021; Accepted: 21 February 2022;
Published: 31 March 2022.
Edited by:
Gabriella Sonnante, National Research Council (CNR), ItalyReviewed by:
Litao Yang, Shanghai Jiao Tong University, ChinaCopyright © 2022 Yang, Yu, Zhang, Guo, Xing, Xu, Wang, Shen, Yu, Lv, Wang, Liu and Tian. This is an open-access article distributed under the terms of the Creative Commons Attribution License (CC BY). The use, distribution or reproduction in other forums is permitted, provided the original author(s) and the copyright owner(s) are credited and that the original publication in this journal is cited, in accordance with accepted academic practice. No use, distribution or reproduction is permitted which does not comply with these terms.
*Correspondence: Xiaoxuan Tian, dGlhbl94aWFveHVhbkB0anV0Y20uZWR1LmNu
Disclaimer: All claims expressed in this article are solely those of the authors and do not necessarily represent those of their affiliated organizations, or those of the publisher, the editors and the reviewers. Any product that may be evaluated in this article or claim that may be made by its manufacturer is not guaranteed or endorsed by the publisher.
Research integrity at Frontiers
Learn more about the work of our research integrity team to safeguard the quality of each article we publish.