
95% of researchers rate our articles as excellent or good
Learn more about the work of our research integrity team to safeguard the quality of each article we publish.
Find out more
ORIGINAL RESEARCH article
Front. Plant Sci. , 24 February 2022
Sec. Plant Breeding
Volume 13 - 2022 | https://doi.org/10.3389/fpls.2022.788593
This article is part of the Research Topic Genomics-enabled Triticeae Improvement View all 15 articles
 Zahid Mahmood1,2
 Mohsin Ali3
 Javed Iqbal Mirza4Muhammad Fayyaz4Khawar Majeed1
 Muhammad Kashif Naeem5
 Abdul Aziz1
 Richard Trethowan6
 Francis Chuks Ogbonnaya7Jesse Poland8
 Umar Masood Quraishi1
 Lee Thomas Hickey9
 Awais Rasheed1,3*
 Zhonghu He3*
Stripe rust caused by Puccnina striiformis (Pst) is an economically important disease attacking wheat all over the world. Identifying and deploying new genes for Pst resistance is an economical and long-term strategy for controlling Pst. A genome-wide association study (GWAS) using single nucleotide polymorphisms (SNPs) and functional haplotypes were used to identify loci associated with stripe rust resistance in synthetic-derived (SYN-DER) wheats in four environments. In total, 92 quantitative trait nucleotides (QTNs) distributed over 65 different loci were associated with resistance to Pst at seedling and adult plant stages. Nine additional loci were discovered by the linkage disequilibrium-based haplotype-GWAS approach. The durable rust-resistant gene Lr34/Yr18 provided resistance in all four environments, and against all the five Pst races used in this study. The analysis identified several SYN-DER accessions that carried major genes: either Yr24/Yr26 or Yr32. New loci were also identified on chr2B, chr5B, and chr7D, and 14 QTNs and three haplotypes identified on the D-genome possibly carry new alleles of the known genes contributed by the Ae. tauschii founders. We also evaluated eleven different models for genomic prediction of Pst resistance, and a prediction accuracy up to 0.85 was achieved for an adult plant resistance, however, genomic prediction for seedling resistance remained very low. A meta-analysis based on a large number of existing GWAS would enhance the identification of new genes and loci for stripe rust resistance in wheat. The genetic framework elucidated here for stripe rust resistance in SYN-DER identified the novel loci for resistance to Pst assembled in adapted genetic backgrounds.
Stripe or yellow rust caused by an obligate pathogen Puccinia striiformis tritici (Pst) is a major threat to wheat production and grain quality. Wheat yield losses in different regions of the world up to 25% have been reported and this can climb to 80% when infections occur early in the crop season (Solh et al., 2012). Recently, stripe rust epidemics have damaged wheat production in many wheat growing countries and regions including Australia, Ethiopia, China, United States, Europe, South Africa, and South Asia (Milus et al., 2006; Chen, 2007; Wellings, 2011). Since Airborne Pst urediniospores can migrate to other regions of the world using the climatic system termed the “Western Disturbance,” thus, spreading new races. The Western Disturbance caused the spread of the (Pst) Yr9 virulent race in the Indian Subcontinent and Nepal from the East African highlands between 1985 and 1997. In the past decade, virulence for Yr27 caused epidemics in Pakistan and India on the commonly growing mega cultivars, Inqlab-91, and PBW-343, respectively (Duveiller et al., 2007).
Rust resistance, like other fungal diseases, can be controlled by fungicide and resistant cultivars. However, the use of a fungicide is associated with a high cost and is hazardous to the environment. Therefore, deploying resistant cultivars is environmentally friendly and particularly inexpensive for wheat growers. To date, more than 83 Pst resistance genes (Yr1–Yr83) have been catalogued in wheat and its wild relatives (Maccaferri et al., 2015; McIntosh et al., 2016). These are predominantly race-specific major genes, which interact with the pathogen according to the gene-for-gene model and produce hypersensitive reactions. This type of resistance is usually short lived when deployed in large areas; the evolution of new pathotypes of the pathogen population leads to a resistance breakdown. Virulence on Yr2, Yr6, Yr7, Yr8, Yr9, Yr17, and Yr27 are examples of major gene resistance breakdown. It is essential that new sources of resistance are found and deployed to keep ahead of pathogen changes. However, minor genes or adult plant resistance (APR) genes are an alternative for major genes and provide a quantitative resistance that is often race non-specific and durable against various pathotypes.
Wheat breeders often rely on current or old varieties as a source of resistance, however, wheat wild relatives can also provide a useful source by direct recombination, bridge crosses, or including the development of synthetic wheats (Ogbonnaya et al., 2013). Within the wheat primary gene pool, considerable genetic variation exists in Aegilops tauschii and T. turgidum for resistance to both biotic and abiotic stresses (Halloran et al., 2008). The introgression of this genetic diversity through the development of synthetic hexaploid wheat (SHW) that can be directly crossed to adapted hexaploid wheat is one such strategy. Hexaploid wheat (SHWs) are known as primary synthetics and are generally obtained by artificially crossing of durum wheat (T. turgidum) and Ae. tauschii. These SHWs have been shown to carry genetic variation for resistance to numerous biotic and abiotic stresses (Mujeeb-Kazi et al., 1996; Ogbonnaya et al., 2013). The yellow, leaf, and stem rust resistance genes Yr28, Lr21, Lr22, Lr32, Lr39, Lr41, Sr33, Sr45, and Sr46 were derived from Ae. tauschii, and the Sr genes were subsequently shown to be resistant to the highly virulent Ug99 race (Cox et al., 1995; Zegeye et al., 2014; McIntosh et al., 2016).
Genome-wide association studies (GWAS) are used to associate the genetic loci with phenotypic diversity (Huang and Han, 2014). This method combines a comparatively large portion of natural diversity in a species and localizes marker-trait associations to much shorter genomic regions because these diversity panels incorporate many more historical recombination events than classical recombinant inbred lines and doubled haploid populations (Nordborg and Weigel, 2008). The GWAS has proven to be a powerful tool for genetic analysis in wheat. It has been successful in identifying the genomic regions and markers for resistance to stripe rust in synthetic hexaploid wheat (Zegeye et al., 2014; Bhatta et al., 2019), global landraces collections (Jordan et al., 2015), Ethiopian durum wheats (Liu et al., 2017c), advanced lines derived from exotic crosses (Ledesma-Ramírez et al., 2019), Chinese wheat landraces (Long et al., 2019), global spring wheat collection (Maccaferri et al., 2015), global winter wheat collection (Bulli et al., 2016), US Pacific Northwest winter wheat (Naruoka et al., 2015; Liu et al., 2018), spring wheat (Muleta et al., 2017a), CIMMYT nurseries (Juliana et al., 2017), Afghan wheat landraces (Manickavelu et al., 2016), Ethiopian bead wheat (Muleta et al., 2017b), emmer wheat (Liu et al., 2017b), North American elite spring wheat (Godoy et al., 2017), elite ICARDA wheats (Jighly et al., 2015), diverse spring wheat (Kankwatsa et al., 2017), global landraces collection (Pasam et al., 2017), and elite durum wheat (Liu et al., 2017a).
Genome-wide prediction also referred to as genomic selection or genomic prediction is a technique to improve the selection accuracy and has the potential to reduce the cost of phenotyping and breeding cycles (Meuwissen et al., 2001) can help increase the rate of genetic gain especially in the case of quantitative traits. In the first step, genomic estimated breeding values (GEBVs) are estimated using a training set and different prediction models, and best prediction models are then used to select new germplasm developed by hybridization prior to field evaluation. The application of genomic prediction depends on the population size, marker density, model performance, heritability of the trait, training population size, and breeding population relatedness (Daetwyler et al., 2008; Bassi et al., 2016). In wheat, genomic prediction studies have been reported to predict rust resistance in diverse wheat landraces (Daetwyler et al., 2014; Crossa et al., 2016), landraces from Afghanistan (Tehseen et al., 2021), tetraploid wheat (Azizinia et al., 2020), and improved wheat germplasm (Ornella et al., 2012; Rutkoski et al., 2014; Bassi et al., 2016; Juliana et al., 2017).
This study was designed for: (i) evaluating the diversity for stripe rust resistance in 193 SYN-DERs against prevailing Pst races in Pakistan; (ii) conducting a GWAS analysis in SYN-DERs for resistance loci to the prevailing Pst races and identifying the linked SNP markers that could be deployed in marker-assisted selection (MAS); (iii) comparing genomic prediction accuracies for stripe rust resistance at seedling and adult plant stages using different models with two genotyping platforms, and (iv) determining whether some derivatives carry un-characterized genes for Pst resistance.
A panel containing 193 SYN-DERs were evaluated in this study (Supplementary Table 1). The details of the germplasm have been described earlier (Afzal et al., 2019). Briefly, the SYN-DERs were developed by crossing elite cultivars and advanced lines of spring wheat with synthetic hexaploidy wheats in several combinations (refer to a pedigree for details of primary synthetic hexaploid wheat accessions numbers). The field experiments were conducted at the National Agricultural Research Centre (NARC), Islamabad (33° 0′N, 73° 4′E) and Cereal Crop Research Institute (CCRI), Nowshera (34° 1′N, 72° 2′E) Khyber Pakhtunkhwa, Pakistan, in the winter field seasons of 2015–2016 and 2016–2017.
Seedling screening against stripe rust was performed at the Crop Disease Research Institute (CDRI), Murree, Pakistan under controlled conditions. Small plastic pots (8 cm × 10 cm) were filled with standard potting mix (soil and nursery substrate, 3:1), and were used to grow 5–6 plants of each accession including the susceptible wheat check cv. Morocco. The plants were grown in a glasshouse maintained at 50% humidity and 20°C. Genotypes were assessed for infection type responses to five Pst races: Pst.571242, Pst.571262, Pst.140202, Pst.571243, and Pst.173262 coded as Wang et al. (2016) and maintained at CDRI, Murree laboratory. These stripe rust races are frequently found in the yellow rust prone areas of Pakistan. The virulence and avirulence formulas for the isolates are provided in Table 1. The Pst isolates maintained at −80°C were heat shocked in a water bath at 42°C for 5 min. The mixture of petroleum ether (Merck Cat # 1.01775.2500) and paraffin oil (Merck Cat # 1.07162.1000) in a ratio of 4:1 was used to suspend the rust spores for inoculation on 10-day-old seedlings, at the two-leaf growth stage. The inoculum was applied using a fine mist atomizer. After inoculation, the mineral oil was allowed to evaporate, and the seedlings were then placed in a tray and watered. The Pst inoculated plant trays were shifted to a dark dew chamber at 100% relative humidity, 10°C temperature, and a light regime of 16 h light and 8 h dark for 24 h. Plants were then moved to a clean glasshouse under controlled temperature conditions of 15–18°C and 50% relative humidity. The same light/dark regime was continued during the rust evaluation. Water was non-limiting and recommended doses of liquid fertilizer were applied. Seedlings were treated with a growth inhibitor (Maleic Hydrazide) to slow plant development thus ensuring even disease infection and development. Notes on rust infection types were taken using a 0–9 scale (McNeal et al., 1971) on the 20th day of inoculation when susceptible genotype Morocco exhibited maximum infection. Seedling infection types (ITs) were classified as resistant with 0–4 (R), moderately resistant with score 5–6 (MR), and moderately to highly susceptible with score 7–9 (MS).
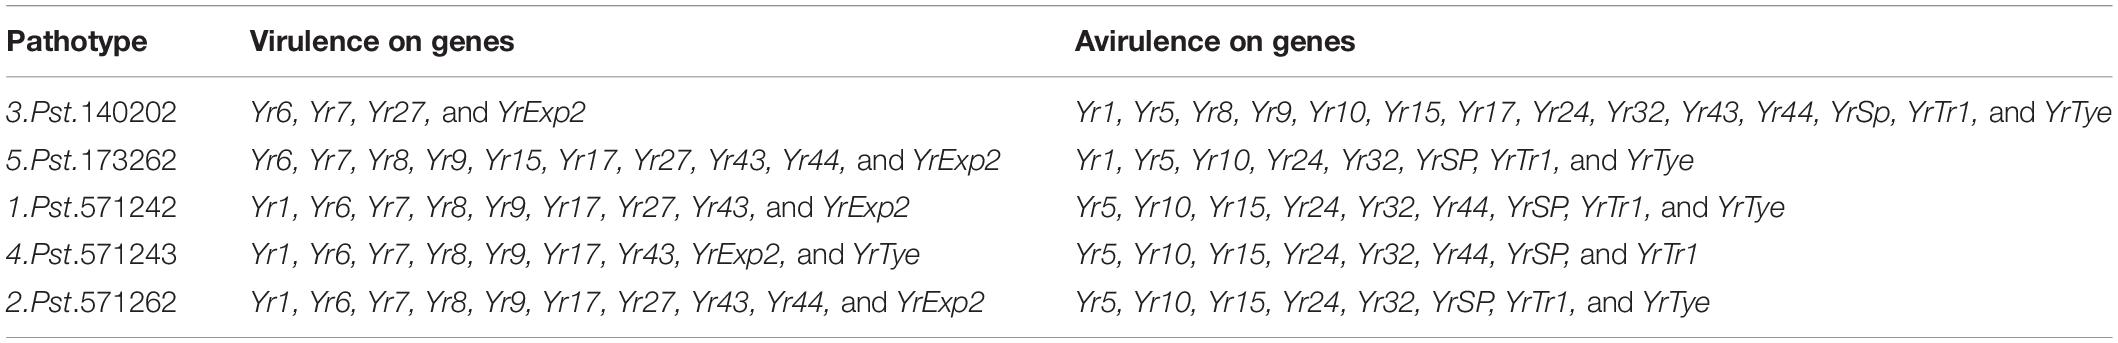
Table 1. Virulence profile of Pst races used in this study.
The diversity panel and a susceptible check (Morocco) were planted in 4 rows of 30 cm spacing and 2 m of length at NARC, Islamabad, and CCRI, Nowshera in 2015–2016 for screening for adult plant stripe rust resistance. The stripe rust susceptible cultivar Morocco was planted every 20th row to assist the spread of the rust epidemic. Inoculation was carried out using the Pst inoculum consisting of races used in this study. The inoculum was prepared by mixing rust spores mixture in liquefied petroleum ether (Merck Cat#1.01775.2500) and paraffin oil (Merck Cat # 1.07162.1000) in a ratio of 4:1 (V/V). The inoculum was sprayed with the help of a ULV sprayer on the rust spreader cultivar Morocco at the booting stage in both years at both field locations because this stage coincides with the favorable climatic conditions for rust spread. Rust infection and severity percentages were recorded when the genotype Morocco reached 70–80% severity. Rust scores were recorded three times each season at 1-week intervals to avoid disease escape. Wheat response to infection [infection types (IT)] was recorded using a 0–9 scale (Line and Qayoum, 1992). Yellow rust disease severity (DS) was noted as % infected leaf area of the host genotypes.
Analyses of variance of yellow rust infection types and disease severity from adult plant field evaluation were done across years and environments using a linear mixed model to test for additive variance between genotypes, environments, and the interactions between genotypes by environments. In the mixed linear model, genotypes, and environments were used as fixed and years as random factors. Broad-sense heritability (H2) was calculated using an ANOVA model to estimate variance components on a genotype mean basis.
where, is the genotypic variance, is the environment variance, σ 2gxe is the genotype by environment interaction variance, and error is the residual error variance, y is the number of years, and r is the number of replications within each experimental site. Pearson correlation coefficients (r) among experimental sites and cropping seasons were estimated to examine the consistency of infection types and disease severity across the environments. Statistical analyses of the present study were performed using R Statistical Software.
For genomic DNA extraction, five seeds of each SYN-DER accession were grown in 7 cm diameter disposable pots in a growth room. After 16–18 days of growth fresh leaf samples were taken to perform DNA extraction (Dreisigacker et al., 2013). Aliquant part of 50 μl DNA (50–100 ng/μl) for each sample was shipped in a 96-well plate arrangement for genotyping with high-density SNP markers, using the Wheat 90K SNP array (Wang et al., 2014), at the Department of Primary Industries, Victoria, Australia. The KASP marker for Lr34/Yr18 was used to identify the durable rust resistance gene in SYN-DERs (Rasheed et al., 2016).
The GWAS for stripe rust responses recorded in seedling and field experiments was performed by the multi-locus GWAS methods. The population structure was inferred from the principal component analysis (PCA), and PC scores from the first five principal components were used as a Q matrix. The kinship matrix (K) was calculated from the TASSEL version 5.0. Quantitative trait nucleotides (QTNs) were identified by meMLM (Wang et al., 2016) and FASTmrMLM (Tamba and Zhang, 2018) methods, which are included in the R-package mrMLM v 3.1.1 For each trait, P-values were extracted from the TASSEL results. Manhattan and quantile-quantile (QQ; observed P values plotted against expected P values) were plotted using R package qqman (Turner, 2014).
The SNP linkage disequilibrium blocks (SNPLDBs) were constructed to identify the multiple alleles to fit the property of multiple alleles per locus in the SYN-DERs. The SNPLDB was constructed using RTM-GWAS software v1.2, which is publicly available at https://github.com/njau-sri/rtm-gwas (He et al., 2017). The output vcf from RTM-GWAS was used as a marker dataset for association analysis in TASSEL version 5.0.
This study used 11 marker-based prediction models to assess predictability (i.e., the correlation between predicted and observed trait values) of unobserved phenotypes. All prediction models differed from each other with respect to assumptions regarding estimation of markers effects. Among the parametric models included, an MLM-based prediction model, a genomic best linear unbiased prediction (GBLUP), was computed using the “BGLR” function of R package Bayesian generalized linear regression (BGLR) version 1.0.8 (Pérez and De, 2014). The GBLUP prediction model utilizes a realized genomic relation matrix (G) to model correlation among individuals (Vanraden, 2008; Habier et al., 2013). In addition, the Bayesian linear prediction models, i.e., Bayesian Ridge Regression (BRR), Bayesian least absolute shrinkage, and selection operator (BL), BayesA, BayesB, BayesC, and reproducing kernel Hilbert spaces regression (RKHS) were also used in prediction analysis. These Bayesian prediction models were also used with the function “BGLR” in the R package “BGLR.” For the ridge regression BLUP (rrBLUP) model, we used the “mixed.solve” function from rrBLUP R package version 4.6 (Endelman, 2011). To implement the elastic net (EN), we used the “glmnet” function implemented in the glmnet R package version 2.0–18 (Friedman et al., 2010). To compute EN, the value of alpha.5 was used. The EN model is a combination of ridge regression and LASSO. In addition, non-parametric models, i.e., relevance vector machines (RVM) and Gaussian Processes (GP), were used to build a GS prediction model. The “rmv” and “gausspr” functions from kernlab R package version 0.9–27 (Karatzoglou et al., 2007) were used for RVM and GP modeling. To verify the predictability of the 11 models in the SYN-DER population, we evaluated the prediction accuracy by 10-fold cross-validation using a training set randomly apportioned into each fold. The data were partitioned into training population (90%) and validation population (10%) sets.
The response of the 193 SYN-DERs and check cultivars to Pst was assessed in four environments (two locations × 2 years) under high disease pressure. ANOVA showed highly significant (P < 0.001 and P < 0.01) differences among genotypes both for specific locations (Islamabad and Nowshera) and across locations (combined data) (Table 2). The variance components for environments were significant (P < 0.01 and P < 0.05). Similarly, genotypes by environment interactions for IT were significant (P < 0.05) at Nowshera and across locations buts non-significant for ISB.
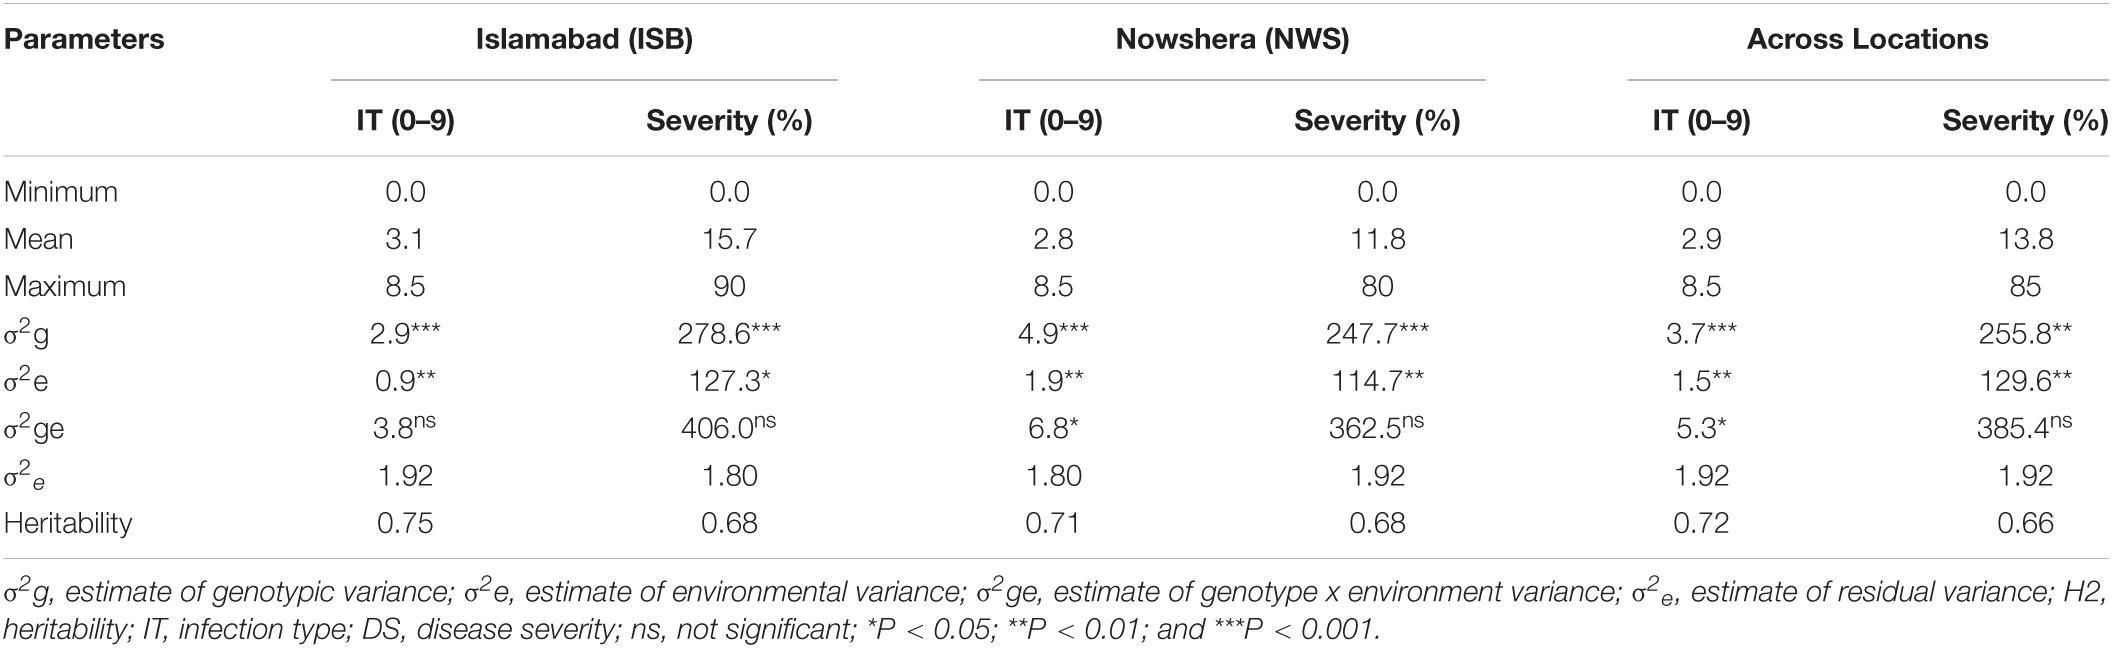
Table 2. Mean response to Puccinia striiformis f. sp. tritici infection, estimates of variance components, and heritability.
The frequency distribution of ITs displayed by the SYN_DERs in response to the five Pst races is presented in Figures 1A,B. Of the lines tested, 78% (152), 63% (122), 79% (153), 38% (75), and 80% (156) of accessions showed seedling resistance to Pst.571242, Pst.571262, Pst.140202, Pst.571243, and Pst.173262, respectively. Notably, 18 (9%) of the genotypes showed seedling resistant infection types to all five Pst races.
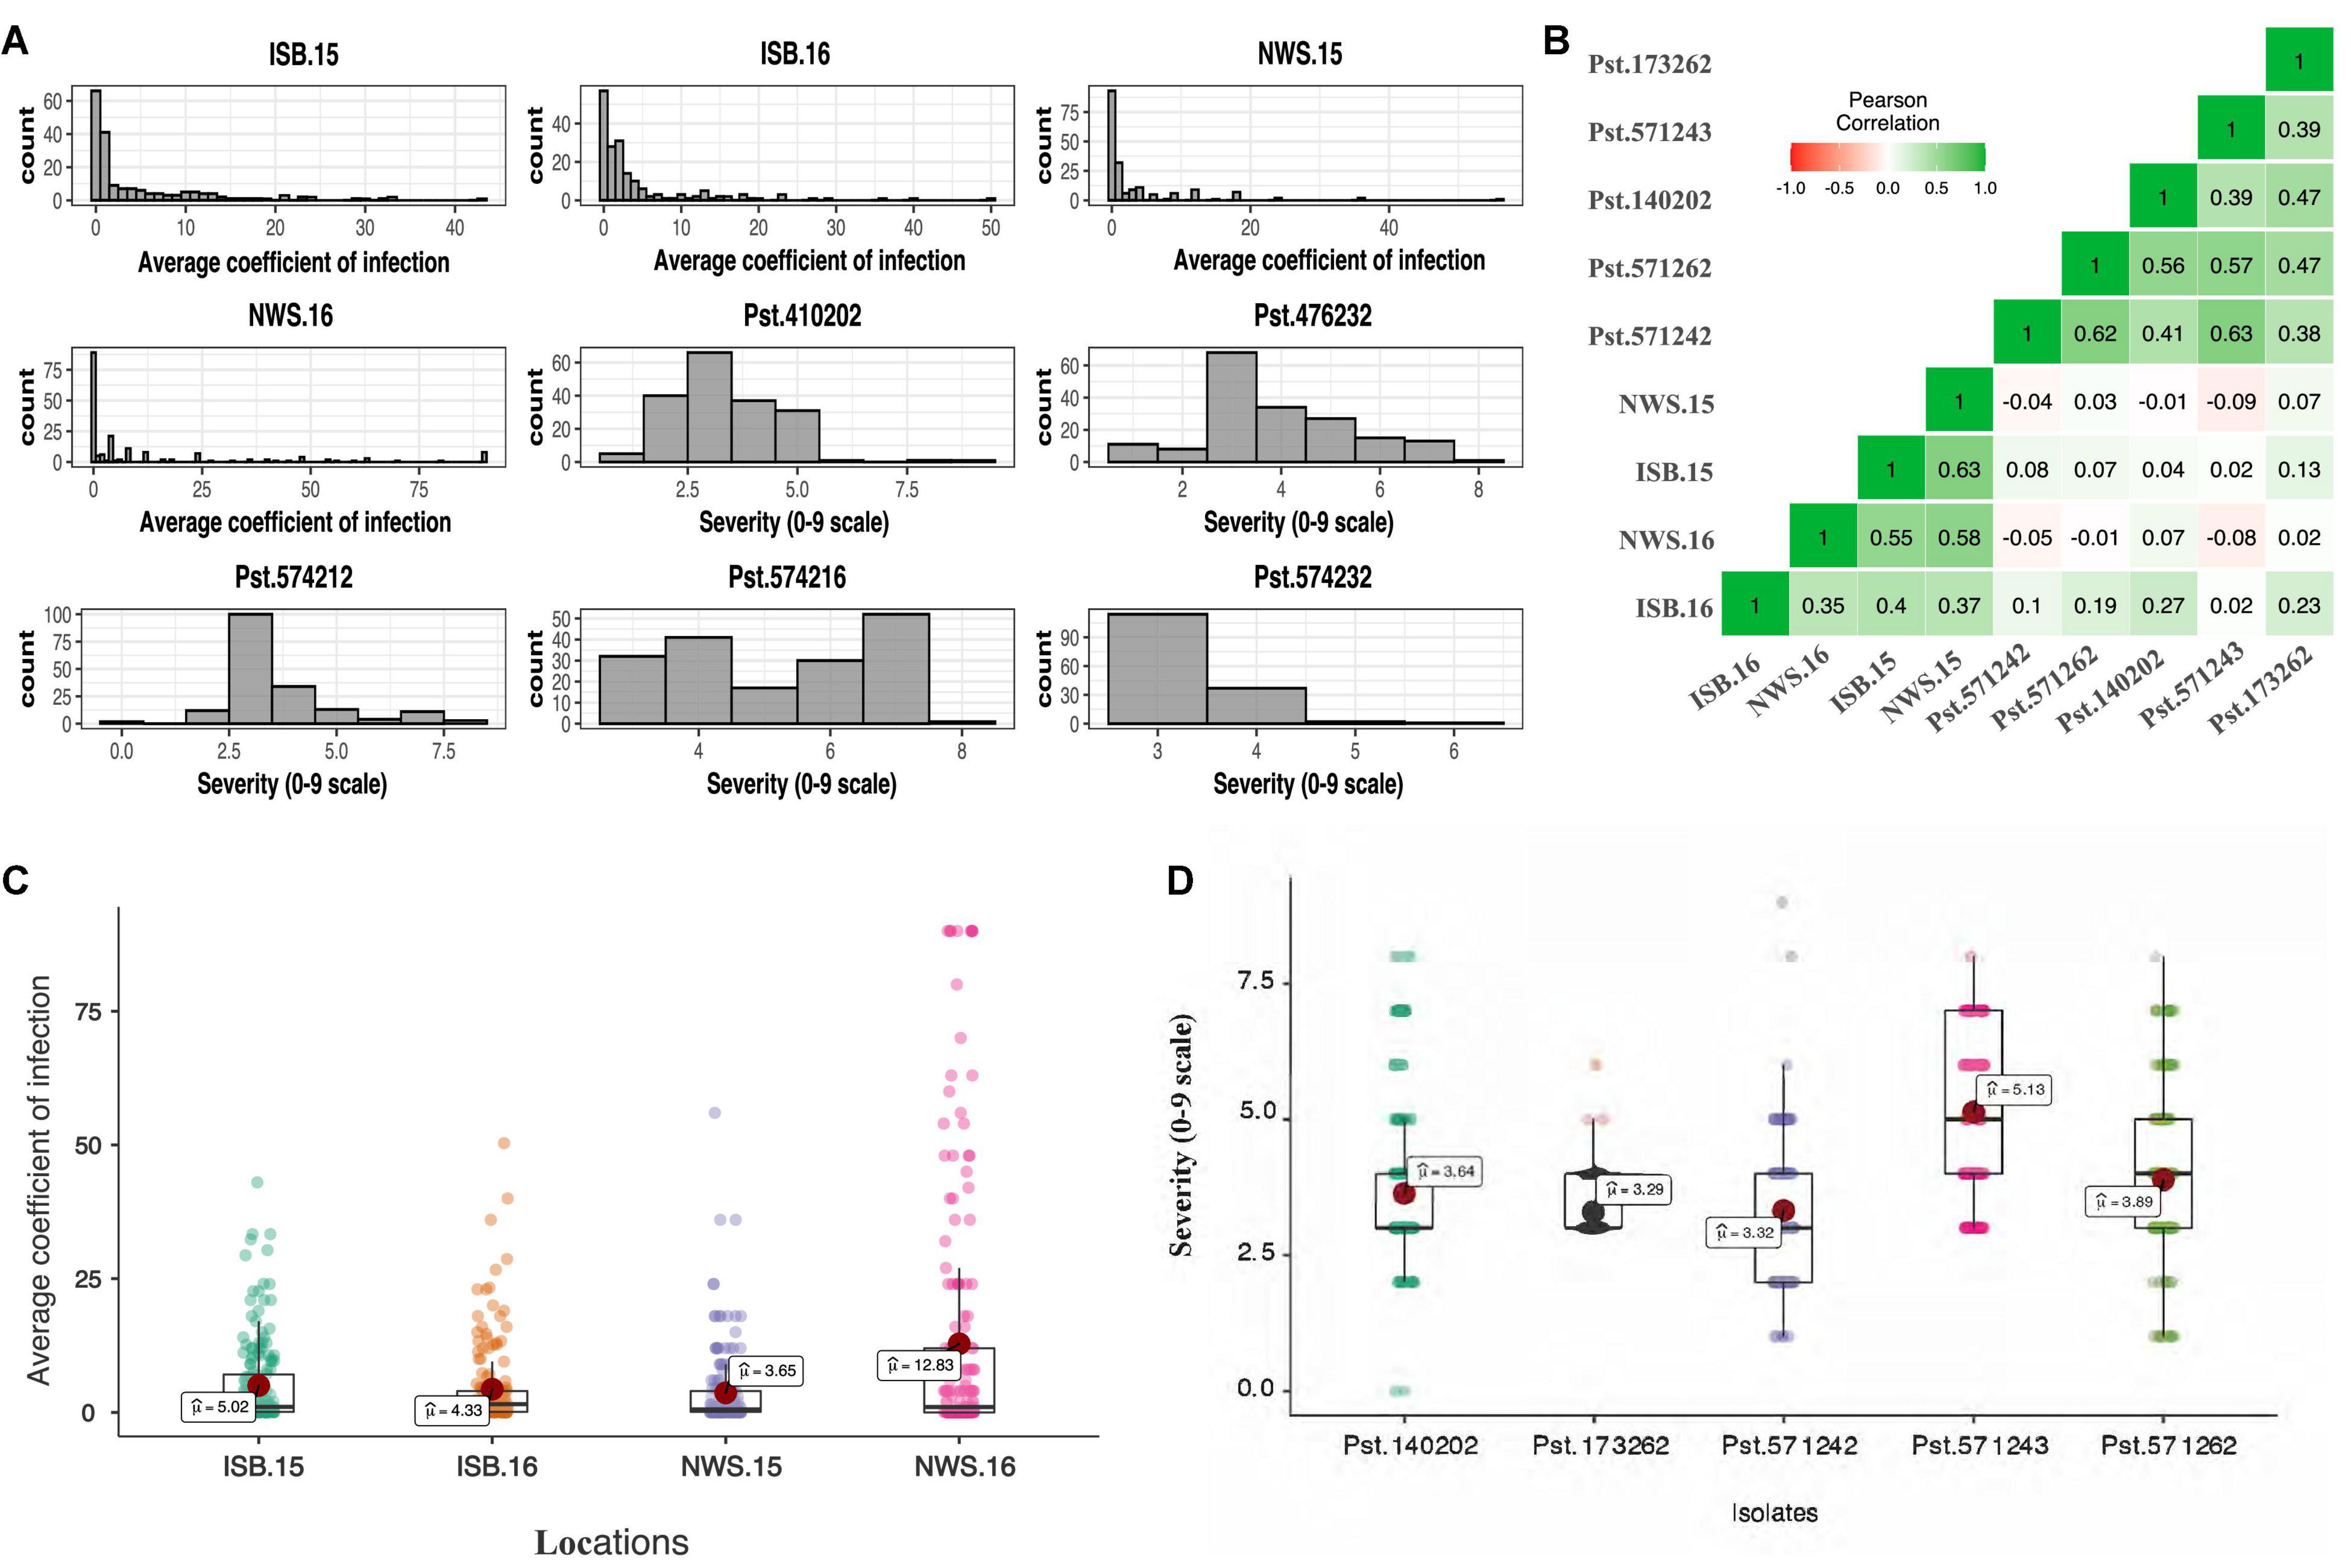
Figure 1. Histogram showing frequency distribution for the average coefficient of infection (ACI) at four locations, viz. Islamabad-2015 (ISB.15), Islamabad-2016 (ISB.16), Nowshera-2015 (NWS.15), and Nowshera-2016 (NWS.16), and disease severity (0–9 scale) against five Pst isolates (A), boxplots for ACI at four locations (B), and disease severity against five Pst isolates (C), and coefficient of correlation across isolates and locations (D).
The population showed a wide range of ITs across the environments. At Nowshera, 12% of accessions (24 genotypes) were highly resistant, 21% (41 genotypes) were showed resistant reactions, and 3 genotypes (1.5%) were highly susceptible. At ISB, 3% (6 genotypes) were highly resistant, 12% (24 genotypes) were resistant, and 1% (2 accessions) showed highly susceptible reactions (Figure 1). Eighteen (9%) of accessions were resistant in both cropping seasons at both experimental locations. Broad sense heritability (H2) for IT and disease severity ranged from 0.66 to 0.75% (Table 2).
Pearson correlation coefficients between stripe rust IT and disease severity between Islamabad and Nowshera in both years are presented in Figure 1E. Correlations were 0.51 and 0.59 for ITs, and 0.38 and 0.61 for disease severity at Islamabad and Nowshera, respectively. The correlations between Islamabad and Nowshera for ITs in 2015 and 2016 were 0.65 and 0.40, respectively. The respective disease severity correlations were 0.63 and 0.30. All five Pst races evaluated for ITs were significantly and positively correlated to each other and values ranged from 0.34 to 0.61 (Figure 1D). Seedling infection types and disease severity of Pst.140202 and Pst.173262 were positively and were significantly correlated with adult plant ITs and disease severity in Islamabad in 2016.
Two genotyping platforms, 90K SNP array and GBS, were used for GWAS. For the 90K SNP array, 29,632 SNP markers were retained after removing SNPs with missing data of >10% and minor allele frequency of <0.05. Figure 2A shows SNP marker density on each wheat chromosome. For GBS, out of 236,327 SNPs identified, 47,122 were finally used after removing SNPs with >10% missing data, and <5% minor allele frequency (Figure 2B).
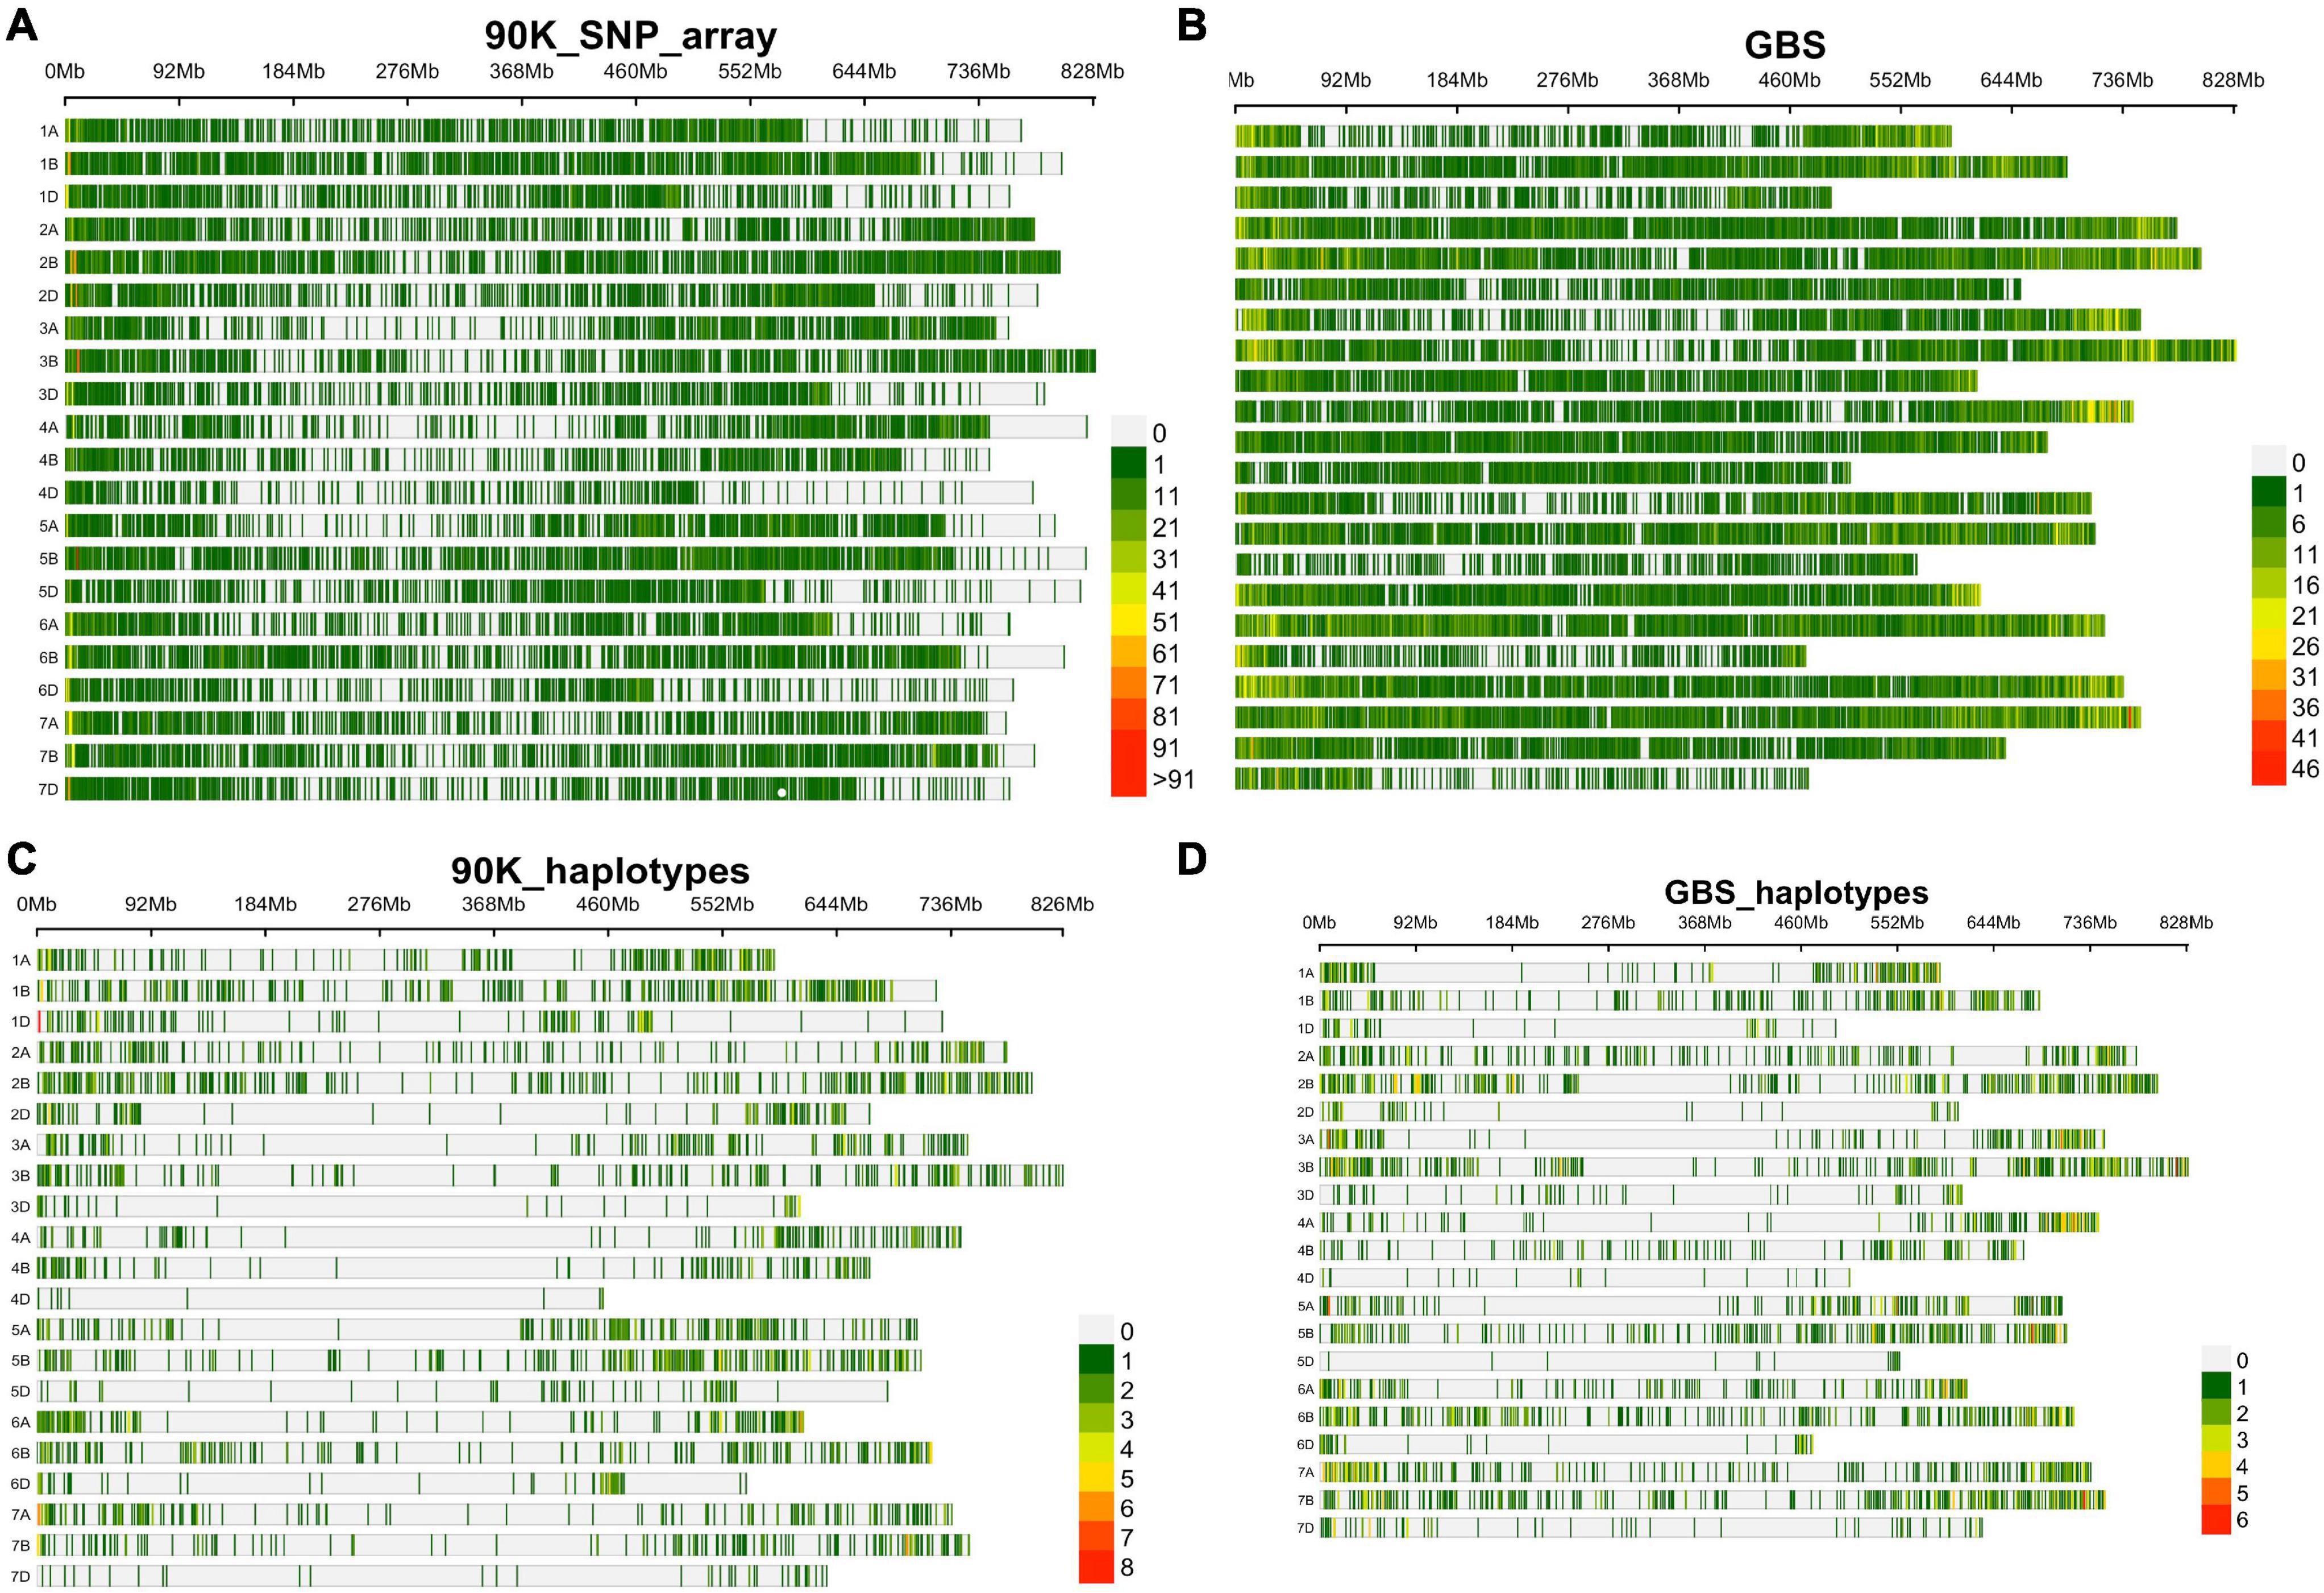
Figure 2. SNP density and distribution in all 21 wheat chromosomes using 90K SNP array and GBS characterized in SYN-DERs, (A) in 90K SNP array, (B) in GBS, (C) haplotype density using 90K SNP array, and (D) haplotype density using GBS platform.
Haplotype blocks were constructed using both genotyping platforms using the block partitioning approach with CIs based on genome-wide LD (D/) patterns (Gabriel et al., 2002), and implemented in RTM-GWAS (He et al., 2017). Table 3 describes the number of haplotype blocks, the range and average size of blocks in terms of kb, and the range and average number of SNPs comprising each haplotype block on each chromosome. In the 90K SNP array, 19,070 LD blocks were constructed (Figure 2C), out of which 3,325 blocks contained more than two haplotype (alleles) (Table 3). The maximum number of haplotypes (n = 304) were constructed on chr2B, while the minimum was on chr4D (n = 10). On an average, the haplotype block size ranged from 5.5 Mb (chr7D) to 11.5 Mb (chr3D). The number of SNPs in each haplotype block was minimum 2 and maximum 14. In GBS, the number of blocks ranged from 16 (chr5D) to 364 (chr7B) (Figure 2D). The haplotype block size ranged from 2 to 19.6 Mb (chr3B), while SNPs/block ranged from 2 to 11 (chr3B and chr6A).
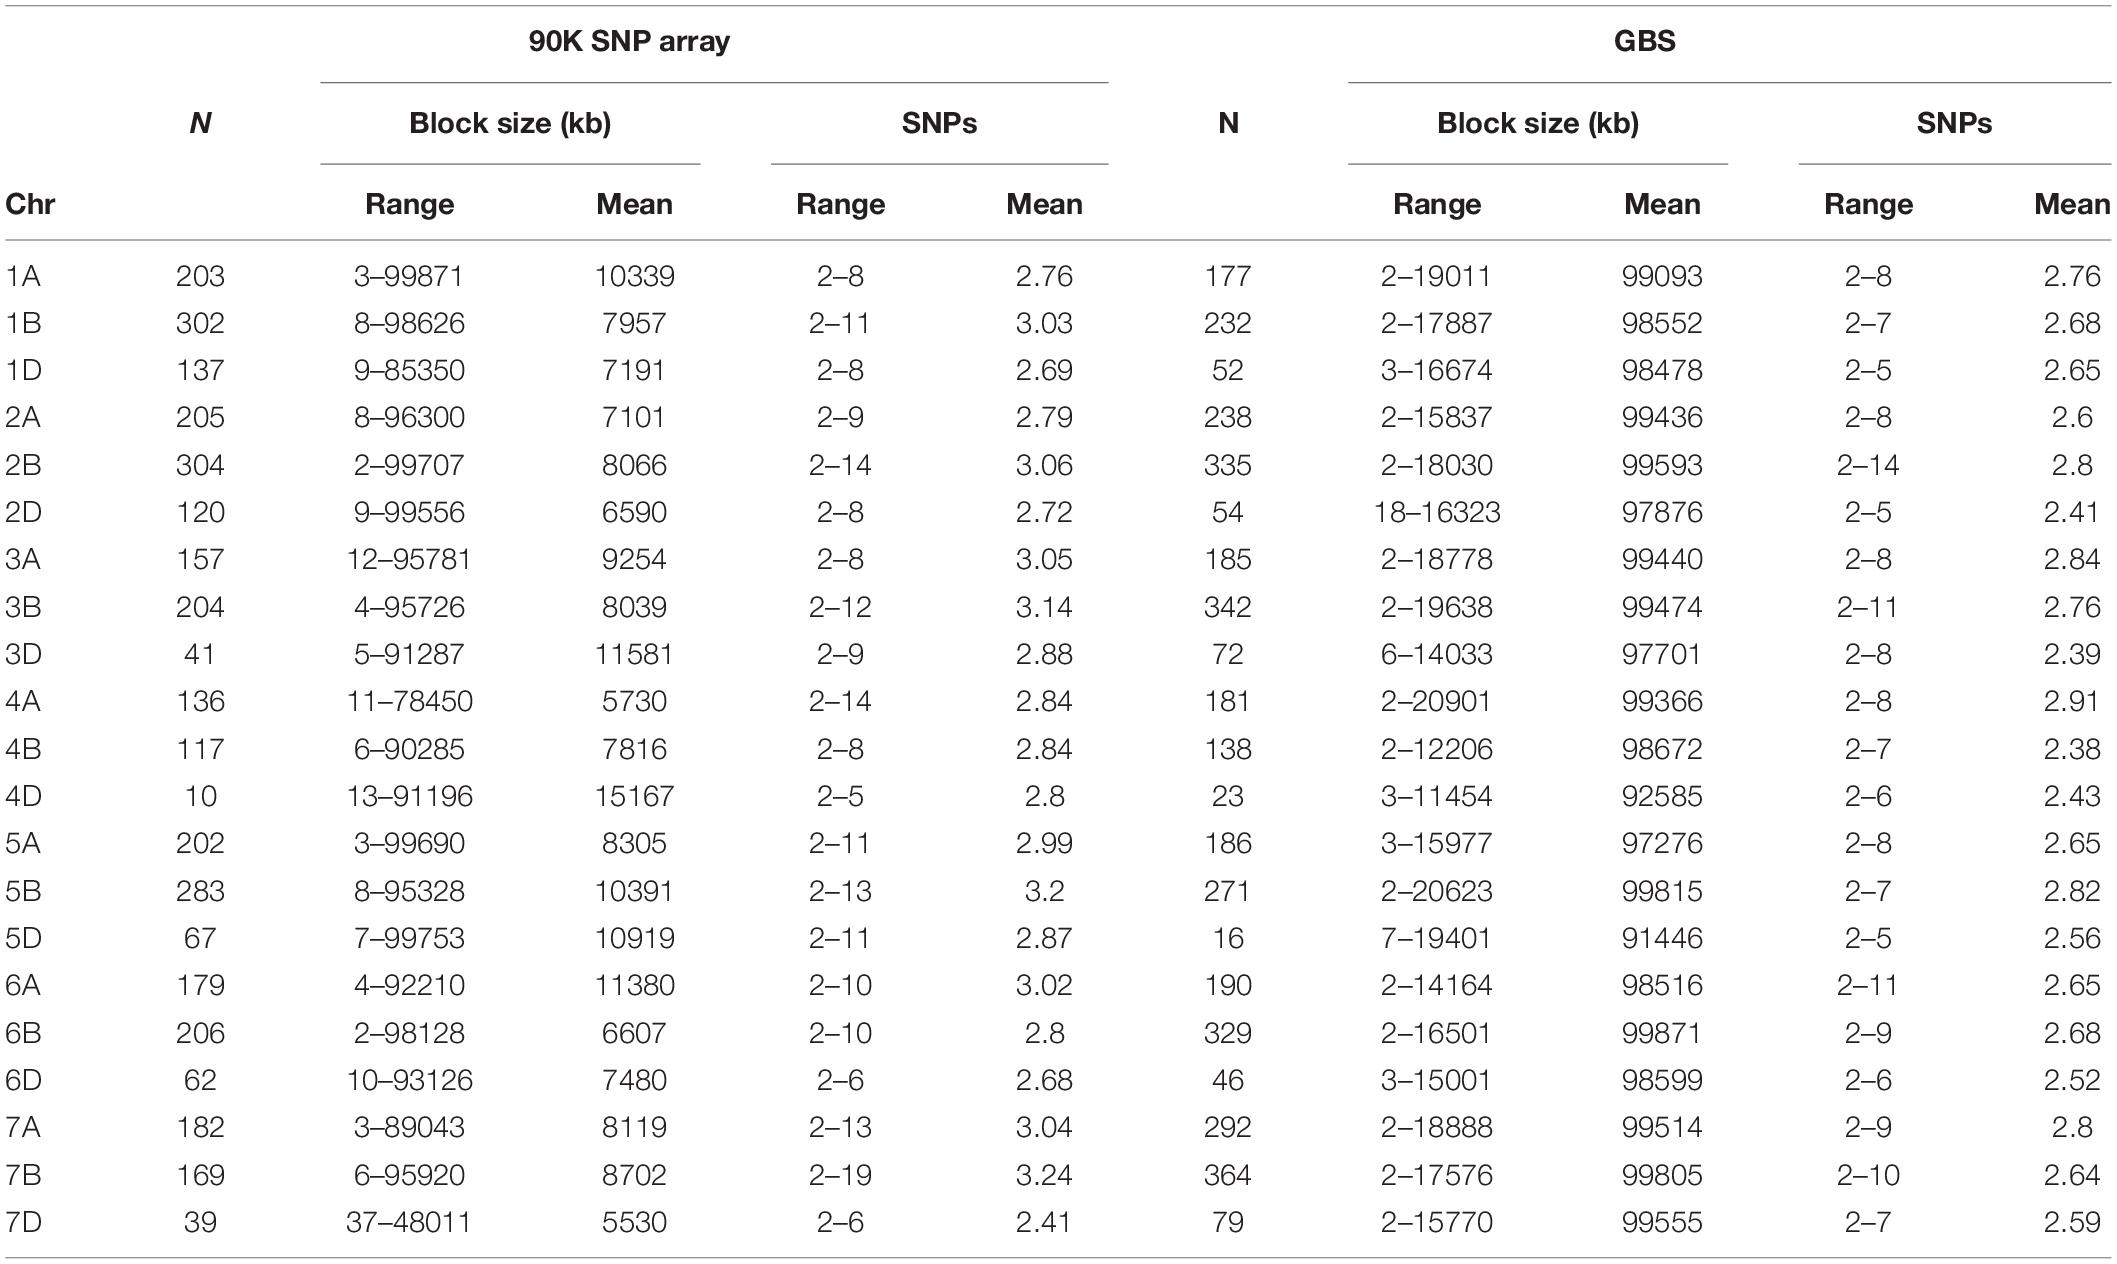
Table 3. Haplotype blocks on wheat chromosomes, their number, block size, and number of SNPs per block using 90K SNP array and genotyping-by-sequencing (GBS) platform.
In total, 23 QTNs were identified for seedling resistance against five races in the SYN-DERs populations (Table 4). Eight QTNs were associated with seedling resistance against Pst.571242, of these the QTN on chr5B at 580.6 Mb was identified by both 90K SNP array and GBS and accounted for 10.5% of the total phenotypic variation. Only two QTNs were identified for resistance against Pst.571262 on chr3D and 7A, and explained 8.5 and 6.9% of the total variation, respectively. Five QTNs were detected against Pst.140202: these explained 2.3 to 10.9% of the total variation and were distributed on chr2D, chr3A, chr3B, chr3D, and chr5B. Seven QTNs were identified for resistance against Pst.571243 and accounted for 7.9 to 15.3% of the total variation. Only one QTN was identified for resistance against Pst.173262 on chr7A and explained 7.6% of the total variation.
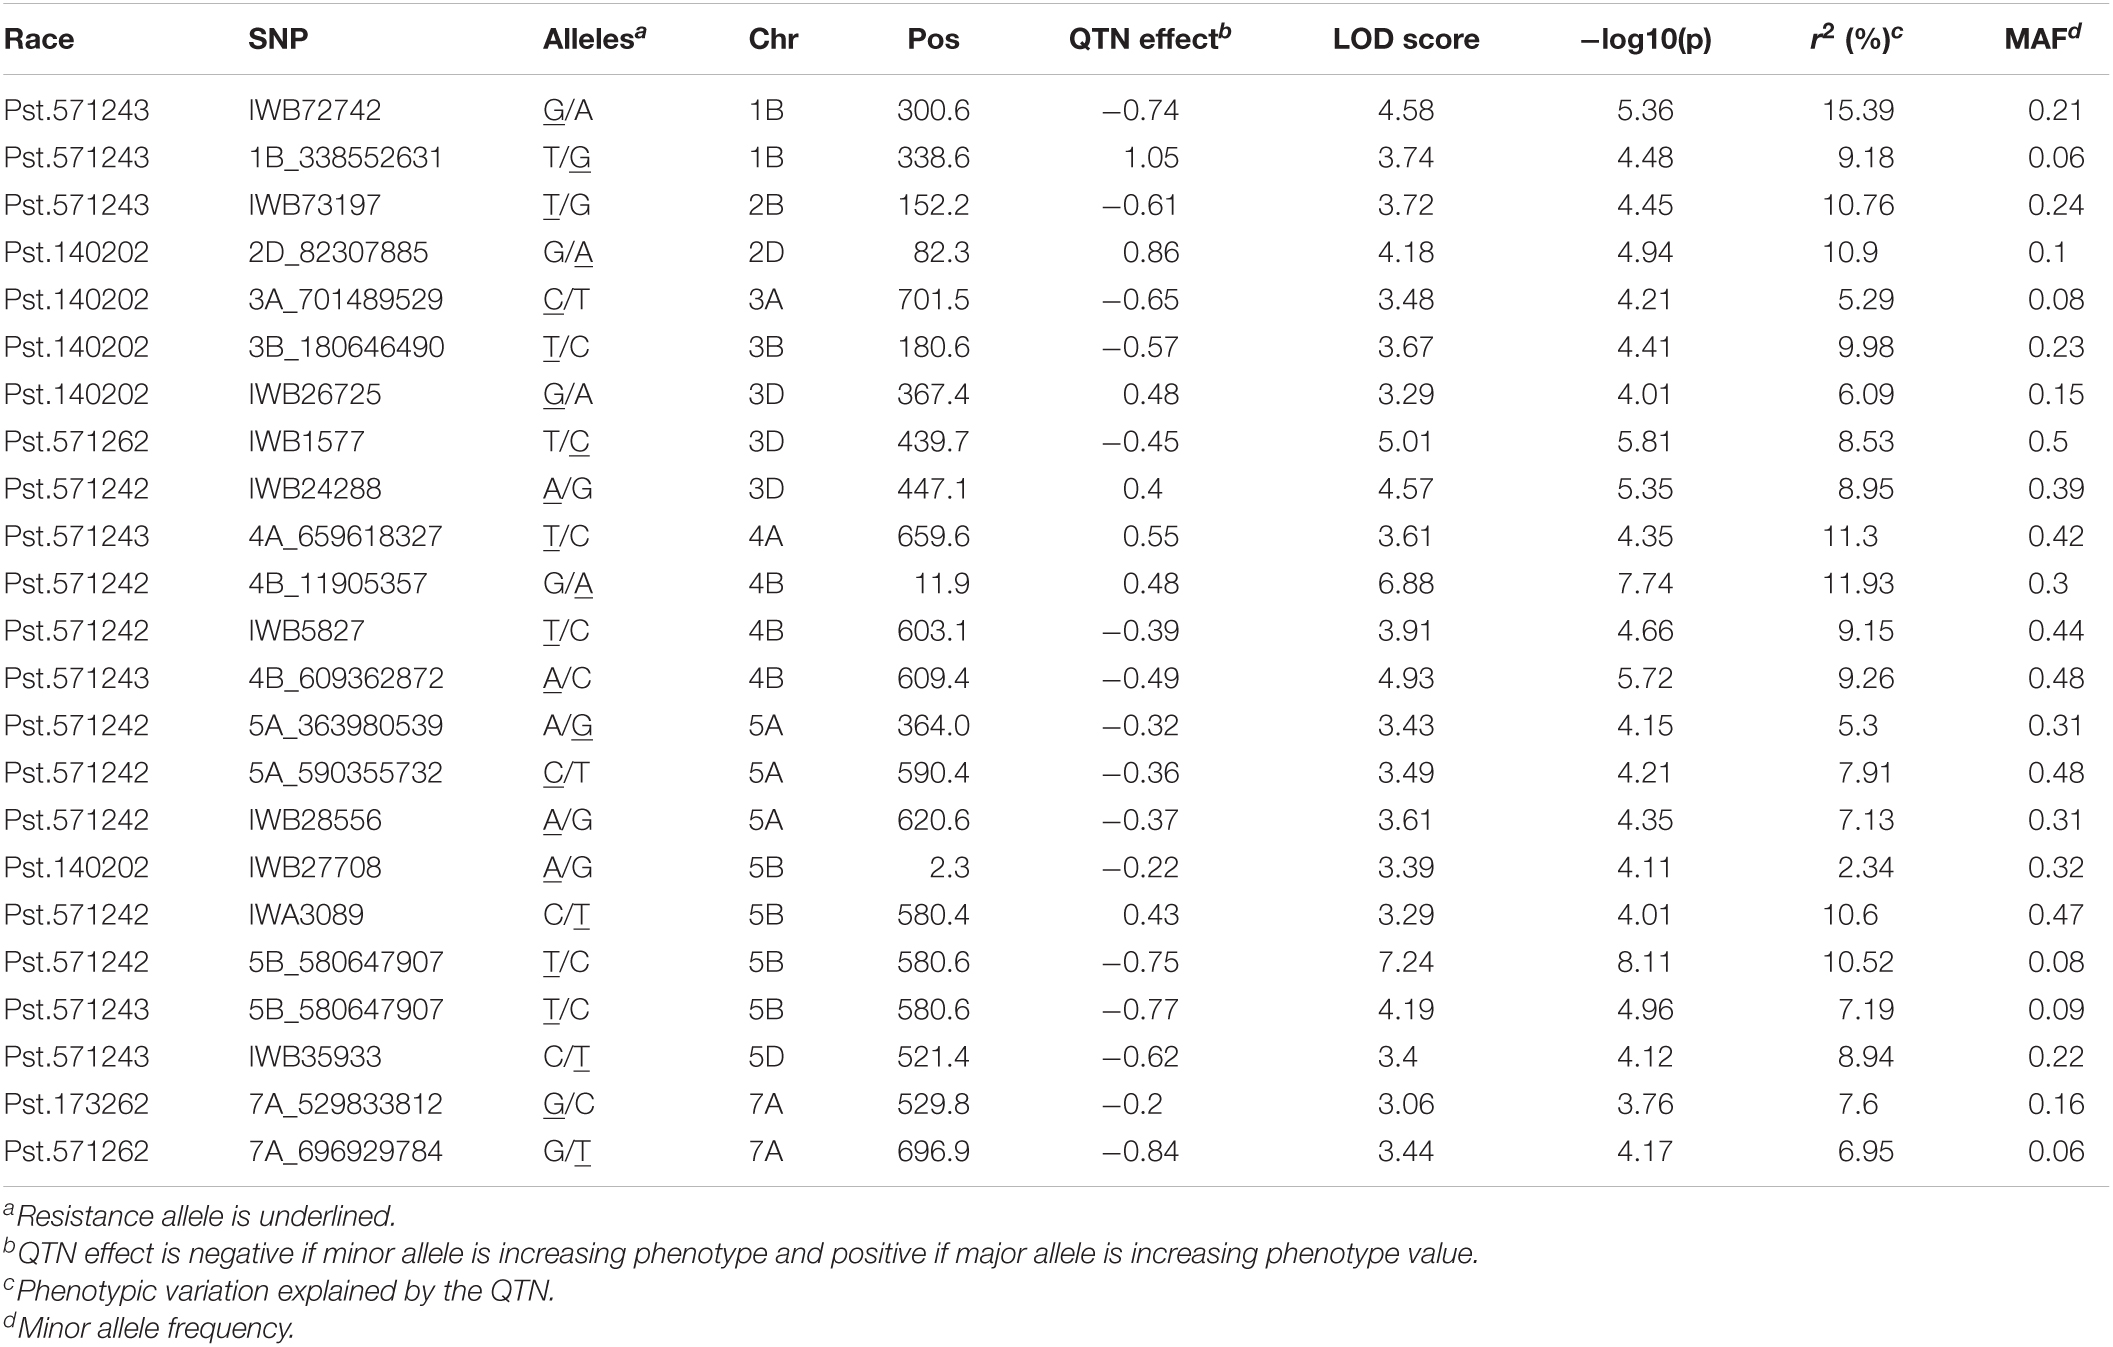
Table 4. Quantitative trait nucleotides (QTNs) associated with resistance to Pst races at seedling stage in SYN-DER panel using 90K and GBS markers.
In total 68 QTNs were identified for adult plant resistance against Pst in SYN-DERs (Table 5). Fourteen QTNs were identified for ISB.15, 19 for ISB.16, 18 for NWS.15, and 17 for NWS.2016. These QTNs were detected on all chromosomes except chr1D, chr2D, and chr4B. Figure 3 shows Manhattan plots for significant SNPs associated with resistance to Pst at NWS.16 using a 90K SNP array (Figure 3A) and GBS (Figure 3B). The allelic effects of associated SNPs are shown as box plots (Figures 3C–F). The phenotypic variation explained by the QTNs ranged from 3.2% (96.1 Mb at chr7D) to 29.3% (55.5 Mb at chr3B). Some QTNs were identified by both genotyping platforms, i.e., at 55.5 Mb on chr3B for resistance to Pst at ISB.15, and 560.4 Mb at chr1A for NWS.15. A QTN at 53.4–58.1 Mb on chr1A associated with NWS.15 and NWS.16, and another on chr7A at 675–676 Mb associated with NWS.15 and 16 (Figures 4A,B). Similarly, QTN on chr7B at 711–727 Mb was associated with resistance to Pst at NWS.16 and ISB.16 (Figure 4C). Some QTNs were associated with resistance to Pst at multiple environments including QTN at 3.1–3.9 Mb on chr1A associated with ISB.15, ISB.16, and NWS.15 (Figures 4C,D). Interestingly some QTNs were associated with both seedling and adult plant resistance, i.e., the QTN on chr1B at 300–327 Mb was associated with Pst.571243 at ISB.16 (Figure 5A), and the QTN at 152–163 Mb on chr2B associated with Pst.571243 at NWS.16. Similarly, a QTN at 355–367 Mb on chr3D was associated with Pst.140202 at NWS.15 (Figure 5B). The QTNs of chr4A, chr2D, and chr4B were associated with Pst.571243, Pst.140202, and Pst.571242, respectively (Figures 5C–E). A QTN on chr7A at 675–696 Mb identified in NWS.15 and 16 was also associated with Pst.571262 (Figure 5F). The allelic effects were also determined for the durable rust resistance gene Yr18, and the resistance allele was significantly associated with resistance to Pst in all four environments, i.e., ISB.16 (Figure 6A), NWS.16 (Figure 6B), ISB.15 (Figure 6C), and NWS.15 (Figure 6D).
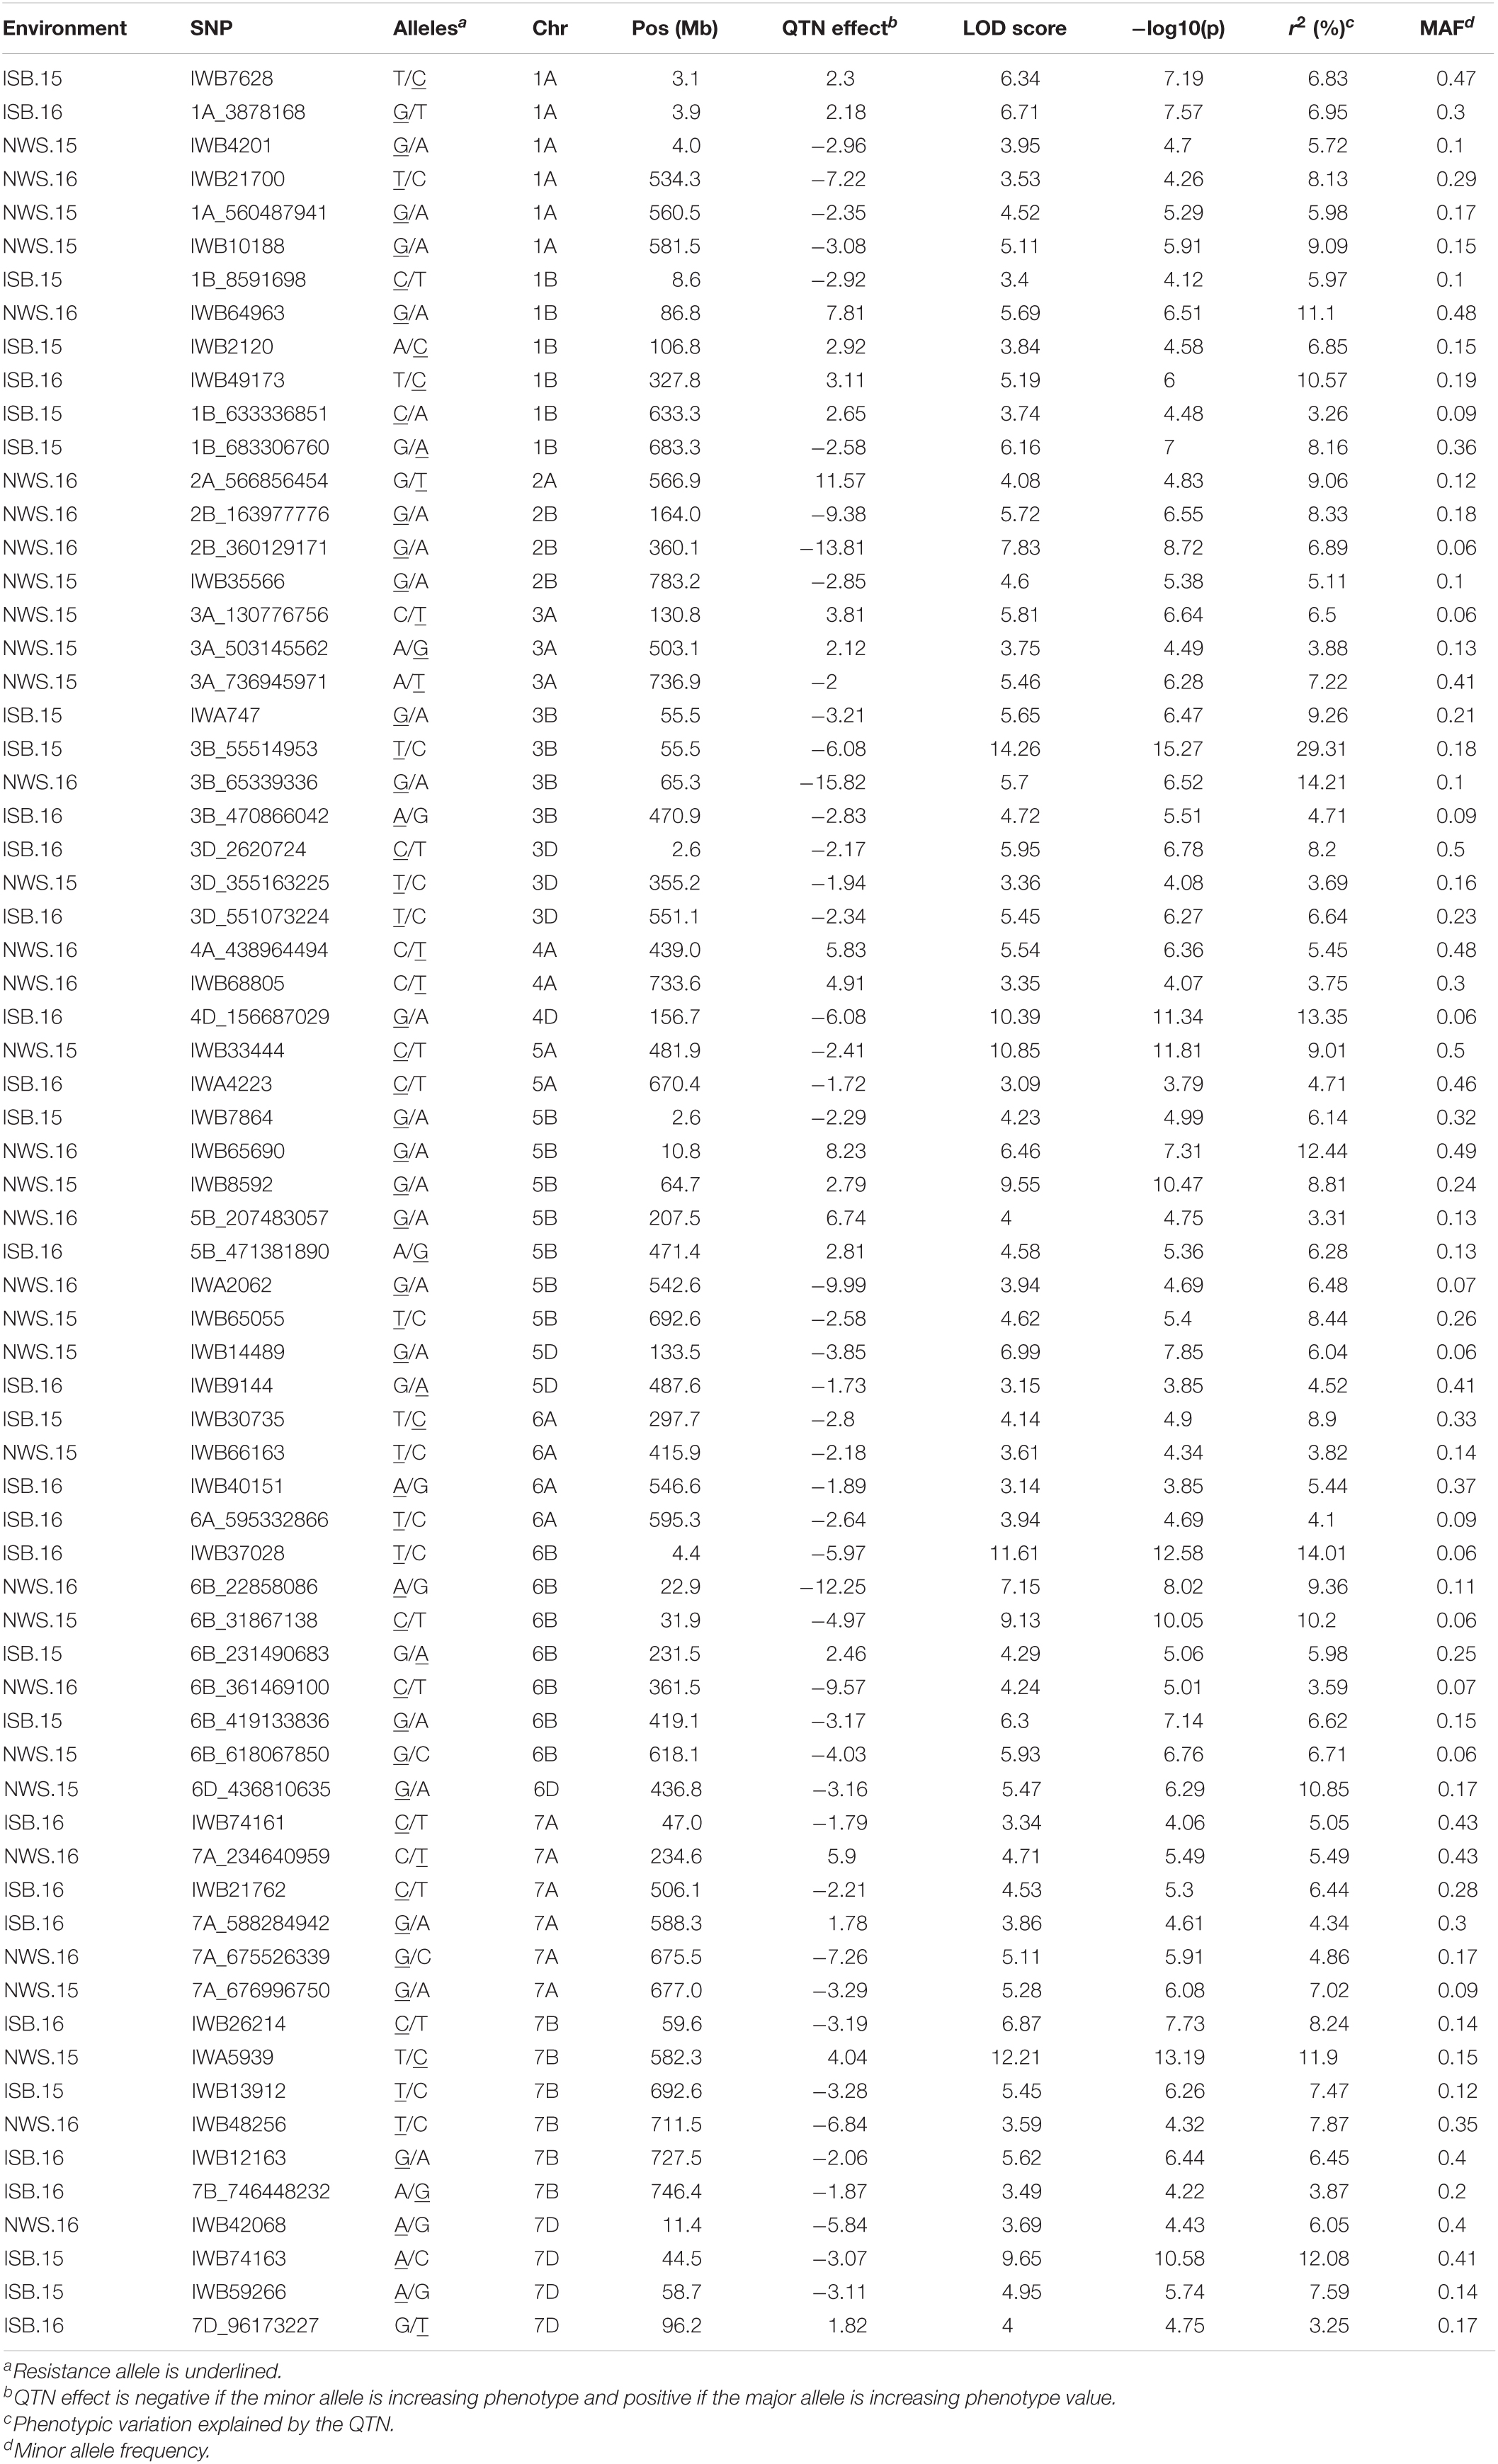
Table 5. Quantitative trait nucleotides (QTNs) associated with resistance to Pst at adult plant stages in four environments in SYN-DER panel using 90K and GBS markers.
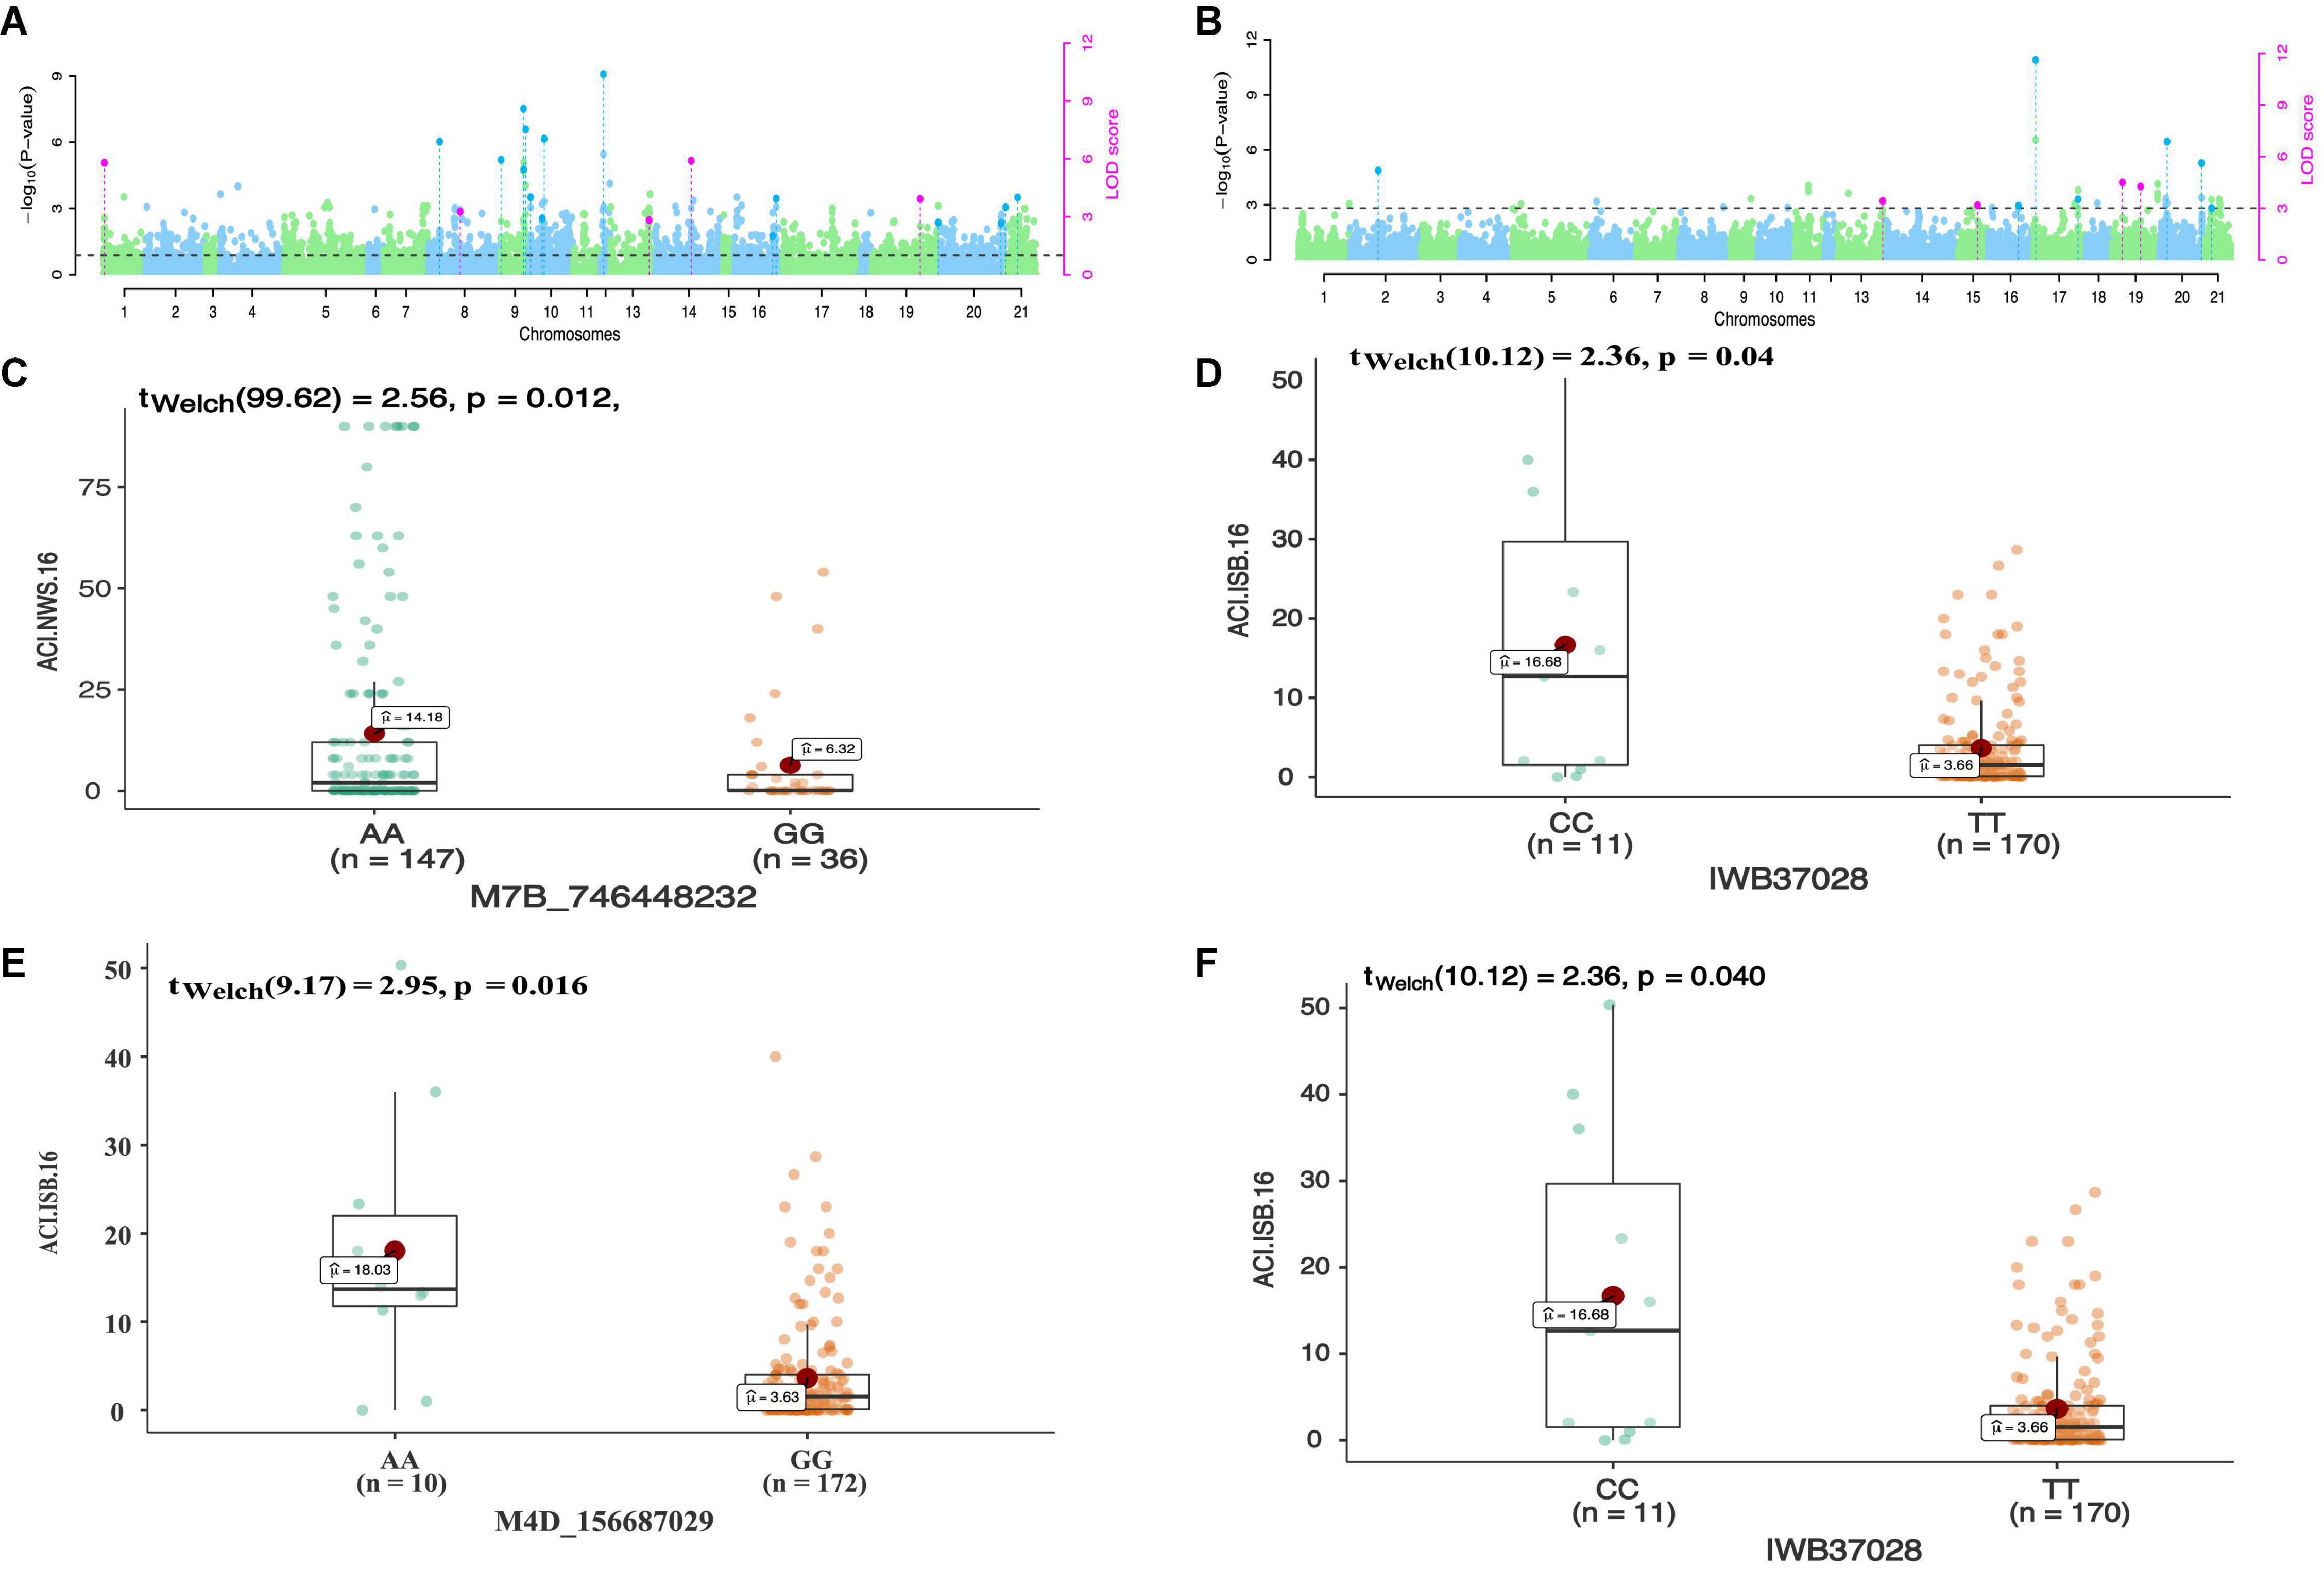
Figure 3. Manhattan plots showing distribution of p-value on –log(10) scale for SNPs associated with an average coefficient of infection (ACI) at Nowshera-2016 (NWS.16) using 90K SNP array (A) and GBS markers (B). The allelic effects of SNPs on chr7B (C), chr6B (D), chr4D (E), and chr6B (F) are shown as boxplots. Each boxplot shows the distribution of the average coefficient of infection (ACI) in a relevant environment for both allelic states of the SNP marker.
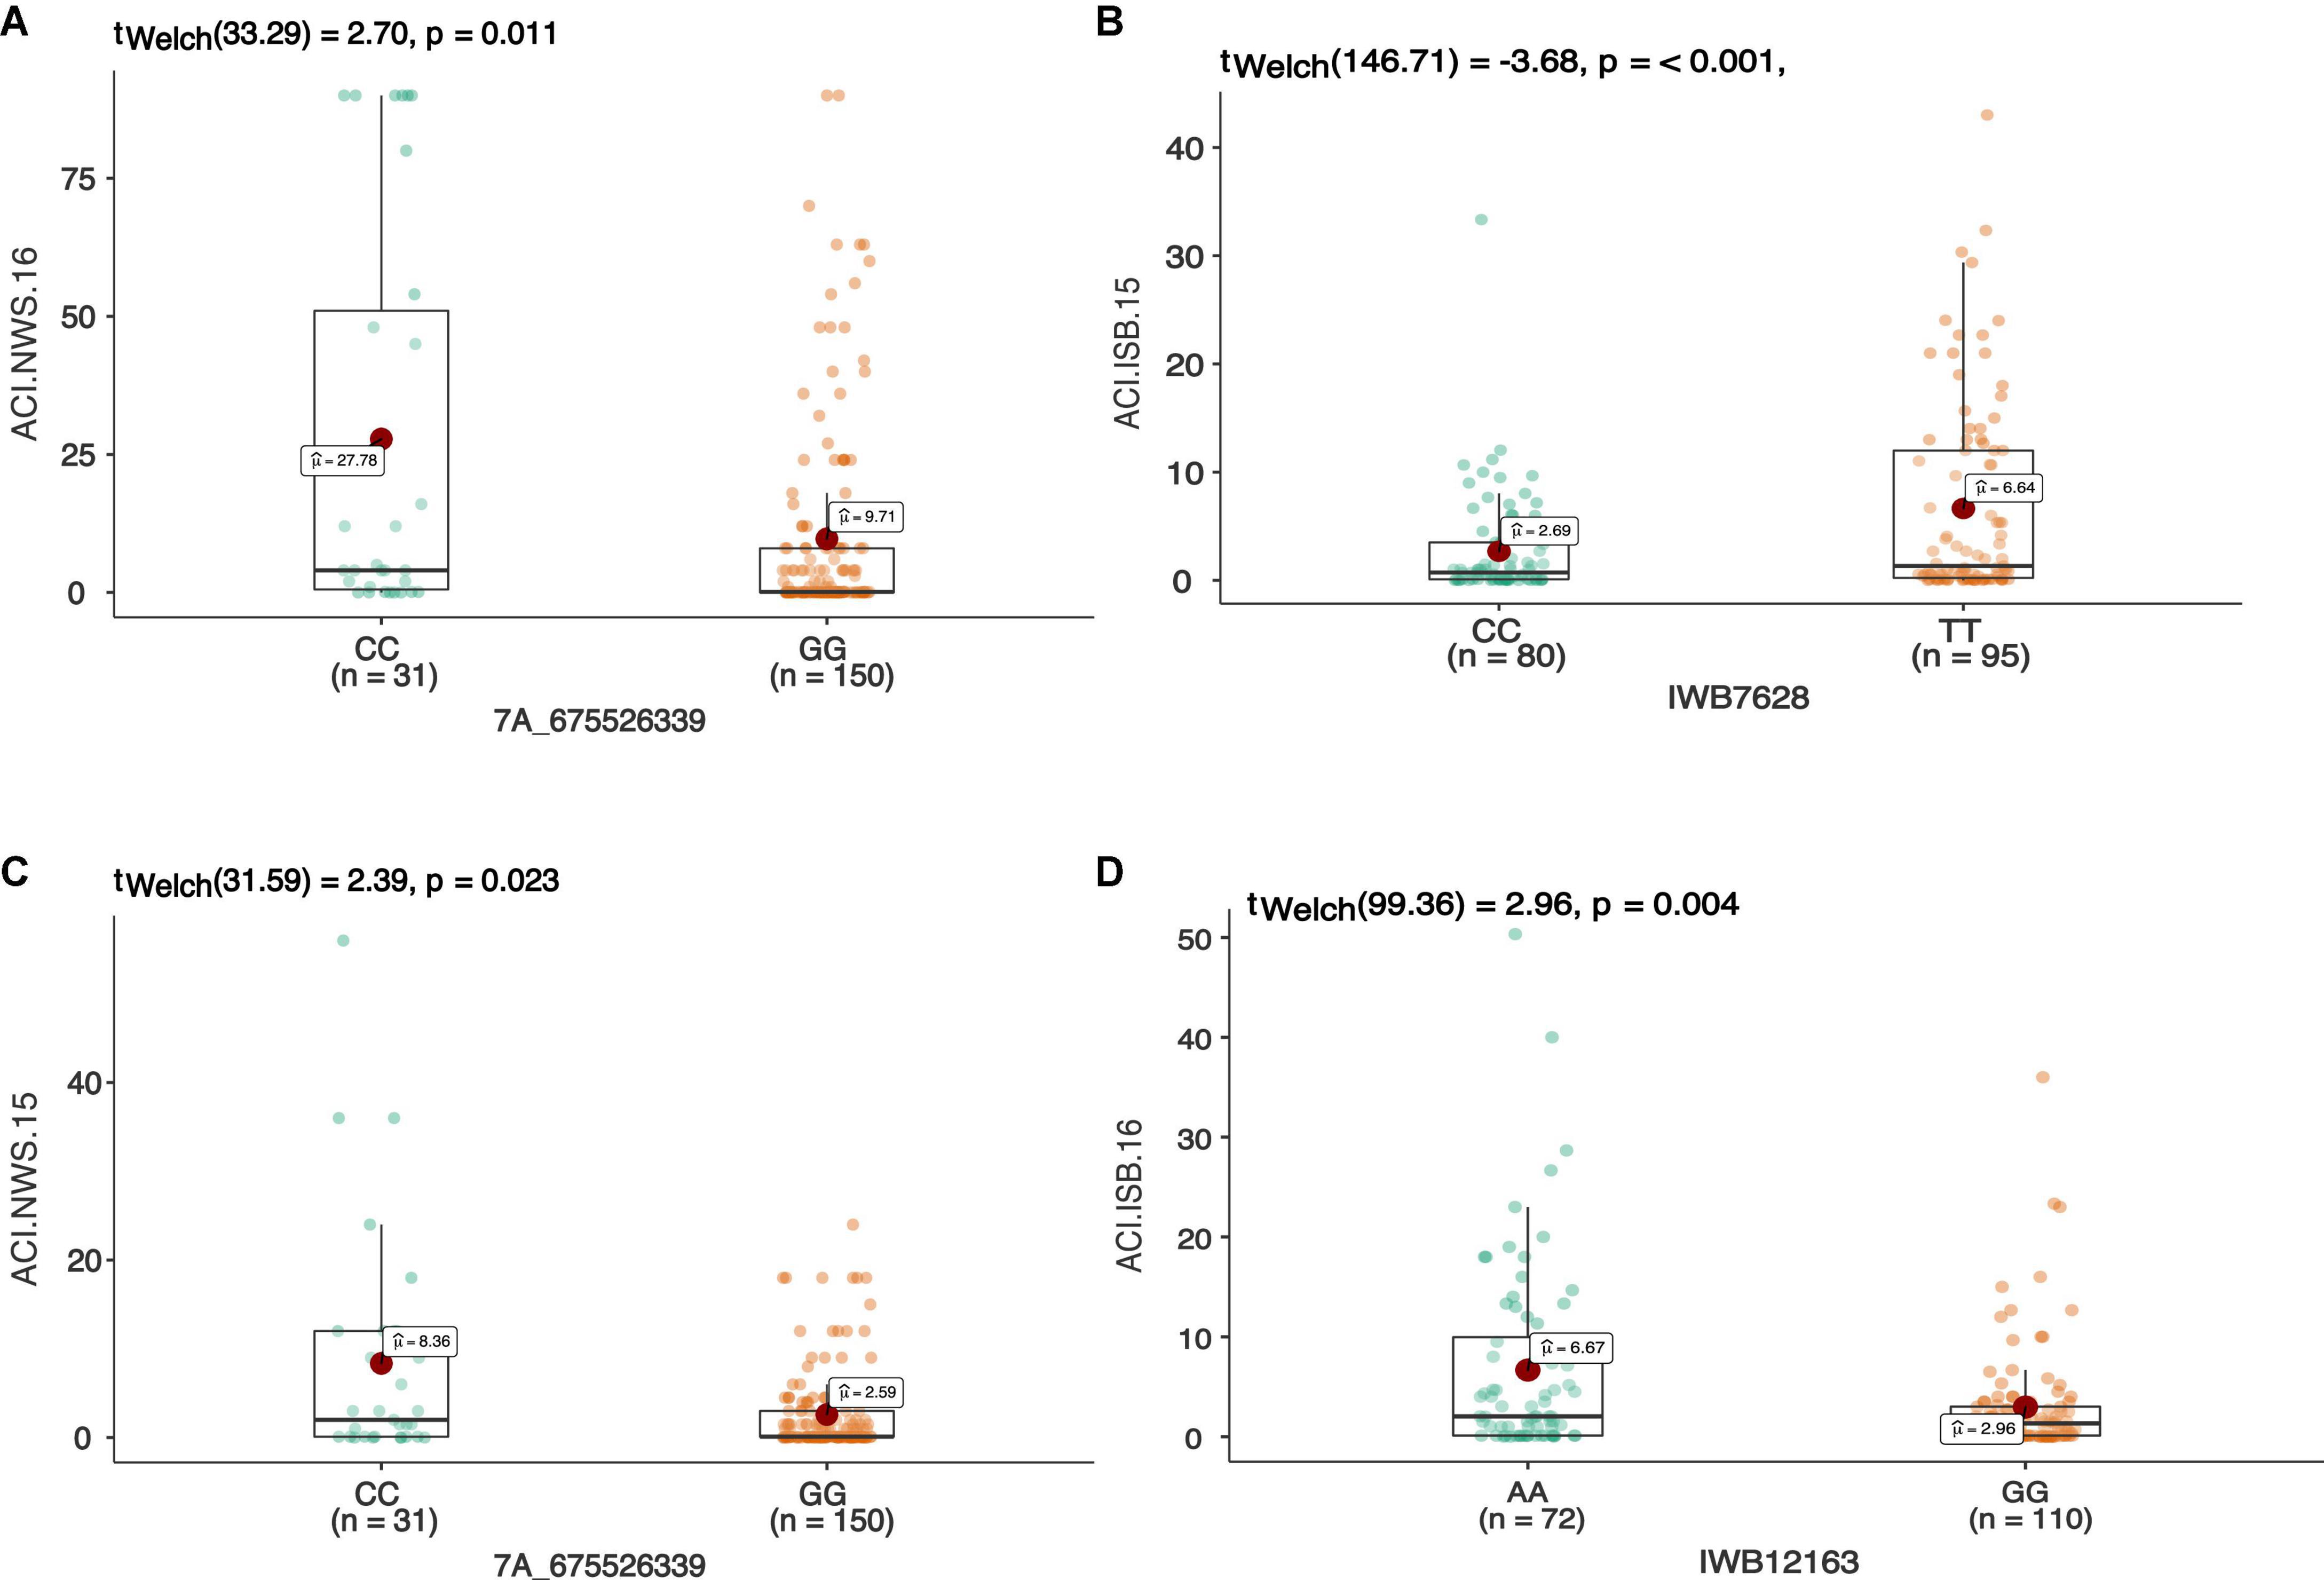
Figure 4. The allelic effect of SNP 7A_675526339 on chr7A associated with the average coefficient of infection at Nowshera (NWS) in both years 2015 and 2016 (A,B). The allelic effects of IWB7628 on chr1A, and IWB12163 on chr7B on the ACI at Islamabad-2015 (C), and Islamabad-2016 (D), respectively. Each boxplot shows the distribution of the average coefficient of infection (ACI) in a relevant environment for both allelic states of the SNP marker.
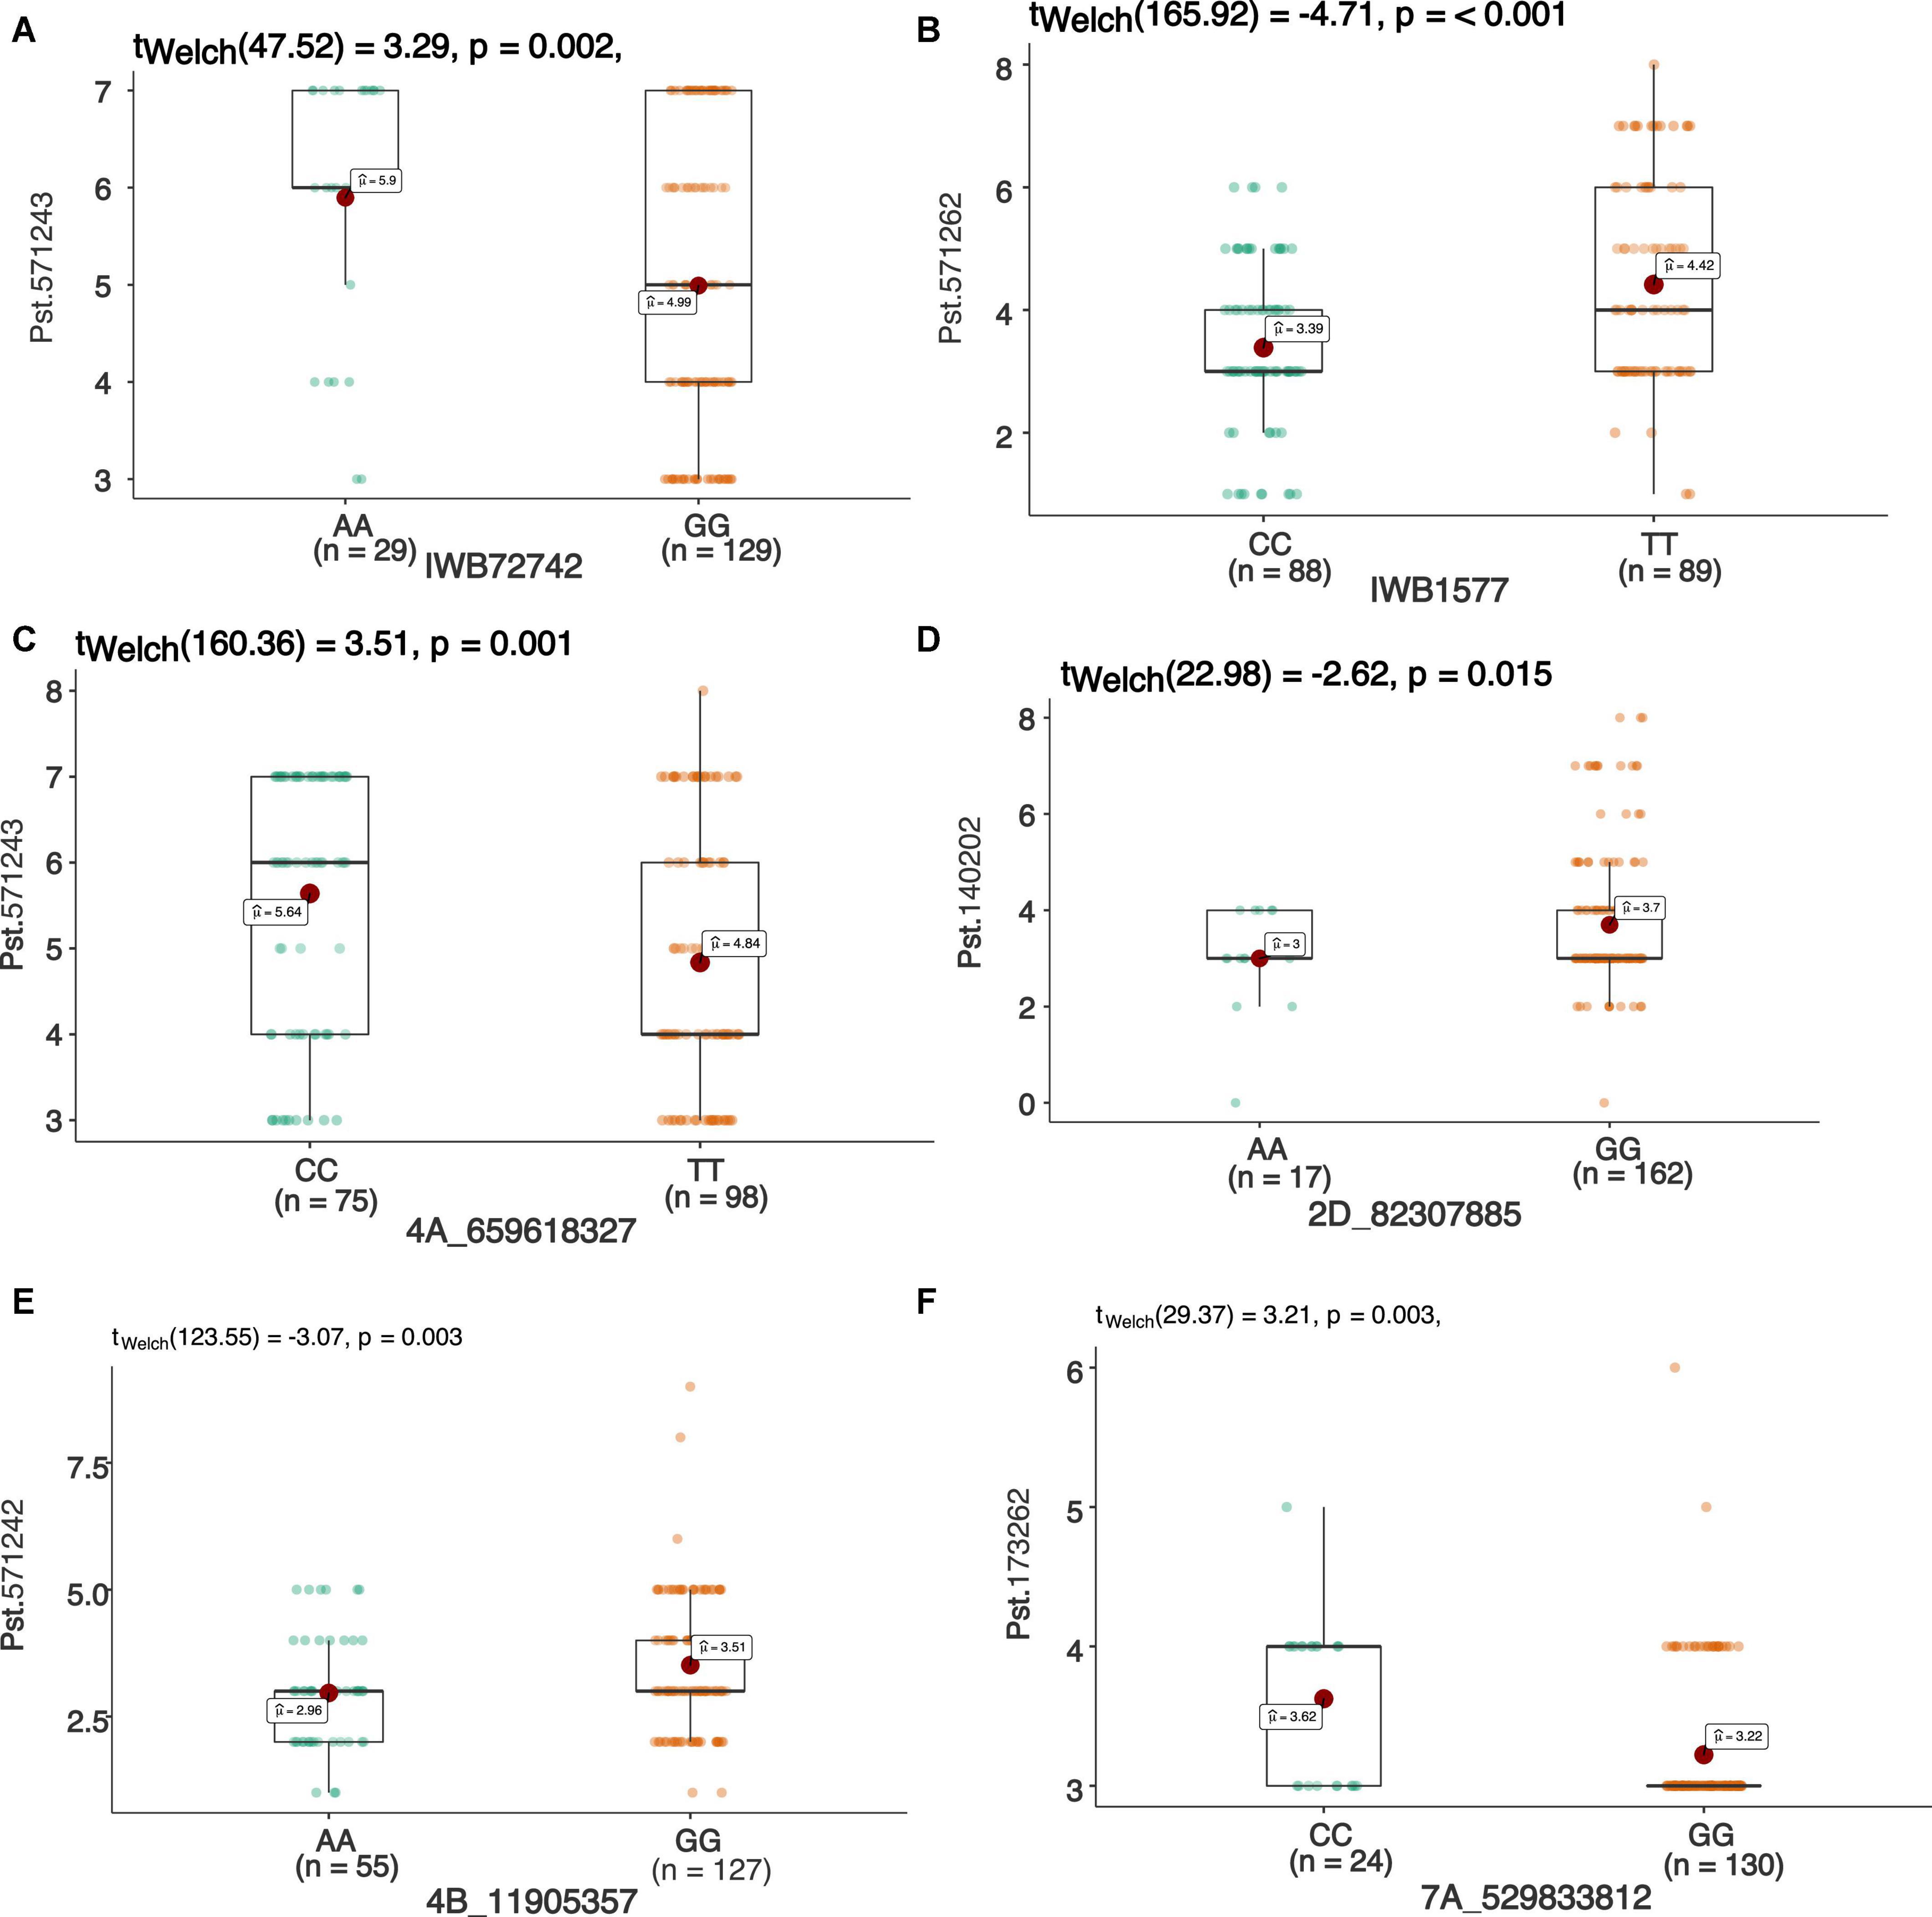
Figure 5. Box plots showing allelic effects of SNPs associated with resistance against stripe rust with highest phenotypic effect at seedling stage against race Pst.571242 (A), Pst.571262 (B), Pst.571243 (C), Pst.140202 (D), Pst.571243 (E), and Pst.173262 (F). Each boxplot shows the distribution of the average coefficient of infection (ACI) in a relevant environment for both allelic states of the SNP marker.
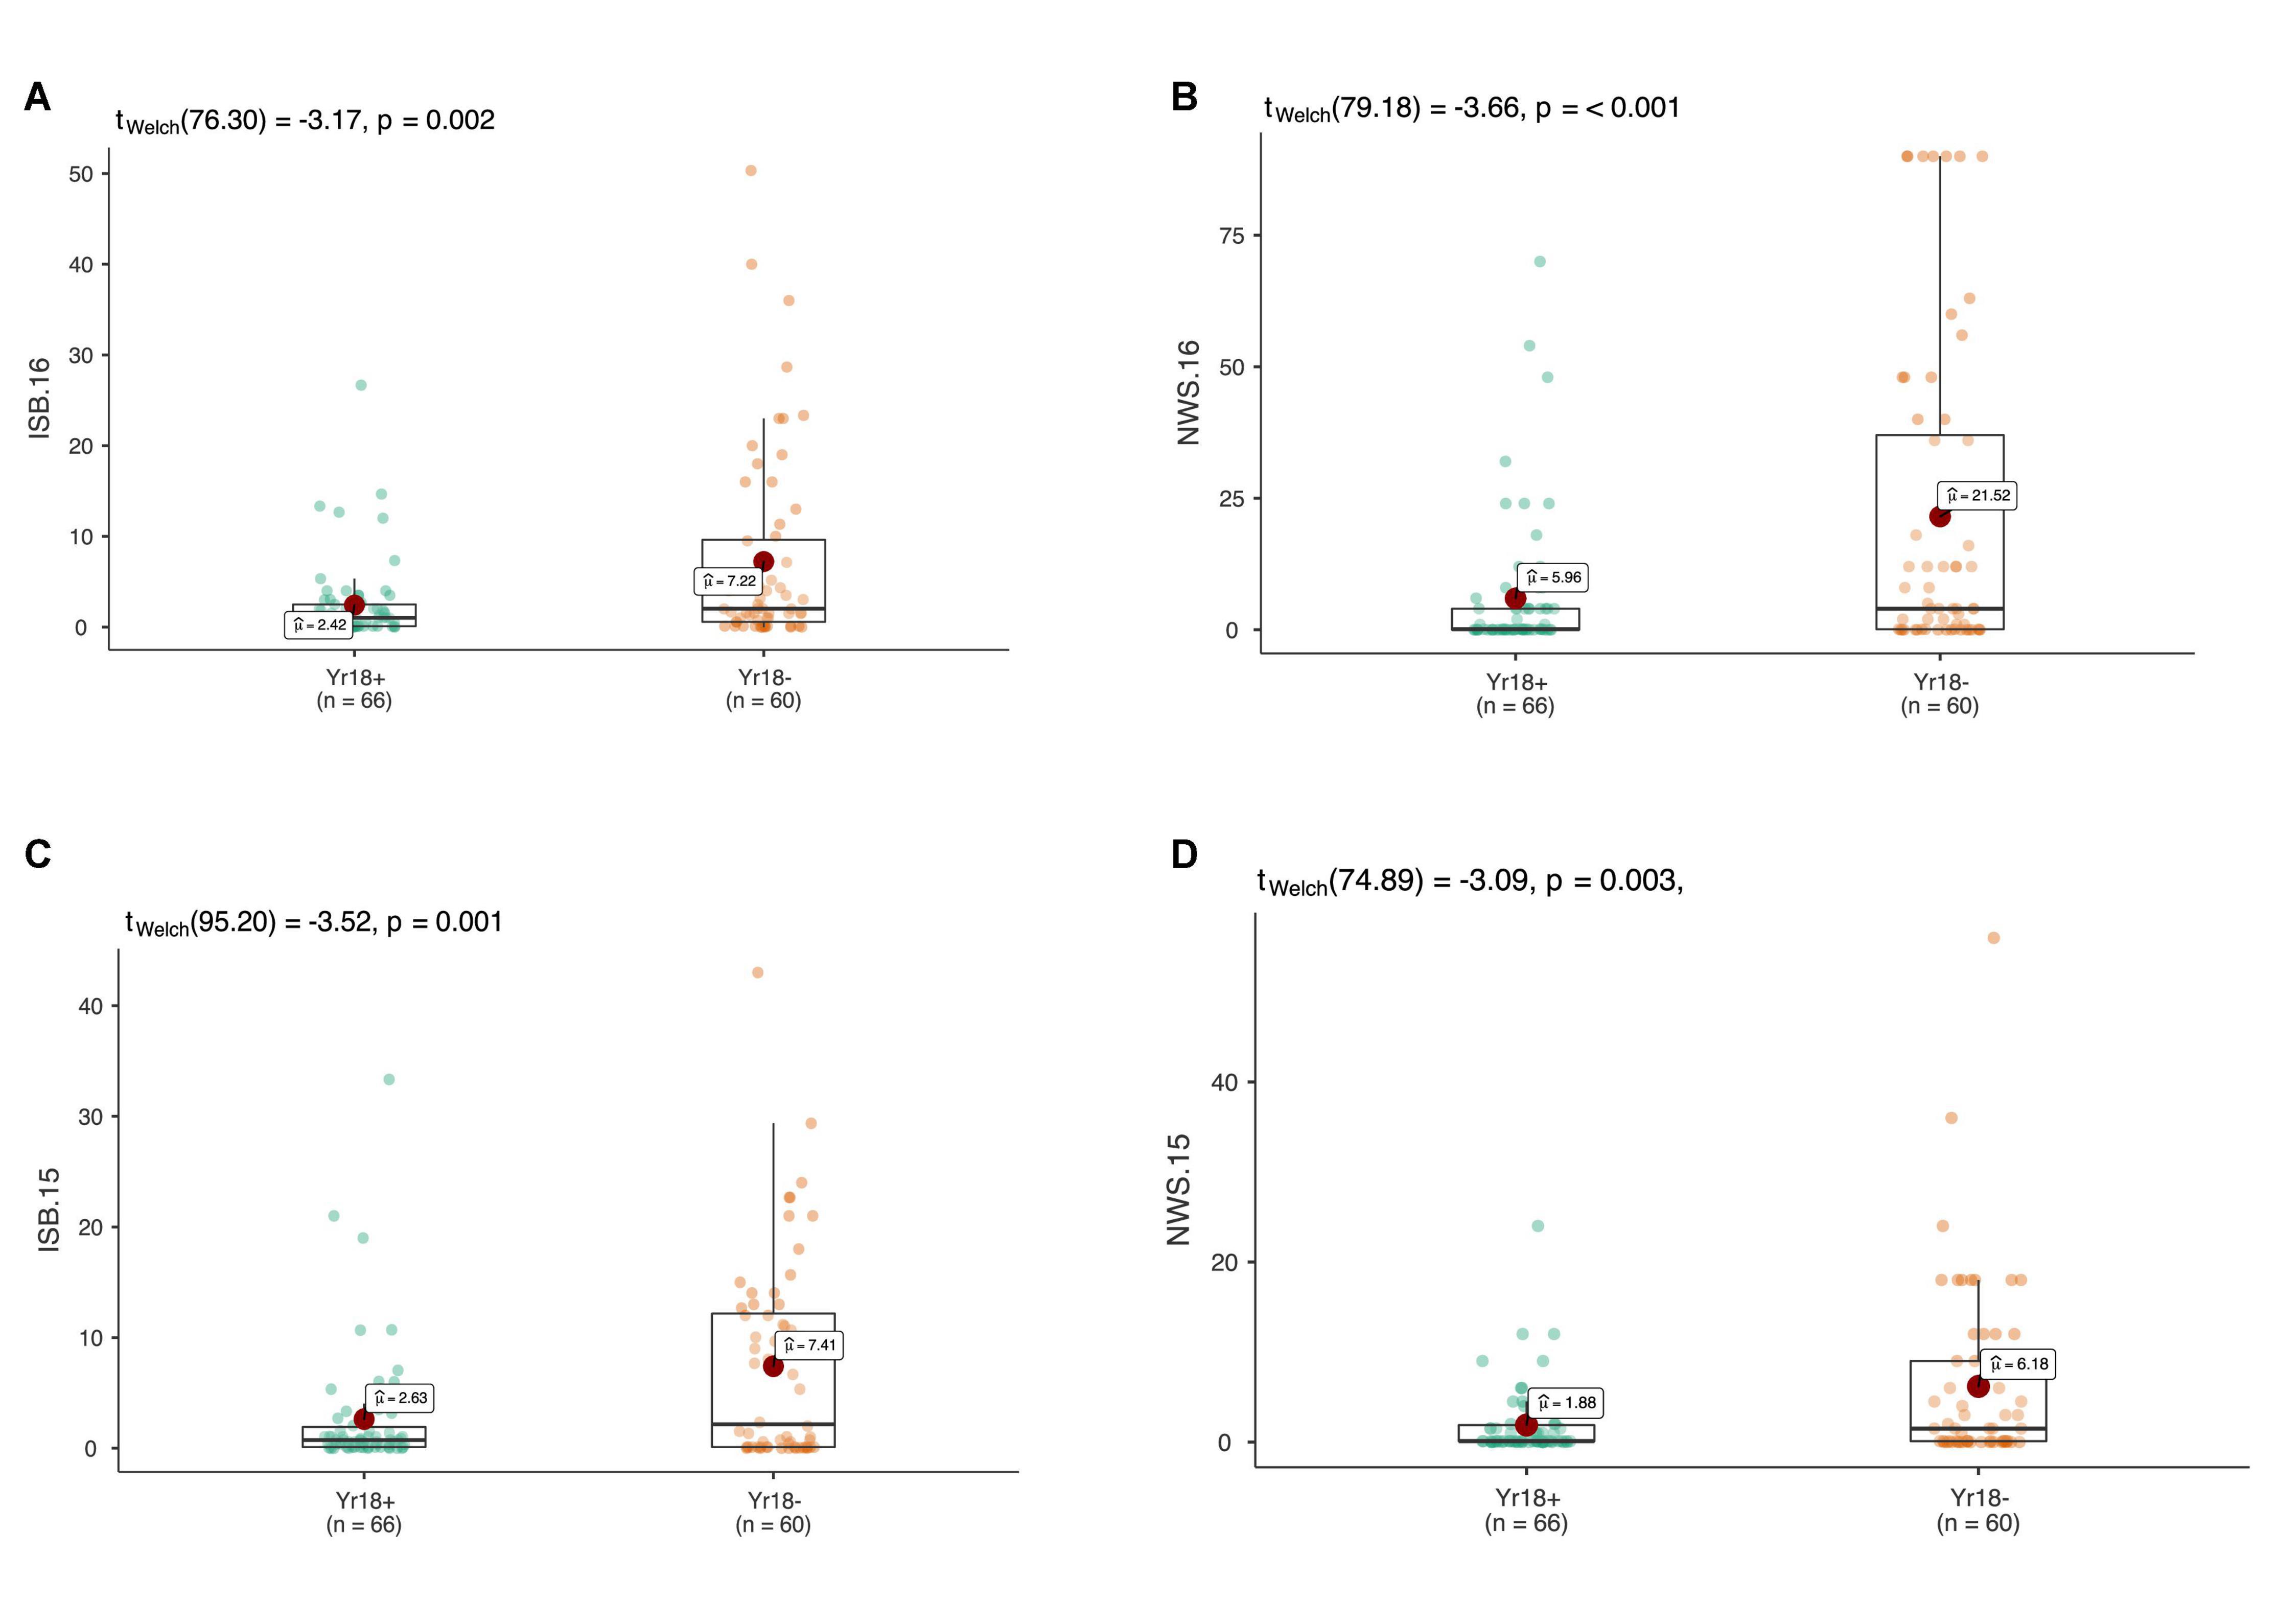
Figure 6. The allelic effects of the durable rust resistance gene Lr34/Yr18 on the average coefficient of infection (ACI) in four environments at adult plant stage in ISB.15 (A), ISB.16 (B), NWS.15 (C), and NWS.16 (D). Each boxplot shows the distribution of the average coefficient of infection (ACI) in a relevant environment for both allelic states of the SNP marker.
In total, three haplotype blocks were associated with seedling resistance against Pst.571242, Pst.140202, and Pst.173262 on chr1A, chr3B, and 7D, respectively (Table 6). The haplotype block on chr1A identified with the 90K SNP array was present at 575.2 Mb and contained six haplotypes, whose frequency ranged from 1.03 to 59% (Figures 7A,B). The effect of all three haplotypes of chr1A LD block is shown in Figure 7C. A haplotype block on chr3B by (GBS markers) was positioned at 125.8 Mb and had four haplotypes with a frequency of 67 to 1%. Similarly, the haplotype block on chr7D was present at 627.3Mb and contained five variants with a frequency between 1.5 to 79.2%. This haploblock is likely a homolog of the QTN identified on chr7A for resistance against the same race.
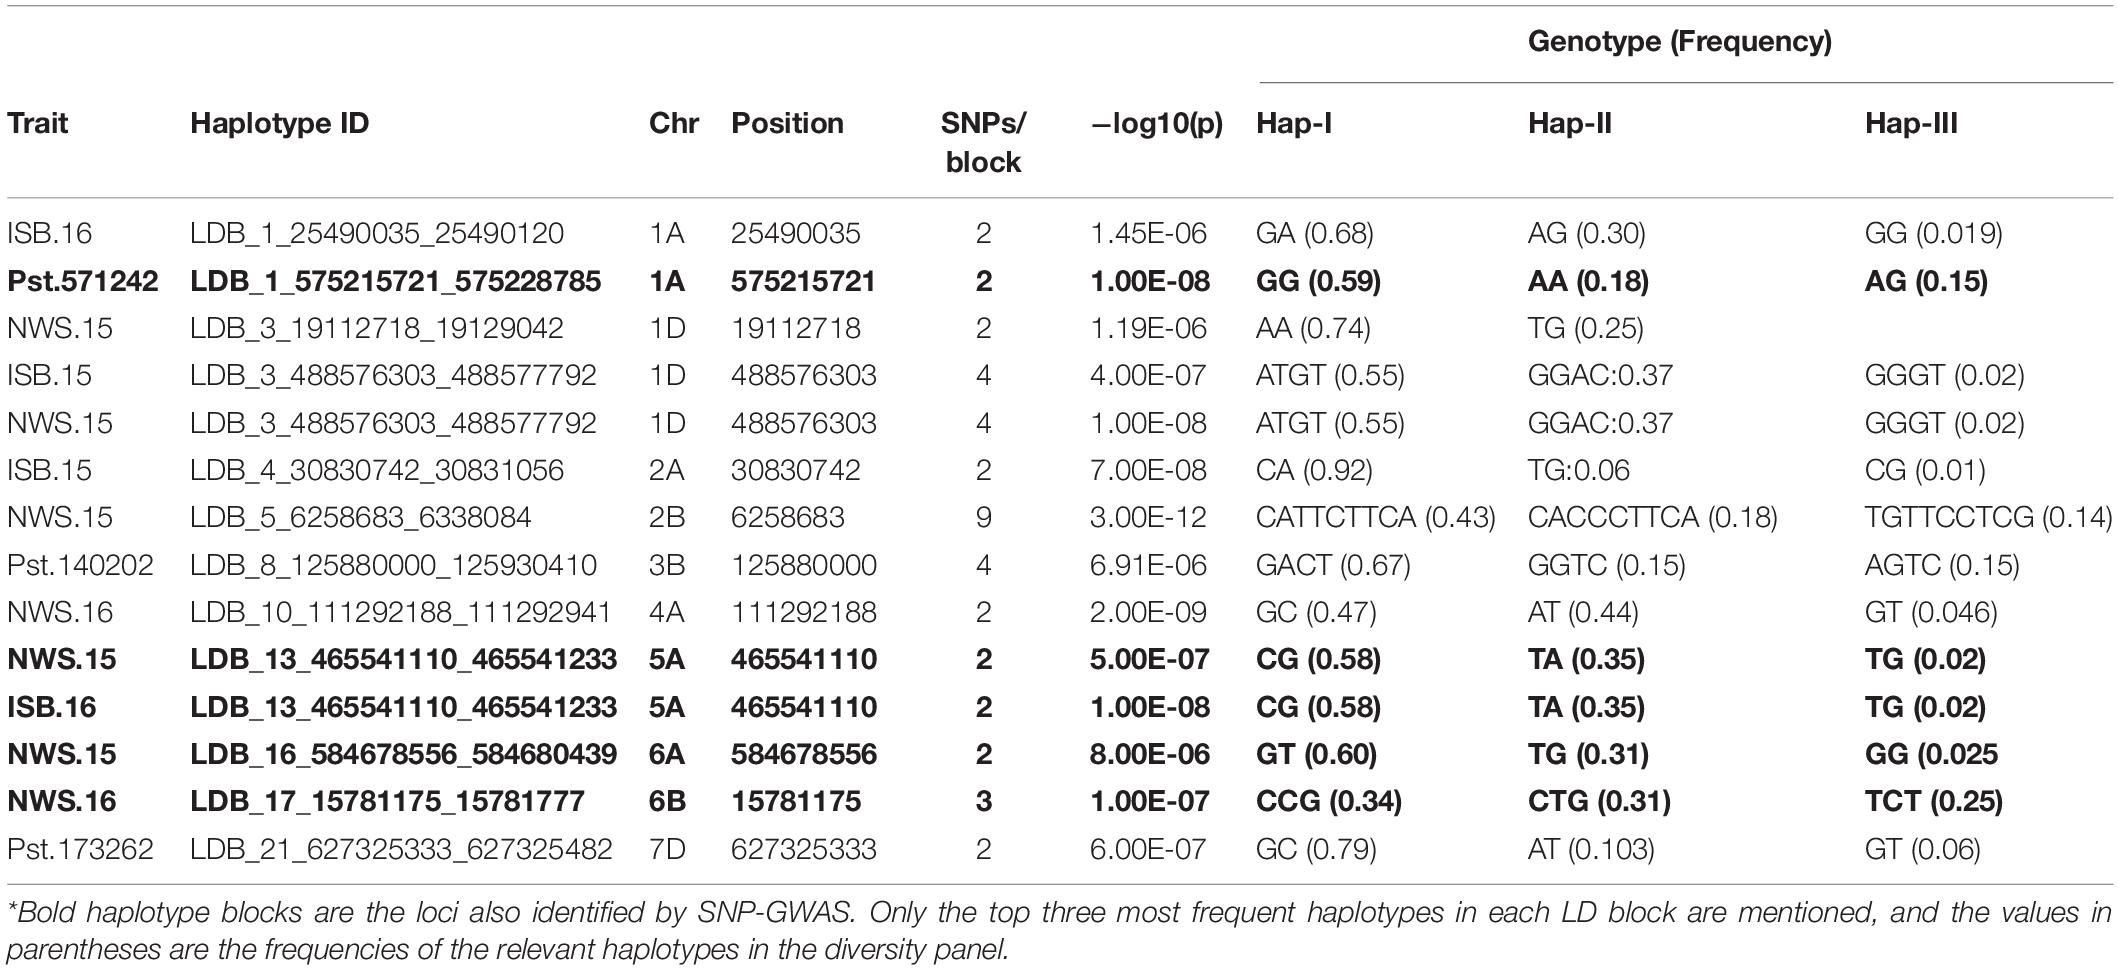
Table 6. Haplotypes associated with resistance to Pst at seedling and adult plant stages in SYN-DER wheats using 90K and GBS markers.
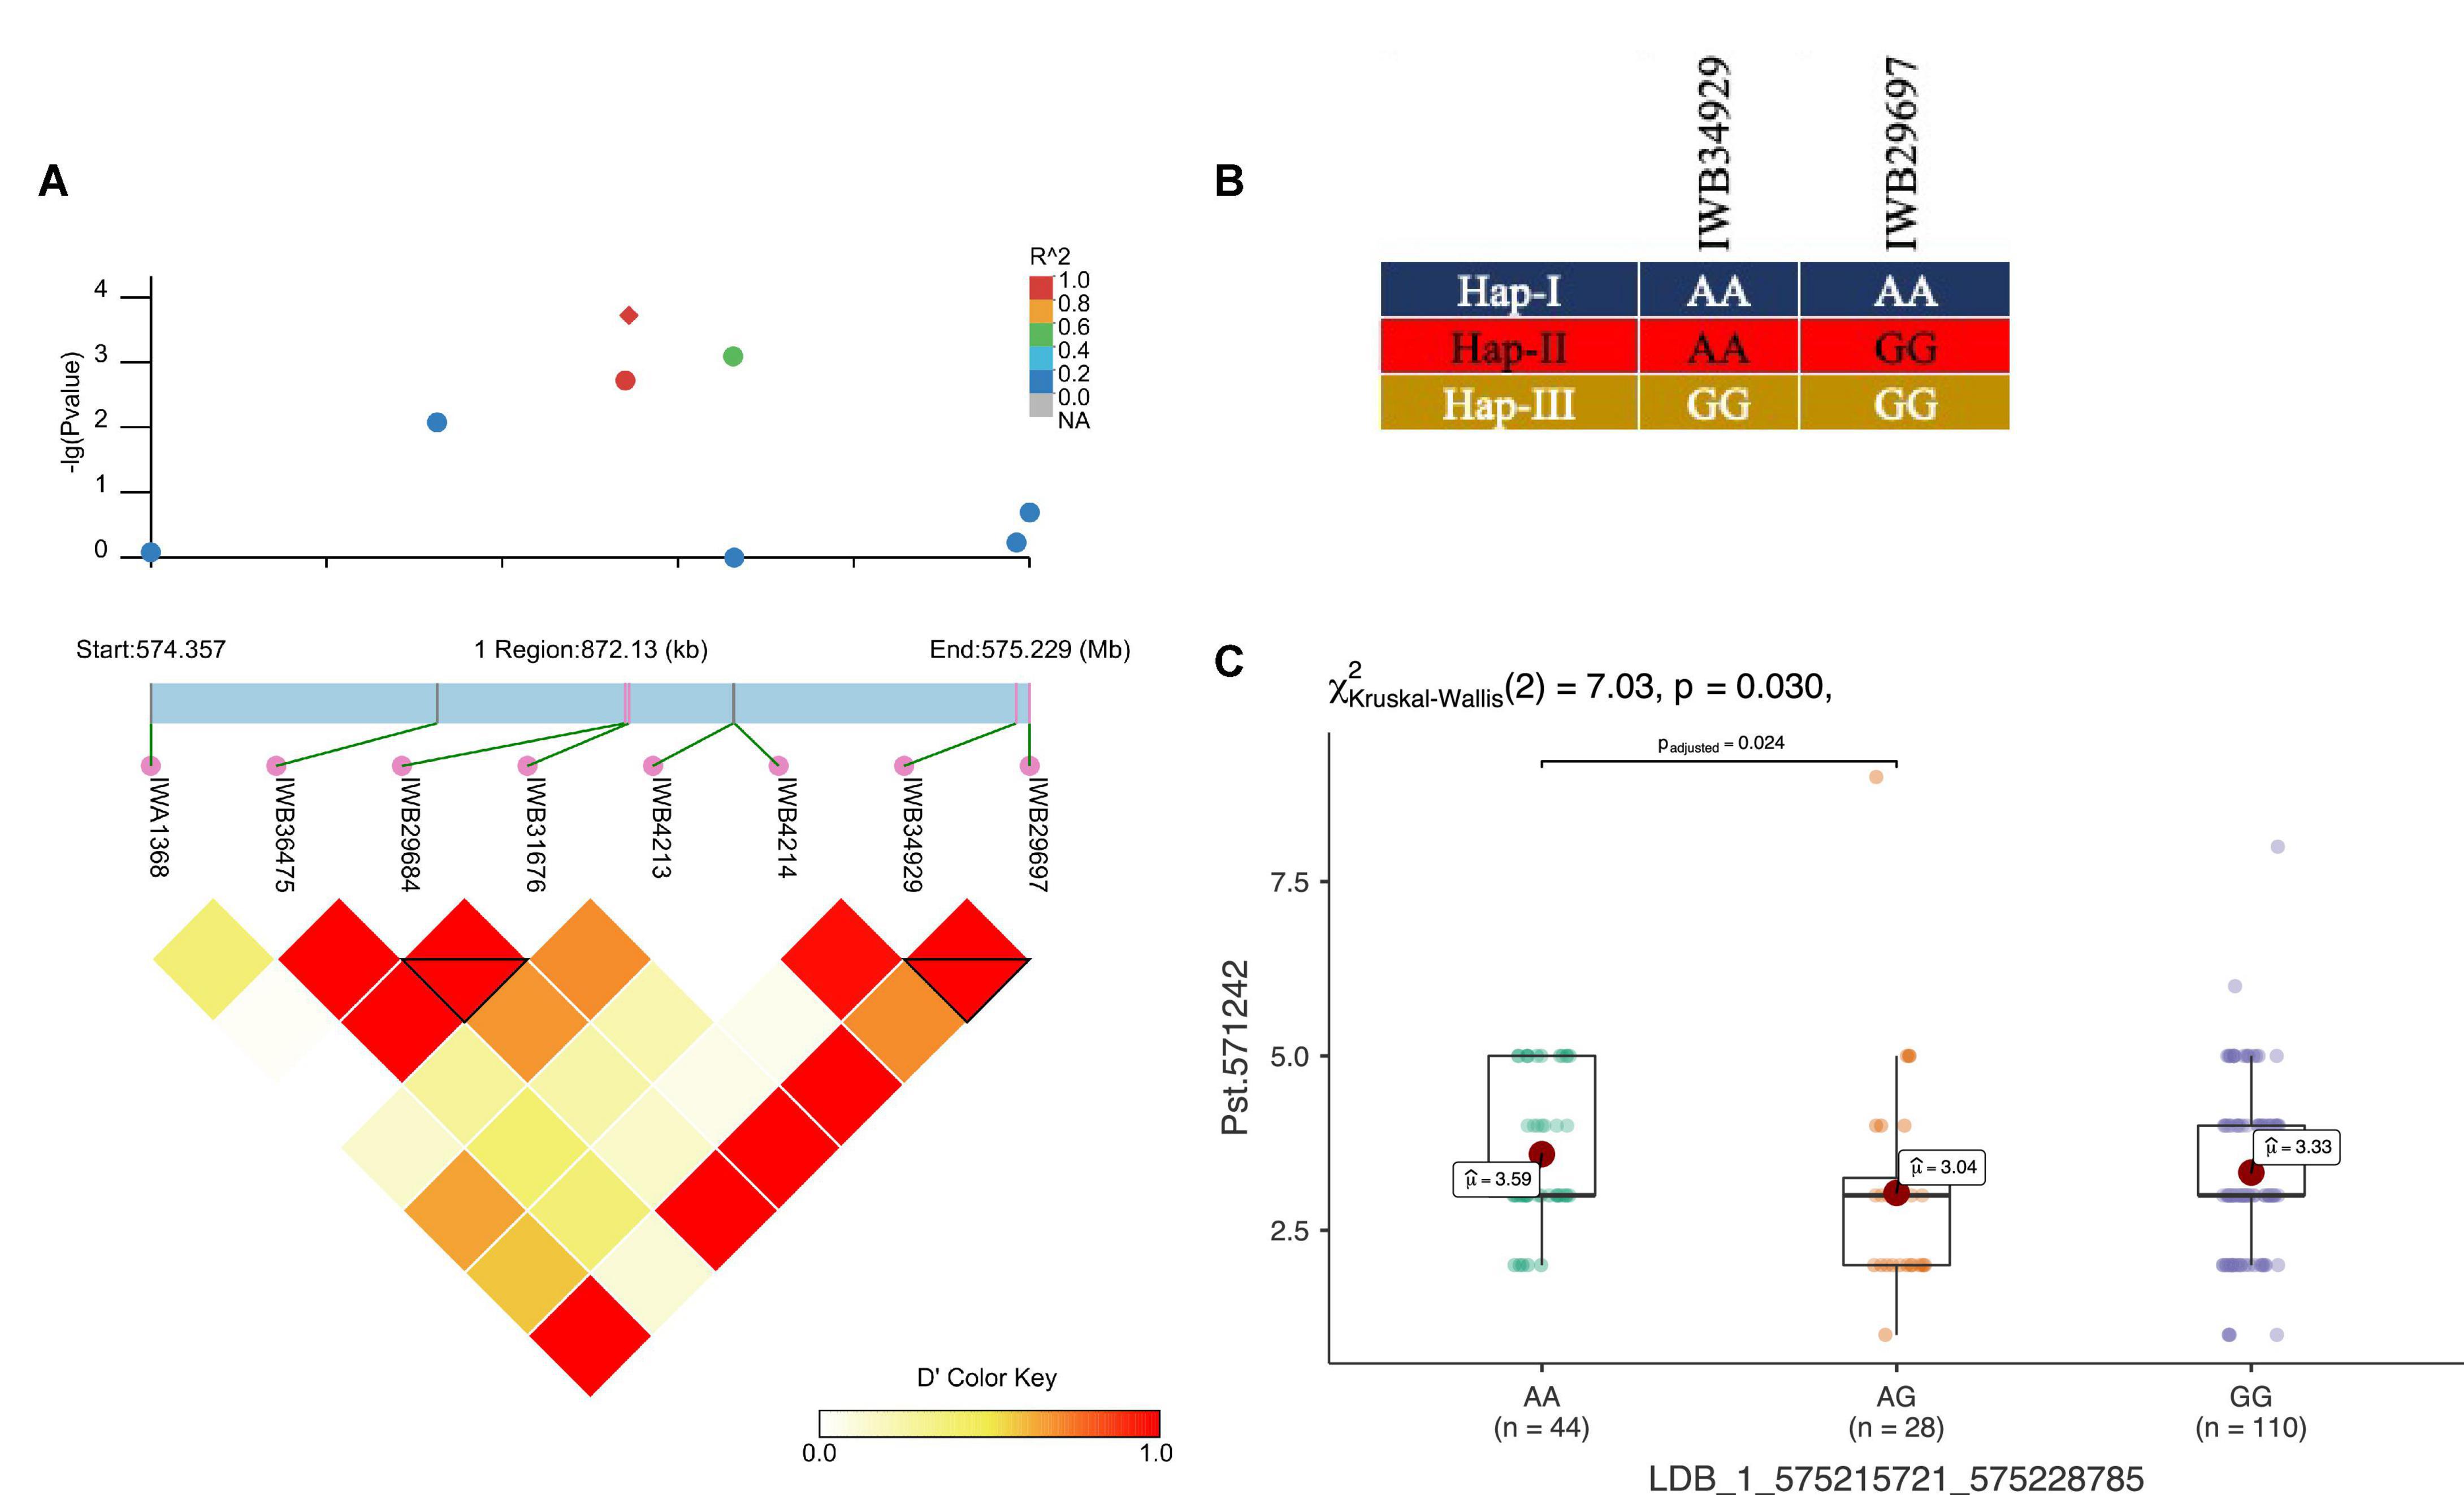
Figure 7. LD haplotype block with SNP positions (A), variants of haplotype block (B), and allelic effect of different haplotypes on resistance against Pst.571242 in the block for LBD_1_575215721_575228785 on chr1A (C). Each boxplot shows the distribution of the average coefficient of infection (ACI) in a relevant environment for all allelic states of the SNP marker.
In total, 11 haplotype blocks (two identified with GBS and nine with 90K SNP array) were associated with Pst resistance at the adult plant stage. Two haplotype blocks on chr5A and chr1A were associated with resistance to Pst at ISB.16, with three and six haplotype variants observed, respectively. The haplotype block on chr6B was associated with resistance to Pst at NWS.16 and consisted of three haplotypes (Figures 8A,B), where the Hap-II (CCG) significantly reduce the ACI (Figure 8C). Similarly, haplotype block on chr1A consisted of four haplotypes (Figures 8D,E), and Hap-II (CATTCTTCA) was associated with resistance to Pst at NWS.15 (Figure 8F). A haplotype block at 488 Mb on chr1D was associated with resistance to Pst at ISB.15 and NWS.15, while another haplotype block on chr5A at 465 Mb was associated with Pst resistance at ISB.16 and NWS.15. This haplotype block is likely the QTN at 481 Mb which was associated with APR at NWS.15. Five haplotype blocks were associated with Pst resistance at NWS.15 and these were distributed across chr1D (2), chr2B, chr5A, and chr6A. For the haplotype block on chr2B (6.2 Mb), 13 different haplotype variants were identified with a frequency ranging between 1.03 and 43%.
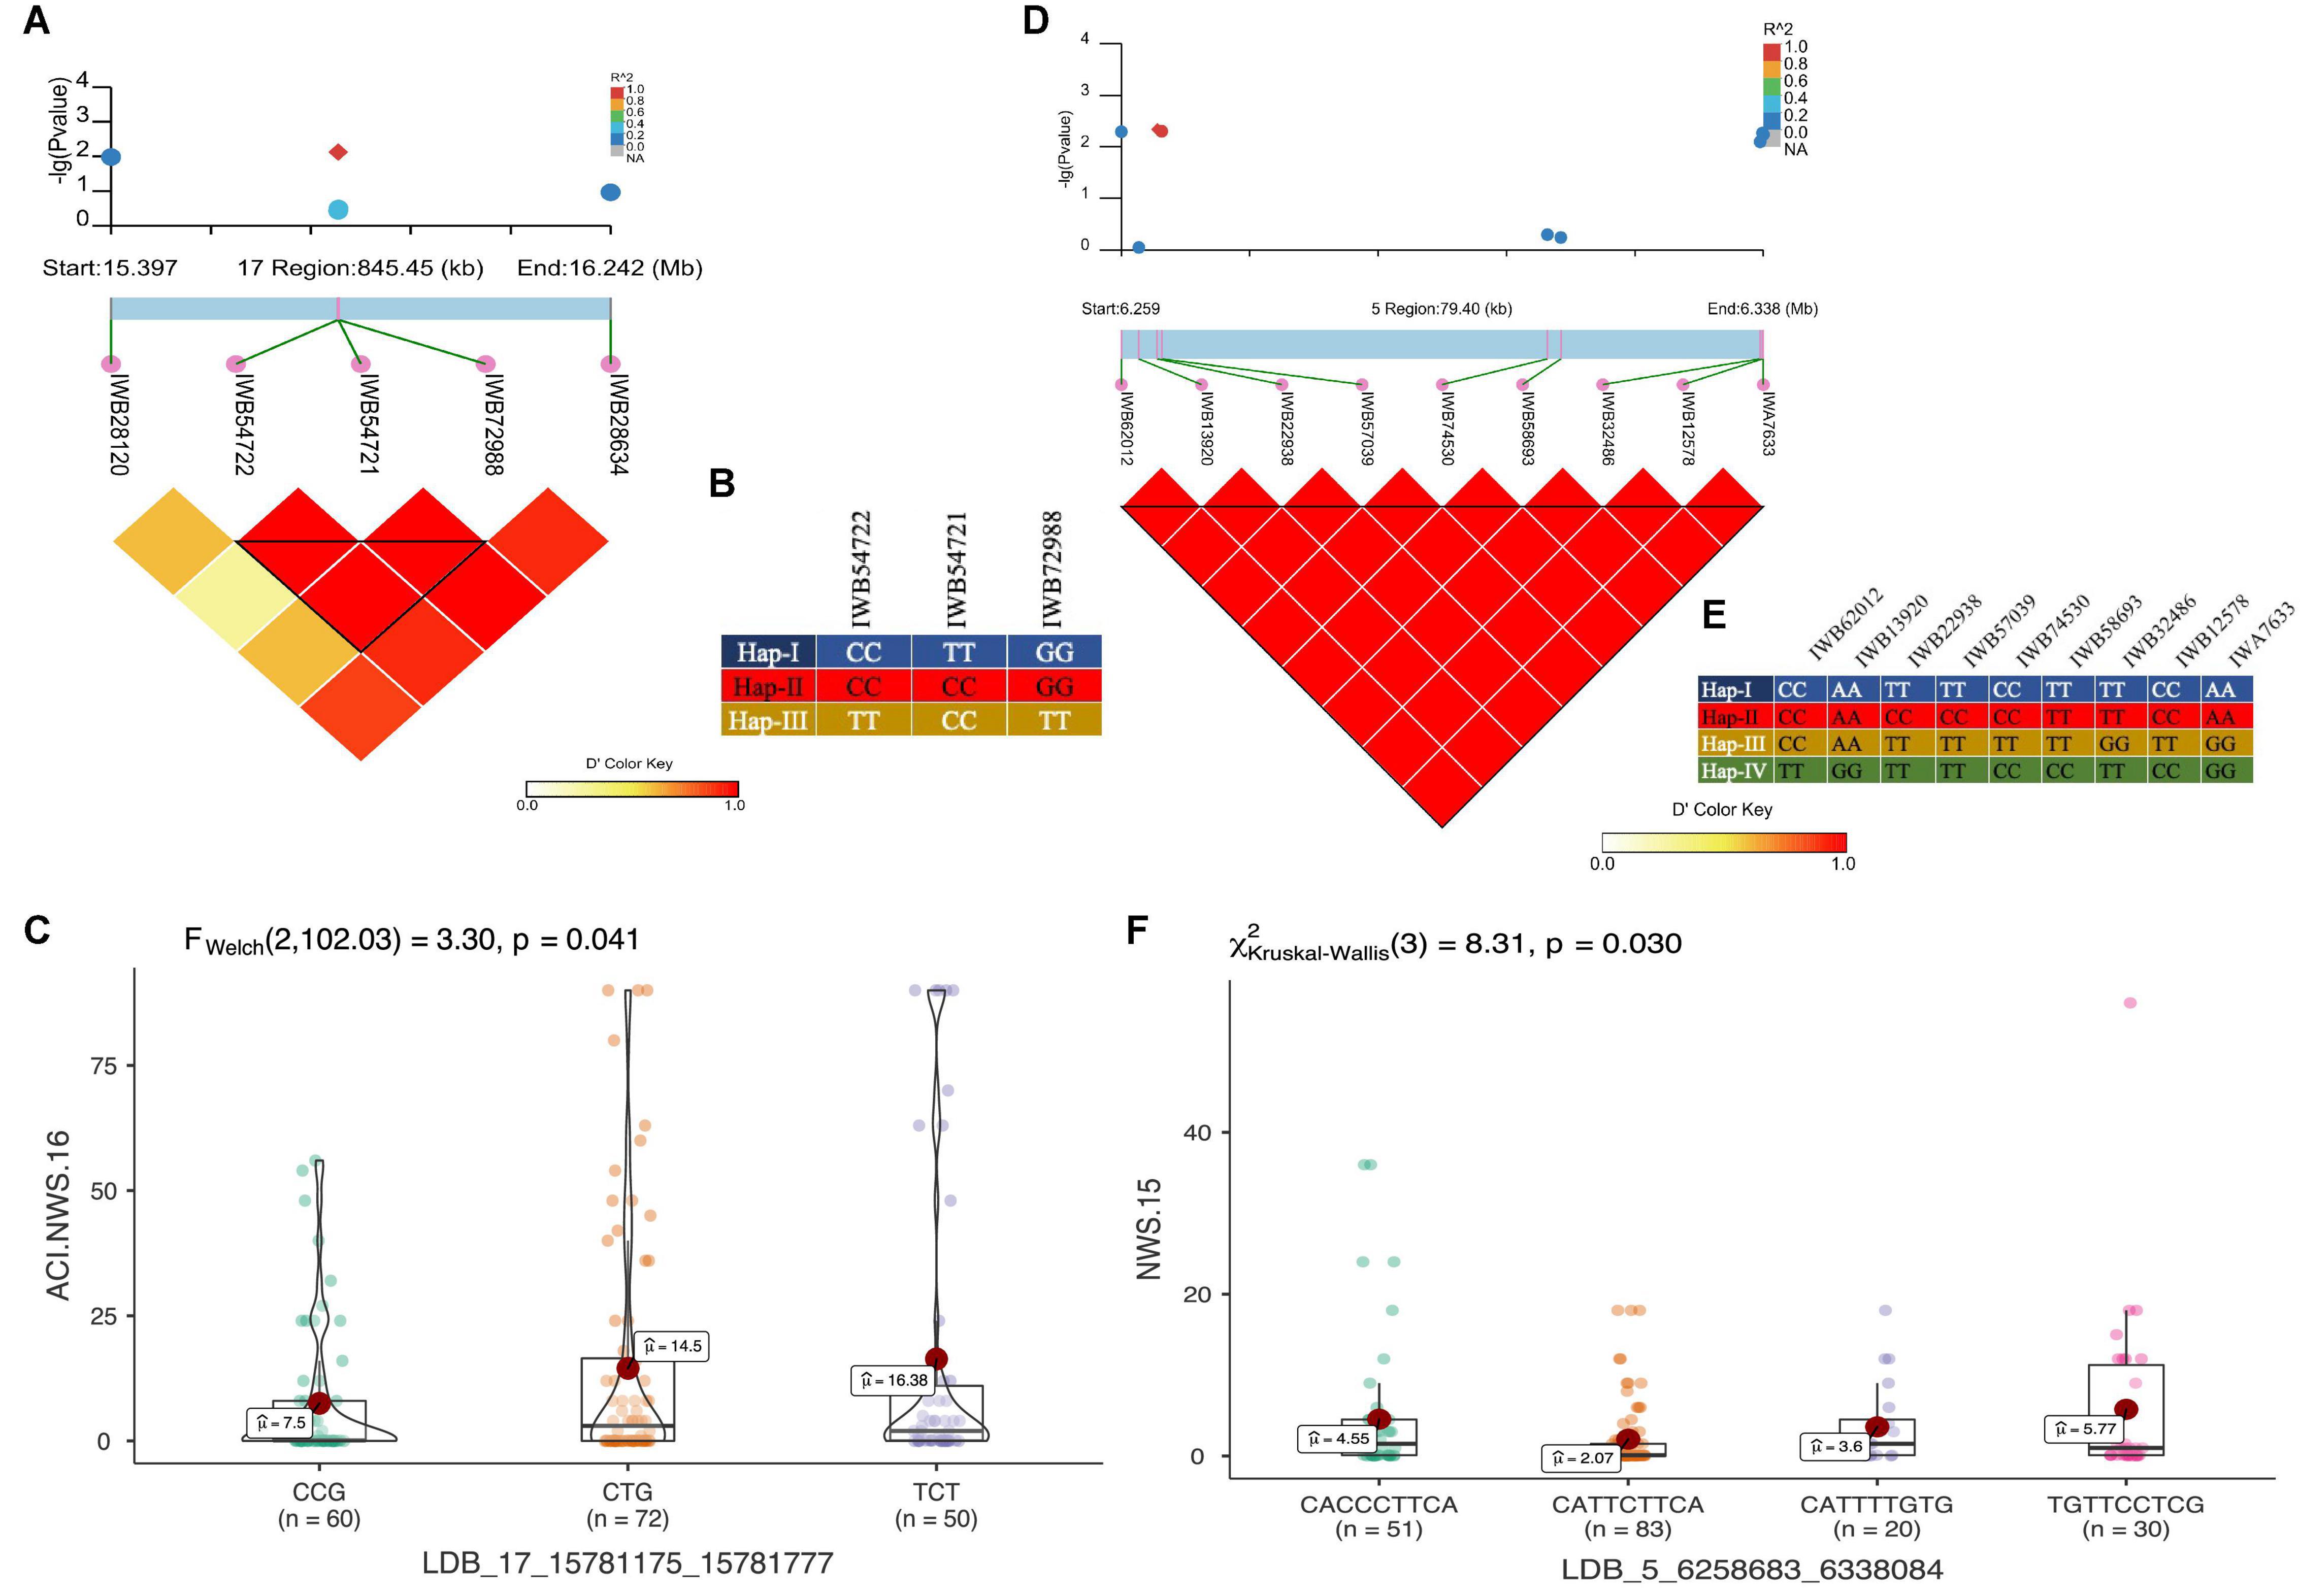
Figure 8. LD haplotype block with SNP positions, variants of haplotype block and allelic effect of different haplotypes in the block for LBD_17_15781175_15781777 on chr6B (A–C), and LBD_5_6258683_6338084 on chr2B (D–F). Each boxplot shows the distribution of the average coefficient of infection (ACI) in a relevant environment for all allelic states of the SNP marker.
Genomic-prediction analysis was conducted using a fivefold validation for Pst resistance at four locations and five Pst races using 11 different prediction models (Table 7). In the case of APR, prediction accuracies ranged from 0.23 (RKHS for ISB.15) to 0.511 (BL for NWS.15) using 90K markers, while prediction accuracies were relatively lower for GBS. Among the prediction models, BRR, BL, and GBLUP showed higher prediction accuracies compared to other models. Prediction accuracies were low for Pst.173262 and Pst.140202 using both GBS and 90K markers. The hierarchical clustering was used to classify the prediction models, which indicated that EN-based prediction accuracies were quite different than other models both for 90K and GBS markers (Figures 9A,B). Based on the 90K platform, all Bayes model (A, B, and C) and BL were quite similar in the prediction of reaction against Pst. BRR, GP, and GBLUP were quite similar in the case of the GBS platform (Figure 9A), while BRR was a bit different compared to GP and GBLUP in the case of 90K markers (Figure 9B).
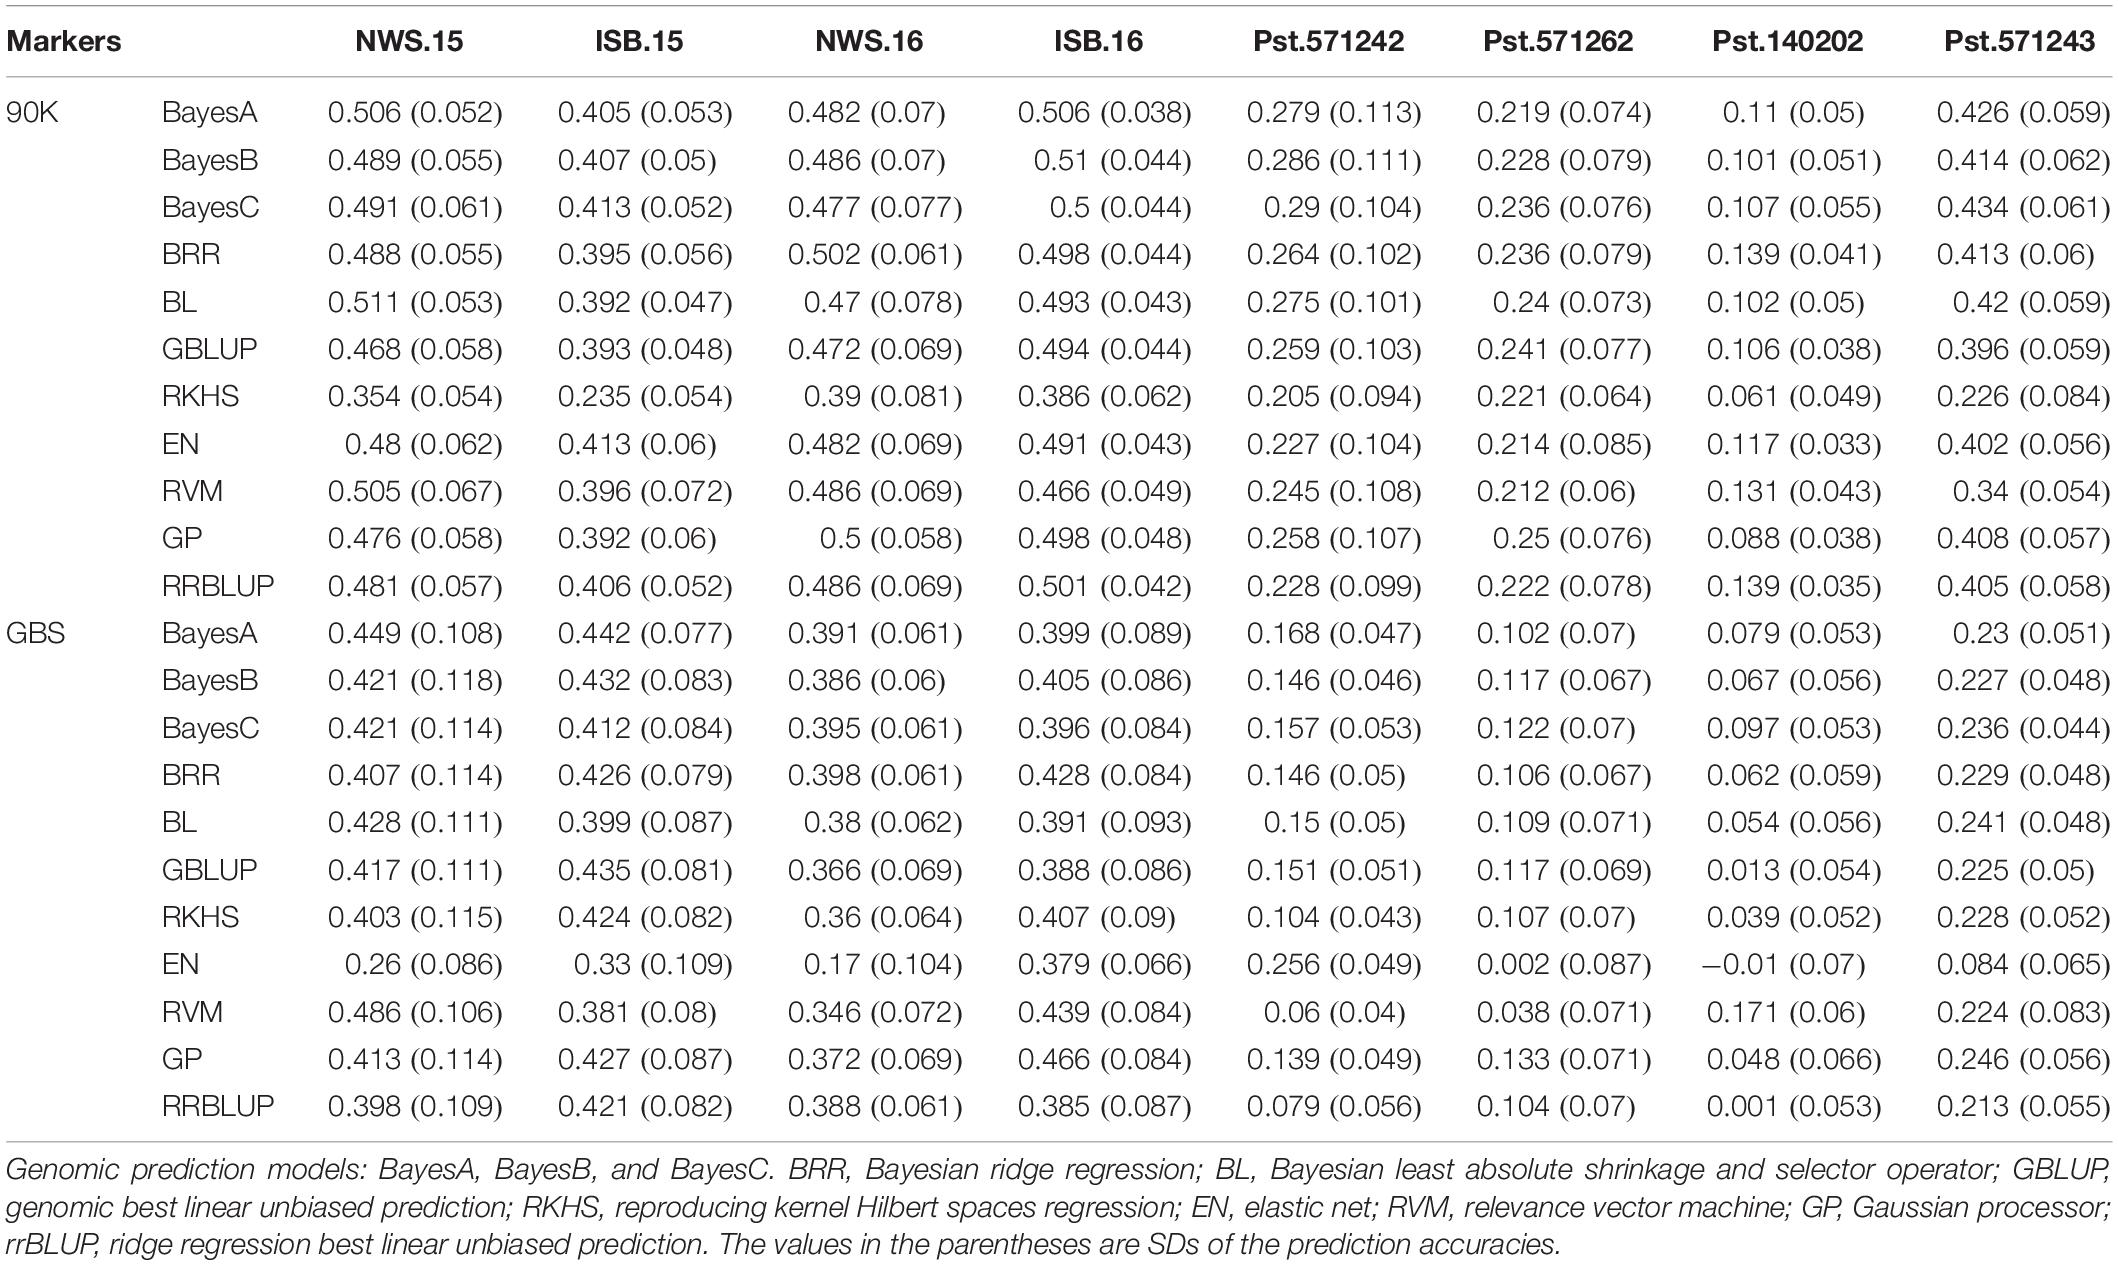
Table 7. Genomic prediction accuracy using 11 different models for stripe rust resistance at four locations, and against five isolates at seedling stage using 90K SNP array and genotyping-by-sequencing (GBS) platform.
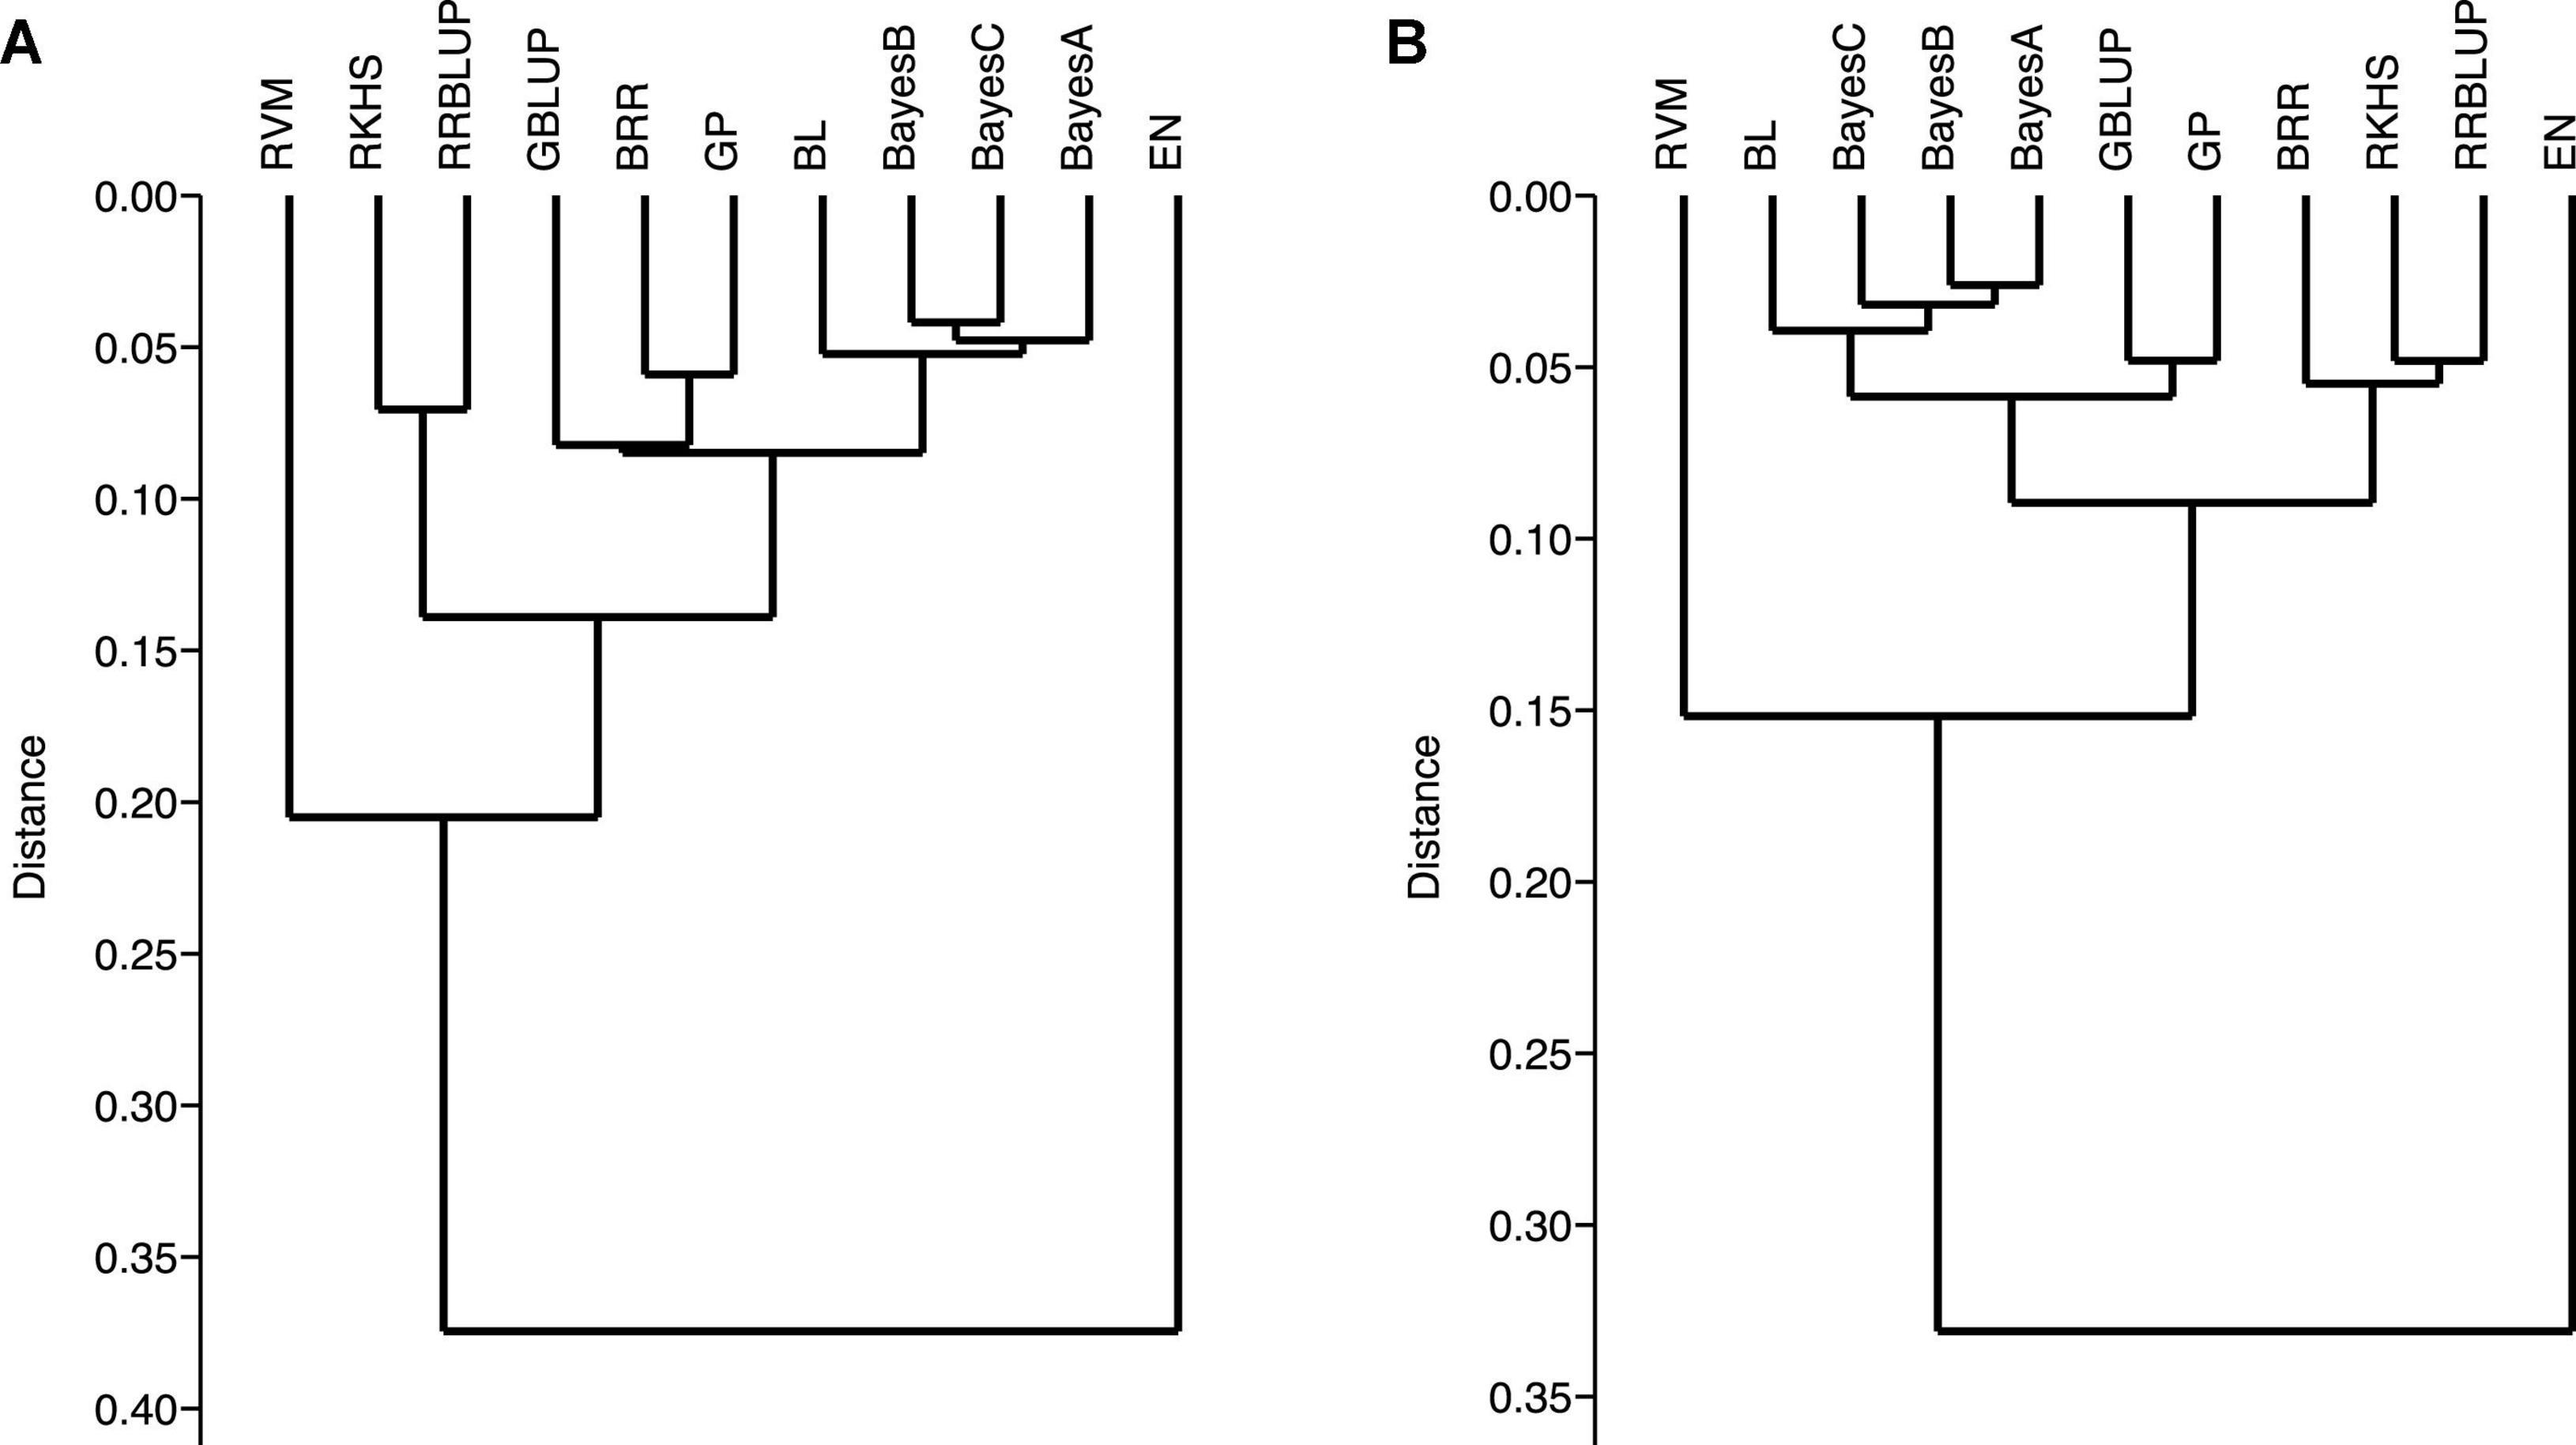
Figure 9. Ward’s hierarchical clustering on the prediction genomic values derived from the stripe rust infection types using 90K (A) and GBS (B) marker platforms. Genomic prediction models: BayesA, BayesB, BayesC, Bayesian ridge regression (BRR), Bayesian least absolute shrinkage and selector operator (BL), genomic best linear unbiased prediction (GBLUP), reproducing kernel Hilbert spaces regression (RKHS), elastic net (EN), relevance vector machine (RVM), Gaussian processor (GP), and ridge regression best linear unbiased prediction (rrBLUP).
The deployment of new, effective, and durable sources of resistance against Pst is required to reduce the risk of epidemics. Seven SYN-DERs were found to possess a high level of resistance against three Pst races, while six were resistant against all five races. It is likely that these SYN-DERs (SD37, SD38, SD73, SD85, SD104, SD172, and SD173) carry major stripe rust resistance genes. All five races used in the evaluation were avirulent to Yr24/Yr26, which was identified in synthetic hexaploid wheats and has been deployed in China and elsewhere (McIntosh et al., 2018). Most Pst races are avirulent to the Yr24/Yr26 gene, however, races virulent to Yr10 were also virulent to Yr24/Yr26, e.g., Australian Pst race 150 E16A + and Chinese Pst races V26-CH42, and V26-Gui22 (McIntosh et al., 2018). Since SYN-DER wheats are not extensively deployed in Pakistan and the races used in this study were the most virulent available races, it is likely that virulence to Yr24/Yr26 is not common in the pathogen population in Pakistan. Therefore, the eight SYN-DERs could be an excellent source of resistance against Pst in Pakistan and other countries where virulence to this gene combination is not present.
At the adult plant stage, more than 110 SYN-DERs showed moderate to resistant responses against Pst. The field screening was carried out in ‘hot-spot’ areas of Pst incidence, thus, this APR in SYN-DER could be usefully deployed against Pst races in the region. These results are in accordance with previous findings that APR occurs at a high frequency in synthetic hexaploid wheat (Zegeye et al., 2014; Bhatta et al., 2019). This is partly attributable to the fact that the A and B genomes of durum wheat are present completely in synthetic hexaploid wheat and partially in SYN-DERs. Previous studies indicate that Pst isolates from bread wheat are often avirulent on durum wheat (Aoun et al., 2021). Among the APR SYN-DERs, 68 carried the Lr34/Yr18 gene, which is known to provide a partial resistance against all Pst races. The results also suggested the presence of Lr34/Yr18 reduced overall incidence of Pst in all four environments against all five isolates. However, none of the SYN-DERs carried Lr67/Yr46, which was expected because this gene evolved after polyploidization and is mostly present in landraces from Pakistan and India (Riaz et al., 2016), while synthetic hexaploid wheats and parents used in SYN-DER did not have any introgression from Pakistan or Indian landraces.
Both platforms, i.e., GBS and 90K SNP array, effectively identified the loci associated with resistance to Pst, and some QTNs were common to both platforms. We have collected information for stripe rust resistance loci from 35 different studies (Supplementary Table 2) and compared our QTNs with previous findings. Among the Yr resistance genes, Yr24/Yr26 is derived from synthetic wheats and widely deployed in synthetic wheat-based commercial cultivars in China (Zeng et al., 2014). Previously, GWAS identified several Yr resistance loci co-localized with known Yr genes including Yr24/Yr26/Yr28 on chromosome 1B, Yr48 on chromosome 5AL, Yr32 on chromosome 2A, and Yr19 on chromosome 5BL (Zegeye et al., 2014). Apart from Yr24/Yr26, it was expected that several of the SYN-DERs could carry Yr32 because all five races are avirulent to this gene. One QTN and one haplotype were associated with resistance to Pst on chr2A at 566 and 30.8 Mb, respectively. The QTN at ∼566 Mb was likely to be Yr32; previously, the SNP AX-108752496 (similar position) was reported to be associated with Pst resistance (Wu et al., 2021). However, the minor allele provided resistance and its frequency at this QTN was 12% (n = 23), fourteen out of 23 SYN-DERs also possessed the durable rust resistance gene Lr34/Yr18. Therefore, these 14 accessions could carry both major and minor genes, thus, provide valuable donor sources for breeding programs.
Among the 32 seedlings and 68 APR QTNs, 18 had a phenotypic effect exceeding 10%. The largest effect QTN on chr3B at ∼55.4 Mb explained 29.3% of the variation was identified by both platforms in two environments. However, the phenotypic variation explained was relatively lower in ISB.16 (14.2%). Yao et al. (2020) previously identified a QTN at a similar position in Chinese wheat landraces (designated QYr.nafu.3BS). Since the major allele provided resistance at this QTN, it is likely that this locus was responsible for the high frequency of the resistant SYN-DERs.
Previous studies identified QTNs for resistance to Pst on chromosomes 2A, 3B, 6A, and 7B in an association mapping panel of 181 SHWs (Zegeye et al., 2014). The QTNs and haplotypes identified on the D genome showed the potential of SYN-DERs for improving the Pst resistance in modern wheat cultivars. The same loci associated with seedling and APR to Pst on chr1B (∼300 Mb), chrr7A (∼506 Mb), chr2B (∼150 Mb), chr3A (∼701 Mb), chr3D (∼355 Mb), and chr5B (∼2.2 Mb). These loci could be used to discover potentially novel alleles of major stripe rust resistance genes. The genes Yr18, Yr29, Yr30, and Yr78 have been widely used in wheat breeding (Wu et al., 2021). However, in our study, no SNP association was found in the vicinity of Yr78 and Yr30. The QTN on chr1B at 683 Mb was likely to be Yr29, and a QTL QYr.nwafu-1BL was also identified in close proximity (Wu et al., 2021). The QTN on chr3A was identified as effective against Pst.140202, and a major gene Yr75 is located nearby at ∼675 Mb, while the stem rust resistance gene Sr15 was identified at the same position (Babiker et al., 2015). However, several loci identified in this study could not be compared with the previous studies due to the absence of a meta-analysis of stripe rust resistance loci in wheat. The establishment of such a framework would greatly enhance the validation and identification of loci associated with stripe rust resistance, particularly in GWAS studies.
Our study applied an LD based haplotype approach to discover loci associated with resistance to Pst. Until now, only one haplotype-based GWAS for stripe rust resistance has been reported (Wu et al., 2021). Previously, we used a haplotype-GWAS approach in SYN-DERs to identify the loci associated with drought adaptability (Afzal et al., 2019). The results confirmed that haplotype-GWAS was an effective strategy to increase the power of GWAS experiments. Here, we showed that haplotype-GWAS identified 9 out of 13 trait-associated loci where individual SNPs were ineffective. This was because haplotypes containing a group of closely linked SNP markers can increase the level of polymorphisms and overcome the limitation of using single SNP markers by creating more combinations (haplotypes). Several haplotypes associated with phenotypes in our study were not identified by SNP-GWAS and this could be due to many factors, including patterns of LD in the population, marker density, and the genetic architecture of the trait. The haplotype on chr6B (Figures 7A–C) associated with ARP was also identified by SNP-GWAS and is likely to be a new locus. Similarly, a haplotype consisting of nine SNPs on chr2B at 6.2 Mb (Figures 7D–F) was not identified by SNP-GWAS, and Hap-II, which provided a high level of APR was present in 83 accessions. Several genes and QTL have been identified on chr2B including Yr32, Yr43, Yr44, Yr53, Yr72, Qyr.cim.2BS2,3, and many more (Supplementary Table 3). However, none of these genes or QTL were located at the position of the haploblock as identified in this study, thus, it could be a new locus. Another haplotype on chr1A was in the proximity of QTL Qyr.nwafu-1AL at ∼587 Mb, which was previously reported using 90K and 660K markers. However, no major gene has been identified in this region. In conclusion, haplotype-GWAS proved to be a useful approach in combination with SNP-GWAS to improve the discovery of resistance loci.
The transition from phenotypic selection to marker-assisted selection, and now genome-wide selection, will allow breeders to improve the selection decision during the early filial generations. However, the success of genomic selection depends on several factors such as the heritability of the trait, phenotypic variation explained by markers, and appropriate genomic prediction models (Ali et al., 2020). Genomic prediction resulted in an accuracy of up to 85% for APR at ISB.16, although predictions at other locations were less accurate. Prediction accuracies were low to moderate for the three other environments using the 90K SNP array but higher for GBS markers. The reason for low prediction accuracies can be attributed to smaller population sizes and unrelated genotypes. Recently, the prediction accuracy for stripe rust resistance in wheat landraces from Afghanistan was observed to be between 0.33 to 0.38 (Tehseen et al., 2021). Among the prediction models used, GBLUP and BayesB were the most effective, while EN was the least. The results in this study supported previous genomic prediction studies, where GBLUP and similar models predicted the disease resistance more accurately than other models (Avni et al., 2017; Juliana et al., 2017; Tehseen et al., 2021).
There is an ongoing need to identify new sources of resistance to Pst. The SYN-DERs provide valuable genetic resources for wheat improvement because they have high breeding value and are derived from primary synthetic hexaploidy wheats with D-genome contribution from Ae. Tauschii. Thus, SYN-DERs can be used to enhance the diversity of the D-genome in modern bread wheat but also the diversity of the A and B genomes because the synthetic wheats carry introgressions from durum wheat. More than 65 loci were identified in this study, which represent potentially important genes for race-specific and broad-spectrum resistance to stripe rust. Haplotype-GWAS should be a routine GWAS analytical approach to extend the discovery of genetic loci associated with phenotypes. The novel loci for resistance to stripe rust identified by SNP, and haplotype GWAS provide an arsenal of new alleles for resistance breeding. The SNP markers with large phenotypic effects for both all-stage resistance and APR can be converted to KASP or STARP markers for use in marker-assisted pre-breeding and breeding programs.
The datasets presented in this study can be found in online repositories. The names of the repository/repositories and accession number(s) can be found in the article/Supplementary Material.
ZM and AA performed field experiments. JM and MF performed the seedling experiment. AR, ZH, FO, and LH designed the experiment. RT conducted the 90K SNP genotyping. JP performed the GBS experiment. MA, AR, and KM analyzed the data. ZM, KM, and AR wrote the manuscript. All authors contributed to the article and approved the submitted version.
The authors declare that the research was conducted in the absence of any commercial or financial relationships that could be construed as a potential conflict of interest.
All claims expressed in this article are solely those of the authors and do not necessarily represent those of their affiliated organizations, or those of the publisher, the editors and the reviewers. Any product that may be evaluated in this article, or claim that may be made by its manufacturer, is not guaranteed or endorsed by the publisher.
We acknowledge Pakistan Science Foundation (PSF) for financial support under PSF-NSFC III/Agr/C-QAU (16). We also acknowledge the National Natural Science Foundation of China (NSFC) for financial support under “Research Fund for International Young Scientist” (31950410563).
The Supplementary Material for this article can be found online at: https://www.frontiersin.org/articles/10.3389/fpls.2022.788593/full#supplementary-material
Afzal, F., Li, H., Gul, A., Subhani, A., Ali, A., Mujeeb-Kazi, A., et al. (2019). Genome-Wide Analyses Reveal Footprints of Divergent Selection and Drought Adaptive Traits in Synthetic-Derived Wheats. G3 9:1957. doi: 10.1534/g3.119.400010
Ali, M., Zhang, Y., Rasheed, A., Wang, J., and Zhang, L. (2020). Genomic Prediction for Grain Yield and Yield-Related Traits in Chinese Winter Wheat. Internat. J. Mole. Sci. 21:1342. doi: 10.3390/ijms21041342
Aoun, M., Rouse, M. N., Kolmer, J. A., Kumar, A., and Elias, E. M. (2021). Genome-Wide Association Studies Reveal All-Stage Rust Resistance Loci in Elite Durum Wheat Genotypes. Front. Plant Sci. 12:594. doi: 10.3389/fpls.2021.640739
Avni, R., Nave, M., Barad, O., Baruch, K., Twardziok, S. O., Gundlach, H., et al. (2017). Wild emmer genome architecture and diversity elucidate wheat evolution and domestication. Science 357, 93–97. doi: 10.1126/science.aan0032
Azizinia, S., Bariana, H., Kolmer, J., Pasam, R., Bhavani, S., Chhetri, M., et al. (2020). Genomic prediction of rust resistance in tetraploid wheat under field and controlled environment conditions. Agronomy 10:1843.
Babiker, E. M., Gordon, T. C., Chao, S., Newcomb, M., Rouse, M. N., Jin, Y., et al. (2015). Mapping resistance to the Ug99 race group of the stem rust pathogen in a spring wheat landrace. Theoret. Appl. Genset. 128, 605–612. doi: 10.1007/s00122-015-2456-6
Bassi, F. M., Bentley, A. R., Charmet, G., Ortiz, R., and Crossa, J. (2016). Breeding schemes for the implementation of genomic selection in wheat (Triticum spp.). Plant Sci. 242, 23–36. doi: 10.1016/j.plantsci.2015.08.021
Bhatta, M., Morgounov, A., Belamkar, V., Wegulo, N. S., Dababat, A. A., Erginbas-Orakci, G., et al. (2019). Genome-Wide Association Study for Multiple Biotic Stress Resistance in Synthetic Hexaploid Wheat. Internat. J. Mole. Sci. 2019:20. doi: 10.3390/ijms20153667
Bulli, P., Zhang, J., Chao, S., Chen, X., and Pumphrey, M. (2016). Genetic Architecture of Resistance to Stripe Rust in a Global Winter Wheat Germplasm Collection. G3 6:2237. doi: 10.1534/g3.116.028407
Chen, X. M. (2007). Challenges and solutions for stripe rust control in the United States. Austral. J. Agricult. Res. 58, 648–655.
Cox, T. S., Sears, R. G., Bequette, R. K., and Martin, T. J. (1995). Germplasm Enhancement in Winter-Wheat X Triticum-Tauschii Backcross Populations. Crop Sci. 35, 913–919.
Crossa, J., Jarquín, D., Franco, J., Pérez-Rodríguez, P., Burgueño, J., Saint-Pierre, C., et al. (2016). Genomic Prediction of Gene Bank Wheat Landraces. G3 6, 1819–1834. doi: 10.1534/g3.116.029637
Daetwyler, H. D., Bansal, U. K., Bariana, H. S., Hayden, M. J., and Hayes, B. J. (2014). Genomic prediction for rust resistance in diverse wheat landraces. Theoret. Appl. Genet. 127, 1795–1803. doi: 10.1007/s00122-014-2341-8
Daetwyler, H. D., Villanueva, B., and Woolliams, J. A. (2008). Accuracy of predicting the genetic risk of disease using a genome-wide approach. PLoS One 3:e3395. doi: 10.1371/journal.pone.0003395
Dreisigacker, S., Tiwari, R., and Sheoran, S. (2013). Laboratory manual: ICAR-CIMMYT molecular breeding course in wheat. Haryana: Directorate of Wheat Research Karnal, India.
Duveiller, E., Singh, R. P., and Nicol, J. M. (2007). The challenges of maintaining wheat productivity: pests, diseases, and potential epidemics. Euphytica 157, 417–430.
Endelman, J. B. (2011). Ridge regression and other kernels for genomic selection with R package rrBLUP. Plant Genome 4, 250–255.
Friedman, J., Hastie, T., and Tibshirani, R. (2010). Regularization paths for generalized linear models via coordinate descent. J. Stat. Softw. 33:1.
Gabriel, S. B., Schaffner, S. F., Nguyen, H., Moore, J. M., Roy, J., Blumenstiel, B., et al. (2002). The Structure of Haplotype Blocks in the Human Genome. Science 296:2225. doi: 10.1126/science.1069424
Godoy, J. G., Rynearson, S., Chen, X., and Pumphrey, M. (2017). Genome-Wide Association Mapping of Loci for Resistance to Stripe Rust in North American Elite Spring Wheat Germplasm. Phytopathology 108, 234–245. doi: 10.1094/PHYTO-06-17-0195-R
Habier, D., Fernando, R. L., and Garrick, D. J. (2013). Genomic BLUP Decoded: A Look into the Black Box of Genomic Prediction. Genetics 194:597. doi: 10.1534/genetics.113.152207
Halloran, G. M., Ogbonnaya, F. C., and Lagudah, E. S. (2008). Triticum (Aegilops) tauschii in the natural and artificial synthesis of hexaploid wheat. Austral. J. Agricult. Res. 59, 475–490. doi: 10.1111/j.1365-313X.2011.04667.x
He, J., Meng, S., Zhao, T., Xing, G., Yang, S., Li, Y., et al. (2017). An innovative procedure of genome-wide association analysis fits studies on germplasm population and plant breeding. Theoret. Appl. Genet. 130, 2327–2343. doi: 10.1007/s00122-017-2962-9
Huang, X., and Han, B. (2014). Natural variations and genome-wide association studies in crop plants. Annu. Rev. Plant Biol. 65, 531–551. doi: 10.1146/annurev-arplant-050213-035715
Jighly, A., Oyiga, B. C., Makdis, F., Nazari, K., Youssef, O., Tadesse, W., et al. (2015). Genome-wide DArT and SNP scan for QTL associated with resistance to stripe rust (Puccinia striiformis f. sp. tritici) in elite ICARDA wheat (Triticumaestivum L.) germplasm. Theoret. Appl. Genet. 128, 1277–1295. doi: 10.1007/s00122-015-2504-2
Jordan, K. W., Wang, S., Lun, Y., Gardiner, L.-J., MacLachlan, R., Hucl, P., et al. (2015). A haplotype map of allohexaploid wheat reveals distinct patterns of selection on homoeologous genomes. Genome Biol. 16:48. doi: 10.1186/s13059-015-0606-4
Juliana, P., Singh, R. P., Singh, P. K., Crossa, J., Huerta-Espino, J., Lan, C., et al. (2017). Genomic and pedigree-based prediction for leaf, stem, and stripe rust resistance in wheat. Theoret. Appl. Genet. 130, 1415–1430. doi: 10.1007/s00122-017-2897-1
Kankwatsa, P., Singh, D., Thomson, P. C., Babiker, E. M., Bonman, J. M., Newcomb, M., et al. (2017). Characterization and genome-wide association mapping of resistance to leaf rust, stem rust and stripe rust in a geographically diverse collection of spring wheat landraces. Mole. Breed. 37:113.
Karatzoglou, A., Smola, A., Hornik, K., Karatzoglou, M. A., SparseM, S., and Yes, L. (2007). The kernlab package. Kernel-Based Machine Learning Lab. R package version 0.9.-22. Available online: https://cran.r-project.org/web/packages/kernlab (accessed on 4 November 2015).
Ledesma-Ramírez, L., Solís-Moya, E., Iturriaga, G., Sehgal, D., Reyes-Valdes, M. H., Montero-Tavera, V., et al. (2019). GWAS to Identify Genetic Loci for Resistance to Yellow Rust in Wheat Pre-Breeding Lines Derived From Diverse Exotic Crosses. Front. Plant Sci. 2019:10. doi: 10.3389/fpls.2019.01390
Line, R. F., and Qayoum, A. (1992). Virulence, aggressiveness, evolution and distribution of races of Puccinia striiformis (the cause of stripe rust of wheat) in North America, 1968-87. Hyderabad: Dept. of Agriculture, Agricultural Research Service.
Liu, W., Maccaferri, M., Rynearson, S., Letta, T., Zegeye, H., Tuberosa, R., et al. (2017c). Novel Sources of Stripe Rust Resistance Identified by Genome-Wide Association Mapping in Ethiopian Durum Wheat (Triticum turgidum ssp. durum). Front. Plant Sci. 2017:8. doi: 10.3389/fpls.2017.00774
Liu, W., Maccaferri, M., Chen, X., Laghetti, G., Pignone, D., Pumphrey, M., et al. (2017b). Genome-wide association mapping reveals a rich genetic architecture of stripe rust resistance loci in emmer wheat (Triticum turgidum ssp. dicoccum). Theoret. Appl. Genet. 130, 2249–2270. doi: 10.1007/s00122-017-2957-6
Liu, W., Maccaferri, M., Bulli, P., Rynearson, S., Tuberosa, R., Chen, X., et al. (2017a). Genome-wide association mapping for seedling and field resistance to Puccinia striiformis f. sp. tritici in elite durum wheat. Theoret. Appl. Genet. 130, 649–667. doi: 10.1007/s00122-016-2841-9
Liu, W., Naruoka, Y., Miller, K., Garland-Campbell, K. A., and Carter, A. H. (2018). Characterizing and Validating Stripe Rust Resistance Loci in US Pacific Northwest Winter Wheat Accessions (Triticum aestivum L.) by Genome-wide Association and Linkage Mapping. Plant Genome 2018:11. doi: 10.3835/plantgenome2017.10.0087
Long, L., Yao, F., Yu, C., Ye, X., Cheng, Y., Wang, Y., et al. (2019). Genome-Wide Association Study for Adult-Plant Resistance to Stripe Rust in Chinese Wheat Landraces (Triticum aestivum L.) From the Yellow and Huai River Valleys. Front. Plant Sci. 2019:10. doi: 10.3389/fpls.2019.00596
Maccaferri, M., Zhang, J., Bulli, P., Abate, Z., Chao, S., Cantu, D., et al. (2015). A Genome-Wide Association Study of Resistance to Stripe Rust (Puccinia striiformis f. sp. tritici) in a Worldwide Collection of Hexaploid Spring Wheat (Triticum aestivum L.). G3 5:449.
Manickavelu, A., Joukhadar, R., Jighly, A., Lan, C., Huerta-Espino, J., Stanikzai, A. S., et al. (2016). Genome wide association mapping of stripe rust resistance in Afghan wheat landraces. Plant Sci. 252, 222–229. doi: 10.1016/j.plantsci.2016.07.018
McIntosh, R., Dubcovsky, J., Rogers, W., Morris, C., Appels, R., and Xia, X. (2016). Catalogue of gene symbols for wheat: 2015–2016 supplement. Komugi Wheat Genet. Resour. Database.
McIntosh, R., Mu, J., Han, D., and Kang, Z. (2018). Wheat stripe rust resistance gene Yr24/Yr26: A retrospective review. Crop J. 6, 321–329. doi: 10.1016/j.cj.2018.02.001
McNeal, F. H., Konzak, C. F., Smith, E. P., Tate, W. S., and Russell, T. S. (1971). A Uniform System for Recording and Processing Cereal Research Data. Report No. REP-10904. El Batán: CIMMYT.
Meuwissen, T. H. E., Hayes, B. J., and Goddard, M. E. (2001). Prediction of total genetic value using genome-wide dense marker maps. Genetics 157, 1819–1829. doi: 10.1093/genetics/157.4.1819
Milus, E. A., Seyran, E., and McNew, R. (2006). Aggressiveness of Puccinia striiformis f. sp. tritici Isolates in the South-Central United States. Plant Dis. 90, 847–852. doi: 10.1094/PD-90-0847
Mujeeb-Kazi, A., Rosas, V., and Roldan, S. (1996). Conservation of the genetic variation of Triticum tauschii (Coss.) Schmalh. (Aegilops squarrosa auct. non L.) in synthetic hexaploid wheats (T. turgidum L. s.lat. x T. tauschii; 2n=6x=42, AABBDD) and its potential utilization for wheat improvement. Genet. Resourc. Crop Evol. 43, 129–134. doi: 10.1007/bf00126756
Muleta, K. T., Bulli, P., Rynearson, S., Chen, X., and Pumphrey, M. (2017a). Loci associated with resistance to stripe rust (Puccinia striiformis f. sp. tritici) in a core collection of spring wheat (Triticum aestivum). PLoS One 12:e0179087. doi: 10.1371/journal.pone.0179087
Muleta, K. T., Rouse, M. N., Rynearson, S., Chen, X., Buta, B. G., and Pumphrey, M. O. (2017b). Characterization of molecular diversity and genome-wide mapping of loci associated with resistance to stripe rust and stem rust in Ethiopian bread wheat accessions. BMC Plant Biol. 17:134. doi: 10.1186/s12870-017-1082-7
Naruoka, Y., Garland-Campbell, K. A., and Carter, A. H. (2015). Genome-wide association mapping for stripe rust (Puccinia striiformis F. sp. tritici) in US Pacific Northwest winter wheat (Triticum aesstivum L.). Theoret. Appl. Genet. 128, 1083–1101. doi: 10.1007/s00122-015-2492-2
Nordborg, M., and Weigel, D. (2008). Next-generatiosn genetics in plants. Nature 456:720. doi: 10.1038/nature07629
Ogbonnaya, F. C., Abdalla, O., Mujeeb-Kazi, A., Alvina, G. K., Xu, S. S., Gosman, N., et al. (2013). Synthetic hexaploids: harnessing species of the primary gene pool for wheat improvement. Plant Breed. Rev. 37, 35–122. doi: 10.1002/9781118497869.ch2
Ornella, L., Singh, S., Perez, P., Burgueño, J., Singh, R., Tapia, E., et al. (2012). Genomic prediction of genetic values for resistance to wheat rusts. Plant Genome 5, 136–148.s doi: 10.1007/s00122-017-2897-1
Pasam, R. K., Bansal, U., Daetwyler, H. D., Forrest, K. L., Wong, D., Petkowski, J., et al. (2017). Detection and validation of genomic regions associated with resistance to rust diseases in a worldwide hexaploid wheat landrace collection using BayesR and mixed linear model approaches. Theor. Appl. Genet. 130, 777–793. doi: 10.1007/s00122-016-2851-7
Pérez, P., and De, G. L. C. (2014). Genome-Wide Regression and Prediction with the BGLR Statistical Package. Genetics 198, 483–495.
Rasheed, A., Wen, W., Gao, F. M., Zhai, S., Jin, H., Liu, J. D., et al. (2016). Development and validation of KASP assays for functional genes underpinning key economic traits in wheat. Theor. Appl. Genet. 129, 1843–1860. doi: 10.1007/s00122-016-2743-x
Riaz, A., Athiyannan, N., Periyannan, S., Afanasenko, O., Mitrofanova, O., Aitken, E. A. B., et al. (2016). Mining Vavilov’s treasure chest of wheat diversity for adult plant resistance to Puccinia triticina. Plant Dis. 101, 317–323. doi: 10.1094/PDIS-05-16-0614-RE
Rutkoski, J. E., Poland, J. A., Singh, R. P., Huerta-Espino, J., Bhavani, S., Barbier, H., et al. (2014). Genomic Selection for Quantitative Adult Plant Stem Rust Resistance in Wheat. Plant Genome 2014:7.
Solh, M., Nazari, K., and Tadesse, W. and Wellings, C. (2012). “The growing threat of stripe rust worldwide,” In Borlaug Global Rust Initiative (BGRI) conference (Beijing), 1-4.
Tamba, C. L., and Zhang, Y.-M. (2018). A fast mrMLM algorithm for multi-locus genome-wide association studies. bioRxiv 2018:341784.
Tehseen, M. M., Kehel, Z., Sansaloni, C. P., Lopes, M. D., Amri, A., Kurtulus, E., et al. (2021). Comparison of Genomic Prediction Methods for Yellow, Stem, and Leaf Rust Resistance in Wheat Landraces from Afghanistan. Plants 10:558. doi: 10.3390/plants10030558
Turner, S. D. (2014). qqman: an R package for visualizing GWAS results using QQ and manhattan plots. Biorxiv, 005165
Vanraden, P. M. (2008). Efficient methods to compute genomic predictions. J. Dairy Sci. 91, 4414–4423. doi: 10.3168/jds.2007-0980
Wang, S. C., Wong, D. B., Forrest, K., Allen, A., Chao, S. M., Huang, B. E., et al. (2014). Characterization of polyploid wheat genomic diversity using a high-density 90 000 single snucleotide polymorphism array. Plant Biotechnol. J. 12, 787–796. doi: 10.1111/pbi.12183
Wang, S.-B., Feng, J.-Y., Ren, W.-L., Huang, B., Zhou, L., Wen, Y.-J., et al. (2016). Improving power and accuracy of genome-wide association studies via a multi-locus mixed linear model methodology. Sci. Rep. 6:19444. doi: 10.1038/srep19444
Wellings, C. R. (2011). Global status of stripe rust: a review of historical and current threats. Euphytica 179, 129–141. doi: 10.1007/s10681-011-0360-y
Wu, J., Yu, R., Wang, H., Zhou, C. E., Huang, S., Jiao, H., et al. (2021). A large-scale genomic association analysis identifies the candidate causal genes conferring stripe rust resistance under multiple field environments. Plant Biotechnol. J. 19, 177–191. doi: 10.1111/pbi.13452
Yao, F., Long, L., Wang, Y., Duan, L., Zhao, X., Jiang, Y., et al. (2020). Population structure and genetic basis of the stripe rust resistance of 140 Chinese wheat landraces revealed by a sgenome-wide association study. Plant Sci. 301:110688. doi: 10.1016/j.plantsci.2020.110688
Zegeye, H., Rasheed, A., Makdis, F., Badebo, A., and Ogbonnaya, F. C. (2014). Genome-wide association mapping for seedling and adult plant resistance to stripe rust in synthetic hexaploid wheat. PLoS One 9:e105593. doi: 10.1371/journal.pone.0105593
Keywords: GWAS, GBS, stripe rust (Puccinia striiformis Westend), synthetic hexaploid derived wheat, haplotype GWAS
Citation: Mahmood Z, Ali M, Mirza JI, Fayyaz M, Majeed K, Naeem MK, Aziz A, Trethowan R, Ogbonnaya FC, Poland J, Quraishi UM, Hickey LT, Rasheed A and He Z (2022) Genome-Wide Association and Genomic Prediction for Stripe Rust Resistance in Synthetic-Derived Wheats. Front. Plant Sci. 13:788593. doi: 10.3389/fpls.2022.788593
Received: 02 October 2021; Accepted: 07 January 2022;
Published: 24 February 2022.
Edited by:
Xue-Feng Ma, Forage Genetics International, United StatesReviewed by:
Frank Maulana, Louisiana State University Agricultural Center, United StatesCopyright © 2022 Mahmood, Ali, Mirza, Fayyaz, Majeed, Naeem, Aziz, Trethowan, Ogbonnaya, Poland, Quraishi, Hickey, Rasheed and He. This is an open-access article distributed under the terms of the Creative Commons Attribution License (CC BY). The use, distribution or reproduction in other forums is permitted, provided the original author(s) and the copyright owner(s) are credited and that the original publication in this journal is cited, in accordance with accepted academic practice. No use, distribution or reproduction is permitted which does not comply with these terms.
*Correspondence: Awais Rasheed, YXJhc2hlZWRAcWF1LmVkdS5waw==; Zhonghu He, ei5oZUBjZ2lhci5vcmc=
Disclaimer: All claims expressed in this article are solely those of the authors and do not necessarily represent those of their affiliated organizations, or those of the publisher, the editors and the reviewers. Any product that may be evaluated in this article or claim that may be made by its manufacturer is not guaranteed or endorsed by the publisher.
Research integrity at Frontiers
Learn more about the work of our research integrity team to safeguard the quality of each article we publish.