
94% of researchers rate our articles as excellent or good
Learn more about the work of our research integrity team to safeguard the quality of each article we publish.
Find out more
ORIGINAL RESEARCH article
Front. Plant Sci., 30 May 2022
Sec. Functional Plant Ecology
Volume 13 - 2022 | https://doi.org/10.3389/fpls.2022.721064
 Jakub Hejtmánek1
 Jan Stejskal1*
 Jaroslav Čepl1Zuzana Lhotáková2
 Jiří Korecký1Anna Krejzková1Jakub Dvořák1
 Salvador A. Gezan3
Norway spruce has a wide natural distribution range, harboring substantial physiological and genetic variation. There are three altitudinal ecotypes described in this species. Each ecotype has been shaped by natural selection and retains morphological and physiological characteristics. Foliar spectral reflectance is readily used in evaluating the physiological status of crops and forest ecosystems. However, underlying genetics of foliar spectral reflectance and pigment content in forest trees has rarely been investigated. We assessed the reflectance in a clonal bank comprising three ecotypes in two dates covering different vegetation season conditions. Significant seasonal differences in spectral reflectance among Norway spruce ecotypes were manifested in a wide-ranging reflectance spectrum. We estimated significant heritable variation and uncovered phenotypic and genetic correlations among growth and physiological traits through bivariate linear models utilizing spatial corrections. We confirmed the relative importance of the red edge within the context of the study site’s ecotypic variation. When interpreting these findings, growth traits such as height, diameter, crown length, and crown height allowed us to estimate variable correlations across the reflectance spectrum, peaking in most cases in wavelengths connected to water content in plant tissues. Finally, significant differences among ecotypes in reflectance and other correlated traits were detected.
Norway spruce (Picea abies L. Karst) is one of Europe’s most dominant tree species of forest ecosystems. It is the most common coniferous tree species of European forests and has a wide nature range from the French Alps (5°E) to the Ural Mountains (155°E; Oleksyn et al., 1998). The altitudinal range is also very wide: Norway spruce original occurrence stretches from the sea level 0–2,300 m in the Italian Alps (Jansson et al., 2013). In recent years, the climate has changed rapidly, impacting the microclimate in forests and the water regime in general. The average annual temperature also has risen slightly (Karlsson et al., 1997; Wallin et al., 2002). It is well known that Norway spruce is relatively sensitive, especially to nutrient deficiencies and soil water content. Thus, it is not surprising that recent years’ observations show drought stress impacts on P. abies (Ditmarová et al., 2010). Some consequences of climate change, such as increased temperature and acute drought events, cause a global problem with bark beetles in forests. Bark beetles are the most devastating biotic agents in many forest ecosystems (Anderegg et al., 2015). The higher frequency of dry summers and warmer temperatures is an important predisposing factor triggering beetles’ outbreaks and affecting population dynamics (Jactel et al., 2012; Weed et al., 2013; Hart et al., 2014).
Picea abies is a polymorphic tree species, and its taxonomic variation is a highly discussed topic (Tutin et al., 1964). There are two main taxonomic types: P. abies var.abies—European spruce and Picea abies var.obovata—Siberian spruce. These two types have significant genetic similarities, suggesting that they belong to the same species (Krutovskii and Bergmann, 1995). Morgenstern (1996) described three morphological forms (ecotypes) of Norway spruce. These forms are low-elevation (naturally growing in areas up to 500 m), medium-elevation, and high-elevation (above 1,100 m a.s.l.). The most significant difference lies in the crown morphology. Low-elevation (acuminata) has a wide crown with long branches, while high-elevation (obovata) has a narrow crown with short branches pointing down. Genetic differences among the putative ecotypes were recently confirmed by Korecký et al. (2021). There are emerging pieces of evidence that some physiological traits also differ among the ecotypes, Tomášková et al. (2021) found that parameters describing structural indicators of PSII in the thylakoid membrane (calculated from the OJIP test) distinguished obovata ecotype. Androsiuk et al. (2013) and Farjon and Filer (2013) also reported specific adaptations for the given geographic area, climatic area, and forest vegetation zone for each ecotypic form. Almost every investigated trait is closely connected to local conditions. Norway spruce is relatively sensitive to drought stress, and this stress is related to adaptations to climate changes (Van der Maaten-Theunissen et al., 2013). High variation in drought stress within Norway spruce populations across vegetation zones was previously reported (Trujillo-Moya et al., 2018). Recently, a significant variation among Norway spruce ecotypes was found in dehydrin gene expression (Čepl et al., 2020). The most notable difference between acuminata and obovata ecotype was found in specific dehydrin PaCAP1 expression. PaDhn4,5 and PaDhn6 dehydrins genes strongly correlate with a climatic variable such as temperature and precipitation.
In general, water deficit is an essential source of abiotic stress with complex effects on plants, including many physiological and biochemical responses, leading to inhibited growth or even mortality (Farooq et al., 2009; Harb et al., 2010). The seedlings experiments with Norway spruce showed a significant decrease in total chlorophyll concentration during advanced stages of dehydration (Ditmarová et al., 2010). These results demonstrate that the drought response of P. abies causes many biochemical changes, and the shifts in selected compounds’ content can be used as an indicator for water stress (Ditmarová et al., 2010). Degradation and content of chlorophylls and proline levels could be used as biomarkers for an early assessment of water stress of Norway spruce. Specific populations are more sensitive to water stress, which indicates some tolerance to osmotic stress during seed germination (Schiop et al., 2017). All photosynthetic pigments, mostly carotenoids, play some role in drought tolerance (including oxidative damage caused by water deficit). Thus, increased carotenoid content is an important indicator of water stress tolerance (Jaleel et al., 2009).
Hyperspectral reflectance of foliage or canopy reveals information connected to its biochemical composition, water content, and structure and thus to plants’ health status (Campbell et al., 2004; Kokaly et al., 2009; Ustin et al., 2009). This valuable information, often hidden from human eyes, has been utilized in many research fields in past decades (Goetz, 2009; Masaitis et al., 2013). Reflectance features in the visible (VIS) part of the electromagnetic spectrum are primarily determined by photosynthetic pigments’ content (Gates et al., 1965). The VIS spectral region is most usually used to evaluate leaf and canopy phenology (Junker and Ensminger, 2016; Yang et al., 2016) and physiological status (Carter, 1993; Mišurec et al., 2012; Einzmann et al., 2021). The sharp increase in reflectance around 700 nm due to the strong chlorophyll absorption band centered around 680 nm coupled with a scattering of near-infrared wavelengths within the leaf is known as “the red edge” (Curran et al., 1990; Gitelson et al., 1996). The red edge (RE) spectral region is also often used for vegetation stress detection. The inflection point of the reflectance curve within the red edge may shift to lower wavelengths due to a decrease of chlorophyll content in leaves or needles (Rock et al., 1988; Curran et al., 1990). The environmental stress factors causing this so-called blue shift of inflection point could be various: worsening of the tree physiological status due to air pollution (Campbell et al., 2004), decreased tree vitality after artificial ring-barking (girdling), and bark beetle infestation (Einzmann et al., 2021) and many others (viral infection, trace metal accumulation; Rathod et al., 2018; Golhani et al., 2019). One crucial question is whether the reflectance in this biologically important spectral region exhibits a similar shift across the studied ecotypes and if this shift can also be observed across the vegetation season. The position of the red edge inflection point is sensitive to environmental factors, but it may also be genetically conditioned. Heritable variation in the red edge was described within the Scots pine population by Čepl et al. (2018). The reflectance in the near-infrared spectral region provides information about leaf structure at the leaf level (Gates et al., 1965; Slaton et al., 2001) and the water content at leaf and canopy level (Kokaly et al., 2009). Vegetation indices (VIs) are various spectral transformations that reduce raw multivariate spectral data to single index values (Jiang et al., 2018; Verrelst et al., 2019). Plenty of VIs was defined1 for leaf and canopy reflectance level. According to the reflectance wavelengths they are computed from, the VIs may be used for retrieval of several leaf traits—usually chlorophylls (Croft et al., 2014; Neuwirthová et al., 2021), anthocyanins (Gitelson et al., 2009), nitrogen (Berger et al., 2020), lignin (Serrano et al., 2002), and water content (Hunt and Rock, 1989; Peñuelas et al., 1993). Regarding population variability in hyperspectral reflectance (Cavender-Bares et al., 2016), showed that multivariate spectral information could distinguish populations of the same species more accurately than individual leaf functional traits.
Our study investigates the differences in the shoot hyperspectral reflectance among three Norway spruce ecotypes and how this variation manifests in a wide-ranging reflectance spectrum. We hypothesized that shoot spectral signal would reflect ecotypes’ adaptation to the local environment of origin and thus allow us to distinguish the ecotypes even after acclimation to conditions of the common-garden experiment. We used the well-established vegetation indices not as simple predictors of given biophysical traits but as a trait that can be genetically determined. Traditionally, the spectral vegetation indices are constructed or pre-selected due to specific absorption features of biochemical compounds or structural traits connected to a stress reaction or health status. With this in mind, we chose heritable vegetation indices from the original candidate set contained within the R package hsdar (Lehnert et al., 2019). The heritable indices subsequently entered the bivariate analysis, which allowed us to estimate genetic correlations with other traits of interest. We estimated phenotypic and genetic correlations among growth and physiological traits to verify their complex relationship through bivariate models and spatial analysis. Subsequently, we examined phenotypic and genetic correlations of the established reflectance indices with growth traits and photosynthetic pigment content. In connection with the aims mentioned above, we confirmed the relative importance of the red edge within the context of the study site’s ecotypic variation. We observed that the phenotypic/genetic correlations vary across the reflectance spectrum, peaking mostly in wavelengths related to chlorophyll and water content in plant tissues.
This experiment comprises a unique clonal Norway spruce common-garden experiment established in the Czechia (N 49°56.37′, E 14°20.96′) in 1970. Vegetatively propagated material used for this experiment originates from several Czech Norway spruce populations. Grafted trees were planted as clonal rows. This trial is unique because it represents all the morphotypes of Norway spruce, which occur in this country. These morphological forms (putative ecotypes) retain some characteristic features, which correspond to their altitudinal origin. Genotypes of the low-elevation form (acuminata) originated from the altitude 360 m a.s.l., medium-elevation altitude form (europaea) from the altitude 770–775 m a.s.l, and the high-elevation form (obovata) from the altitude 1,145–1,175 m a.s.l. The exact geographical origin of the sampled ecotypes (grafting locations) is shown in Supplementary Figure 1.
This experimental trial is situated in low relief of 320–340 m a.s.l. It was established in 1970 (Šindelář, 1975). Bedrock constitutes clayey Algonkian phyllite slates with variously thick loess and sloping clay overlaps. The soils can be characterized as medium-deep cambisols in strongly skeletal bases, in places with signs of reduction processes. The upper horizons are clayey, the lower horizons heavier, silty clay. There is a lack of loess cover in areas, and the soils are generally richer in the skeleton (particles >2 mm). The average tree height on the plot (2020) was 20.6 m; sd = 2.95 m, and the average DBH was 33.1 cm; sd = 7.7 cm.
One branch (30 cm) per tree was sampled with telescopic pruning poles. We targeted needles from the crown’s southern exposure, 5–8 m above ground, corresponding to the transition or shaded crown part. Shoot samples were collected from 86 (87 in August) trees in two periods. The first one was realized on May 25th, 2020, and the second sampling was on August 18th, 2020. In May, the current year’s needles were not yet fully developed; therefore, the previous-year needles were collected for reflectance analysis. In August, the current year needles were already mature. However, in some trees, the terminal buds remained dormant, and thus the mixed sample of current and previous-year needles was taken for reflectance measurement and pigment analyses. The sampling procedure consisted of a random selection of replicated clones from three represented ecotypes, ensuring that we covered different microsites within the trial. All sampled trees retained their morphological characteristics (ecotypic appearance) correspondingly to their altitudinal origin. These two periods were chosen concerning actual climatic conditions, especially the measure of water stress of trees. The experimental layout and the highlighted sampled trees are shown in Supplementary Figure 1. In addition, we measured standard growth parameters such as tree height (m) and diameter in breast height (DBH; cm). Subsequently, we measured the bottom height of the vital crown (HC) and the overall length of the crown (LC) for each tree.
Climatic data for this study were obtained from the nearest meteorological station (Praha- Libuš). Ten kilometers from the test site. We reported the climatic data 14 days before sampling. Before the first sampling, the mean daily temperature was 12.4°C, and before the second sampling 22.6°C. Mean daily precipitation was almost the same at both times. Before the first measurement −409. mm/day and before the second measurement −483. mm/day. However, it must be noted that it was raining almost all day on the second sampling day. The long-term mean of precipitation in this area around Cukrák is 587 mm, and the mean annual temperature is 8,6°C (observed between the years 1980 and 2016).
Spectral reflectance information was obtained from needles as a bidirectional reflectance factor (BRF). Reflectance was measured between 350 and 2,500 nm by spectroradiometer ASD FieldSpec 4, which was attached to the contact probe (ASD Plant Probe) with the circular field of view of 133 m2 (d = 11 mm; Schaepman-Strub et al., 2006; Čepl et al., 2018). Spectral reflectance was normalized against a 99% Spectralon white reference panel to produce BRF for each measurement. The scan average on the FieldSpec was set to 15 to avoid foliage overheating, and the integration time was set to 136 ms (Eitel et al., 2006). From each sampled branch (by single tree), several (8–12) shoots with the needles still attached were placed in a Petri dish coated with a spectrally black coating (NEXTEL Velvet-Coating 811-21) with low reflectance, and it was scanned five times. The black surface was set on the samples’ background to eliminate background spectral noise from the surrounding environment. From these measurements, the median for each wavelength was calculated. Reflectance indices were computed using the R package hsdar (Lehnert et al., 2019). The reported indices were pre-selected based on their information value and the predicted heritability and calculated using the R package hsdar (Lehnert et al., 2019).
Needles were cut and inserted along with grinding balls into 2 ml tubes. The samples were freeze-dried by liquid nitrogen and ground for 5 min at 30 Hz in a Mixer Mill MM400 (Retsch technology, Haan, Germany). Freeze–drying and grinding were repeated till the material was powdery. Twenty five milligrams of the powder was weighed into a 2 ml microcentrifuge tube (Eppendorf, Hamburg, Germany), and 1 ml 80% (v/v) acetone and I mg of MgCO3 were added. The samples were vortexed for 30–60 s and then centrifuged (Eppendorf 5424R, Hamburg, Germany) at 13,500 rpm for 10 min. Acetone to 10 ml was added to the supernatant. The absorbance was measured at 646, 663, and 470 nm using a spectrophotometer (Hach Lange DR6000 UV–VIS, Dusseldorf, Germany). The pigment concentration in extracts was calculated according to Lichtenthaler (1987) equations and related to needle dry mass. As mentioned above, the pigment content was assessed only in the August sampling.
For statistical analysis, native functions of the R software version 3.5.0 (R Core Team, 2022) and the library ASReml for R version 4 (Butler et al., 2017) were used. A univariate linear mixed model was fitted to evaluate all traits of interest with the following terms:
where y corresponds to the data vector; μ is the overall mean effect; βx and βx are fixed effects associated with orthogonal polynomials of second-order; c is the clonal effect, with c ~ MVN(0, σ2cIc); e is the random vector of errors, with e ~ MVN(0, R). The letters 1, X, and Z designate a vector of ones and incidence matrices for associated fixed effects and random effects, and Ic is an identity matrix of order c. R is a matrix of variance–covariance of errors for each field position. Two forms of R matrix were evaluated, one considering independent errors, i.e., R = σ2In and another based on a separable first-order autoregressive process (AR1) in rows and columns, for which the R matrix is R = [AR1(pcol) ⊗ AR1(prow)]; where are the residual variance, and AR1(pcol) and AR1(prow) represent a first-order autoregressive correlation matrix. Several models were fitted, considering independent or autoregressive errors and with or without polynomial functions. The best model was selected based on likelihood ratio tests (LRT) and approximated F-tests (Isik et al., 2017).
Broad-sense heritability (H2) was estimated for each response variable based on the following formula: H2 = σ2c/(σ2c + σ2), where σ2c is the genetic variation attributed to represented clones; approximated standard errors were obtained using the Delta method.
We ran an extended bivariate model to estimate the additive correlation between particular traits based on stacking both traits. The model formulae used was:
where y corresponds to the data vector of stacked response; t is the fixed effect of trait; tβx and tβx are fixed effects of polynomials of second-order nested within trait; tc is the clonal effect nested within trait, with tc ~ MVN(0, Gc ⊗ Ic); u is the random vector of experimental units (trees), with u ~ MVN(0, σ2uIu); e is the random vector of errors, with e ~ MVN(0, R), where R is a block diagonal matrix with a separable first-order autoregressive process as described earlier for each of the traits. Also, Gc is a 2 × 2 variance–covariance matrix with clonal variances on the diagonal and a genetic covariance between traits on the off-diagonal (i.e., unstructured). The random effect u allows for specifying correlation between observations (i.e., across traits) that belong to the same tree.
There were significant differences (value of p < 0.05) in mean reflectance between the two samplings in May and August despite its restriction to several distinct regions, with major differences between 700 and 1,300 nm (NIR plateau). The biggest difference (nearly 5%) was found around 1,050 nm (Figure 1). There were wide regions of wavelengths, at which the reflectance in both respective months significantly differed based on the pairwise t-test. Regions with value of p < 0.05: 350–415, 667–668, 720–1,421, 1,604–1,657, 1,844–1,867, and 1,888–1,909. The biggest difference in reflectance was recorded between 720 and 1,421 nm, encompassing the NIR part of the spectra.
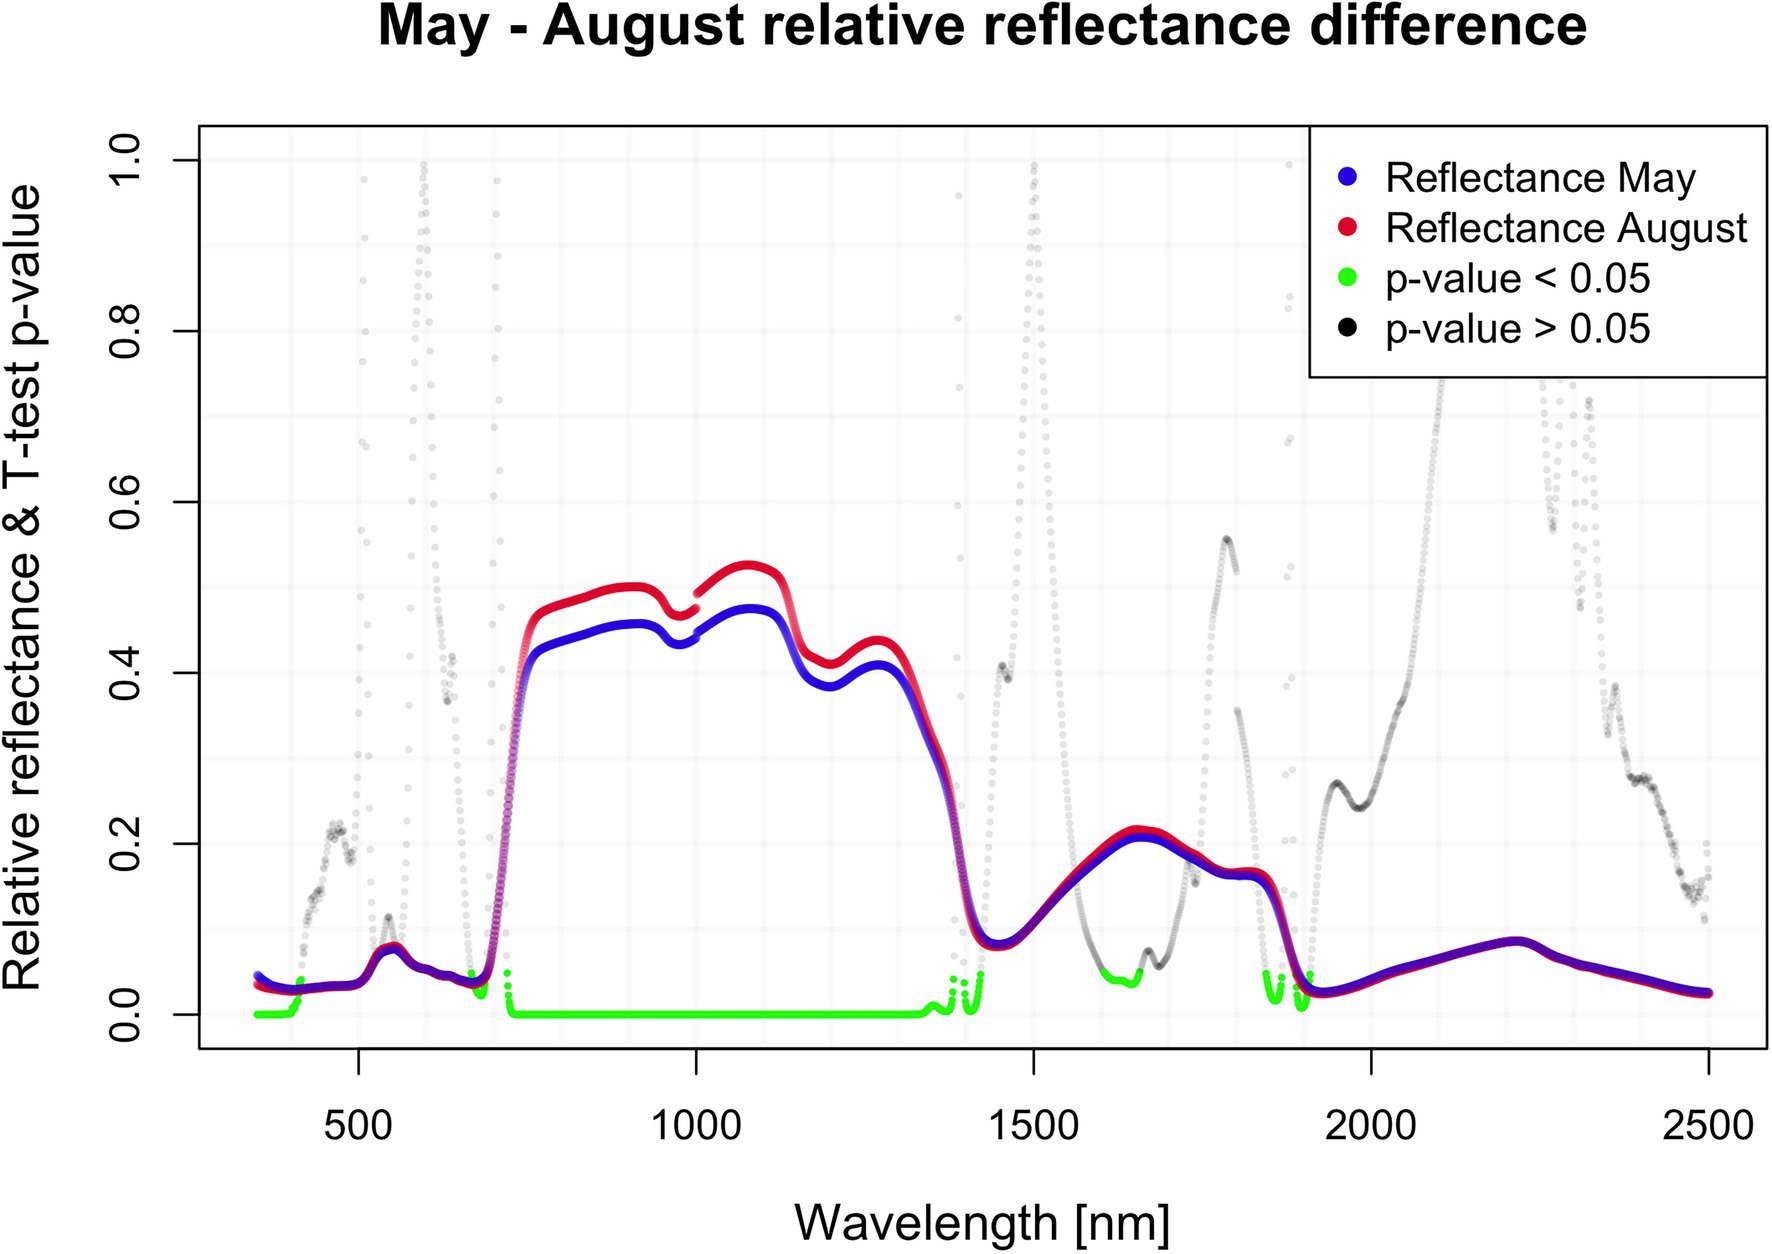
Figure 1. Seasonal difference in hyperspectral reflectance.
As verified by multiple comparisons (LSD: least square differences), there were significant (value of p < 0.05) differences among ecotypes in reflectance, although this was mostly restricted to specific parts of the spectrum. Differences were generally more pronounced within the second sampling period in August. However, the pairwise differences between ecotypes are month-specific (Figures 2, 3). To further illustrate the variation among ecotypes, we calculated the mean reflectance for each in May and August (Figure 4). The common differences between medium-elevation and high-elevation ecotypes occurred in the reflectance measured in both months. These pairwise differences were situated mostly within the VIS and RE spectral regions: green region (aka green bump) and red-edge in May (Figure 2); and blue and red region in August (Figure 3). Comparing spectral regions distinguishing medium-elevation and high-elevation ecotypes, the ranges of significant difference shifted towards lower wavelengths in August, In May, we found a significant difference in reflectance between the low-elevation and high-elevation ecotypes of Norway spruce, particularly between wavelength 600 and 700, including the red edge (Figure 2). In August, the differences between medium-elevation and high-elevation ecotypes were still present, however, in shorter wavelengths than in May (Figure 3). The low-elevation and high-elevation ecotypes did not show significant differences in reflectance in August. During the August sampling, we recorded a strongly significant difference between medium-elevation and low-elevation ecotypes in reflectance across the NIR and shortwave infrared (SWIR) spectrum (1,150–2,500 nm).
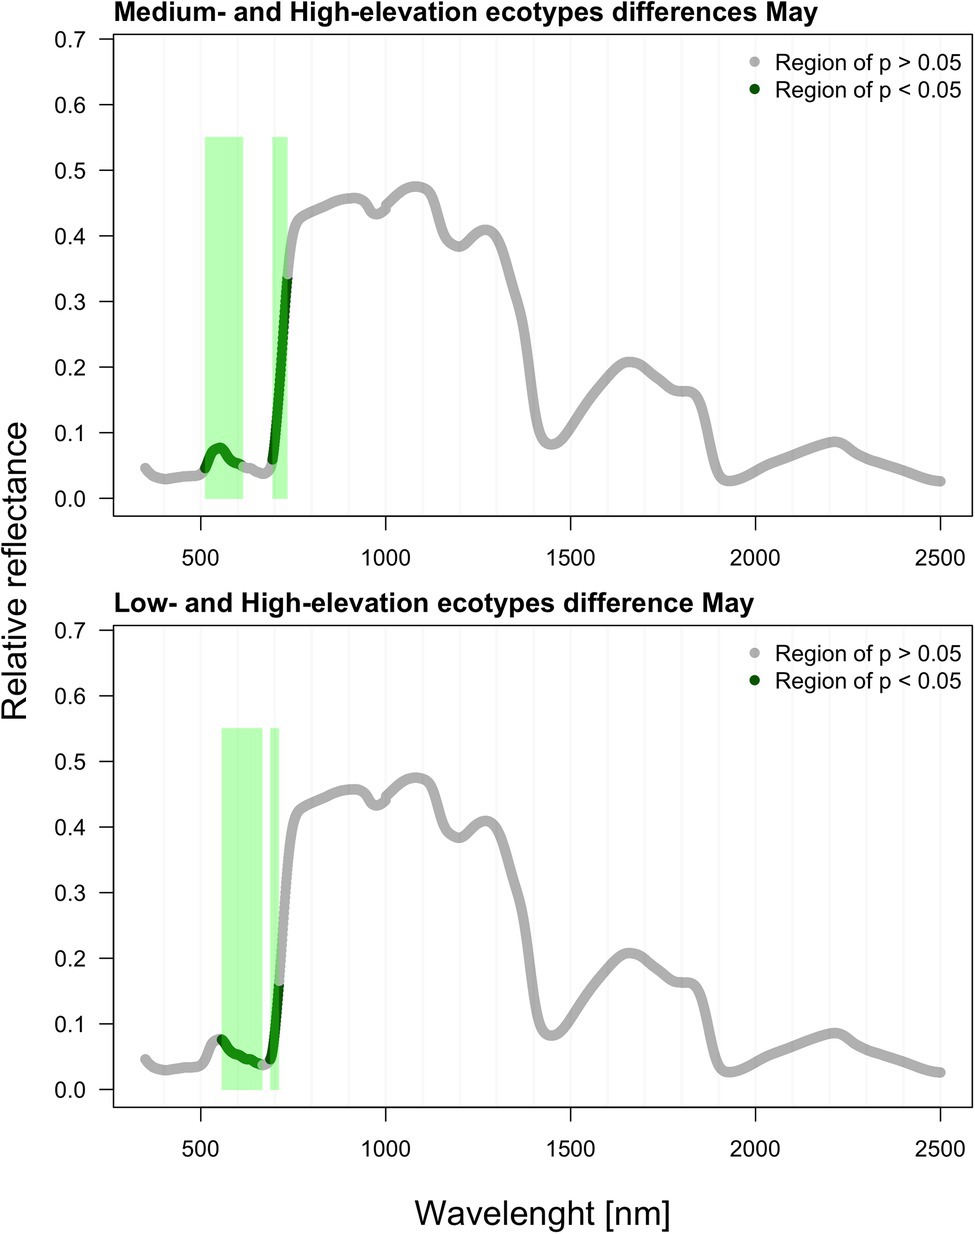
Figure 2. Differences among ecotypes in hyperspectral reflectance recorded in May.
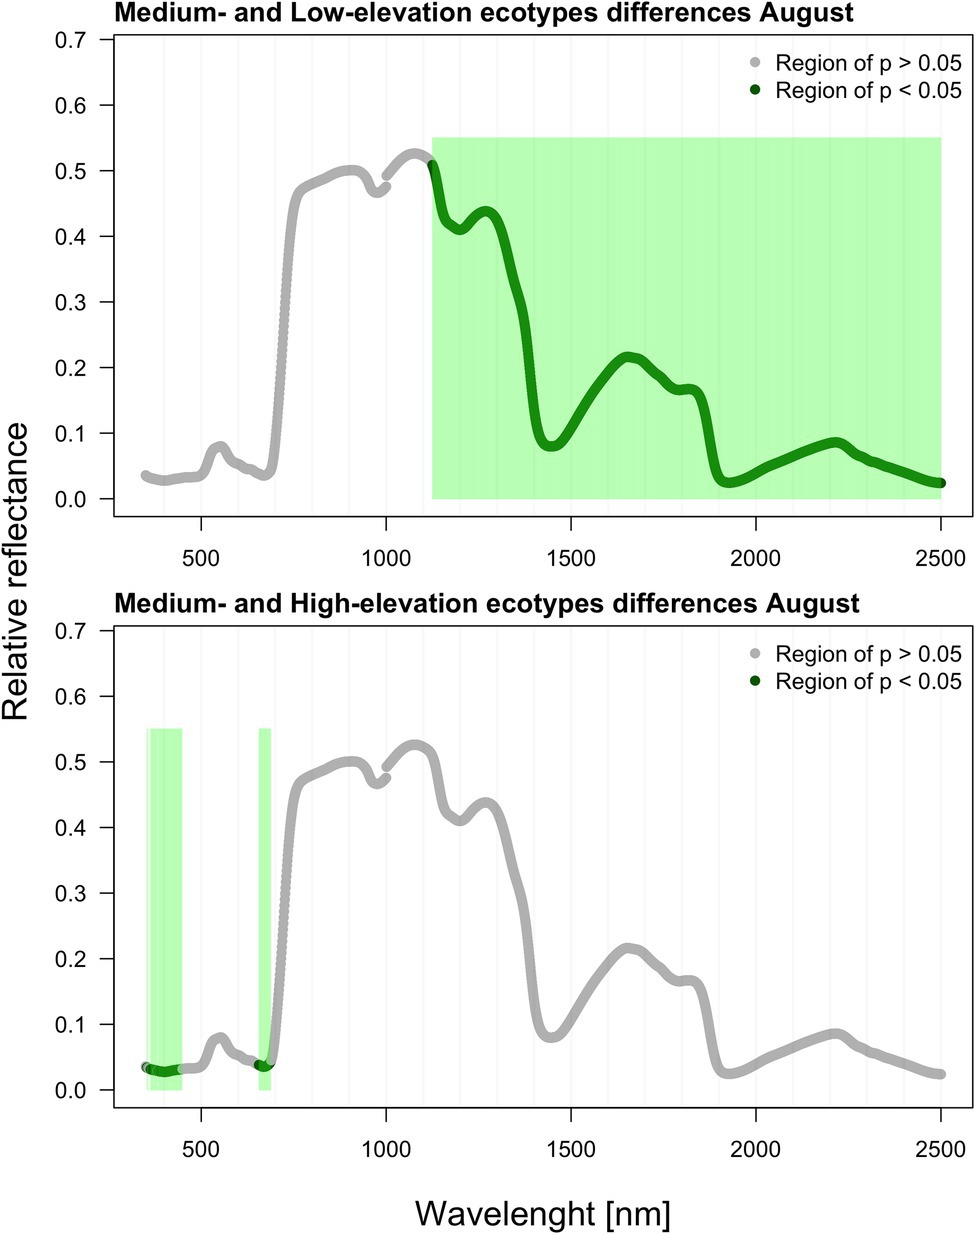
Figure 3. Differences among ecotypes in hyperspectral reflectance recorded in August.
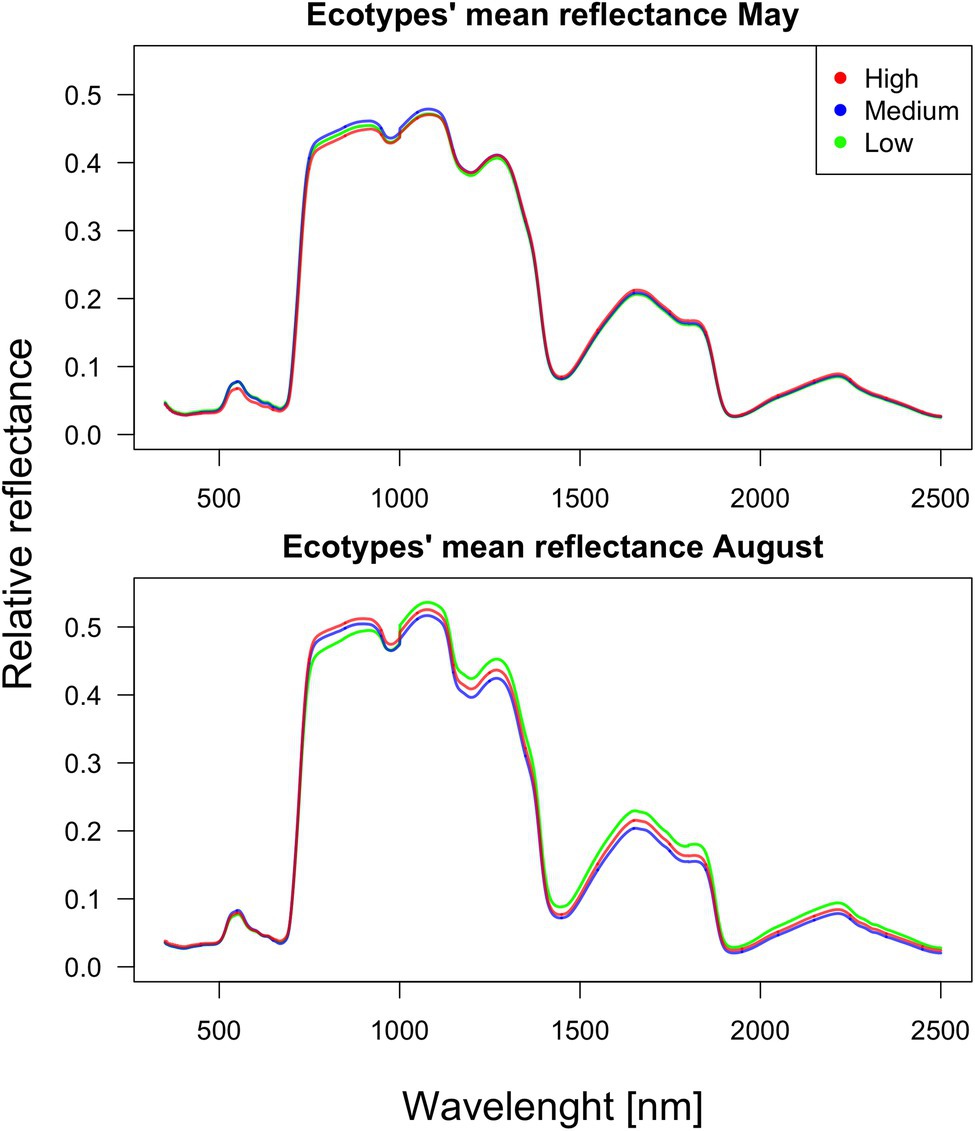
Figure 4. Mean reflectance for each ecotype in May and August.
The descriptive statistics for all studied parameters (including photosynthetic pigments and growth traits) are summarized in Table 1. The pairwise differences between ecotypes concerning all studied parameters are summarized in Table 2. We found a significant difference in ecotypes (medium vs. low-elevation) in all three pigments. It should be emphasized that the photosynthetic pigments were extracted only within the August sampling. Thus, the pairwise differences in pigment content are relevant only concerning the reflectance acquired in August. The ecotypes were also significantly different in total height and DBH. In this case, these significant differences were detected among both combinations with the high-elevation origin. The significant differences in pairwise combinations, manifested by the lowest value of ps, were in the crown length. In HC, medium elevation vs. high elevation was exactly on the verge of a significant difference (value of p = 0.055).
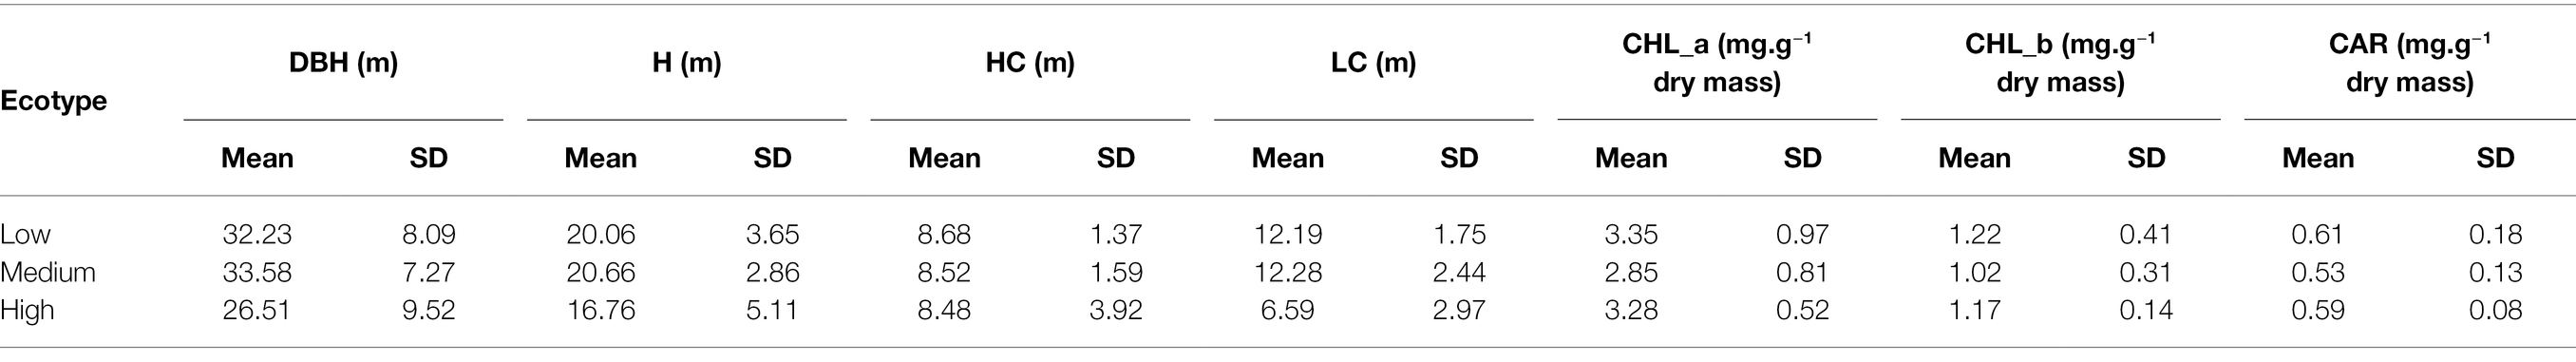
Table 1. Descriptive statistics in growth traits and pigment content in various Norway spruce ecotypes.
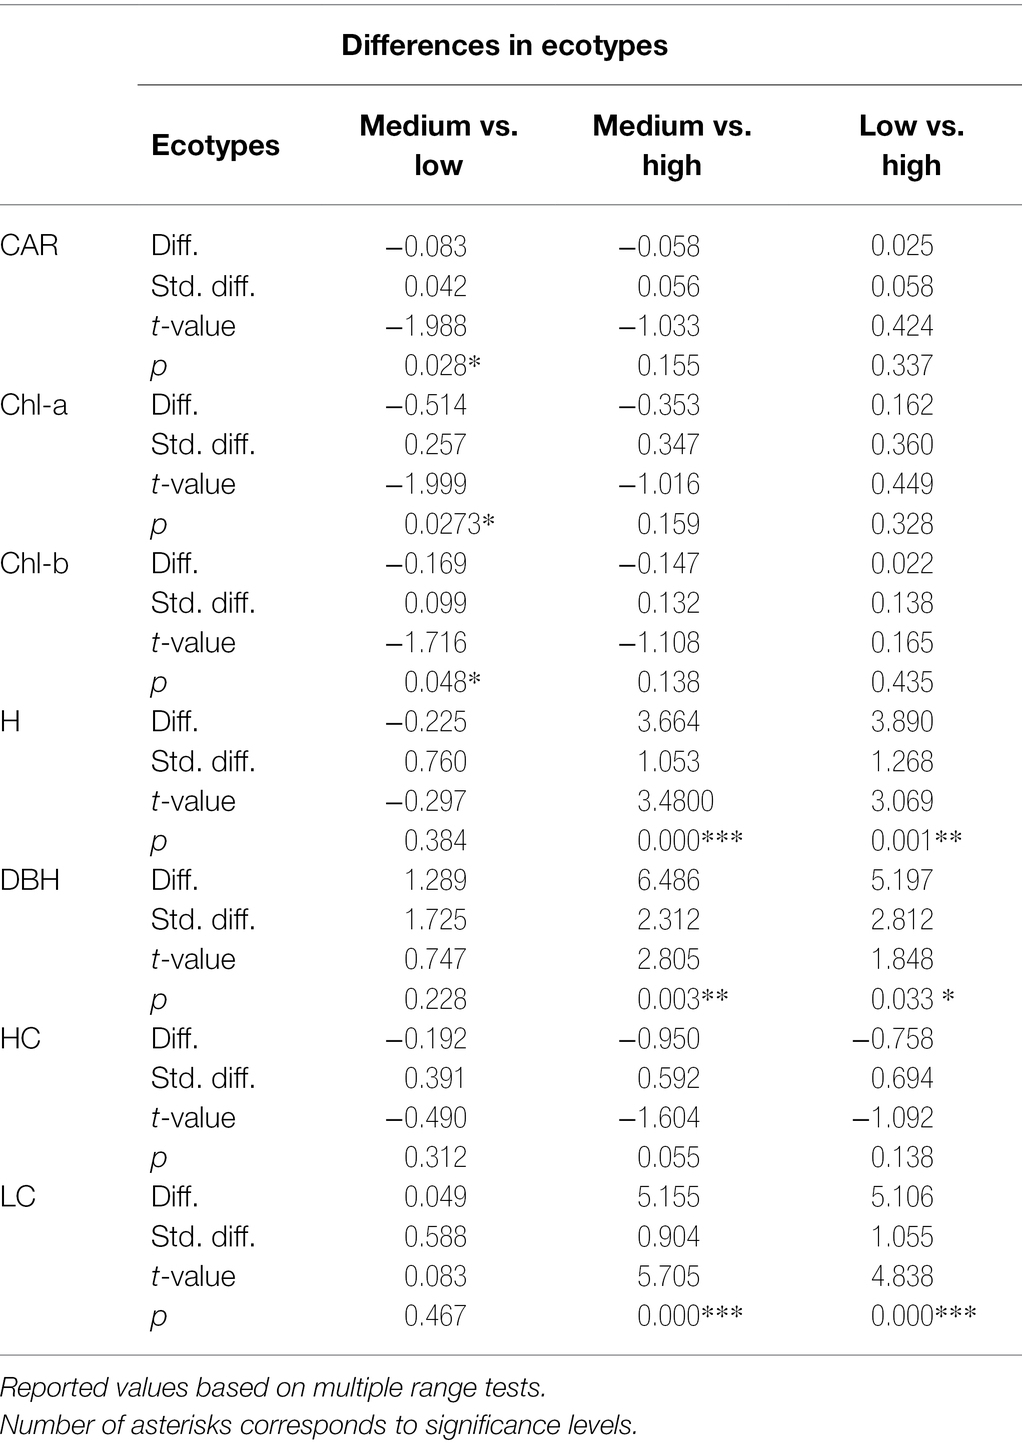
Table 2. Differences among ecotypes in pigment content and growth.
We found significant phenotypic correlations between spectral reflectance and all three extracted photosynthetic pigments (Figure 5). All three photosynthetic pigments exhibited relatively strong correlations with spectral reflectance, especially around 500, 700, and above 1,300 nm. Generally, the correlation appeared to be strongly negative within the green part of the spectrum, shifting to strong positive correlation values beyond 1,300 nm. The two charts within Figure 6 depict the correlation between reflectance, the trees’ total height, and the crown height. Correlation with HC is more visible as the significant regions stretch across a wider spectrum, especially above 1,300 nm. Further, there was also a prominent position of the green range and far-red region in the vicinity of the red edge.
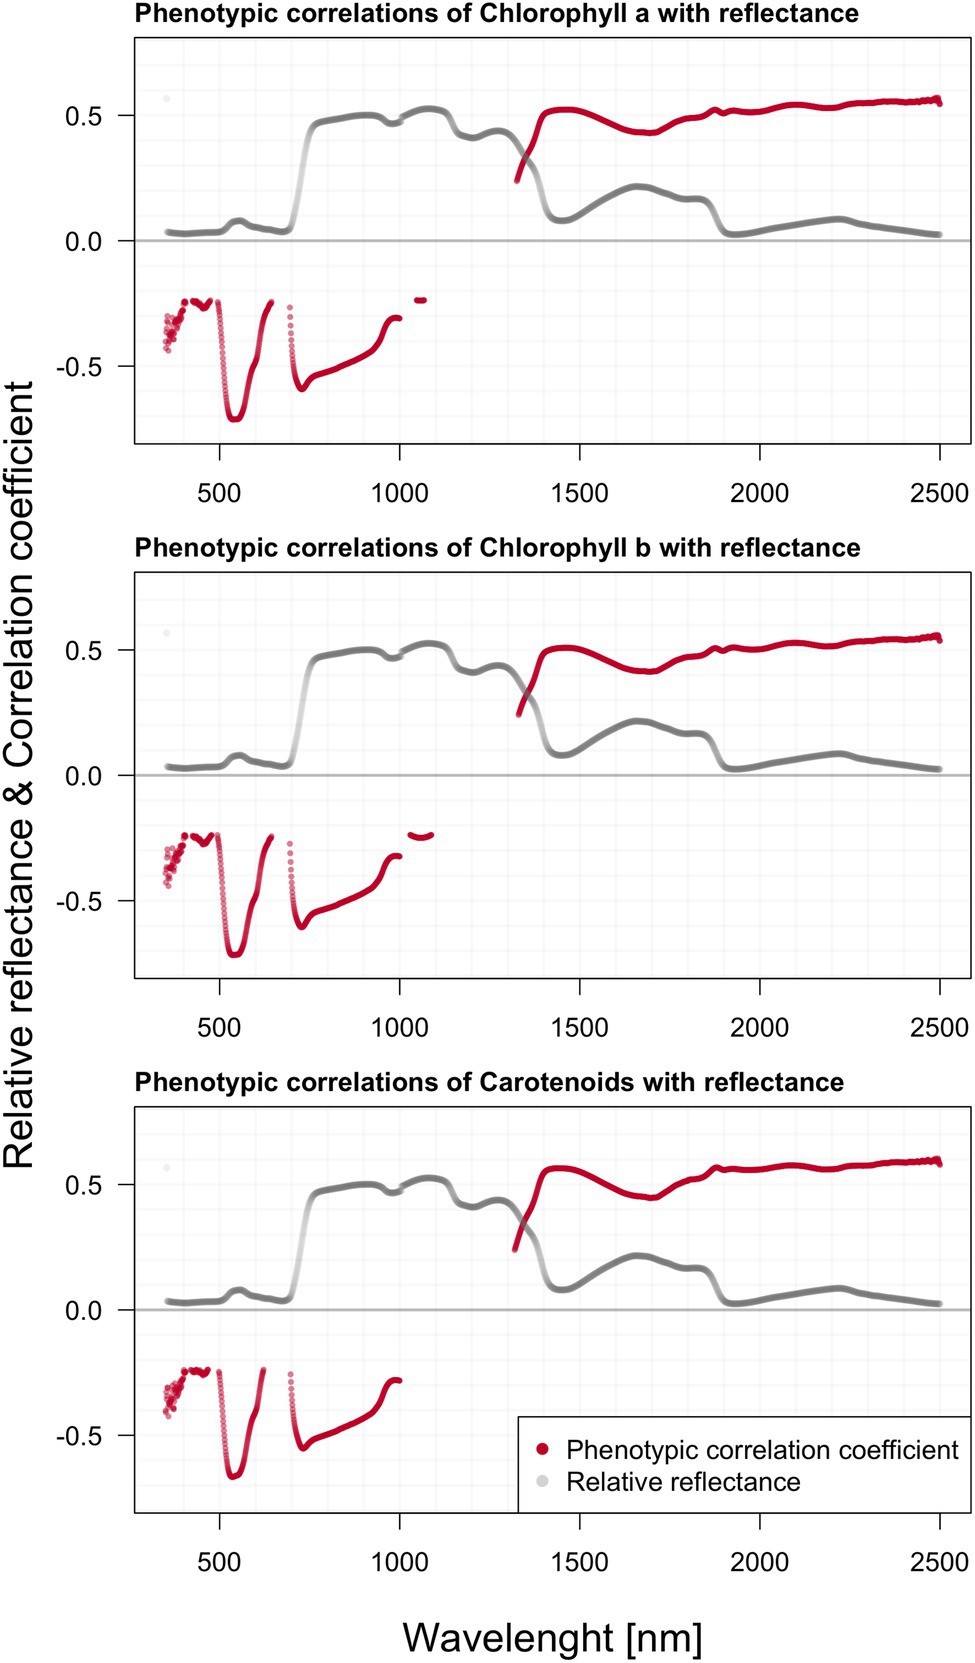
Figure 5. Phenotypic correlations among hyperspectral reflectance and individual photosynthetic pigments content; reported values based on Pearson’s correlation coefficients.
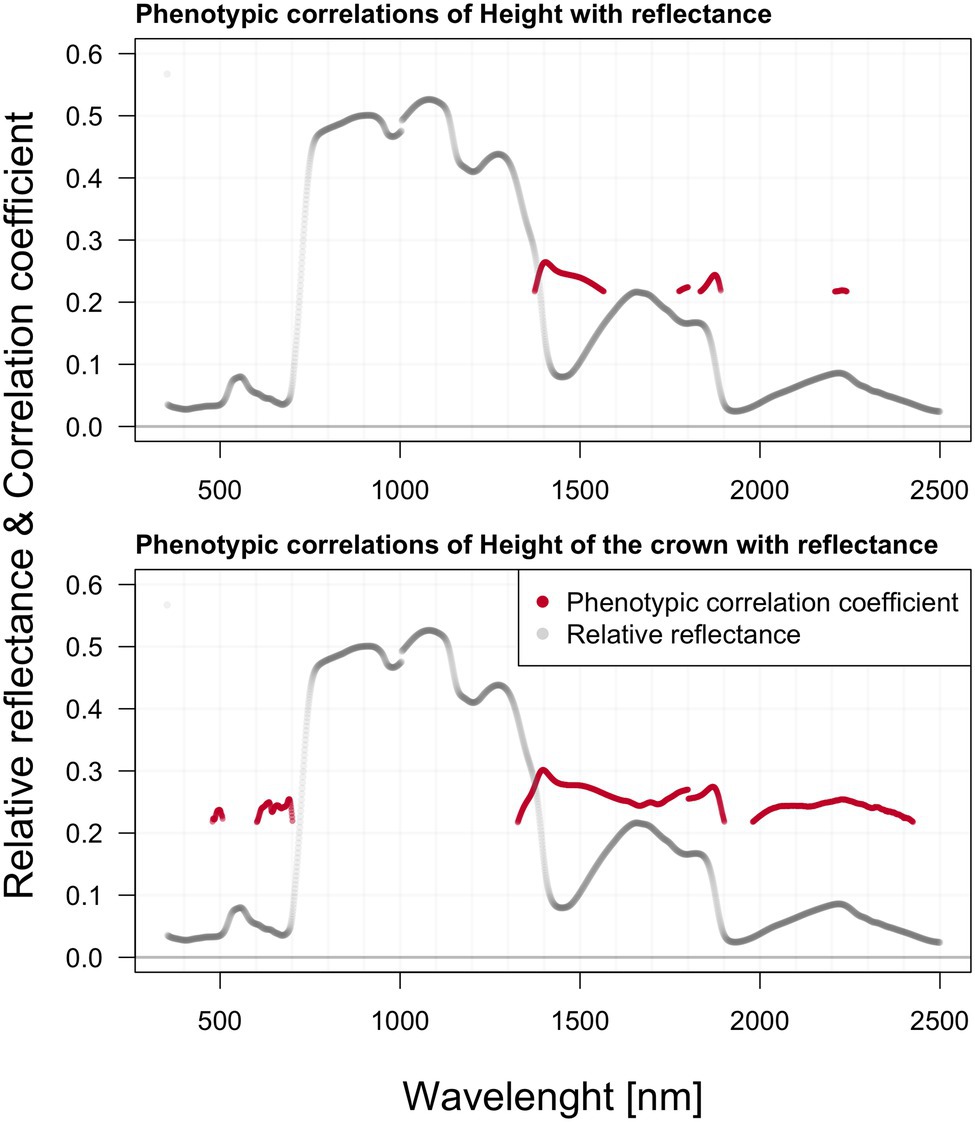
Figure 6. Phenotypic correlations among hyperspectral reflectance and selected growth parameters; reported values based on Pearson’s correlation coefficients.
In the present study, we used commonly used vegetation indices with a different purpose than usual. Our intention was not to use VIs as predictors of needle biophysical traits, but simply as heritable traits derived from hyperspectral reflectance. Therefore, we selected indices showing the highest estimated heritability (tested by LRT). Later, we studied the phenotypic correlations among those heritable indices, growth parameters, and photosynthetic pigments (Table 3). All reflectance indices (except TCARI2 against carotenoid content) exhibited significant (positive or negative) phenotypic correlations with all three pigments content. However, the R2 for linear relationships between heritable indices and photosynthetic pigments are rather low (the highest R2 = 0.59 and 0.511 were found for chlorophylls and DWSI4 and GI, respectively). Overall height, the height of the crown, and the LC exhibited either much lower or zero correlations with the reflectance indices.
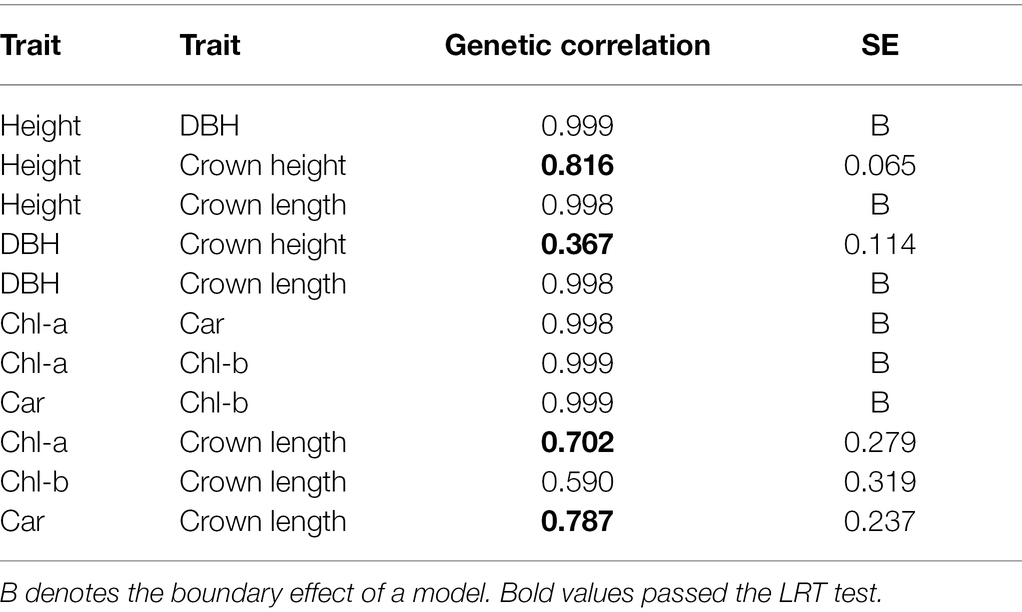
Table 3. Phenotypic correlations among the hyperspectral indices, photosynthetic pigments, and measured growth traits.
Further, we report the genetic correlations based on complex mixed linear models. This approach enabled us to reveal the intricate patterns of genetic correlation (based on clonal attributes) among various traits. We did not find any significant genetic correlations among spectra and growth on the material sampled in May (also, photosynthetic pigments were not extracted in May sampling). Contrastingly, significant genetic correlations were found among many observed parameters in the August sampling date (Table 4). As expected, genetic correlations are generally high when co-dependent growth traits are being observed. This was also confirmed in our experiment. Similarly, photosynthetic pigments show maximum genetic correlations among each other. A similar pattern could be seen concerning phenotypic correlations (results not shown). In Table 3, the genetic correlation between all available measured parameters can be observed. The strongest positive correlations exhibit the photosynthetic pigments across their pairwise comparison. Growth parameters show strong positive correlations, especially between DBH, total height, and crown length. Interestingly, all three pigments were relatively (but not significantly according to rigorous LRT) correlated to the crown’s length (0.58–0.78), with the highest value between carotenoids and LC.
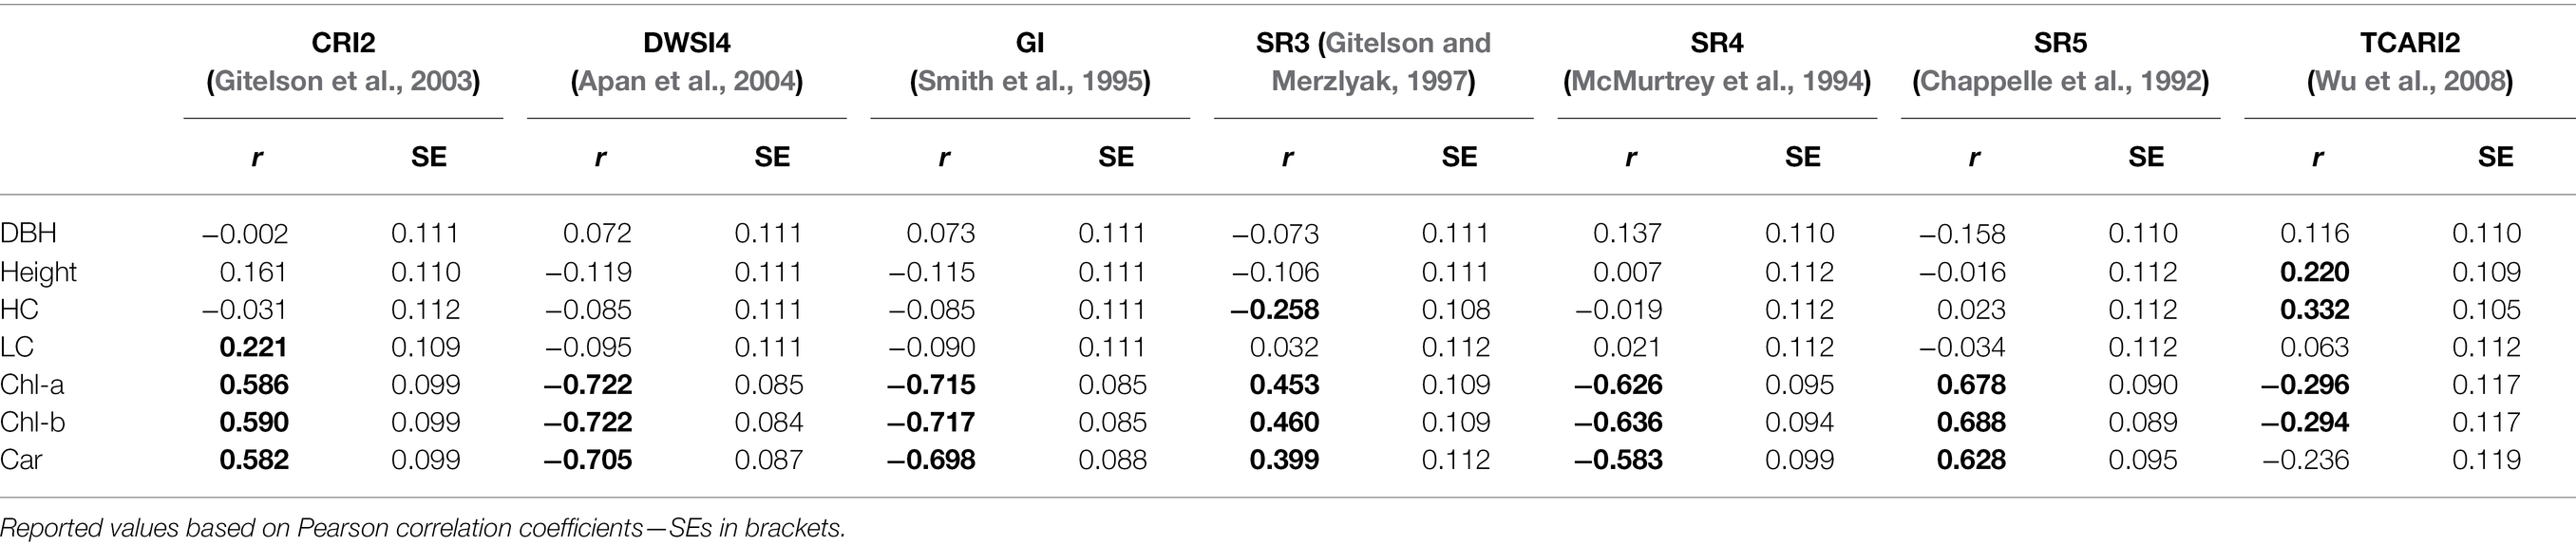
Table 4. Estimated genetic correlations among photosynthetic pigments content and growth traits.
We did not estimate any significant genetic correlations between hyperspectral data, height, and DBH. Genetic correlation of the length of a crown (LC) with reflectance is significant in a relatively wide range of the spectrum, especially within the region 1,360–1,900 nm (minimum value of 0.89 with SE 0.23) and in the region 2,050–2,420 nm (min 0.931 with SE 0.2287) a strong positive correlation was recorded. Genetic correlation in the crown (HC) height with reflectance is comparatively less abundant across the spectra than the crown’s length (LC). Interesting is the visible correlation peak occurring between 600 and 700 nm in the vicinity of the red edge. These correlations are highlighted in Figure 7.
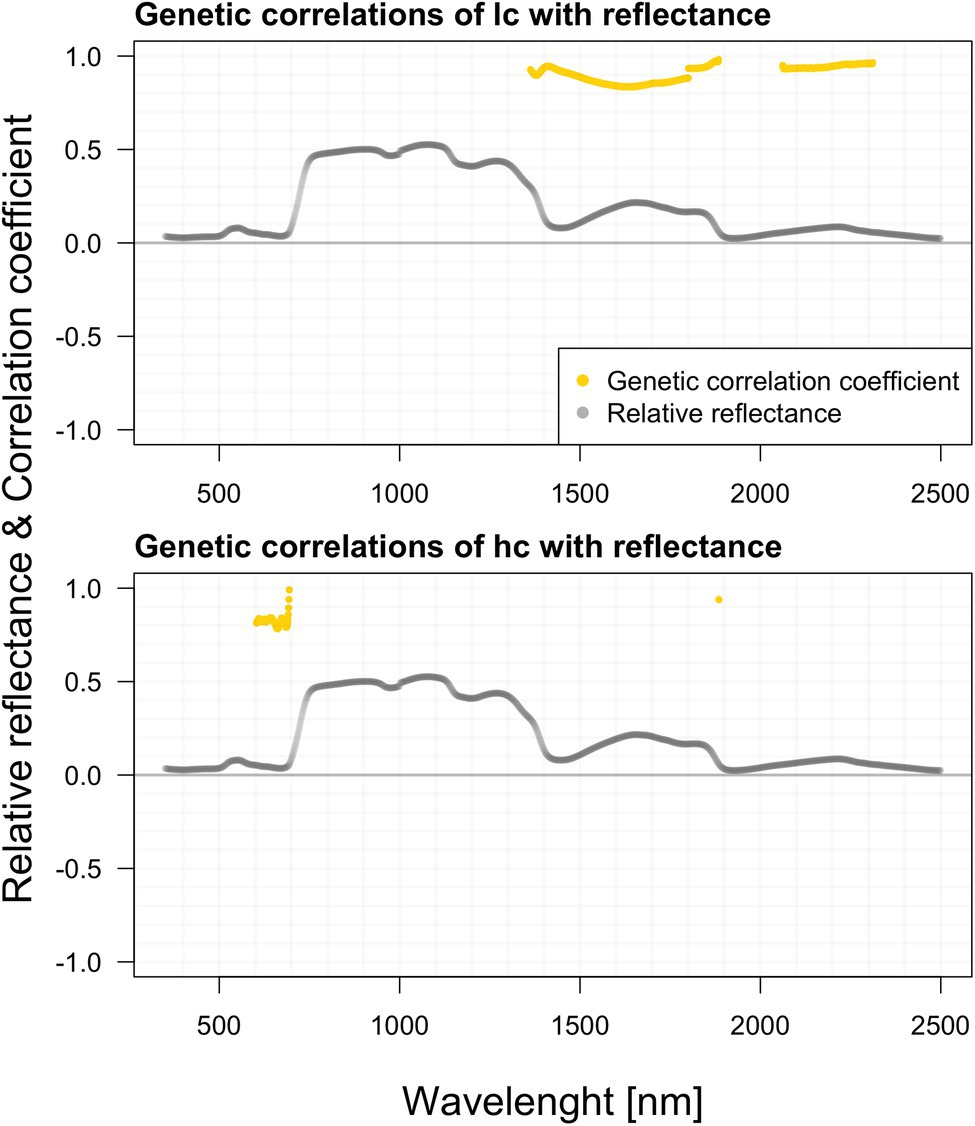
Figure 7. Genetic correlations among hyperspectral reflectance and selected growth parameters.
In contrast to growth traits, we found significant genetic correlations between the raw spectral data and all photosynthetic pigments (Figure 8). Like the phenotypic relations depicted earlier, the visible differences among individual pigments are rather marginal. Correlations of chlorophyll a with reflectance are significant mainly within the NIR and SWIR. There are substantial correlations in 1,360–1,800 and 2,050–2,240 nm. Along the green-light region from 500 to 600 nm, the contrasting strong negative correlations below −0.900 occur, following the similar pattern observed in the above-illustrated phenotypic correlations. Correlations between chlorophyll b and reflectance are negative again in the visible parts of the spectrum and positive in the far regions. Carotenoids do correlate with reflectance in an almost identical pattern as chlorophyll b. We found strong negative correlations (below −0.880) in the region 507–518. In 1315–1885 and 2,060–2,320 nm, we found other significant ranges.
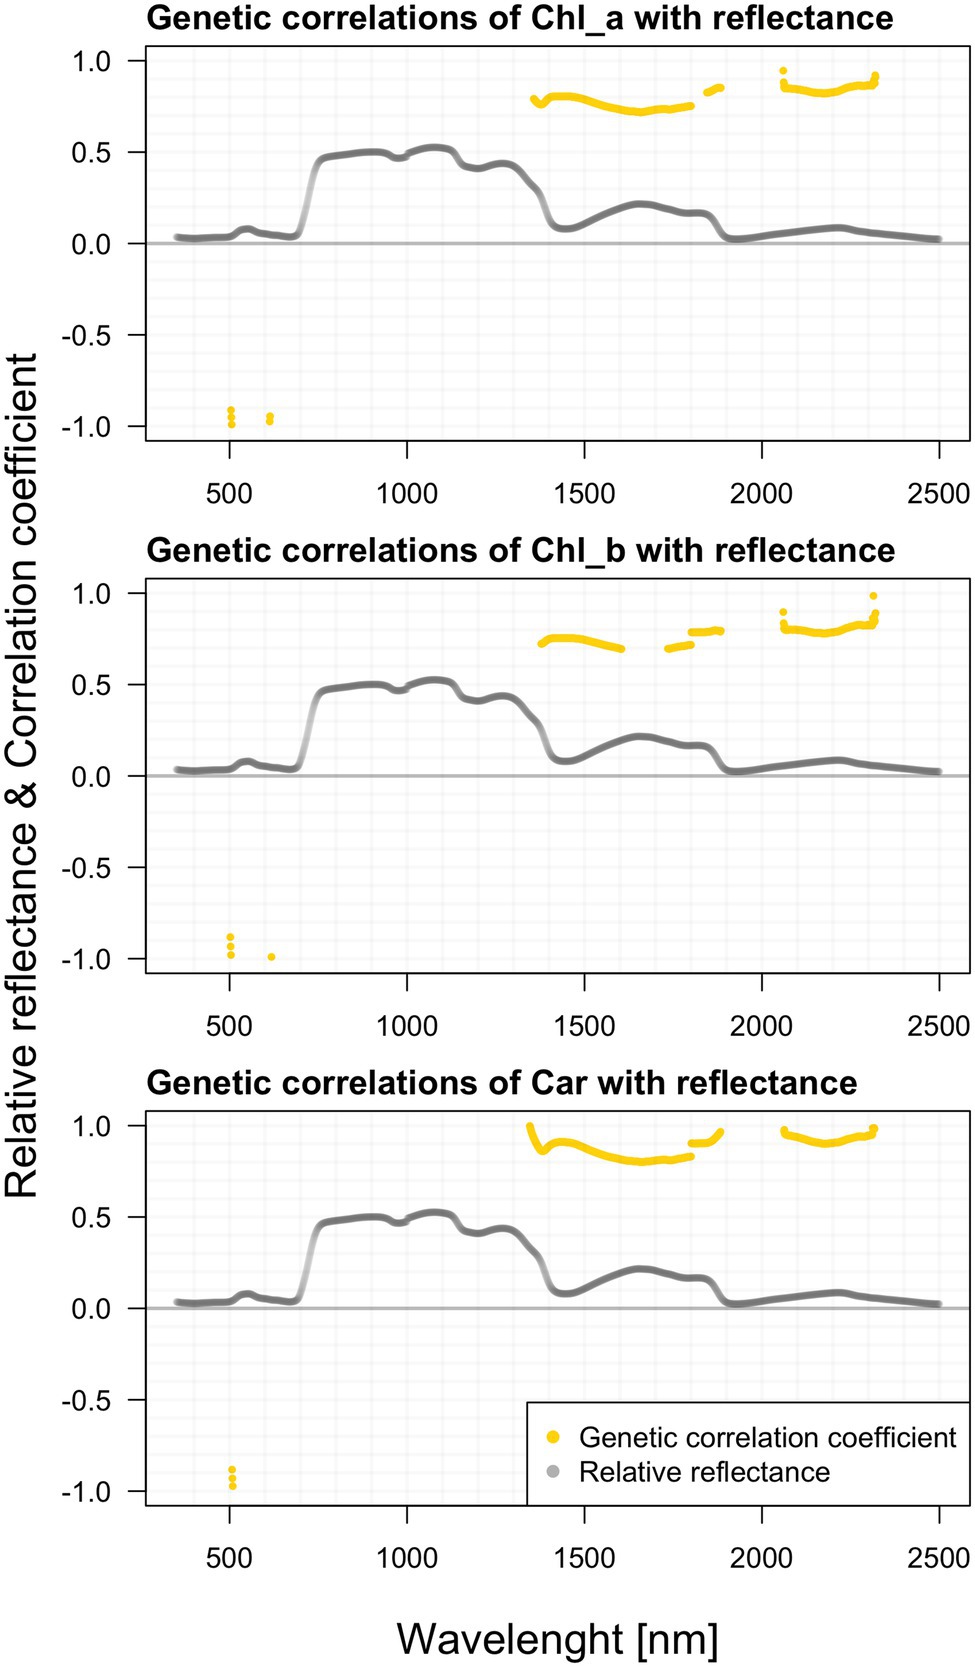
Figure 8. Genetic correlations among hyperspectral reflectance and individual photosynthetic pigments content.
Traditionally, the spectral information has rendered indices pre-selected due to their specific properties connected to stress relation or health status determining capacity. With this in mind, we chose those indices from the original candidate set contained within the R package hsdar (Lehnert et al., 2019) that were heritable for the subsequent bivariate analysis, which allowed us to estimate genetic correlations with other traits of interest. This selected subset is listed in Table 5. The highest heritability values were recorded in SR3. In this case, almost 50% of these indices’ variation is controlled by genetics (attributed to clonal variation) in our experimental plot. The relatively high standard error values can be attributed to the small sample size used in this study.
To picture the complex relationships among various traits, further elaborated within genetic correlations, we also present the estimated heritability in all measured traits (Table 5). Finally, genetic correlations between multiple reflectance indices and other recorded parameters were calculated in the bivariate models (Table 6). There are relatively high values of genetic correlations with photosynthetic pigments. The highest genetic correlation (0.99) was found between chlorophyll b, chlorophyll a, and the CRI2 index. CRI2 is also highly correlated with chlorophyll b (0.97).
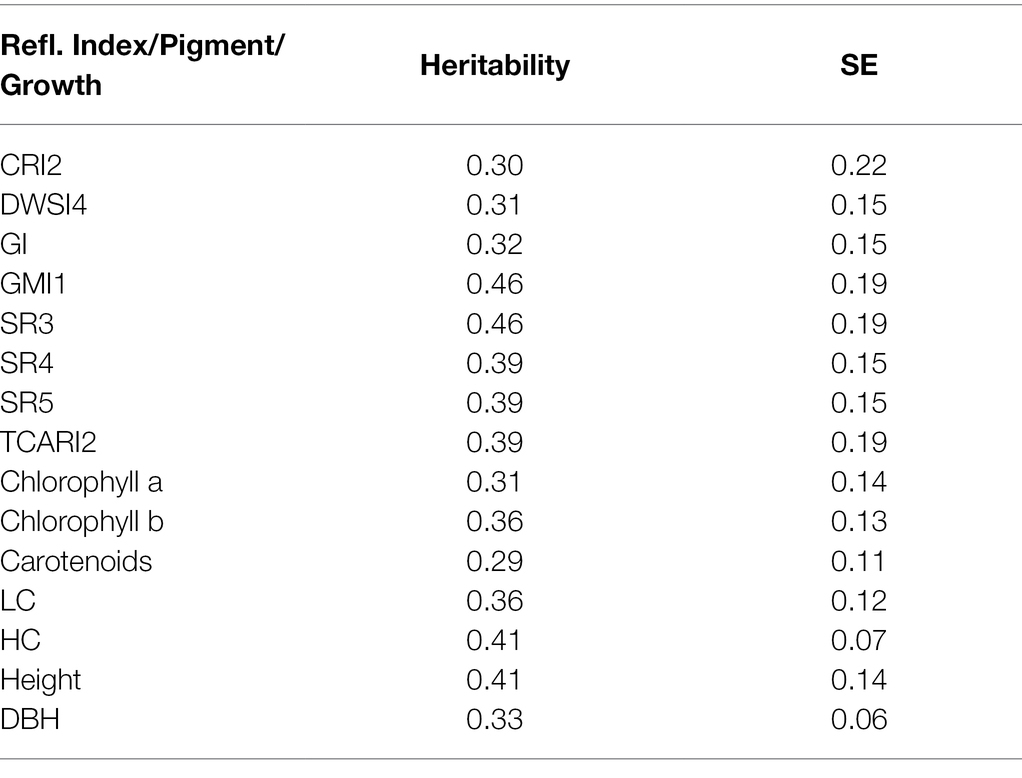
Table 5. Estimated heritability of reflectance indices, photosynthetic pigments, and growth traits.
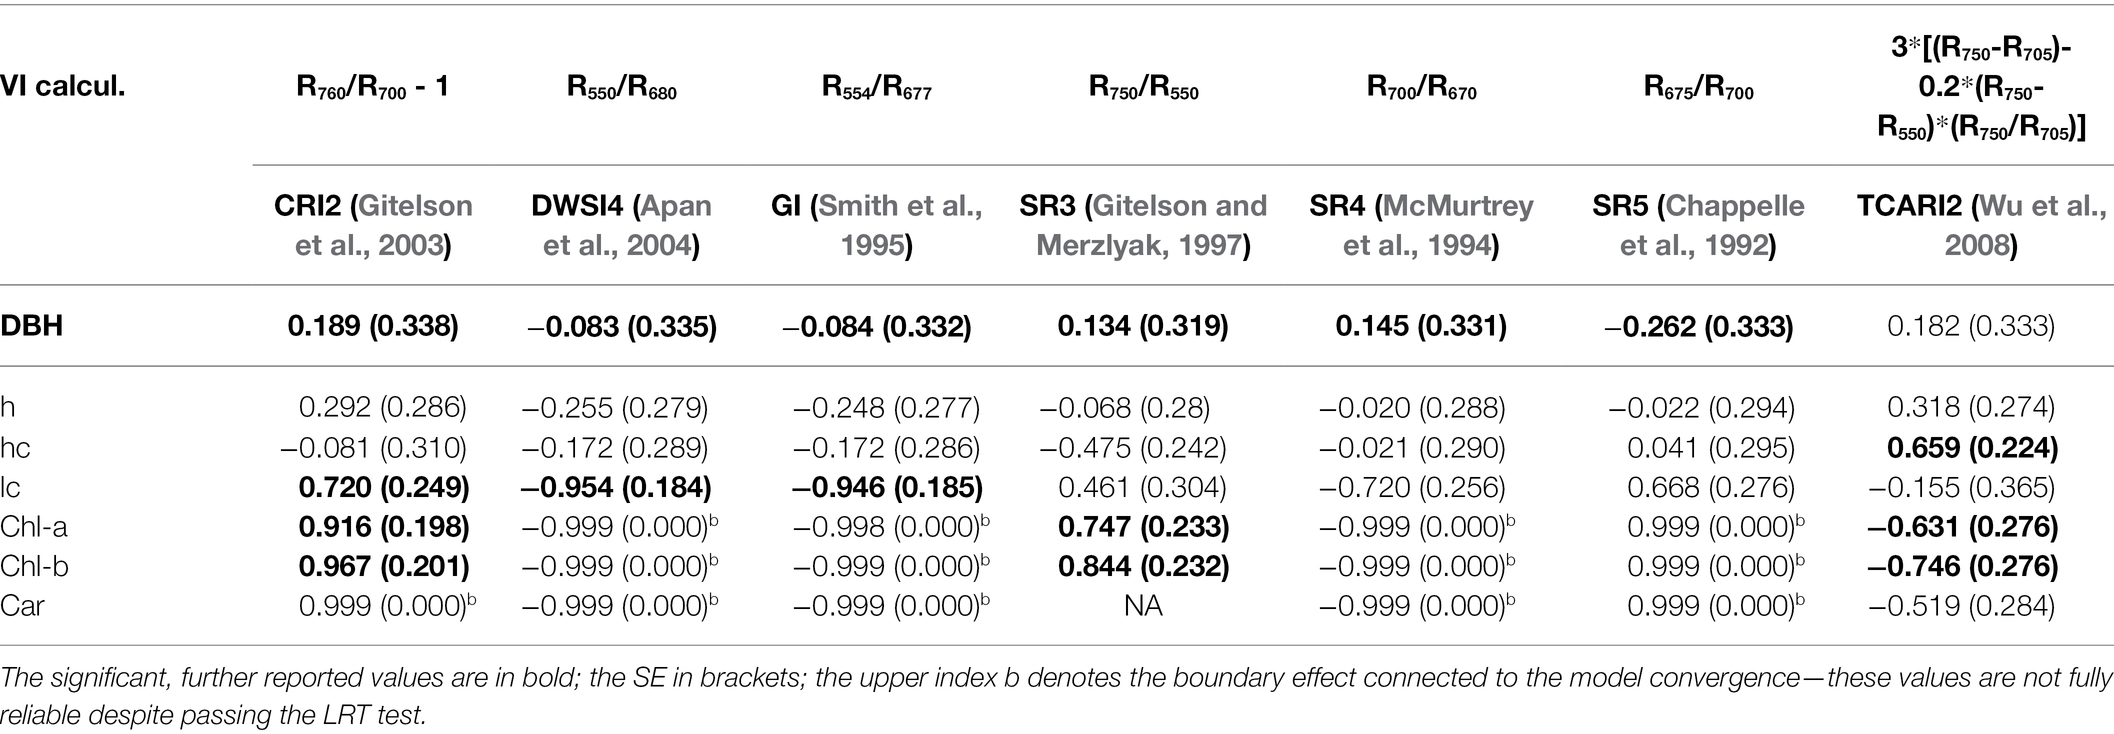
Table 6. Genetic correlations among the hyperspectral indices, photosynthetic pigments, and measured growth traits.
In contrast to phenotypic correlations among indices and growth, strong negative genetic correlations were found between LC and DWSI4 and GI (−0.95). On the other hand, CRI2 correlated strongly positively with the LC parameter. Lastly, TCARI2 exhibits a strong positive genetic correlation with an HC parameter.
It is known that hyperspectral reflectance mirrors the actual conditions in forest stands, and these specific differences are temporal and spatial. We detected a significant difference between the shoot reflectance in May and August in the spectral range from 700 to 1,300 nm.
The mean reflectance curve in both periods has an almost identical shape except for the region between 700 and 1,300 nm. The biggest difference was detected around 1,050 nm. The NIR region responds to many structural parameters in plant tissue (Rock et al., 1994; Slaton et al., 2001; Sánchez et al., 2012). This detectable difference in NIR may occur since we sampled mostly previous year’s needles in May, whereas we measured the current needles during the August sampling. In other words, the higher NIR reflectance from August samples may reflect the different structural parameters of current-years vs. previous-season needles. A similar trend in reflectance decrease with needle aging was reported for Norway spruce (Hovi et al., 2017; Lhotáková et al., 2021). The apparent inconsistency in the age of needle samples was since some trees did not produce new shoots in the 2020 season in the reach of our sampling device (up to 8 meters above ground). However, the youngest available needles were supposed to be the most physiologically active as reported for various conifers (Bernier et al., 2001; Jensen et al., 2015) and thus suitable for revealing differences in needle physiological (pigments) and optical traits among the studied ecotypes.
Needle water content also affects NIR reflectance: directly in water absorption bands centered around 970, 1,200, 1,450, and 1930 nm (some spectral intervals of significant differences among sampling dates correspond to these spectral regions); and indirectly due to decreasing cell turgor during dehydration (Peñuelas and Inoue, 1999), which could be included in the structural effect mentioned above. Although we did not quantify water content in needles, we suppose it is directly influenced by available soil moisture. Despite the higher average precipitation recorded in August (4.3 mm vs. 2.6 mm in May), available moisture was perhaps much lower in late summer. The mean temperature was noticeably higher in August (20.9°C) than in May (12.5°C). Thus, the higher temperatures led to increased evapotranspiration (the mean values may be biased by the thunderstorm that preceded our August sampling). These specific circumstances may have indirectly affected needles’ spectral properties and contributed to differences in NIR reflectance between May and August.
The typical morphological features of respective ecotypes were retained in the studied common garden. We assumed the adaptation to the original climatic conditions was genetically determined. These assumptions were supported by preliminary SNPs data cluster analysis (Čepl et al., 2020). Although there is no information about distinguishing Norway spruce ecotypes from spectral reflectance neither at canopy nor at needle level, we expected these adaptations to be reflected in variable hyperspectral reflectance of young shoots. We based our hypothesis on previous findings in Quercus populations, which were more distinguishable by hyperspectral reflectance than individual functional leaf traits (Cavender-Bares et al., 2016).
Recently, multivariate statistical approaches that work with continuous spectra are frequently used in laboratory and image spectroscopy (Deepak et al., 2019; Verrelst et al., 2019; Lhotáková et al., 2021). We also tested principal component analysis and random forest classification for distinguishing Norway spruce ecotypes in the present study. However, the results were not convincing (data not shown). High variability in reflectance spectra and broad spectral regions with high spectral similarity could fail to differentiate the ecotypes. Therefore, we applied a pairwise comparison of individual wavelengths.
We recorded the significant differences among Norway spruce ecotypes in reflectance. However, they were mostly limited to specific and quite narrow regions of the spectra and depended on the sampling month. These reflectance differences among represented ecotypes were more frequent and pronounced in the second sampling period (in August). In May, the differences among two ecotype pairs (medium-elevation and high-elevation; low-elevation and high-elevation) were concentrated in the VIS part of the spectrum (green and red region) and partly red edge, which makes sense considering the accumulation of needle chlorophyll with aging. This process may not be synchronized among the ecotypes, even though they grow in the same environment. We can only hypothesize about this cause as we did not sample needles for biochemical analyses in May. In the pairwise comparison between medium-elevation and high-elevation ecotypes, the ranges of significant difference shifted back towards the visible parts of spectra, corresponding to the putative red edge shift after a prolonged drought (Curran et al., 1990) caused by heatwaves. At the level of cell membrane stability, the high-elevation Norway spruce ecotype from Germany was less thermotolerant than its low-elevation counterpart (Valcu et al., 2008); however, the relation of thermotolerance to reflectance spectra was not investigated.
Conversely, in August, the biggest differences were found between low-elevation and medium-elevation ecotypes covering the broad part of the NIR plateau and SWIR. We attribute the differences in these spectral regions rather to low water content in medium-elevation ecotype (having the lower reflectance). The peak of heritable variation in the red edge described by Čepl et al. (2018) is here further documented on a much broader scale of within-species genetic variation inherent to various origins.
Further, we explored the potential differences among represented Norway spruce populations concerning photosynthetic pigments content and various growth traits. All photosynthetic pigments behaved equally, showing significantly lower contents in the medium-elevation ecotype than the low-land ecotype. Later the ecotypic variation within pigments emerged only in medium- vs. low-elevation comparison (in contradiction to spectral data), which can be attributed to the under-representation of the high-elevation source. We could speculate that the trait is more sensitive to sample size within these multiple comparisons.
The ecotypes were also significantly different in total height and DBH. These significant differences were detected among both combinations with high-elevation origin. Morphologically, the high-elevation origin is unique, mirrored in any pairwise comparison highlighting the difference. The two significant differences across all pairwise combinations connected with very low value of ps were found in the LC parameter. This major difference could be attributed to visible differences in crown morphology among respective ecotypes. These habitual characteristics were retained in the clonal trial and further contributed to other physiological differences. In HC, medium elevation vs. high elevation is exactly on the verge of a significant difference (value of p = 0.055). We concluded that this growth trait is less informative about the recent increment and health status and does not contribute much to the observed ecotypic variation.
Our study showed several potentially adaptive traits that help characterize Norway spruce populations from cold mountain environments. It has been documented that populations originating from colder high-elevation sites often differed per unit change in altitude or mean annual temperature more than low elevation populations did (Oleksyn et al., 1998).
We analyzed the ecotypic variation of Norway spruce elevation forms grown in natural conditions of a common-garden experiment (i.e., clone bank). This makes our findings unique, as methodically similar research is predominantly performed under controlled conditions in greenhouse or growth chambers (e.g., Eldhuset et al., 2013; Sena et al., 2018) while studies of Norway spruce grown under natural conditions are scarce (e.g., Yakovlev et al., 2008). Tomášková et al. (2021) hypothesized that the high elevation spruce ecotype would strive less compared to the medium and lowland one after a prolonged period of drought in 2018. The experiment confirmed high adaption potential for high-mountain spruce ecotype planted in low elevation based on variable chlorophyll a fluorescence (Tomášková et al., 2021). Our results support the adaptation potential of high-elevation ecotype at the level of photosynthetic apparatus, as the contents of photosynthetic pigments were not significantly decreased compared to medium- and low-elevation ones. Similarly, the results of spectral analyses support the adaptation potential of high-elevation ecotype, as the differences in hyperspectral reflectance were restricted to specific parts of the spectrum, and the multivariate analyses failed to distinguish the ecotypes.
We presented phenotypic correlations between photosynthetic pigments and reflectance in single wavelengths in the measured spectral range. Not surprisingly, chlorophylls and carotenoid content correlate mostly with VIS wavelengths, which correlate mostly with VIS wavelengths, determined by their molecular structure and specific absorption features (Ustin et al., 2009). Similarly, Schlerf et al. (2010) evaluated the information content of spectral reflectance (laboratory and airborne data) for the estimation of needle chlorophyll concentration in Norway spruce (Picea abies L. Karst.) needles. The wavebands selected in the regression models to estimate chlorophyll concentration were typically located in the red edge region and near the green reflectance peak. Even though pigments do not absorb NIR wavelengths, NIR reflectance is not uncommon to contribute to chlorophyll retrieval models (Lhotáková et al., 2021).
All photosynthetic pigments show a substantial positive genetic correlation between 1,357–1,800 and 1,845–2,240 nm. Along the green-light region from 504 to 614 nm, the contrasting strong negative correlations below −0.91 occur, following the similar pattern observed in the above-illustrated phenotypic correlations. We found strong negative correlations (below −0.88) in the regions 507–518 and 585–605 nm. In 1,313–1,884 and 2,060–2,320 nm we found high positive genetic correlations. It seems that this inverted relationship across the spectra might be a general pattern observable in various populations of different species. This phenomenon could be attributed to the presumably positive relationship between water content and pigment content, as both are vital for the striving of the plants. The repeated drops along the reflectance curve are commonly attributed to water content.
In contrast to systematic studies focused on correlating and modeling pigments contents from leaf-level reflectance, the studies relating leaf reflectance to growth traits of forest trees are absent. In crop science, canopy reflectance is commonly used to estimate aboveground biomass or yield (Yang and Chen, 2004; Wang et al., 2017). In forest science, the tree height and aboveground biomass are usually modeled from canopy level lidar data or lidar (Persson et al., 2002), hyperspectral data fusion (Sankey et al., 2017), or UAV-borne image data with a very high spatial resolution (Tao et al., 2021). In contrast, we tested the single wavelength shoot-level reflectance correlation to all three growth traits such as DBH, tree height, crown height, and length. We suppose that the relationships among shoot level reflectance and growth traits would be indirect, reflecting several physiological processes such as photosynthetic capacity, assimilate partitioning into growth, reproduction, and defense (Zhang et al., 2015). However, from presented correlations between the shoot level reflectance and growth traits, the mechanisms behind could not be elucidated. Some of the selected spectral attributes were shown to have significant relationships with growth parameters in phenotypic and genetic correlations. Phenotypic correlation with HC is more visible as the significant regions stretched across a much wider range of the spectrum, especially beyond 1,300 nm. Phenotypic correlation between the HC and blue and red spectral regions could be mediated by chlorophyll absorption in these wavelengths. Further, there is also a prominent position of the green range and far-red region in the vicinity of the red edge. Contrastingly, the height correlates against spectra only within NIR and SWIR.
We did not find any genetic correlations between shoot hyperspectral reflectance and height with DBH. Genetic correlation of the LC with reflectance is significant in a relatively wide range of the spectrum, especially within the region 1,363–1,901 nm (minimum value of 0.89 with SE 0.23) and in the region 1,989–2,438 nm (min 0.93 with SE 0.23) a strong positive correlation was recorded. Genetic correlation in the crown height (HC) with reflectance is comparatively less abundant across the spectra than the LC. There are significant ranges in 1,887–1,897, 1,995–2,057, and 2,322–2,397 nm. But more interesting is the visible correlation peak occurring between 603 and 704 nm in the vicinity of the red edge. We can speculate that these relationships might share a similar background with pigment content genetic correlations. The water content (reflected in NIR and FAR) will likely be positively correlated with the overall photosynthetic capacity of trees, which is further reflected in the LC.
Spectral reflectance measurement provides a fast, non-destructive method for pigment and other leaf or canopy traits estimation (Sims and Gamon, 2002; Croft et al., 2014). Many spectral indices have been developed (see Footnote 1). All three photosynthetic pigments show significant correlations against the selected reflectance indices in our study. We deliberately chose those established indices, where we estimated the heritable variation. It should be stressed that this broad-sense heritability was based on clonal variation present in our trial. The heritability values presented here are slightly higher than previous experiments with a half-sib or full-sib genetic structure (Čepl et al., 2016, 2018), which allowed the estimates of the narrow-sense heritability. The standard error (SE) values vary across the measured traits strongly connected to the sample size. We can observe that growth traits tend to have lower SE (0.06–0.14) as they comprise the whole common garden. Highly heritable traits can benefit from multivariate analyses as genetic correlations can be estimated to predict the effectiveness of indirect selections on one trait with the primary goal of improving a different trait (Isik et al., 2017). Genetic correlation estimates in population and evolutionary genetics are useful to understand how different traits are genetically related to fitness and how natural selection for higher fitness affects or is constrained by other traits (Isik et al., 2017).
In the preselection of heritable reflectance indices, the majority are simple ratios. Only two out of seven indices are more complex (namely CRI2 and TCARI2). All reflectance indices (except TCARI2 vs. Carotenoids content) exhibit significant positive or negative phenotypic correlations with all three pigments content. A significant negative correlation was recorded in pigments with DWIS4 and GI reflectance indexes (<−0.70). Contrastingly, the highest positive correlation was found between pigments and the SR5 index (0.63). These values follow the correlations reported in previous studies (Datt, 1999; Solovchenko et al., 2010; Hernández-Clemente et al., 2012; Sonobe and Wang, 2017).
Overall, the highest genetic correlation (0.99) was found between Chlorophyll b, chlorophyll a, and the CRI2 index. CRI2 is also highly correlated with Chlorophyll b (0.97). We can conclude that the genetic correlations generally reach higher values but often exhibit higher SE due to their higher sensitivity to sample size.
In Norway spruce, the red edge position can indicate physiological conditions due to air pollution (Campbell et al., 2004). Moorthy et al. (2008) investigated quantitative links among various Chlorophyll concentrations hyperspectral observations of Jack Pine (Pinus banksiana) in the forest health context. They concluded that chlorophyll content measurements are useful bioindicators of stand health conditions.
Our evaluation’s novelty lies in the reported phenotypic/genetic correlations of reflectance indices against various growth parameters. This concept is more often seen in crop science, and our results may indicate the potential for forestry and tree improvement. It is more feasible to train and validate prediction models in highly uniform crop fields even across multiple sites. Rather heterogeneous conditions create an obstacle to further applications of these methods in forestry. We see a clear potential for forest trees from the strong and significant genetic correlations we estimated through the specific design utilizing clonal replications. In our study height, the height of the crown and the LC correlate rather poorly with the reflectance indices. CRI2 showed a low positive correlation against LC; TCARI2 exhibits a moderate positive phenotypic correlation with an HC.
In contrast, strong negative genetic correlations were found between LC and DWSI4 and GI (−0.95). Conversely, CRI2 correlated strongly positively with the LC parameter. Lastly, TCARI2 exhibits a strong positive genetic correlation with an HC parameter. It seems that genetic correlations between spectral indices and various growth parameters possibly connected to pleiotropy reflect the actual productivity and health status much more precisely than the simple phenotypic correlations. It is questionable if this is given by the higher precision of spatial modeling, which takes the experimental design and microenvironment into account.
The original contributions presented in the study are included in the article/Supplementary Material, further inquiries can be directed to the corresponding author.
JH and JS coordinated research activities. JS, JH, and JD collected material in the field. ZL, JD, and AK did laboratory work. JS, JH, SG, and JČ built statistical models. JS, JH, JČ, JK, SG, and ZL wrote the manuscript. All authors contributed to the article and approved the submitted version.
This work was supported by the National Agency of Agriculture research, Czechia (NAZV) (grant number QK1910480); the project EXTEMIT-K: “Building up an excellent scientific team and its spatiotechnical background focused on mitigation of the impact of climatic changes to forests from the level of a gene to the level of a landscape at the FFWS CULS Prague,” (grant number CZ.02.1.01/0.0/0.0/15_003/0000433) financed by OP RDE; The Ministry of Education, Youth, and Sports program INTER-EXCELLENCE, subprogram INTER-ACTION (grant number LTAUSA19113).
The authors declare that the research was conducted in the absence of any commercial or financial relationships that could be construed as a potential conflict of interest.
All claims expressed in this article are solely those of the authors and do not necessarily represent those of their affiliated organizations, or those of the publisher, the editors and the reviewers. Any product that may be evaluated in this article, or claim that may be made by its manufacturer, is not guaranteed or endorsed by the publisher.
We thank Rastislav Jakuš (Czech University of Life Sciences Prague) for providing the data on growth parameters.
The Supplementary Material for this article can be found online at: https://www.frontiersin.org/articles/10.3389/fpls.2022.721064/full#supplementary-material
Anderegg, W. R., Hicke, J. A., Fisher, R. A., Allen, C. D., Aukema, J., Bentz, B., et al. (2015). Tree mortality from drought, insects, and their interactions in a changing climate. New Phytol. 208, 674–683. doi: 10.1111/nph.13477
Androsiuk, P., Shimono, A., Westin, J., Lindgren, D., Fries, A., and Wang, X. R. (2013). Genetic status of Norway spruce (Picea abies) breeding populations for northern Sweden. Silvae Genet. 62, 127–136. doi: 10.1515/sg-2013-0017
Apan, A., Held, A., Phinn, S., and Markley, J. (2004). Detecting sugarcane 'orange rust'disease using EO-1 Hyperion hyperspectral imagery. Int. J. Remote Sens. 25, 489–498. doi: 10.1080/01431160310001618031
Berger, K., Verrelst, J., Féret, J.-B., Wang, Z., Wocher, M., Strathmann, M., et al. (2020). Crop nitrogen monitoring: recent progress and principal developments in the context of imaging spectroscopy missions. Remote Sens. Environ. 242:111758. doi: 10.1016/j.rse.2020.111758
Bernier, P. Y., Raulier, F., Stenberg, P., and Ung, C.-H. (2001). Importance of needle age and shoot structure on canopy net photosynthesis of balsam fir (Abies balsamea): a spatially inexplicit modeling analysis. Tree Physiol. 21, 815–830. doi: 10.1093/treephys/21.12-13.815
Butler, D. G., Cullis, B. R., Gilmour, A. R., Gogel, B. J., and Thompson, R. (2017). ASReml-R Reference Manual Version 4. Hemel Hempstead, UK: VSN International Ltd.
Campbell, P. E., Rock, B. N., Martin, M. E., Neefus, C. D., Irons, J. R., Middleton, E. M., et al. (2004). Detection of initial damage in Norway spruce canopies using hyperspectral airborne data. Int. J. Remote Sens. 25, 5557–5584. doi: 10.1080/01431160410001726058
Carter, G. A. (1993). Responses of leaf spectral reflectance to plant stress. Am. J. Bot. 80, 239–243. doi: 10.1002/j.1537-2197.1993.tb13796.x
Cavender-Bares, J., Meireles, J. E., Couture, J. J., Kaproth, M. A., Kingdon, C. C., Singh, A., et al. (2016). Associations of leaf spectra with genetic and phylogenetic variation in oaks: prospects for remote detection of biodiversity. Remote Sens. 8:221. doi: 10.3390/rs8030221
Čepl, J., Holá, D., Stejskal, J., Korecký, J., Kočová, M., Lhotáková, Z., et al. (2016). Genetic variability and heritability of chlorophyll a fluorescence parameters in scots pine (Pinus sylvestris L.). Tree Physiol. 36, 883–895. doi: 10.1093/treephys/tpw028
Čepl, J., Stejskal, J., Korecký, J., Hejtmánek, J., Faltinová, Z., Lstibůrek, M., et al. (2020). The dehydrins gene expression differs across ecotypes in Norway spruce and relates to weather fluctuations. Sci. Rep. 10, 1–9. doi: 10.1038/s41598-020-76900-x
Čepl, J., Stejskal, J., Lhotáková, Z., Holá, D., Korecký, J., Lstibůrek, M., et al. (2018). Heritable variation in needle spectral reflectance of scots pine (Pinus sylvestris L.) peaks in red edge. Remote Sens. Environ. 219, 89–98. doi: 10.1016/j.rse.2018.10.001
Chappelle, E. W., Kim, M. S., and McMurtrey, J. E. III (1992). Ratio analysis of reflectance spectra (RARS): an algorithm for the remote estimation of the concentrations of chlorophyll a, chlorophyll b, and carotenoids in soybean leaves. Remote Sens. Environ. 39, 239–247. doi: 10.1016/0034-4257(92)90089-3
Croft, H., Chen, J. M., and Zhang, Y. (2014). The applicability of empirical vegetation indices for determining leaf chlorophyll content over different leaf and canopy structures. Ecol. Complex. 17, 119–130. doi: 10.1016/j.ecocom.2013.11.005
Curran, P. J., Dungan, J. L., and Gholz, H. L. (1990). Exploring the relationship between reflectance red edge and chlorophyll content in slash pine. Tree Physiol. 7, 33–48. doi: 10.1093/treephys/7.1-2-3-4.33
Datt, B. (1999). A new reflectance index for remote sensing of chlorophyll content in higher plants: tests using eucalyptus leaves. J. Plant Physiol. 154, 30–36. doi: 10.1016/S0176-1617(99)80314-9
Deepak, M., Keski-Saari, S., Fauch, L., Granlund, L., Oksanen, E., and Keinänen, M. (2019). Leaf canopy layers affect spectral reflectance in silver birch. Remote Sens. 11:2884. doi: 10.3390/rs11242884
Ditmarová, Ľ., Kurjak, D., Palmroth, S., Kmeť, J., and Střelcová, K. (2010). Physiological responses of Norway spruce (Picea abies) seedlings to drought stress. Tree Physiol. 30, 205–213. doi: 10.1093/treephys/tpp116
Einzmann, K., Atzberger, C., Pinnel, N., Glas, C., Böck, S., Seitz, R., et al. (2021). Early detection of spruce vitality loss with hyperspectral data: results of an experimental study in Bavaria, Germany. Remote Sens. Environ. 266:112676. doi: 10.1016/j.rse.2021.112676
Eitel, J. U., Gessler, P. E., Smith, A. M., and Robberecht, R. (2006). Suitability of existing and novel spectral indices to remotely detect water stress in Populus spp. For. Ecol. Manag. 229, 170–182. doi: 10.1016/j.foreco.2006.03.027
Eldhuset, T. D., Nagy, N. E., Volařík, D., Børja, I., Gebauer, R., Yakovlev, I. A., et al. (2013). Drought affects tracheid structure, dehydrin expression, and above-and belowground growth in 5-year-old Norway spruce. Plant Soil 366, 305–320. doi: 10.1007/s11104-012-1432-z
Farjon, A., and Filer, D. (2013). An Atlas of the World's Conifers: An Analysis of Their Distribution, Biogeography, Diversity and Conservation Status. Leiden, Netherlands: Brill.
Farooq, M., Wahid, A., Kobayashi, N., et al. (2009). Plant drought stress: effects, mechanisms and management. Agron. Sustain. Dev. 29, 185–21. doi: 10.1051/agro:2008021
Gates, D. M., Keegan, H. J., Schleter, J. C., and Weidner, V. R. (1965). Spectral properties of plants. Appl. Opt. 4, 11–20. doi: 10.1364/AO.4.000011
Gitelson, A. A., Chivkunova, O. B., and Merzlyak, M. N. (2009). Nondestructive estimation of anthocyanins and chlorophylls in anthocyanic leaves. Am. J. Bot. 96, 1861–1868. doi: 10.3732/ajb.0800395
Gitelson, A. A., Gritz, Y., and Merzlyak, M. N. (2003). Relationships between leaf chlorophyll content and spectral reflectance and algorithms for non-destructive chlorophyll assessment in higher plant leaves. J. Plant Physiol. 160, 271–282. doi: 10.1078/0176-1617-00887
Gitelson, A. A., and Merzlyak, M. N. (1997). Remote estimation of chlorophyll content in higher plant leaves. Int. J. Remote Sens. 18, 2691–2697. doi: 10.1080/014311697217558
Gitelson, A. A., Merzlyak, M. N., and Lichtenthaler, H. K. (1996). Detection of red edge position and chlorophyll content by reflectance measurements near 700 nm. J. Plant Physiol. 148, 501–508. doi: 10.1016/S0176-1617(96)80285-9
Goetz, A. F. H. (2009). Three decades of hyperspectral remote sensing of the earth: a personal view. Remote Sens. Environ. 113, S5–S16. doi: 10.1016/j.rse.2007.12.014
Golhani, K., Balasundram, S. K., Vadamalai, G., and Pradhan, B. (2019). Selection of a spectral index for detection of orange spotting disease in oil palm (Elaeis guineensis Jacq.) using red edge and neural network techniques. J. Indian Soc. Remote Sens. 47, 639–646. doi: 10.1007/s12524-018-0926-4
Harb, A., Krishnan, A., Ambavaram, M. M., and Pereira, A. (2010). Molecular and physiological analysis of drought stress in Arabidopsis reveals early responses leading to acclimation in plant growth. Plant Physiol. 154, 1254–1271. doi: 10.1104/pp.110.161752
Hart, S. J., Veblen, T. T., Eisenhart, K. S., Jarvis, D., and Kulakowski, D. (2014). Drought induces spruce beetle (Dendroctonus rufipennis) outbreaks across northwestern Colorado. Ecology 95, 930–939. doi: 10.1890/13-0230.1
Hernández-Clemente, R., Navarro-Cerrillo, R. M., and Zarco-Tejada, P. J. (2012). Carotenoid content estimation in a heterogeneous conifer forest using narrow-band indices and PROSPECT+ DART simulations. Remote Sens. Environ. 127, 298–315. doi: 10.1016/j.rse.2012.09.014
Hovi, A., Raitio, P., and Rautiainen, M. (2017). A spectral analysis of 25 boreal tree species. Silva Fenn. 51:7753. doi: 10.14214/sf.7753
Hunt, E. R., and Rock, B. N. (1989). Detection of changes in leaf water content using near- and middle-infrared reflectances. Remote Sens. Environ. 30, 43–54. doi: 10.1016/0034-4257(89)90046-1
Isik, F., Holland, J., and Maltecca, C. (2017). Genetic Data Analysis for Plant and Animal Breeding (Vol. 400). Cham, Switzerland: Springer International Publishing.
Jactel, H., Petit, J., Desprez-Loustau, M. L., Delzon, S., Piou, D., Battisti, A., et al. (2012). Drought effects on damage by forest insects and pathogens: a meta-analysis. Glob. Chang. Biol. 18, 267–276. doi: 10.1111/j.1365-2486.2011.02512.x
Jaleel, C. A., Manivannan, P., Wahid, A., Farooq, M., Al-Juburi, H. J., Somasundaram, R., et al. (2009). Drought stress in plants: a review on morphological characteristics and pigments composition. Int. J. Agric. Biol. 11, 100–105.
Jansson, G., Danusevičius, D., Grotehusman, H., Kowalczyk, J., Krajmerova, D., Skrøppa, T., et al. (2013). “Norway spruce (Picea abies (L.) H. Karst.),” in Forest Tree Breeding in Europe. ed. L. E. Paques (Dordrecht: Springer), 123–176.
Jensen, A. M., Warren, J. M., Hanson, P. J., Childs, J., and Wullschleger, S. D. (2015). Needle age and season influence photosynthetic temperature response and total annual carbon uptake in mature Picea mariana trees. Ann. Bot. 116, 821–832. doi: 10.1093/aob/mcv115
Jiang, J., Comar, A., Burger, P., Bancal, P., Weiss, M., and Baret, F. (2018). Estimation of leaf traits from reflectance measurements: comparison between methods based on vegetation indices and several versions of the PROSPECT model. Plant Methods 14, 1–16. doi: 10.1186/s13007-018-0291-x
Junker, L. V., and Ensminger, I. (2016). Relationship between leaf optical properties, chlorophyll fluorescence and pigment changes in senescing Acer saccharum leaves. Tree Physiol. 36, 694–711. doi: 10.1093/treephys/tpv148
Karlsson, P. E., Medin, E. L., Wallin, G., Selldén, G., and Skärby, L. (1997). Effects of ozone and drought stress on the physiology and growth of two clones of Norway spruce (Picea abies). New Phytol. 136, 265–275. doi: 10.1046/j.1469-8137.1997.00735.x
Kokaly, R. F., Asner, G. P., Ollinger, S. V., Martin, M. E., and Wessman, C. A. (2009). Characterizing canopy biochemistry from imaging spectroscopy and its application to ecosystem studies. Remote Sens. Environ. 113, S78–S91. doi: 10.1016/j.rse.2008.10.018
Korecký, J., Čepl, J., Stejskal, J., Faltinová, Z., Dvořák, J., Lstibůrek, M., et al. (2021). Genetic diversity of Norway spruce ecotypes assessed by GBS-derived SNPs. Sci. Rep. 11, 1–12. doi: 10.1038/s41598-021-02545-z
Krutovskii, K. V., and Bergmann, F. (1995). Introgressive hybridization and phylogenetic relationships between Norway, Picea abies (L.) Karst., and Siberian, P. obovata Ledeb., spruce species studied by isozyme loci. Heredity 74, 464–480. doi: 10.1038/hdy.1995.67
Lehnert, L. W., Meyer, H., Obermeier, W. A., Silva, B., Regeling, B., and Thies, B. (2019). Hyperspectral Data Analysis in R: The hsdar Package. J. Stat. Softw. 89, 1–23. doi: 10.18637/jss.v089.i12
Lhotáková, Z., Kopačková-Strnadová, V., Oulehle, F., Homolová, L., Neuwirthová, E., Švik, M., et al. (2021). Foliage biophysical trait prediction from laboratory spectra in Norway spruce is more affected by needle age Than by site soil conditions. Remote Sens. 13:391. doi: 10.3390/rs13030391
Lichtenthaler, H. K. (1987). Chlorophylls and carotenoids: pigments of photosynthetic biomembranes. Methods Enzymol. 148, 350–382. doi: 10.1016/0076-6879(87)48036-1
Masaitis, G., Mozgeris, G., and Augustaitis, A. (2013). Spectral reflectance properties of healthy and stressed coniferous trees. Iforest 6, 30–36. doi: 10.3832/ifor0709-006
McMurtrey, J. E., Chappelle, E. W., Kim, M. S., Meisinger, J. J., and Corp, L. A. (1994). Distinguishing nitrogen fertilization levels in field corn (Zea mays L.) with actively induced fluorescence and passive reflectance measurements. Remote Sens. Environ. 47, 36–44. doi: 10.1016/0034-4257(94)90125-2
Mišurec, J., Kopačková, V., Lhotáková, Z., Hanuš, J., Weyermann, J., Entcheva-Campbell, P., et al. (2012). Utilization of hyperspectral image optical indices to assess the Norway spruce forest health status. J. Appl. Remote. Sens. 6, 063545–063551. doi: 10.1117/1.JRS.6.063545
Moorthy, I., Miller, J. R., and Noland, T. L. (2008). Estimating chlorophyll concentration in conifer needles with hyperspectral data: an assessment at the needle and canopy level. Remote Sens. Environ. 112, 2824–2838. doi: 10.1016/j.rse.2008.01.013
Morgenstern, E. K. (1996). Geographic Variation in Forest Trees: Genetic Basis and Application of Knowledge in Silviculture. UBC Press: Vancouver, 109–115.
Neuwirthová, E., Kuusk, A., Lhotáková, Z., Kuusk, J., Albrechtová, J., and Hallik, L. (2021). Leaf age matters in remote sensing: taking ground truth for spectroscopic studies in hemiboreal deciduous trees with continuous leaf formation. Remote Sens. 13:1353. doi: 10.3390/rs13071353
Oleksyn, J., Modrzýnski, J., Tjoelker, M. G., Zytkowiak, R., Reich, P. B., and Karolewski, P. (1998). Growth and physiology of Picea abies populations from elevational transects: Common garden evidence for altitudinal ecotypes and cold adaptation. Funct. Ecol. 12, 573–590. doi: 10.1046/j.1365-2435.1998.00236.x
Peñuelas, J., Fillela, I., Biel, C., Serrano, L., and Savé, R. (1993). The reflectance at the 950–970 nm region as an indicator of plant water status. Int. J. Remote Sens. 14, 1887–1905. doi: 10.1080/01431169308954010
Peñuelas, J., and Inoue, Y. (1999). Reflectance indices indicative of changes in water and pigment contents of peanut and wheat leaves. Photosynthetica 36, 355–360. doi: 10.1023/A:1007033503276
Persson, A., Holmgren, J., and Soderman, U. (2002). Detecting and measuring individual trees using an airborne laser scanner. Photogramm. Eng. Remote. Sens. 68, 925–932.
R Core Team (2022). A language and environment for statistical computing. R Foundation for Statistical Computing, Vienna, Austria. Available at: https://www.R-project.org/
Rathod, P. H., Brackhage, C., Müller, I., Van der Meer, F. D., and Noomen, M. F. (2018). Assessing metal-induced changes in the visible and near-infrared spectral reflectance of leaves: a pot study with sunflower (Helianthus annuus L.). J. Indian Soc. Remote Sens. 46, 1925–1937. doi: 10.1007/s12524-018-0846-3
Rock, B. N., Hoshizaki, T., and Miller, J. R. (1988). Comparison of in situ and airborne spectral measurements of the blue shift associated with forest decline. Remote Sens. Environ. 24, 109–127. doi: 10.1016/0034-4257(88)90008-9
Rock, B. N., Williams, D. L., Moss, D. M., Lauten, G. N., and Kim, M. (1994). High-spectral resolution field and laboratory optical reflectance measurements of red spruce and eastern hemlock needles and branches. Remote Sens. Environ. 47, 176–189. doi: 10.1016/0034-4257(94)90154-6
Sánchez, M. T., De la Haba, M. J., Benítez-López, M., Fernández-Novales, J., Garrido-Varo, A., and Pérez-Marín, D. (2012). Non-destructive characterization and quality control of intact strawberries based on NIR spectral data. J. Food Eng. 110, 102–108. doi: 10.1016/j.jfoodeng.2011.12.003
Sankey, T., Donager, J., McVay, J., and Sankey, J. B. (2017). UAV lidar and hyperspectral fusion for forest monitoring in the southwestern USA. Remote Sens. Environ. 195, 30–43. doi: 10.1016/j.rse.2017.04.007
Schaepman-Strub, G., Schaepman, M. E., Painter, T. H., Dangel, S., and Martonchik, J. V. (2006). Reflectance quantities in optical remote sensing—definitions and case studies. Remote Sens. Environ. 103, 27–42. doi: 10.1016/j.rse.2006.03.002
Schiop, S. T., Al Hassan, M., Sestras, A. F., Boscaiu, M., Sestras, R. E., and Vicente, O. (2017). Biochemical responses to drought, at the seedling stage, of several Romanian Carpathian populations of Norway spruce (Picea abies L. Karst). Trees 31, 1479–1490. doi: 10.1007/s00468-017-1563-1
Schlerf, M., Atzberger, C., Hill, J., Buddenbaum, H., Werner, W., and Schüler, G. (2010). Retrieval of chlorophyll and nitrogen in Norway spruce (Picea abies L. Karst.) using imaging spectroscopy. Int. J. Appl. Earth Obs. Geoinf. 12, 17–26. doi: 10.1016/j.jag.2009.08.006
Sena, C. M., Leandro, A., Azul, L., Seiça, R., and Perry, G. (2018). Vascular oxidative stress: impact and therapeutic approaches. Front. Physiol. 9:1668. doi: 10.3389/fphys.2018.01668
Serrano, L., Peñuelas, J., and Ustin, S. L. (2002). Remote sensing of nitrogen and lignin in Mediterranean vegetation from AVIRIS data: decomposing biochemical from structural signals. Remote Sens. Environ. 81, 355–364. doi: 10.1016/S0034-4257(02)00011-1
Sims, D. A., and Gamon, J. A. (2002). Relationships between leaf pigment content and spectral reflectance across a wide range of species, leaf structures and developmental stages. Remote Sens. Environ. 81, 337–354. doi: 10.1016/S0034-4257(02)00010-X
Šindelář, J. (1975). Klonové archivy smrku ztepilého Picea abies Karst. na PLO Zbraslav-Strnady – polesí Jíloviště. Jíloviště-Strnady. VÚLHM.
Slaton, M. R., Hunt, E. R., and Smith, W. K. (2001). Estimating near-infrared leaf reflectance from leaf structural characteristics. Am. J. Bot. 88, 278–284. doi: 10.2307/2657019
Smith, R. C. G., Adams, J., Stephens, D. J., and Hick, P. T. (1995). Forecasting wheat yield in a Mediterranean-type environment from the NOAA satellite. Aust. J. Agric. Res. 46, 113–125. doi: 10.1071/AR9950113
Solovchenko, A. E., Chivkunova, O. B., Gitelson, A. A., and Merzlyak, M. N. (2010). Non-destructive Estimation Pigment Content Ripening Quality and Damage in Apple Fruit With Spectral Reflectance in the Visible Range. Fresh Produce. 4.
Sonobe, R., and Wang, Q. (2017). Hyperspectral indices for quantifying leaf chlorophyll concentrations performed differently with different leaf types in deciduous forests. Eco. Inform. 37, 1–9. doi: 10.1016/j.ecoinf.2016.11.007
Tao, X., Li, Y., Yan, W., Wang, M., Tan, Z., Jiang, J., et al. (2021). Heritable variation in tree growth and needle vegetation indices of slash pine (Pinus elliottii) using unmanned aerial vehicles (UAVs). Ind. Crop. Prod. 173:114073. doi: 10.1016/j.indcrop.2021.114073
Tomášková, I., Pastierovič, F., Krejzková, A., Čepl, J., and Hradecký, J. (2021). Norway spruce ecotypes distinguished by chlorophyll a fluorescence kinetics. Acta Physiol. Plant. 43, 1–6. doi: 10.1007/s11738-020-03190-1
Trujillo-Moya, C., George, J. P., Fluch, S., Geburek, T., Grabner, M., Karanitsch-Ackerl, S., et al. (2018). Drought sensitivity of Norway spruce at the species' warmest fringe: quantitative and molecular analysis reveals high genetic variation among and within provenances. G3 8, 1225–1245. doi: 10.1534/g3.117.300524
Tutin, T. G., Heywood, V. H., Burges, N. A., and Valentine, D. H. (eds.) (1964). Flora Europaea: Plantaginaceae to Compositae (and Rubiaceae). Vol. 4. Cambridge, UK: Cambridge University Press.
Ustin, S. L., Gitelson, A. A., Jacquemoud, S., Schaepman, M., Asner, G. P., Gamon, J. A., et al. (2009). Retrieval of foliar information about plant pigment systems from high resolution spectroscopy. Remote Sens. Environ. 113, S67–S77. doi: 10.1016/j.rse.2008.10.019
Valcu, C.-M., Lalanne, C., Plomion, C., and Schlink, K. (2008). Heat induced changes in protein expression profiles of Norway spruce (Picea abies) ecotypes from different elevations. Proteomics 8, 4287–4302. doi: 10.1002/pmic.200700992
Van der Maaten-Theunissen, M., Kahle, H. P., and van der Maaten, E. (2013). Drought sensitivity of Norway spruce is higher than that of silver fir along an altitudinal gradient in southwestern Germany. Ann. For. Sci. 70, 185–193. doi: 10.1007/s13595-012-0241-0
Verrelst, J., Malenovský, Z., Van der Tol, C., Camps-Valls, G., Gastellu-Etchegorry, J.-P., Lewis, P., et al. (2019). Quantifying vegetation biophysical variables from imaging spectroscopy data: a review on retrieval methods. Surv. Geophys. 40, 589–629. doi: 10.1007/s10712-018-9478-y
Wallin, G., Karlsson, P. E., Selldén, G., Ottosson, S., Medin, E. L., Pleijel, H., et al. (2002). Impact of four years exposure to different levels of ozone, phosphorus and drought on chlorophyll, mineral nutrients, and stem volume of Norway spruce, Picea abies. Physiol. Plant. 114, 192–206. doi: 10.1034/j.1399-3054.2002.1140205.x
Wang, C., Feng, M., Yang, W., Ding, G., Xiao, L., Li, G., et al. (2017). Extraction of sensitive bands for monitoring the winter wheat (Triticum aestivum) growth status and yields based on the spectral reflectance. PLoS One 12:e0167679. doi: 10.1371/journal.pone.0167679
Weed, A. S., Ayres, M. P., and Hicke, J. A. (2013). Consequences of climate change for biotic disturbances in north American forests. Ecol. Monogr. 83, 441–470. doi: 10.1890/13-0160.1
Wu, C., Niu, Z., Tang, Q., and Huang, W. (2008). Estimating chlorophyll content from hyperspectral vegetation indices: modeling and validation. Agric. For. Meteorol. 148, 1230–1241. doi: 10.1016/j.agrformet.2008.03.005
Yakovlev, I. A., Asante, D. K., Fossdal, C. G., Partanen, J., Junttila, O., and Johnsen, Ø. (2008). Dehydrins expression related to timing of bud burst in Norway spruce. Planta 228, 459–472. doi: 10.1007/s00425-008-0750-0
Yang, C. M., and Chen, R. K. (2004). Modeling rice growth with hyperspectral reflectance data. Crop Sci. 44, 1283–1290. doi: 10.2135/cropsci2004.1283
Yang, X., Tang, J., Mustard, J. F., Wu, J., Zhao, K., Serbin, S., et al. (2016). Seasonal variability of multiple leaf traits captured by leaf spectroscopy at two temperate deciduous forests. Remote Sens. Environ. 179, 1–12. doi: 10.1016/j.rse.2016.03.026
Keywords: Norway spruce [Picea abies (L.) H. Karst], hyperspectral reflectance, chlorophyll, ecotypes genetic variation, genetic correlation, broad-sense heritability
Citation: Hejtmánek J, Stejskal J, Čepl J, Lhotáková Z, Korecký J, Krejzková A, Dvořák J and Gezan SA (2022) Revealing the Complex Relationship Among Hyperspectral Reflectance, Photosynthetic Pigments, and Growth in Norway Spruce Ecotypes. Front. Plant Sci. 13:721064. doi: 10.3389/fpls.2022.721064
Edited by:
Boris Rewald, University of Natural Resources and Life Sciences Vienna, AustriaReviewed by:
Qingfeng Song, Center for Excellence in Molecular Plant Sciences (CAS), ChinaCopyright © 2022 Hejtmánek, Stejskal, Čepl, Lhotáková, Korecký, Krejzková, Dvořák and Gezan. This is an open-access article distributed under the terms of the Creative Commons Attribution License (CC BY). The use, distribution or reproduction in other forums is permitted, provided the original author(s) and the copyright owner(s) are credited and that the original publication in this journal is cited, in accordance with accepted academic practice. No use, distribution or reproduction is permitted which does not comply with these terms.
*Correspondence: Jan Stejskal, c3RlanNrYWxqQGZsZC5jenUuY3o=
Disclaimer: All claims expressed in this article are solely those of the authors and do not necessarily represent those of their affiliated organizations, or those of the publisher, the editors and the reviewers. Any product that may be evaluated in this article or claim that may be made by its manufacturer is not guaranteed or endorsed by the publisher.
Research integrity at Frontiers
Learn more about the work of our research integrity team to safeguard the quality of each article we publish.