 Qi Wu1,2,3*
 Xue Bai1,2,3Mengping Nie1,2,3Li Li1,2,3Yiming Luo1,2,3
 Yu Fan1,2,3
 Changying Liu1,2,3
 Xueling Ye1,2,3Liang Zou1,2,3
- 1Key Laboratory of Coarse Cereal Processing, Ministry of Agriculture and Rural Affairs, Chengdu University, Chengdu, Sichuan, China
- 2Sichuan Engineering & Technology Research Center of Coarse Cereal Industralization, Chengdu University, Chengdu, Sichuan, China
- 3School of Food and Biological Engineering, Chengdu University, Chengdu, Sichuan, China
Quinoa (Chenopodium quinoa) is a prospective orphan crop that needs yield improvement. Previous studies indicate PHOSPHATIDYLETHANOLAMINE BINDING PROTEIN (PEBP) family genes are highly associated with the key agronomic traits of crops. Characterizing the pivotal PEBP genes will speed up the domestication and yield improvement of quinoa. Previous investigations on PEBP genes of Chenopodium species indicated that, the PEBP genes, despite in the same subclade, may have experienced functional diversification. Especially, the allotetraploidy (AABB) and numerous segmental duplications and chromosomal rearrangements in quinoa make it more difficult to understand the functions of PEBP genes. More recently, 6 quinoa FT subfamily genes were predicted to be related to flowering of quinoa. However, investigation on the whole PEBP family members is still lacking. In this study, we obtained 23 PEBP genes, including 5 MFT, 11 FTL and 7 TFL genes. We found 7 orthologous gene pairs, from sub-genome A and sub-genome B, respectively, showing collinearities with sugar beet. Evolution analysis on PEBP genes of two quinoa sub-genomes, sugar beet and relatives of diploid ancestors indicated that, the reasons for gene duplication events varied and 4 tandem duplications are the major reason for PEBP family expansion. Tissue-specific expression analysis suggested that expression patterns are mostly differing between orthologous gene pairs. Analysis on gene expressions at 6 stages suggested the possible positive roles of CqFTL1/CqFTL2, CqFTL5, CqFTL8, CqFTL6/CqFTL9 and CqTFL6/CqTFL7, and negative roles of CqTFL1/CqTFL2/CqTFL3, CqTFL4/CqTFL5 in inflorescence branching. Expression analysis in ABA-treated seed, in combination with the cis-acting element distribution analysis, indicated that CqMFT2, CqMFT3 and CqMFT4 may regulate seed germination via ABA signaling. Observations on responses to night break and photoperiod changes highlighted the roles of CqFTL5 and CqFTL8 under short day, and CqFTL6 under long day for quinoa flowering. Further, co-expression network analysis indicated that 64 transcription factors may act upstream of CqFTL5 and CqFTL8 to regulate flowering. Together, this study will help us identify the pivotal PEBP genes that may be utilized for quinoa breeding in future.
Background
Quinoa (Chenopodium quinoa) is a prospective orphan crop due to the nutritional components in its seed and high tolerance to various abiotic stresses that could ensure its growth in marginal lands (Lopez-Marques et al., 2020). Nowadays, because of the increasing global demands for quinoa, yield improvement per unit area and expansion of cultivation area should be achieved. As demonstrated in many studies, flowering time regulation not only is tightly associated with inflorescence morphology and yield, but also is related to the adaption in higher latitudes (Song et al., 2015). Thus, identifying the genes highly associated with flowering and inflorescence morphology is essential for fast domestication and yield improvement of quinoa.
Transition from vegetive to reproductive stage is influenced by both internal and environmental cues (Song et al., 2015). Photoperiod is the major pathway regulating floral transition. In favorable season, day length signal is transmitted to the major floral integrator FLOWERING LOCUS T (FT) (Taoka et al., 2013; Tsuji et al., 2013; Holt et al., 2014; Kyozuka et al., 2014; Song et al., 2015). FT encodes for florigen protein that moves through the phloem from leaves to the shoot apical meristem (SAM), where partners with bZIP transcription factor FD and 14-3-3 proteins to form floral activating complex (FAC), which in turn promotes expressions of the floral identity genes APETALA1 (AP1) and LEAFY (LFY) (Taoka et al., 2013; Tsuji et al., 2013; Holt et al., 2014; Kyozuka et al., 2014; Song et al., 2015). FT belongs to PHOSPHATIDYLETHANOLAMINE BINDING PROTEIN (PEBP) family. PEBP family contains three subfamilies, namely FT, TERMINAL FLOWER 1 (TFL1) and MOTHER OF FT AND TFL1 (MFT), all of which exert important roles in plant growth and development (Karlgren et al., 2011; Wickland and Hanzawa, 2015). In contrast to the floral-inducing role of FT, TFL1 functions as a floral repressor and maintains vegetative growth by repressing AP1 and LFY (Hanano and Goto, 2011; Kaneko-Suzuki et al., 2018; Goretti et al., 2020). The spatio-temporal expression of FT/TFL1 affects flowering time, inflorescence architecture and final yield.
Up to date, a good many evidences have demonstrated the important roles of FT-, TFL1- and MFT-like genes in agronomic traits regulation. Overexpression of the rice (Oryza saltiva) TFL1 homologs, RICE CENTRORADIALIS-like 1/2 (RCN1/2), led to delayed heading and generation of higher-order panicle branches (Nakagawa et al., 2002), whereas RNA interfering (RNAi) of rice TFL1 resulted in advanced heading and reduced branches (Liu et al., 2013). The maize (Zea mays) plants ectopic expressing ZEA CENTRORADIALIS 2/4/5 (ZCN2/4/5) produced increased lateral branches (Danilevskaya et al., 2010). The wheat (Triticum aestivum) plants overexpressing TaTFL1-2D generated increased spikelets (Wang et al., 2017). In the background of mutant self-pruning (sp, homolog of TFL1), the tomato (Solanum lycopersicum) plants with heterozygous single flower truss (sft/+) (sft, homolog of FT) produced heterosis and dramatically increased number of fruits (Krieger et al., 2010; Jiang et al., 2013). A natural variant of the TFL1 homolog CENTRORADIALIS (HvCEN) contributed to the spring growth habit of cultivated barley (Hordeum vulgare) (Comadran et al., 2012). HvCEN interacts with HvFT3 to control spikelet initiation and grain number of barley (Mulki et al., 2018; Bi et al., 2019). In addition to the classical florigen function, the rice FT homolog HEADING DATE 3A (HD3A) also regulates shoot branching (Tamaki et al., 2007; Tsuji et al., 2015). In potato (Solanum tuberosum), the FT homolog StSP6A is required for tuberization transition (Navarro et al., 2011). MFT, ancestral gene of FT and TFL1, is a key regulator in seed germination. OsMFT2 negatively regulates seed germination via ABA pathway and the knock-out mutant exhibited pre-harvest sprouting phenotype (Song et al., 2020). The wheat MFT was revealed to be tightly linked with the seed dormancy QTL QPhs.ocs-3A.1 (Nakamura et al., 2011). The conserved functions of PEBP homologs were found among different plant species. However, due to the differing expression patterns and multiple copies of PEBP family, the PEBP genes, even in the same subfamily, may have distinct functions. For example, in soybean (Glycine max), FT5a is involved in post-flowering stem growth other than the flowering-inducing role shared with FT2a (Takeshima et al., 2019). In rice, the FT homolog HD3A is the principal flowering regulator under short day, while the other FT homolog RICE FLOWERING LOCUS T1 (RFT1) mainly functions under long day (Komiya et al., 2008; Komiya et al., 2009).
As the importance of PEBPs in yield regulation has been demonstrated in many crops, characterizing and manipulating of the significant PEBP genes in quinoa will help improve the yield and cultivation area of quinoa. Recently, a few studies on FT subclade genes were carried out in Amaranthaceae family. In sugar beet (Beta vulgaris), two FT paralogs, BvFT1 and BvFT2, were identified. However, they harbor antagonistic functions in flowering (Pin et al., 2010). In C. rubrum, two FT homologs, CrFTL1 and CrFTL2, were identified, in which only CrFTL1, rather than CrFTL2, was up-regulated during floral transition (Chab et al., 2008). In Chenopodium species, the expression of FTL1 was correlated with floral induction in C. suecicum and short-day type C. ficifolium, whereas was not correlated with that in long-day type C. ficifolium (Storchova et al., 2019). These results suggested that those PEBPs of Chenopodium species, despite in the same clade, may have experienced functional diversification. Quinoa, an allotetraploid (AABB), had experienced numerous chromosomal rearrangements and chromosome fusions (Jarvis et al., 2017), which may increase the functional complexity of PEBP family. More recently, the quinoa FT subfamily genes were identified and their evolutionary relationships with other plants were assessed (Štorchová, 2020). Expressions of six CqFT genes were compared in early- and late-flowering quinoa accessions (Patiranage et al., 2021). Haplotypes of two CqFT genes were predicted to be associated with the photoperiod sensitivity of quinoa (Patiranage et al., 2021). These studies have improved our understanding of the plausible functions of quinoa FT-like subfamily members. Yet, functions of quinoa TFL1-like and MFT-like subfamily genes remain mysterious. Complete investigations into gene duplication, gene structure, cis-acting element in the promotor, and more important, the transcriptional changes of the whole PEBP family in various progresses are still required to further elucidate their specific roles. In this study, we analyzed the phylogenetic relationships, collinearities and duplication events between PEBP genes of sub-genome A and sub-genome B and relatives of diploid ancestors, and assessed their expression changes during inflorescence development and seed germination and detected their responses to night break and photoperiods, and further performed co-expression network analysis to predict the transcription factors upstream of PEBP genes. The results of this study will help identify the pivotal PEBP genes governing flowering time, inflorescence branching and seed germination, which may be utilized for quinoa breeding in future.
Materials and methods
Identification, and phylogenetic analysis of PEBP homologs from different plants
To identify the PEBP genes in various plant species, we performed BLASTP (E-value<1.0e-15) search against genomes of Arabidopsis thaliana, Spinacia oleracea, Oryza sativa and Beta vulgaris in Phytozome V13 (https://phytozome-next.jgi.doe.gov), and C. pallidicaule and C. suecicum in Chenopodium database (https://www.cbrc.kaust.edu.sa/chenopodiumdb/), using FT (AT1G65480.1), TFL (AT5G03840.1) and MFT (AT1G18100.1) protein sequences of Arabidopsis as the queries. Then those homologs were aligned with the Hidden Markov Model (HMM) profile of PEBP domain (PF01161) using Pfam search (E-value<1.0e-10) (Finn et al., 2016) to ensure those homologs habor a PEBP domain. Multiple sequence alignment of PEBP sequences from various species was performed using CLASTALW (Thompson et al., 2002). Phylogenetic tree was constructed using MEGA 11.0 (Tamura et al., 2021) based on the Neighbor-Joining method (Dohm et al., 2013) with a bootstrap value of 1000.
Chromosomal location, gene structure and conserved motif analysis
The General Feature Format (GFF) file and chromosome-scale genome sequence of quinoa were downloaded from Phytozome V13 database (https://phytozome-next.jgi.doe.gov/info/Cquinoa_v1_0). Based on these two files, the physical location on chromosomes, and intron and exon structures of PEBP genes were determined and visualized by using the two programs of Gene Location Visualize and Gene Structure View in TBtools (Chen et al., 2020). Multiple Em for Motif Elicitation (MEME) program (https://meme-suite.org/meme/tools/meme) was used to identify the conserved motifs in PEBP proteins setting the maximum motif count of 8. The motif analysis results were illustrated using the Gene Structure View program in TBtools (Chen et al., 2020).
Collinearity and gene duplication events analysis between PEBP genes of different species
The GFF file and chromosome-scale genome sequence of sugar beet (Beta vulgaris) were downloaded from Phytozome V13 database (https://phytozome-next.jgi.doe.gov/info/Bvulgaris_EL10_1_0). The GFF files and chromosome-scale genomes of quinoa and sugar beet were input into the Multiple collinear scanning tool (MCScanX) in TBtools (Chen et al., 2020) and the collinearity between quinoa and sugar beet genomes was analyzed. Then the collinearities between PEBP genes from quinoa and sugar beet were determined. Meanwhile, the duplication events among quinoa PEBP genes were analyzed. The results were visualized by using the Advanced Circos program in TBtools (Chen et al., 2020).
Distribution of cis-acting element in quinoa PEBP gene promoters
The 2000bp sequences upstream of the translation start site of PEBP genes were recognized as promoter regions. The promoter sequences were uploaded to the Plant Cis-Acting Regulatory Elements (PlantCARE) database to search cis-acting elements. The physical distribution of various cis-acting elements was displayed using Simple BioSequence Viewer in TBtools (Chen et al., 2020).
Expression analysis of PEBPs in various tissues and biological events
For tissue-specific expression pattern analysis, we used the RNA-seq data from Zou et al. (Zou et al., 2017). Raw data of various quinoa tissues, including 1-week-old seedling, stem, leaf, inflorescence from 6-week-old plants and dry seed, was downloaded from Sequence Read Archive (https://www.ncbi.nlm.nih.gov/sra) of the BioProject PRJNA394651. The fragments per kilobase of transcript per million fragments mapped (FPKM) value of each gene was calculated with the previously described methods (Wu et al., 2019; Wu et al., 2020; Wu et al., 2021). For gene expression analysis in quinoa inflorescences at six developmental stages, we investigated the FPKM values of PEBP genes in our published transcriptome data (Wu et al., 2019). YP1, YP2, YP3 and YP4 represent the young non-branching panicles, whereas P1 and P2 stand for the panicles of elder branching stages. Raw data generated from six-stage inflorescence samples was downloaded from SRA (BioProject PRJNA511332), and was further processed with the bioinformatic pipeline methods described before (Wu et al., 2020). To know gene expression changes of PEBP genes during seed germination, we used the published transcriptome data of our laboratory (Wu et al., 2020). We compared the expression levels (FPKM value) of PEBP genes in control and Abscisic acid (ABA)-treated seeds 5h and 15h after imbibition. To investigate PEBP gene expression changes in response to night-break (NB) treatment, we used our published RNA-seq data generated from leaf samples treated by short-day and NB conditions (Wu et al., 2021). To investigate the PEBP gene diurnal expression pattern changes in response to photoperiod, two-week-old quinoa seedlings were cultivated under short-day (8h/16h, light/dark) and long-day (16h/8h, light/dark) conditions for sampling and RNA-seq analysis. The top two fully-expanded leaves of 3~5 plants were harvested at the time point of 17:00, 20:00, 23:00, 02:00, 05:00, 08:00, 11:00 and 14:00, with two biological replicates. All the leaf samples were subjected to RNA extraction, high-throughput sequencing and data analysis as previously described (Wu et al., 2019; Wu et al., 2021).
Prediction of the co-expressed transcription factors with PEBPs
The expression profiles of 32 samples covering 16 time points of SD and LD were subjected to weighted gene co-expression network analysis (WGCNA) by applying R package, with the parameters set as following: gene expression threshold: FPKM≥1.0, power=1, minimum module size=30, minimum height for merging modules=0.25. As a result, 3972 genes were sorted into 6 co-expressed modules. CqFTL5 and CqFTL8 with were clustered into the blue module containing 934 co-expressed genes. Then all the 934 protein sequences in blue module were uploaded to PlantTFDB v5.0 website (Jin et al., 2017) (http://planttfdb.cbi.pku.edu.cn) for TF prediction.
Results and discussion
Identification, phylogenetic relationship and chromosomal location analysis of PEBPs in quinoa
By using BLASTP and Pfam search methods, 23 PEBP homologous genes were identified in quinoa genome. The shortest quinoa PEBP gene (AUR62033889, named CqFTL3), encoding for 88 amino acid residues (Table 1), was predicted to harbor an incomplete PEBP domain. The longest PEBP gene (AUR62013052, named CqFTL2), encoding for 339 amino acid residues (Table 1), was predicted to harbor two PEBP domains. These results are in line with the points in previous study (Jarvis et al., 2017; Štorchová, 2020), indicating that CqFTL3 may be a pseudogene and CqFTL2 may experience tandem duplication.
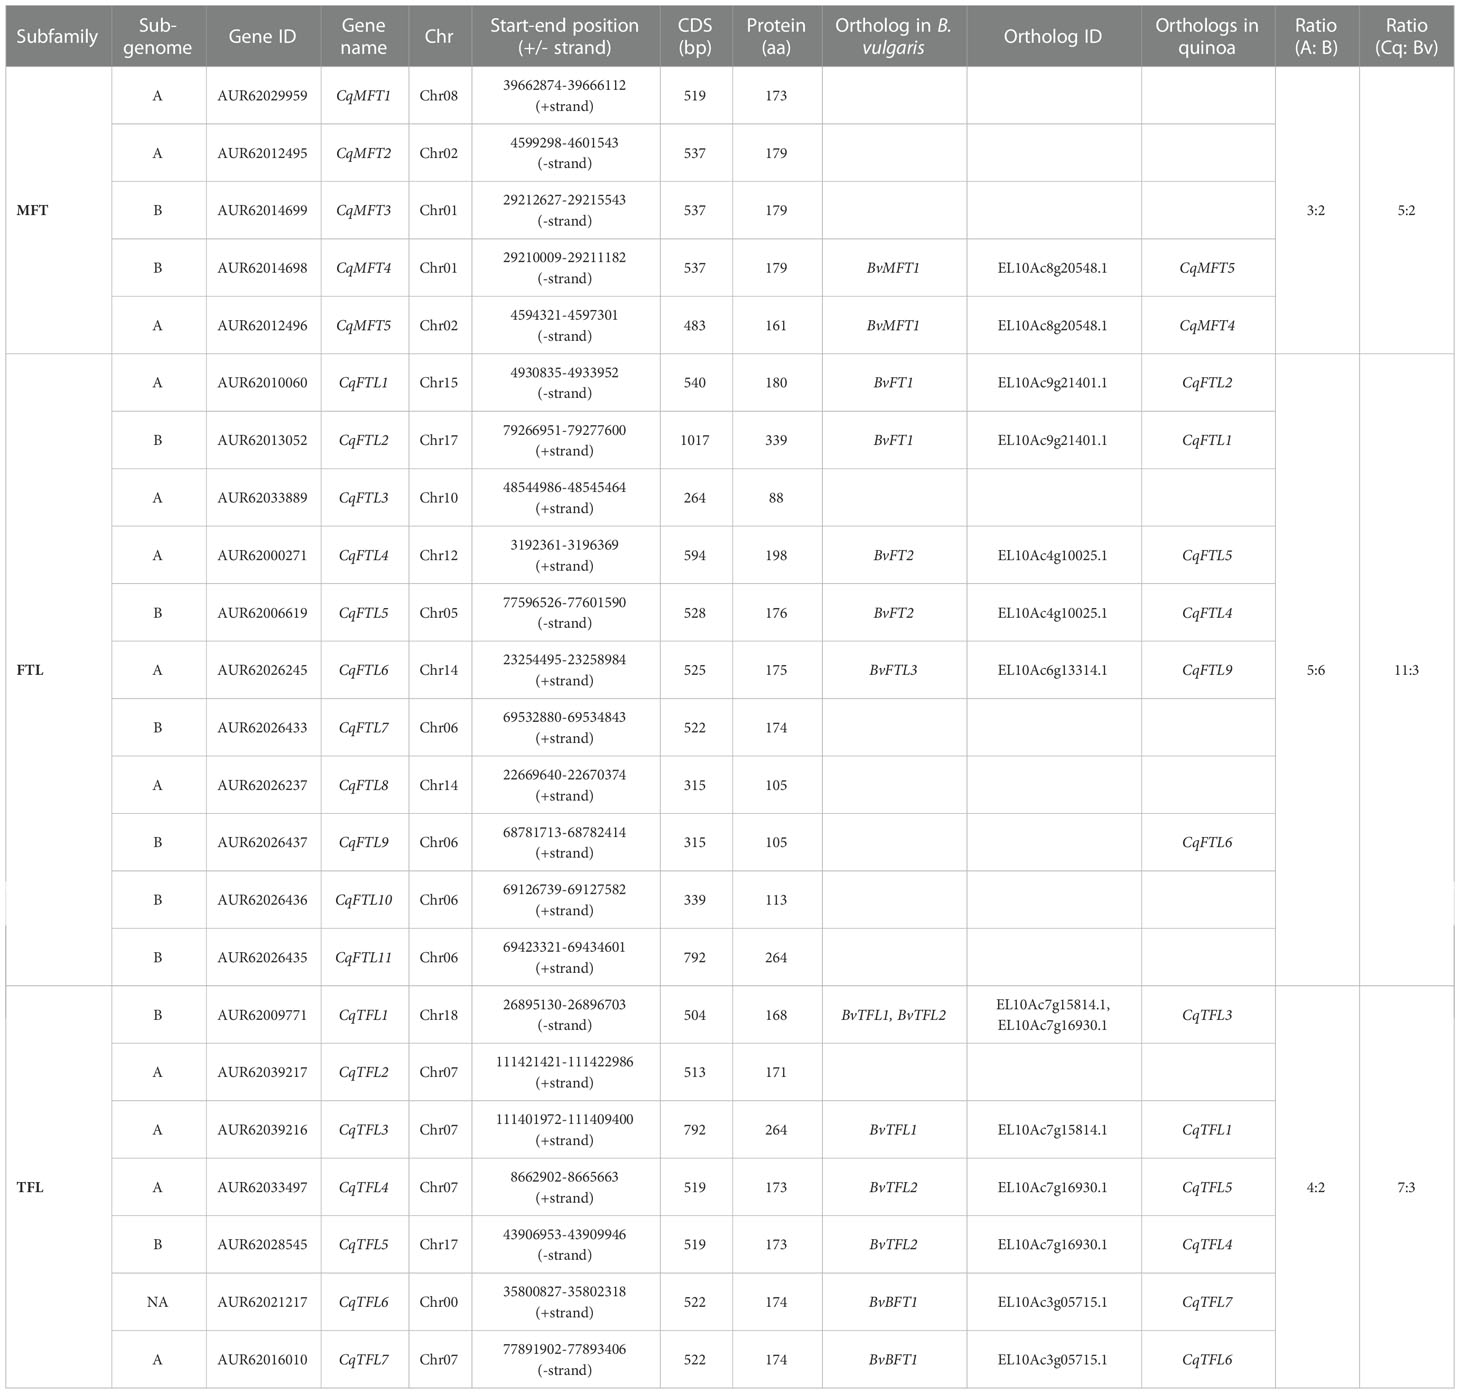
Table 1 Summary of PEBP gene family in C. quinoa and B. vulgaris.
To evaluate the phylogenetic relationships between PEBP genes of quinoa, and closet relatives of its diploid ancestors, C. pallidicaule (AA) and C. suecicum (BB), and its relatives in Amaranthaceae family, spinach (Spinacia oleracea) and sugar beet (Beta vulgaris), and model dicot and monocot plants, Arabidopsis (Arabidopsis thaliana) and rice (Oryza sativa), a Neighbor-Joining phylogenetic tree containing 83 sequences (Supplementary File 1) was inferred using MEGA 11.0 (Tamura et al., 2021). As displayed in Figure 1, 23 quinoa PEBP genes were sorted into three major subfamilies. Quinoa contains 5 MFT clade members, named CqMFT1 to CqMFT5, 11 FT-like (FTL) clade members, named CqFTL1 to CqFTL11, 7 TFL1-like (TFL) clade members, named CqTFL1 to CqTFL7 (Figure 1). C. pallidicaule contains 3 MFTs, 4 FTLs and 3 TFLs, and C. suecicum contains 2 MFTs, 5 FTLs and 3 TFLs (Figure 1).
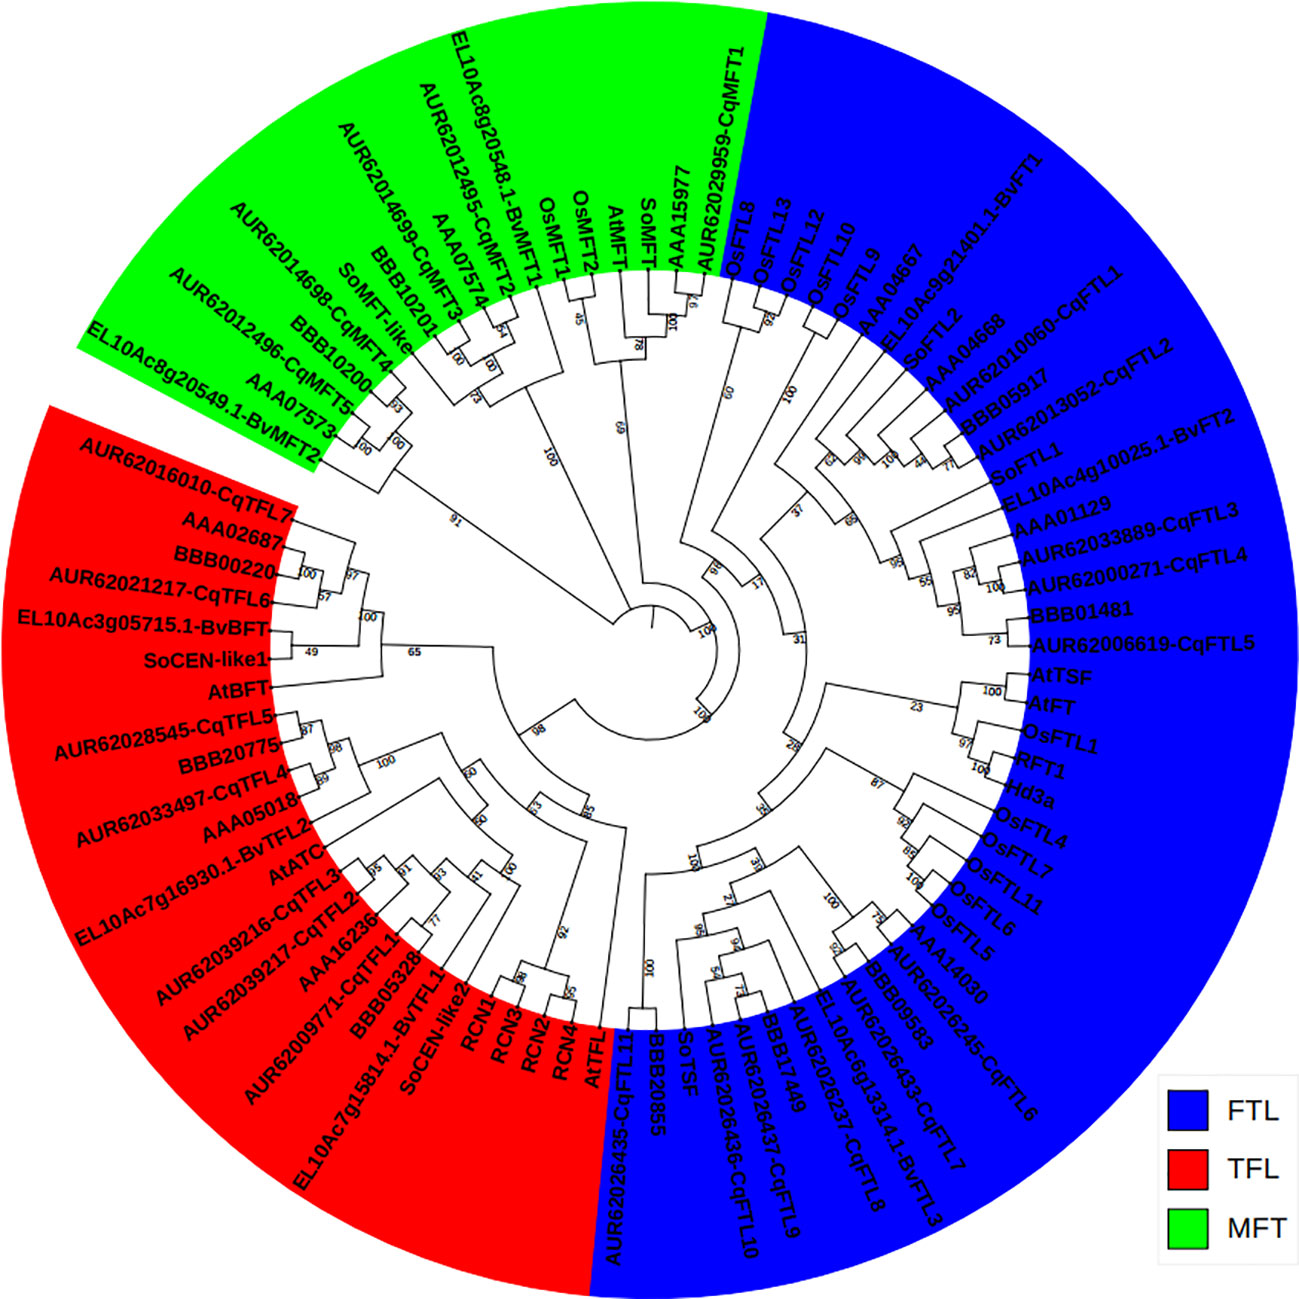
Figure 1 Phylogenetic relationship between the PEBP genes from Chenopodium quinoa, C. pallidicaule, C. suecicum, Beta vulgaris, Spinacia oleracea, Arabidopsis thaliana and Oryza saltiva. The PEBP protein sequences were downloaded from Phytozome V13 database. MFT, FT and TFL subclades are colored in green, blue and red, respectively. A total of 83 protein sequences were aligned using CLASTALW in MEGA 11.0. The phylogenetic tree was constructed by MEGA 11.0 using the Neighbor-Joining method with a bootstrap of 1000. The tree is unrooted, bootstrap values are indicated on branches.
Then, we drew a chromosomal location map of PEBPs. As illustrated in Figure 2, 23 PEBP genes are distributed on 12 chromosomes with the exception that CqTFL6 is anchored on Chr00. Sub-genome A and sub-genome B have nearly equal number of PEBPs. Chr06 of sub-genome B and Chr07 of sub-genome A contain the largest number of CqFTLs and CqTFLs, respectively.
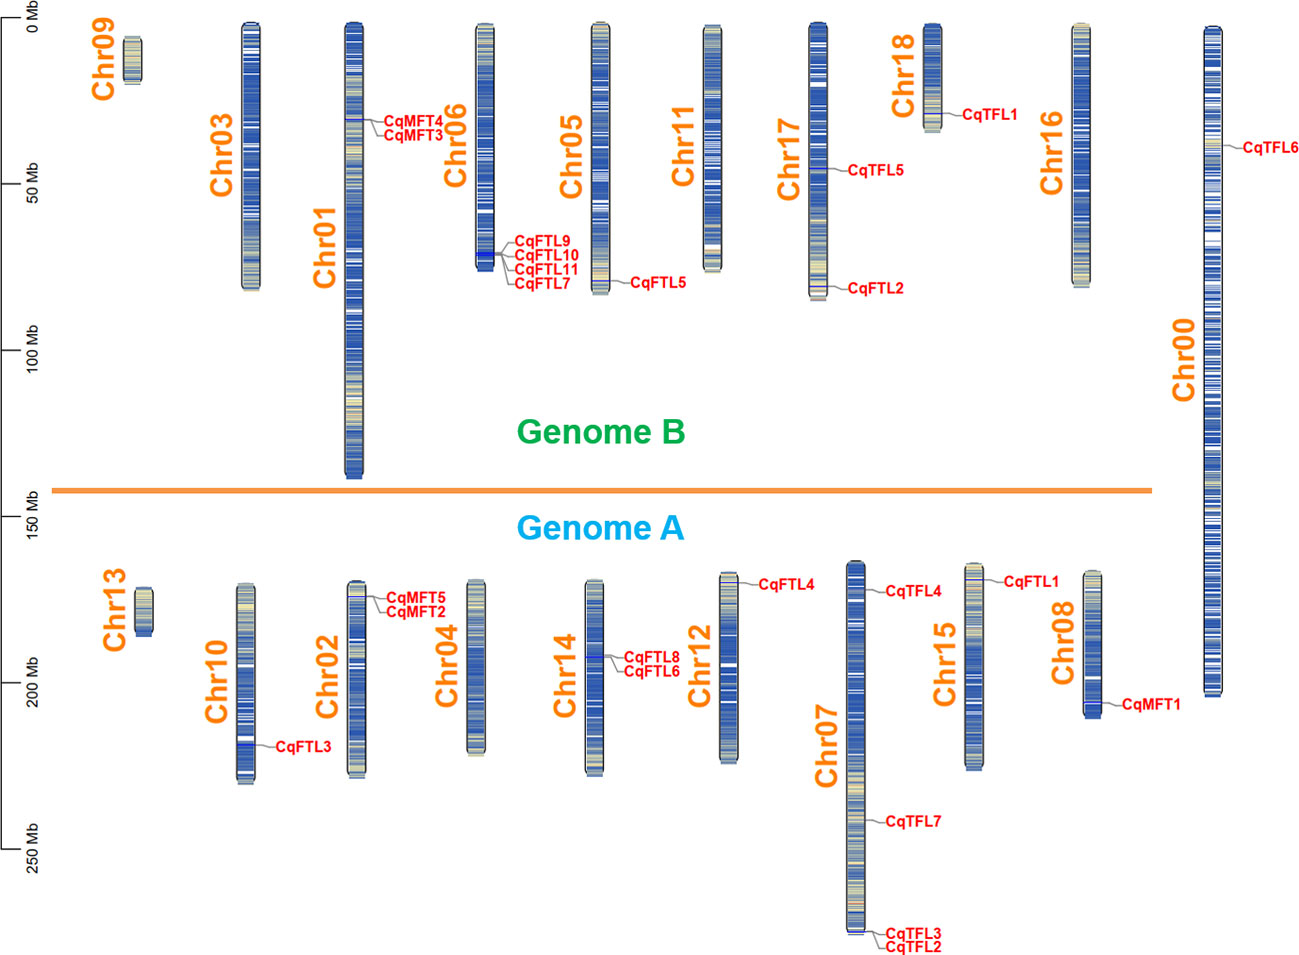
Figure 2 Physical location of PEBP genes on quinoa chromosomes. Chromosome segments colored in white and blue indicate high and low gene densities, respectively. All the quinoa chromosomes are divided into sub-genome A and B with the exception of Chr00.
Gene structure and conserved motifs of PEBP genes
Diagram of PEBP gene structures shows that, out of 23 PEBPs, most (17 of 23) harbor 4 exons and 3 introns (Figure 3). CqFTL2 contains the most (8 exons and 7 introns), whereas CqFTL3 contains the least (2 exons and 1 intron) number of exons and introns (Figure 3). MEME program was used to identify the conserved motifs in quinoa PEBP proteins. A total of 8 conserved motifs were identified in PEBP proteins (Figure 3). Motif composition schematic analysis indicates that motif 1, 2, 3, 4 and 5 were constitutively occurred in most of the PEBP genes (Figure 3). Yet, several PEBP proteins lack some specific motifs. For example, CqFTL2 lacks motif 1, 2 and 3; CqFTL8, CqFTL9 and CqFTL10 lack motifs 2 and 3; CqFTL11 lacks motif 4; CqMFT1 lacks motif 5; CqMFT4 lacks motifs 2, 4, and 5 (Figure 3). In addition, we found that motif 6 was occurred in most of the FTL and TFL subfamilies, whereas was absent in MFT subfamily (Figure 3). Motif 7 instead of motif 8 was possessed by most of the FTL subfamily members, while motif 8 was exclusively occurred in majority of TFL and MFT subfamilies (Figure 3). As PEBP proteins usually interact with other proteins (Taoka et al., 2013; Tsuji et al., 2013), such as FD and 14-3-3 proteins, to exert their roles, we speculated that these distinct motif compositions of quinoa PEBPs may result in varied protein-protein interactions and function diversities.
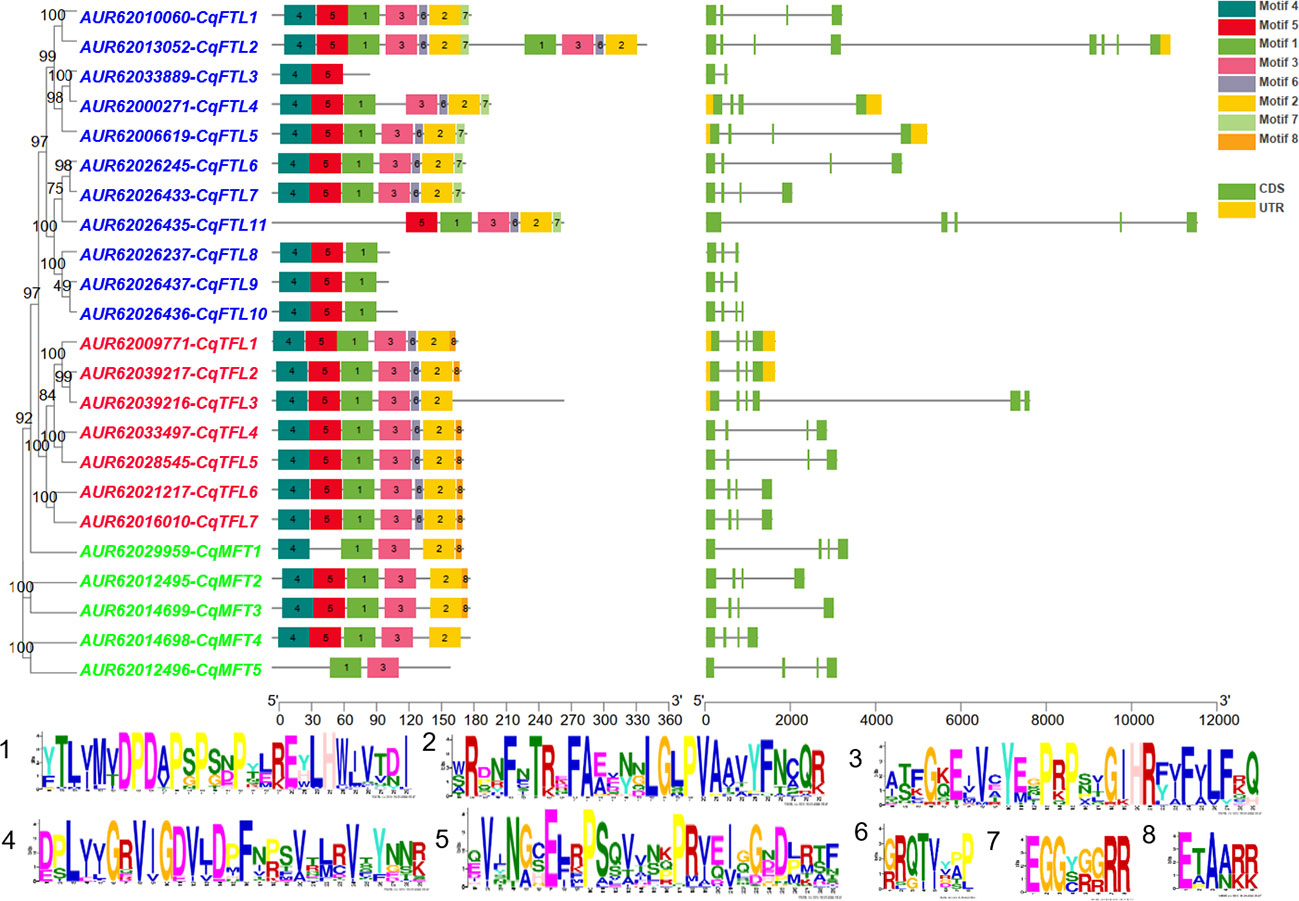
Figure 3 Diagram shows the conserved amino acid motifs and gene structure of PEBP genes in quinoa. The conserved motifs were identified by MEME. A total of 8 motifs were discovered among all PEBP genes. Different motifs are indicated by the colored boxes. Motif 1 to motif 5 are appeared in most PEBP proteins. Amino acid sequences of the conserved motifs are listed below. The identities of FT, TFL and MFT subclade genes are colored in blue, red and green in phylogenetic tree at the left side. Exons, introns and untranslated regions (UTRs) of PEBP genes are denoted by green, yellow boxes and dark lines, respectively.
Multiple sequence alignment suggests that the conserved amino acid residue tyrosine (Y) or histidine (H) in motif 1 is a key site distinguishing FTL and TFL clades (Figure 4), in consistent with the findings in PEBP families of other plants (Wang et al., 2015). Besides, as the occurrences of motif 7 and motif 8 in FTL and TFL/MFT subfamilies are mutually exclusive (Figure 4), we speculated that in these two motifs there may be specific amino acid residues distinguishing FTL and TFL/MFT clades. As expected, we found that, the third amino acid residue in motif 7 and 8 was Glycine (G) in FTL genes, whereas it was Alanine (A) in TFL and MFT genes (Figure 4). Thus, this key site (G/A) may provide as a novel site for investigation of the converse functions of FTL and TFL/MFT clades.
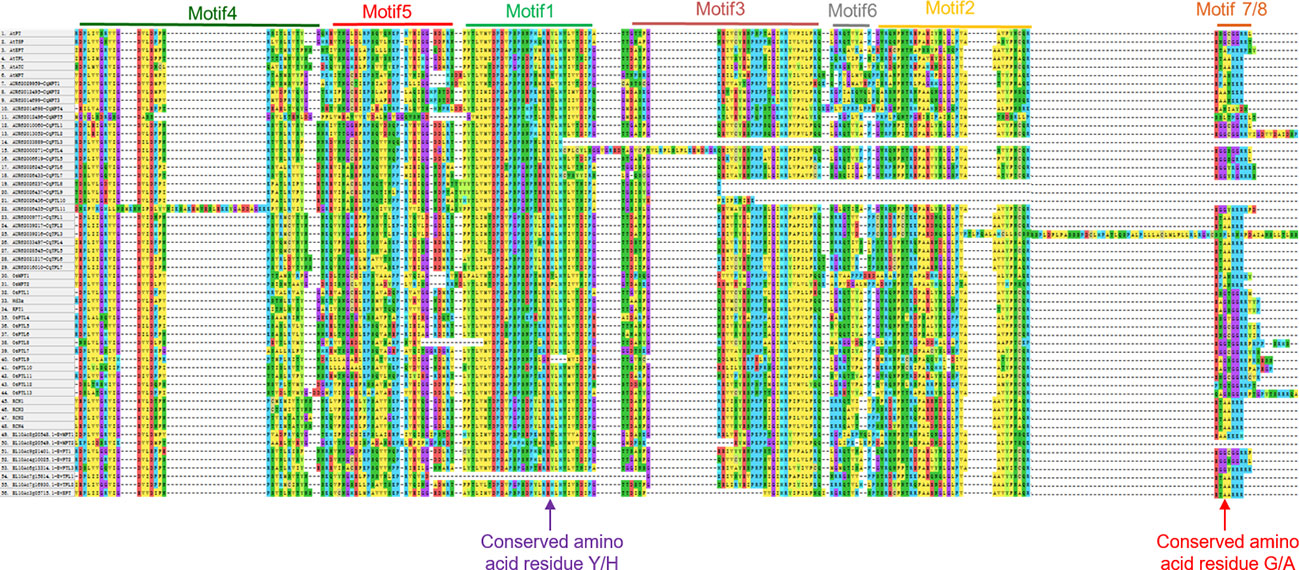
Figure 4 Multiple sequence alignment of the PEBP proteins from different plants. Sequences numbered with 1 to 6, 7 to 29, 30 to 48 and 49 to 56 stand for PEBP genes from Arabidopsis, rice, quinoa and sugar beet, respectively. The conserved motif 1 to motif 5 are indicated at the top of aligned sequences. Red arrow indicates the key conserved amino acid residue that determines FT and TFL subclade functions.
Gene duplication, collinearity and evolutionary history of PEBPs
Diploid sugar beet contains 8 PEBP genes in the genome. As a close relative of sugar beet, theoretically tetraploid quinoa (AABB) should has doubled number of PEBP homologs. However, we identified 23 PEBPs, nearly 3 times of that in B. vulgaris (Table 1). We wondered what caused the disproportional PEBP family expansion. Gene number ratios between quinoa and sugar beet in MFT and TFL clades are 5:2 and 7:3, respectively (Table 1). Surprisingly, gene number ratio in FTL clade is 11:3 (Table 1), remarkably higher than the plausible ratio 2:1. We analyzed the collinearities of PEBP genes between sub-genomes, and found that a total of 7 orthologous gene pairs from sub-genome A and B, including CqMFT4/CqMFT5, CqFTL1/CqFTL2, CqFTL4/CqFTL5, CqFTL6/CqFTL9, CqTFL1/CqTFL3, CqTFL4/CqTFL5 and CqTFL6/CqTFL7, displayed collinear relationships (Table 1; Figure 5A). In addition, CqTFL1 and CqTFL5 also displayed collinearity (Figure 5A), indicating inner sub-genome duplication. Collinearity analysis between quinoa and sugar beet genomes showed that, 13 out of 23 PEBP genes of quinoa were orthologous to 7 out of 8 PEBPs of sugar beet (Table 1; Figure 5B). Due to the allotetraploidy of quinoa genome, most of the sugar beet PEBPs have two sister genes, from quinoa sub-genome A and sub-genome B, respectively. There are 7 orthologous clusters, including CqMFT4/CqMFT5-BvMFT1, CqFTL1/CqFTL2-BvFT1, CqFTL4/CqFTL5-BvFT2, CqFTL6-BvFTL3, CqTFL1/CqTFL3-BvTFL1, CqTFL1/CqTFL4/CqTFL5-BvTFL2 and CqTFL6/CqTFL7-BvBFT1 (Table 1; Figure 5B). Most of these orthologous groups are in line with the gene pairs from sub-genome A and sub-genome B. There are 3 copies of quinoa TFL gene in the CqTFL1/CqTFL4/CqTFL5-BvTFL2 cluster (Figure 5B), probably rising from the segmental duplication events between Chr17 and Chr18 in sub-genome B (Figure 5A).
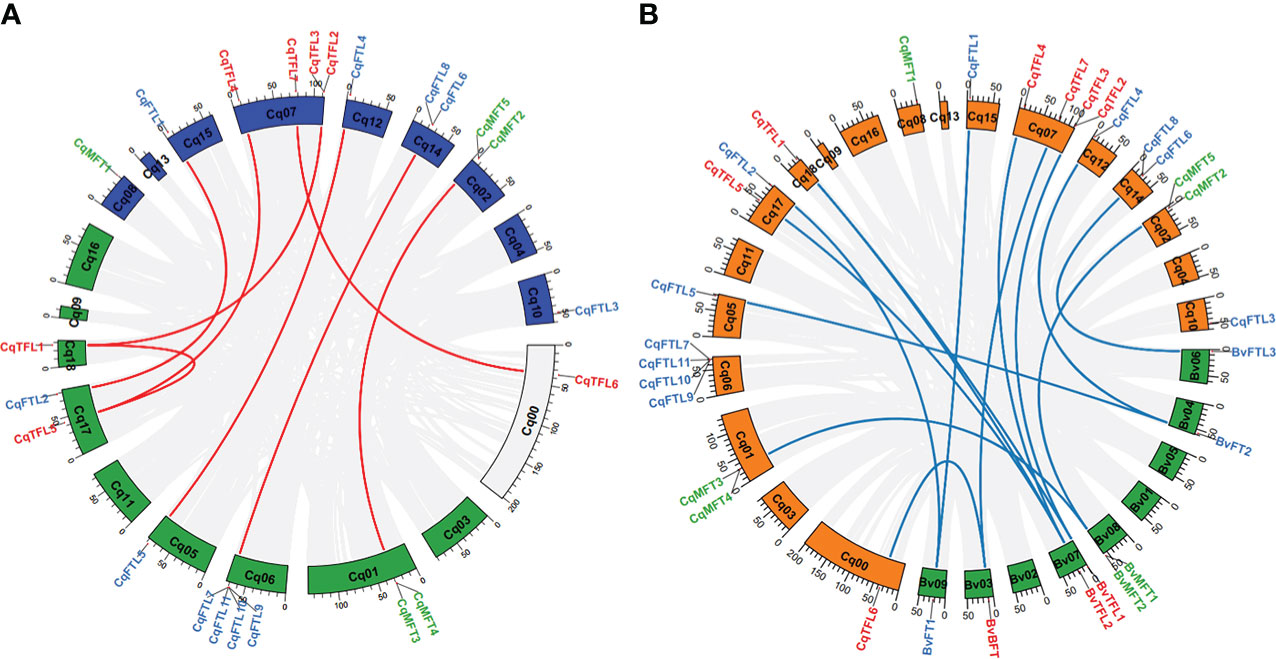
Figure 5 Circos plots shows the syntenic relationships between PEBPs from sub-genome A and B of quinoa and between PEBPs of quinoa and sugar beet. (A) Schematic representation of the syntenic relationships between homoeologous PEBPs of sub-genome A (blue) and B (green). Gray lines connect the homoeologous gene pairs of different chromosomes. Homoeologous PEBPs in quinoa are linked by red lines. (B) Syntenic relationships between the homoeologous PEBPs of quinoa and sugar beet. Chromosomes of quinoa and sugar beet are colored in green and orange, respectively. Gray lines connect the homoeologous gene pairs of quinoa and sugar beet. Blue lines connect the homoeologous PEBP gene pairs of quinoa and sugar beet.
The rest of PEBPs, including CqMFT1, CqMFT2, CqMFT3, CqFTL3, CqFTL7, CqFTL8, CqFTL10, CqFTL11 and CqTFL2, lack syntenic regions. We analyzed the gene physical locations, and found some of them were distributed in close vicinity to the other PEBP genes (Table 1; Figure 2). Among those genes, 4 tandem repeats were found, including CqMFT3/CqMFT4 on Chr01, CqMFT2/CqMFT5 on Chr02, CqFTL9/CqFTL10/CqFTL11/CqFTL7 on Chr06 and CqTFL2/CqTFL3 on Chr07 (Table 1; Figure 2). Notably, all these tandem repeats are located on distal telomeric ends of chromosomes (Figure 5A), indicating possible higher frequency of tandem duplications in distal telomeric segments. In general, these evidences indicated that tandem duplication is the major mechanism underlying PEBP family expansion.
Then, we analyzed the rise of gene duplication of PEBPs by combining phylogenetic analysis with collinearity analysis. According to the genome map of sugar beet, BvMFT1 and BvMFT2 are in tandem repeat location. Meanwhile, we found the orthologs, in the relatives of sub-genome A (AAA07574/AAA07573 in C. pallidicaule) and sub-genome B (BBB10201/BBB10201 in C. suecicum), are also in tandem repeat locations. Thus, we deduced that the tandem duplications of CqMFT3/CqMFT4 and CqMFT2/CqMFT5 happened before the divergence of the ancestor of Chenopodium from sugar beet, far before the tetraploidization of quinoa. Though CqMFT1 was in non-synteny with sugar beet and C. suecicum, however, it is sister to the MFT genes of Arabidopsis, and C. pallidicaule and spinach. Phylogenetic analysis indicated that the tandem duplication of CqTFL2/CqTFL3 was happened after the ancestor of sub-genome A diverged from C. pallidicaule. CqFTL3, a sister of CqFTL4 in the phylogenetic tree, but is in non-syntenic region and lacks 4 motifs of CqFTL4, indicating that gene amplification may occur through transposable elements. CqFTL8, despite located nearby CqFTL6, but was not detected as a tandem repeat with CqFTL6 (Figure 5A). Meanwhile, CqFTL8 is in non-syntenic region and lacks motif 3, 6, 2, 7 compared with the other CqFTL genes (Figure 3), indicating it might arise from small-scale transposition. Synteny was found in CqFTL9 of sub-genome A and CqFTL6 of sub-genome B (Figure 5A), whereas only CqFTL6, rather than CqFTL9, has synteny with BvFTL3 of sugar beet (Figure 5B), suggesting the tandem duplication in CqFTL9/CqFTL10/CqFTL11/CqFTL7 possibly was generated after the divergence of the ancestor of sub-genome B from sugar beet.
Distribution of cis-acting elements in PEBP promoters
Cis-acting elements in gene promotor have important regulatory roles mediating transcriptional activation and repression, and various cis-acting elements controlling specific progresses have been identified. To predict and understand the versatile functions of PEBP genes, we explored the cis-acting elements in promotors. Two kilo base pairs upstream of the translational start site of PEBP genes were submitted to PlantCARE database for cis-acting elements prediction. As displayed in Figure 6, various cis-acting elements, related to light, phytohormones, cold, drought and circadian clock responses, were identified. Light responsive elements (LREs) take a great proportion among various cis-acting elements in PEBP promoters, suggesting that PEBPs may be tightly associated with light biological events. A total of 8 kinds of LREs were identified. LRE_Box4 and LRE_G-box were the two major elements distributed in all PEBP promoters. Some cis-acting elements showed gene-specific distribution patterns. CqFTL8 promoter harbors the most abundant LRE_Box4. CqFTL11 promoter harbors more LRE_Sp1. LRE_G-box rather than LRE_Box4 was more abundant in the promoters of MFT clade. More low-temperature responsive elements (LTRs) were enriched in CqMFT1 promoter, indicating the possible roles of CqMFT1 in sensing cold stress. Circadian regulatory elements (Circadian) were only distributed in the promoters of CqFTL7, CqFTL11, CqMFT2, CqTFL2 and CqTFL3. Abscisic acid responsive elements (ABREs) were abundantly located in promoters of CqMFT2 and CqMFT3, indicating these two gene may be involved in ABA signaling. In addition, we noticed distributions of the cis-acting elements in promoters of some gene pairs were also in synteny. The distributions of ABRE, AuxRR-core, LRE_Box4, LRE_G-box, LRE_GT1-motif, LRE_Sp1 and LRE_TCT-motif in CqFTL1 promoter were in synteny with that in CqFTL2 promoter. This is in line with the collinearity between these two genes. The distributions of the cis-acting elements including Circadian, GRE_P-box, LRE_Box4, LRE_chs-CMA1a and LRE_GT1-motif in CqTFL2 promoter were in highly collinear relationship with that in CqTFL3 promoter. This may be caused by the tandem duplication of CqTFL2/CqTFL3. The specific distributions of cis-acting elements in PEBP promoters suggest their possible roles in different biological events.
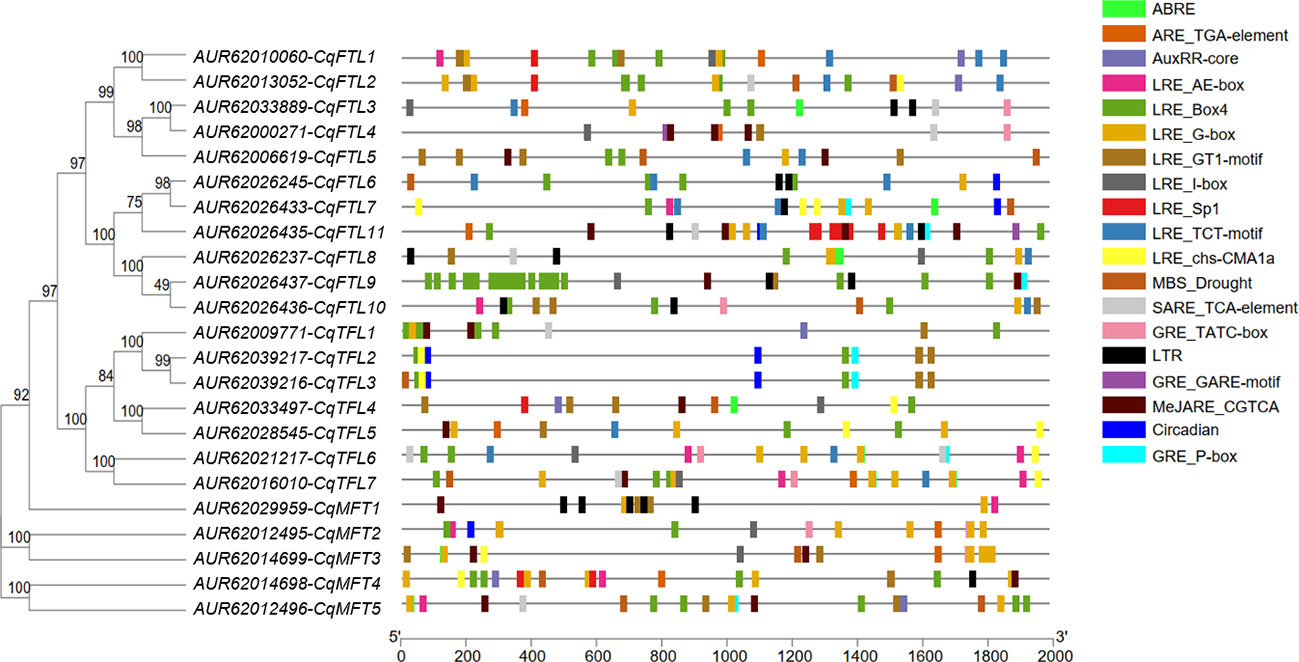
Figure 6 Illustration shows the physical locations of various cis-acting elements in the promoter regions of PEBPs. Promoter sequences of quinoa PEBPs were submitted to PlantCARE database to identify various cis-acting elements. Boxes with different colors indicate various cis-acting elements located in the promoter regions of PEBPs. Abbreviations and sequences: ABRE, abscisic acid responsive element, ABRE: ACGTG; ARE, auxin-responsive element, ARE_TGA-element: AACGAC; AuxRR, auxin responsive element, AuxRR-core: GGTCCAT; LRE, light responsive element, LRE_AE-box: AGAAACAA, LRE_Box 4: ATTAAT, LRE_G-box: CACGTG, LRE_GT1-motif: GGTTAA, LRE_I-box: AGATAAGG, LRE_Sp1: GGGCGG, LRE_TCT-motif: TCTTAC, LRE_chs-CMA1a: TTACTTAA; MBS, MYB binding site, MBS_Drought: CAACTG; SARE, salicylic acid responsive element, SARE_TCA-element: CCATCTTTTT; GRE, gibberellin-responsive element, GRE_TATC-box: TATCCCA, GRE_GARE-motif: TCTGTTG, GRE_P-box: CCTTTTG; LTR, low-temperature responsive element, CCGAAA; MeJARE, MeJA-responsive element, MeJARE_CGTCA: CGTCA; Circadian, circadian regulatory element, Circadian: CAAAGATATC.
Tissue-specific expression analysis of PEBPs
To characterize the expression patterns of PEBPs in various quinoa organs, we analyzed the RNA-seq data and compared the FPKM values of 23 PEBP genes in seedling, leaf, stem, inflorescence and seed. Out of 23 PEBP genes, 18 were expressed in at least one organ tissue (Figure 7; Supplementary File 2). Generally, expressions of PEBPs in various tissues were clade-specific. FTL clade genes were more enriched in leaf, stem and inflorescence, and TFL clade genes were abundant in seedling, stem and inflorescence, whereas expressions of the MFT clade genes were relatively higher in seed (Figure 7). It seems like that expressions of the MFT clade genes are more conserved, and all the MFT gene pairs were expressed in similar patterns (Figure 7). By contrast, expressions of the orthologous gene pairs in FTL and TFL clades were likely differing (Figure 7). For CqFTL1/CqFTL2, CqFTL1 was highly enriched in inflorescence, whereas CqFTL2 was ubiquitously expressed in all tissues (Figure 7). For CqFTL4/CqFTL5, CqFTL4 was expressed mainly in leaf, and CqFTL5 was abundant in leaf and stem (Figure 7). Another branch containing CqFTL7 and CqFTL8 was expressed specifically in leaf (Figure 7). For CqTFL1/CqTFL3, higher expressions of CqTFL1 were detected in both stem and inflorescence, and CqTFL3 was specifically abundant in stem (Figure 7). The duplicated gene of CqTFL2, CqTFL3, was also expressed mainly in stem (Figure 7). For CqTFL6/CqTFL7, CqTFL6 was specifically expressed in seedling, whereas CqTFL7 transcripts were abundant in seedling and inflorescence (Figure 7). CqTFL4/CqTFL5 harbored similar expression patterns, both were specifically expressed in seedling. The differing expression patterns in gene pairs indicate the possible diversified roles of orthologs from sub-genome A and sub-genome B.
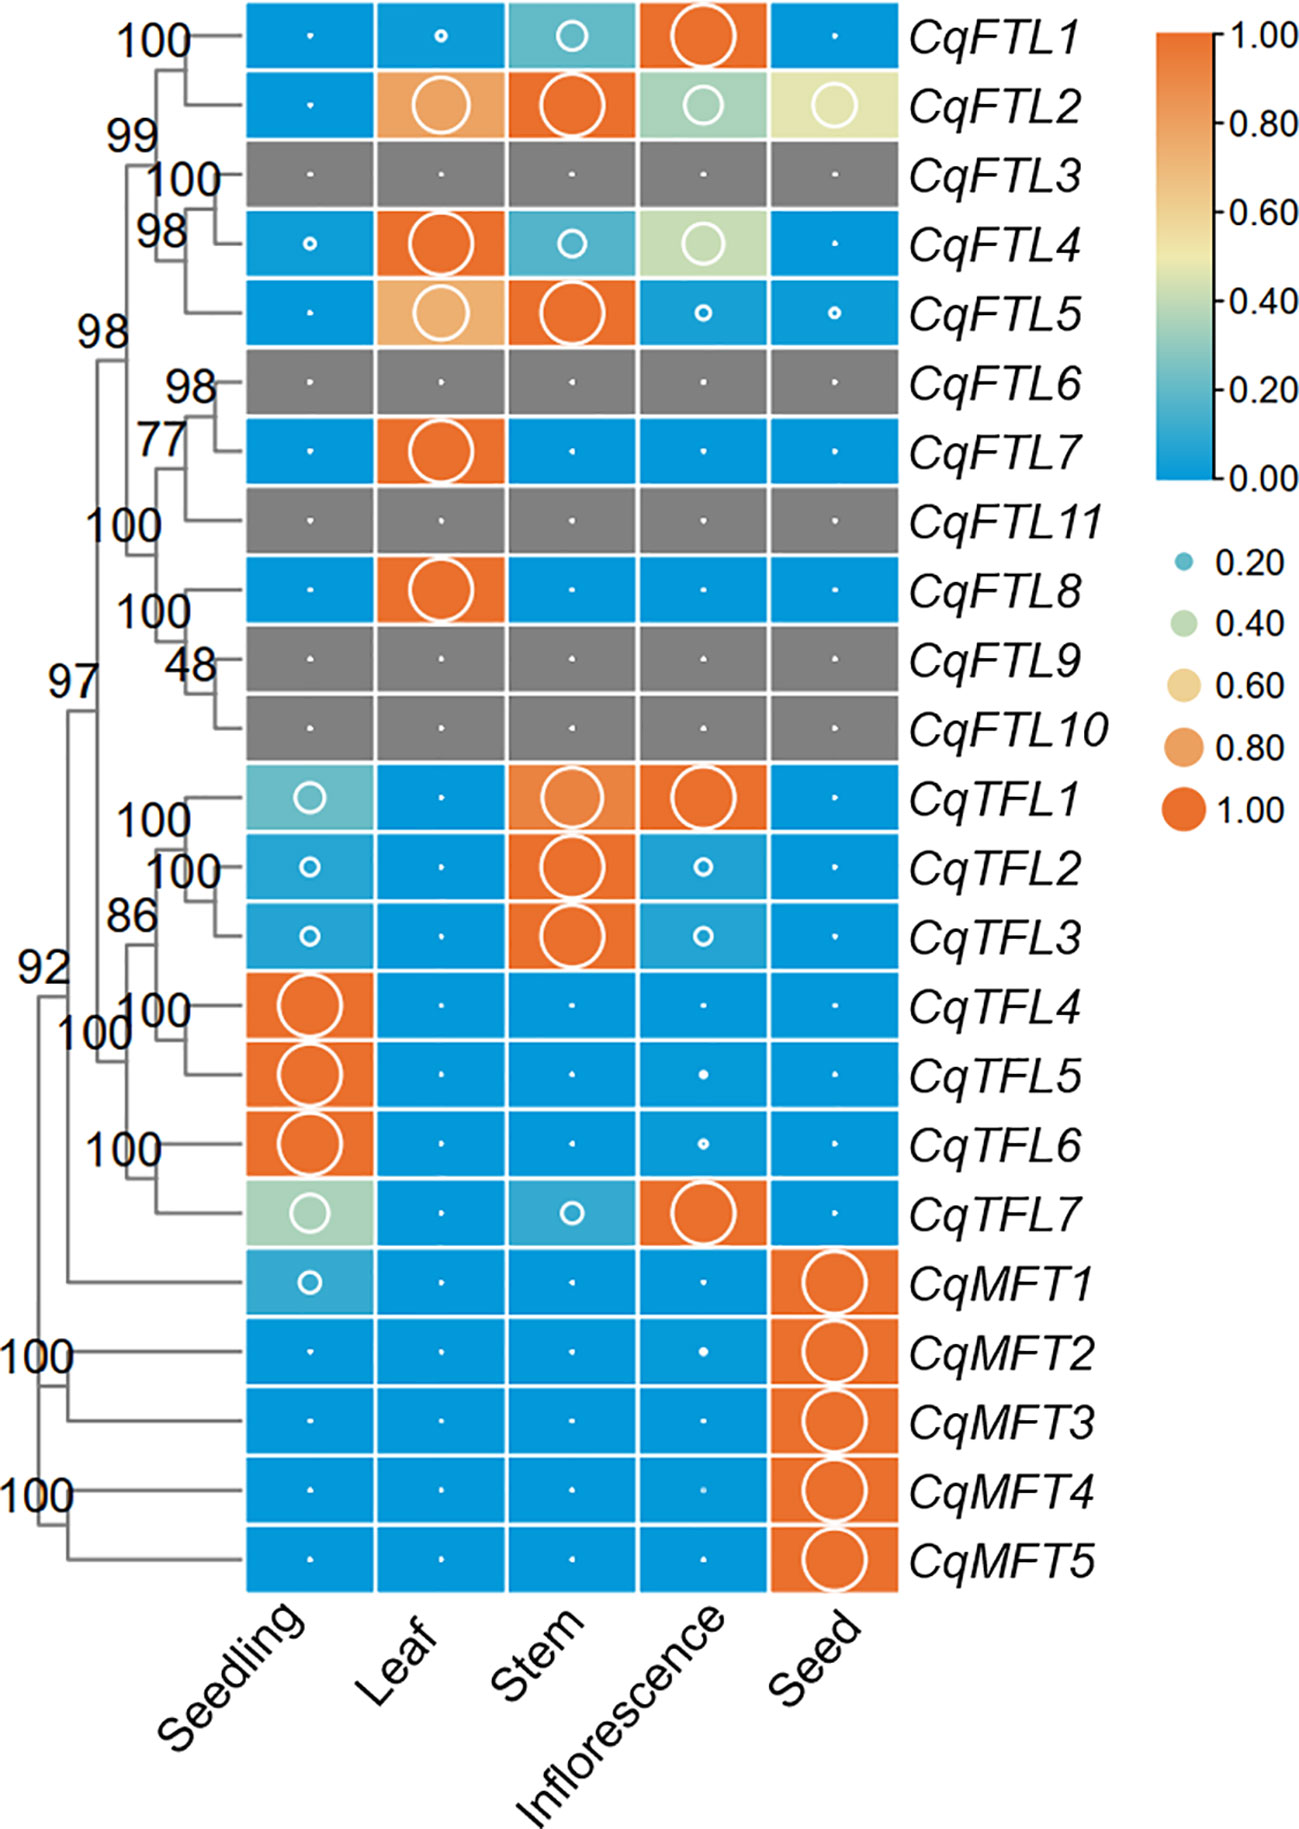
Figure 7 Expression profiles of PEBP genes in 5 quinoa tissues. The expression value is denoted by FPKM values (cutoff=0.1) generated by using the RNA-seq data from Zou et al. (Zou et al., 2017). Each expression value was generated from three replicates. Orange boxes with larger-size bubbles indicate higher expression levels. Expressions in various tissues of the same gene were normalized to 0 to 1 by row.
The PEBPs involved in inflorescence branching
Branching of inflorescence is a key factor influencing plant architecture and yield. Numerous evidences have suggested the important roles of PEBP genes in inflorescence branching and yield control (Teo et al., 2014; Benlloch et al., 2015). To investigate which quinoa PEBP members are potential regulator for panicle branching, we analyzed the expression changes of PEBPs across 6 developmental stages, before and after panicle branching. Expressions of 19 PEBPs were detected in at least one stage (Figure 8; Supplementary File 2). Differing from the diversified expressions in tissues above, most of the orthologous gene pairs in FTL and TFL clades showed similar expression patterns. For FTL clade, with the exception that CqFTL3 and CqFTL4 were expressed ubiquitously at non-branching stages (YP1 to YP4) (Figure 8), expressions of CqFTL1/CqFTL2, CqFTL5, CqFTL6/CqFTL9 and CqFTL8, ascended with the development of inflorescence and were abundant at branching stages (P1 and P2) (Figure 8). For TFL clade, expression levels of gene pairs CqTFL1/CqTFL3, CqTFL4/CqTFL5, and the duplicated gene of CqTFL3, CqTFL2 were relatively higher at non-branching stages (YP1 and YP2) while descended with the development of inflorescence (Figure 8), whereas the gene pairs CqTFL6/CqTFL7 were relatively abundant in branching stages (P2) (Figure 8). Most of the MFT clade genes were ubiquitously expressed across all stages (Figure 8). The specific expressions of CqTFL1/CqTFL2/CqTFL3 and CqTFL4/CqTFL5 at non-branching stages, and the enrichment of CqFTL1/CqFTL2, CqFTL5, CqFTL6/CqFTL9, CqFTL8 and CqTFL6/CqTFL7 at branching stages, suggest that those PEBPs may participate in panicle architecture regulation.
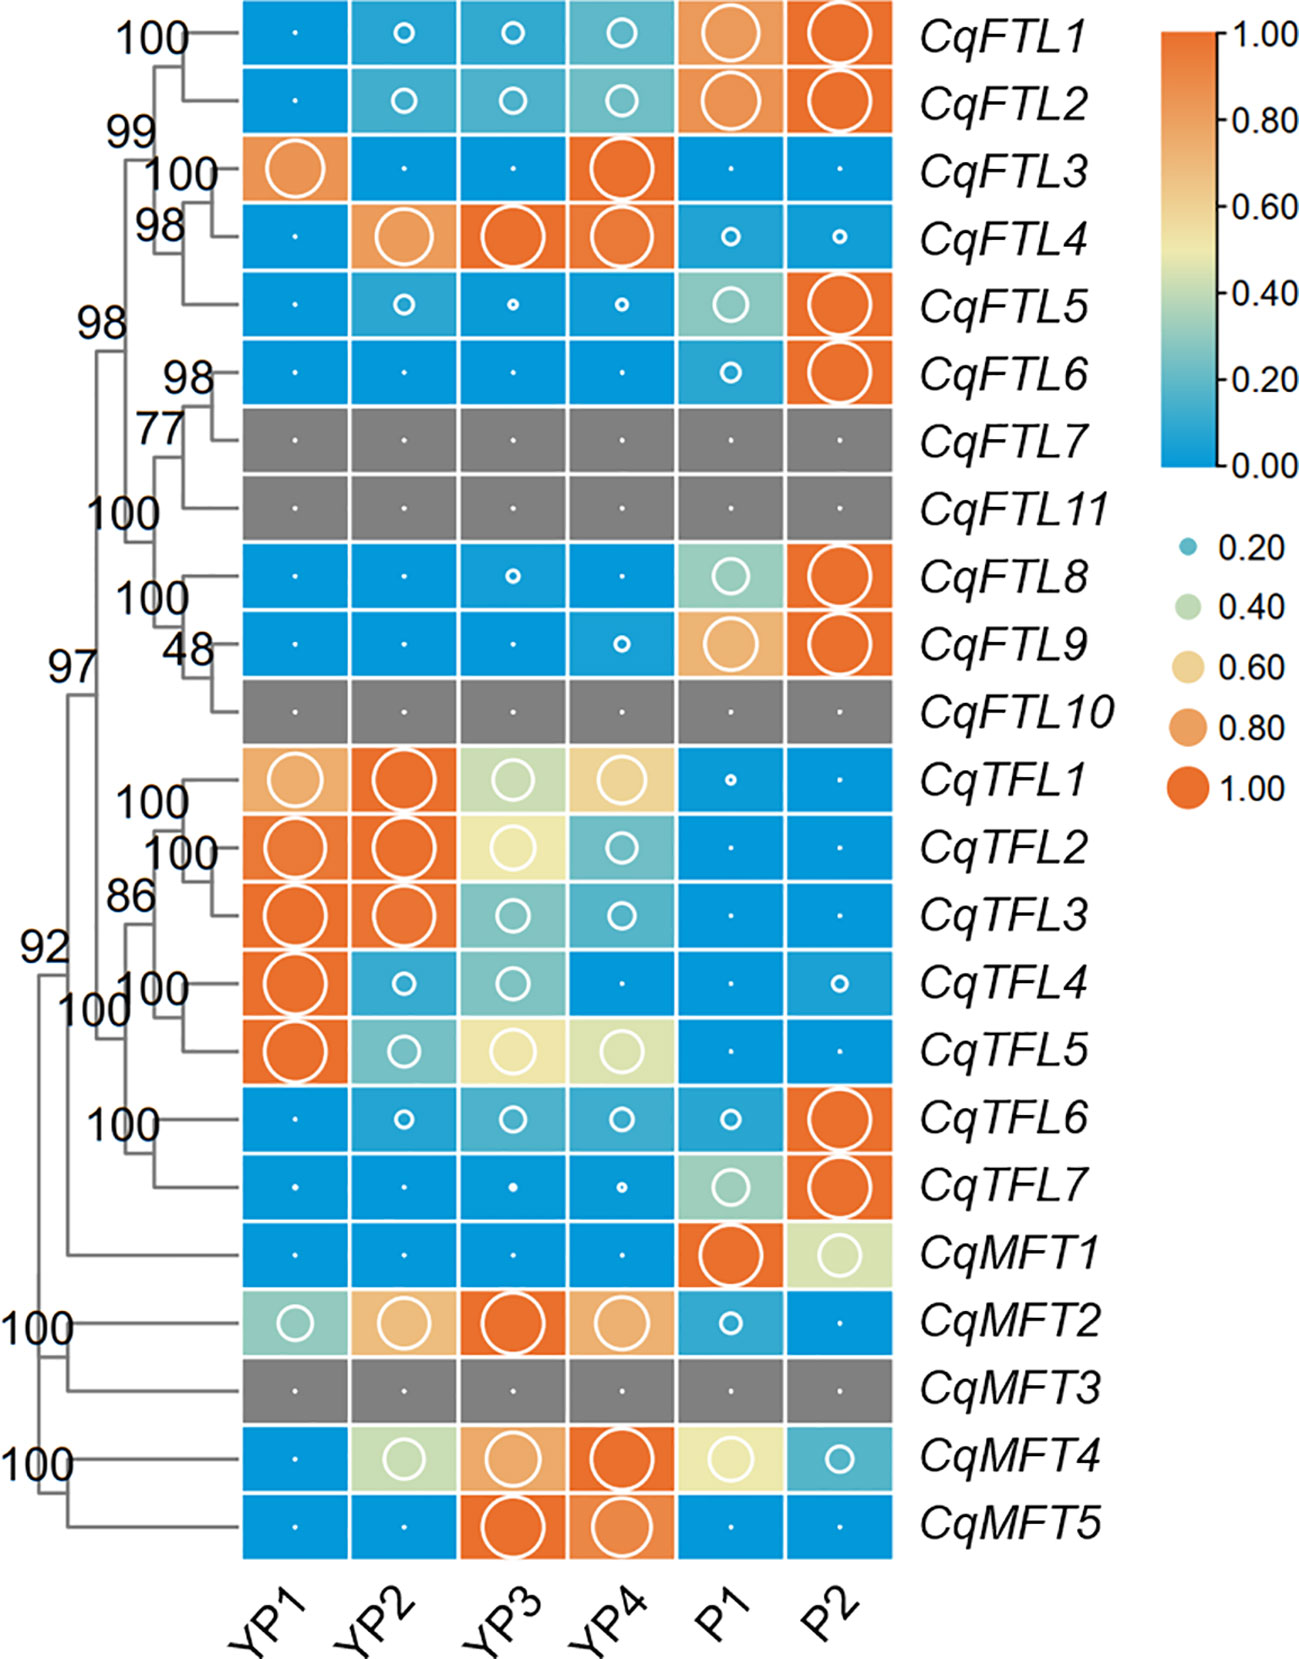
Figure 8 Expression of PEBP genes during quinoa inflorescence development. RNA-seq data of inflorescences sampled from 6 developmental stages was used to investigate the expression changes of PEBPs (Wu et al., 2019). Expression levels are denoted by FPKM values (cutoff=0.1). YP1 to YP4 indicates non-branching young panicles at 4 earlier developmental stages. P1 and P2 indicate branching panicles at 2 later developmental stages. Each expression value was generated from three replicates. Orange boxes with larger-size bubbles indicate higher expression levels. Expression levels at 6 stages of the same gene were normalized to 0 to 1 by row.
The principal PEBPs involved in seed germination
Pre-harvest sprouting (PHS) is a knotty problem that influences the yield and nutritional qualities of quinoa (Wu et al., 2020). Understanding the mechanisms underlying seed germination will facilitate breeding PHS-resistant elites of quinoa. We investigated the expressions of PEBPs during seed germination before and after ABA treatment. A higher proportion of MFT clade genes (4 out of 5, 80%), whereas relative lower percentages of FTL clade (6 out of 11, 55%) and TFL clade genes (1 out of 7, 15%) were detected during seed germination (Figure 9; Supplementary File 2). We found CqMFT2, CqMFT3 and CqMFT4 were largely repressed as germination went on (Figure 9). Further, we found that the transcriptional changes of CqMFT2, CqMFT3 and CqMFT4 during germination were attenuated when treated by ABA (Figure 9). This is in agreement with the enrichment of the cis-acting element ABRE in MFT gene promoters, indicating those three genes may respond to ABA to regulate seed germination.
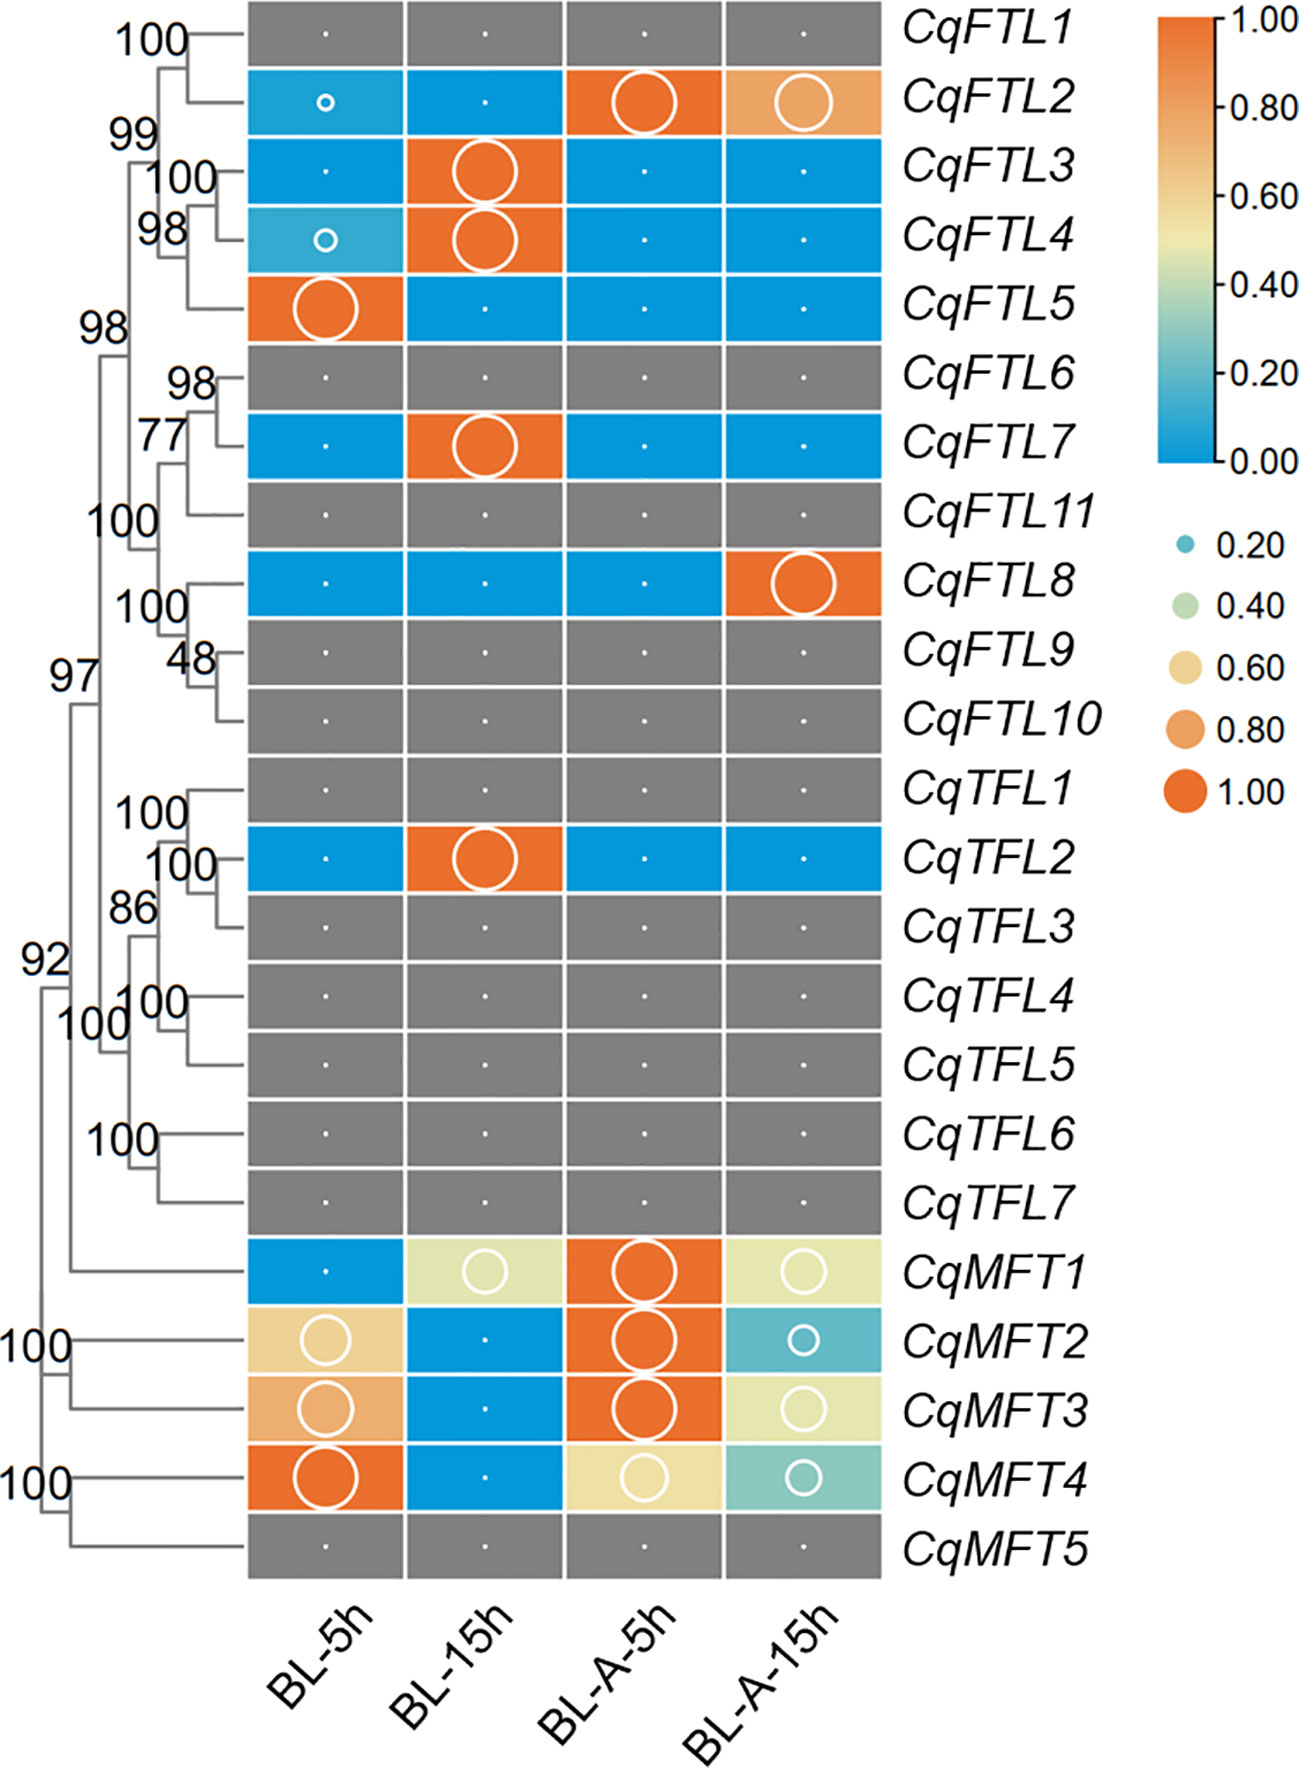
Figure 9 Expression changes of PEBPs during seed germination. RNA-seq data of control and ABA-treated seeds at 5h and 15h after imbibition was used to investigate the expression levels denoted by FPKM values (cutoff=0.1) (Wu et al., 2020). BL-A-5h/15h and BL-5h/15h indicate the seeds of cultivar “BL” with or without ABA treatment. Each expression value was generated from three replicates. Orange boxes with larger-size bubbles indicate higher expression levels. Expression values in various seed samples of the same gene were normalized to 0 to 1 by row.
Responses of PEBP genes to night break
Night break (NB) has a repressive effect on the flowering of short-day plant (SDP) mostly by repressing florigen-encoding genes (Ishikawa et al., 2005). Like that in other SDPs, in our previous study we also noticed the repressive effects of NB on quinoa flowering. To know which PEBP genes may be involved in NB responses, we analyzed the transcriptome data of quinoa leaf samples collected from SD and NB conditions. As illustrated in Figure 10, FT clade genes were more active than TFL and MFT clade genes. A total of 9 PEBP genes were detected, of which 8 were FTL clade genes (Figure 10; Supplementary File 2). Obviously, CqFTL3, CqFTL5, CqFTL7, CqFTL8 and CqFTL9 were expressed at higher levels under SD, whereas were rapidly down-regulated by NB treatment (Figure 10). The opposed expression patterns of the 5 FTL genes under SD and NB indicate their possible positive effects in quinoa flowering. In addition, we noticed the differing responses to NB between orthologous gene pairs. For example, in CqFTL4/CqFTL5, CqFTL5 was sensitive to NB, whereas CqFTL4 was only slightly repressed by NB (less than 2 folds). In CqFTL6/CqFTL9, CqFTL9 was largely repressed by NB, while CqFTL6 were down-regulated regardless of light conditions.
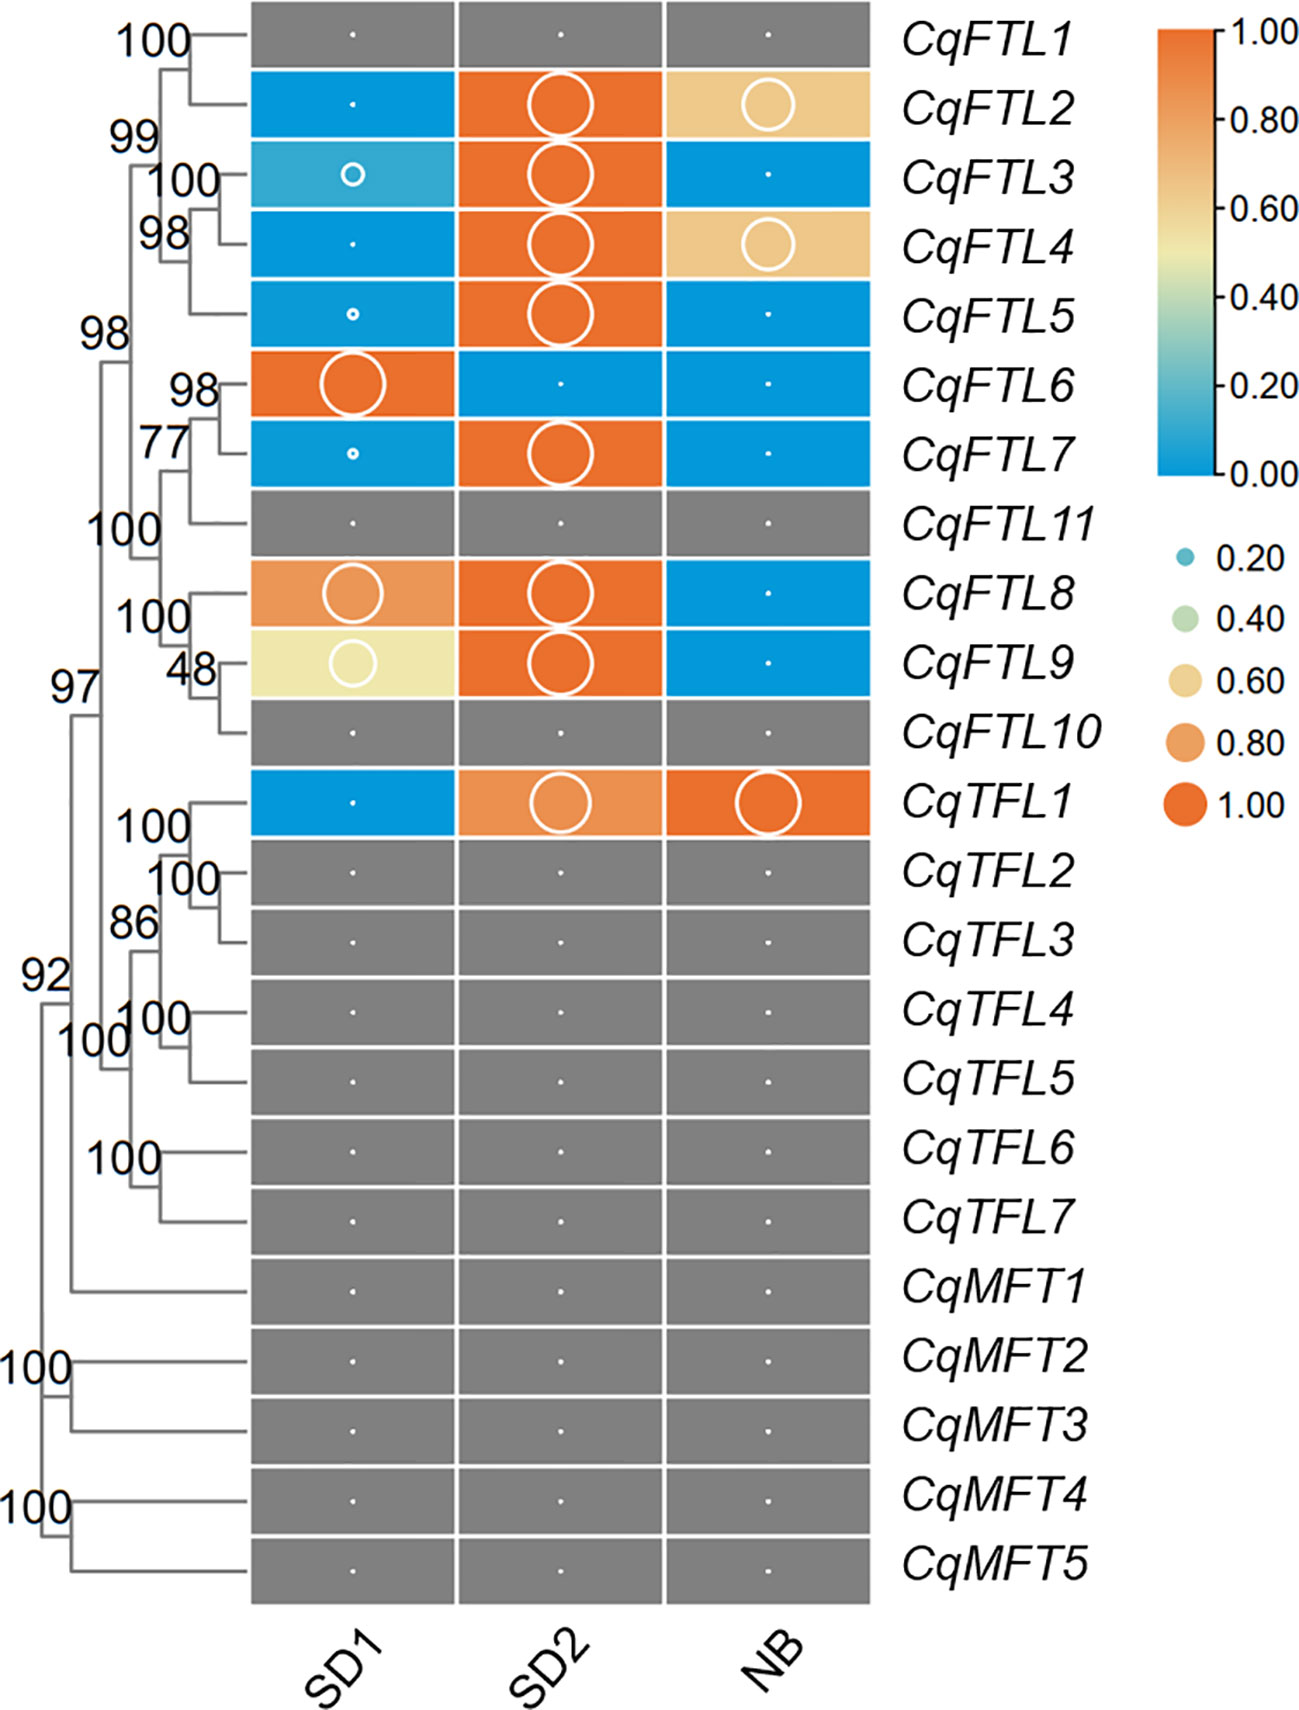
Figure 10 Investigation on the transcriptional changes of PEBPs in response to night break. Our previously published transcriptome data was used to. SD1 and SD2 indicate leaf samples collected from 14-day- and 26-day-old plants under short-day conditions. NB indicates the leaf sample of SD2 plants with 2d night-break treatment. Each expression value was generated from three replicates. Orange boxes with larger-size bubbles indicate higher expression levels. Expression values (cutoff=0.1) in various leaf samples of the same gene were normalized to 0 to 1 by row.
Diurnal expression analysis of PEBPs
As quinoa belongs to SDPs, SD induces whereas long day (LD) represses quinoa flowering. To evaluate the relationships between PEBPs and day lengths, we performed a comprehensive analysis on PEBP expressions over 24 h under SD and LD. The quinoa plants were grown in growth chamber supplied with SD or LD. Before bolting stage, the top-fully-expanded leaves of two-week-old seedlings were collected for RNA-seq. We detected the expressions of 9 FTL clade genes, but only 2 TFL and 1 MFT clade genes were detected in leaves at this stage (Figures 11A-L; Supplementary File 2). The 24 h expression profile showed that, the expressions of several quinoa PEBP genes were diurnally rhythmic and differed under different day lengths (Figures 11A, E, F, H, L). Clearly, expression patterns between the orthologous gene pairs CqFTL1/CqFTL2 (Figures 11A, B), CqFTL4/CqFTL5 (Figures 11D, E), CqFTL6/CqFTL9 (Figures 11F, I) were different. Expressions of CqFTL1, CqFTL4, CqFTL5 and CqFTL8 were considerably higher under SD than that under LD (Figures 11A, D, E, H). By contrast, CqFTL6 was induced by LD rather than SD (Figure 11F). Expression levels of CqFTL7 and CqFTL9 were slightly higher under SD than that under LD (Figures 11G, I). Expression levels of CqFTL3 were comparable between under SD and under LD (Figure 11C). CqFTL1 and CqFTL8 expressions were peaked at dawn time, and CqFTL5 and CqFTL9 were abundantly expressed at 2 h after dawn break (Figures 11A, E, H, I). CqFTL2 was highly expressed throughout the day under both SD and LD (Figure 11B). The expressions of CqTFL1 and CqTFL2 were comparable between under SD and LD (Figures 11J, K). CqMFT2 was induced by SD and peaked at the end of day (Figures 11L). Together, these results indicated that CqFTL1, CqFTL4, CqFTL5 and CqFTL8 may act as SD-type flowering inducer, whereas CqFTL6 may act as LD-type flowering inducer. Recently, Patiranage et al. also investigated the diurnal expression patterns of FTL genes, but only limited to 6 FTL genes of quinoa at bolting stage (Patiranage et al., 2021). As florigen encoding FT-like genes are highly induced in leaves before floral transition, we chose to investigate the diurnal expressions at vegetative stage before bolting. The classical florigen genes are likely to diurnally expressed and are sensitive to night break (Ishikawa et al., 2005; Meng et al., 2011). By combining the responses to night break and photoperiodic expressions of quinoa FTL genes, we speculated that CqFTL5 and CqFTL8 are the major florigen-encoding genes in quinoa.
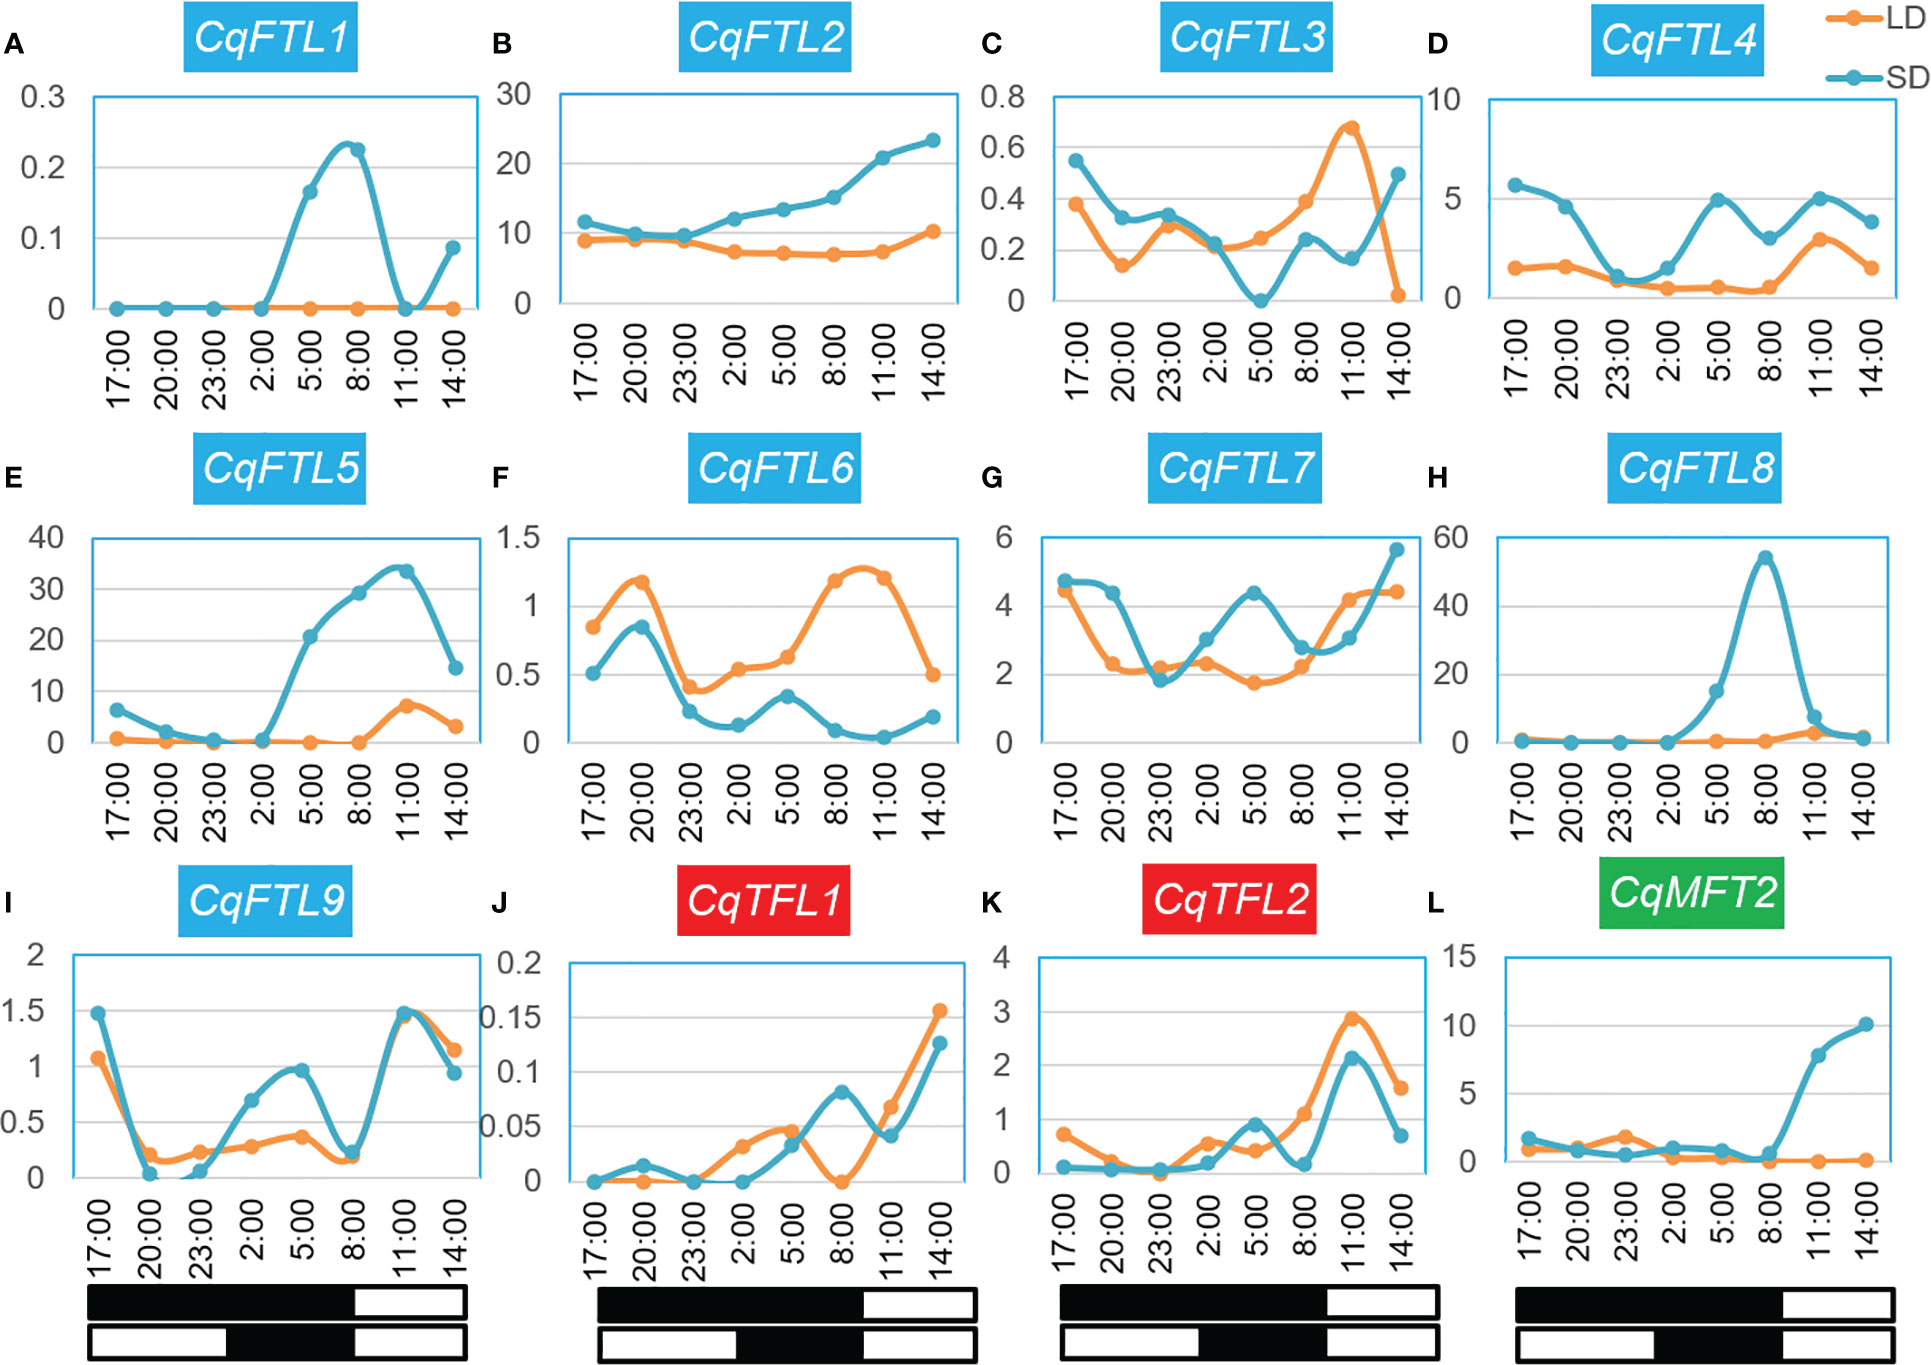
Figure 11 Diurnal expression patterns of PEBPs under short-day and long-day conditions. (A-L) Expression patterns of CqFTL1, CqFTL2, CqFTL3, CqFTL4, CqFTL5, CqFTL6, CqFTL7, CqFTL8, CqFTL9, CqTFL1, CqTFL2 and CqMFT2 under short-day and long-day conditions. Two-week-old plants grown under short-day and long-day conditions were used to collect the leaf samples, respectively, at 17:00, 20:00, 23:00, 02:00, 05:00, 08:00, 11:00 and 14:00. RNA-seq analysis was performed to investigate the expression patterns of PEBPs. White and black boxes indicate day and night time, respectively. Each expression value was generated from two replicates. Orange and blue curves stand for the expression levels of PEBPs under long-day and short-day conditions.
Prediction of the putative TFs upstream of CqFTL5 and CqFTL8 by large-scale co-expression network analysis
As floral integrators, FT genes usually are regulated by a complex network consisting of a lot of transcription factors (TFs) (Tsuji et al., 2013). To know which TFs may lay in the signal cascades upstream of FT genes in quinoa, WGCNA was performed to identify the co-expressed genes. The expression profiles of 32 samples covering 16 time points of SD and LD were used for WGCNA. A total of 6 co-expression modules were obtained. We found only CqFTL5 and CqFTL8 were predicted to occur in those modules. CqFTL5 and CqFTL8 were clustered into the same module-blue module, which contains 934 co-expressed genes. Then those genes were submitted to PlantTFDB v5.0 for TF prediction. A total of 64 TFs, 6.85% of blue module genes, were predicted to be co-expressed with CqFTL5 and CqFTL8. A heatmap was drawn according to their expression profiles (Figure 12). Clearly, those TFs were clustered into two major clusters. One cluster displayed LD-repressive and SD-inducible expression patterns, consistent with that of CqFTL5 and CqFTL8, whereas, the other cluster displayed opposed expression patterns (Figure 12). Thus, those TFs of the two clusters were predicted to be putative promoters and repressors of CqFTL5 and CqFTL8. Notably, compared with the overall TF percentage of blue module genes, remarkable higher rates of family members were found in CO-like (CONSTANS), DBB (Double B-box), GeBP, HSF (Heat Stress Transcription Factors) and bZIP families (Table 2). DBB encodes for a double B-box zinc finger protein, and is regulated by circadian rhythm and participates in light signal transduction during photomorphogenesis. Previous studies indicated that CO-like encodes for a B-box zinc finger protein, and functions as an important mediator of circadian clock to control FT during floral transition (Putterill et al., 1995; Izawa et al., 2002). Thus, like that in other plants, the CO-FT signal pathway is presumably conserved in quinoa flowering. The central roles of MADS-box genes during floral transition have been extensively investigated (Kim et al., 2008; Ryu et al., 2009). We identified that two MADS-box genes were co-expressed with CqFTL5 and CqFTL8. Together, we speculated that these TFs may modulate the transcription levels of CqFTL5 and CqFTL8 in leaves to control quinoa flowering time.
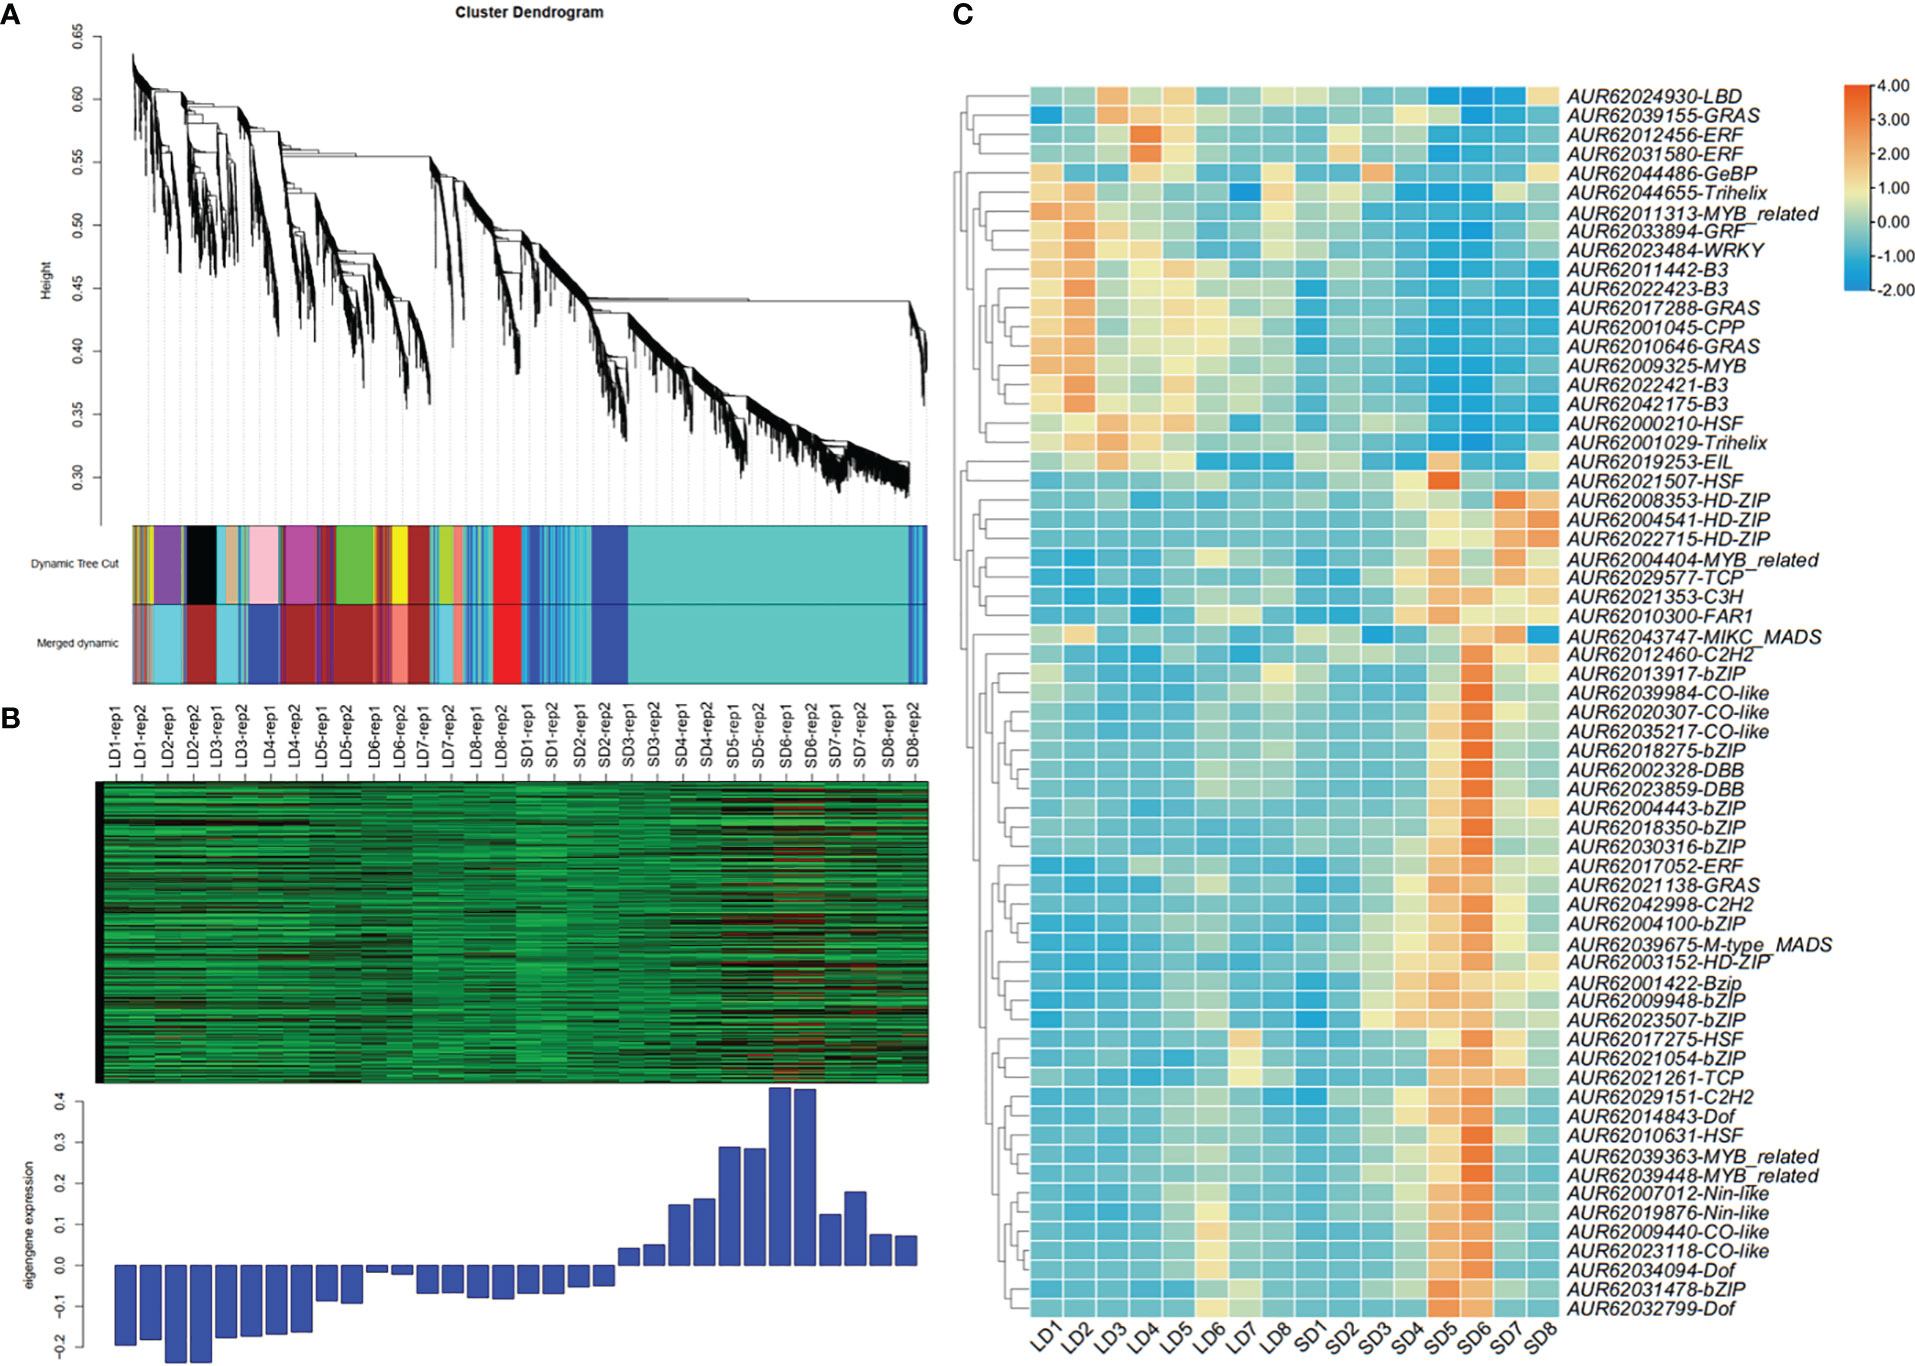
Figure 12 Weighted gene co-expression network analysis and transcription factor prediction methods were used to identify the co-expressed TFs with CqFTL5 and CqFTL8. (A) All the expressed genes were sorted into 6 co-expressed modules by applying weighted gene co-expression network analysis. (B) CqFTL5 and CqFTL8 were clustered into blue module containing 934 co-expressed genes. SD1 to SD8, or LD1 to LD8, refers to the samples diurnally collected at 17:00, 20:00, 23:00, 02:00, 05:00, 08:00, 11:00 and 14:00. (C) Heatmap shows the expression levels of 64 TFs identified from blue module.
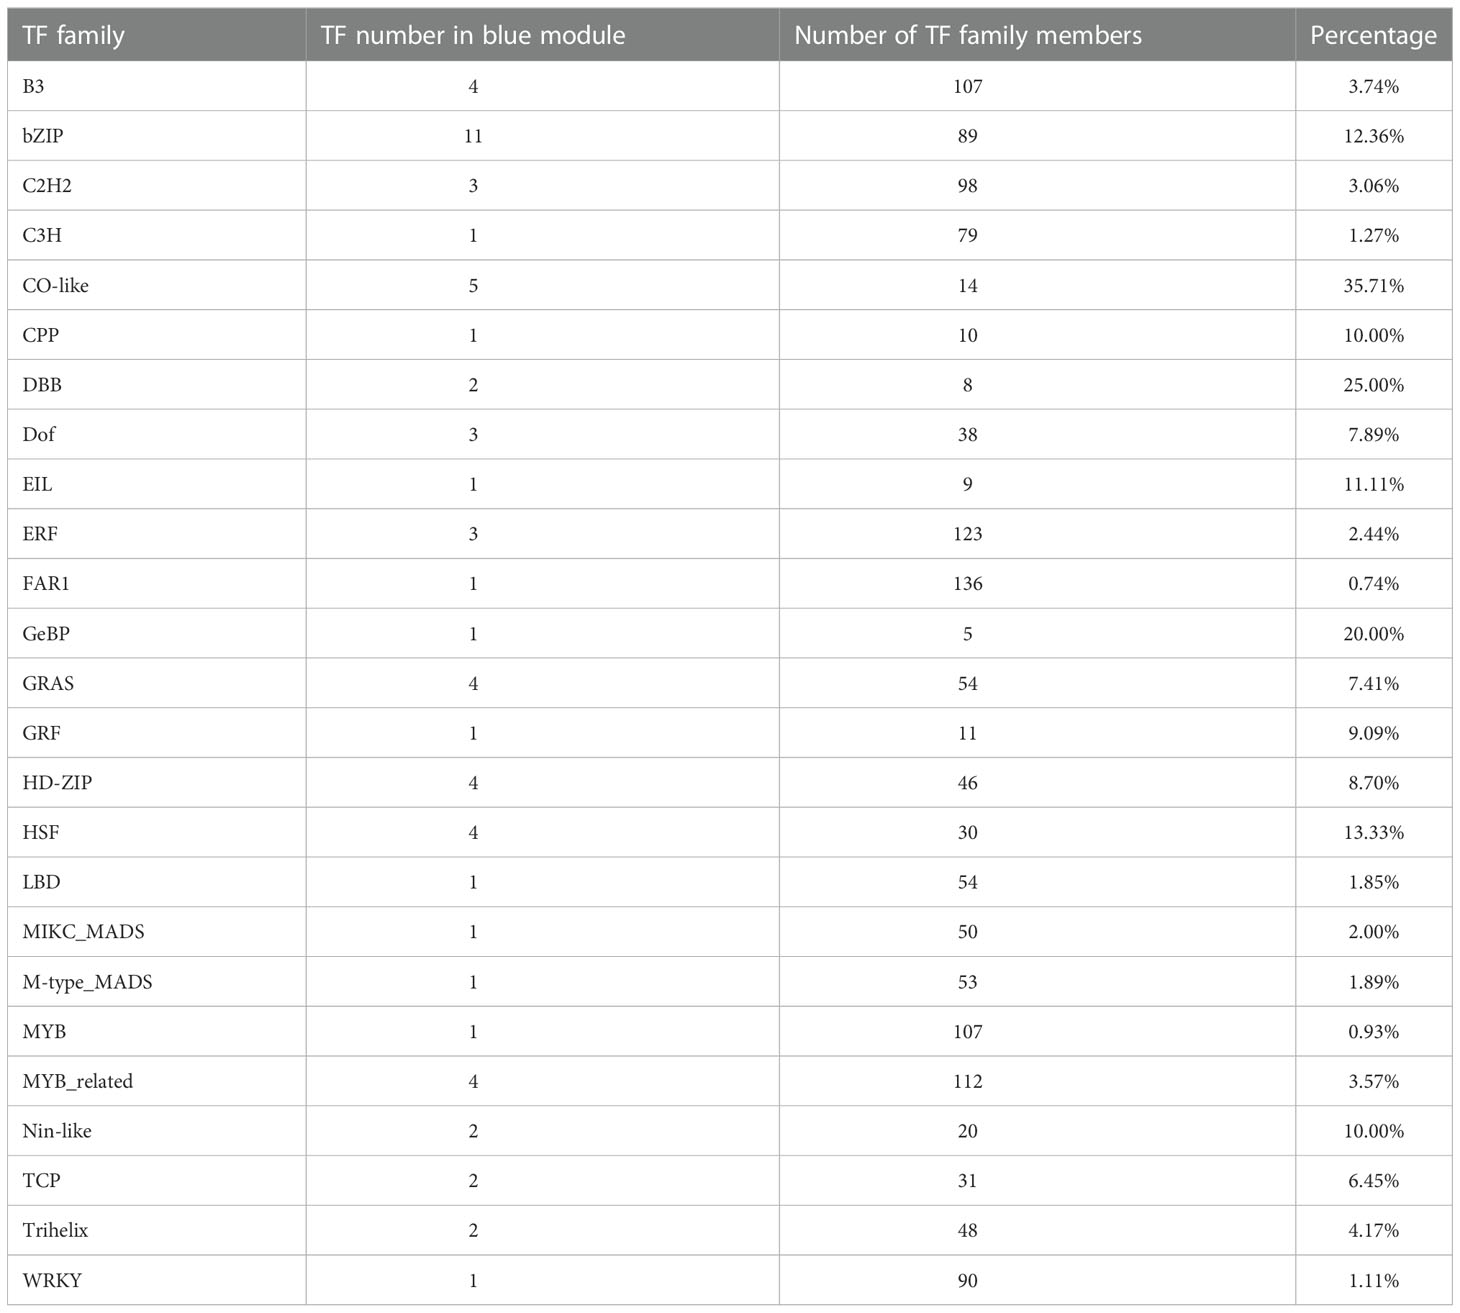
Table 2 The transcription factors co-expressed with CqFTL5 and CqFTL8 in blue module.
Conclusions
In this study, we identified 23 PEBP family members in quinoa. We investigated the relationships of PEBP genes in sugar beet and relatives of quinoa diploid ancestors, and identified 7 orthologous PEBP gene pairs. Evolution analysis indicated the reasons for PEBP duplication events varied, and tandem duplication is the major driving force for PEBP family expansion. Then, we identified the pivotal PEBP genes for inflorescence branching, seed germination and flowering time regulation, and predicted 64 putative transcription factors upstream of CqFTL5 and CqFTL8 by performing co-expression network analysis.
Data availability statement
The data presented in the study are deposited in the NCBI SRA repository (http://trace.ncbi.nlm.nih.gov/Traces/sra), accession number PRJNA824606, PRJNA825321, PRJNA824547,PRJNA824641, PRJNA824640, PRJNA824668, PRJNA824959, PRJNA824960, PRJNA824961, PRJNA824962 and PRJNA824963.
Author contributions
QW conceived and designed this study. QW performed most of the bioinformatics analysis and wrote the manuscript. XB participated in phylogenetic analysis and evolution analysis. MN, LL and YL cultivated the seedlings and harvested the samples for RNA sequencing. YF, CL, XY and LZ participated in expression analysis. All authors contributed to the article and approved the submitted version.
Funding
This work is supported by Natural Science Foundation of Sichuan Province (Grant 2022NSFSC1773, 2022NSFSC1725), National Natural Science Foundation of China (Grant 31701493), China Agriculture Research System (Grant CARS-07-B-1), the project of the Key Laboratory of Coarse Cereal Porcessing, Ministy of Agriculuture and Rural Affairs (Grant 2021CC004, 2019CC14), and the project of Irradiation Preservation Technology Key Laboratory of Sichuan Province, Sichuan Institute of Atomic Energy (Grant FZBC2022004).
Conflict of interest
The authors declare that the research was conducted in the absence of any commercial or financial relationships that could be construed as a potential conflict of interest.
Publisher’s note
All claims expressed in this article are solely those of the authors and do not necessarily represent those of their affiliated organizations, or those of the publisher, the editors and the reviewers. Any product that may be evaluated in this article, or claim that may be made by its manufacturer, is not guaranteed or endorsed by the publisher.
Supplementary material
The Supplementary Material for this article can be found online at: https://www.frontiersin.org/articles/10.3389/fpls.2022.1119049/full#supplementary-material
Supplementary File 1 | Protein sequences of PEBPs from Chenopodium quinoa, C. pallidicaule, C. suecicum, Beta vulgaris, Spinacia oleracea, Arabidopsis thaliana and Oryza saltiva.
Supplementary File 2 | Expression data of PEBP genes in various biological events.
Supplementary File 3 | Expression profiles of the TFs in blue module.
References
Benlloch, R., Berbel, A., Ali, L., Gohari, G., Millan, T., Madueno, F. (2015). Genetic control of inflorescence architecture in legumes. Front. Plant Sci. 6, 543. doi: 10.3389/fpls.2015.00543
Bi, X., van Esse, W., Mulki, M. A., Kirschner, G., Zhong, J., Simon, R., et al. (2019). CENTRORADIALIS interacts with FLOWERING LOCUS T-like genes to control floret development and grain number. Plant Physiol. 180, 1013–1030. doi: 10.1104/pp.18.01454
Chab, D., Kolar, J., Olson, M. S., Storchova, H. (2008). Two flowering locus T (FT) homologs in chenopodium rubrum differ in expression patterns. Planta 228, 929–940. doi: 10.1007/s00425-008-0792-3
Chen, C., Chen, H., Zhang, Y., Thomas, H. R., Frank, M. H., He, Y., et al. (2020). TBtools: An integrative toolkit developed for interactive analyses of big biological data. Mol. Plant 13, 1194–1202. doi: 10.1016/j.molp.2020.06.009
Comadran, J., Kilian, B., Russell, J., Ramsay, L., Stein, N., Ganal, M., et al. (2012). Natural variation in a homolog of antirrhinum CENTRORADIALIS contributed to spring growth habit and environmental adaptation in cultivated barley. Nat. Genet. 44, 1388–1392. doi: 10.1038/ng.2447
Danilevskaya, O. N., Meng, X., Ananiev, E. V. (2010). Concerted modification of flowering time and inflorescence architecture by ectopic expression of TFL1-like genes in maize. Plant Physiol. 153, 238–251. doi: 10.1104/pp.110.154211
Dohm, J. C., Minoche, A. E., Holtgräwe, D., Capella-Gutiérrez, S., Zakrzewski, F., Tafer, H., et al. (2013). The genome of the recently domesticated crop plant sugar beet (Beta vulgaris). Nature 505, 546. doi: 10.1038/nature12817
Finn, R. D., Coggill, P., Eberhardt, R. Y., Eddy, S. R., Mistry, J., Mitchell, A. L., et al. (2016). The pfam protein families database: towards a more sustainable future. Nucleic Acids Res. 44, D279–D285. doi: 10.1093/nar/gkv1344
Goretti, D., Silvestre, M., Collani, S., Langenecker, T., Méndez, C., Madueno, F., et al. (2020). TERMINAL FLOWER 1 functions as a mobile transcriptional cofactor in the shoot apical meristem. Plant Physiol. 182(4), 2061–2095. doi: 10.1104/pp.19.00867
Hanano, S., Goto, K. (2011). Arabidopsis TERMINAL FLOWER1 is involved in the regulation of flowering time and inflorescence development through transcriptional repression. Plant Cell 23, 3172–3184. doi: 10.1105/tpc.111.088641
Holt, A. L., van Haperen, J. M. A., Groot, E. P., Laux, T. (2014). Signaling in shoot and flower meristems of arabidopsis thaliana. Curr. Opin. Plant Biol. 17, 96–102. doi: 10.1016/j.pbi.2013.11.011
Ishikawa, R., Tamaki, S., Yokoi, S., Inagaki, N., Shinomura, T., Takano, M., et al. (2005). Suppression of the floral activator Hd3a is the principal cause of the night break effect in rice. Plant Cell 17, 3326–3336. doi: 10.1105/tpc.105.037028
Izawa, T., Oikawa, T., Sugiyama, N., Tanisaka, T., Yano, M., Shimamoto, K. (2002). Phytochrome mediates the external light signal to repress FT orthologs in photoperiodic flowering of rice. Genes Dev. 16, 2006–2020. doi: 10.1101/gad.999202
Jarvis, D. E., Ho, Y. S., Lightfoot, D. J., Schmockel, S. M., Li, B., Borm, T. J., et al. (2017). The genome of chenopodium quinoa. Nature 542, 307–312. doi: 10.1038/nature21370
Jiang, K., Liberatore, K. L., Park, S. J., Alvarez, J. P., Lippman, Z. B. (2013). Tomato yield heterosis is triggered by a dosage sensitivity of the florigen pathway that fine-tunes shoot architecture. PloS Genet. 9, e1004043. doi: 10.1371/journal.pgen.1004043
Jin, J., Tian, F., Yang, D. C., Meng, Y. Q., Kong, L., Luo, J., et al. (2017). PlantTFDB 4.0: toward a central hub for transcription factors and regulatory interactions in plants. Nucleic Acids Res. 45, D1040–D1045. doi: 10.1093/nar/gkw982.
Kaneko-Suzuki, M., Kurihara-Ishikawa, R., Okushita-Terakawa, C., Kojima, C., Nagano-Fujiwara, M., Ohki, I., et al. (2018). TFL1-like proteins in rice antagonize rice FT-like protein in inflorescence development by competition for complex formation with 14-3-3 and FD. Plant Cell Physiol. 59, 458–468. doi: 10.1093/pcp/pcy021
Karlgren, A., Gyllenstrand, N., Kallman, T., Sundstrom, J. F., Moore, D., Lascoux, M., et al. (2011). Evolution of the PEBP gene family in plants: functional diversification in seed plant evolution. Plant Physiol. 156, 1967–1977. doi: 10.1104/pp.111.176206
Kim, S. L., Lee, S., Kim, H. J., Nam, H. G., An, G. (2008). OsMADS51 is a short-day flowering promoter that functions upstream of Ehd1, OsMADS14, and Hd3a. Plant Physiol. 147, 438–438. doi: 10.1104/pp.107.103291
Komiya, R., Ikegami, A., Tamaki, S., Yokoi, S., Shimamoto, K. (2008). Hd3a and RFT1 are essential for flowering in rice. Development 135, 767–774. doi: 10.1242/dev.008631
Komiya, R., Yokoi, S., Shimamoto, K. (2009). A gene network for long-day flowering activates RFT1 encoding a mobile flowering signal in rice. Development 136, 3443–3450. doi: 10.1242/dev.040170
Krieger, U., Lippman, Z. B., Zamir, D. (2010). The flowering gene SINGLE FLOWER TRUSS drives heterosis for yield in tomato. Nat. Genet. 42, 459–463. doi: 10.1038/ng.550
Kyozuka, J., Tokunaga, H., Yoshida, A. (2014). Control of grass inflorescence form by the fine-tuning of meristem phase change. Curr. Opin. Plant Biol. 17, 110–115. doi: 10.1016/j.pbi.2013.11.010
Liu, C., Teo, Z. W., Bi, Y., Song, S., Xi, W., Yang, X., et al. (2013). A conserved genetic pathway determines inflorescence architecture in arabidopsis and rice. Dev. Cell 24, 612–622. doi: 10.1016/j.devcel.2013.02.013
Lopez-Marques, R. L., Norrevang, A. F., Ache, P., Moog, M., Visintainer, D., Wendt, T., et al. (2020). Prospects for the accelerated improvement of the resilient crop quinoa. J. Exp. Bot. 71, 5333–5347. doi: 10.1093/jxb/eraa285
Meng, X., Muszynski, M. G., Danilevskaya, O. N. (2011). The FT-like ZCN8 gene functions as a floral activator and is involved in photoperiod sensitivity in maize. Plant Cell 23, 942–960. doi: 10.1105/tpc.110.081406
Mulki, M. A., Bi, X., von Korff, M. (2018). FLOWERING LOCUS T3 controls spikelet initiation but not floral development. Plant Physiol. 178, 1170–1186. doi: 10.1104/pp.18.00236
Nakagawa, M., Shimamoto, K., Kyozuka, J. (2002). Overexpression of RCN1 and RCN2, rice TERMINAL FLOWER 1/CENTRORADIALIS homologs, confers delay of phase transition and altered panicle morphology in rice. Plant j.: Cell Mol. Biol. 29, 743–750. doi: 10.1046/j.1365-313X.2002.01255.x
Nakamura, S., Abe, F., Kawahigashi, H., Nakazono, K., Tagiri, A., Matsumoto, T., et al. (2011). A wheat homolog of MOTHER OF FT AND TFL1 acts in the regulation of germination. Plant Cell 23, 3215–3229. doi: 10.1105/tpc.111.088492
Navarro, C., Abelenda, J. A., Cruz-Oro, E., Cuellar, C. A., Tamaki, S., Silva, J., et al. (2011). Control of flowering and storage organ formation in potato by FLOWERING LOCUS T. Nature 478, 119–122. doi: 10.1038/nature10431
Patiranage, D. S. R., Asare, E., Maldonado-Taipe, N., Rey, E., Emrani, N., Tester, M., et al. (2021). Haplotype variations of major flowering time genes in quinoa unveil their role in the adaptation to different environmental conditions. Plant. Cell Environ 44, 2565–2579. doi: 10.1111/pce.14071
Pin, P. A., Benlloch, R., Bonnet, D., Wremerth-Weich, E., Kraft, T., Gielen, J. J., et al. (2010). An antagonistic pair of FT homologs mediates the control of flowering time in sugar beet. Science 330, 1397–1400. doi: 10.1126/science.1197004
Putterill, J., Robson, F., Lee, K., Simon, R., Coupland, G. (1995). The CONSTANS gene of arabidopsis promotes flowering and encodes a protein showing similarities to zinc finger transcription factors. Cell 80, 847–857. doi: 10.1016/0092-8674(95)90288-0
Ryu, C.-H., Lee, S., Cho, L.-H., Kim, S. L., Lee, Y.-S., Choi, S. C., et al. (2009). OsMADS50 and OsMADS56 function antagonistically in regulating long day (LD)-dependent flowering in rice. Plant. Cell Environ. 32, 1412–1427. doi: 10.1111/j.1365-3040.2009.02008.x
Song, Y. H., Shim, J. S., Kinmonth-Schultz, H. A., Imaizumi, T. (2015). Photoperiodic flowering: time measurement mechanisms in leaves. Annu. Rev. Plant Biol. 66, 441–464. doi: 10.1146/annurev-arplant-043014-115555
Song, S., Wang, G., Wu, H., Fan, X., Liang, L., Zhao, H., et al. (2020). OsMFT2 is involved in the regulation of ABA signaling-mediated seed germination through interacting with OsbZIP23/66/72 in rice. Plant j.: Cell Mol. Biol. 103, 532–546. doi: 10.1111/tpj.14748
Štorchová, H. (2020). “The evolution of the FLOWERING LOCUS T-like (FTL) genes in the goosefoot subfamily chenopodioideae,” in Evolutionary biology–a transdisciplinary approach. Ed. Pontarotti, P. (Cham: Springer International Publishing), 325–335.
Storchova, H., Hubackova, H., Abeyawardana, O. A. J., Walterova, J., Vondrakova, Z., Eliasova, K., et al. (2019). Chenopodium ficifolium flowers under long days without upregulation of FLOWERING LOCUS T (FT) homologs. Planta 250, 2111–2125. doi: 10.1007/s00425-019-03285-1
Takeshima, R., Nan, H., Harigai, K., Dong, L., Zhu, J., Lu, S., et al. (2019). Functional divergence between soybean FLOWERING LOCUS T orthologues FT2a and FT5a in post-flowering stem growth. J. Exp. Bot. 70, 3941–3953. doi: 10.1093/jxb/erz199
Tamaki, S., Matsuo, S., Wong, H. L., Yokoi, S., Shimamoto, K. (2007). Hd3a protein is a mobile flowering signal in rice. Science 316, 1033–1036. doi: 10.1126/science.1141753
Tamura, K., Stecher, G., Kumar, S. (2021). MEGA11 molecular evolutionary genetics analysis version 11. Mol. Biol. Evol. 38, 3022–3027. doi: 10.1093/molbev/msab120
Taoka, K., Ohki, I., Tsuji, H., Kojima, C., Shimamoto, K. (2013). Structure and function of florigen and the receptor complex. Trends Plant Sci. 18, 287–294. doi: 10.1016/j.tplants.2013.02.002
Teo, Z. W., Song, S., Wang, Y. Q., Liu, J., Yu, H. (2014). New insights into the regulation of inflorescence architecture. Trends Plant Sci. 19, 158–165. doi: 10.1016/j.tplants.2013.11.001
Thompson, J. D., Gibson, T. J., Higgins, D. G. (2002). “Multiple sequence alignment using ClustalW and ClustalX,” in Current protocols in bioinformatics 1, 2.3.1-2.3.22. doi: 10.1002/0471250953.bi0203s00
Tsuji, H., Tachibana, C., Tamaki, S., Taoka, K., Kyozuka, J., Shimamoto, K. (2015). Hd3a promotes lateral branching in rice. Plant j.: Cell Mol. Biol. 82, 256–266. doi: 10.1111/tpj.12811
Tsuji, H., Taoka, K.-I., Shimamoto, K. (2013). Florigen in rice: complex gene network for florigen transcription, florigen activation complex, and multiple functions. Curr. Opin. Plant Biol. 16, 228–235. doi: 10.1016/j.pbi.2013.01.005
Wang, Y., Yu, H., Tian, C., Sajjad, M., Gao, C., Tong, Y., et al. (2017). Transcriptome association identifies regulators of wheat spike architecture. Plant Physiol. 175, 746–757. doi: 10.1104/pp.17.00694
Wang, Z., Zhou, Z., Liu, Y., Liu, T., Li, Q., Ji, Y., et al. (2015). Functional evolution of phosphatidylethanolamine binding proteins in soybean and arabidopsis. Plant Cell 27, 323–336. doi: 10.1105/tpc.114.135103
Wickland, D. P., Hanzawa, Y. (2015). The FLOWERING LOCUS T/TERMINAL FLOWER 1 gene family: Functional evolution and molecular mechanisms. Mol. Plant 8, 983–997. doi: 10.1016/j.molp.2015.01.007
Wu, Q., Bai, X., Wu, X. Y., Xiang, D. B., Wan, Y., Luo, Y. M., et al. (2020). Transcriptome profiling identifies transcription factors and key homologs involved in seed dormancy and germination regulation of chenopodium quinoa. Plant Physiol. Biochem. 151, 443–456. doi: 10.1016/j.plaphy.2020.03.050
Wu, Q., Bai, X., Zhao, W., Shi, X., Xiang, D., Wan, Y., et al. (2019). Investigation into the underlying regulatory mechanisms shaping inflorescence architecture in chenopodium quinoa. BMC Genomics 20, 658. doi: 10.1186/s12864-019-6027-0
Wu, Q., Luo, Y., Wu, X., Bai, X., Ye, X., Liu, C., et al. (2021). Identification of the specific long-noncoding RNAs involved in night-break mediated flowering retardation in chenopodium quinoa. BMC Genomics 22, 284. doi: 10.1186/s12864-021-07605-2
Keywords: FT, TFL, MFT, flowering, yield, Chenopodium quinoa
Citation: Wu Q, Bai X, Nie M, Li L, Luo Y, Fan Y, Liu C, Ye X and Zou L (2023) Genome-wide identification and expression analysis disclose the pivotal PHOSPHATIDYLETHANOLAMINE BINDING PROTEIN members that may be utilized for yield improvement of Chenopodium quinoa. Front. Plant Sci. 13:1119049. doi: 10.3389/fpls.2022.1119049
Received: 08 December 2022; Accepted: 19 December 2022;
Published: 10 January 2023.
Edited by:
Meng Kou, Sweet Potato Research Institute (CAAS), ChinaReviewed by:
Lixiang Wang, Shanxi Agricultural University, ChinaZaijun Yang, China West Normal University, China
Copyright © 2023 Wu, Bai, Nie, Li, Luo, Fan, Liu, Ye and Zou. This is an open-access article distributed under the terms of the Creative Commons Attribution License (CC BY). The use, distribution or reproduction in other forums is permitted, provided the original author(s) and the copyright owner(s) are credited and that the original publication in this journal is cited, in accordance with accepted academic practice. No use, distribution or reproduction is permitted which does not comply with these terms.
*Correspondence: Qi Wu, amVydmlzd3VxaUAxMjYuY29t