
95% of researchers rate our articles as excellent or good
Learn more about the work of our research integrity team to safeguard the quality of each article we publish.
Find out more
ORIGINAL RESEARCH article
Front. Plant Sci. , 04 January 2023
Sec. Functional and Applied Plant Genomics
Volume 13 - 2022 | https://doi.org/10.3389/fpls.2022.1098560
This article is part of the Research Topic Genetics, Genomics and Breeding of Plant Architecture, Biomass, Grain Quality and Grain Yield Traits in Rice and Wheat View all 15 articles
 Jie Zhao1†
 Lijing Sun1†
 Huimin Gao2†Mengyun Hu1Liming Mu3Xiaohu Cheng3Jianbing Wang3
 Yun Zhao1Qianying Li1Peinan Wang1
 Hui Li1*
 Yingjun Zhang1*
The primary goal of modern wheat breeding is to develop new high-yielding and widely adaptable varieties. We analyzed four yield-related agronomic traits in 502 wheat accessions under normal conditions (NC) and drought treatment (DT) conditions over three years. The genome-wide association analysis identified 51 yield-related and nine drought-resistance-related QTL, including 13 for the thousand-grain weight (TGW), 30 for grain length (GL), three for grain width (GW), five for spike length (SL) and nine for stress tolerance index (STI) QTL in wheat. These QTL, containing 72 single nucleotide polymorphisms (SNPs), explained 2.23 – 7.35% of the phenotypic variation across multiple environments. Eight stable SNPs on chromosomes 2A, 2D, 3B, 4A, 5B, 5D, and 7D were associated with phenotypic stability under NC and DT conditions. Two of these stable SNPs had association with TGW and STI. Several novel QTL for TGW, GL and SL were identified on different chromosomes. Three linked SNPs were transformed into kompetitive allele-specific PCR (KASP) markers. These results will facilitate the discovery of promising SNPs for yield-related traits and/or drought stress tolerance and will accelerate the development of new wheat varieties with desirable alleles.
Wheat (Triticum aestivum L.), one of the most widely cultivated and most important cereal crops, provides approximately 20% of the dietary calories and proteins for human nutrition (Wang et al., 2021; Li et al., 2022a). However, climate stress and depleting fresh water for agricultural irrigation have severely affected wheat production, and drought stress is a major threat to wheat yield (Ahmed et al., 2022). Wheat is particularly susceptible to drought-induced stress throughout the growth period, and therefore, mining drought-stable QTL is vital for increasing wheat yield.
Wheat yield is a complex trait affected by grain and spike agronomic characteristics, including thousand-grain weight (TGW), grain length (GL), grain width (GW), and spike length (SL) (Li et al., 2019). In the present years, numerous QTL for wheat yield were mapped on 21 wheat chromosomes (Tshikunde et al., 2019; Cao et al., 2020). Several genes associated with wheat yield have been cloned in rice or Arabidopsis. These homologous genes include TaCwi-A1 (Ma et al., 2012), TaCKX6-D1 (Zhang et al., 2012), TaSAP1 (Chang et al., 2013), TaGASR7-A1 (Dong et al., 2014), TaGW2A (Hong et al., 2014), TaGS-D1 (Zhang et al., 2014b), TaCWI-4A (Jiang et al., 2015), TaCWI-5D (Jiang et al., 2015), TaCYP78A3 (Ma et al., 2015), TaTGW6-A1 (Hanif et al., 2016), TaTGW-7A (Hu et al., 2016), TaGS5-3A (Ma et al., 2016), TaGS5-A1 (Wang et al., 2016), TaFlo2-A1 (Sajjad et al., 2017), TaBT1 (Wang et al., 2019), TaDA1 (Liu et al., 2020), TaPRR1 (Sun et al., 2020), TaSPL14 (Cao et al., 2021), TaPGS1 (Guo et al., 2022), TaIAA21 (Jia et al., 2021), and TaPIN1s (Yao et al., 2021). Many yield-related QTL/genes have been detected, but limited research has investigated their consistency in stressful and optimal environments. Thus, elucidating the genetic basis of grain and spike morphometric traits under diverse conditions is crucial for improving wheat yield and yield stability.
The rapid development of sequencing and high-density marker genotyping technologies has made GWAS (genome-wide association study) an effective method of identifying the quantitative variation of complex crop traits (Nordborg and Weigel, 2008; Hayes, 2013). The GWAS technique has high resolution and accuracy and has been widely used to study agronomic traits (Pang et al., 2020) and biotic and abiotic resistance (Kang et al., 2020; Shan et al., 2022) in wheat. In addition, GWAS performs genome-scale sequencing of numerous cultivars with diverse genetic backgrounds, thus, accelerating the genetic dissection of complex traits in crops (Juliana et al., 2022; Shan et al., 2022).
In this study, 502 Chinese wheat accessions were genotyped using the wheat 15K SNP array. The TGW, GL, GW, SL and STI (stress tolerance index) phenotypes were analyzed under normal (NC) and drought treatment (DT) conditions. Next, GWAS was performed using multi-year experimental data to identify high confidence loci associated with yield-related traits in a hexaploidy wheat genome under the two conditions. The findings will improve the understanding of the genetic mechanism of wheat yield-related and drought resistance traits and provide new genetic loci for breeding new high-yielding and stress-resistant wheat varieties.
Five hundred and two hexaploidy wheat collections in China were used in this experiment (Supplementary Table 1). The wheat collections were mainly from the Winter Wheat Region of the Yellow and Huai Valleys, which accounted for approximately 75% of the wheat produced in China. This study was established in the Dishang Experimental Station of the Institute of Cereal and Oil Crops, Hebei Academy of Agriculture and Forestry Sciences, Shijiazhuang, Hebei Province, China, located at 38°N and 114°83′E. The field experiments were conducted over three consecutive years (2018 – 2019, 2019 – 2020, 2020 – 2021). The average rainfalls in the October – May season of 2018 – 2019, 2019 – 2020, and 2020 – 2021 were 101, 131, and 75 mm, respectively (Supplementary Figure 1). Plants under normal conditions (NC) were irrigated twice at the jointing and booting stages in 2018 – 2019 (NC19), 2019 – 2020 (NC20), and 2020 – 2021 (NC21). In contrast, drought-treated plants were not irrigated throughout the growth period in 2018 – 2019 (DT19), 2019 – 2020 (DT20), and 2020 – 2021 (DT21). All plants were grown in rows 3 by 0.22 m in length and width at a sowing rate of 84 seeds per row in randomized complete blocks. Trials were fertilized and maintained free from weeds, insects, and diseases.
Five randomly selected spikes were sampled for manual measurement, and then to generate one average value. The grain traits (TGW, GL, and GW) were recorded using a scaled-camera-assisted phenotyping system (Wanshen Detection Technology Co., Ltd., Hangzhou, China). The stress tolerance index of each accession was calculated using the formula: STI = (TGW.DT × TGW.NC)/(X.NC2), where TGW.NC and TGW.DT were the TGW for each accession under normal and drought treatment conditions, respectively; and X.NC was the average TGW of all accessions under normal conditions (Fernandez, 1992).
All statistical analysis was conducted in R v4.1.0 (Yu et al., 2019) and SPSS v16.0 software (SPSS Inc, Chicago). Pearson’s correlation coefficient was determined for all traits in the different environments. The formula h2 = σg2/(σg2 + σgy2/y + σer2/yr) was used to calculate broad sense heritability (h2), where σg2, σgy2, and σer2 represent the genotypic variance, genotype by year effect, and the residual error, respectively. y and r are the number of years and replications, respectively.
The wheat iSelect 15K SNP array from China Golden Maker Biotechnology Co., Ltd., Beijing (http://www.cgmb.com.cn/) was used for genotyping the 502 accessions. The array was identified with specific genetic positions based on the consensus map (Li et al., 2021). The 13,947 SNPs were filtered using PLINK v1.9 (http://pngu.mgh.harvard.edu/purcell/plink/) (Purcell et al., 2007) to delete loci with minor allele frequency (MAF) (< 5%) and low-quality SNPs (with > 20% missing data). After filtering, 13,705 SNPs remained and were used for GWAS. The physical maps of all polymorphic SNPs were obtained by searching the reference sequence IWGSC RefSeq v1.0 2018 using URGI BLAST (http://wheat-urgi.versailles.inra.fr/Tools/BLAST ).
The phylogenetic tree was generated as previously described (Zhao et al., 2020). The principal component analysis (PCA) was constructed using PLINK v1.9, and the percentage of variance explained by the top 10 PCs was plotted to determine the optimal number of PCs. Furthermore, the relative kinship matrix (K-matrix) between accessions was calculated using TASSEL v5.2.73 (Bradbury et al., 2007). Linkage disequilibrium (LD) was estimated as the squared allele frequency correlation (r2) using PLINK v1.9. The LD decay distance was obtained by constructing a scatterplot of r2 values against SNP pairs distance and fitting the points to a smooth curve using the R package “ggplot2”.
The mixed linear model (MLM) (PCA+K) was used for GWAS using the GAPIT package (Wang and Zhang, 2021) in R software. The first five principal components were included in the GWAS model. The mixed linear model accounts for false positives caused by the population structure and relative kinship. For this reason, the P values with cutoff set at 0.05 was highly restrictive. Considering the potential risk of type II error, and combining the GWAS results of the three years, the -log10 (P value) ≥ 3.0 were regarded as significant marker-trait associations (MTAs), as shown in Manhattan plots (Wang et al., 2021). Important P value distributions (observed P values plotted against expected P values) are shown in Q-Q plots.
The SNP makers highly associated with grain and spike traits were selected and converted to KASP (kompetitive allele-specific PCR) markers. The KASP markers were used for PCR amplification of wheat DNA in 3 μL final volumes containing 40 –50 ng of genomic DNA, 0.75 μL of 2 × KASP Master Mix (LGC Genomics, product code: KBS-1050-112), and 0.0417 μL of assay primer mix (12 mM of each allele-specific primer and 30 mM of the common primer). The cycling conditions followed: 94°C for 15 min, ten cycles of 94°C for 20 s, touchdown starting at 61°C for 20 s (decreasing 0.6°C per cycle), 26 cycles of 94°C for 20 s, and 55°C for 1 min. The end-point fluorescence data were visualized with a microplate reader (Omega, BMG LABTECH, Germany) and analyzed by the Kluster-Caller software (LGC Genomics). The Student’s t-tests were used to compare allelic effects of the phenotypic data and the effectiveness of the associated SNPs using KASP markers. The primers used in this research were listed in Supplementary Table 2.
The traits of 502 wheat accessions were characterized during three crop seasons (2018 – 2019, 2019 – 2020, and 2020 – 2021) under normal and drought treatment conditions (Figure 1, Supplementary Figure 2, and Table 1). The correlations were analyzed between the three crop seasons for TGW, GL, GW, and SL (Supplementary Figure 3). For all the detected phenotypes, positive correlations were found among different crop seasons under both normal and drought treatment conditions. Therefore, we compared the phenotypes under the different conditions based on the average values. All genotypes exhibited significant differences for each trait, with the coefficients of variation (CV) ranging from 3.83% to 16.39%. Except for GL, the normal and drought treatment conditions were significantly different (P < 0.001) for TGW, GW, and SL. The average TGW under the normal conditions was 48.62 g (ranging from 31.31 to 65.76 g), whereas the average TGW under the drought treatment conditions was 46.68 g (ranging from 32.40 to 63.12 g). Correspondingly, the average STI was 0.97 (ranging from 0.54 to 1.45). Traits GW and SL decreased from 3.62 to 3.55 mm and 8.22 to 7.75 cm under the DT conditions compared to the normal conditions. In contrast, the average GL differed slightly (0.03 cm) between the two conditions (Table 1). Therefore, drought treatment environmentally stressed the plants, reducing their spike and grain yield. All detected traits showed high broad sense heritability (h2, 76.16 – 95.66%) under the two conditions.
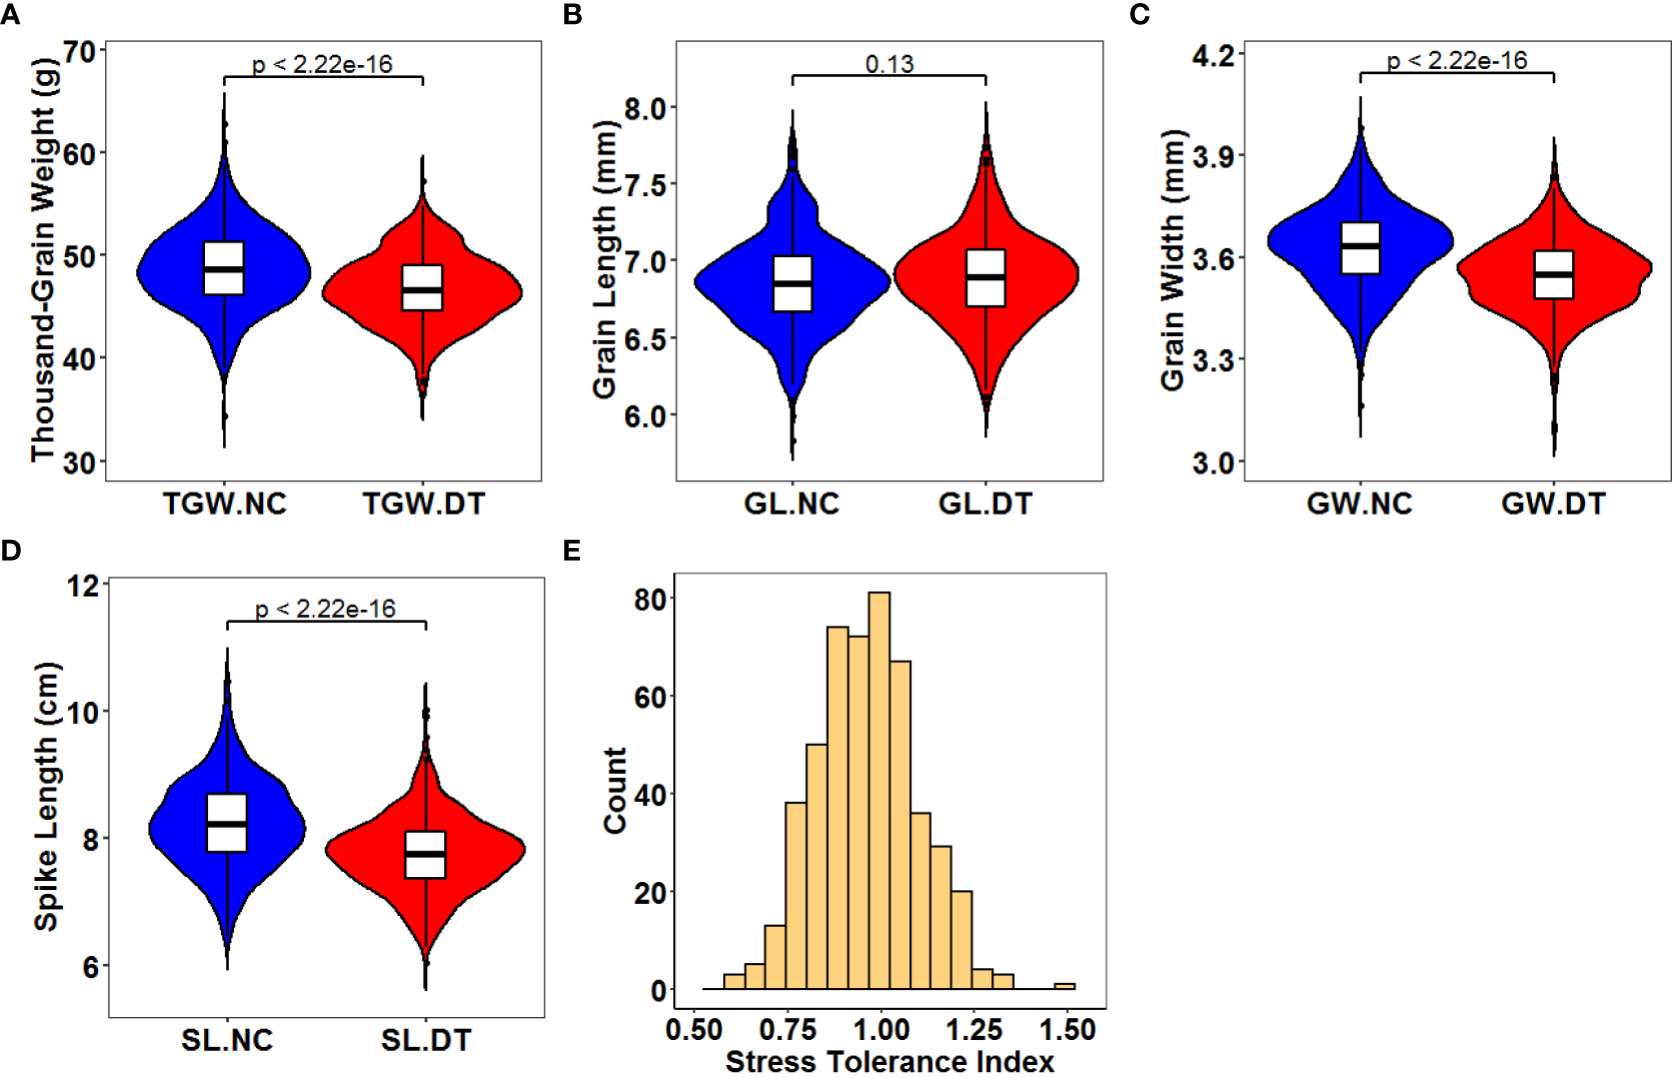
Figure 1 Distribution of the average phenotype for the 502 wheat accessions across all environments. (A) Thousand-grain weight under normal (TGW.NC) and drought treatment conditions (TGW.DT); (B) Grain length under normal (GL.NC) and drought treatment conditions (GL.DT); (C) Grain width under normal (GW.NC) and drought treatment conditions (GW.DT); (D) Spike length under normal (SL.NC) and drought treatment conditions (SL.DT); (E) Stress tolerance index. The center and edges of the boxplot represent the median and the 25th or 75th percentile respectively, while the whiskers represent the median ± 1.5 × IQR (interquartile interval).
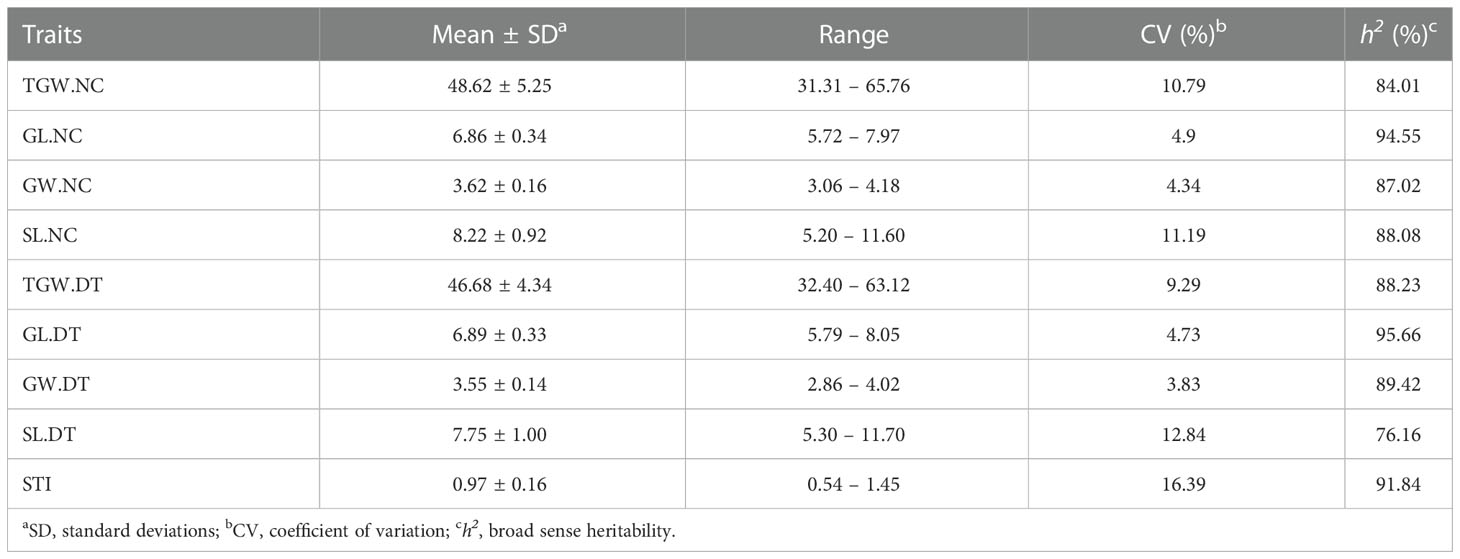
Table 1 Statistics for thousand-grain weight (TGW), grain length (GL), grain width (GW), spike length (SL) and stress tolerance index (STI) in the association population under normal (NC) and drought treatment (DT) conditions.
We analyzed the correlations between the four traits (Figure 2). Under the normal conditions, any two of TGW, GL, and GW were positively correlated (r = 0.61*** between TGW and GL, r = 0.78*** between TGW and GW, and r = 0.35*** between GL and GW). Moreover, SL was positively correlated with TGW and GL (0.098* and 0.18***) respectively and uncorrelated with GW (Figure 2A). The correlations between TGW, GL, and GW were similar under NC and DT conditions. Additionally, SL was weakly correlated with GL (r = 0.085*) but uncorrelated with TGW and GW under DT (Figure 2B).
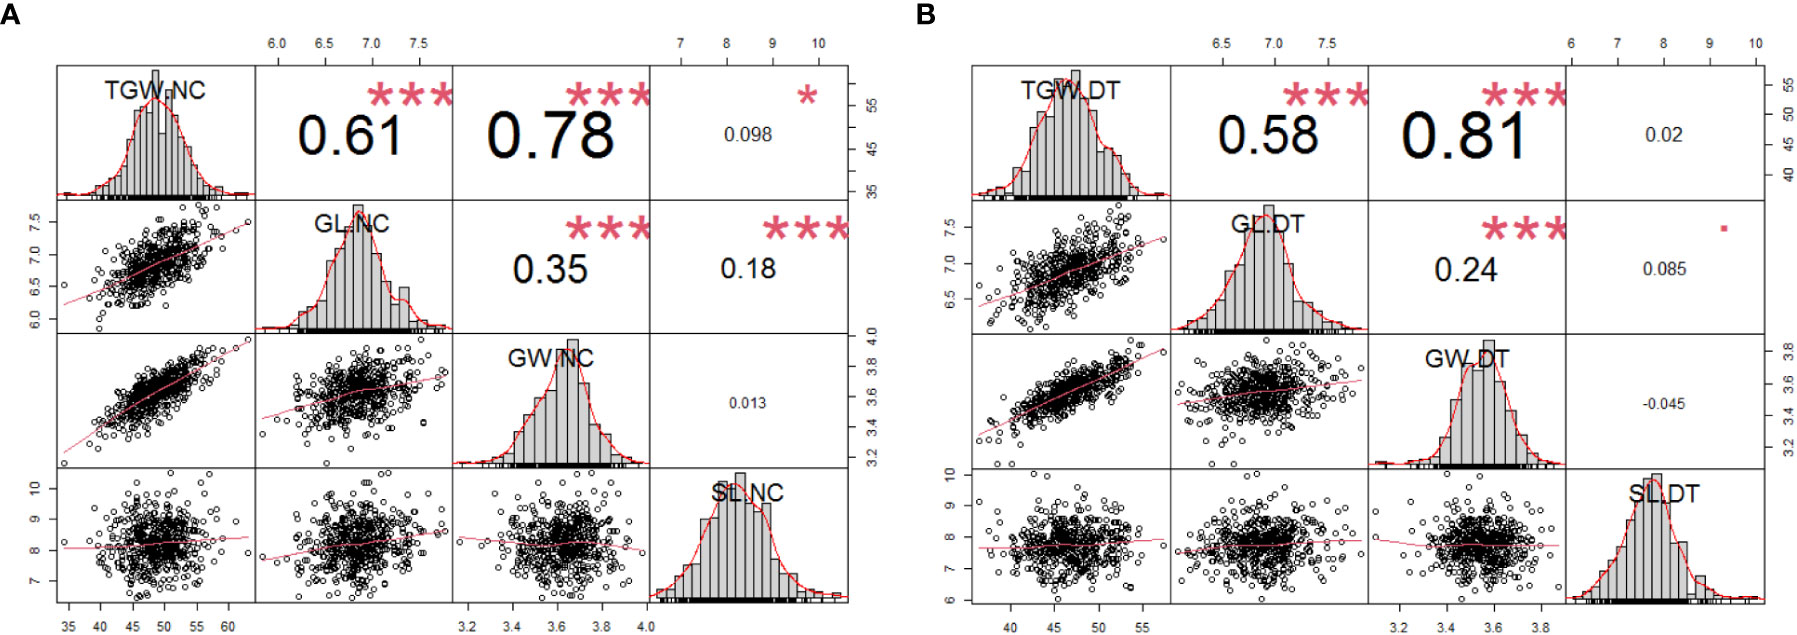
Figure 2 Phenotypic performances, distribution, and correlation coefficients for the 502 wheat accessions using the average phenotypic data under normal (A) and drought treatment conditions (B). The frequency distribution of the phenotypic data for each trait is shown in the histograms. The X-Y scatter plot with the adjusted Pearson’s coefficients. *P < 0.05, ***P < 0.001. TGW.NC, thousand-grain weight under normal conditions; GL.NC, grain length under normal conditions; GW.NC, grain width under normal conditions; SL.NC, spike length under normal conditions; TGW.DT, thousand-grain weight under drought treatment conditions; GL.DT, grain length under drought treatment conditions; GW.DT, grain width under drought treatment conditions; SL.DT, spike length under drought treatment conditions.
All 502 accessions were genotyped using the wheat iSelect 15K array. After filtering (missing rate > 20% and minor allele frequency < 0.05), 13,705 high-quality SNPs were retained and used for genetic analysis. These SNPs were distributed on all 21 wheat chromosomes, with 4916, 5326, and 3463 SNPs in the A, B, and D sub-genomes. Chromosome 3B had the most SNPs (1024) but the shortest average distance between SNPs (833 kb). However, 4D had the least (264 SNPs and 2056 kb) (Supplementary Figure 4).
We used different approaches to cluster the accessions into different groups and assessed the similarity of the results. The neighbor-joining tree divided the panel into three major groups (Figure 3A). Similarly, PCA classified the panel into three groups despite the numerous admixtures. These results revealed a weak population structure since the first three principal components collectively explained only approximately 19.31% of the total variance, i.e., 9.73, 5.37, and 4.21% for PC1, PC2, and PC3, respectively (Figure 3B). Overall, the above methods classify the populations into three subgroups.
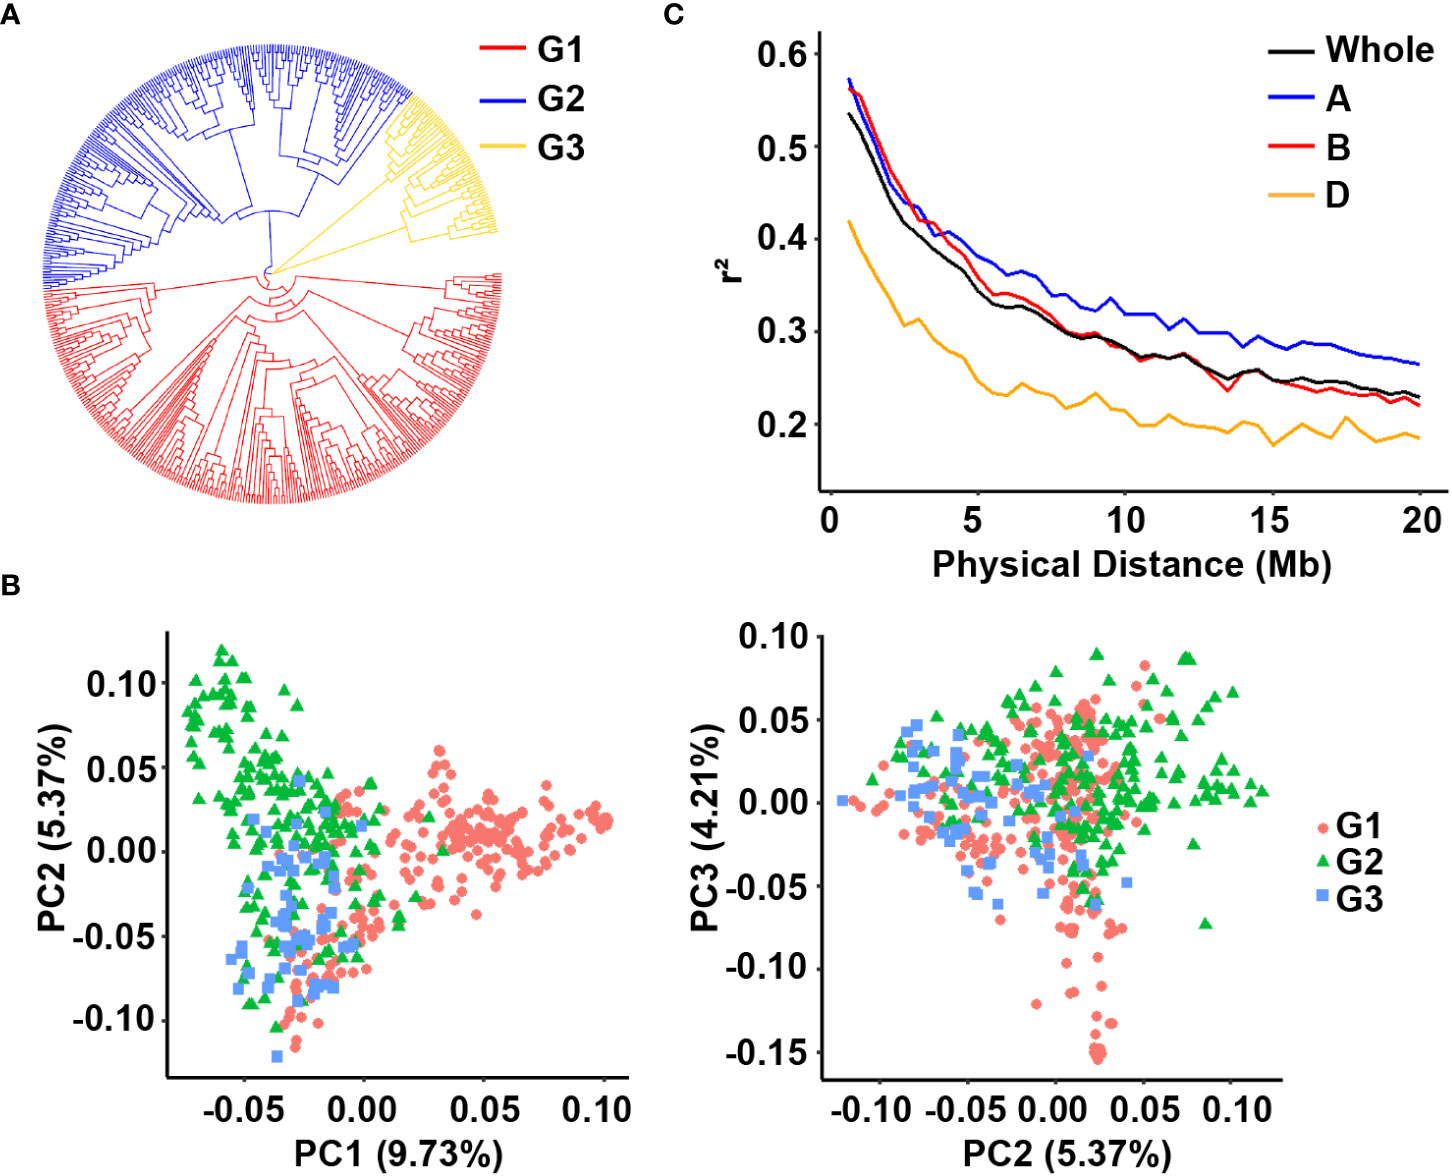
Figure 3 Analysis of the population structure of the 502 wheat accessions. (A) Neighbor-joining tree of all wheat accessions; (B) Principal component analysis showing the population structure in the diversity panel; (C) LD decay value in the whole genome, A sub-genome, B sub-genome and D sub-genome of wheat.
The filtered SNP data were used to calculate LD. The average r2 values for the A, B, and D sub-genomes and the whole genome gradually decreased with increasing pairwise distance (Figure 3C). When the cutoff threshold for r2 was half of its maximum value, the A sub-genome had the longest LD decay distance (approximately 12 Mb) compared to the B and D sub-genomes (> 10 Mb). The LD decay distance for the entire genome was approximately 12 Mb.
We performed GWAS for all the traits with the MLM in different environments under both conditions. We defined the significant and repetitive SNPs in at least two environments as true and reliable association loci. The purpose was to eliminate the influence of the environmental background and explain the true components of genetic variation. The Q-Q and Manhattan plots based on the average values of the individual traits are shown in Figures 4, 5. The GWAS identified 666 and 821 SNPs in different environments under NC and DT conditions, respectively, including 67 significant SNPs in 51 QTL from the multiple environments (Tables 2, 3 and Supplementary Table 3). In addition, 311 SNPs were detected for STI in different environments. Among them, 18 high confidence SNPs in nine QTL for STI were detected under more than one environment (Table 4 and Supplementary Table 4).
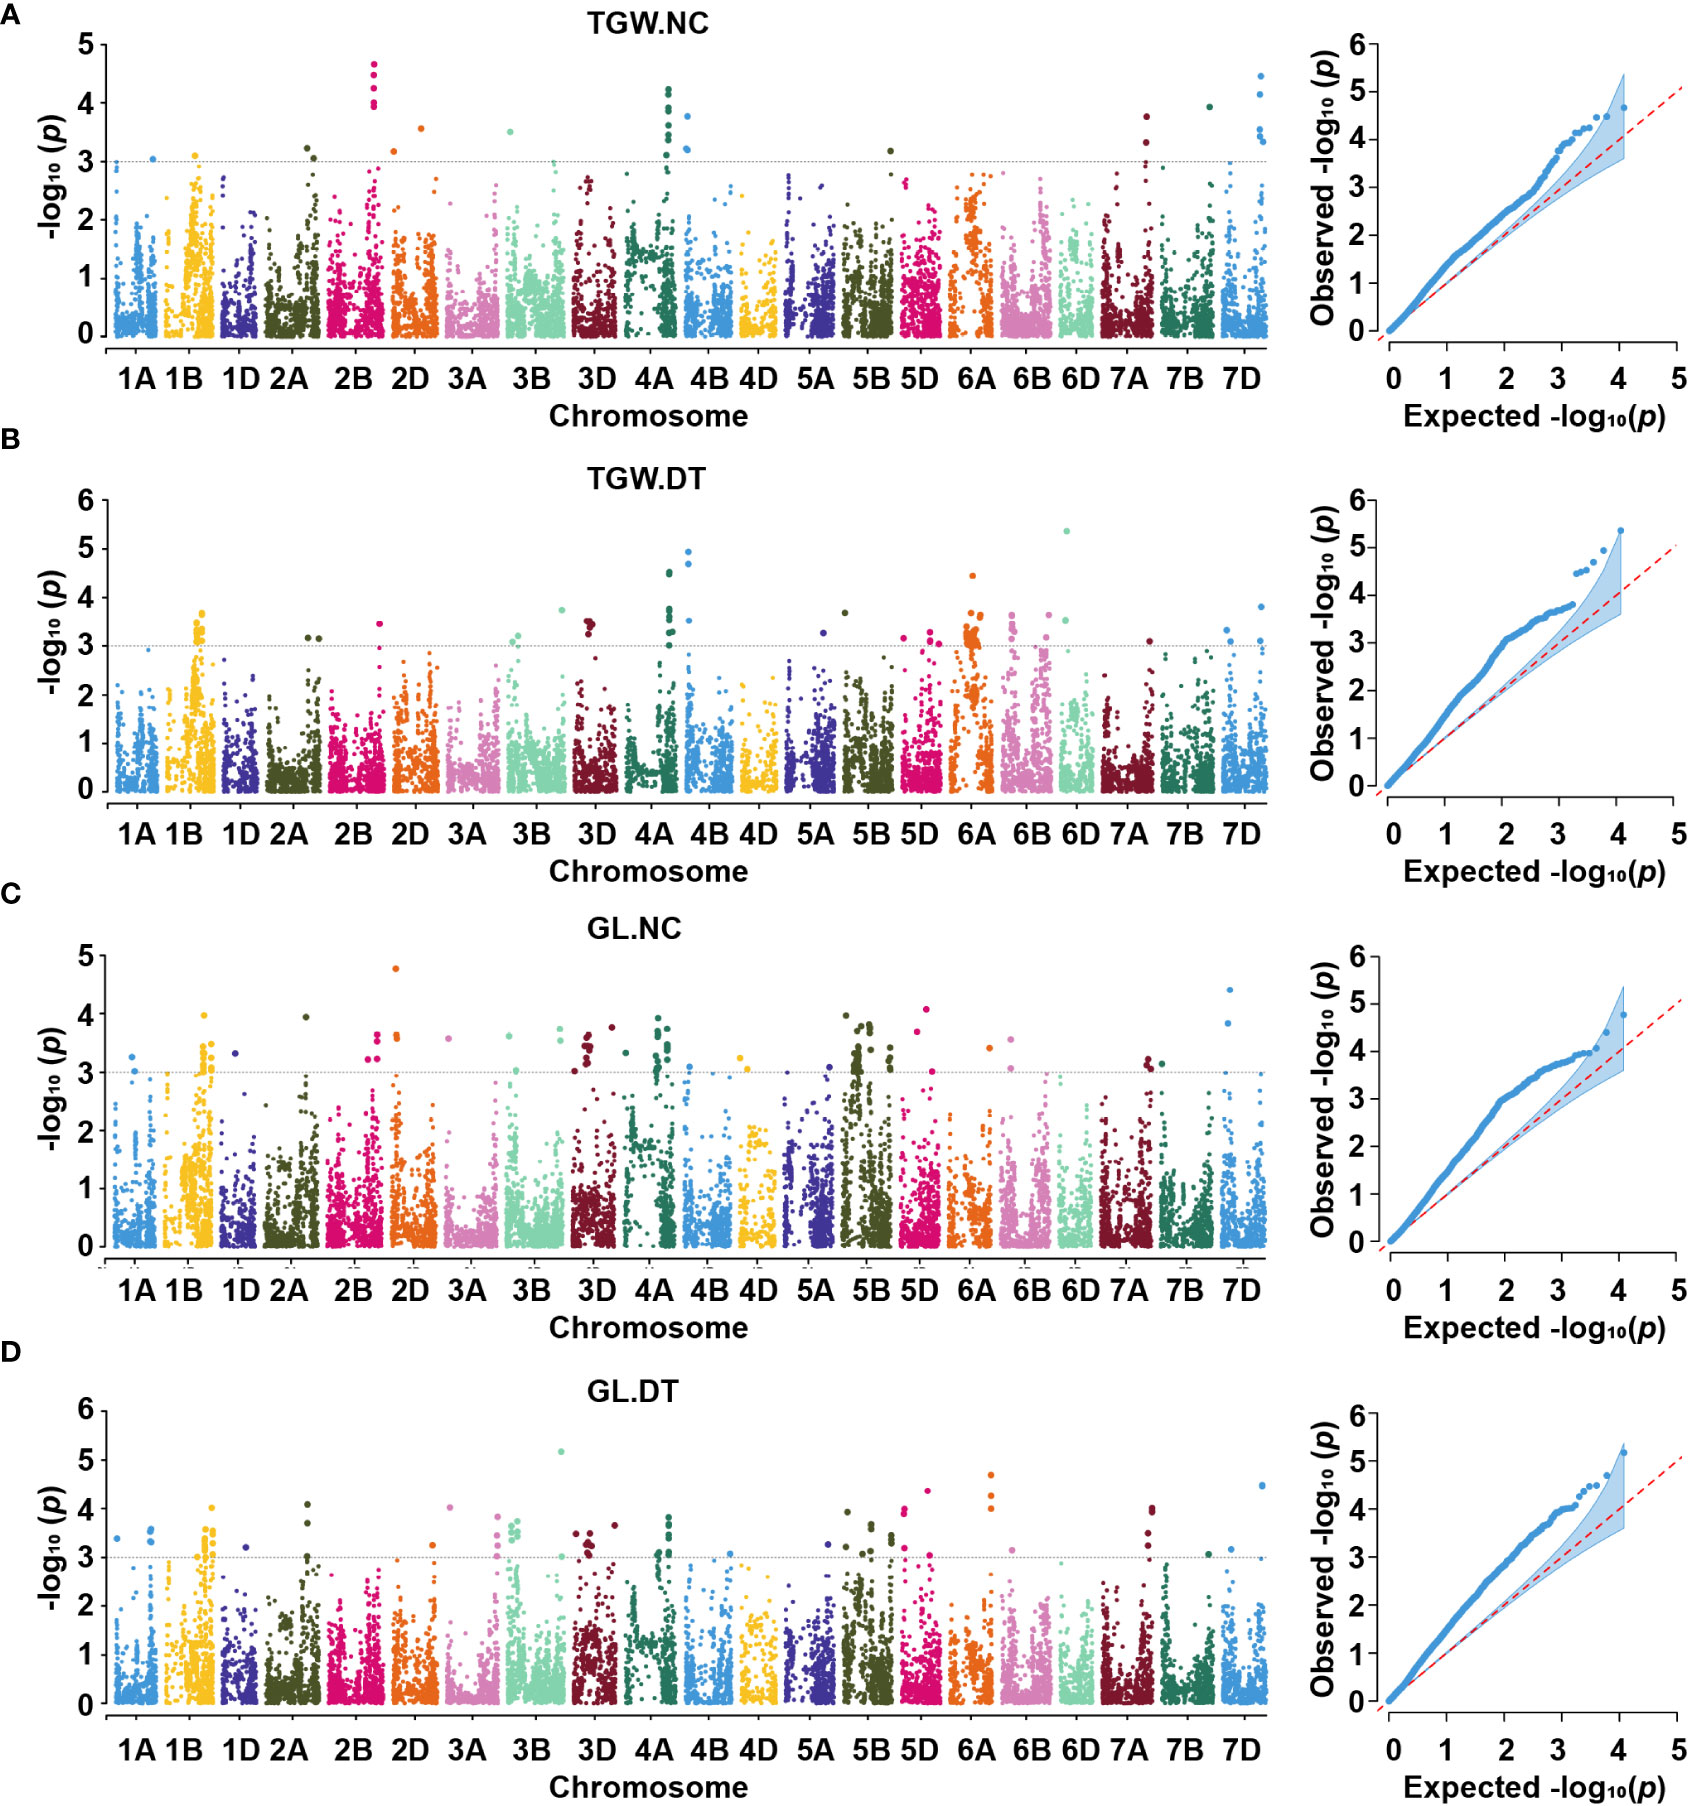
Figure 4 Manhattan and Q-Q plots for thousand-grain weight (A, B) and grain length (C, D) under two conditions. TGW.NC, thousand-grain weight under normal conditions; TGW.DT, thousand-grain weight under drought treatment conditions; GL.NC, grain length under normal conditions; GL.DT, grain length under drought treatment conditions.
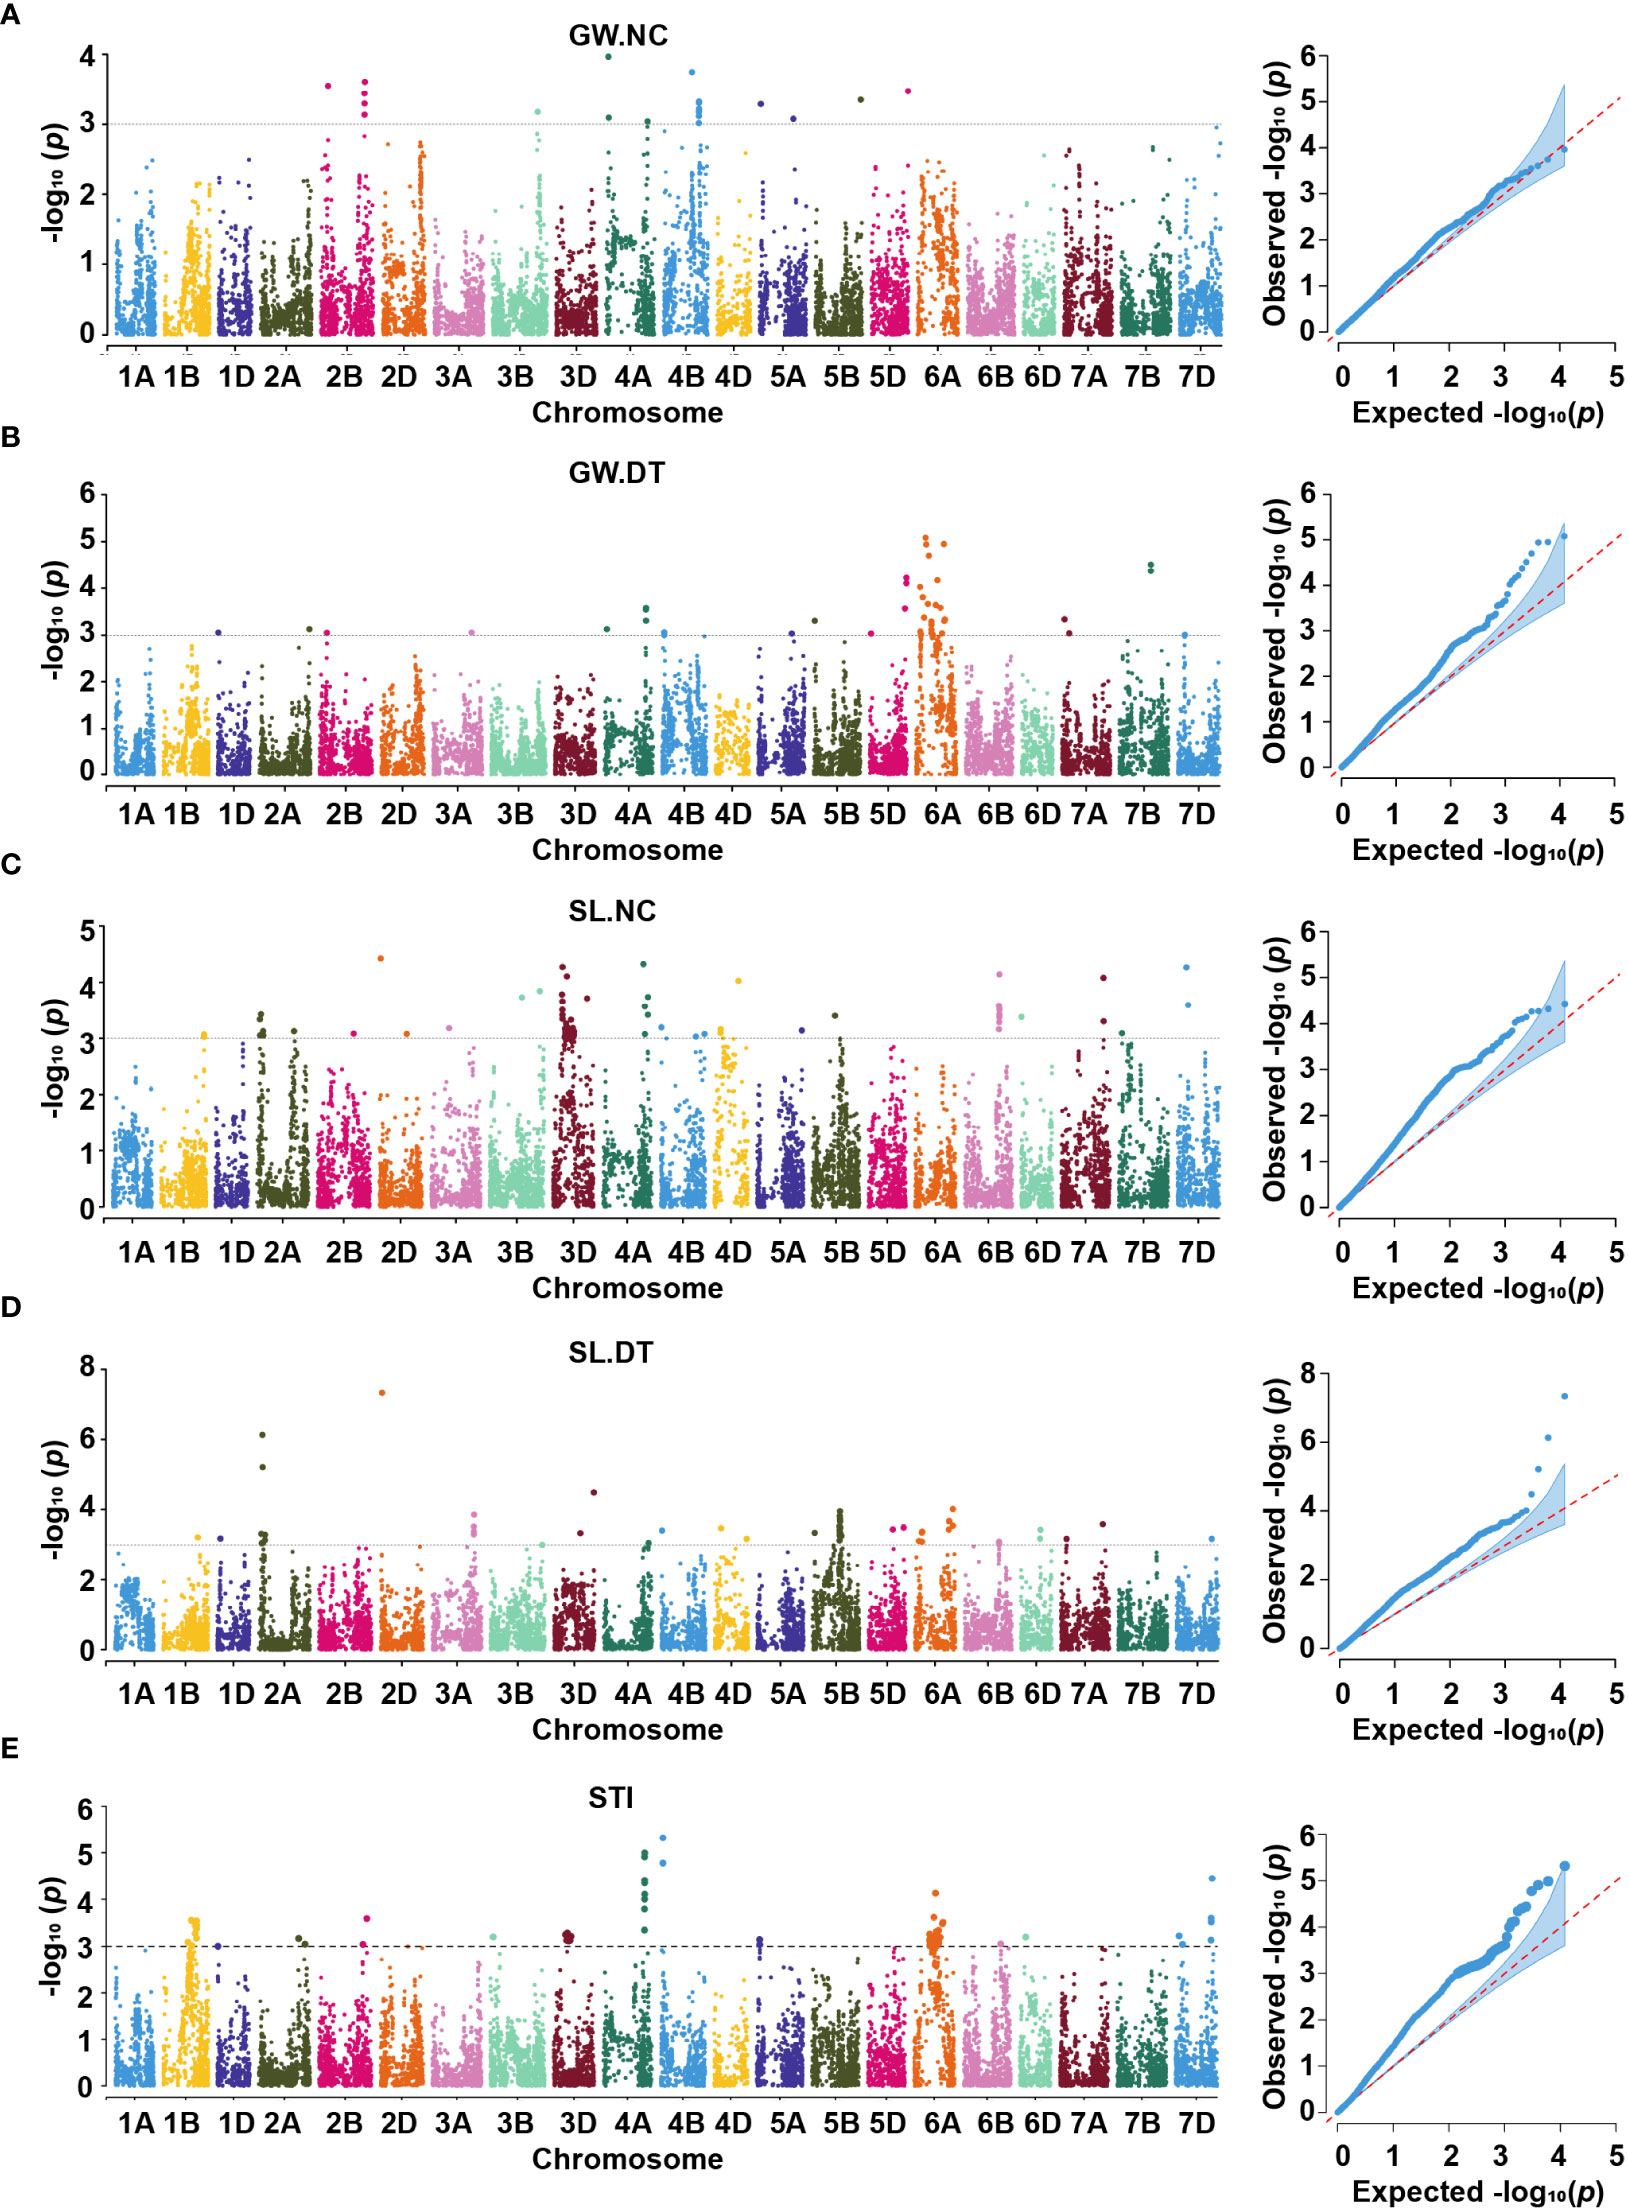
Figure 5 Manhattan and Q-Q plots for grain width (A, B), spike length (C, D) and stress tolerance index (E) under two conditions. GW.NC, grain width under normal conditions; GW.DT, grain width under drought treatment conditions; SL.NC, spike length under normal conditions; SL.DT, spike length under drought treatment conditions; STI, stress tolerance index.
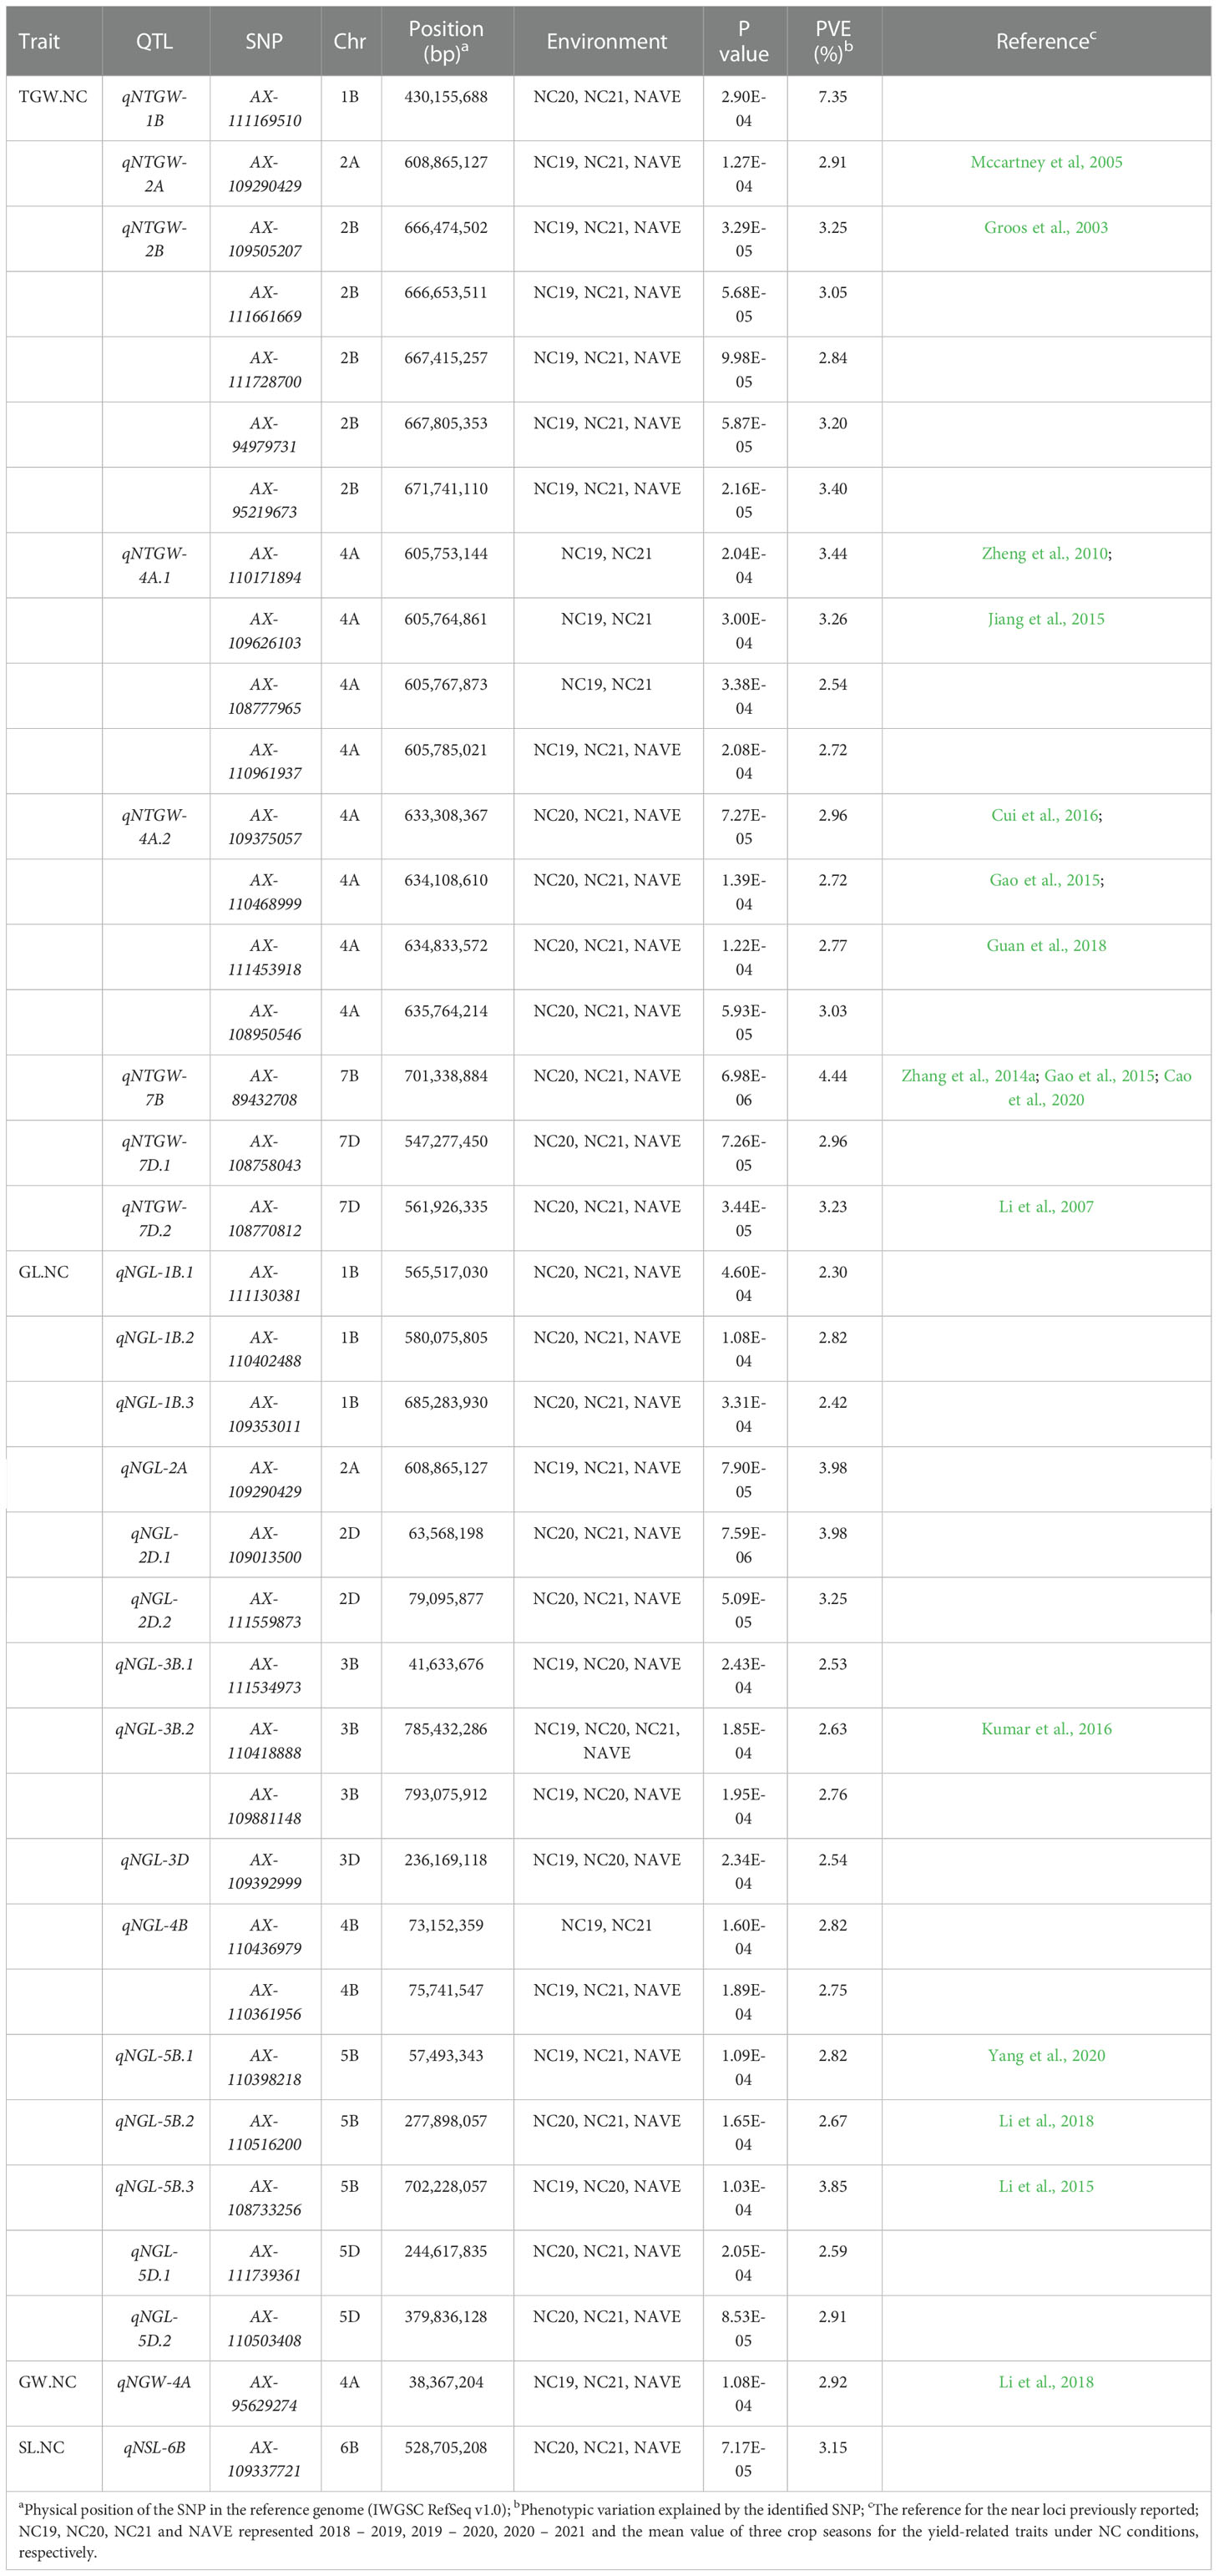
Table 2 The QTL and significant SNPs identified by GWAS for the yield-related traits under normal (NC) conditions.
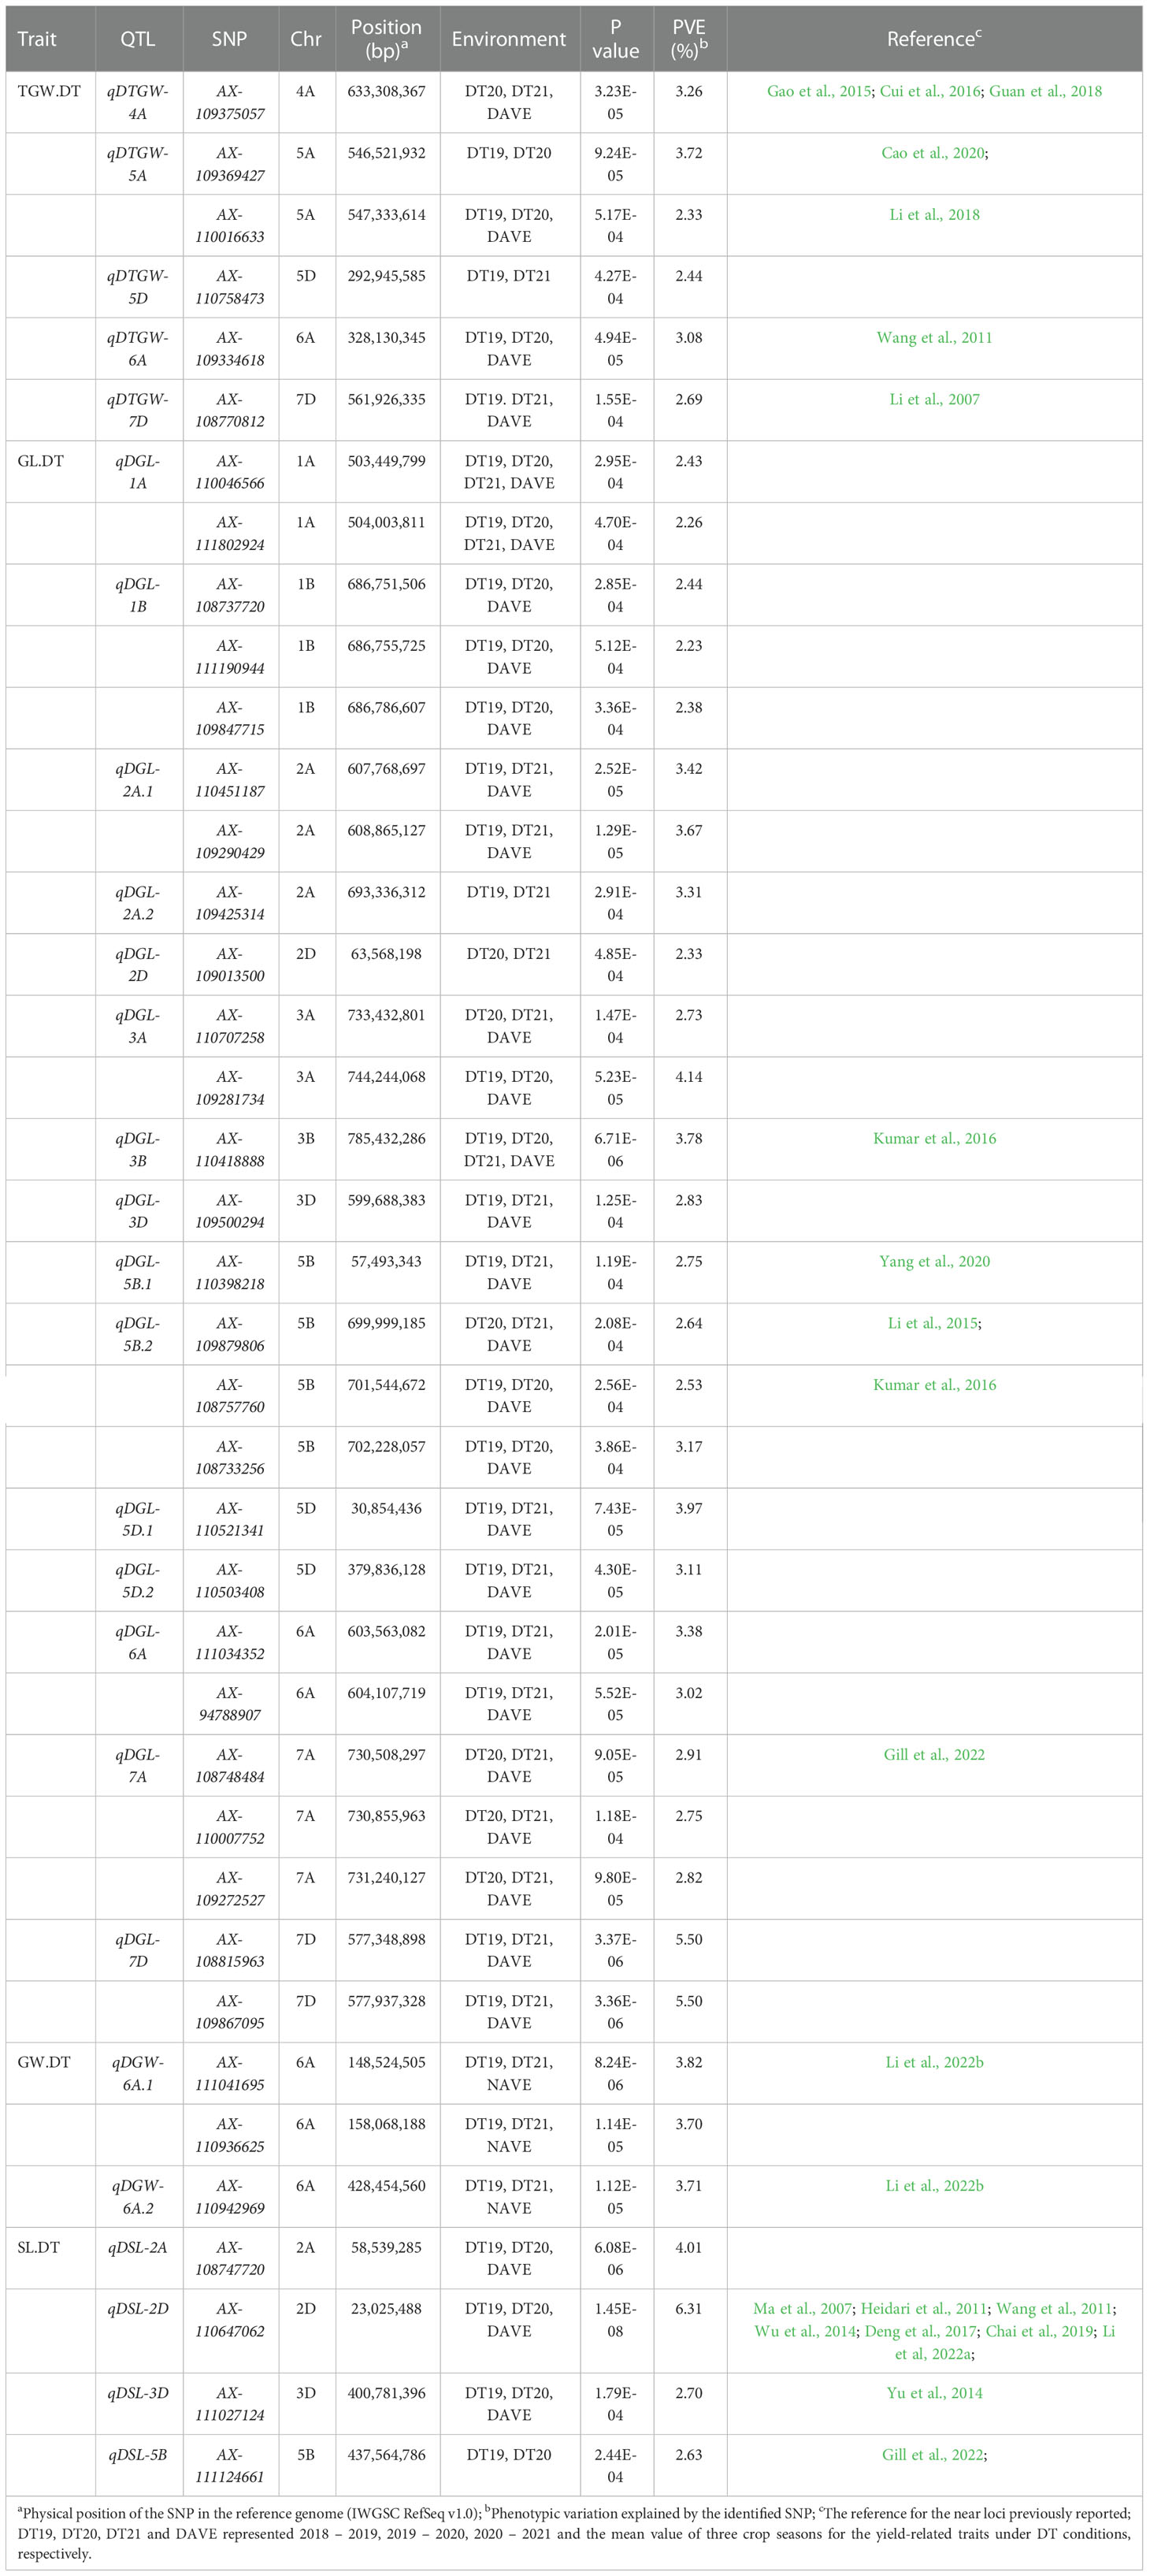
Table 3 The QTL and significant SNPs identified by GWAS for the yield-related traits under drought treatment (DT) conditions.
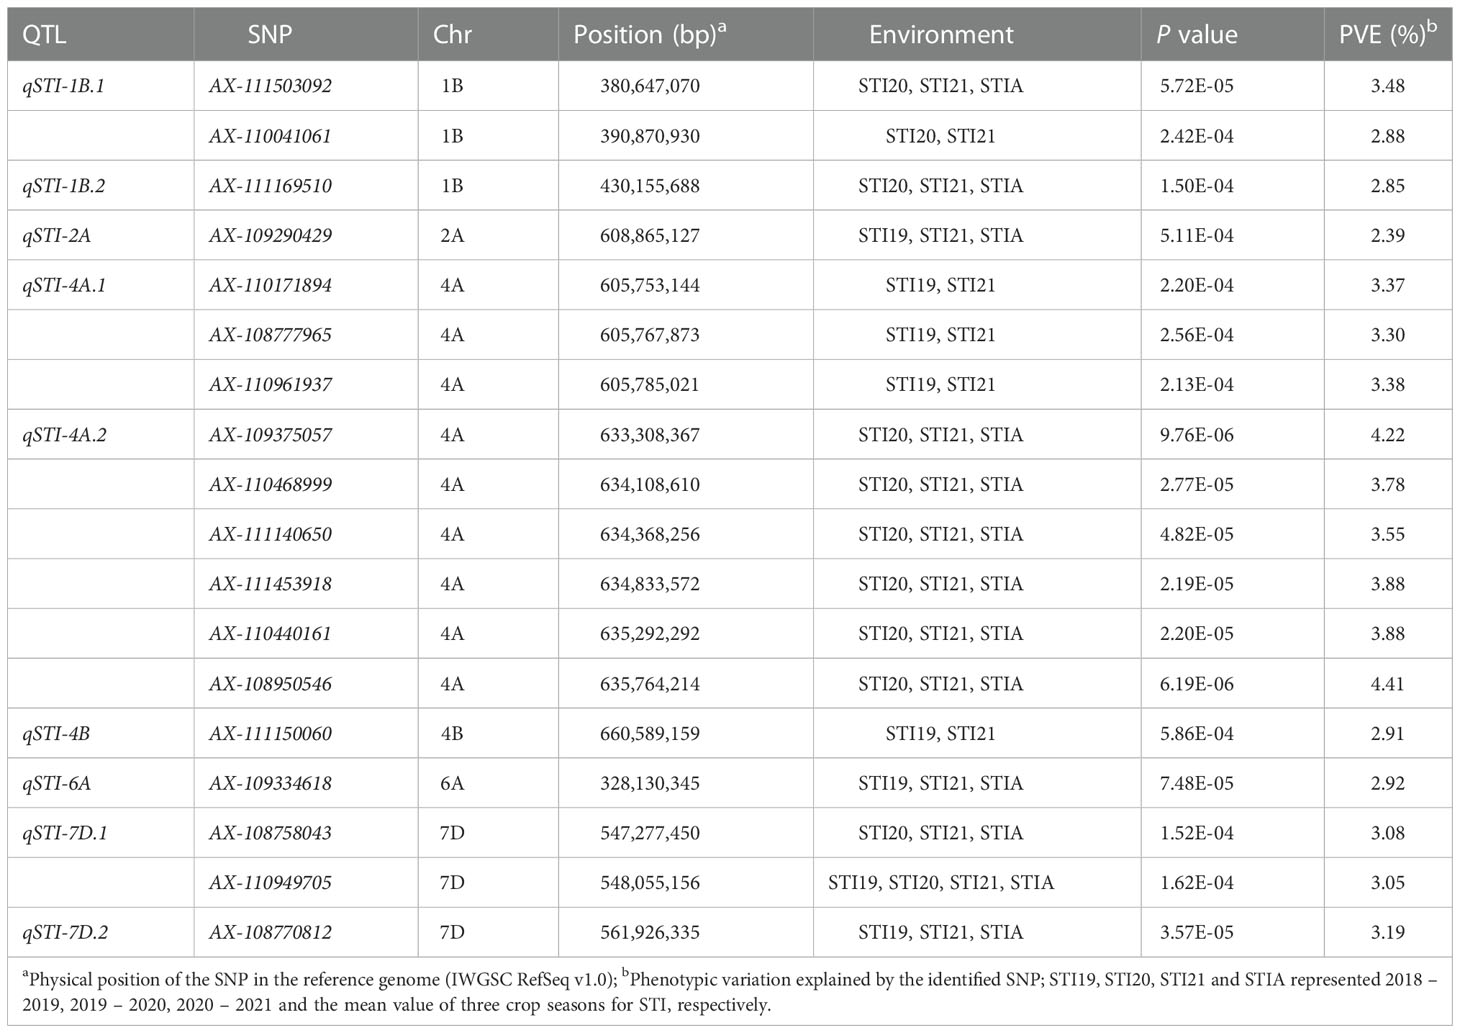
Table 4 The QTL and significant SNPs identified by GWAS for stress tolerance index (STI).
Eight QTL, represented by 18 SNPs, were detected on chromosomes 1B, 2A, 2B, 4A, 7B, and 7D for TGW under normal conditions (Figure 4A, Supplementary Figures 5A–C, Table 2, and Supplementary Table 3). One important QTL, qNTGW-2B, had five significant SNPs in multiple environments. qNTGW-2B was mapped to the physical region of 666.47 – 671.74 Mb on chromosome 2B, accounting for 2.84 – 3.40% of the phenotypic variation. Two QTL associated with TGW were detected on chromosome 4A. The first, qNTGW-4A.1, had four SNPs mapped to the physical position of 605.75 – 605.78 Mb and explained 2.54 – 3.44% of the phenotypic variation. The second qNTGW-4A.2, located at position of 633.30 – 635.76 Mb, was also represented by four SNPs and explained approximately 2.72 – 3.03% of the phenotypic variation. Besides, chromosome 7D also had two QTL (qNTGW-7D.1 and qNTGW-7D.2), marked by SNPs AX-108758043 and AX-108770812 and explaining 2.96 and 3.23% of the phenotypic variation, respectively. In addition, three QTL, qNTGW-1B (430.15 Mb), qNTGW-2A (608.86 Mb), and qNTGW-7B (701.33 Mb), were represented by SNPs AX-111169510, AX-109290429, and AX-89432708, respectively, and collectively explained 14.70% of the phenotypic variation. Under drought treatment conditions, five QTL were associated with TGW (Figure 4B, Supplementary Figures 5D–F, Table 3, and Supplementary Table 3). Among these, qDTGW-5A physically was mapped to the physical region of 546.52 – 547.33 Mb on chromosome 5A. This QTL was represented by two SNPs and explained 2.33 – 3.72% of the phenotypic variation under drought treatment conditions. Another QTL, qDTGW-5D, at 292.94 Mb on chromosome 5D and qDTGW-6A at 328.13 Mb on chromosome 6A explained 2.44 and 3.08% of the phenotypic variation, respectively. Furthermore, two QTL represented by SNPs AX-109375057 and AX-108770812 were located on chromosomes 4A and 7D under both conditions. qDTGW-4A on chromosome 4A explained 3.26% of the phenotypic variation under the DT conditions, whereas qDTGW-7D on chromosome 7D explained 2.69% of the phenotypic variation.
Under the normal conditions, 15 QTL for GL, represented by 17 SNPs, were detected on chromosomes 1B, 2A, 2D, 3B, 3D, 4B, 5B, and 5D (Figure 4C, Supplementary Figures 6A–C, Table 2, and Supplementary Table 3). qNGL-1B.1 (565.51 Mb), qNGL-1B.2 (580.07 Mb), and qNGL-1B.3 (685.28 Mb) were detected on chromosome 1B, accounting for 2.30 – 2.82% of the phenotypic variation. Three QTL (qNGL-2A, qNGL-3B.1, and qNGL-3D) marked by AX-109290429, AX-111534973, and AX-109392999, were detected on chromosomes 2A, 3B, and 3D, respectively. Two QTL (qNGL-2D.1, qNGL-2D.2) were mapped to 63.56 Mb and 79.09 Mb on chromosome 2D. Besides, qNGL-3B.2 and qNGL-4B, explaining 2.63 – 2.82% of the phenotypic variation in GL, were represented by two SNPs, respectively. Finally, five QTL (qNGL-5B.1, qNGL-5B.2, qNGL-5B.3, qNGL-5D.1, and qNGL-5D.2) located on chromosomes 5B and 5D were represented by five SNPs and accounted for 2.59 – 3.85% of the phenotypic variation.
Under drought treatment conditions, fifteen QTL associated with GL were represented by 26 significant SNPs on chromosomes 1A, 1B, 2A, 2D, 3A, 3B, 3D, 5B, 5D, 6A, 7A, and 7D (Figure 4D, Supplementary Figures 6D–F, Table 3, and Supplementary Table 3). One of the 15, qDGL-1A, was detected at the physical position of 503.44 – 504.00 Mb on chromosome 1A. Two SNPs represented this QTL, collectively explaining 4.69% of the phenotypic variation. Seven of these QTL, including qDGL-2A.2 (693.33 Mb), qDGL-2D (63.56 Mb), qDGL-3B (785.43 Mb), qDGL-3D (599.68 Mb), qDGL-5B.1 (57.49 Mb), qDGL-5D.1 (30.85 Mb) and qDGL-5D.2 (379.83 Mb) were represented by various SNPs, which accounted for 2.33 – 3.97% of the phenotypic variation. qDGL-7A and qDGL-7D are located on chromosomes 7A and 7D, represented by five SNPs, accounting for 2.75 – 5.50% of the phenotypic variation. qDGL-1B was located at the physical position of 686.75 – 686.78 Mb on chromosome 1B, and qDGL-5B.2 was at the physical position of 699.99 – 702.22 Mb on chromosome 5B. These two QTL, which explained 2.23 – 3.17% of the phenotypic variation, were represented by three SNPs. Three QTL (qDGL-2A.1, qDGL-3A, and qDGL-6A) represented by two SNPs were mapped on chromosomes 2A, 3A, and 6A, respectively, explaining 2.73 – 4.14% of the phenotypic variation. Additionally, six SNPs, including AX-109290429 (on chromosome 2A), AX-109013500 (on chromosome 2D), AX-110418888 (on chromosome 3B), AX-110398218 (on chromosome 5B), AX-108733256 (on chromosome 5B), and AX-110503408 (on chromosome 5D) were detected under NC and DT conditions. Most notably, AX-109290429 was associated with TGW.NC, GL.NC, and GL.DT.
Under the normal conditions, one QTL, qNGW-4A, was detected at 38.36 Mb on chromosome 4A and accounted for 2.92% of the phenotypic variation (Figure 5A, Supplementary Figures 7A–C, Table 2, and Supplementary Table 3). By contrast, the DT conditions revealed two QTL represented by three SNPs on chromosome 6A (Figure 5B, Supplementary Figures 7D–F, Table 3, and Supplementary Table 3). The first QTL qDGW-6A.1, located at 148.52 – 158.06 Mb, was represented by two SNPs and explained 3.70 – 3.82% of the total phenotypic variation. The second QTL, qDGW-6A.2, represented by SNP AX-110942969, was mapped to the physical position of 428.45 Mb and explained 3.71% of the phenotypic variation.
For SL, one QTL, qNSL-6B, represented by AX-109337721, was mapped to 528.70 Mb on chromosome 6B and explained 3.15% of the total phenotypic variation under the normal conditions (Figure 5C, Supplementary Figures 8A–C,Table 2, and Supplementary Table 3). In contrast, we detected four QTL represented by four SNPs on chromosomes 2A, 2D, 3D, and 5B under the DT conditions (Figure 5D, Supplementary Figures 8D–F, Table 3, and Supplementary Table 3). The first QTL, qDSL-2A, represented by AX-108747720, was marked to chromosome 2A and explained 4.01% of the phenotypic variation. The second QTL, qDSL-2D, detected on chromosome 2D (at 23.02 Mb), was represented by AX-110647062 and explained 6.31% of phenotypic variation in SL. The last two QTL (qDSL-3D and qDSL-5B) explained 2.70 and 2.63% of the phenotypic variation, respectively.
For STI, nine high confidence QTL were detected under more than one environment. These QTL involved 18 SNPs distributed on six chromosomes (including 1B, 2A, 4A, 4B, 6A and 7D) (Figure 5E, Supplementary Figure 9, Table 4, and Supplementary Table 4). Five of these QTL, including qSTI-1B.2 (430.15 Mb), qSTI-2A (608.86 Mb), qSTI-4B (660.58 Mb), qSTI-6A (328.13 Mb) and qSTI-7D.2 (561.92 Mb) were represented by various SNPs, which accounted for 2.39 – 3.19% of the phenotypic variation. In addition, qSTI-1B.1 was located at 380.64 – 390.87 Mb on chromosome 1B, and qSTI-7D.1 was detected at 547.27 – 548.05 Mb on chromosome 7D. These two QTL, which explained 2.88 – 3.48% of the phenotypic variation, were represented by two SNPs, respectively. Another two QTL (qSTI-4A.1 and qSTI-4A.2) represented by nine SNPs on chromosome 4A totally explained 33.76% of the phenotypic variation. Notably, twelve SNPs (including AX-111169510, AX-109290429, AX-110171894, AX-108777965, AX-110961937,AX-109375057, AX-110468999, AX-111453918, AX-108950546, AX-109334618, AX-108758043 and AX-108770812) had association with STI as well as TGW.
The marker alleles associated with high TGW, GL, GW, and SL were considered “superior alleles”, and the marker alleles with the opposite effects as “inferior alleles” to ease the description of allelic effects. The allelic effect was verified using the highest -log10 (P) SNPs within the detected QTL in the association population by examining whether the differences in phenotypic values (grouped by polymorphism) reached a significant level (Figure 6). The number of superior alleles in each wheat line was calculated based on representative SNPs for the loci detected using the average values for grain and spike traits across all environments. The patterns of relationship were similar for the detected traits, where superior alleles additively increased TGW.NC (R2 = 0.2015), TGW.DT (R2 = 0.1581), GL.NC (R2 = 0.2256), GL.DT (R2 = 0.2853), GW.DT (R2 = 0.0098) and SL.DT (R2 = 0.1230) (Figure 7).
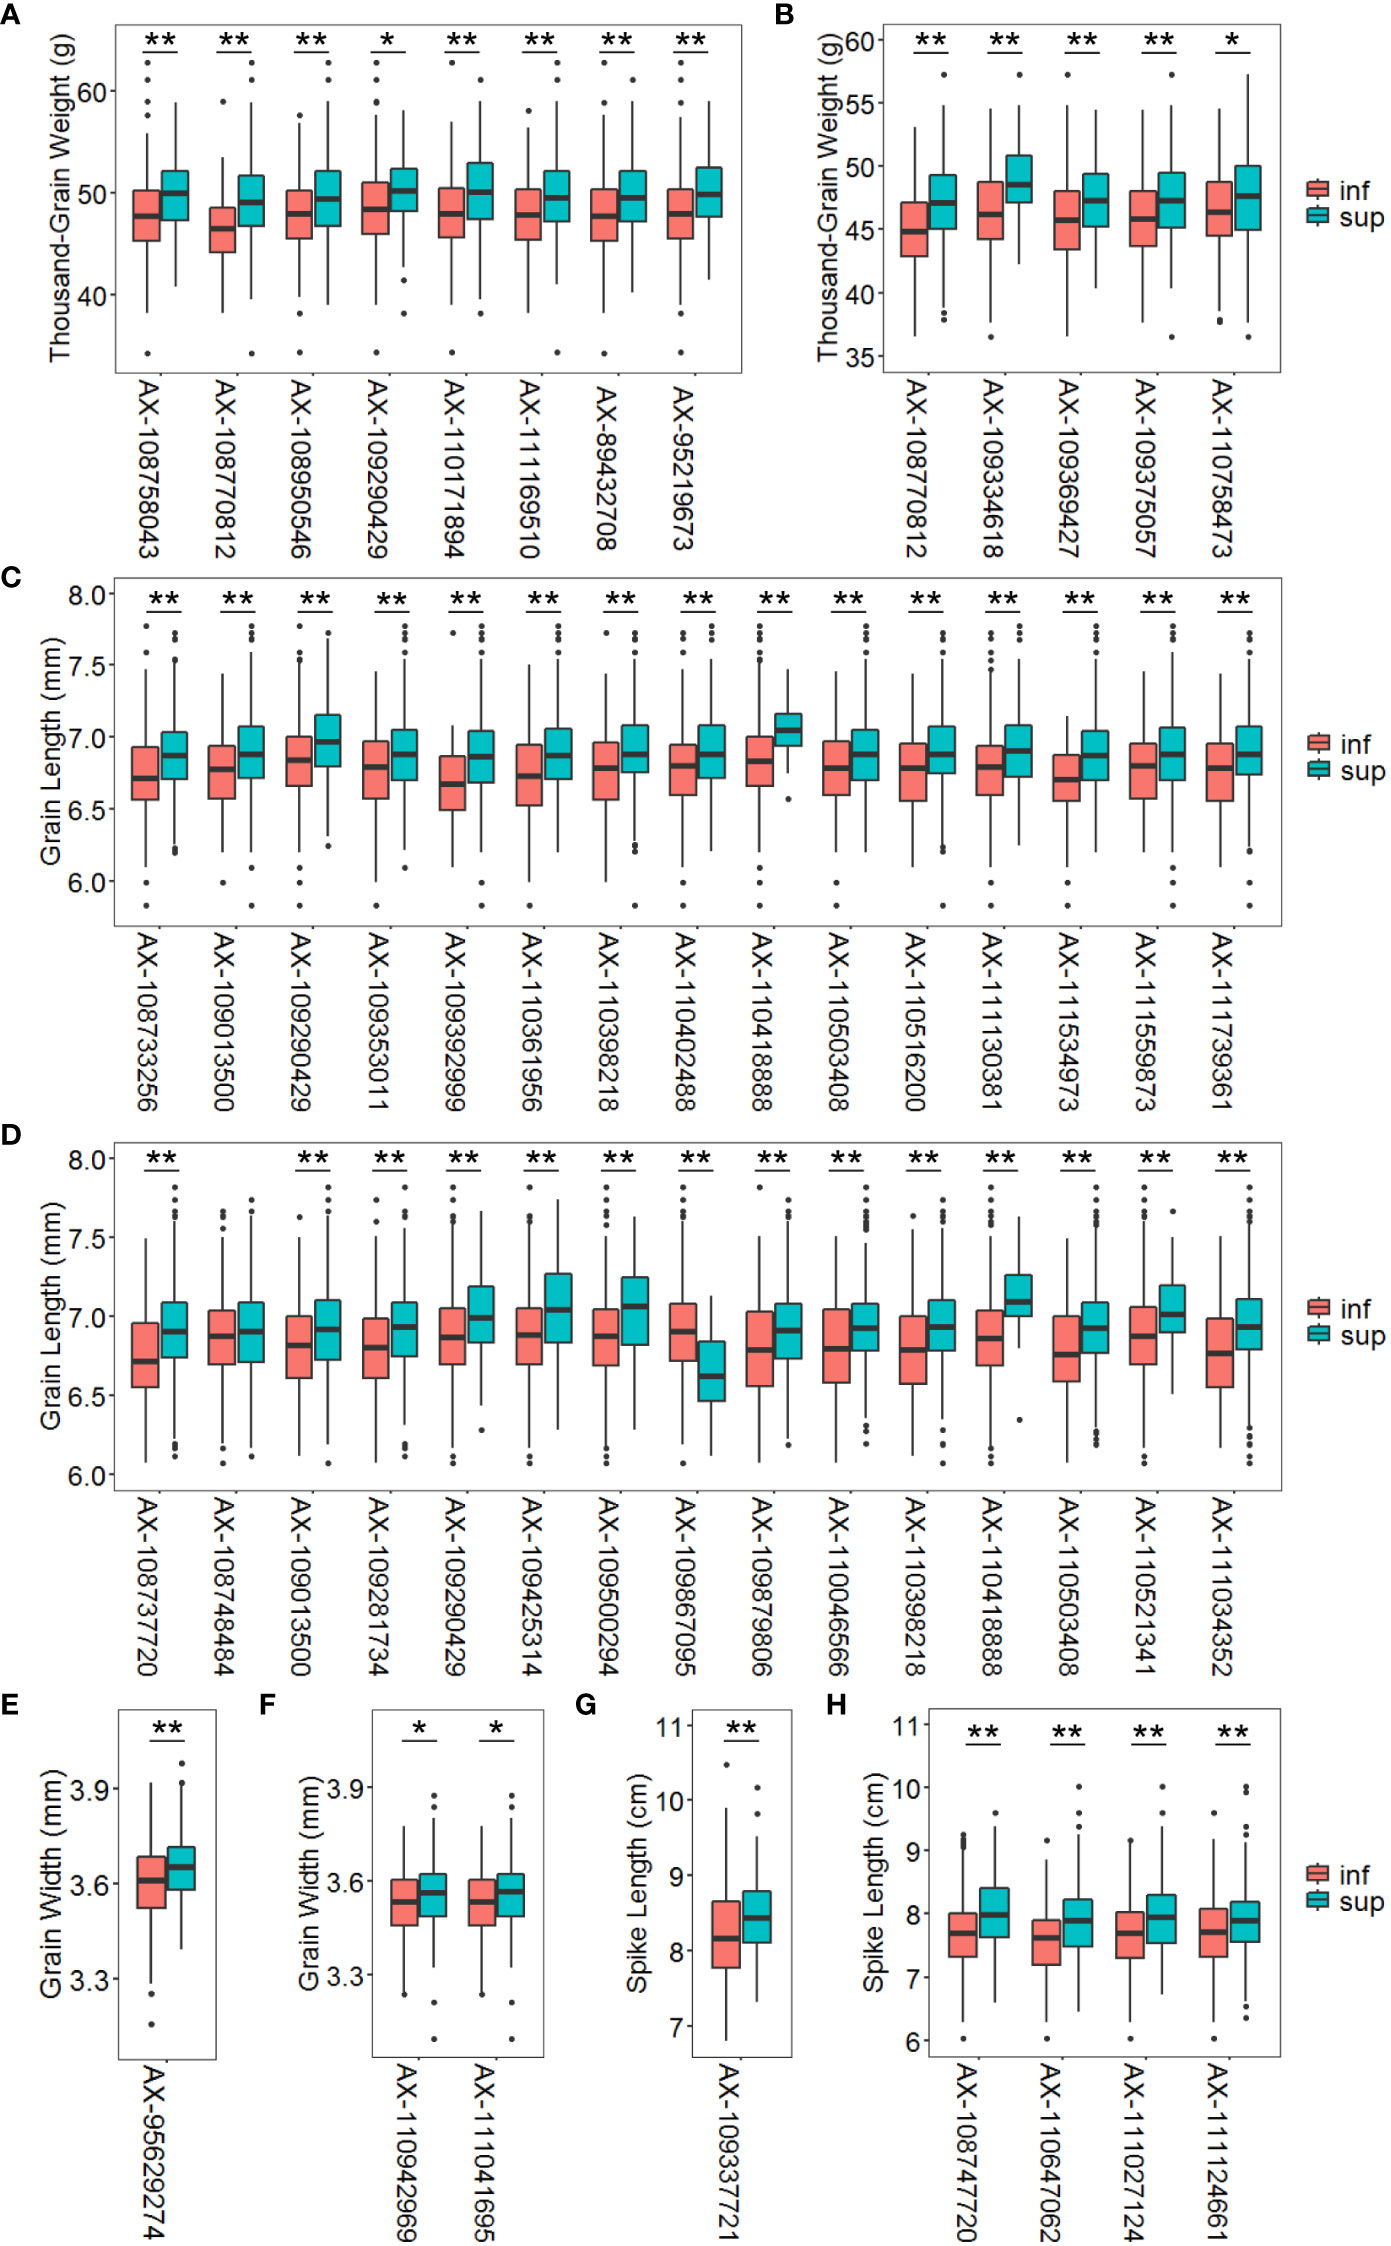
Figure 6 Average phenotypic values of accessions with different alleles in multi-environment significant loci under normal and drought treatment conditions for thousand-grain weight (A, B), grain length (C, D), grain width (E, F) and spike length (G, H). The P value was determined by the two tailed Student’s t-test. *P < 0.05, **P < 0.01. Inf represents the inferior allele and sup represents the superior allele.
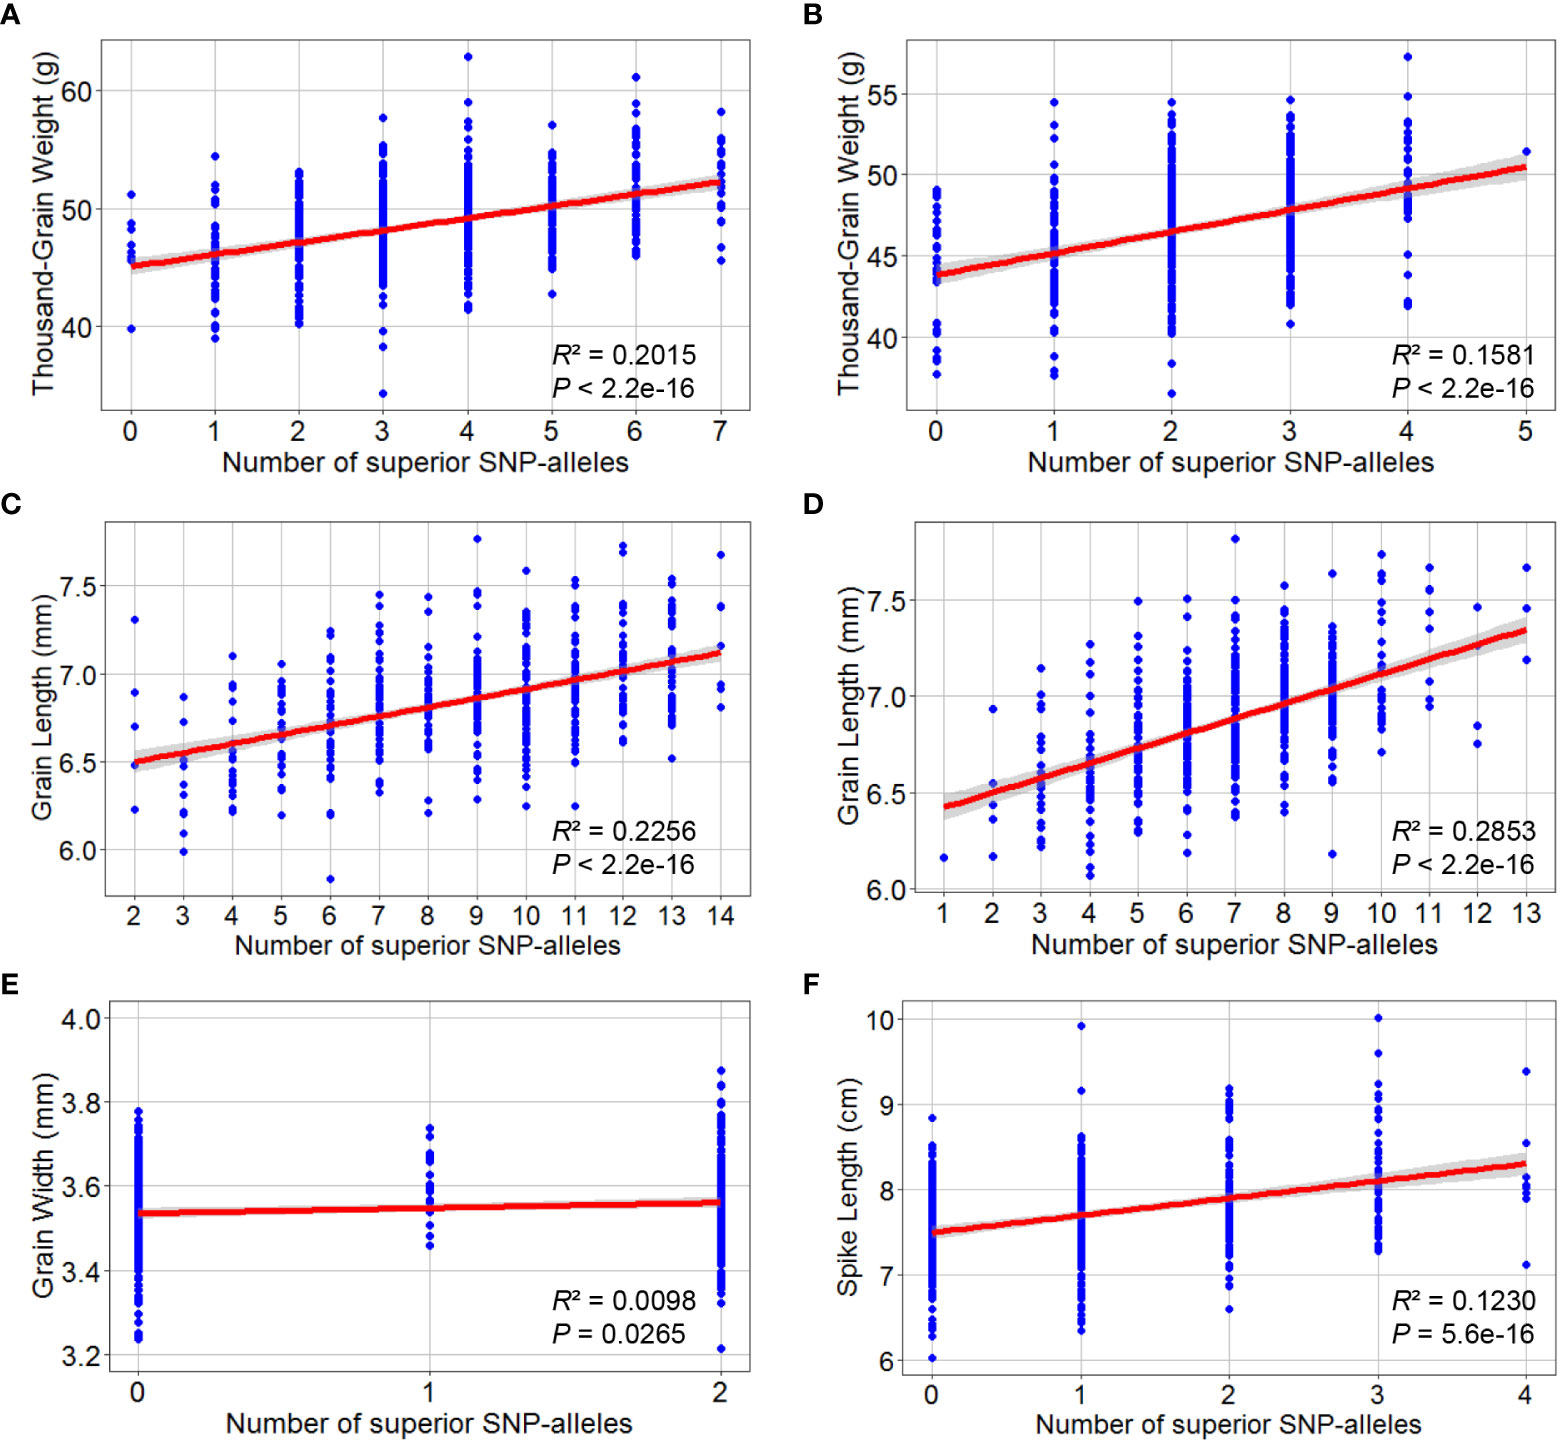
Figure 7 Superior allelic effects of the highest -log10 (P) SNPs by GWAS for thousand-grain weight, grain length, grain width and spike length. Thousand-grain weight under normal (A) and drought treatment (B) conditions; Grain length under normal (C) and drought treatment (D) conditions; (E) Grain width under drought treatment condition; (F) Spike length under drought treatment condition. At the bottom of the box plot corresponding to each SNP allele.
Three significant SNP markers (AX-109290429, AX-110418888, and AX-109369427) on chromosomes 2A, 3B, and 5A were identified in multiple environments were converted into KASP markers. The KASP markers could accurately classify different alleles. The results showed that different alleles carrying FAM and HEX fluorescence were distributed around the X and Y axes, respectively (Supplementary Figure 10). These KASP marker-based allelic typing results were consistent with those on the 15K SNP array.
Wheat is particularly vulnerable to drought stress during growth. This study investigated the effects of drought stress on yield-related traits of wheat. Under the drought treatment conditions, TGW, GW, and SL were reduced by 4, 2, and 6% compared to the normal conditions (Figure 1 and Table 1). However, the broad sense heritability of TGW, GL, GW, and SL was relatively high (76.16 – 95.66%) under both conditions, consistent with previous studies (Sukumaran et al., 2018; Wolde et al., 2019; Ji et al., 2021; Wang et al., 2021; Wang et al., 2022). Furthermore, the association panel showed significant phenotypic variation in TGW, GL, GW, and SL under normal and drought conditions. These results highlight the potential of these germplasms to identify the alleles associated with plant adaption to harsh environments for improving elite wheat yield.
The association results were validated using MLM, which considers population structure and kinship to define the significant SNPs in over two environments under normal and drought conditions. Therefore, 37 and 39 significant SNPs (in 51 QTL) were considered reliable MTAs in multiple environments associated with the yield-related traits under NC and DT conditions (Tables 2, 3). Eighteen MTAs (in nine QTL) associated with STI were identified in more than one environment (Table 4). Furthermore, we identified the QTL for the stability of grain and spike traits by comparing the MTAs detected under normal and drought treatment conditions simultaneously with those detected only under normal conditions.
We observed 18 credible SNPs associated with TGW, representing eight loci mapped onto chromosomes 1BL, 2AL, 2BL, 4AL, 7BL, and 7DL under normal conditions. One SNP cluster (consisting of five SNPs) was identified on chromosome 2BL, spanning the 5.27 Mb (2B: 666.47 – 671.74 Mb) physical position. This locus was located on the same genomic region containing previously reported QTL for TGW (Groos et al., 2003). In addition, two adjacent major QTL represented by eight SNPs were detected on chromosome 4AL, explaining 23.44% of the TGW variance. One QTL, qNTGW-4A.1, accounted for 11.96% of the phenotypic variation, consistent with a previous study (Zheng et al., 2010). Moreover, the QTL was adjacent to the yield-associated gene, TaCWI-4A, in the Jiang consensus map (Jiang et al., 2015). Another QTL, qNTGW-4A.2, located at the 633.30 – 635.76 Mb interval on chromosome 4A, was adjacent to other QTL for TGW, as previously indicated (Gao et al., 2015; Cui et al., 2016; Guan et al., 2018). In addition, qNTGW-2A, qNTGW-7B, and qNTGW-7D.2 associated with TGW were detected on chromosomes 2AL, 7BL, and 7DL, respectively (Mccartney et al., 2005; Li et al., 2007; Zhang et al., 2014a; Gao et al., 2015; Cao et al., 2020). Although previous studies also identified several QTL controlling TGW on chromosome 1B (Zheng et al., 2010; Wang et al., 2012; Cui et al., 2014; Sukumaran et al., 2018; Qu et al., 2021), the QTL were inconsistent with qNTGW-1B detected in this study, suggesting that qNTGW-1B, reported for the first time in the current study was a novel QTL.
A total of 15 QTL containing 17 SNPs associated with GL were detected on chromosomes 1B, 2A, 2D, 3B, 3D, 4B, 5B, and 5D under normal conditions. Among these loci, qNGL-3B.2, associated with GL, was marked at 785.43 – 793.05 Mb on chromosome 3BL. Previous studies have also identified QTL that controls GL at adjacent positions (Kumar et al., 2016). We identified three QTL on chromosome 5B, which explained 9.34% of phenotypic variation in GL. The first QTL, qNGL-5B.1, on chromosome 5BS was mapped at a similar position with Qgl.caas-5BS, associated with GL (Yang et al., 2020). The second QTL was located at the neighboring chromosomal region of the grain-length-related QTL, QKL.caas-5BS, detected in the Chinese bread wheat recombinant inbred population (Li et al., 2018). The third QTL, qNGL-5B.3, on chromosome 5BL shared a similar region with QKl5B.2-16 for GL (Li et al., 2015). Notably, the SNP AX-109290429 on chromosome 2AL was significantly associated with GL, TGW and STI, suggesting that this locus is highly valuable for these traits. Position-based comparisons of the SNPs identified in this study with previous reports identified another ten new and preliminary loci associated with GL on chromosomes 1B, 2D, 3B, 3D, 4B, and 5D.
Several previous studies also identified QTL for GW, such as qKW-4A (Su et al., 2018), QKW.ndsu.4A (Kumar et al., 2016), QKw-4A.1 (Cui et al., 2016), QKW.caas-4AS (Li et al., 2018), and QKW.caas-4AL (Li et al., 2018) on chromosome 4A. This study also detected qNGW-4A for GW on chromosome 4AS under normal conditions, similar with the position identified by Li et al. (Li et al., 2018).
Moreover, there were several QTL for SL detected on chromosome 6B in the previous studies (Liu et al., 2014; Gao et al., 2015; Deng et al., 2017; Li et al., 2018; Cao et al., 2019). We also detected a credible QTL at the physical position of 528.70 Mb on chromosome 6B. However, this QTL for SL was not previously reported, suggesting that it may be new.
The SNPs detected under DT differed from those under the normal conditions (Table 3 and Supplementary Table 3) owing to the effects of the drought stress. We also detected five QTL represented by six SNPs for TGW under DT. Most notably, two of these SNPs (AX-109375057 and AX-108770812) were associated with TGW.NC, TGW.DT and STI, suggesting that these SNPs’ effects on TGW and STI were extremely important and unaffected by environmental changes (Tables 2–4 and Supplementary Tables 3, 4). Moreover, the QTL qDTGW-5A for TGW was located at adjacent chromosomal regions (Li et al., 2018; Cao et al., 2020). Furthermore, qDTGW-6A was marked at an approximately equivalent chromosomal region in a previous study (Wang et al., 2011). Comparisons between qDTGW-5D discovered in this research with other QTL identified in previous studies showed that qDTGW-5D, located on chromosome 5D, was a newly detected QTL regulating TGW.
For GL, nine QTL were detected under DT conditions, and six others under NC and DT conditions. Previously, qDGL-7A for GL was only detected under DT conditions in the region near SNP S7A_717859384, associated with GL (Gill et al., 2022). For GW, we detected two QTL on chromosome 6A under DT. These QTL were marked at a near location similar with a previously detected QTL for GW (Li et al., 2022b). We discovered four QTL for SL on chromosome 2AS, 2DS, 3DL, and 5BL under DT. Of these, qDSL-2D, qDSL-3D, and qDSL-5B were located at similar regions with QTL for SL from previous studies (Ma et al., 2007; Heidari et al., 2011; Wang et al., 2011; Wu et al., 2014; Yu et al., 2014; Deng et al., 2017; Chai et al., 2019; Gill et al., 2022; Li et al., 2022a). Notably, qDSL-2A for SL was first discovered in the current study by comparing this study with previous research.
A total of nine high confidence QTL for STI were detected, out of which, seven QTL (qDRI-1B.2, qDRI-2A, qDRI-4A.1, qDRI-4A.2, qDRI-6A, qDRI-7D.1, qDRI-7D.2) were co-located with QTL for TGW under NC or DT conditions. Therefore, these seven co-located QTL can be used to synergistically improve the yield and drought resistance of wheat. To the best of our knowledge, only a few QTL for STI, which was calculated from TGW, have been detected in wheat (Negisho et al., 2022). Nevertheless, they were located at different chromosomal regions with these QTL for STI detected in this study.
Many agronomic traits are complex quantitative traits that are susceptible to environmental factors. Therefore, this study detected eight stable MTAs (two for TGW and STI, six for GL) under normal and drought conditions. The MTAs detected are important for both normal and drought treatment conditions, providing insights into the genetic basis of the stability of agronomic traits. These MTAs can be used to develop useful markers for genetic improvement in wheat breeding.
This study identified numerous SNPs closely associated with TGW, GL, GW, SL and STI. Among these, three SNP markers were developed as KASP markers, making the genotype identification process more efficient, inexpensive, fast, convenient, and greatly accelerating the process of molecular marker-assisted selection. Under normal conditions, accessions with superior alleles for TGW at eight SNP loci showed TGW values of 49.29 to 50.17 g. In contrast, accessions with inferior alleles at these loci showed TGW values of 46.45 – 48.54 g. Under DT conditions, accessions with superior alleles for TGW at five SNP loci showed TGW values of 47.36 – 49.03 g compared to 44.93 – 46.55 g for accessions with inferior alleles. Nevertheless, the frequency of superior alleles of SNP AX-109334618 on chromosome 6A was only about 5%, indicating that this SNP has not been fully utilized. Furthermore, this SNP was associated with not only TGW but also STI, suggesting that it is worth considering as a major genetic locus for improving TGW and drought resistance (Figures 6A, B).
Under normal conditions, accessions with superior alleles for GL at 15 SNP loci showed significantly higher GL values (6.87 – 7.07 mm) than those with inferior alleles (6.68 – 6.84 mm). Moreover, under DT conditions, the GL values of accessions with superior alleles for this trait at 15 SNP loci ranged from 6.89 to 7.12 mm compared to 6.64 – 6.87 mm for accessions with inferior alleles at the same loci. However, superior alleles at some loci, such as AX-109290429, AX-109425314, AX-110418888, AX-109500294, and AX-110521341, were present in < 12% of the accessions, suggesting that these loci require more attention when studying the improvement of GL (Figures 6C, D). Under normal conditions, accessions with a superior allele at AX-95629274 showed 3.65 mm GW values than the 3.60 mm for accessions with an inferior allele at this locus. Furthermore, accessions with superior alleles at two SNP loci showed higher GW values (~3.53 mm) than accessions with inferior alleles (~3.56 mm) under DT conditions (Figures 6E, F).
However, accessions with the superior allele of SNP AX-109337721 showed significantly higher SL values (~8.17 cm) than those with the inferior allele (~8.52 cm) under normal conditions. Notably, the superior allele of this SNP was < 14% frequent among accessions, indicating that this SNP is underutilized and a probably significant genetic locus for improving SL. Finally, the SL values of accessions with superior alleles for this trait at the four SNP loci were 7.88 – 8.01 cm compared to 7.55 – 7.70 cm for accessions with inferior alleles under DT conditions. Nevertheless, the frequencies of superior alleles for AX-108747720, AX-111027124, and AX-111124661 were < 26%, indicating these loci require more attention when improving SL (Figures 6G, H).
The TGW of the detected varieties from different decades increased with increasing frequency of superior alleles under both conditions. Furthermore, increased TGW was strongly selected for breeding before the 2010s. However, after 2020, the average TGW of the accessions in this study decreased slightly, as did the corresponding number of superior alleles in both conditions (Supplementary Figure 11). Altogether, the elite alleles at these loci detected under two conditions can be integrated into wheat varieties using molecular breeding to improve wheat yield.
In summary, this study identified high confidence loci for yield-related and drought-resistance-related traits in normal and drought-stressed common wheat by GWAS and developed three KASP markers associated with these traits, which is a major step to accelerate the breeding of high-yielding and drought-resistant varieties.
The original contributions presented in the study are included in the article/Supplementary Material. Further inquiries can be directed to the corresponding author.
HL and YJZ conceived and designed the experiments. JZ, LS and HG performed most of the experiments and wrote the manuscript. MH, LM, XC and JW provided technical assistance and conducted the collection and maintenance of wheat germplasm. YZ, QL and PW involved in discussion and participated in field trials. All authors contributed to the article and approved the submitted version.
This work was supported by National Natural Science Foundation of China (32101749), Science and Technology Program of Hebei (20326345D, C2022301004), Hebei Modern Agricultural Industrial Technology System (HBCT2018010201), Project for Hebei Scientific and Technological Innovation Team of Modern Wheat Seed Industry (21326318D), HAAFS Science and Technology Innovation Special Project (2022KJCXZX-LYS-1, 2022KJCXZX-LYS-20) and Talents construction project of science and technology innovation, Hebei Academy of Agriculture and Forestry Sciences (C22R0305).
The authors thank Dr. Yelun Zhang and Dr. Liangjie Lv, Institute of Cereal and Oil Crops, Hebei Academy of Agriculture and Forestry Sciences, for providing the wheat accessions.
The authors declare that the research was conducted in the absence of any commercial or financial relationships that could be construed as a potential conflict of interest.
All claims expressed in this article are solely those of the authors and do not necessarily represent those of their affiliated organizations, or those of the publisher, the editors and the reviewers. Any product that may be evaluated in this article, or claim that may be made by its manufacturer, is not guaranteed or endorsed by the publisher.
The Supplementary Material for this article can be found online at: https://www.frontiersin.org/articles/10.3389/fpls.2022.1098560/full#supplementary-material
Ahmed, H. G. M., Zeng, Y., Shah, A. N., Yar, M. M., Ullah, A., Ali, M. (2022). Conferring of drought tolerance in wheat (Triticum aestivum L.) genotypes using seedling indices. Front. Plant Sci. 13, 961049. doi: 10.3389/fpls.2022.961049
Bradbury, P. J., Zhang, Z., Kroon, D. E., Casstevens, T. M., Ramdoss, Y., Buckler, E. S. (2007). TASSEL: software for association mapping of complex traits in diverse samples. Bioinformatics 23, 2633–2635. doi: 10.1093/bioinformatics/btm308
Cao, P., Liang, X., Zhao, H., Feng, B., Xu, E., Wang, L., et al. (2019). Identification of the quantitative trait loci controlling spike-related traits in hexaploid wheat (Triticum aestivum L.). Planta 250, 1967–1981. doi: 10.1007/s00425-019-03278-0
Cao, J., Liu, K., Song, W., Zhang, J., Yao, Y., Xin, M., et al. (2021). Pleiotropic function of the SQUAMOSA PROMOTER-BINDING PROTEIN-LIKE gene TaSPL14 in wheat plant architecture. Planta 253, 44. doi: 10.1007/s00425-020-03531-x
Cao, S., Xu, D., Hanif, M., Xia, X., He, Z. (2020). Genetic architecture underpinning yield component traits in wheat. Theor. Appl. Genet. 133, 1811–1823. doi: 10.1007/s00122-020-03562-8
Chai, L., Chen, Z., Bian, R., Zhai, H., Cheng, X., Peng, H., et al. (2019). Dissection of two quantitative trait loci with pleiotropic effects on plant height and spike length linked in coupling phase on the short arm of chromosome 2D of common wheat (Triticum aestivum L.). Theor. Appl. Genet. 132, 1815–1831. doi: 10.1007/s00122-019-03318-z
Chang, J., Zhang, J., Mao, X., Li, A., Jia, J., Jing, R. (2013). Polymorphism of TaSAP1-A1 and its association with agronomic traits in wheat. Planta 237, 1495–1508. doi: 10.1007/s00425-013-1860-x
Cui, F., Fan, X., Chen, M., Zhang, N., Zhao, C., Zhang, W., et al. (2016). QTL detection for wheat kernel size and quality and the responses of these traits to low nitrogen stress. Theor. Appl. Genet. 129, 469–484. doi: 10.1007/s00122-015-2641-7
Cui, F., Zhao, C., Ding, A., Li, J., Wang, L., Li, X., et al. (2014). Construction of an integrative linkage map and QTL mapping of grain yield-related traits using three related wheat RIL populations. Theor. Appl. Genet. 127, 659–675. doi: 10.1007/s00122-013-2249-8
Deng, Z., Cui, Y., Han, Q., Fang, W., Li, J., Tian, J. (2017). Discovery of consistent QTLs of wheat spike-related traits under nitrogen treatment at different development stages. Front. Plant Sci. 8, 2120. doi: 10.3389/fpls.2017.02120
Dong, L., Wang, F., Liu, T., Dong, Z., Li, A., Jing, R., et al. (2014). Natural variation of TaGASR7-A1 affects grain length in common wheat under multiple cultivation conditions. Mol. Breed. 34, 937–947. doi: 10.1007/s11032-014-0087-2
Fernandez, G. C. J. (1992). “Effective selection criteria for assessing plant stress tolerance,” in Proceedings of the International Symposium on Adaptation of Vegetables and Other Food Crops in Temperature and Water Stress. Ed. Kuo, C. G. (Tainan, Taiwan).
Gao, F., Wen, W., Liu, J., Rasheed, A., Yin, G., Xia, X., et al. (2015). Genome-wide linkage mapping of QTL for yield components, plant height and yield-related physiological traits in the Chinese wheat cross zhou 8425B/Chinese spring. Front. Plant Sci. 6, 1099. doi: 10.3389/fpls.2015.01099
Gill, H. S., Halder, J., Zhang, J., Rana, A., Kleinjan, J., Amand, P. S., et al. (2022). Whole-genome analysis of hard winter wheat germplasm identifies genomic regions associated with spike and kernel traits. Theor. Appl. Genet. 135, 2953–2967. doi: 10.1007/s00122-022-04160-6
Groos, C., Robert, N., Bervas, E., Charmet, G. (2003). Genetic analysis of grain protein-content, grain yield and thousand-kernel weight in bread wheat. Theor. Appl. Genet. 106, 1032–1040. doi: 10.1007/s00122-002-1111-1
Guan, P., Lu, L., Jia, L., Kabir, M. R., Zhang, J., Zhao, Y., et al. (2018). Global QTL analysis identifies genomic regions on chromosomes 4A and 4B harboring stable loci for yield-related traits across different environments in wheat (Triticum aestivum L.). Front. Plant Sci. 9, 529. doi: 10.3389/fpls.2018.00529
Guo, X., Fu, Y., Lee, Y. J., Chern, M., Li, M., Cheng, M., et al. (2022). The PGS1 basic helix-loop-helix (bHLH) protein regulates Fl3 to impact seed growth and grain yield in cereals. Plant Biotechnol. J. 20, 1311–1326. doi: 10.1111/pbi.13809
Hanif, M., Gao, F., Liu, J., Wen, W., Zhang, Y., Rasheed, A., et al. (2016). TaTGW6-A1, an ortholog of rice TGW6, is associated with grain weight and yield in bread wheat. Mol. Breed. 36, 1. doi: 10.1007/s11032-015-0425-z
Hayes, B. (2013). Overview of statistical methods for genome-wide association studies (GWAS). Methods Mol. Biol. 1019, 149–169. doi: 10.1007/978-1-62703-447-0_6
Heidari, B., Sayed-Tabatabaei, B. E., Saeidi, G., Kearsey, M., Suenaga, K. (2011). Mapping QTL for grain yield, yield components, and spike features in a doubled haploid population of bread wheat. Genome 54, 517–527. doi: 10.1139/g11-017
Hong, Y., Chen, L., Du, L. P., Su, Z., Wang, J., Ye, X., et al. (2014). Transcript suppression of TaGW2 increased grain width and weight in bread wheat. Funct. Integr. Genomics 14, 341–349. doi: 10.1007/s10142-014-0380-5
Hu, M. J., Zhang, H. P., Liu, K., Cao, J. J., Wang, S. X., Jiang, H., et al. (2016). Cloning and characterization of TaTGW-7A gene associated with grain weight in wheat via SLAF-seq-BSA. Front. Plant Sci. 7, 1902. doi: 10.3389/fpls.2016.01902
Jia, M., Li, Y., Wang, Z., Tao, S., Sun, G., Kong, X., et al. (2021). TaIAA21 represses TaARF25-mediated expression of TaERFs required for grain size and weight development in wheat. Plant J. 108, 1754–1767. doi: 10.1111/tpj.15541
Jiang, Y., Jiang, Q., Hao, C., Hou, J., Wang, L., Zhang, H., et al. (2015). A yield-associated gene TaCWI, in wheat: Its function, selection and evolution in global breeding revealed by haplotype analysis. Theor. Appl. Genet. 128, 131–143. doi: 10.1007/s00122-014-2417-5
Ji, G., Xu, Z., Fan, X., Zhou, Q., Yu, Q., Liu, X., et al. (2021). Identification of a major and stable QTL on chromosome 5A confers spike length in wheat (Triticum aestivum L.). Mol. Breed. 41, 56. doi: 10.1007/s11032-021-01249-6
Juliana, P., Govindan, V., Crespo-Herrera, L., Mondal, S., Huerta-Espino, J., Shrestha, S., et al. (2022). Genome-wide association mapping identifies key genomic regions for grain zinc and iron biofortification in bread wheat. Front. Plant Sci. 13, 903819. doi: 10.3389/fpls.2022.903819
Kang, Y., Barry, K., Cao, F., Zhou, M. (2020). Genome-wide association mapping for adult resistance to powdery mildew in common wheat. Mol. Boil. Rep. 47, 1241–1256. doi: 10.1007/s11033-019-05225-4
Kumar, A., Mantovani, E. E., Seetan, R., Soltani, A., Echeverry-Solarte, M., Jain, S., et al. (2016). Dissection of genetic factors underlying wheat kernel shape and size in an elite × nonadapted cross using a high density SNP linkage map. Plant Genome 9, 1–22. doi: 10.3835/plantgenome2015.09.0081
Li, T., Deng, G., Su, Y., Yang, Z., Tang, Y., Wang, J., et al. (2022b). Genetic dissection of quantitative trait loci for grain size and weight by high-resolution genetic mapping in bread wheat (Triticum aestivum L.). Theor. Appl. Genet. 135, 257–271. doi: 10.1007/s00122-021-03964-2
Li, A., Hao, C., Wang, Z., Geng, S., Jia, M., Wang, F., et al. (2022a). Wheat breeding history reveals synergistic selection of pleiotropic genomic sites for plant architecture and grain yield. Mol. Plant 15, 504–519. doi: 10.1016/j.molp.2022.01.004
Li, S., Jia, J., Wei, X., Zhang, X., Li, L., Chen, H., et al. (2007). A intervarietal genetic map and QTL analysis for yield traits in wheat. Mol. Breed. 20, 167–178. doi: 10.1007/s11032-007-9080-3
Liu, G., Jia, L., Lu, L., Qin, D., Zhang, J., Guan, P., et al. (2014). Mapping QTLs of yield-related traits using RIL population derived from common wheat and Tibetan semi-wild wheat. Theor. Appl. Genet. 127, 2415–2432. doi: 10.1007/s00122-014-2387-7
Liu, H., Li, H., Hao, C., Wang, K., Wang, Y., Qin, L., et al. (2020). TaDA1, a conserved negative regulator of kernel size, has an additive effect with TaGW2 in common wheat (Triticum aestivum L.). Plant Biotechnol. J. 18, 1330–1342. doi: 10.1111/pbi.13298
Li, F., Wen, W., He, Z., Liu, J., Jin, H., Cao, S., et al. (2018). Genome-wide linkage mapping of yield-related traits in three Chinese bread wheat populations using high-density SNP markers. Theor. Appl. Genet. 131, 1903–1924. doi: 10.1007/s00122-018-3122-6
Li, F., Wen, W., Liu, J., Zhang, Y., Cao, S., He, Z., et al. (2019). Genetic architecture of grain yield in bread wheat based on genome-wide association studies. BMC Plant Biol. 19, 168. doi: 10.1186/s12870-019-1781-3
Li, Q., Zhang, Y., Liu, T., Wang, F., Liu, K., Chen, J., et al. (2015). Genetic analysis of kernel weight and kernel size in wheat (Triticum aestivum L.) using unconditional and conditional QTL mapping. Mol. Breed. 35, 194. doi: 10.1007/s11032-015-0384-4
Li, L., Zhang, Y., Zhang, Y., Li, M., Xu, D., Tian, X., et al. (2021). Genome-wide linkage mapping for preharvest sprouting resistance in wheat using 15K single-nucleotide polymorphism arrays. Front. Plant Sci. 12, 749206. doi: 10.3389/fpls.2021.749206
Ma, L., Li, T., Hao, C., Wang, Y., Chen, X., Zhang, X. (2016). TaGS5-3A, a grain size gene selected during wheat improvement for larger kernel and yield. Plant Biotechnol. J. 14, 1269–1280. doi: 10.1111/pbi.12492
Ma, M., Wang, Q., Li, Z., Cheng, H., Li, Z., Liu, X., et al. (2015). Expression of TaCYP78A3, a gene encoding cytochrome P450 CYP78A3 protein in wheat (Triticum aestivum L.), affects seed size. Plant J. 83, 312–325. doi: 10.1111/tpj.12896
Ma, D., Yan, J., He, Z., Wu, L., Xia, X. (2012). Characterization of a cell wall invertase gene TaCwi-A1 on common wheat chromosome 2A and development of functional markers. Mol. Breed. 29, 43–52. doi: 10.1007/s11032-010-9524-z
Ma, Z., Zhao, D., Zhang, C., Zhang, Z., Xue, S., Lin, F., et al. (2007). Molecular genetic analysis of five spike-related traits in wheat using RIL and immortalized F2 populations. Mol. Genet. Genomics 277, 31–42. doi: 10.1007/s00438-006-0166-0
Mccartney, C. A., Somers, D. J., Humphreys, D. G., Lukow, O., Ames, N., Noll, J., et al. (2005). Mapping quantitative trait loci controlling agronomic traits in the spring wheat cross RL4452 × 'AC domain'. Genome 48, 870–883. doi: 10.1139/g05-055
Negisho, K., Shibru, S., Matros, A., Pillen, K., Ordon, F., Wehner, G. (2022). Association mapping of drought tolerance indices in Ethiopian durum wheat (Triticum turgidum ssp. durum). Front. Plant Sci. 13, 838088. doi: 10.3389/fpls.2022.838088
Nordborg, M., Weigel, D. (2008). Next-generation genetics in plants. Nature 456, 720–723. doi: 10.1038/nature07629
Pang, Y., Liu, C., Wang, D., St Amand, P., Bernardo, A., Li, W., et al. (2020). High-resolution genome-wide association study identifies genomic regions and candidate genes for important agronomic traits in wheat. Mol. Plant 13, 1311–1327. doi: 10.1016/j.molp.2020.07.008
Purcell, S., Neale, B., Todd-Brown, K., Thomas, L., Ferreira, M. A., Bender, D., et al. (2007). PLINK: A tool set for whole-genome association and population-based linkage analyses. Am. J. Hum. Genet. 81, 559–575. doi: 10.1086/519795
Qu, P., Wang, J., Wen, W., Gao, F., Liu, J., Xia, X., et al. (2021). Construction of consensus genetic map with applications in gene mapping of wheat (Triticum aestivum L.) using 90K SNP array. Front. Plant Sci. 12, 727077. doi: 10.3389/fpls.2021.727077
Sajjad, M., Ma, X., Habibullah Khan, S., Shoaib, M., Song, Y., Yang, W., et al. (2017). TaFlo2-A1, an ortholog of rice Flo2, is associated with thousand grain weight in bread wheat (Triticum aestivum L.). BMC Plant Biol. 17, 164. doi: 10.1186/s12870-017-1114-3
Shan, D., Ali, M., Shahid, M., Arif, A., Waheed, M. Q., Xia, X., et al. (2022). Genetic networks underlying salinity tolerance in wheat uncovered with genome-wide analyses and selective sweeps. Theor. Appl. Genet. 135, 2925–2941. doi: 10.1007/s00122-022-04153-5
Sukumaran, S., Lopes, M., Dreisigacker, S., Reynolds, M. (2018). Genetic analysis of multi-environmental spring wheat trials identifies genomic regions for locus-specific trade-offs for grain weight and grain number. Theor. Appl. Genet. 131, 985–998. doi: 10.1007/s00122-017-3037-7
Sun, H., Zhang, W., Wu, Y., Gao, L., Cui, F., Zhao, C., et al. (2020). The circadian clock gene, TaPRR1, is associated with yield-related traits in wheat (Triticum aestivum L.). Front. Plant Sci. 11, 285. doi: 10.3389/fpls.2020.00285
Su, Q., Zhang, X., Zhang, W., Zhang, N., Song, L., Liu, L., et al. (2018). QTL detection for kernel size and weight in bread wheat (Triticum aestivum L.) using a high-density SNP and SSR-based linkage map. Front. Plant Sci. 9, 1484. doi: 10.3389/fpls.2018.01484
Tshikunde, N. M., Mashilo, J., Shimelis, H., Odindo, A. (2019). Agronomic and physiological traits, and associated quantitative trait loci (QTL) affecting yield response in wheat (Triticum aestivum L.): A review. Front. Plant Sci. 10, 1428. doi: 10.3389/fpls.2019.01428
Wang, L., Ge, H., Hao, C., Dong, Y., Zhang, X. (2012). Identifying loci influencing 1,000-kernel weight in wheat by microsatellite screening for evidence of selection during breeding. PloS One 7, e29432. doi: 10.1371/journal.pone.0029432
Wang, X., Guan, P., Xin, M., Wang, Y., Chen, X., Zhao, A., et al. (2021). Genome-wide association study identifies QTL for thousand grain weight in winter wheat under normal- and late-sown stressed environments. Theor. Appl. Genet. 134, 143–157. doi: 10.1007/s00122-020-03687-w
Wang, Y., Hou, J., Liu, H., Li, T., Wang, K., Hao, C., et al. (2019). TaBT1, affecting starch synthesis and thousand kernel weight, underwent strong selection during wheat improvement. J. Exp. Bot. 70, 1497–1511. doi: 10.1093/jxb/erz032
Wang, J., Liu, W., Wang, H., Li, L., Wu, J., Yang, X., et al. (2011). QTL mapping of yield-related traits in the wheat germplasm 3228. Euphytica 177, 277–292. doi: 10.1007/s10681-010-0267-z
Wang, P., Tian, T., Ma, J., Liu, Y., Zhang, P., Chen, T., et al. (2022). Genome-wide association study of kernel traits using a 35K SNP array in bread wheat (Triticum aestivum L.). Front. Plant Sci. 13, 905660. doi: 10.3389/fpls.2022.905660
Wang, S., Yan, X., Wang, Y., Liu, H., Cui, D., Chen, F. (2016). Haplotypes of the TaGS5-A1 gene are associated with thousand-kernel weight in Chinese bread wheat. Front. Plant Sci. 7, 783. doi: 10.3389/fpls.2016.00783
Wang, J., Zhang, Z. (2021). GAPIT version 3: boosting power and accuracy for genomic association and prediction. Genomics Proteomics Bioinf. 19, 629–640. doi: 10.1016/j.gpb.2021.08.005
Wolde, G. M., Trautewig, C., Mascher, M., Schnurbusch, T. (2019). Genetic insights into morphometric inflorescence traits of wheat. Theor. Appl. Genet. 132, 1661–1676. doi: 10.1007/s00122-019-03305-4
Wu, X., Cheng, R., Xue, S., Kong, Z., Wan, H., Li, G., et al. (2014). Precise mapping of a quantitative trait locus interval for spike length and grain weight in bread wheat (Triticum aestivum L.). Mol. Breed. 33, 129–138. doi: 10.1007/s11032-013-9939-4
Yang, L., Zhao, D., Meng, Z., Xu, K., Yan, J., Xia, X., et al. (2020). QTL mapping for grain yield-related traits in bread wheat via SNP-based selective genotyping. Theor. Appl. Genet. 133, 857–872. doi: 10.1007/s00122-019-03511-0
Yao, F. Q., Li, X. H., Wang, H., Song, Y. N., Li, Z. Q., Li, X. G., et al. (2021). Down-expression of TaPIN1s increases the tiller number and grain yield in wheat. BMC Plant Biol. 21, 443. doi: 10.1186/s12870-021-03217-w
Yu, K., Liu, D., Chen, Y., Wang, D., Yang, W., Yang, W., et al. (2019). Unraveling the genetic architecture of grain size in einkorn wheat through linkage and homology mapping and transcriptomic profiling. J. Exp. Bot. 70, 4671–4688. doi: 10.1093/jxb/erz247
Yu, M., Mao, S. L., Chen, G. Y., Pu, Z. E., Wei, Y. M., Zheng, Y. L. (2014). QTLs for uppermost internode and spike length in two wheat RIL populations and their affect upon plant height at an individual QTL level. Euphytica 200, 95–108. doi: 10.1007/s10681-014-1156-7
Zhang, X., Deng, Z., Wang, Y., Li, J., Tian, J. (2014a). Unconditional and conditional QTL analysis of kernel weight related traits in wheat (Triticum aestivum L.) in multiple genetic backgrounds. Genetica 142, 371–379. doi: 10.1007/s10709-014-9781-6
Zhang, Y., Liu, J., Xia, X., He, Z. (2014b). TaGS-D1, an ortholog of rice OsGS3, is associated with grain weight and grain length in common wheat. Mol. Breed. 34, 1097–1107. doi: 10.1007/s11032-014-0102-7
Zhang, L., Zhao, Y. L., Gao, L. F., Zhao, G. Y., Zhou, R. H., Zhang, B. S., et al. (2012). TaCKX6-D1, the ortholog of rice OsCKX2, is associated with grain weight in hexaploid wheat. New Phytol. 195, 574–584. doi: 10.1111/j.1469-8137.2012.04194.x
Zhao, J., Wang, S., Qin, J., Sun, C., Liu, F. (2020). The lipid transfer protein OsLTPL159 is involved in cold tolerance at the early seedling stage in rice. Plant Biotechnol. J. 18, 756–769. doi: 10.1111/pbi.13243
Keywords: common wheat, yield, GWAS, drought, KASP markers
Citation: Zhao J, Sun L, Gao H, Hu M, Mu L, Cheng X, Wang J, Zhao Y, Li Q, Wang P, Li H and Zhang Y (2023) Genome-wide association study of yield-related traits in common wheat (Triticum aestivum L.) under normal and drought treatment conditions. Front. Plant Sci. 13:1098560. doi: 10.3389/fpls.2022.1098560
Received: 15 November 2022; Accepted: 13 December 2022;
Published: 04 January 2023.
Edited by:
Yong Zhou, Yangzhou University, ChinaReviewed by:
Jindong Liu, Chinese Academy of Agricultural Sciences, ChinaCopyright © 2023 Zhao, Sun, Gao, Hu, Mu, Cheng, Wang, Zhao, Li, Wang, Li and Zhang. This is an open-access article distributed under the terms of the Creative Commons Attribution License (CC BY). The use, distribution or reproduction in other forums is permitted, provided the original author(s) and the copyright owner(s) are credited and that the original publication in this journal is cited, in accordance with accepted academic practice. No use, distribution or reproduction is permitted which does not comply with these terms.
*Correspondence: Hui Li, endzbGlodWlAMTYzLmNvbQ==; Yingjun Zhang, emhhbmd5aW5nanVuMTk3N0AxNjMuY29t
†These authors have contributed equally to this work
Disclaimer: All claims expressed in this article are solely those of the authors and do not necessarily represent those of their affiliated organizations, or those of the publisher, the editors and the reviewers. Any product that may be evaluated in this article or claim that may be made by its manufacturer is not guaranteed or endorsed by the publisher.
Research integrity at Frontiers
Learn more about the work of our research integrity team to safeguard the quality of each article we publish.