
94% of researchers rate our articles as excellent or good
Learn more about the work of our research integrity team to safeguard the quality of each article we publish.
Find out more
ORIGINAL RESEARCH article
Front. Plant Sci., 11 January 2023
Sec. Functional and Applied Plant Genomics
Volume 13 - 2022 | https://doi.org/10.3389/fpls.2022.1094112
This article is part of the Research TopicGenetic Characterization of Yield- and Quality-Related Traits in LegumesView all 14 articles
 Shilin Luo1,2,3†
 Jia Jia1,2,3†
 Riqian Liu1,2,3†
 Ruqian Wei1,2,3
 Zhibin Guo1,2,3
 Zhandong Cai1,2,3
 Bo Chen1,2,3
 Fuwei Liang1,2,3Qiuju Xia4
 Hai Nian1,2,3*
 Yanbo Cheng1,2,3*
Introduction: The seed weight of soybean [Glycine max (L.) Merr.] is one of the major traits that determine soybean yield and is closely related to seed size. However, the genetic basis of the synergistic regulation of traits related to soybean yield is unclear.
Methods: To understand the molecular genetic basis for the formation of soybean yield traits, the present study focused on QTLs mapping for seed size and weight traits in different environments and target genes mining.
Results: A total of 85 QTLs associated with seed size and weight traits were identified using a recombinant inbred line (RIL) population developed from Guizao1×B13 (GB13). We also detected 18 environmentally stable QTLs. Of these, qSL-3-1 was a novel QTL with a stable main effect associated with seed length. It was detected in all environments, three of which explained more than 10% of phenotypic variance (PV), with a maximum of 15.91%. In addition, qSW-20-3 was a novel QTL with a stable main effect associated with seed width, which was identified in four environments. And the amount of phenotypic variance explained (PVE) varied from 9.22 to 21.93%. Five QTL clusters associated with both seed size and seed weight were summarized by QTL cluster identification. Fifteen candidate genes that may be involved in regulating soybean seed size and weight were also screened based on gene function annotation and GO enrichment analysis.
Discussion: The results provide a biologically basic reference for understanding the formation of soybean seed size and weight traits.
Soybean is one of the globally esteemed food crops with numerous nutritionalsubstances including protein, carbohydrates, lipids, minerals, vitamins, and bioactive substances such as isoflavones, saponins, sterols and phospholipids. With its vital values in agriculture and economy, soybean plays an important role in agricultural and industrial activities such as processing food and feed and producing textiles. While the demand for soybean has been increasing globally, soybean yield enhancement is now receiving significant attention for its potential for evolving productivity.
Seed size and seed weight are quantitative traits controlled by multiple genes and constrained by environmental factors. The forming of both traits is a complex biological process (Li et al., 2020). Seed size usually measure s seed length, seed width, and seed thickness (Salas et al., 2006). Many studies have been done worldwide on QTL localization of seed size and weight in soybean. In contrast, studies on QTL localization for seed size were relatively less than that for seed weight. For example, on the soybean data website SoyBase (http://www.soybase.org/) as of March 2022, the number of QTL publications are 18 on seed length, 16 on seed width, and 23 on seed thickness versus the number of QTL publications on seed weight are 300.
Salas et al. (2006) detected a total of 19 QTLs associated with seed shape using three RIL populations in two environments. Xu et al. (2011) used MAJ Multi-QTL Joint Analysis (MAJ) and composite interval mapping (CIM) for QTLs mapping. A total of 121 main QTLs were detected in the F2:3, F2:4 and F2:5 populations from the direct and reciprocal crosses of Lishuizhongzihuang with Nannong493-1. Sun et al. (2021) used a RIL population to detect QTLs for seed size traits in four environments. Ten QTLs controlling related traits were identified, of which five QTLs distributed on chromosomes 02, 04, 06, 13 and 16 were detected in at least two environments with PVE ranging from 3.6 to 9.4%. The results of similar studies (Salas et al., 2006; Xu et al., 2011; Hu et al., 2013; Niu et al., 2013; Yang et al., 2017; Teng et al., 2018; Gao et al., 2019; Cui et al., 2020; Sun et al., 2021; Kumawat and Xu, 2021) vary form different localization methods and different genetic backgrounds
The first study on QTL localization of seed weight in bean was reported by Sax (1923), in which he used seed colors as the markers. With the advancement of molecular marker technology, scholars had developed various molecular markers such as restriction fragment length polymorphism (RFLP), simple sequence repeat (SSR) and single nucleotide polymorphism (SNP) with different mapping populations to identify QTLs of soybean seed weight. In 1996, Maughan et al. (1996) detected 6 QTLs associated with seed weight in 150 F2 populations and their 150 F2:3 lines using 91 polymorphic genetic markers including RFP, RAPD and SSR. Zhang et al. (2016) performed a genome-wide association study (GWAS) using 309 soybean germplasm resources with 31045 SNP markers and associated QTLs related to seed weight to chromosome 04 and 19. More results from previous studies (Mian et al., 1996; Csanadi et al., 2001; Lee et al., 2001; Chapman et al., 2003; Fasoula et al., 2004; Hyten et al., 2004; D. Li et al., 2008; Han et al., 2012; Pathan et al., 2013; Kato et al., 2014; Yan et al., 2014; Kulkarni et al., 2017; Liu D. et al., 2018) are not identical, but these QTLs have laid a foundation for molecular marker-assisted breeding.
In summary, most researchers use different numbers of mapping populations to detect QTL in various environments. However, studies using more mapping populations had fewer experimental settings, in contrast to studies using fewer mapping populations tended to have more experimental environments. In this study, one mapping population is used to detect QTL in six environments suggesting a higher standard for the identification of stable QTL. In addition, the QTLs localization of soybean seed size and weight traits by RIL population in different environments and the mining of main effect genes can help us to understand the biological basis of soybean yield trait forming process, which has great theoretical and practical significance in guiding the molecular design breeding and in consistently enhancing soybean yield.
GB13 RIL population, comprising 248 lines, constructed with Guizao1 as the female parent and B13 as the male parent was planted on three replications in July 2018, July 2019 and July 2020 at the Teaching and Research Base of Zengcheng (23°14´N, 113°38´E), and in July 2019 and July 2020 at the Experimental Teaching Base of Guangzhou (23°10´N, 113°22´E) (designated as 18ZC, 19ZC, 20ZC, 19GZ and 20GZ, respectively). In addition, one F1 and 248 F8:11 RILs of the GB13 RIL population were developed using the single seed descent method (Jiang et al., 2019). The experimental materials were planted in a completely randomized zonal design with one row per strain, a row length of 2.0 m, a row spacing of 0.5 m, and a plant spacing of 0.1 m. Field management was carried out according to conventional standards, and no pest or disease outbreaks occurred during growth.
Seed length (SL), seed width (SW) and seed thickness (ST) of soybean seeds were measured using an electronic vernier caliper (Figure 1). Twenty seeds from each strain were randomly selected for seed size measurement, after which they were weighed on an electronic balance. After three repetitions, five times the average of the weights were used as phenotypic data for the seed weight trait (100-seed weight, HSW).
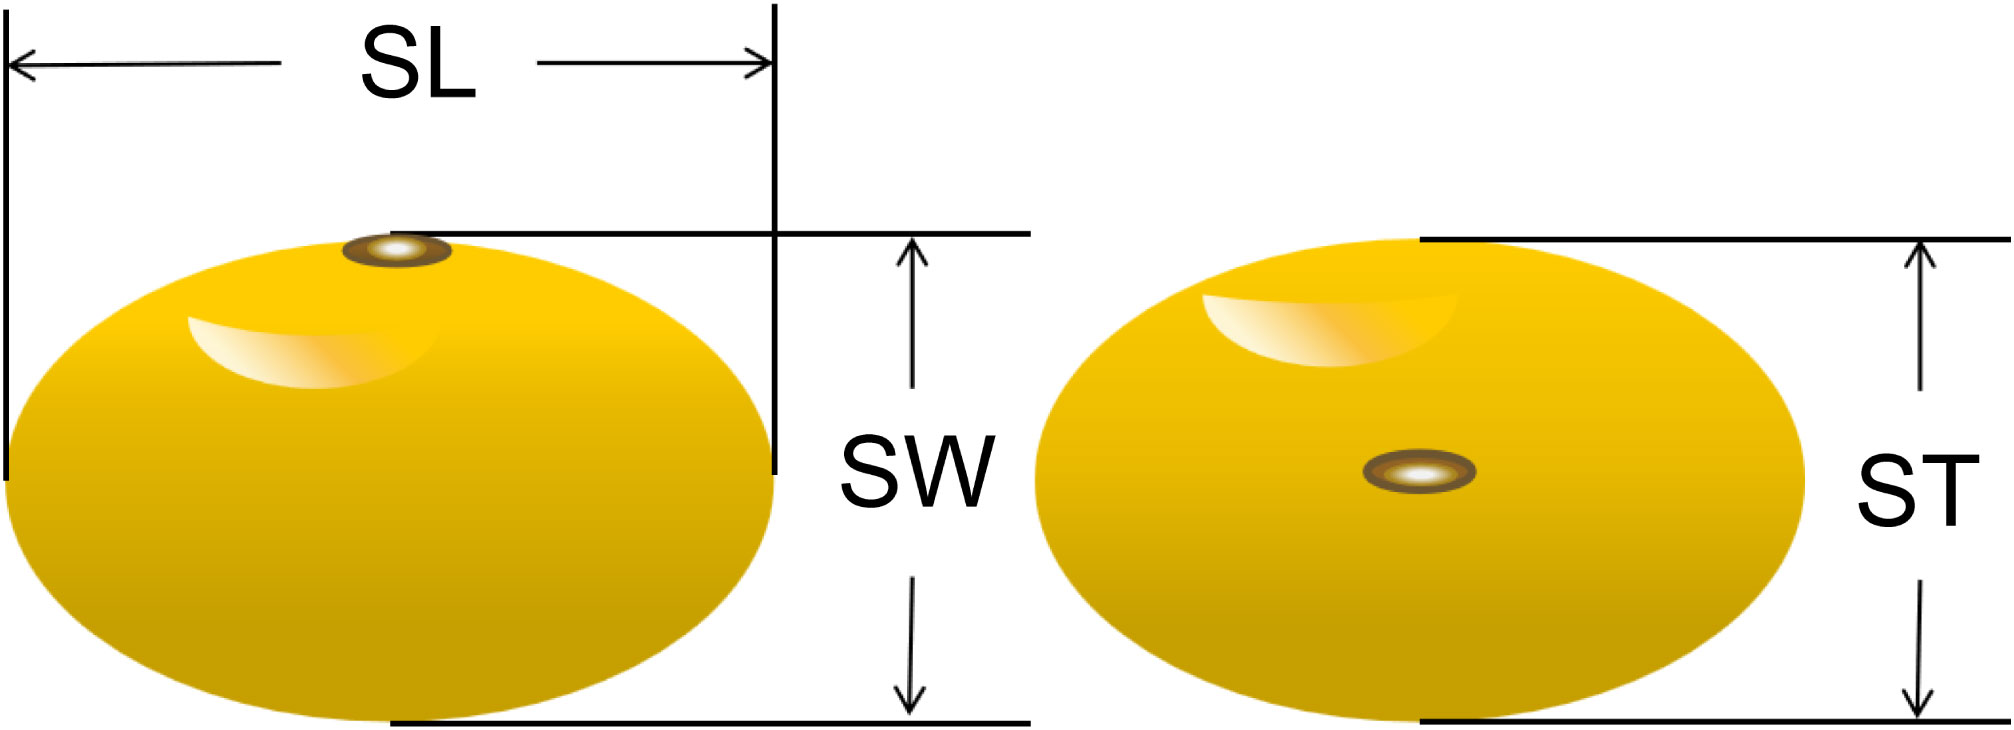
Figure 1 Measuring seed length (SL), seed width (SW) and seed thickness (ST).
The mean of the phenotypic data from the GB13 RIL population in five natural environments was calculated as the phenotypic data of the sixth environment (combined environment, designated as CE). Descriptive statistics, linear regression analysis and calculation of the skewness and the kurtosis were performed on phenotypic data from six environments using GraphPad Prism software (GraphPad Software Inc. v.7.0.4, United States), and the corresponding tables or figures were generated. Analysis of variance (ANOVA) and estimation of broad-sense heritability (h2) were performed on phenotypic data from the five natural environments using Genstat 12th Edition software. The formulae (Nyquist and Baker, 1991; Elattar et al., 2021) were as follows:
where σ2g denotes genotype variance, σ2ge denotes genotype × environment interaction variance, and σ2e denotes variance error. “n” denotes the number of environments, and “r” denotes the number of replicates per environment.
The composite interval mapping method (Zeng, 1994) was used to map QTLs with a high-density bin linkage map previously constructed in the laboratory, as described, the map contained 56,561 SNPs and 3715 bin markers covering a total genome length of 3049.2 cM, with the length of the linkage cluster ranging from 120.22-211.37 cM, The average distance between markers was 0.80 cM, and the number of bin markers on each cluster varied from 147 to 259. (Jiang et al., 2019). The additive effect (ADD) and PVE of each QTL were analyzed by the WinQTLCart 2.5 software. The threshold of LOD for different traits was set to 2.5 at the 5% significance level, and LOD thresholds greater than 2.5 were considered as the basis for determining the presence of QTLs. QTLs located on the same chromosome with adjacent marker intervals were combined into one QTL if their confidence intervals overlapped. QTLs were named according to “q + trait + chromosome + sequence number”, with the symbol “-” in between (Mccouch et al., 1997).
Generally, QTLs detected in at least two environments were considered stable QTLs (Qi et al., 2017), but there were six experimental environments in this study, so QTLs detected in at least three environments were considered as stable QTLs in this study to identify the stable QTLs.
All QTLs were sorted by chromosome as the primary condition and physical position as the secondary condition. QTLs with identical chromosomes in overlapping or adjacent physical position (less than 5cM) were grouped into a cluster and identified as QTL cluster if it was associated with at least two traits (Liu et al., 2017; Wang et al., 2022). To mine the main effect and stable candidate genes, the identified QTL clusters contain at least one stable QTL in this study.
First, GO (Gene Ontology) term enrichment analysis was performed for the genes within the interval of the identified QTL clusters. This is useful for selecting candidate genes based on the sequence variation of genes between the parents. The GO annotation numbers were downloaded from the soybean data website SoyBase (https://www.soybase.org/), and then the WEGO2.0 online gene enrichment analysis mapping web page (http://wego.genomics.org.cn/) was used to create the gene enrichment cellular composition, molecular function and biological processes visualization diagrams. Next, genes that were highly or specifically expressed in soybean seeds were to be further screened. Gene expression data were obtained from the soybean data website SoyBase. Finally, the selected genes were functionally annotated by the Phytozome database (https://phytozome-next.jgi.doe.gov/), and then the candidate genes were identified based on the relevant literature and related gene functions. Meanwhile, the heat map of candidate genes expression was employed to analyze tissue-specific expression (Jia et al., 2022) by the online site (https://www.omicshare.com/tools/Home/Soft/heatmap), and the structures of candidate genes were mapped using the online site of the Gene Structure Display Server (http://gsds.gao-lab.org/index.php). The resequencing data of the parental lines were referred to compare the variation of candidate genes between parental lines. The whole genome of parental lines were sequenced using the Illumina HiSeq X Ten p, with an average sequencing depth of 8× (Xian et al., 2022). High-quality sequencing data were assessed to predict the gene structural variations.
The regression linear analysis of seed size with seed weight shows that the SL, SW and ST were all highly significantly and positively correlated with HSW (p<0.01), with R-Squared (R2) of regression linear analysis ranging from 0.440 to 0.804 (Figure 2). In 18ZC, 19ZC, 19GZ, 20ZC and CE, the R2 between SW and HSW were the highest at 0.804, 0.721, 0.753, 0.552 and 0.742, respectively, while in 20GZ, the R2 between ST and HSW was the highest at 0.754. Thus, seed size is indeed closely related to seed weight. 18ZC, 19ZC and CE had the next largest R2 between SL and HSW at 0.685, 0.680 and 0.614, respectively and the smallest R2 between ST and HSW at 0.679, 0.626 and 0.588, respectively. 19GZ and 20ZC had the next largest R2 between ST and HSW at 0.713 and 0.467, and the smallest R2 between SL and HSW at 0.664 and 0.440. 20GZ had the next largest R2 between SL and HSW at 0.721, and the smallest R2 between SW and HSW at 0.717. Also, the above results suggest that the correlation between seed size and seed weight seems to be applied in field selection breeding as a reference for selecting high-yielding varieties.
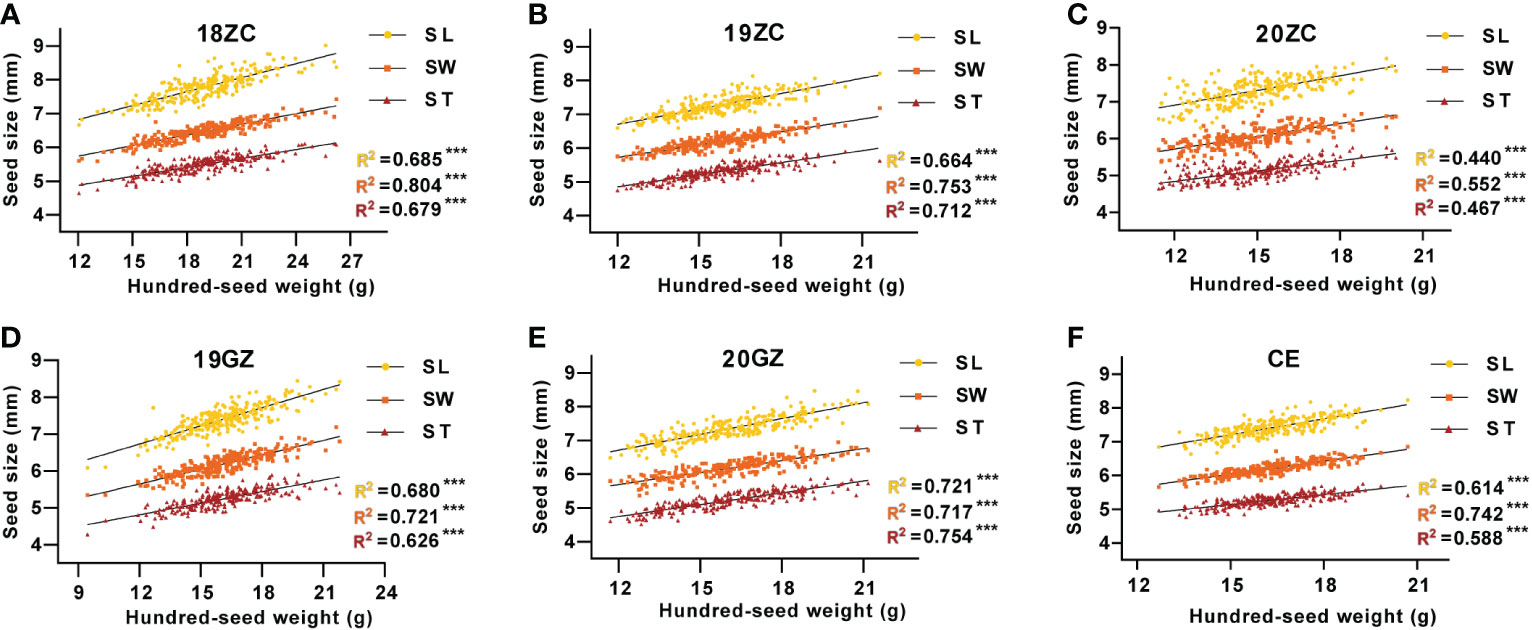
Figure 2 The correlation between seed size and seed weight of GB13 RIL population across the Teaching and Research Base of Zengcheng (ZC) in (A) 2018, (B) 2019 and (C) 2020, the Experimental Teaching Base of Guangzhou (GZ) in (D) 2019 and (E) 2020 and (F) their combined environment (CE). ***p < 0.001 (F-test). R2 indicates the correlation coefficient.
The phenotypic data were analyzed by descriptive statistics, and the results showed that the SL, SW, ST (Supplementary Figure 1) and HSW of the female parent Guizao1 were higher than those of the male parent B13 with significant differences (Table 1), which laid the foundation for QTL mapping. The GB13 RIL population differed remarkably insize and weight traits, both of which showed transgressive segregation. The coefficient of variation (CV) for SL ranged from 4.33 to 5.25%, for SW from 3.96 to 4.78%, for ST from 4.71 to 5.18%, and for HSW from 10.68 to 12.98%. The CV for HSW was greater than that for SL, SW and ST, but they were relatively stable, which indicated that both parents contained genes that were acting in the phenotypic variation.
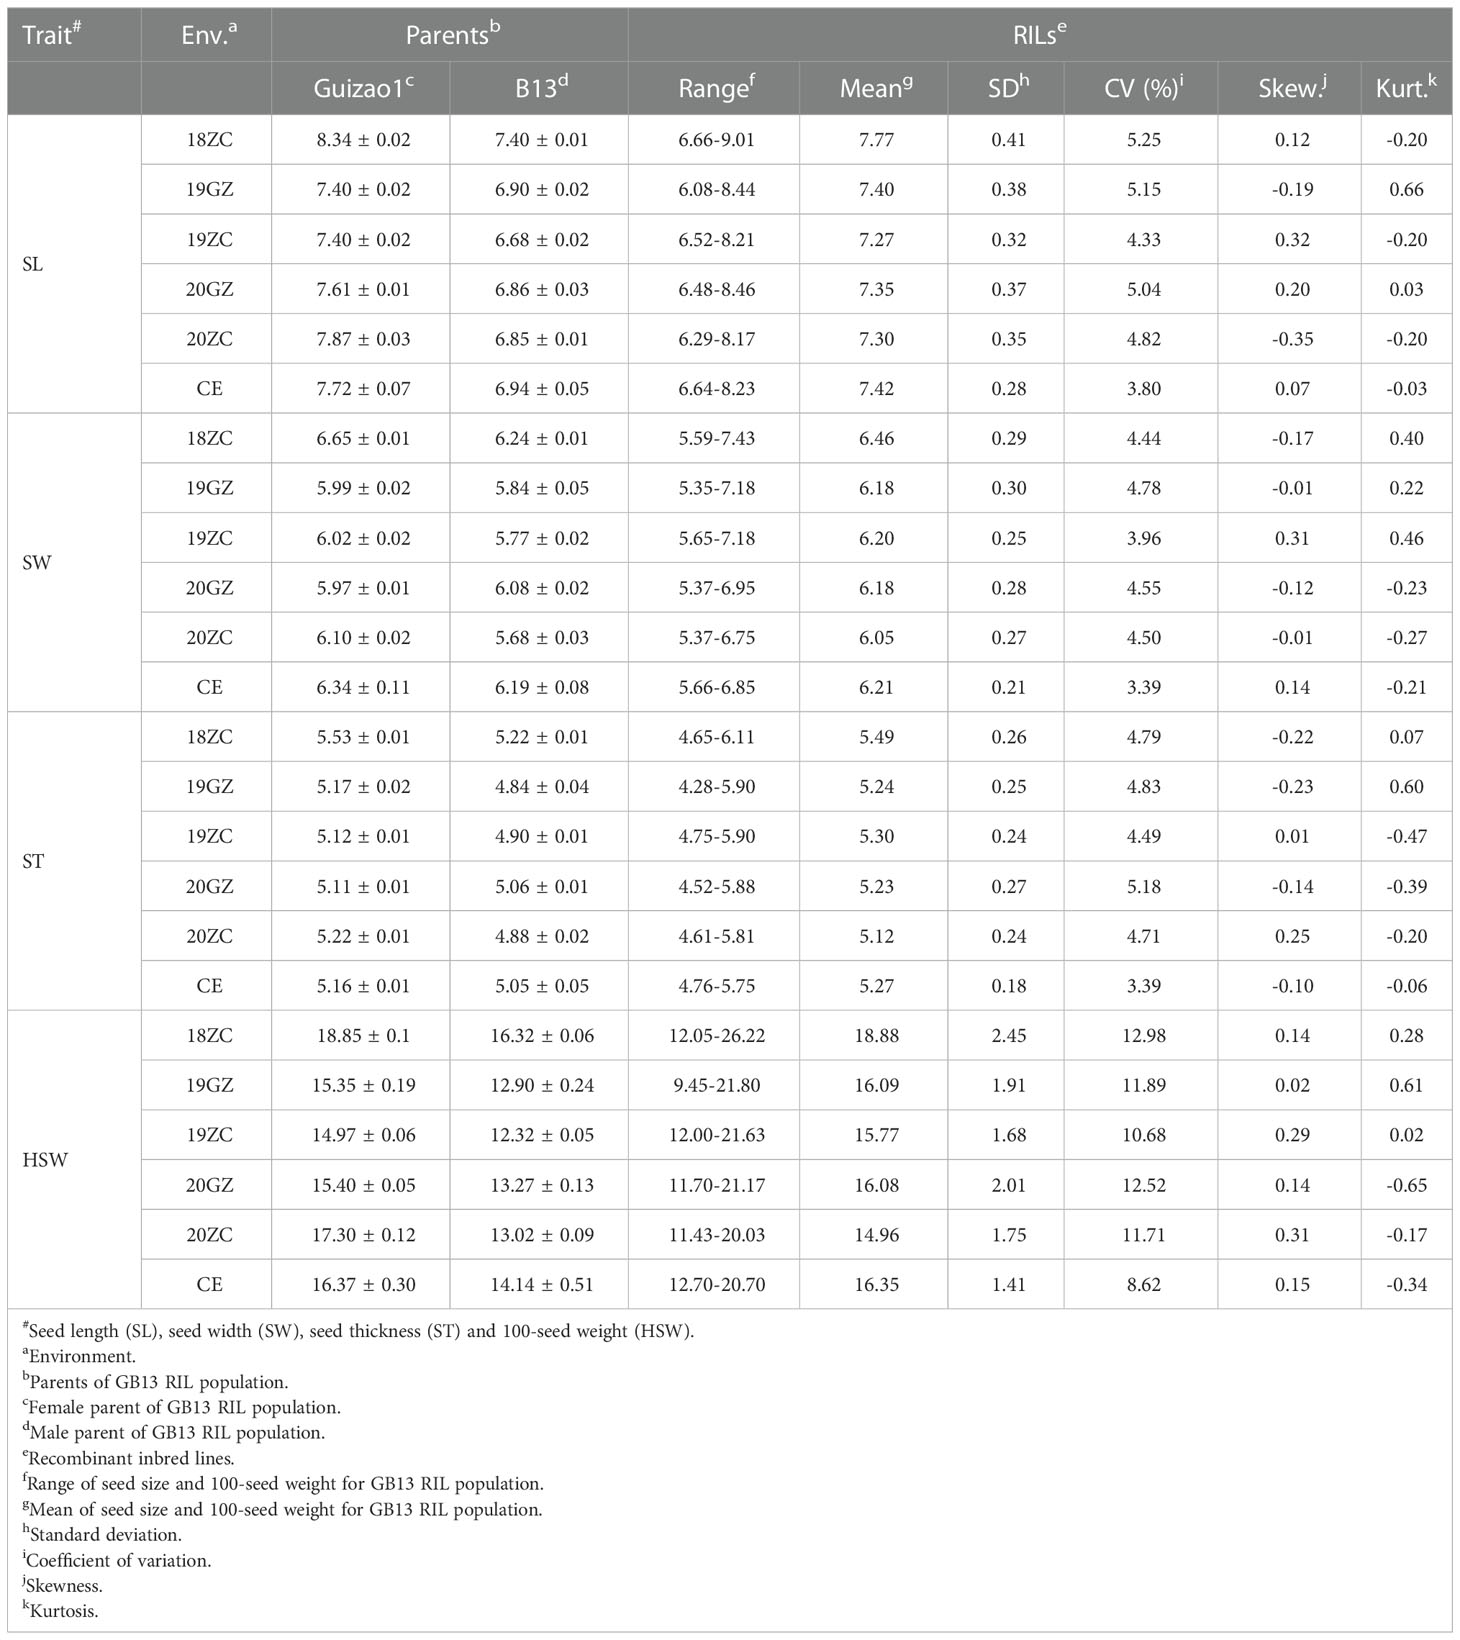
Table 1 Statistical analysis ofseed size and weight traits for the parents and the lines at different environments.
The absolute values of the skewness and the kurtosis of SL, SW, ST and HSW of the GB13 RIL population were less than 1 (Table 1). In addition, the frequency distribution graph (Figure 3) showed that the phenotypic data of seed size and weight traits displayed continuous variation. The above results indicated that seed size and weight traits of the GB13 RIL population obeyed normal distribution, which was consistent with the characteristics of the RIL population and belonged to quantitative genetic traits.
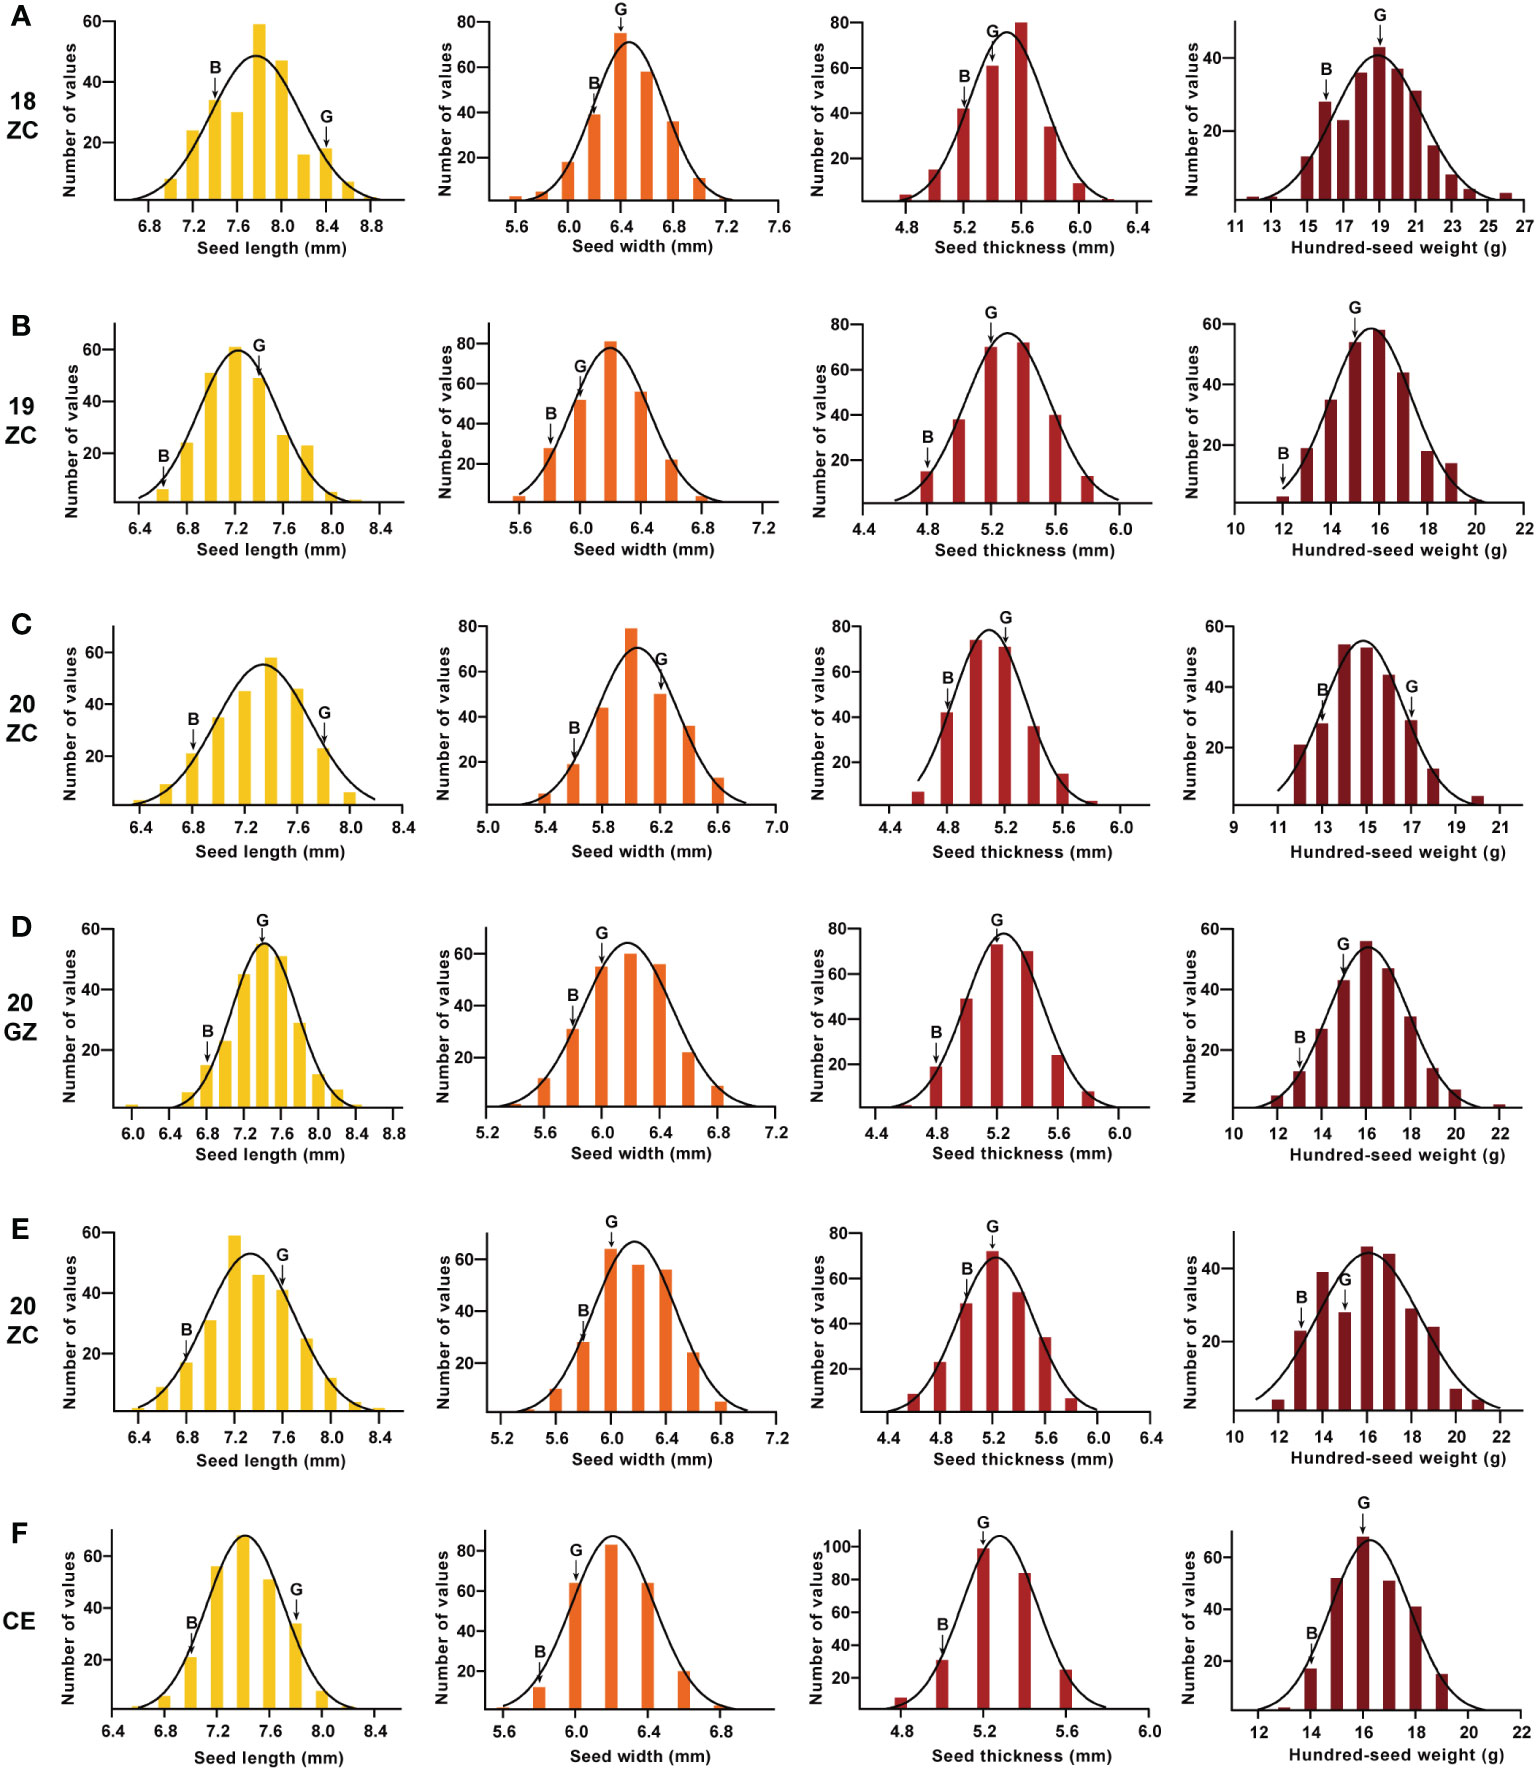
Figure 3 Frequency distribution and its fitted curve ofseed size and weight traits for GB13 RIL population across the Teaching and Research Base of Zengcheng (ZC) in (A) 2018, (B) 2019 and (C) 2020, the Experimental Teaching Base of Guangzhou (GZ) in (D) 2019 and (E) 2020 and (F) their combined environment (CE). The letter “G” indicates the female parent Guizao1, and the letter “B” indicates the male parent B13. The horizontal coordinates of the different colored figures from left to right were seed length, seed width, seed thickness and 100-seed weight.
The results of ANOVA for SL, SW, ST and HSW of the GB13 RIL population in five natural environments (Table 2) show that the genotype, environment and interaction between genotype and environment had significant effects on seed size and weight traits of the GB13 RIL population (p<0.0001). The h2 for seed size and weight traits of the GB13 RIL population were relatively high ranging from 0.74 to 0.83 (Table 2). The traits are suitable for further QTL localization analysis.
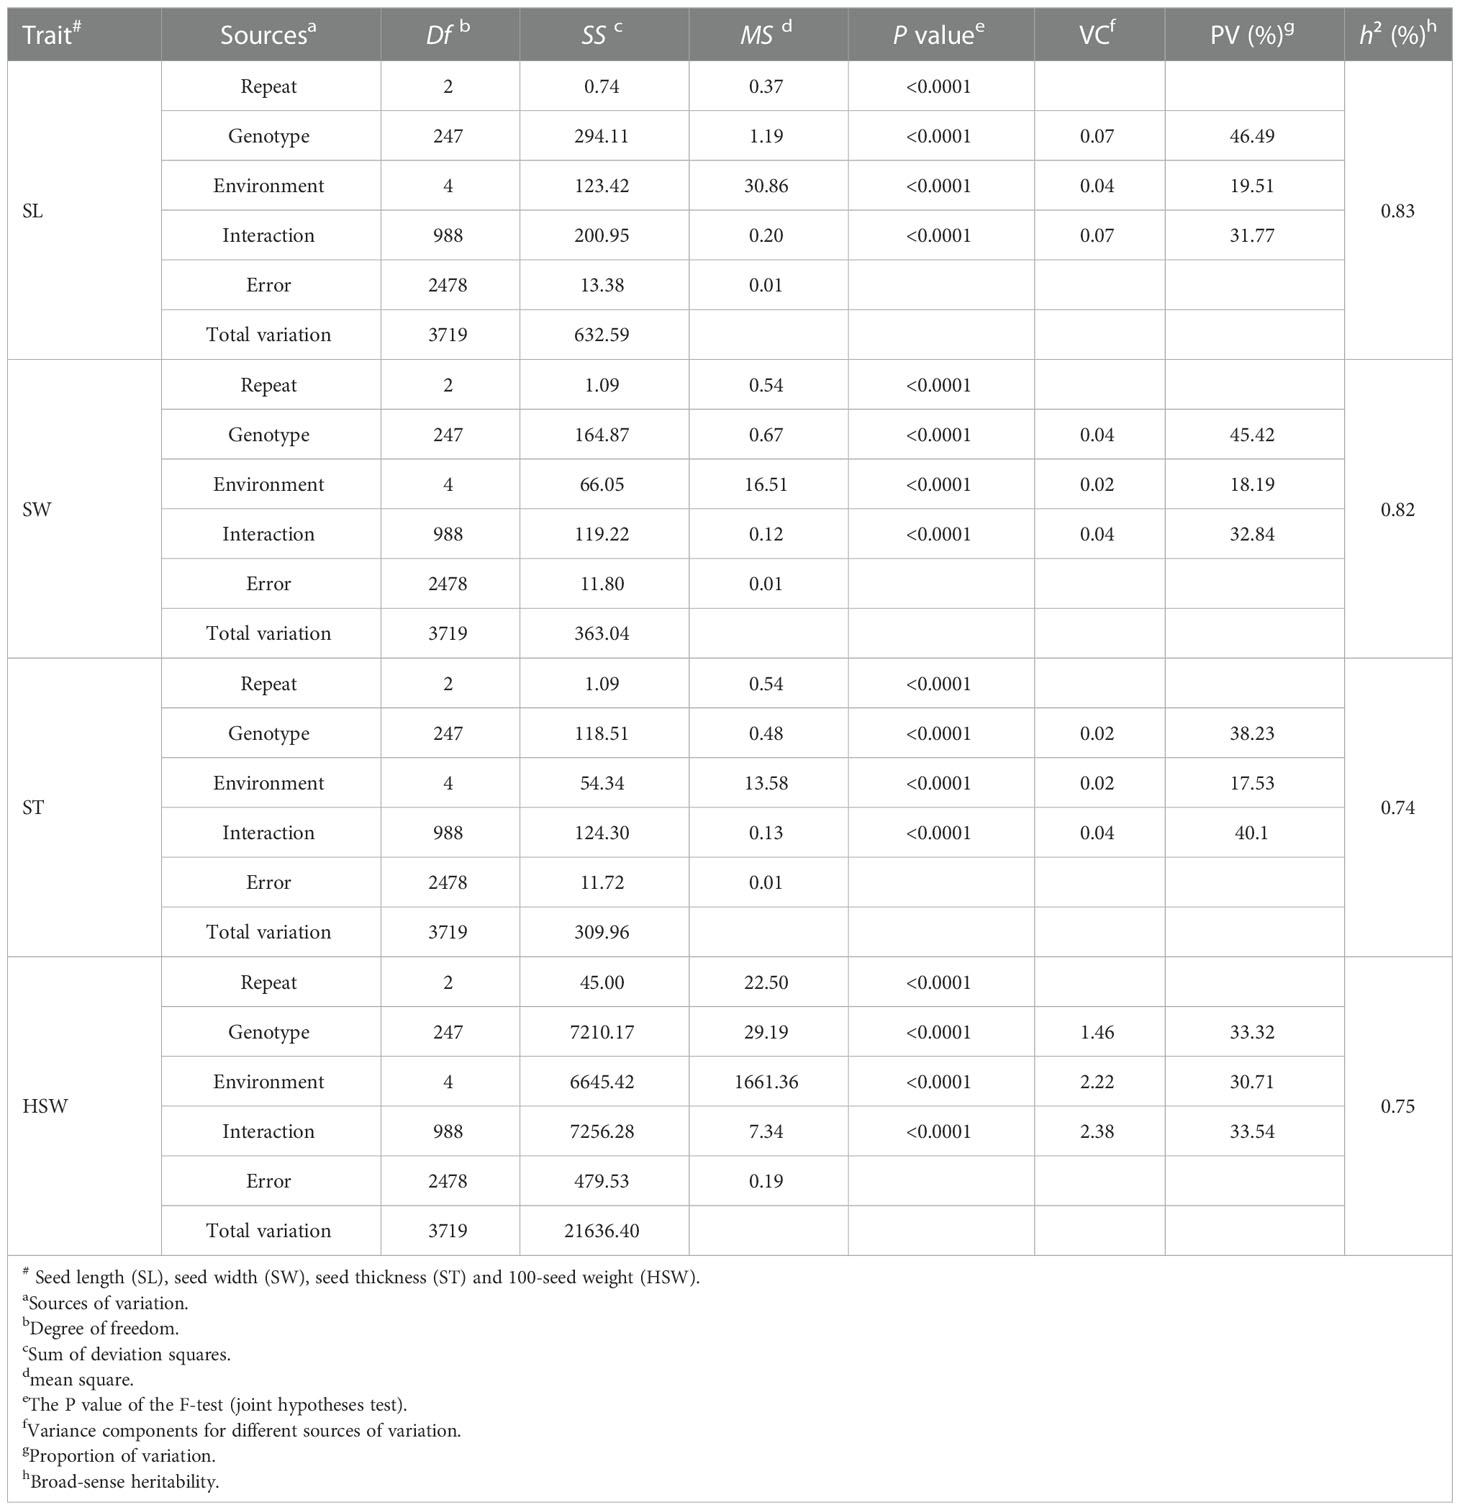
Table 2 Analysis of variance and broad-sense heritability for GB13 RIL population at five natural environments.
In terms of the proportion of total variation accounted for variation of different sources (Table 2), the largest source of variation in SL and SW was genotype, while the largest source of variation in ST and HSW was genotype × environment interactions. The most influenced by the environment was HSW, accounted for 30.71% of the total variation. It was followed by SL, SW and ST, which accounting for 19.51%, 18.19% and 17.53% of the total variation, respectively. The above results indicated that the seed weight trait was more influenced by the environment compared to the seed size trait.
A total of 85 QTL were detected for seed size and weight in six environments with PVE in the range of 3.14% - 21.93%, of which 19 QTLs were identified for SL, 23 for SW, 18 for ST, and 25 for HSW (Supplementary Tables 1–4). By collation and analysis, a total of 18 stable QTLs were identified (Table 3), including 3 for SL, 6 for SW, 4 for ST, and 5 for HSW (Figure 4). One QTL, qSL-3-1, associated with SL was detected in all environments, and it explained more than 10% of PV in three environments in the range of 11.93% - 15.91%. Three QTLs (qHSW-11-3, qHSW-20-3 and qSW-20-3) were detected in four environments. Among them, qSW-20-3 explained 9.22%, 10.79%, 20.89% and 21.93% of PV in four environments, respectively. Another 14 QTLs distributed on chromosomes 03, 04, 05, 07, 11, 12, 13, 18 and 20 were detected in three environments. In summary, integrating the PVE for QTL, the number of detections in various environments, and the relevant references, qSL-3-1 and qSW-20-3 can be considered as novel stable QTL with the main effects. Meanwhile, these stable QTLs above were important references for the excavation of genes controlling seed size and weight traits.
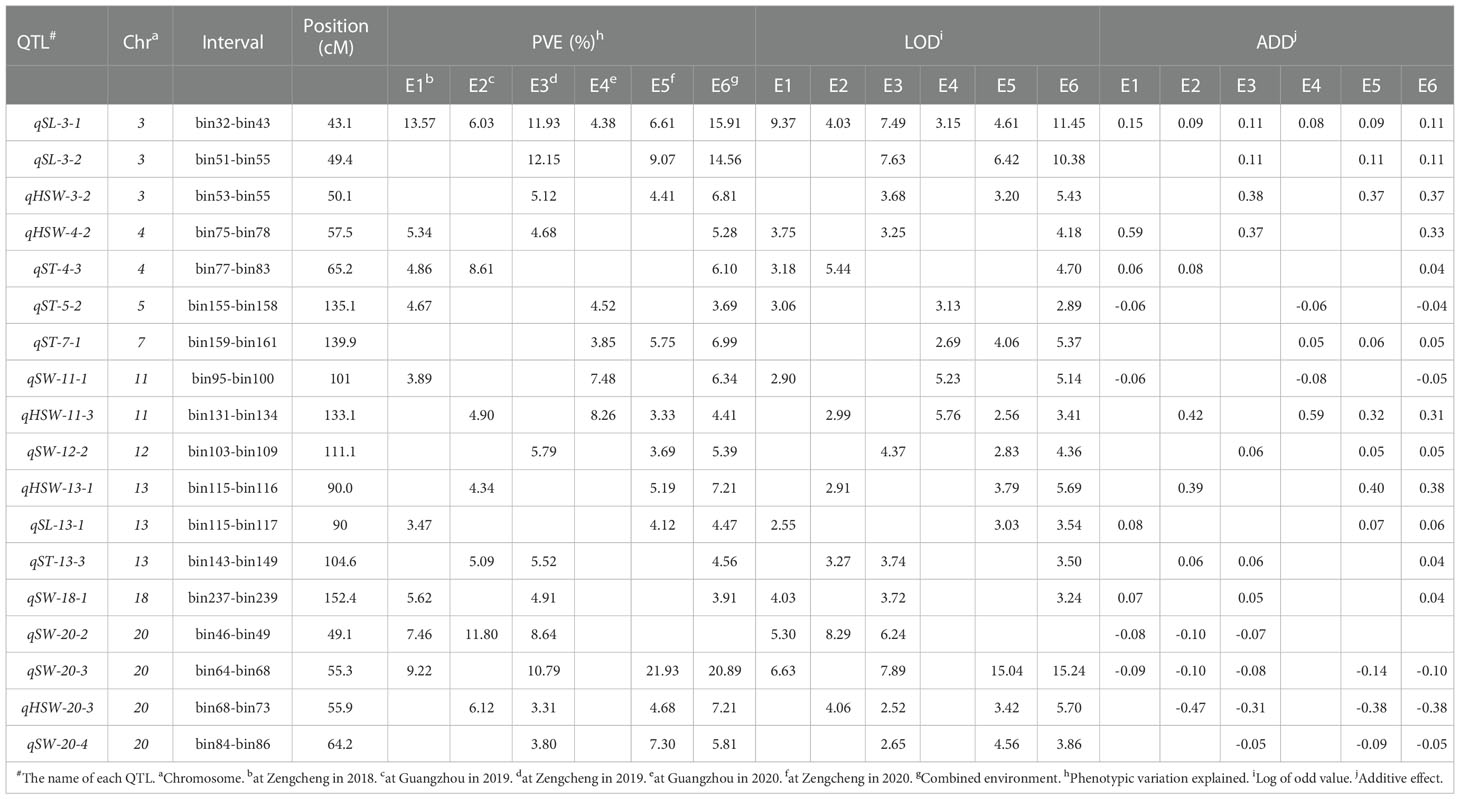
Table 3 Stable QTLs associated withseed size and weight traits for GB13 RIL population across different environments.
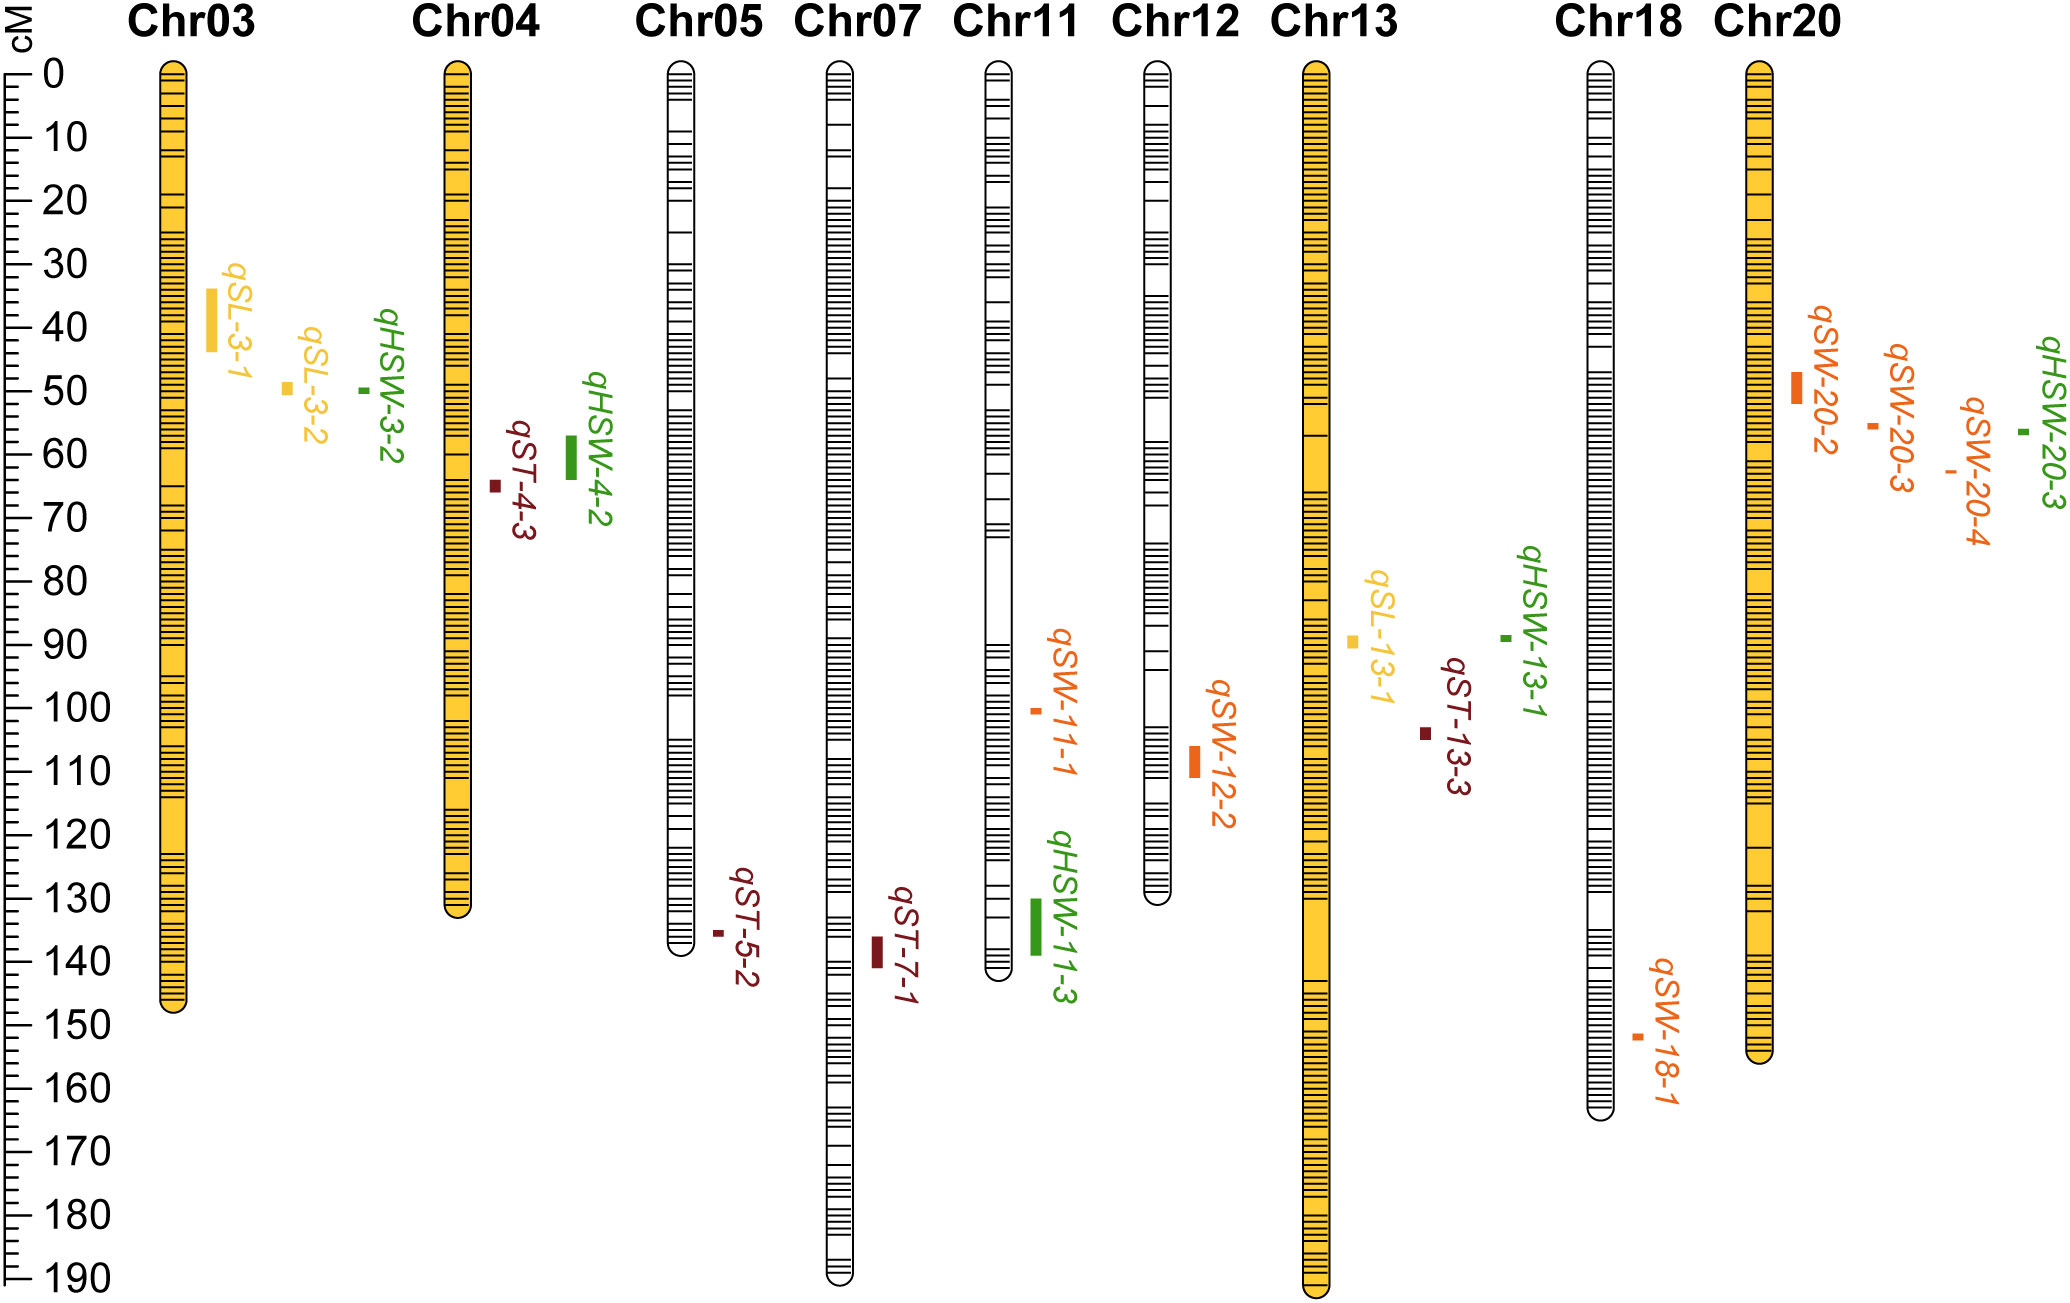
Figure 4 The linkage map of stable QTLs for soybean seed size and weight traits. The ruler on the left side indicates the interval distance between markers using cM (centimorgan) as the unit. Bars with yellow emphasis indicate the chromosome on which the QTL clusters are located. Between the bars in the graph, the yellow indicates QTL for SL; the orange indicates QTL for SW; the reddish brown indicates QTL for ST; the green indicates QTL for HSW.
According to the classification criteria of QTL clusters, we obtained five QTL clusters (Table 4) from the QTL mapping results (Supplementary Tables 1–4). These five QTL clusters were distributed on chromosomes 03, 04, 13 and 20. All of them were associated with HSW, which verified that the seed size was closely related to HSW from another aspect. The four QTL clusters related to SL were qLH3-1, qLH3-2, qLWTH4 and qLH13; the two QTL clusters related to SW were qLWTP4 and qWTH20; the two QTL clusters related to ST were qLWTP4 and qWTP20. In terms of the number of traits controlled, one QTL cluster for four traits was qLWTP4, one QTL cluster for three traits was qWTH20, and three QTL clusters for two traits were qLH3-1, qLH3-2, and qLH13. Among them, qLP3-1 and qLP3-2 containing major and stable QTL(s) were located on the forearm of chromosome 03 at the physical positions between 4387438 and 6456915 bp and between 8784766 and 17199876 bp, respectively. Similarly, qWTH20 also contained major and stable QTLs and was located at the physical position of chromosome 20 between 12056958 and 33222868 bp.
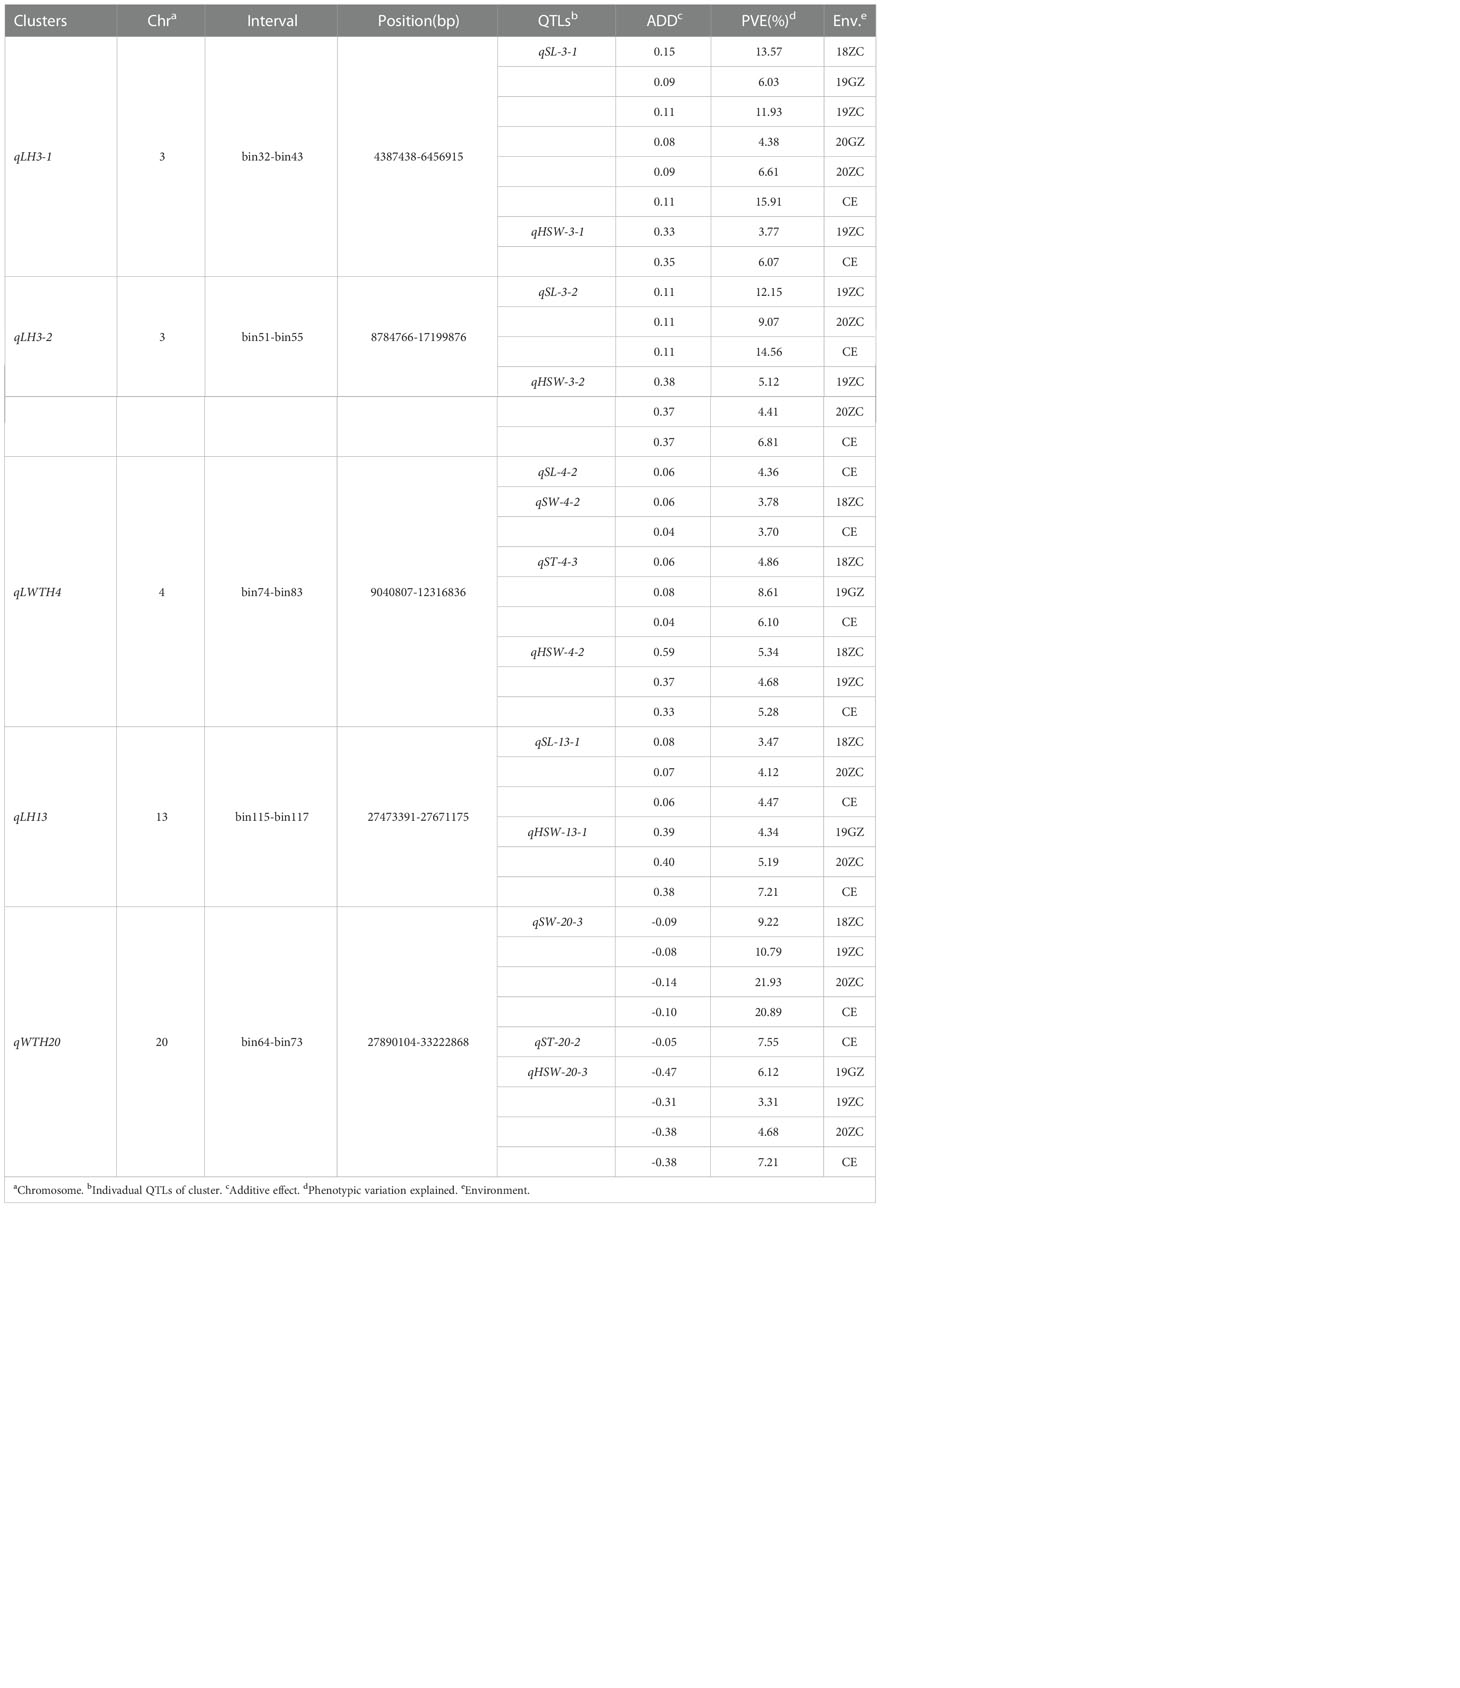
Table 4 QTL clusters associated with at least two traits.
In summary, qLP3-1, qLP3-2 and qWTH20 may be QTL clusters containing major effect genes that regulate soybean seed size and weight traits; qLWTP4 and qLP13 may be QTL clusters containing micro-effector genes that harmonize the control of soybean seed size and weight traits. Therefore, these five QTL clusters can provide a reference for mining the target genes controlling seed size and weight traits, and were used as the target intervals for gene GO enrichment analysis.
By Gene GO enrichment analysis, we found that most of the genes within these five QTL cluster intervals were involved in cellular processes and metabolic processes (Figure 5). Most of the genes in the qLP3-1 were involved in intracellular metabolic processes, bioregulation and reaction to stimuli, and were mostly involved in binding and catalytic activities in terms of molecular functions. While most of the genes in the qLP3-2 were similar in function to those in the qLP3-1. In comparison, most of the genes in the qLWTP4 were also involved in intracellular metabolic processes, but a small number of genes were involved in regulating growth and cell proliferation. The qLP13 contained only 11 annotated genes, most of which were involved in growth and cellular processes. Similarly, most of the genes in the qWTP20-2 were involved in intracellular metabolic processes.
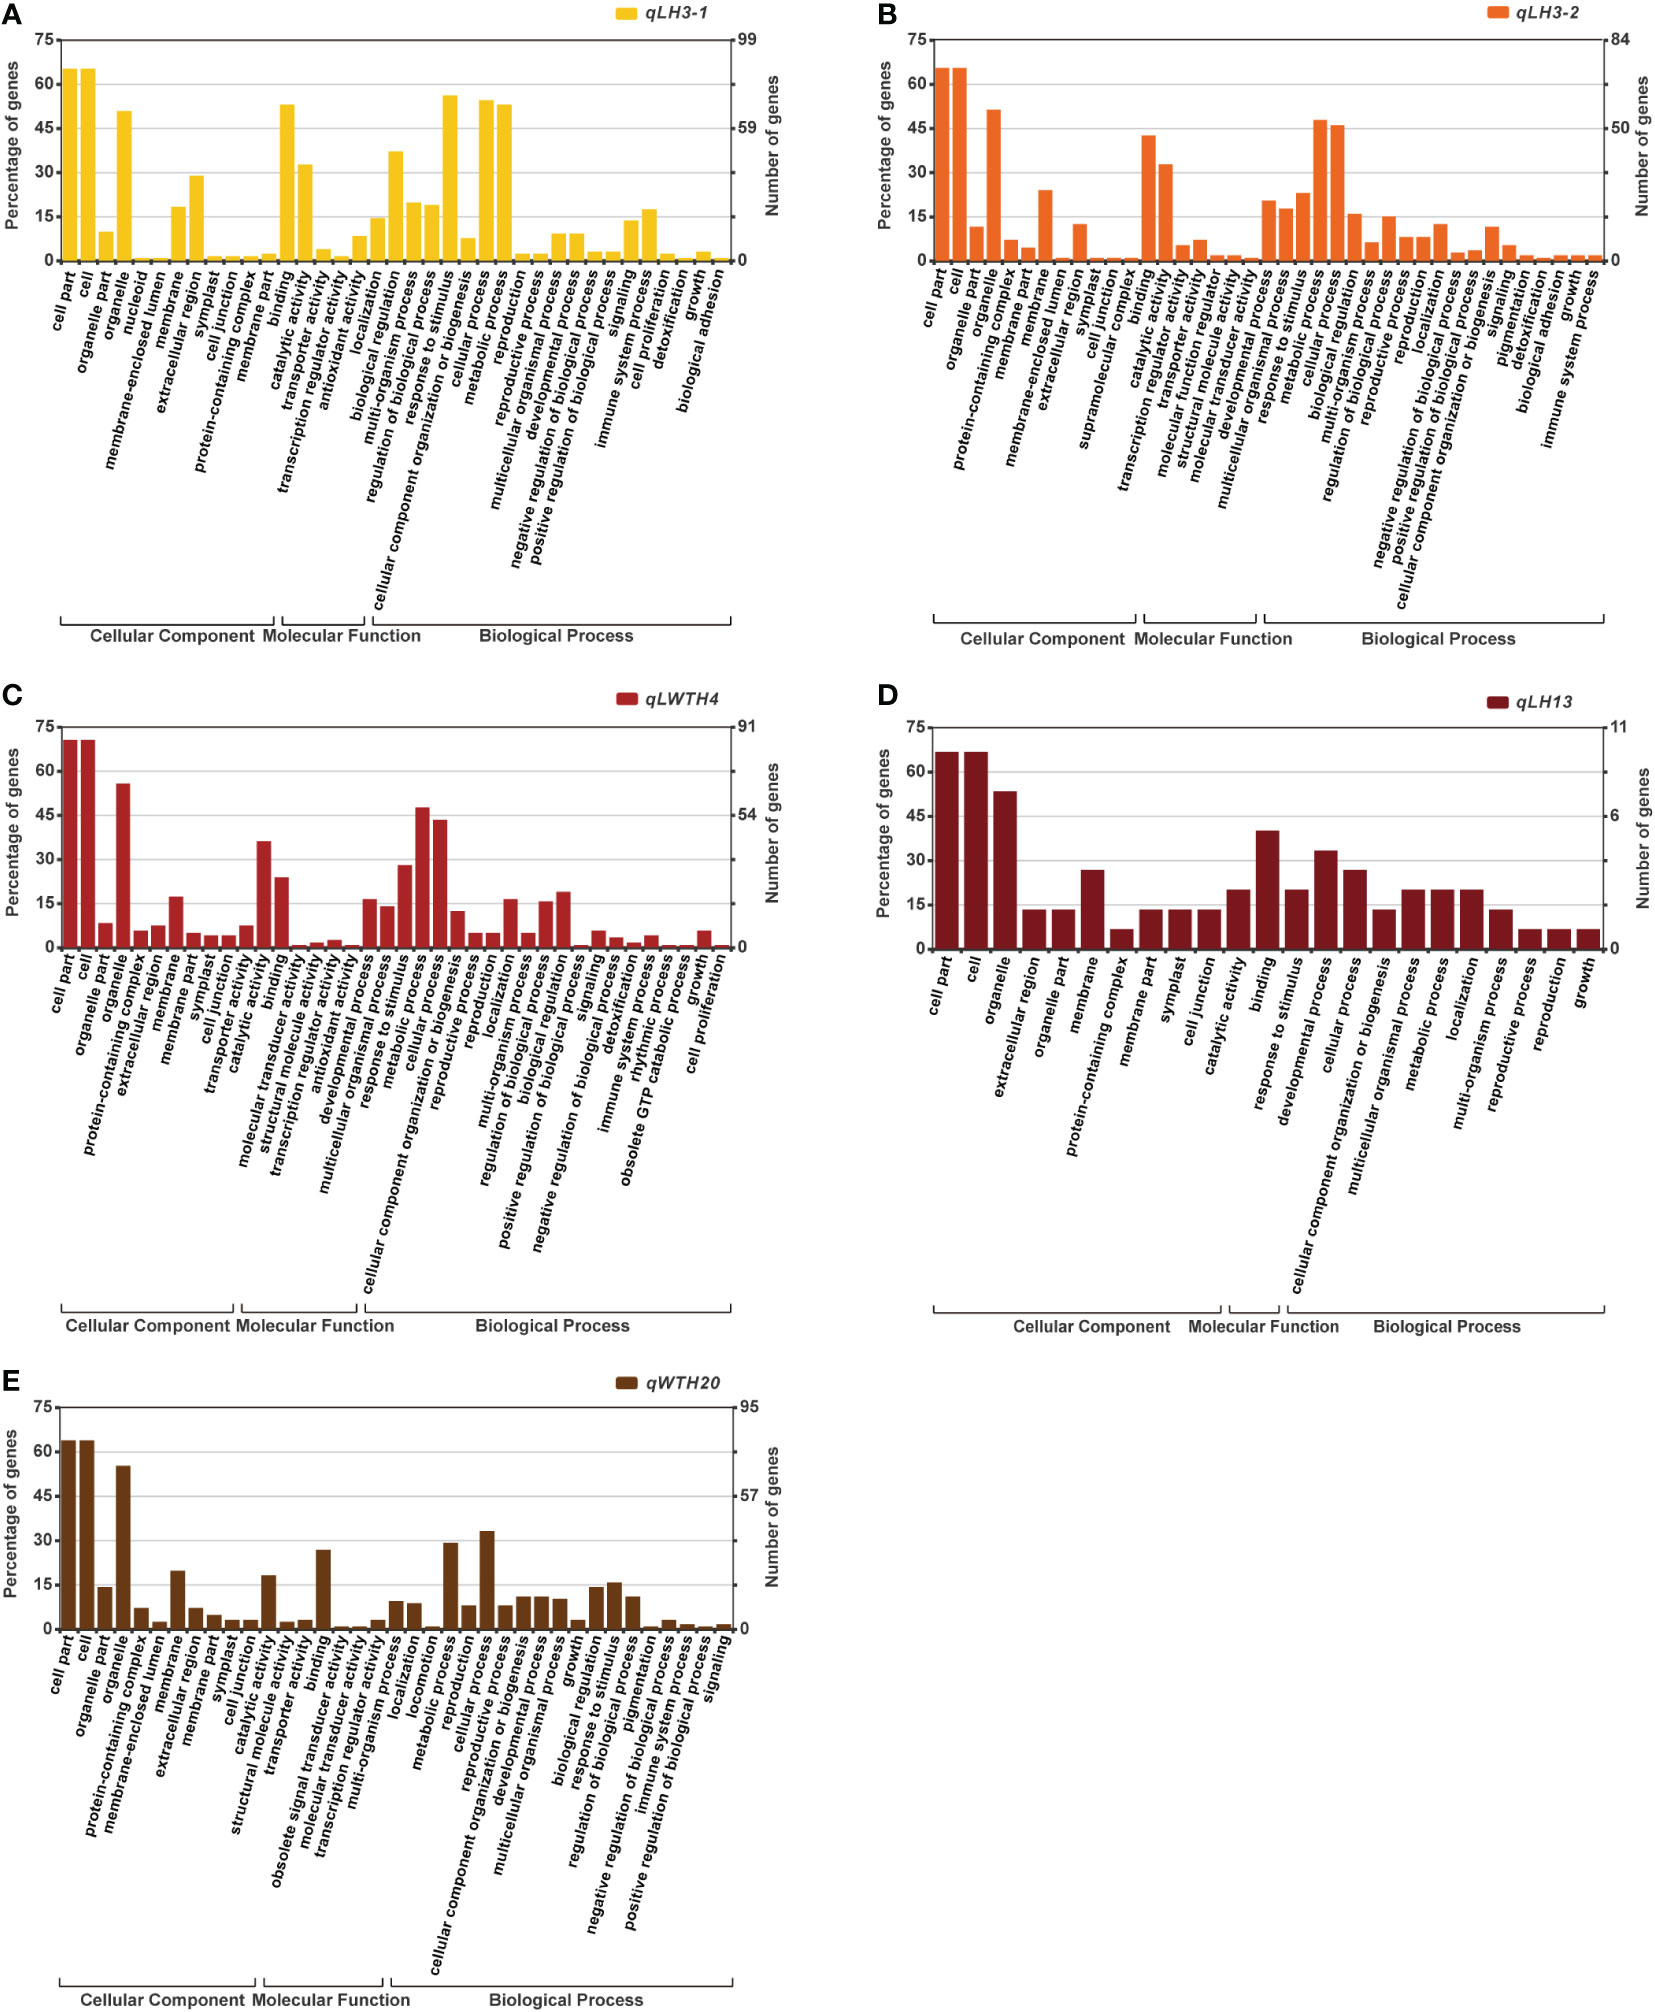
Figure 5 GO term enrichment analysis of the genes located within the five QTL clusters: (A) qLH3-1; (B) qLH3-2; (C) qLWTH4; (D) qLH13; (E) qWTH20.
Through the above gene GO enrichment analysis, followed by gene expression screening, gene function annotation, and sequence variation analysis, we obtained a total of 15 candidate genes (Table 5) that might be participating in the regulation of seed size and weight traits. Among them, six genes were located on chromosome 03, three on chromosome 04, two on chromosome 13, and four on chromosome 20. Among the 15 genes screened, Glyma.03g040400 was the gene with the same function as the gene (LOC_Os07g19000) associated with seed size in rice; Glyma.03g045400 and Glyma.20g084000 were related to DNA methylation; Glyma.04g100400, Glyma.20g081600 and Glyma.20g087000 were hormone-related and might be involved in the regulation of seed size and weight traits by hormone signaling pathway; Glyma.04g100100, Glyma.04g107100, Glyma.13g159500 and Glyma.20g084500 might negatively regulate seed size and weight through the ubiquitin-proteasome pathway. Glyma.03g036600 and Glyma.03g065700 were associated with transcription factor regulation and might be involved in the regulation of seed size and weight traits through the transcription factor regulation pathway; Glyma.03g044200, Glyma.03g065900 and Glyma.13g160400 might be related to the metabolic synthesis of protein and oil, and indirectly regulated the seed size and weight traits.
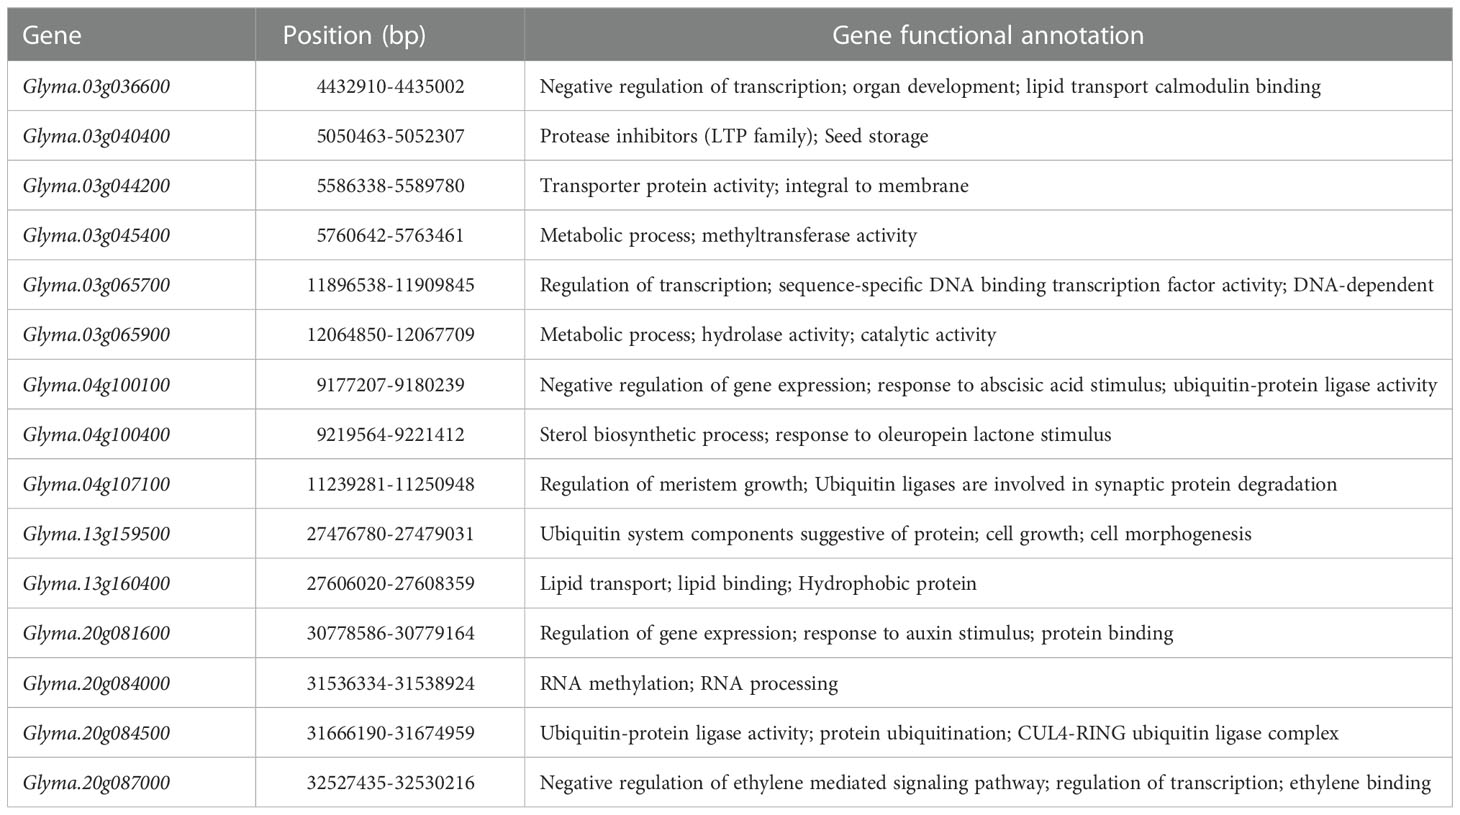
Table 5 Candidate genes identified within the five QTL clusters that were highly expressed or specific expression in soybean seed.
The expression heat map (Figure 6A) of these 15 candidate genes showed that two genes each were highly expressed in young leaf and nodule of soybean; three genes were specifically expressed at the pod shell development stage in soybean; eight genes including Glyma.03g036600, Glyma.03g040400, Glyma.03g045400, Glyma.03g065700, Glyma.03g065900, Glyma.04g100400, Glyma.04g107100 and Glyma.20g087000 were specifically and progressively expressed at the seed maturity stage in soybean. Meanwhile, the structural maps for most of the candidate genes (Figure 6B) were matched with their sequence in the parental lines, but ten candidate genes varied in the sequence of the parental lines, with the variant region on introns, 3’UTR (untranslated region) and 5’UTR (Table 6). They are Glyma.03g036600, Glyma.03g040400, Glyma.03g044200, Glyma.03g045400, Glyma.03g065700, Glyma.04g100100, Glyma.04g107100, Glyma.13g160400, Glyma.20g084000 and Glyma.20g084500, and deserve to be investigated in depth.
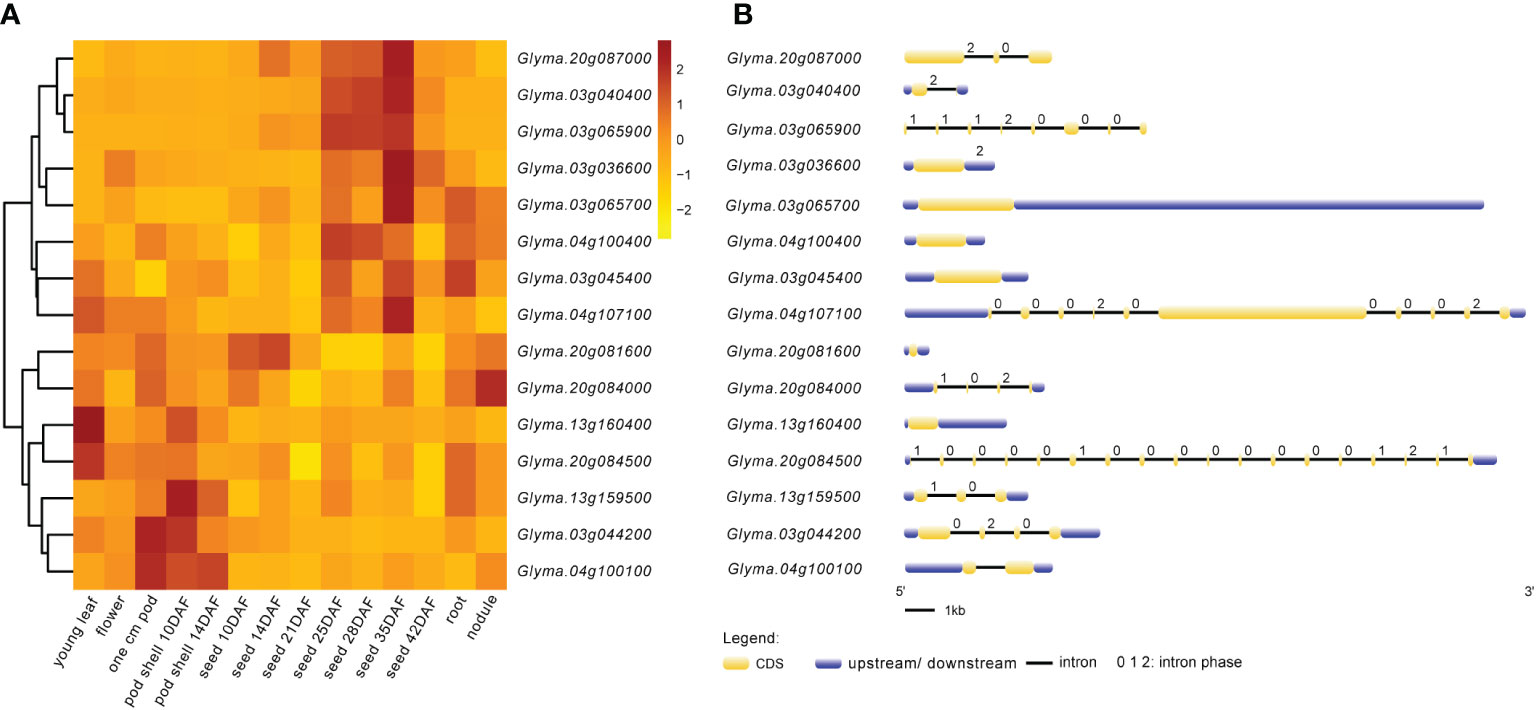
Figure 6 Expression patterns and structures of candidate genes. (A) Visual heat map of candidate genes expressed in different tissues and periods of soybean. The expression data of 15 candidate genes in this study were downloaded from SoyBase (https://www.soybase.org/soyseq/). Normalization of expression data by different genes. (B) Gene structure diagram of candidate genes. The yellow indicates CDS (coding DNA sequence); the blue indicates upstream or downstream of CDS containing 5’UTR and 3’UTR. Arabic numbers indicate the number of intron phases.
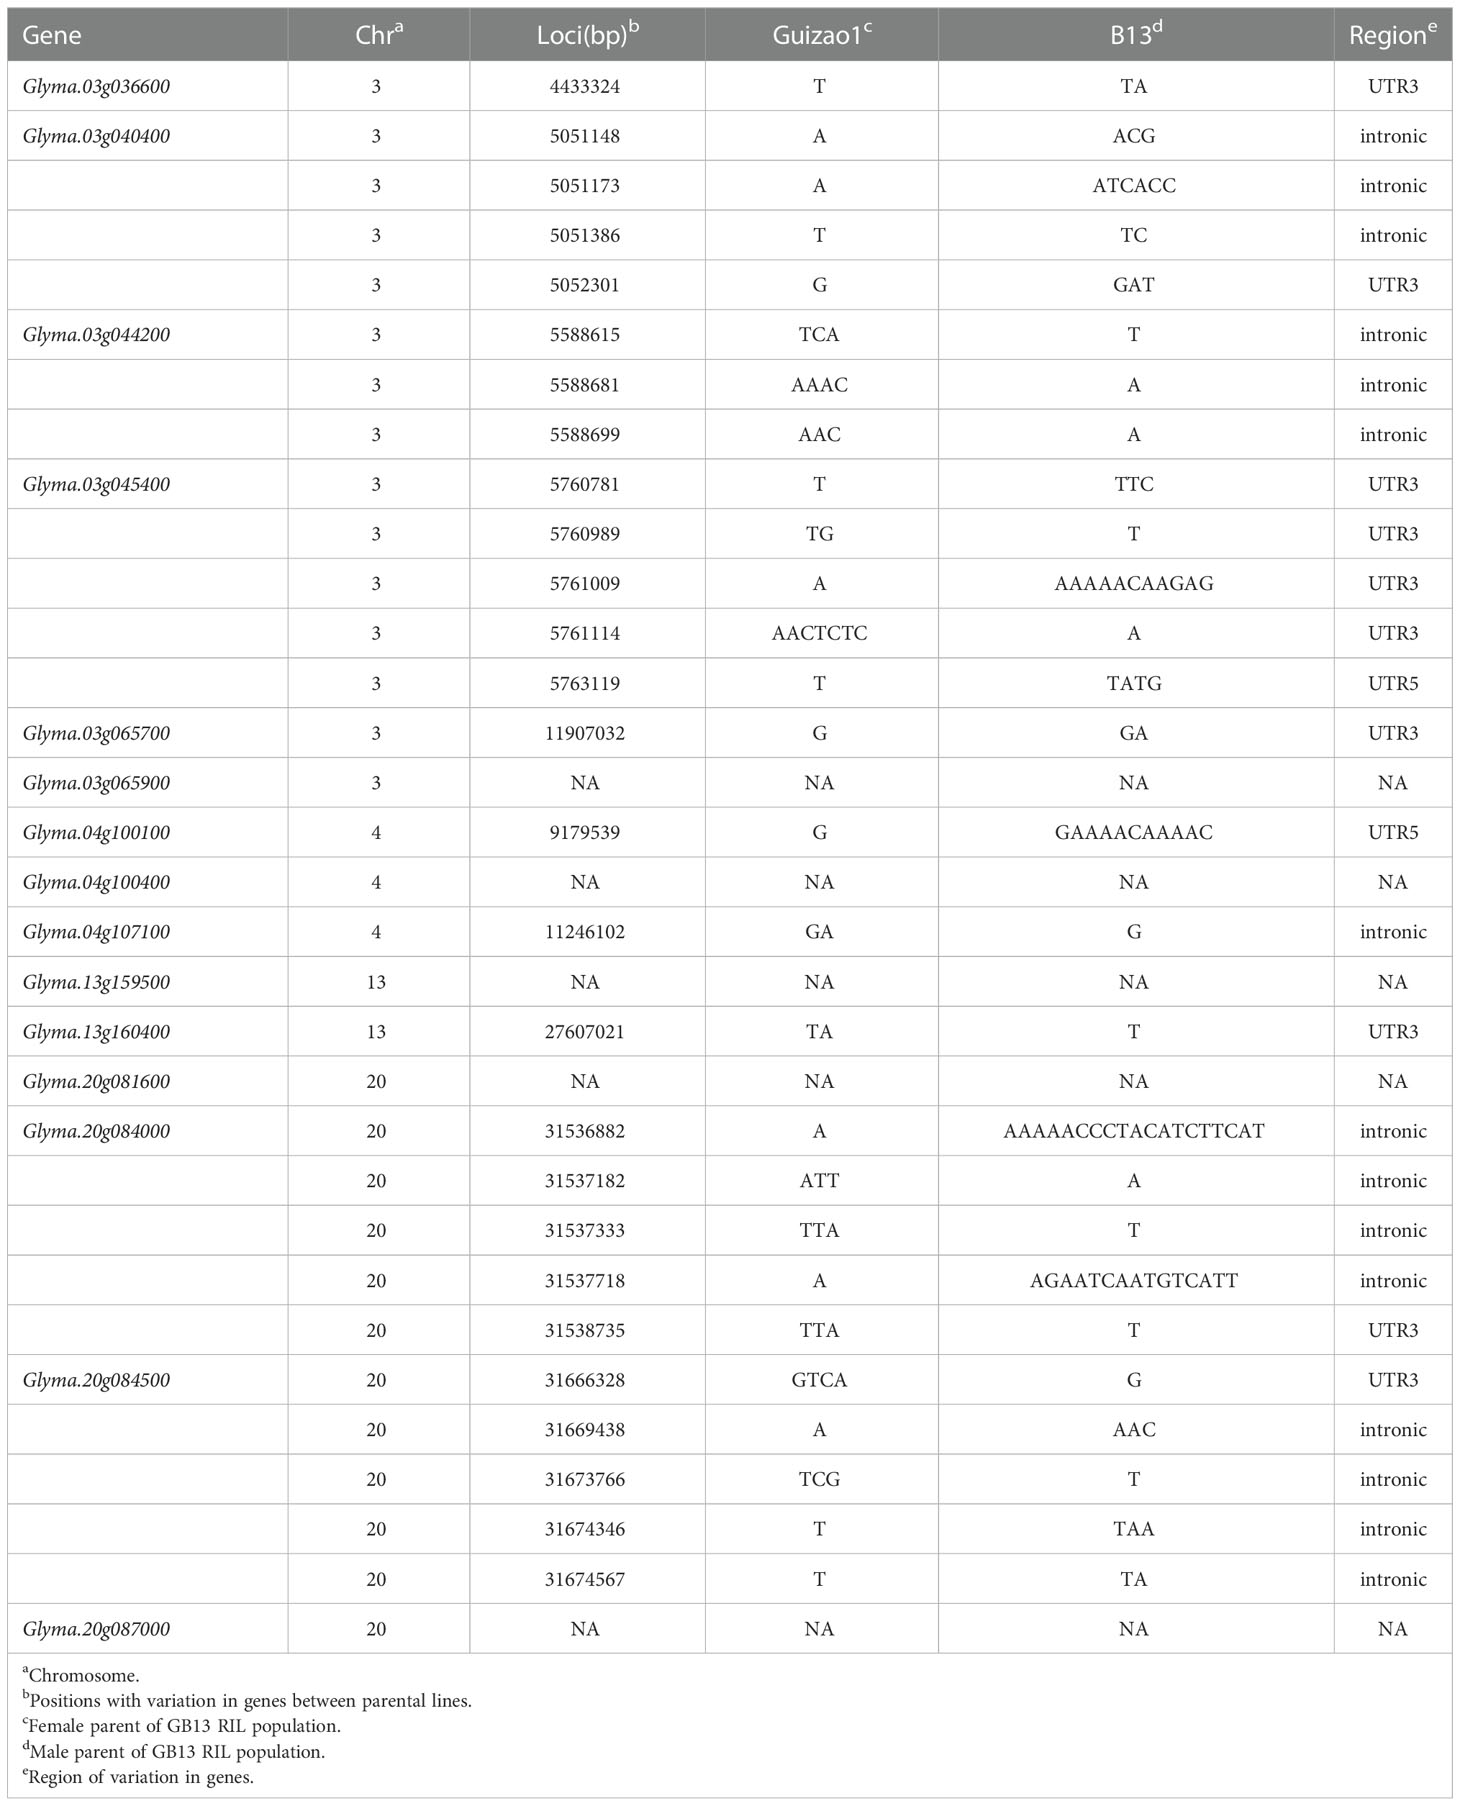
Table 6 Sequence variations between the parental lines of candidate genes.
Based on the results of the correlation analysis between seed size and seed weight in this study, the R2 between seed width and seed weight was the largest in most environments, so we suggest that varieties with wide seeds can be selected for varietal improvement for soybean seed weight trait. However, from the results of the QTLs localized for soybean seed size and weight traits, most of the QTLs for HSW overlapped or were close to the QTL interval for SL. It suggests that most of the genes with multi-effects may be genes that coordinate the control on both SL and HSW. Nevertheless, the specific regulatory mechanism is still unclear (He et al., 2021) and needs to be further investigated.
In this study, a total of 60 QTLs related to seed size trait and 25 QTLs related to seed weight trait were identified in the GB13 RIL population in five natural environments and their combined environment. Nineteen QTLs for SL included 4 stable QTLs and 15 sensitive QTLs (Supplementary Table 1); 23 QTLs for seed width included 6 stable QTLs and 17 sensitive QTLs (Supplementary Table 2); 18 QTLs for ST included 5 stable QTLs and 13 sensitive QTLs (Supplementary Table 3). The 25 QTLs associated with HSW included 5 stable QTLs and 20 sensitive QTLs (Supplementary Table 4). By comparing the results with those of previous studies, ten sensitive QTLs for SL (qSL-2-1, qSL-3-3, qSL-4-1, qSL-4-2, qSL-4-3, qSL-6-2, qSL-11-1, qSL-11-2, qSL-18-2 and qSL-20-1) overlapped with the intervals of previous localization results or were within their subsets (Salas et al., 2006; Xu et al., 2011; Niu et al., 2013; Yang et al., 2017; Cui et al., 2020; Hina et al., 2020; Kumawat and Xu, 2021). Eight sensitive QTLs for SW (qSW-2-1, qSW-2-2, qSW-4-1, qSW-9-1, qSW-10-1, qSW-15-1, qSW-20-1, and qSW-20-5) overlap with or were within a subset of the previous localization result intervals (Xu et al., 2011; Niu et al., 2013; Yang et al., 2017; Hina et al., 2020). Five sensitive QTLs for ST (qST-4-4, qST-5-2, qST-6-1, qST-13-1 and qST-20-3) overlapped with or included the intervals of previous localization results (Xu et al., 2011; Niu et al., 2013; Hina et al., 2020). Five sensitive QTLs for HSW (qHSW-4-3, qHSW-13-2, qHSW-17-2, qHSW-20-1, and qHSW-20-5) were found to have regions of overlap with the localization results of previous studies (Mansur et al., 1993; Teng et al., 2009; Han et al., 2012; Kato et al., 2014). Overall, the results of the present study correlated well with those of previous studies.
Besides, comparing the localization results of seed size traits in this study with the results of other related trait localization studies, eight QTLs (qSL-4-1, qSL-17-1, qSL-20-1, qSW-12-2, qSW-15-2, qSW-17-1, qST-13-3, qST-20-1) were found to overlap or interval overlap with QTLs related to yield traits from previous studies (Mansur et al., 1993; Kabelka et al., 2004; Du et al., 2009; Palomeque et al., 2009; Liu et al., 2011; Wang X. et al., 2014). Fifteen QTLs (qSL-6-2, qSL-13-1, qSL-17-1, qSL-18-1, qSL-20-1, qSW-11-1, qSW-12-1, qSW-12-2, qSW-20-2, qSW-20-3, qST-5-2, qST-13-1, qST-13-3, qST20-1, qST-20-2) overlapped QTLs associated with traits related to protein, oil and fatty acids (Sebolt et al., 2000; Tajuddin et al., 2003; Bachlava et al., 2009; Qi et al., 2011; Eskandari et al., 2013; Mao et al., 2013; Wang J. et al., 2014; Fan et al., 2015; Warrington et al., 2015; Han et al., 2015; Leite et al., 2016; Fliege et al., 2022). Five QTLs (qSW-15-1, qSW-15-3, qSW-18-2, qST-4-1 and qSW-5-2) had overlapping intervals with QTLs related to seed-set of pod number and soybean maturity (Yao et al., 2015; Ning et al., 2018). Two QTLs (qSL-5-1 and qST-5-2) had interval overlapping with isoflavonoid-related QTLs (Yang et al., 2011; Cai et al., 2018). The qSW-4-1 overlapped with the QTLs associated with the long juvenility (Yue et al., 2017). Researchers sometimes studied the seed weight of soybean for QTLs mapping in collaboration with protein and oil content (Fasoula et al., 2004; Pathan et al., 2013; Yesudas et al., 2013; Wang X. et al., 2014; Whiting et al., 2020; He et al., 2021). In this study, qHSW-13-1, qHSW-15-1, qHSW-17-2, qHSW-20-2 and the stable QTL qHSW-20-3 had overlap intervals with QTLs related to protein or oil content studied previously (Panthee et al., 2005; Mao et al., 2013; Wang X. et al., 2014; Han et al., 2015; Fliege et al., 2022). Besides, qHSW-15-1 and qHSW-17-1 also had overlap intervals with yield-related QTL studied previously (Palomeque et al., 2009; Liu et al., 2011). In summary, many QTLs with stable main effects related to seed size and weight traits in this study were consistent with previous studies results and correlated with QTLs related to other traits including protein, oil content, pod number, yield, maturity, and long juvenile stage. Thus, we suggest that genes regulating soybean seed size and weight traits may be correlated with genes regulating other traits, especially protein and oil content, so genes regulating the synthesis or metabolism of protein and oil content were also used as the basis for candidate gene speculation in this study.
In addition, compared with soybean, rice (Oryza sativa L.) has been studied much more intensively than soybean in terms of its seed size and weight. Currently, genes associated with seed size and weight, such as GW2 (Song et al., 2007), OsGRF4 (Li et al., 2016), GS3 (Fan et al., 2006), qSW5 (Shomura et al., 2008), GW5 (Weng et al., 2008), qGL3 (Zhang et al., 2012), LGY3 (Liu Q. et al., 2018), GS5 (Li and Li, 2016), GS6 (Sun et al., 2013), GLW7 (Wang et al., 2015), etc., have been cloned. Furthermore, the regulatory pathways of the genes mainly include the ubiquitin-proteasome pathway, G protein signaling pathway, Mitogen-activated protein kinases (MAPK) signaling pathway, hormone signaling pathway and transcription factor regulatory pathway, etc. (Li and Li, 2016). Among them, in the ubiquitin-proteasome pathway, E3 ubiquitin ligase plays a major role and negatively regulates seed width and seed weight (Song et al., 2007). In the hormone signaling pathway, Brassinolide (BR) and Auxin (IAA) can promote cell growth and expansion (Li et al., 2019), it mainly regulates glume development to positively regulate seed size in rice (Li et al., 2011). Therefore, in this study, candidate genes were selected and predicted by screening genes within five clusters based on their specific expression in soybean, combined with homologous or identical functions of genes related to grain size and weight traits in rice.
The major and stable QTL, qSW-20-3, which was detected in four environments with PVE varied from 9.22 to 21.93%, was contained in the qWTP20-2 cluster. By the analysis of sequence variation, we found that among the candidate genes within this QTL interval, only Glyma.20g084000 and Glyma.20g084500 were different in the sequence of the parental lines. They were not specifically expressed at the seed maturation stage in soybean, moreover, they have a negative additive effect, but they were associated with RNA methylation and protein ubiquitination, respectively. Therefore, we speculate that the genes within this cluster may indirectly regulate seed size and weight by regulating other traits. While another major and stable QTL, qSL-3-1, which was detected in six environments with PVE varied from 4.38 to 15.91%, was contained in the qLP3-1 cluster. Comparing the sequence variation between parental lines for candidate genes within this cluster, we found that five genes underwent natural variation between parental lines, and all of them were specifically and highly expressed at the seed maturation stage in soybean. Moreover, they have a positive additive effect. Therefore, we speculate that the five candidate genes within the qLP3-1 cluster regulate seed size and weight positively through certain pathways based on their gene annotation. However, the exact signaling pathway remains to be further investigated.
It is important to study the molecular regulatory network of yield-related traits in soybean. And the loci and candidate genes in this study provide an important theoretical basis and genetic resources for solving the bottleneck problem of soybean yield, which deserves to be further investigated at the molecular level.
The original contributions presented in the study are included in the article/Supplementary Material. Further inquiries can be directed to the corresponding authors.
YC and SL designed the project. SL performed the experiments and drafted the manuscript. RL, ZG, BC, and FL helped the experiment to obtain part of the data. JJ and RW revised the manuscript. SL and QX analyzed the data. HN and ZC validated the manuscripts.
This work was supported by the Key-Areas Research and Development Program of Guangdong Province (2020B020220008), the China Agricultural Research System (CARS-04-PS09), the Guangdong Agricultural Research System (2022KJ136), and the Research Project of the State Key Laboratory of Agricultural and Biological Resources Protection and Utilization in Subtropics.
We thank Prof. Liangfa Ge (South China Agricultural University, Guangzhou, China) for critical reading and comments on the manuscript and Long Xiao (Perkins&Will, Vancouver, BC) for constructive suggestions on the language of the manuscript.
The authors declare that the research was conducted in the absence of any commercial or financial relationships that could be construed as a potential conflict of interest.
All claims expressed in this article are solely those of the authors and do not necessarily represent those of their affiliated organizations, or those of the publisher, the editors and the reviewers. Any product that may be evaluated in this article, or claim that may be made by its manufacturer, is not guaranteed or endorsed by the publisher.
The Supplementary Material for this article can be found online at: https://www.frontiersin.org/articles/10.3389/fpls.2022.1094112/full#supplementary-material
Bachlava, E., Dewey, R. E., Burton, J. W., Cardinal, A. J. (2009). Mapping and comparison of quantitative trait loci for oleic acid seed content in two segregating soybean populations. Crop Sci. 49 (2), 433–442. doi: 10.2135/cropsci2008.06.0324
Cai, Z., Cheng, Y., Ma, Z., Liu, X., Ma, Q., Xia, Q., et al. (2018). Fine-mapping of QTLs for individual and total isoflavone content in soybean (Glycine max l.) using a high-density genetic map. Theor. Appl. Genet. 131 (3), 555–568. doi: 10.1007/s00122-017-3018-x
Chapman, A., Pantalone, V. R., Ustun, A., Allen, F. L., Landau-Ellis, D., Trigiano, R. N., et al. (2003). Quantitative trait loci for agronomic and seed quality traits in an F2 and F4:6 soybean population. Euphytica. 129 (3), 387–393. doi: 10.1023/A:1022282726117
Csanadi, G., Vollmann, J., Stift, G., Lelley, T. (2001). Seed quality QTLs identified in a molecular map of early maturing soybean. Theor. Appl. Genet. 103 (6-7), 912–919. doi: 10.1007/s001220100621
Cui, B., Chen, L., Yang, Y., Liao, H. (2020). Genetic analysis and map-based delimitation of a major locusqSS3 for seed size in soybean. Plant Breeding. 139 (6), 1145–1157. doi: 10.1111/pbr.12853
Du, W., Wang, M., Fu, S., Yu, D. (2009). Mapping QTLs for seed yield and drought susceptibility index in soybean (Glycine max l.) across different environments. J. Genet. Genomics 36 (12), 721–731. doi: 10.1016/S1673-8527(08)60165-4
Elattar, M. A., Karikari, B., Li, S., Song, S., Cao, Y., Aslam, M., et al. (2021). Identification and validation of major QTLs, epistatic interactions, and candidate genes for soybean seed shape and weight using two related RIL populations. Front. Genet. 12. doi: 10.3389/fgene.2021.666440
Eskandari, M., Cober, E. R., Rajcan, I. (2013). Genetic control of soybean seed oil: I. QTL and genes associated with seed oil concentration in RIL populations derived from crossing moderately high-oil parents. Theor. Appl. Genet. 126 (2), 483–495. doi: 10.1007/s00122-012-1995-3
Fan, S., Li, B., Yu, F., Han, F., Yan, S., Wang, L., et al. (2015). Analysis of additive and epistatic quantitative trait loci underlying fatty acid concentrations in soybean seeds across multiple environments. Euphytica. 206 (3), 689–700. doi: 10.1007/s10681-015-1491-3
Fan, C., Xing, Y., Mao, H., Lu, T., Han, B., Xu, C., et al. (2006). GS3, a major QTL for grain length and weight and minor QTL for grain width and thickness in rice, encodes a putative transmembrane protein. Theor. Appl. Genet. 112 (6), 1164–1171. doi: 10.1007/s00122-006-0218-1
Fasoula, V. A., Harris, D. K., Boerma, H. R. (2004). Validation and designation of quantitative trait loci for seed protein, seed oil, and seed weight from two soybean populations. Crop Sci. 44 (4), 1218–1225. doi: 10.2135/cropsci2004.1218
Fliege, C. E., Ward, R. A., Vogel, P., Nguyen, H., Quach, T., Guo, M., et al. (2022). Fine mapping and cloning of the major seed protein quantitative trait loci on soybean chromosome 20. Plant J. 110 (1), 114–128. doi: 10.1111/tpj.15658
Gao, H. H., Gu, Y., Jiang, H. W., Li, Y. Y., Xin, D. W., Liu, C. Y., et al. (2019). Mapping and analysis of QTLs related to seed length and seed width in Glycine max. Plant Breeding. 138 (6), 733–740. doi: 10.1111/pbr.12745
Han, Y., Teng, W., Wang, Y., Zhao, X., Wu, L., Li, D., et al. (2015). Unconditional and conditional QTL underlying the genetic interrelationships between soybean seed isoflavone, and protein or oil contents. Plant Breeding. 134 (3), 300–309. doi: 10.1111/pbr.12259
Han, Y., Xie, D., Teng, W., Sun, J., Li, W. (2012). QTL underlying developmental behaviour of 100-seed weight of soybean. Plant Breeding. 131 (5), 600–606. doi: 10.1111/j.1439-0523.2012.01987.x
He, Q., Xiang, S., Yang, H., Wang, W., Shu, Y., Li, Z., et al. (2021). A genome-wide association study of seed size, protein content, and oil content using a natural population of sichuan and chongqing soybean. Euphytica. 217 (11), 198. doi: 10.1007/s10681-021-02931-8
Hina, A., Cao, Y., Song, S., Li, S., Sharmin, R. A., Elattar, M. A., et al. (2020). High-resolution mapping in two RIL populations refines major QTL “hotspot” regions for seed size and shape in soybean (Glycine max l.). Int. J. Mol. Sci. 21 (3), 1040. doi: 10.3390/ijms21031040
Hu, Z., Zhang, H., Kan, G., Ma, D., Zhang, D., Shi, G., et al. (2013). Determination of the genetic architecture of seed size and shape via linkage and association analysis in soybean (Glycine max l. merr.). Genetica. 141 (4-6), 247–254. doi: 10.1007/s10709-013-9723-8
Hyten, D. L., Pantalone, V. R., Sams, C. E., Saxton, A. M., Landau-Ellis, D., Stefaniak, T. R., et al. (2004). Seed quality QTL in a prominent soybean population. Theor. Appl. Genet. 109 (3), 552–561. doi: 10.1007/s00122-004-1661-5
Jiang, B. Z., Li, M., Cheng, Y. B., Cai, Z. D., Ma, Q. B., Jiang, Z., et al. (2019). Genetic mapping of powdery mildew resistance genes in soybean by high-throughput genome-wide sequencing. Theor. Appl. Genet. 132 (6), 1833–1845. doi: 10.1007/s00122-019-03319-y
Jia, J., Wang, H., Cai, Z., Wei, R., Huang, J., Xia, Q., et al. (2022). Identification and validation of stable and novel quantitative trait loci for pod shattering in soybean [Glycine max (L.) merr.]. J. Integr. Agr. 21 (11), 3169–3184. doi: 10.1016/j.jia.2022.08.082
Kabelka, E. A., Diers, B. W., Fehr, W. R., LeRoy, A. R., Baianu, I. C., You, T., et al. (2004). Putative alleles for increased yield from soybean plant introductions. Crop Sci. 44 (3), 784. doi: 10.2135/cropsci2004.0784
Kato, S., Sayama, T., Fujii, K., Yumoto, S., Kono, Y., Hwang, T., et al. (2014). A major and stable QTL associated with seed weight in soybean across multiple environments and genetic backgrounds. Theor. Appl. Genet. 127 (6), 1365–1374. doi: 10.1007/s00122-014-2304-0
Kulkarni, K. P., Asekova, S., Lee, D., Bilyeu, K., Song, J. T., Lee, J. (2017). Mapping QTLs for 100-seed weight in an interspecific soybean cross of williams 82 (Glycine max) and PI 366121 (Glycine soja). Crop Pasture Sci. 68 (2), 148–155. doi: 10.1071/CP16246
Kumawat, G., Xu, D. (2021). A major and stable quantitative trait locus qSS2 for seed size and shape traits in a soybean RIL population. Front. Genet. 12. doi: 10.3389/fgene.2021.646102
Lee, S. H., Park, K. Y., Lee, H. S., Park, E. H., Boerma, H. R. (2001). Genetic mapping of QTLs conditioning soybean sprout yield and quality. Theor. Appl. Genet. 103 (5), 702–709. doi: 10.1007/s001220100595
Leite, D. C., Pinheiro, J. B., Campos, J. B., Di Mauro, A. O., Unêda-Trevisoli, S. H. (2016). QTL mapping of soybean oil content for marker-assisted selection in plant breeding program. Genet. Mol. Res. 15 (1), grm7685. doi: 10.4238/gmr.15017685
Li, Y., Fan, C., Xing, Y., Jiang, Y., Luo, L., Sun, L., et al. (2011). Natural variation in GS5 plays an important role in regulating grain size and yield in rice. Nat. Genet. 43 (12), 1266–1269. doi: 10.1038/ng.977
Li, S., Gao, F., Xie, K., Zeng, X., Cao, Y., Zeng, J., et al. (2016). The OsmiR396c-OsGRF4-OsGIF1 regulatory module determines grain size and yield in rice. Plant Biotechnol. J. 14 (11), 2134–2146. doi: 10.1111/pbi.12569
Li, N., Li, Y. (2016). Signaling pathways of seed size control in plants. Curr. Opin. Plant Biol. 33, 23–32. doi: 10.1016/j.pbi.2016.05.008
Li, M., Liu, Y., Wang, C., Yang, X., Li, D., Zhang, X., et al. (2020). Identification of traits contributing to high and stable yields in different soybean varieties across three chinese latitudes. Front. Plant Sci. 10, 1642. doi: 10.3389/fpls.2019.01642
Liu, Q., Han, R., Wu, K., Zhang, J., Ye, Y., Wang, S., et al. (2018). G-Protein βγ subunits determine grain size through interaction with MADS-domain transcription factors in rice. Nat. Commun. 9 (1), 852. doi: 10.1038/s41467-018-03047-9
Liu, W., Kim, M. Y., Van, K., Lee, Y., Li, H., Liu, X., et al. (2011). QTL identification of yield-related traits and their association with flowering and maturity in soybean. J. Crop Sci. Biotechnol. 14 (1), 65–70. doi: 10.1007/s12892-010-0115-7
Liu, N., Li, M., Hu, X., Ma, Q., Mu, Y., Tan, Z., et al. (2017). Construction of high-density genetic map and QTL mapping of yield-related and two quality traits in soybean RILs population by RAD-sequencing. BMC Genomics 18 (1), 466. doi: 10.1186/s12864-017-3854-8
Liu, D., Yan, Y., Fujita, Y., Xu, D. (2018). Identification and validation of QTLs for 100-seed weight using chromosome segment substitution lines in soybean. Breed. Sci. 68 (4), 442–448. doi: 10.1270/jsbbs.17127
Li, N., Xu, R., Li, Y. (2019). Molecular networks of seed size control in plants. Annu. Rev. Plant Biol. 70 (1), 435–463. doi: 10.1146/annurev-arplant-050718-095851
Li, W., Zheng, D., Van, K., Lee, S. (2008). QTL mapping for major agronomic traits across two years in soybean (Glycine max l. merr.). J. Crop Sci. Biotechnol. 11 (3), 171–176.
Mansur, L. M., Lark, K. G., Kross, H., Oliveira, A. (1993). Interval mapping of quantitative trait loci for reproductive, morphological, and seed traits of soybean (Glycine max l.). Theor. Appl. Genet. 86 (8), 907–913. doi: 10.1007/BF00211040
Mao, T., Jiang, Z., Han, Y., Teng, W., Zhao, X., Li, W. (2013). Identification of quantitative trait loci underlying seed protein and oil contents of soybean across multi-genetic backgrounds and environments. Plant Breeding. 132 (6), 630–641. doi: 10.1111/pbr.12091
Maughan, P. J., Maroof, M. A., Buss, G. R. (1996). Molecular-marker analysis of seed-weight: Genomic locations, gene action, and evidence for orthologous evolution among three legume species. Theor. Appl. Genet. 93 (4), 574–579. doi: 10.1007/BF00417950
Mccouch, S., Cho, Y., Yano, M., Paul, E., Blinstrub, M., Morishima, H., et al. (1997). Report on QTL nomenclature. Rice Genet. Newsl. 14, 11–13.
Mian, M. A., Bailey, M. A., Tamulonis, J. P., Shipe, E. R., Carter, T. E. J., Parrott, W. A., et al. (1996). Molecular markers associated with seed weight in two soybean populations. Theor. Appl. Genet. 93 (7), 1011–1016. doi: 10.1007/BF00230118
Ning, H., Yuan, J., Dong, Q., Li, W., Xue, H., Wang, Y., et al. (2018). Identification of QTLs related to the vertical distribution and seed-set of pod number in soybean [Glycine max (L.) merri]. PLoS One 13 (4), e195830. doi: 10.1371/journal.pone.0195830
Niu, Y., Xu, Y., Liu, X., Yang, S., Wei, S., Xie, F., et al. (2013). Association mapping for seed size and shape traits in soybean cultivars. Mol. Breeding. 31 (4), 785–794. doi: 10.1007/s11032-012-9833-5
Nyquist, W. E., Baker, R. J. (1991). Estimation of heritability and prediction of selection response in plant populations. Crit. Rev. Plant Sci. 10 (3), 235–322. doi: 10.1080/07352689109382313
Palomeque, L., Li-Jun, L., Li, W., Hedges, B., Cober, E. R., Rajcan, I. (2009). QTL in mega-environments: II. agronomic trait QTL co-localized with seed yield QTL detected in a population derived from a cross of high-yielding adapted × high-yielding exotic soybean lines. Theor. Appl. Genet. 119 (3), 429–436. doi: 10.1007/s00122-009-1048-8
Panthee, D. R., Pantalone, V. R., West, D. R., Saxton, A. M., Sams, C. E. (2005). Quantitative trait loci for seed protein and oil concentration, and seed size in soybean. Crop Sci. 45 (5), 2015–2022. doi: 10.2135/cropsci2004.0720
Pathan, S. M., Vuong, T., Clark, K., Lee, J., Shannon, J. G., Roberts, C. A., et al. (2013). Genetic mapping and confirmation of quantitative trait loci for seed protein and oil contents and seed weight in soybean. Crop Sci. 53 (3), 765–774. doi: 10.2135/cropsci2012.03.0153
Qi, Z., Wu, Q., Han, X., Sun, Y., Du, X., Liu, C., et al. (2011). Soybean oil content QTL mapping and integrating with meta-analysis method for mining genes. Euphytica. 179 (3), 499–514. doi: 10.1007/s10681-011-0386-1
Qi, Z. M., Zhang, X. Y., Qi, H. D., Xin, D. W., Han, X., Jiang, H. W., et al. (2017). Identification and validation of major QTLs and epistatic interactions for seed oil content in soybeans under multiple environments based on a high-density map. Euphytica. 213 (8), 162. doi: 10.1007/s10681-017-1952-y
Salas, P., Oyarzo-Llaipen, J. C., Wang, D., Chase, K., Mansur, L. (2006). Genetic mapping of seed shape in three populations of recombinant inbred lines of soybean (Glycine max l. merr.). Theor. Appl. Genet. 113 (8), 1459–1466. doi: 10.1007/s00122-006-0392-1
Sax, K. (1923). The association of size differences with seed-coat pattern and pigmentation in PHASEOLUS VULGARIS. Genetics. 8 (6), 552–560. doi: 10.1093/genetics/8.6.552
Sebolt, A. M., Shoemaker, R. C., Diers, B. W. (2000). Analysis of a quantitative trait locus allele from wild soybean that increases seed protein concentration in soybean. Crop Sci. 40 (5), 1438–1444. doi: 10.2135/cropsci2000.4051438x
Shomura, A., Izawa, T., Ebana, K., Ebitani, T., Kanegae, H., Konishi, S., et al. (2008). Deletion in a gene associated with grain size increased yields during rice domestication. Nat. Genet. 40 (8), 1023–1028. doi: 10.1038/ng.169
Song, X., Huang, W., Shi, M., Zhu, M., Lin, H. (2007). A QTL for rice grain width and weight encodes a previously unknown RING-type E3 ubiquitin ligase. Nat. Genet. 39 (5), 623–630. doi: 10.1038/ng2014
Sun, L., Li, X., Fu, Y., Zhu, Z., Tan, L., Liu, F., et al. (2013). GS6, a member of the GRAS gene family, negatively regulates grain size in rice. J. Integr. Plant Biol. 55 (10), 938–949. doi: 10.1111/jipb.12062
Sun, Y. Q., Tian, R., Shao, Z. Q., Chen, S. L., Zhang, H., Jin, Y., et al. (2021). Mining of quantitative trait loci and candidate genes for seed size and shape across multiple environments in soybean (Glycine max). Plant Breeding. 140 (6), 1058–1069. doi: 10.1111/pbr.12968
Tajuddin, T. C. F. T., Watanabe, S., Yamanaka, N., Harada, K. (2003). Analysis of quantitative trait loci for protein and lipid contents in soybean seeds using recombinant inbred lines. Breed. Sci. 53 (2), 133–140. doi: 10.1270/jsbbs.53.133
Teng, W., Han, Y., Du, Y., Sun, D., Zhang, Z., Qiu, L., et al. (2009). QTL analyses of seed weight during the development of soybean (Glycine max l. merr.). Heredity. 102 (4), 372–380. doi: 10.1038/hdy.2008.108
Teng, W. L., Sui, M. N., Li, W., Wu, D. P., Zhao, X., Li, H. Y., et al. (2018). Identification of quantitative trait loci underlying seed shape in soybean across multiple environments. J. Agric. Science. 156 (1), 3–12. doi: 10.1017/S002185961700082X
Wang, H., Jia, J., Cai, Z., Duan, M., Jiang, Z., Xia, Q., et al. (2022). Identification of quantitative trait loci (QTLs) and candidate genes of seed iron and zinc content in soybean [Glycine max (L.) merr.]. BMC Genomics 23 (1), 146. doi: 10.1186/s12864-022-08313-1
Wang, X., Jiang, G., Green, M., Scott, R. A., Song, Q., Hyten, D. L., et al. (2014). Identification and validation of quantitative trait loci for seed yield, oil and protein contents in two recombinant inbred line populations of soybean. Mol. Genet. Genomics 289 (5), 935–949. doi: 10.1007/s00438-014-0865-x
Wang, S., Li, S., Liu, Q., Wu, K., Zhang, J., Wang, S., et al. (2015). The OsSPL16-GW7 regulatory module determines grain shape and simultaneously improves rice yield and grain quality. Nat. Genet. 47 (8), 949–954. doi: 10.1038/ng.3352
Wang, J., Liu, L., Guo, Y., Wang, Y., Zhang, L., Jin, L., et al. (2014). A dominant locus, qBSC-1, controls β subunit content of seed storage protein in soybean (Glycine max (L.) merri.). J. Integr. Agr. 13 (9), 1854–1864. doi: 10.1016/S2095-3119(13)60579-1
Warrington, C. V., Abdel-Haleem, H., Hyten, D. L., Cregan, P. B., Orf, J. H., Killam, A. S., et al. (2015). QTL for seed protein and amino acids in the benning × danbaekkong soybean population. Theor. Appl. Genet. 128 (5), 839–850. doi: 10.1007/s00122-015-2474-4
Weng, J., Gu, S., Wan, X., Gao, H., Guo, T., Su, N., et al. (2008). Isolation and initial characterization of GW5, a major QTL associated with rice grain width and weight. Cell Res. 18 (12), 1199–1209. doi: 10.1038/cr.2008.307
Whiting, R. M., Torabi, S., Lukens, L., Eskandari, M. (2020). Genomic regions associated with important seed quality traits in food-grade soybeans. BMC Plant Biol. 20 (1), 485. doi: 10.1186/s12870-020-02681-0
Xian, P., Cai, Z., Jiang, B., Xia, Q., Cheng, Y., Yang, Y., et al. (2022). GmRmd1 encodes a TIR-NBS-BSP protein and confers resistance to powdery mildew in soybean. Plant Commun. 3 (6), 100418. doi: 10.1016/j.xplc.2022.100418
Xu, Y., Li, H., Li, G., Wang, X., Cheng, L., Zhang, Y. (2011). Mapping quantitative trait loci for seed size traits in soybean (Glycine max l. merr.). Theor. Appl. Genet. 122 (3), 581–594. doi: 10.1007/s00122-010-1471-x
Yang, K., Moon, J., Jeong, N., Chun, H., Kang, S., Back, K., et al. (2011). Novel major quantitative trait loci regulating the content of isoflavone in soybean seeds. Genes Genom. 33 (6), 685–692. doi: 10.1007/s13258-011-0043-z
Yang, H., Wang, W., He, Q., Xiang, S., Tian, D., Zhao, T., et al. (2017). Chromosome segment detection for seed size and shape traits using an improved population of wild soybean chromosome segment substitution lines. Physiol. Mol. Biol. Plants. 23 (4), 877–889. doi: 10.1007/s12298-017-0468-1
Yan, L., Li, Y., Yang, C., Ren, S., Chang, R., Zhang, M., et al. (2014). Identification and validation of an over-dominant QTL controlling soybean seed weight using populations derived from Glycine max × Glycine soja. Plant Breeding. 133 (5), 632–637. doi: 10.1111/pbr.12197
Yao, D., Liu, Z. Z., Zhang, J., Liu, S. Y., Qu, J., Guan, S. Y., et al. (2015). Analysis of quantitative trait loci for main plant traits in soybean. Genet. Mol. Res. 14 (2), 6101–6109. doi: 10.4238/2015.June.8.8
Yesudas, C. R., Bashir, R., Geisler, M. B., Lightfoot, D. A. (2013). Identification of germplasm with stacked QTL underlying seed traits in an inbred soybean population from cultivars Essex and forrest. Mol. Breeding. 31 (3), 693–703. doi: 10.1007/s11032-012-9827-3
Yue, Y., Liu, N., Jiang, B., Li, M., Wang, H., Jiang, Z., et al. (2017). A single nucleotide deletion in j encoding GmELF3 confers long juvenility and is associated with adaption of tropic soybean. Mol. Plant 10 (4), 656–658. doi: 10.1016/j.molp.2016.12.004
Zeng, Z. B. (1994). Precision mapping of quantitative trait loci. Genet. (Austin). 136 (4), 1457–1468. doi: 10.1093/genetics/136.4.1457
Zhang, J., Song, Q., Cregan, P. B., Jiang, G. (2016). Genome-wide association study, genomic prediction and marker-assisted selection for seed weight in soybean (Glycine max). Theor. Appl. Genet. 129 (1), 117–130. doi: 10.1007/s00122-015-2614-x
Keywords: soybean, seed size, seed weight, stable QTLs, QTL clusters
Citation: Luo S, Jia J, Liu R, Wei R, Guo Z, Cai Z, Chen B, Liang F, Xia Q, Nian H and Cheng Y (2023) Identification of major QTLs for soybean seed size and seed weight traits using a RIL population in different environments. Front. Plant Sci. 13:1094112. doi: 10.3389/fpls.2022.1094112
Received: 09 November 2022; Accepted: 15 December 2022;
Published: 11 January 2023.
Edited by:
Jianghua Chua, Key Laboratory of Tropical Plant Resource and Sustainable Use (CAS), ChinaReviewed by:
Zhaoming Qi, Northeast Agricultural University, ChinaCopyright © 2023 Luo, Jia, Liu, Wei, Guo, Cai, Chen, Liang, Xia, Nian and Cheng. This is an open-access article distributed under the terms of the Creative Commons Attribution License (CC BY). The use, distribution or reproduction in other forums is permitted, provided the original author(s) and the copyright owner(s) are credited and that the original publication in this journal is cited, in accordance with accepted academic practice. No use, distribution or reproduction is permitted which does not comply with these terms.
*Correspondence: Yanbo Cheng, eWJjaGVuZ0BzY2F1LmVkdS5jbg==; Hai Nian, aG5pYW5Ac2NhdS5lZHUuY24=
†These authors share first authorship
Disclaimer: All claims expressed in this article are solely those of the authors and do not necessarily represent those of their affiliated organizations, or those of the publisher, the editors and the reviewers. Any product that may be evaluated in this article or claim that may be made by its manufacturer is not guaranteed or endorsed by the publisher.
Research integrity at Frontiers
Learn more about the work of our research integrity team to safeguard the quality of each article we publish.