 Zhixue Dong1,2†
 Minqiang Tang2,3†
 Xiaobo Cui2†
 Chuanji Zhao2†
 Chaobo Tong2
 Yueying Liu2
 Yang Xiang4Zaiyun Li1
 Junyan Huang2*Xiaohui Cheng2*Shengyi Liu2
- 1National Key Lab of Crop Genetic Improvement, College of Plant Science and Technology, Huazhong Agricultural University, Wuhan, China
- 2Key Laboratory of Biology and Genetic Improvement of Oil Crops, the Ministry of Agriculture and Rural Affairs of the People's Republic of China (PRC), Oil Crops Research Institute, Chinese Academy of Agricultural Sciences, Wuhan, China
- 3Key Laboratory of Genetics and Germplasm Innovation of Tropical Special Forest Trees and Ornamental Plants, Ministry of Education, School of Forestry, Hainan University, Haikou, China
- 4Guizhou Rapeseed Institute, Guizhou Academy of Agricultural Science, Guiyang, China
Rapeseed (Brassica napus L.) is a crucial oil crop cultivated worldwide. First branch height, an essential component of rapeseed plant architecture, has an important effect on yield and mechanized harvesting; however, the underlying genetic mechanism remains unclear. In this study, based on the 60K single nucleotide polymorphism array and a recombinant inbred lines population derived from M083 and 888-5, a total of 19 QTLs were detected in five environments, distributed on linkage groups A02, A09, A10, C06, and C07, which explained phenotypic variation ranging from 4.87 to 29.87%. Furthermore, 26 significant SNPs were discovered on Chr.A02 by genome-wide association study in a diversity panel of 324 re-sequencing accessions. The major QTL of the first branch height trait was co-located on Chr.A02 by integrating linkage mapping and association mapping. Eleven candidate genes were screened via allelic variation analysis, inter-subgenomic synteny analysis, and differential expression of genes in parental shoot apical meristem tissues. Among these genes, BnaA02g13010D, which encodes a TCP transcription factor, was confirmed as the target gene according to gene function annotation, haplotype analysis, and full-length gene sequencing, which revealed that TATA insertion/deletion in the promoter region was closely linked to significantly phenotypic differences BnaA02.TCP1M083 overexpression resulted in decreased branch height and increased branch number in Arabidopsis. These results provide a genetic basis for first branch height and the ideal architecture of B. napus.
Introduction
Rapeseed (Brassica napus L.) is an important source of edible oil, biodiesel and protein feed for livestock in the world (Chalhoub et al., 2014). It is the third largest oil crop with an annual seed yield of 72 million tons that takes up ~13% of global oilseed production after oil palm and soybean (FAOSTAT, https://www.fao.org/faostat/). Global rapeseed production has increased significantly since 1961, but there has been no change in seed yield, at least in the last five years (Liu et al., 2022). With the growing human population and changing environment, the energy demand for rapeseed and crop production has increased. However, owing to the increasing urbanization, dwindling resources and competition with staple crops for land, the development of the rapeseed industry has plateaued in recent years (Liu et al., 2022). Therefore, there is an urgent to study and cultivate high-yield rapeseed varieties using genomics and biotechnology to meet global demands.
Crop yield mainly comprises the number of plants per unit area, number of grains per plant, and thousand-seed weight. Plant architecture, defined as the three-dimensional organization of the plant body, plays an extremely important role in crop growth, yield, and harvest index (Reinhardt and Kuhlemeier, 2002; Sarlikioti et al., 2011; Gou et al., 2017; Wang et al., 2017; Sun et al., 2019; Tian et al., 2019; Yang et al., 2019; Zheng et al., 2020; Guo et al., 2020). Crop breeding research has focused on shoot architecture, including the component traits of plant height, branch or tiller number and angle, leaf shape, size and angle, and inflorescence morphology (Wang and Li, 2008; Wang et al., 2018). Among these traits, plant height is the most prominent determinant of plant architecture and is often selected in domesticated crops. In the 1960s, the central theme of the “Green Revolution” was reducing plant height by introducing the semi-dwarf gene sd1 into rice and the dwarf genes Rht-B1b/Rht-D1b into wheat, which greatly improved lodging resistance and the harvest index (Khush, 2001; Liu et al., 2018). The upright and sparsely branched phenotype of maize (Zea mays) is suitable for high-density planting, which greatly improved the harvest index (Tian et al., 2019). Currently, one of the major challenges in modern agriculture is the development of an ideotype that produces high yields in various environments.
Plant architecture is controlled by a complex regulatory network that includes phytohormones, miRNAs, and several transcription factors (Lo et al., 2017; Tang and Chu, 2017; Liu et al., 2019; Schneider et al., 2019; Chen et al., 2020; Guo et al., 2020). The molecular mechanisms regulating plant aerial architecture have been identified in several crops, including rice (OsIPA1), maize (ZmUPA2, Zmtin1), wheat (TaSPL8), cucumber (CsBRC1), soybean (GmWRI1b), and rapeseed (BnaMAX1) (Liu et al., 2019; Shen et al., 2019; Sun et al., 2019; Tian et al., 2019; Zhang et al., 2019c; Zheng et al., 2020; Guo et al., 2020), which improved plant performance and yield. Simultaneously, most identified genes that shape plant architecture are related to plant height, which participates in biosynthesis or signaling pathways of phytohormones, including auxin, gibberellins, brassinosteroids and strigolactones (Wang et al., 2018). Genetic studies in tomato, Arabidopsis, rice, and maize have shown that many genes are directly involved in the initiation and outgrowth of axillary buds, which significantly affects crop yield by influencing branch or tiller numbers (Wang and Li, 2006; Wang et al., 2016; Wang and Jiao, 2018).
Dicot plant architecture is typical of rapeseed plants, including the shoot apical meristem (SAM), which establishes the shoot as the primary growth axis of the plant by continuously initiating phytomers, and the root apical meristem, which establishes the primary root that can branch to form secondary or higher-order lateral roots (Teichmann and Muhr, 2015). Recently, an ideotype-like rapeseed plant stature mutant with compact inflorescence and high pod density was isolated, which could be utilized to shorten the flowering period and increase production and was highly desired for mechanized harvest (Fan et al., 2021; Kuai et al., 2022). In general, rapeseed with semi-dwarf plant type tends to show many branches and high primary branch height, which is beneficial for improving production by increasing pod number per plant and enhancing lodging resistance. Therefore, first branch height (FBH), the distance between the growing point of the first effective branch and the cotyledon node, is also a non-negligible factor shaping rapeseed plant architecture and influencing rapeseed yield (Zheng et al., 2019). Nevertheless, there are no reports on FBH gene localization and cloning in rapeseed.
Quantitative trait loci (QTL) mapping combined with genome-wide association study (GWAS) is an effective approach for identifying loci controlling complex traits (Han et al., 2018; Wang et al., 2020b). Zhao et al. (2016) detected 27 QTLs related to FBH trait distributed on 11 chromosomes with a doubled haploid population derived from KenC-8 and N53-2. Cai et al. (2016) also used a doubled haploid population derived from Huashuang 5 and J7005 to detect16 QTLs that contribute to FBH trait in rapeseed. Luo et al. (2017) genotyped and reanalyzed the previous phenotypes of a doubled haploid population (Tapidor and Ningyou7), and detected 35 QTLs related to FBH, which were distributed on A01, A02, A03, A05, A06, A09, A10, C05, C06, C07, C08, and C09. The contribution rate of these QTLs ranged from 3.19 to 22.91%. Shen et al. (2018) detected five plant height-related QTLs and five FBH-related QTLs on chromosomes A02 and A07 using a doubled haploid population derived from Westar and Y689. All the above reports identified QTLs for rapeseed FBH, but all QTLs were screened using a single method. QTL mapping and GWAS can accurately and rapidly locate and screen for candidate genes. Recently, several studies detected and screened candidate genes for agronomic traits in rapeseed (Sun et al., 2016; Wang et al., 2020b; Zhao et al., 2022). However, this approach was not used to rapeseed FBH.
In this study, a recombinant inbred lines (RILs) population derived from M083 and 888-5 containing 210 lines was used for linkage mapping to detect QTLs for FBH in different environments with a 60 K Brassica Infinium single nucleotide polymorphism (SNP) array. We further identified several candidate genes for FBH with a GWAS of 324 natural accessions that our lab collected and re-sequenced previously based on QTL mapping. The results obtained here lay the foundation for further study of the genetic architecture and molecular mechanisms of FBH in rapeseed, and facilitate molecular breeding to improve plant architecture for easy mechanical harvest and increase rapeseed yield.
Materials and methods
Plant materials
An association panel composed of 324 diverse rapeseed inbred lines (25 winter, 259 semi-winter, and 40 spring types) collected worldwide was used for GWAS. These lines were grown in Yangluo, Wuhan, China in 2016, 2017, 2018, and 2019. Each variety was planted in a plot with three rows (33-cm line width and 20-cm plant distance), with 12 plants per row. The lines were randomly designed with three replicates.
A RIL population containing 210 lines derived from the crossing of 888-5 and M083 was used in a previous study. The parent line 888-5 had a lower FBH than the M083 inbred line (Liu et al., 2005). The genetic linkage map contained 9,278 SNPs covering 4,071.08 cM, which mapped to 2,771 loci (bins) in a previous study (Zhang et al., 2019b). The population was planted in the standard breeding trial fields of Xiantao and Wuhan, Hubei Province, and Yangzhou, Jiangsu Province, China in 2016 and 2017. The planting method was the same as that of association population.
Phenotyping and data analysis
At maturity, the association population, RIL population, and the parental lines (888-5 and M083) were assessed for FBH (from the base of the stem to the first effective branch) in each environment. The phenotypic values of the lines in each environment were calculated as the average of ten plants in triplicate. The two parents were compared using two-sample t-test. SPSS 21 (Armonk, NY, United States) was used to calculate the frequency distribution. Analysis of variance was performed using the GLM procedure of SAS. The best linear unbiased prediction (BLUP) of each inbred line in the association population and the effects of genotype, environment, and genotype × environment interactions in linkage and association mapping population were obtained by using the “lmer” function in the “lme4” package of R version 3.6.3 (http://www.R-project.org). The broad-sense heritability (H2) of FBH was calculated as follows:
where G is the genetic variance, G×E is the variance of the genotype-environment interaction, e is the residual error variance, n is the number of environments, and r is the number of replicates within the environment.
QTL identification and analysis
The QTL for FBH was detected using composite interval mapping(CIM) (Zeng, 1994) in Windows QTL Cartographer 2.5 (Wang et al., 2005). The QTL evidence was checked at 1cM intervals with a 10 cM window size using the likelihood ratio test (LRT), after which the LRT values were converted to a logarithm of odds (LOD) scale (LOD¼; 0.217_LRT). The threshold LOD value was estimated using 1,000 permutations at a significance level of P< 0.05. The confidence interval of the QTL position was determined by the 2-LOD interval method. The contribution rate (R2) and additive effect of a presumptive QTL were simultaneously calculated using Windows QTL Cartographer 2.5. The QTL nomenclature described by McCouch et al. (1997) was adopted in this study, each designation was named begins with ‘q’ followed by the abbreviation of the trait name, the linkage group, and the serial number of the QTL on the linkage group, such as qFBH02-1. The QTLs position was drawn using MapChart software (Voorrips, 2002).
GWAS for FBH
GWAS for FBH was performed using a mixed linear model (MLM) to detect associations between phenotypes and genotypes in TASSEL v5.0 (http://www.maizegenetics.net/tassel) (Zhang et al., 2010). The population structure and genetic relationships between accessions were also calculated using TASSEL v5.0 in previous study (Zhang et al., 2019b). The P value was calculated for each SNP as P = 1/N according to the adjusted Bonferroni method, where N is the number of SNPs calculated by the simple program in R software (Li et al., 2012; Li et al., 2021), and defined as the genome-wide control threshold. The quantile-quantile (Q-Q) plot shown with the expected P-value and Manhattan plot were displayed using the R package “qqman” (Turner, 2014). Linkage disequilibrium (LD) of the whole genome was analyzed using PopLDdecay software (Zhang et al., 2019a). The LD heat map of 0.5 LD sequence regions adjacent to the significantly associated SNPs were generated using the “LD heatmap” package in R.
RNA extraction and gene expression quantification
Parental SAM samples were collected at the initial developmental stage of the shoot bud. Total high-quality RNA was extracted using the FastPure Plant Kotal RNA Isolation Kit (Vazyme, Nanjing, China). Then, cDNA was synthesized using HiScript III 1st Strand cDNA Synthesis Kit (Vazyme, Nanjing, China). Quantitative real-time PCR (qRT-PCR) was performed using SYBR Green Real-time PCR (Takara, Kusatsu, Japan) in a CFX Connect Real-time PCR system (BioRad, United States), and BnaActin was used as the reference gene. The 2-∆∆CT method was used to calculate the relative gene expression levels (Livak and Schmittgen, 2001). Each qRT-PCR experiment contained three technical replicates. The specific primers used for qRT-PCR are listed in Supplementary Table 1. Genes were considered as differentially expressed between parents when the log2fold change was ≥ 1 or ≤ -1, and they can be selected as candidate genes.
Gene analysis in the common interval
Allele variation and sub-genome synteny analysis were used to exclude genes when predicting candidate genes for FBH (Zhang et al., 2019b). Based on the B.napus cv. Darmor-bzh reference genome (Chalhoub et al., 2014), we matched the genetic markers for linkage mapping to the physical positions, and compared the linkage and association mapping results. Then, parallel region was defined as co-located interval, which is the major QTL for trait. Parental allele variation analysis was performed using homozygous polymorphic SNP and InDel derived from deeply re-sequenced parent data. The genes within the major QTL were analyzed using sub-genome synteny, and synteny genes existed in another sub-genome of B.napus were excluded. Candidate genes were identified combined with gene expression levels derived from qRT-PCR data.
Haplotype analysis of candidate genes
The 324 accessions of the association population were used to analyze the haplotypes of candidate genes in the genomic regions. The SNPs within the 1.5 kb promoter region of the candidate genes and the nonsynonymous SNPs in the coding sequence were used for haplotype analysis.
Analyses of parental BnaA02.TCP sequence
The total parent DNA was extracted from the leaf samples using the Hi-DNA secure Plant Kit (TianGen, Beijing, China). The sequence of the genomic regions ~1.5 kb upstream of the BnaA02.TCP1 coding sequence was cloned using the primers listed in Supplementary Table 2. The cloned products were sent to QingKe Biotechnology Co., LTD for sequencing, and the genomic sequences were compared using MEGA-X (Tamura et al., 2011).
Construction of the 35S::BnaA02.TCP1M083molecular cassette and plant transformation
The BnaA02.TCP1M083 coding sequence was isolated using the primers listed in Supplementary Table 2 to generate the 35S::BnaA02.TCP1M083 construct. The PCR fragment was cloned into the pBI121 vector and was driven by the 35S promoter. Agrobacterium tumefaciens strain GV3101 carrying the sequenced construct was confirmed via colony PCR and transformed into col-0 plants using the floral dipping method in Arabidopsis. Surviving seedlings with kanamycin were positive transgenic plants and were validated using qRT-PCR experiments, AtActin was used as the reference gene and three repeats of samples were collected for RNA extraction. Six transgenic lines were obtained, three of which were randomly chosen for phenotypic observation.
Results
Phenotypic variation in RIL and association populations
The FBH values of 888-5 and M083 was 14.9 ± 3.8 cm and 70.5 ± 10.2 cm, respectively, which showed highly significant difference in the field trial (Figures 1A, B). The phenotypic data of the FBH of RIL lines were investigated in five environments (Supplementary Table 3), and all displayed normal frequency distributions with continuous variation (Figure 1C). Significant variation among the FBH genotypes was observed: for instance, the minimum FBH was 6.15 cm, while the maximum was 121.4 cm, and the coefficient of variation ranged from 19.84 to 40.94% (Table 1), which showed great distinction. In the association population, the phenotypic frequency distributions of FBH in the four environments and BLUP all presented approximately continuous and normal distributions (Figure 1D; Supplementary Table 5), indicating that the group was suitable for association analysis. Significant variation was also observed in the association population, for example, FBH ranged from 23.41 to 99.11 cm, with an average of 58.75 cm in BLUP; the coefficient of variation was 23.07% (Table 1). The coefficient of variation was greater than 19.84% in both RIL and association populations (Table 1), which indicated dispersion measures were high among accessions or lines. Broad-sense heritability (H2) of FBH in linkage and association populations were 88.96% and 92.61% with significant variation (P< 0.01), respectively (Supplementary Table 4).
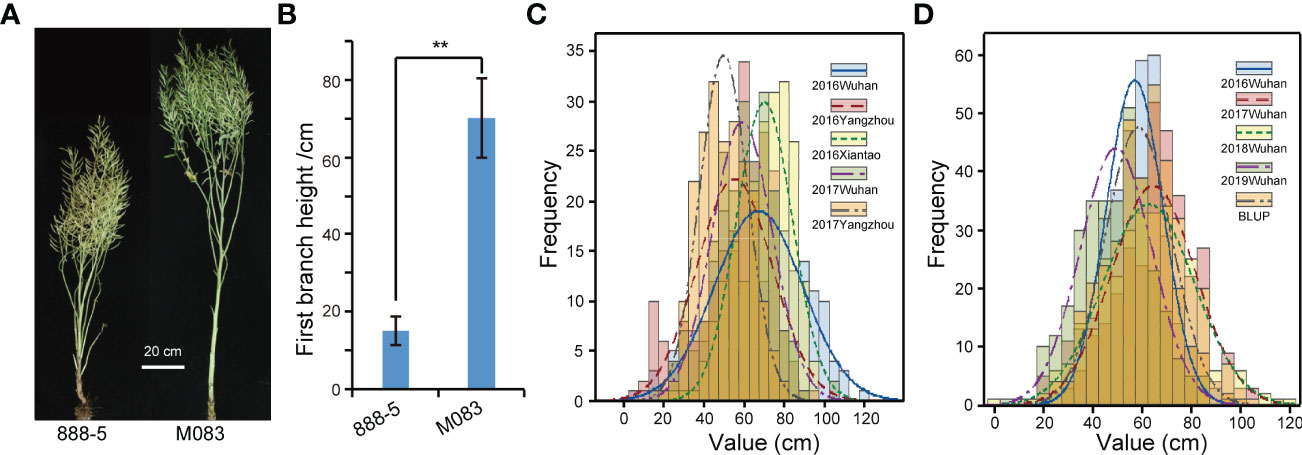
Figure 1 Parent phenotype and phenotypic frequency distribution of recombinant inbred lines (RILs) and natural accessions. (A) The mature stage phenotype of 888-5 and M083. Scale bar = 20 cm. (B) Comparison of first branch height (FBH) between 888-5 and M083. Data are presented as means ± SD (n ˃ 20). The double asterisks represent a significant difference determined via Student’s t-test at P< 0.01. (C) FBH phenotypic frequency distribution in RILs under five environments. (D) FBH phenotypic frequency distribution in 324 collected accessions under four consecutive years and best linear unbiased prediction (BLUP).
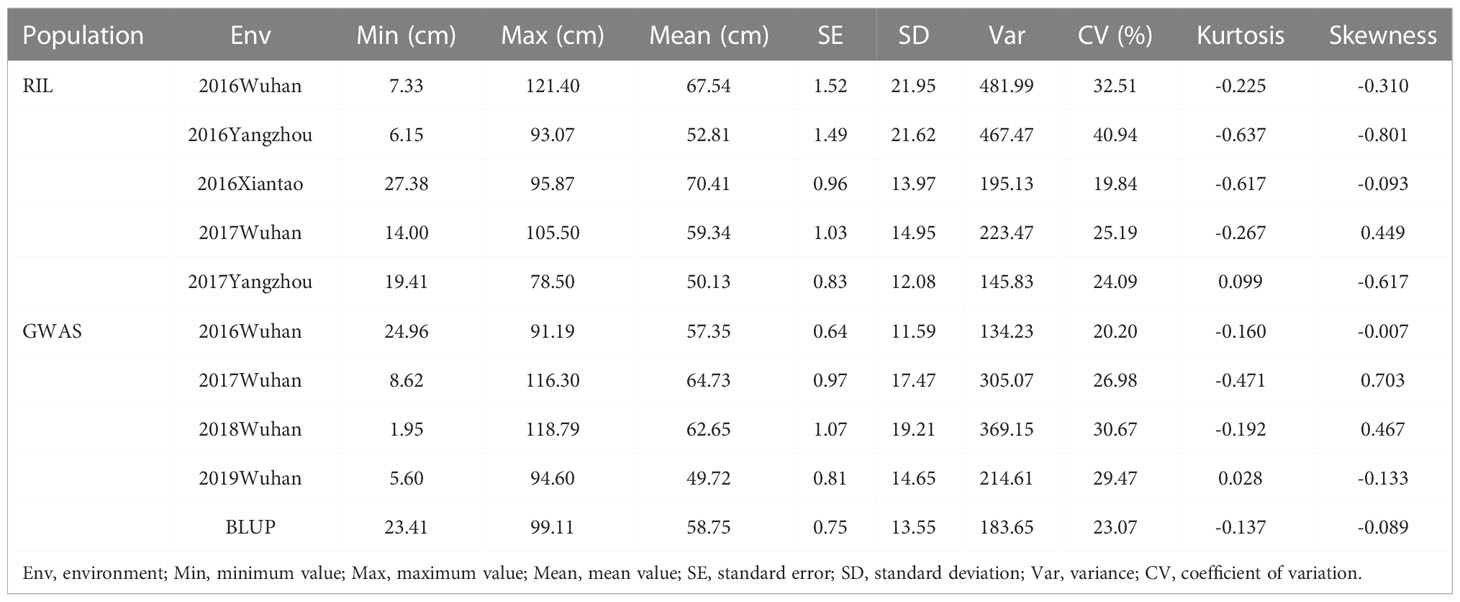
Table 1 Phenotypic variation in the linkage and association populations.
FBH association analysis
Based on the whole genome sequencing (WGS) data, a total of 2,465,230 high-quality SNPs (minor allele frequency, MAF > 0.05, missing rate< 0.5) were filtered in previous studies and the LD distances of the A and C sub-genomes were 21 and 128 kb (r2 > 0.2), respectively. The quantile-quantile plots for GWAS based on the four environments and BLUP values of FBH implied that the associations were well controlled for population structure, and the Manhattan plots revealed only one significant peak located on ChrA02 in the four environments and BLUP (Figures 2). At a significance level of P< 1/2,465,230, 26 significant SNPs were mapped on A02 chromosome in BLUP within the interval of 6.92-7.11 Mb between SNPs p6926697 and p7113686. (Figure 2A; Supplementary Table 6). These results suggest the presence of an important genetic locus in A02 that regulates FBH.
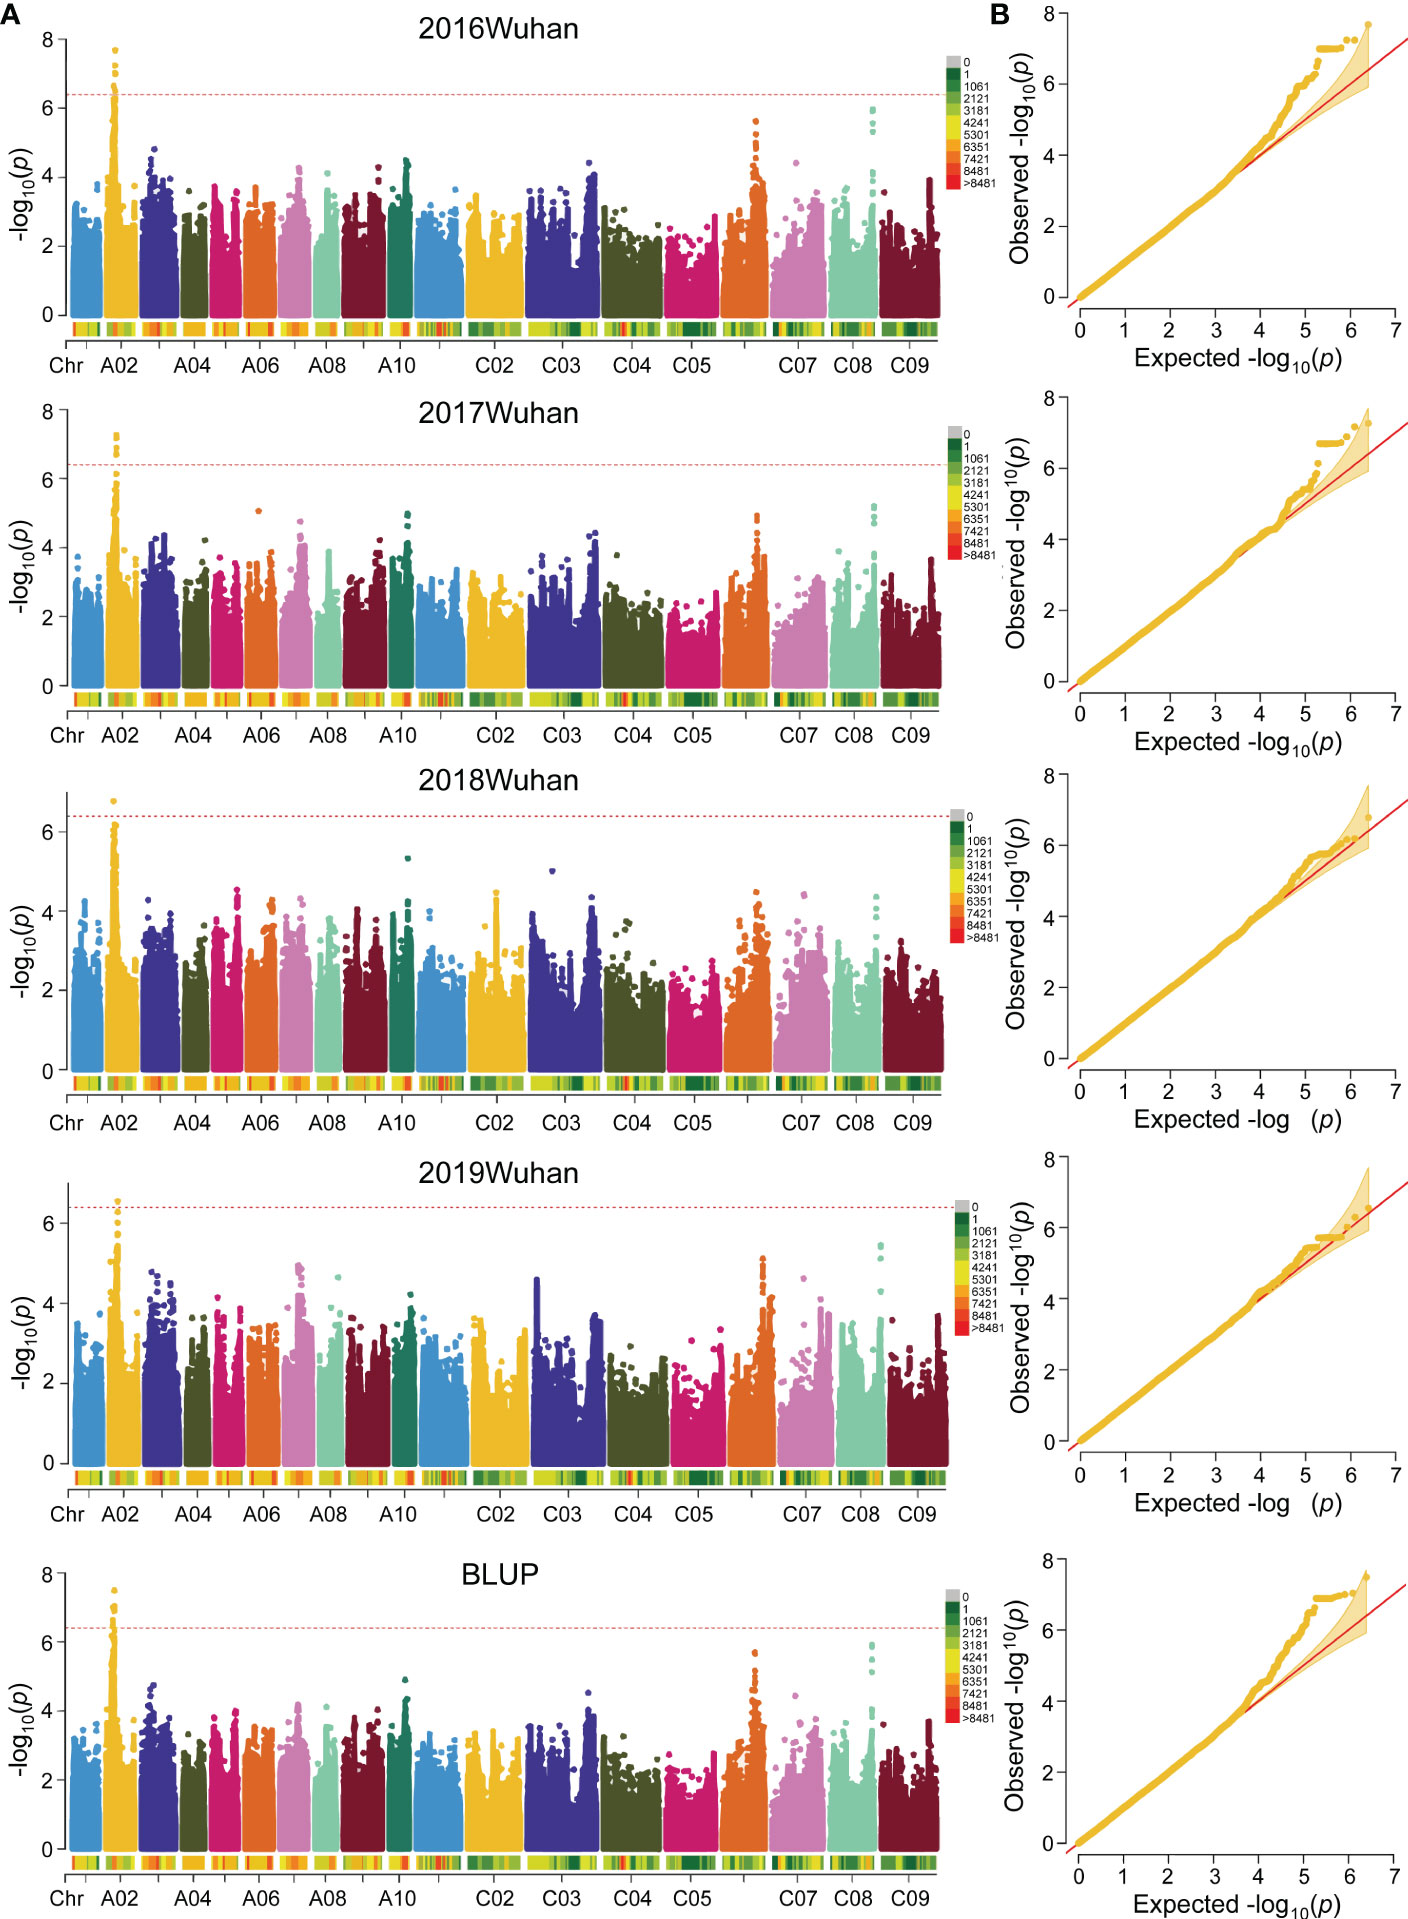
Figure 2 Genome-wide association study (GWAS) of FBH trait in 324 accessions. (A) Manhattan plot of FBH identified by GWAS in four consecutive years and BLUP based on a mixed linear model (MLM) of Efficient Mixed-Model Association eXpedited (EMMAX). The red dotted lines and color blocks represent threshold lines and SNP number in 1 Mb window size, respectively. (B) Quantile-Quantile plot of FBH in four consecutive years and BLUP.
QTL linkage mapping of FBH
Based on the modified B.napus 60 K SNP array and a high density genetic map developed in a previous study (Zhang et al., 2019b), a total of 19 QTLs were detected for FBH in single environment using WinQTL Cartographer 2.5 (Figure3A; Table 2). These QTLs were distributed on linkage groups A02, A09, A10, C06, and C07, with phenotypic variation explained (PVE) rates ranging from 4.87 to 29.87% (Table 2). Among these QTLs, six were located in an approximate region on linkage group A02, and qFBH02-1, qFBH02-2, and qFBH02-3 were repeatedly detected in more than one environment, with the PVE ranging from 15.77 to 29.87% (Figures 3B, C; Table 2). In addition, qFBH02-5 demonstrated a PVE as high as 18.96%, but it was only detected in E5. Simultaneously, four QTLs were detected in group C07 under all environments, except E1, and explained 5.61 ~ 9.02% of phenotypic variation (Table 2). Among the 19 QTLs, qFBH09-1, qFBH09-2 and qFBH09-3 low-FBH alleles came from 888-5, and the remaining high-FBH alleles QTLs were provided by M083.
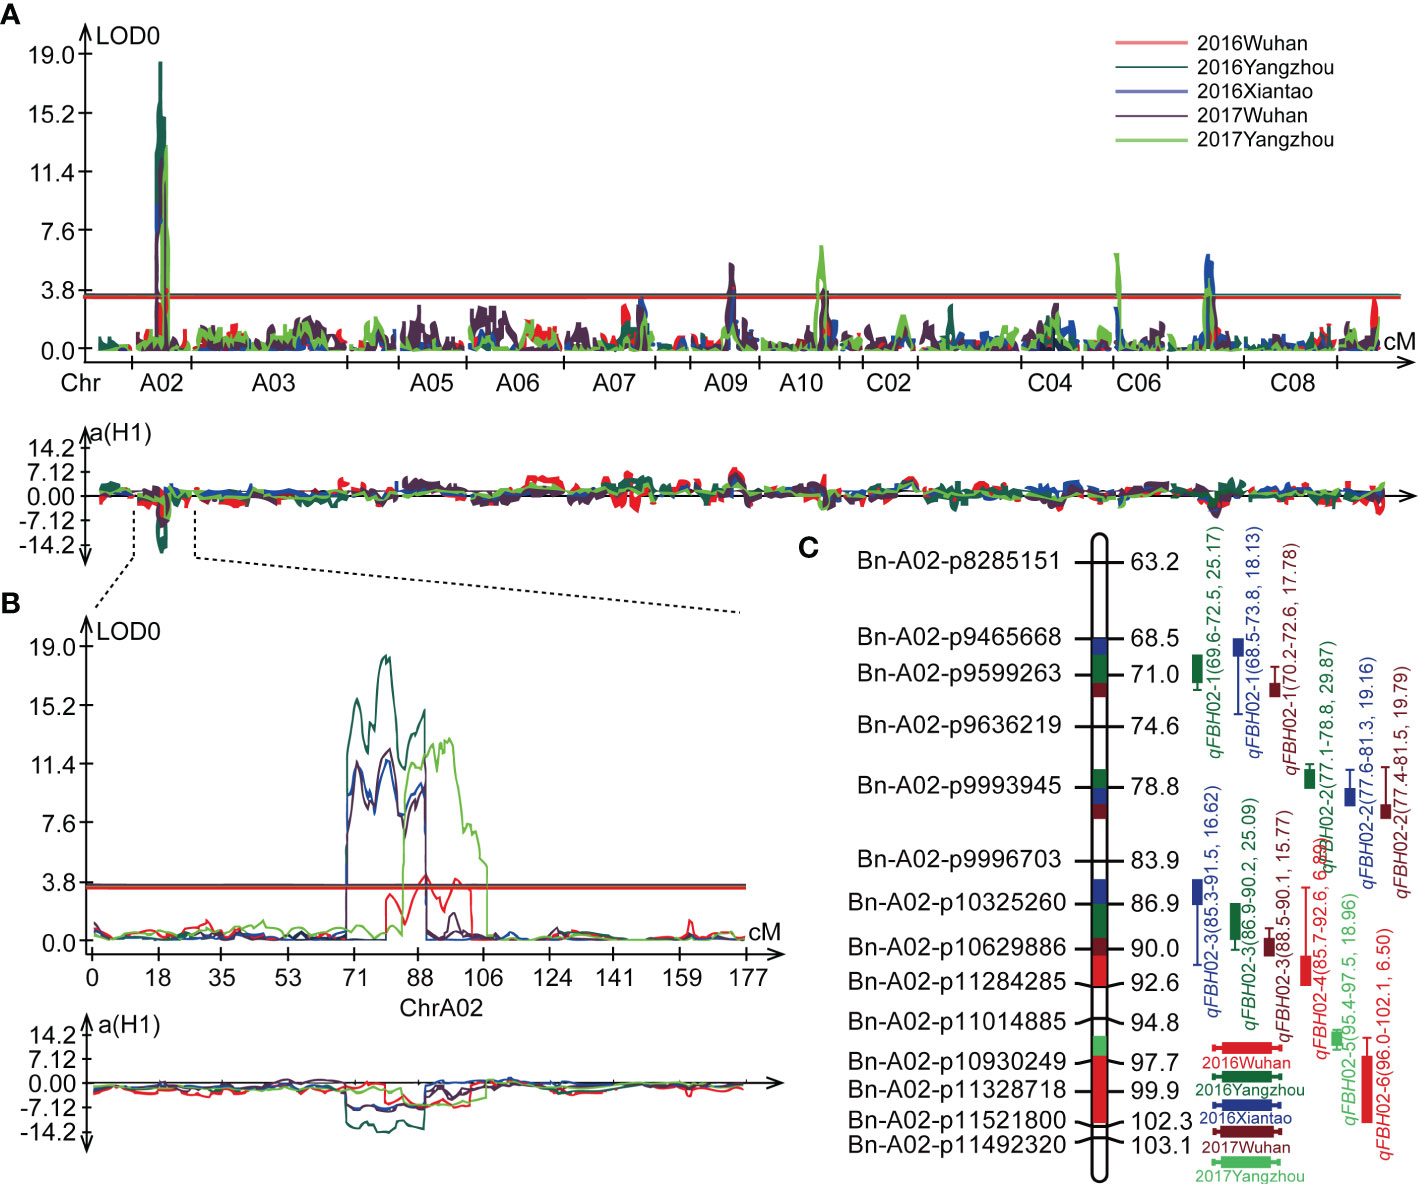
Figure 3 Quantitative trait loci (QTL) identification for FBH in five environments. (A) QTL distribution on the whole genome; diverse colors represent the QTL identified in different environments. (B) Localization of the identified QTLs on linkage group A02 in different environments. (C) Genetic markers and QTL localizations on linkage group A02.
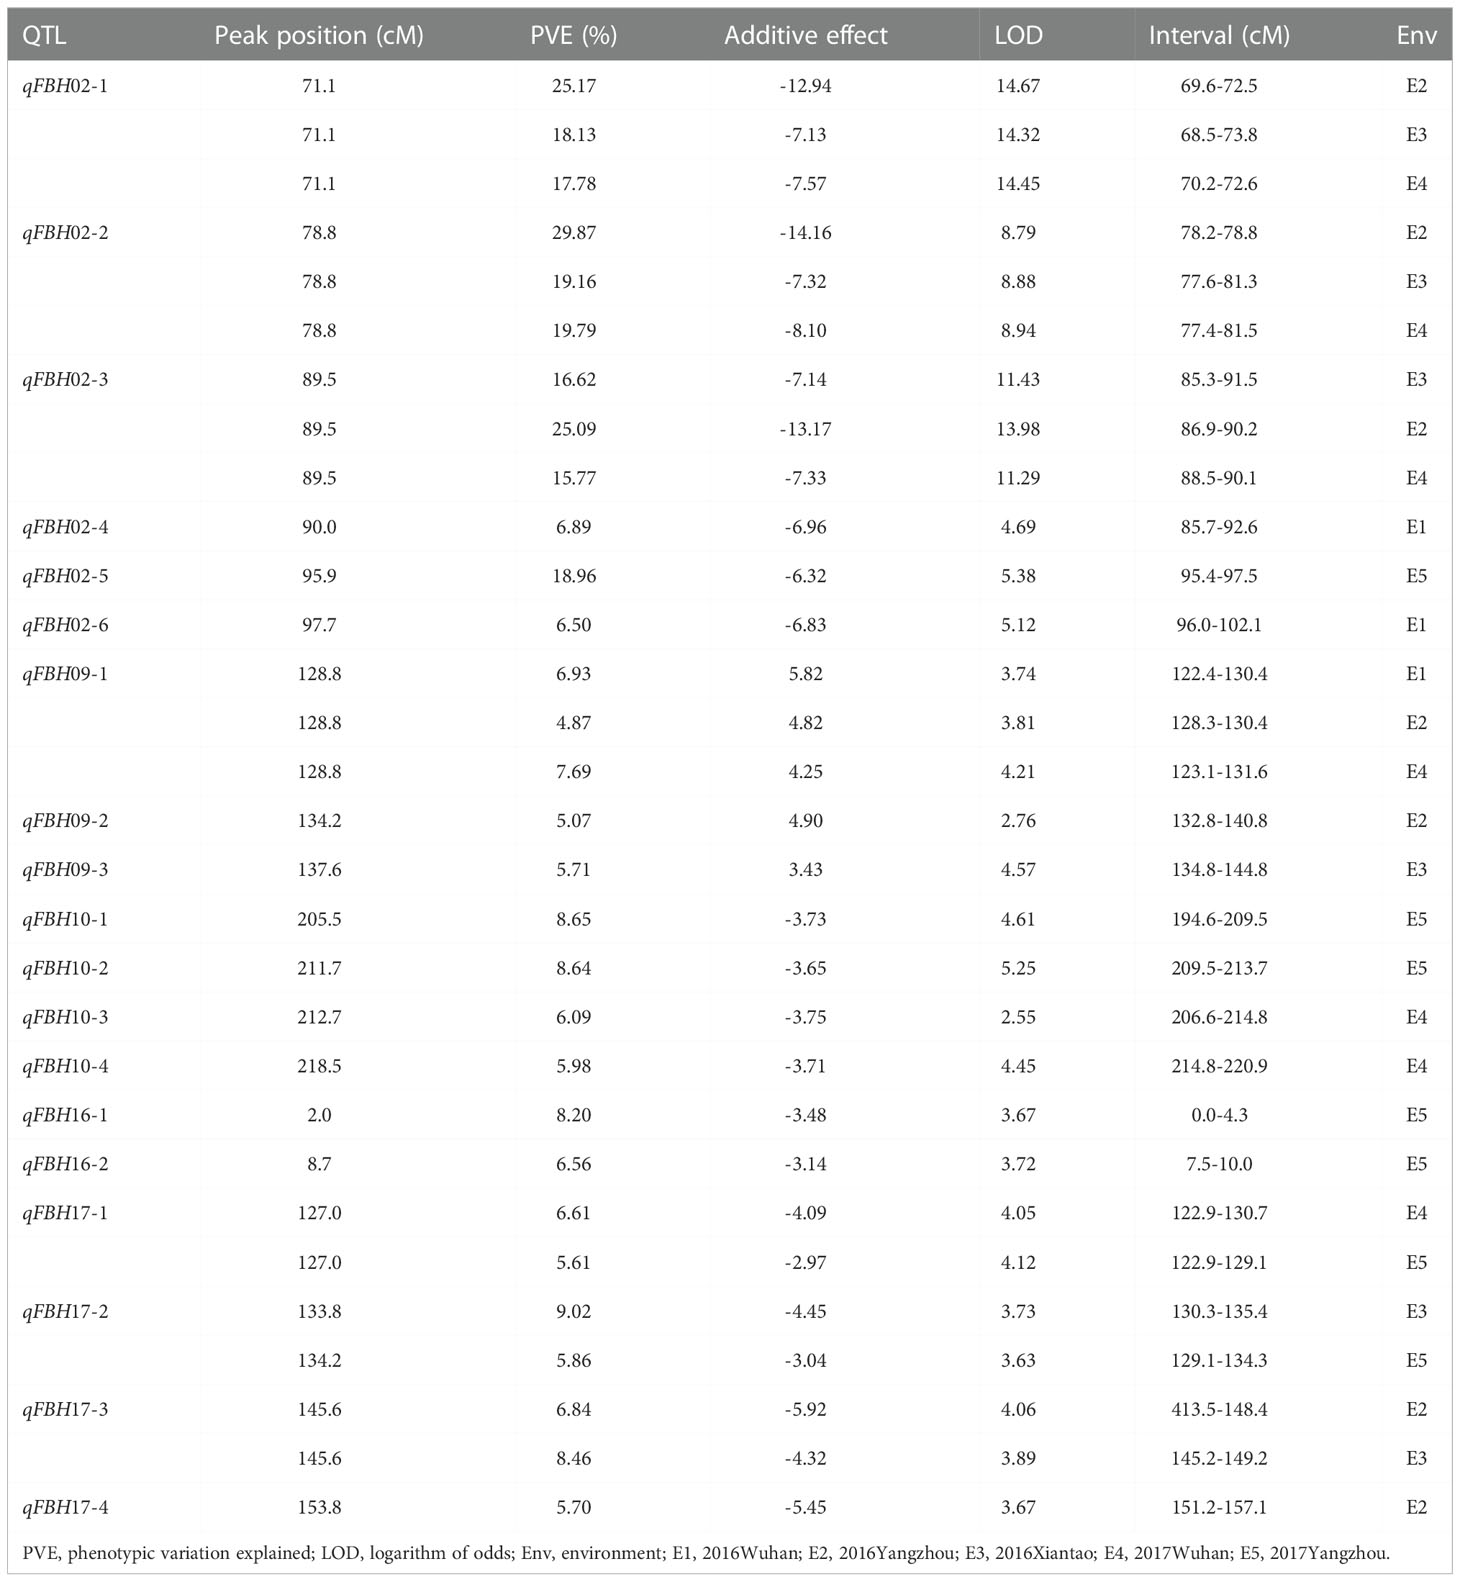
Table 2 Putative QTLs for rapeseed FBH in RIL population under different environments.
Overlaps between linkage and association mapping
Integrated linkage and association mapping results, showed that the 26 significant SNP loci in GWAS and qFBH02-3 obtained via linkage mapping had overlapping regions (Figure 4A), which indicated that the overlapped region could be considered the major QTL for FBH trait. LD decay analysis of 324 rapeseed germplasm resources showed that the decay distances (r2 > 0.2) of sub-genomes A and C were approximately 20 kb and 60 kb, respectively (Figure 4B). The attenuation distance of sub-genome A was significantly smaller than that of sub-genome C, indicating that sub-genome A had a higher degree of chromosome variation and genetic diversity, whereas sub-genome C was more stable. Simultaneously, LD heatmap analysis 60 Kb upstream and downstream of the significant SNPs revealed that three tightly linked blocks within an interval of 6.89 - 7.12 Mb on chromosome A02, named qA02.FBH (Figure 4C).
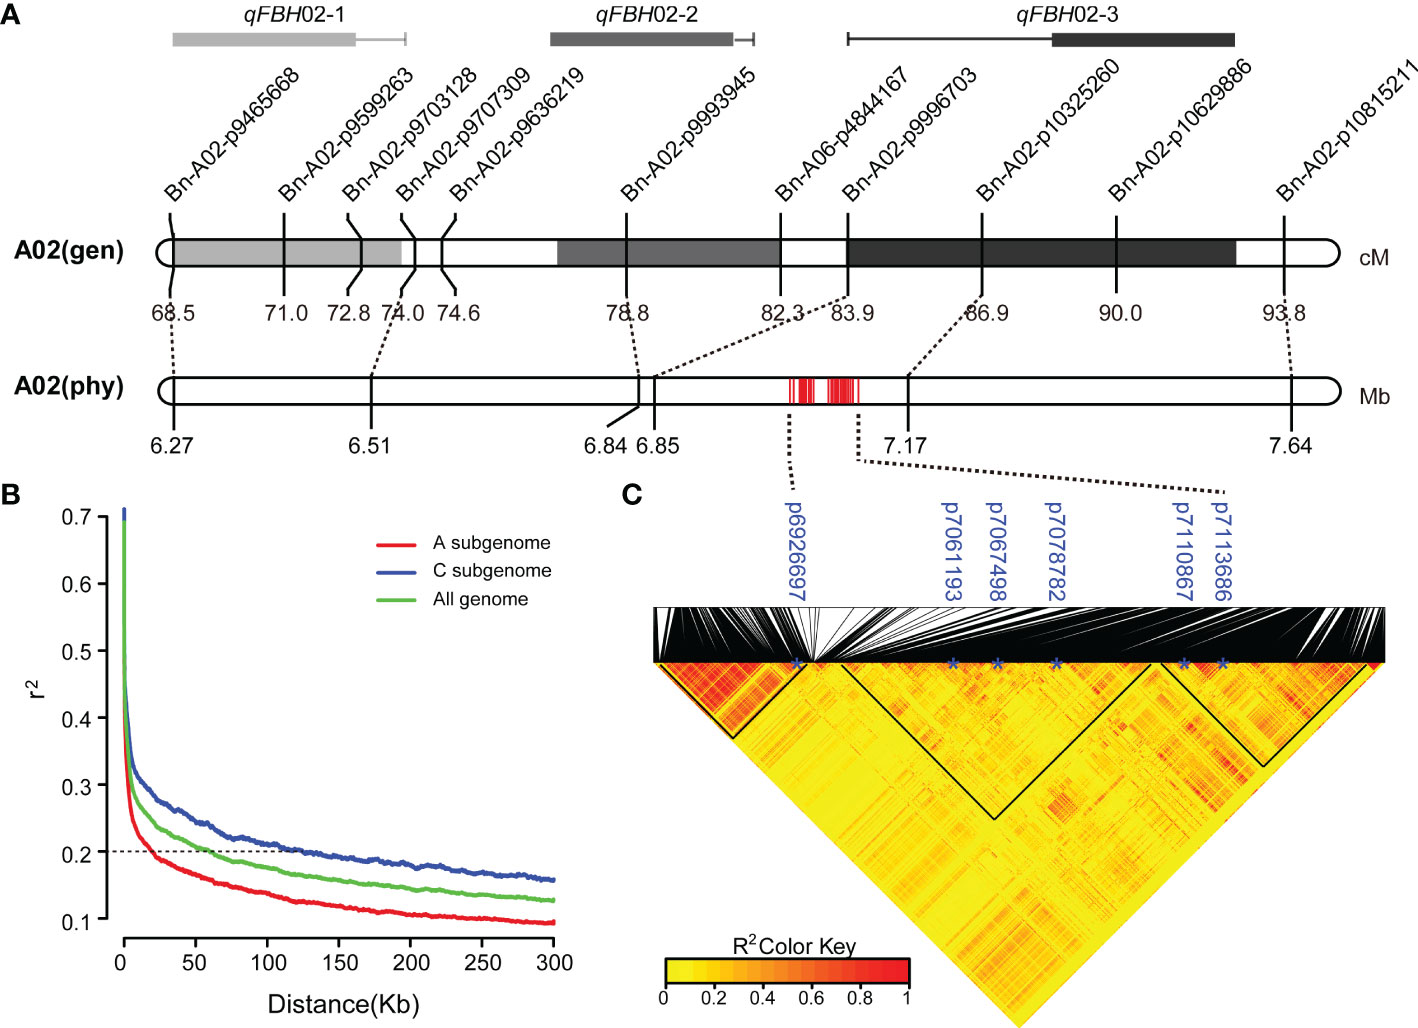
Figure 4 Co-localization of qA02.FBH. (A) The genetic location corresponds to the physical location. (B) Linkage disequilibrium (LD) decay of the (A, C) subgenomes and the whole genome. (C) LD heatmap surrounding the peak on A02. The black triangles represent closely linked loci.
Candidate gene predictions
The qA02.FBH region covers 230 kb and contains 31 annotated genes according to the reference genome annotation (Darmor-bzh), three of which (BnaA02g12830D, BnaA02g12900D, and BnaA02g12930D) with several hundreds of nucleotides had no orthologous genes in Arabidopsis. Four genes, BnaA02g12770D, BnaA02g12780D, BnaA02g12910D, and BnaA02g13070D, encoded unknown proteins. The remaining genes encoded functional proteins, including four pairs of genes (BnaA02g12870D and BnaA02g12880D, BnaA02g12940D and BnaA02g12950D, BnaA02g12980D and BnaA02g12990D, BnaA02g13030D and BnaA02g13040D) had the same functions as orthologous gene in Arabidopsis (Supplementary Table 7). At the DNA level, the SNP and InDel variations of the qA02.FBH between the two parents were analyzed using deep re-sequencing data (Figure 5A). In total, 1,398 variations were identified, most of which were located in the intergenic and intragenic region of the candidate genes, and 114 SNPs and 10 InDels resulting in missense mutations and frameshift or codon changes in the coding region, respectively (Supplementary Tables 8, 9).
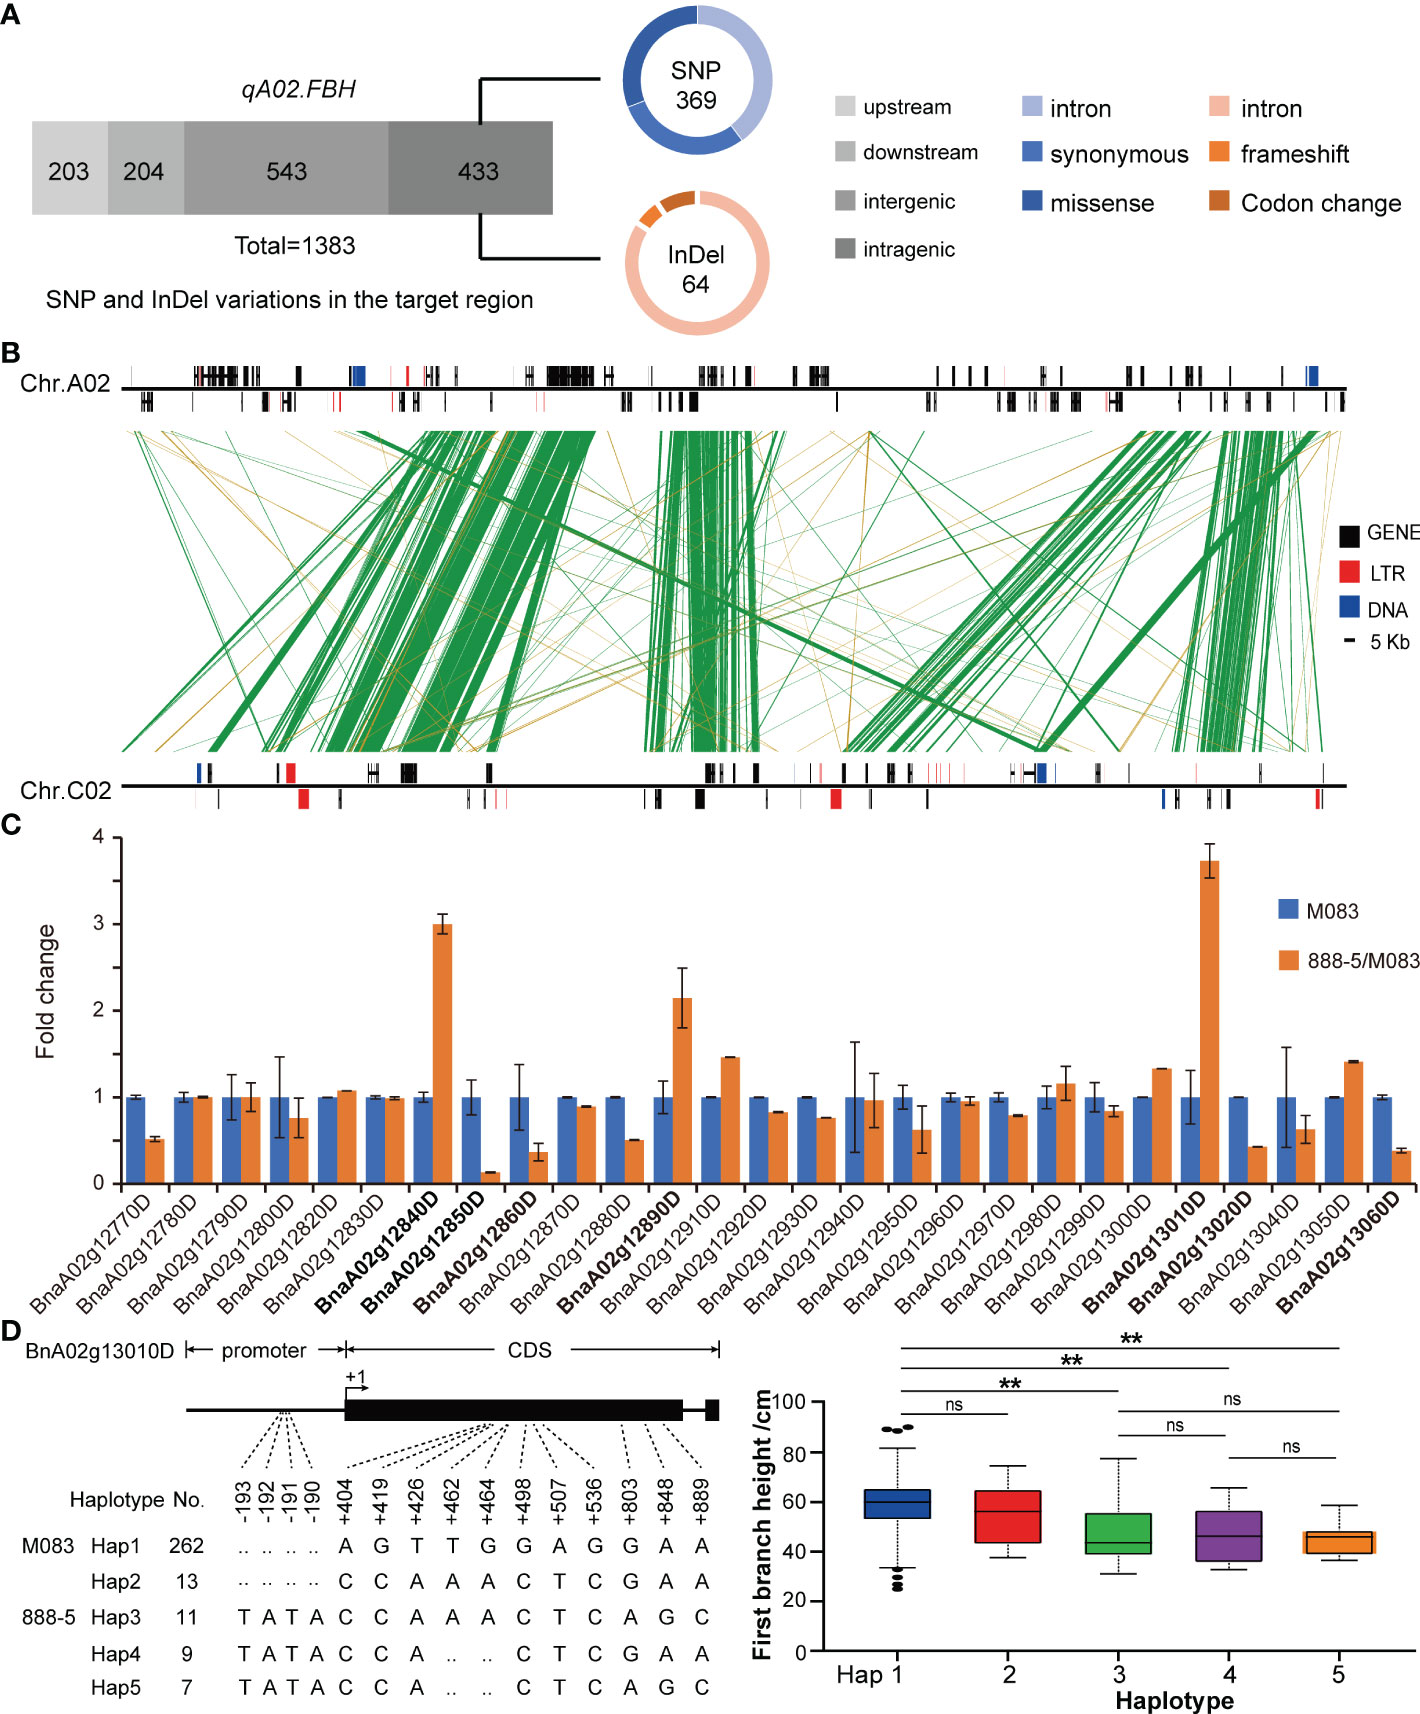
Figure 5 Candidate gene prediction via manifold analysis. (A) The identified variations in qA02.FBH. (B) Synteny analysis for qA02.FBH between subgenomes. (C) Expression levels of annotated genes in qA02.FBH. (D) Haplotype analysis of BnaA02g13010D based on association population in BLUP. Data are presented as means ± SD. The double asterisks represent a significant difference determined via Student’s t-test at P < 0.01. ns represents no significance.
Synteny analysis revealed that, the syntenic block of qA02.FBH ranged from 12,397,768 to 13,133,808 bp on chromosome C02 (Figure 5B). There was no syntenic genes for BnaA02g12830D, BnaA02g12840D, BnaA02g12890D, BnaA02g12910D, BnaA02g12920D, and BnaA02g12940D in the syntenic block (Table 3). In contrast, there were no QTLs or significant SNPs identified in the syntenic block based on the association and linkage mapping results (Figures 2A, 3A), suggesting that these six genes should be considered as candidate genes. Simultaneously, seven genes, BnaA02g12840D, BnaA02g12850D, BnaA02g12860D, BnaA02g12890D, BnaA02g13010D, BnaA02g13020D, and BnaA02g13060D, were differentially expressed between SAM tissues of the two parents, as demonstrated using RT-qPCR (Figure 5C; Table 3). The variations and haplotype results of above eleven genes revealed that BnaA02g13010D had TATA variation in the promoter region, resulting in a significant difference in BLUP (Figure 5D; Table 3). A BLAST search revealed that BnaA02g13010D was annotated as a transcription factor with a TCP (TB1, CYC, PCF) domain (BnaA02.TCP1) gene in BRAD (http://brassicadb.cn/), and its homologous genes were associated with plant architecture in Arabidopsis (Guo et al., 2010; Gao et al., 2015) and maize (Dixon et al., 2020).
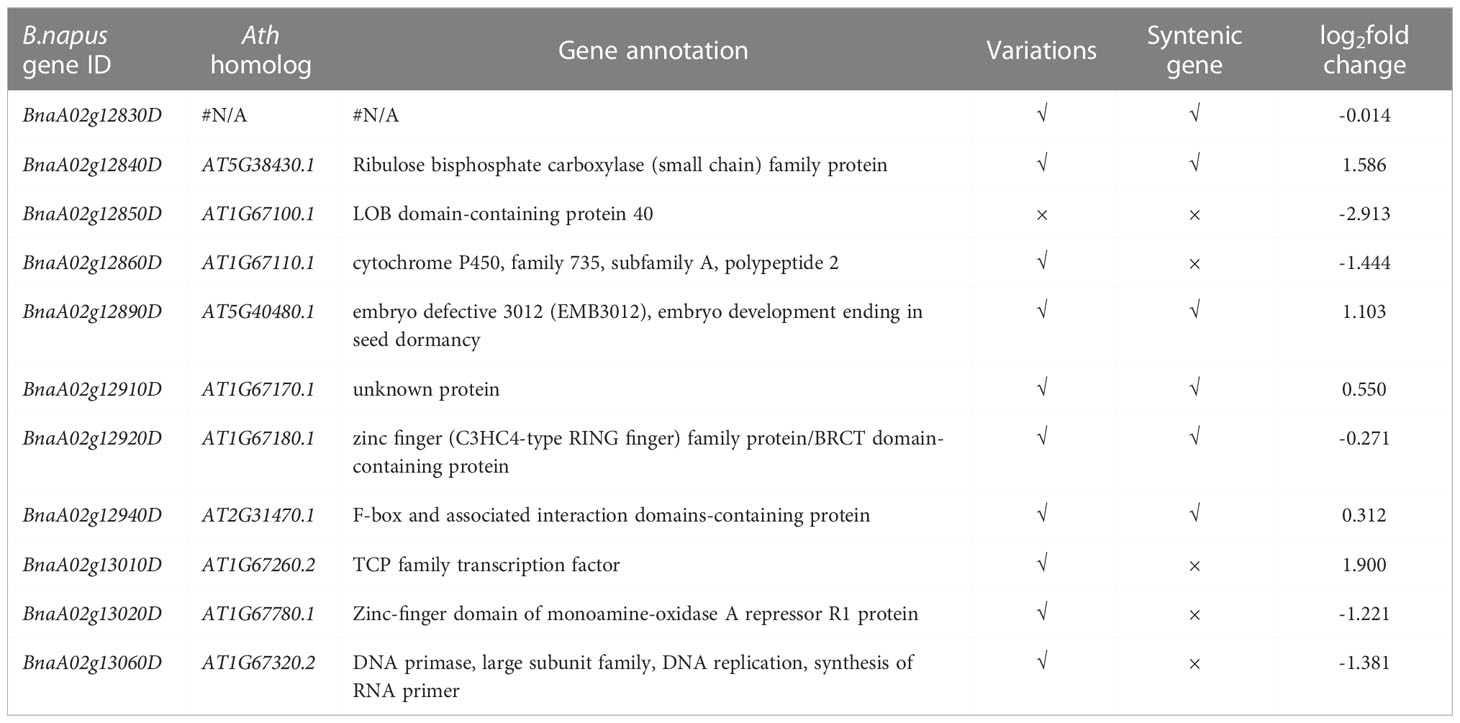
Table 3 Candidate genes for FBH in the qA02.FBH interval.
BnaA02.TCP altered plant architecture in transgenic Arabidopsis
Sequencing results showed that BnaA02.TCP1M083 had a TATA deletion in the promoter region and 14 missense mutations in the coding region compared with BnaA02.TCP1888-5 (Figure 6A; Supplementary Figure 1).BnaA02.TCP1 expression was higher in 888-5 SAM than in M083 SAM (Figure 5C). Consequently, an overexpression (OE) vector containing BnaA02.TCP1M083 was transferred into wild-type Arabidopsis (col-0). Transgenic lines were validated by qRT-PCR and three highly expressed lines were randomly selected for phenotyping (Supplementary Figure 2). At the mature stage, BnaA02.TCP1M083-OE transgenic plants exhibited higher FBH and more branches than the wild type plants (Figures 6B-D). Phylogenetic tree analysis of BnaA02.TCP1 showed that AtTCP1 was most similar in sequence, suggesting that they are homologous and perform the same function. These findings implied that BnaA02.TCP1 may respond to rapeseed plant architecture development, as in Arabidopsis.
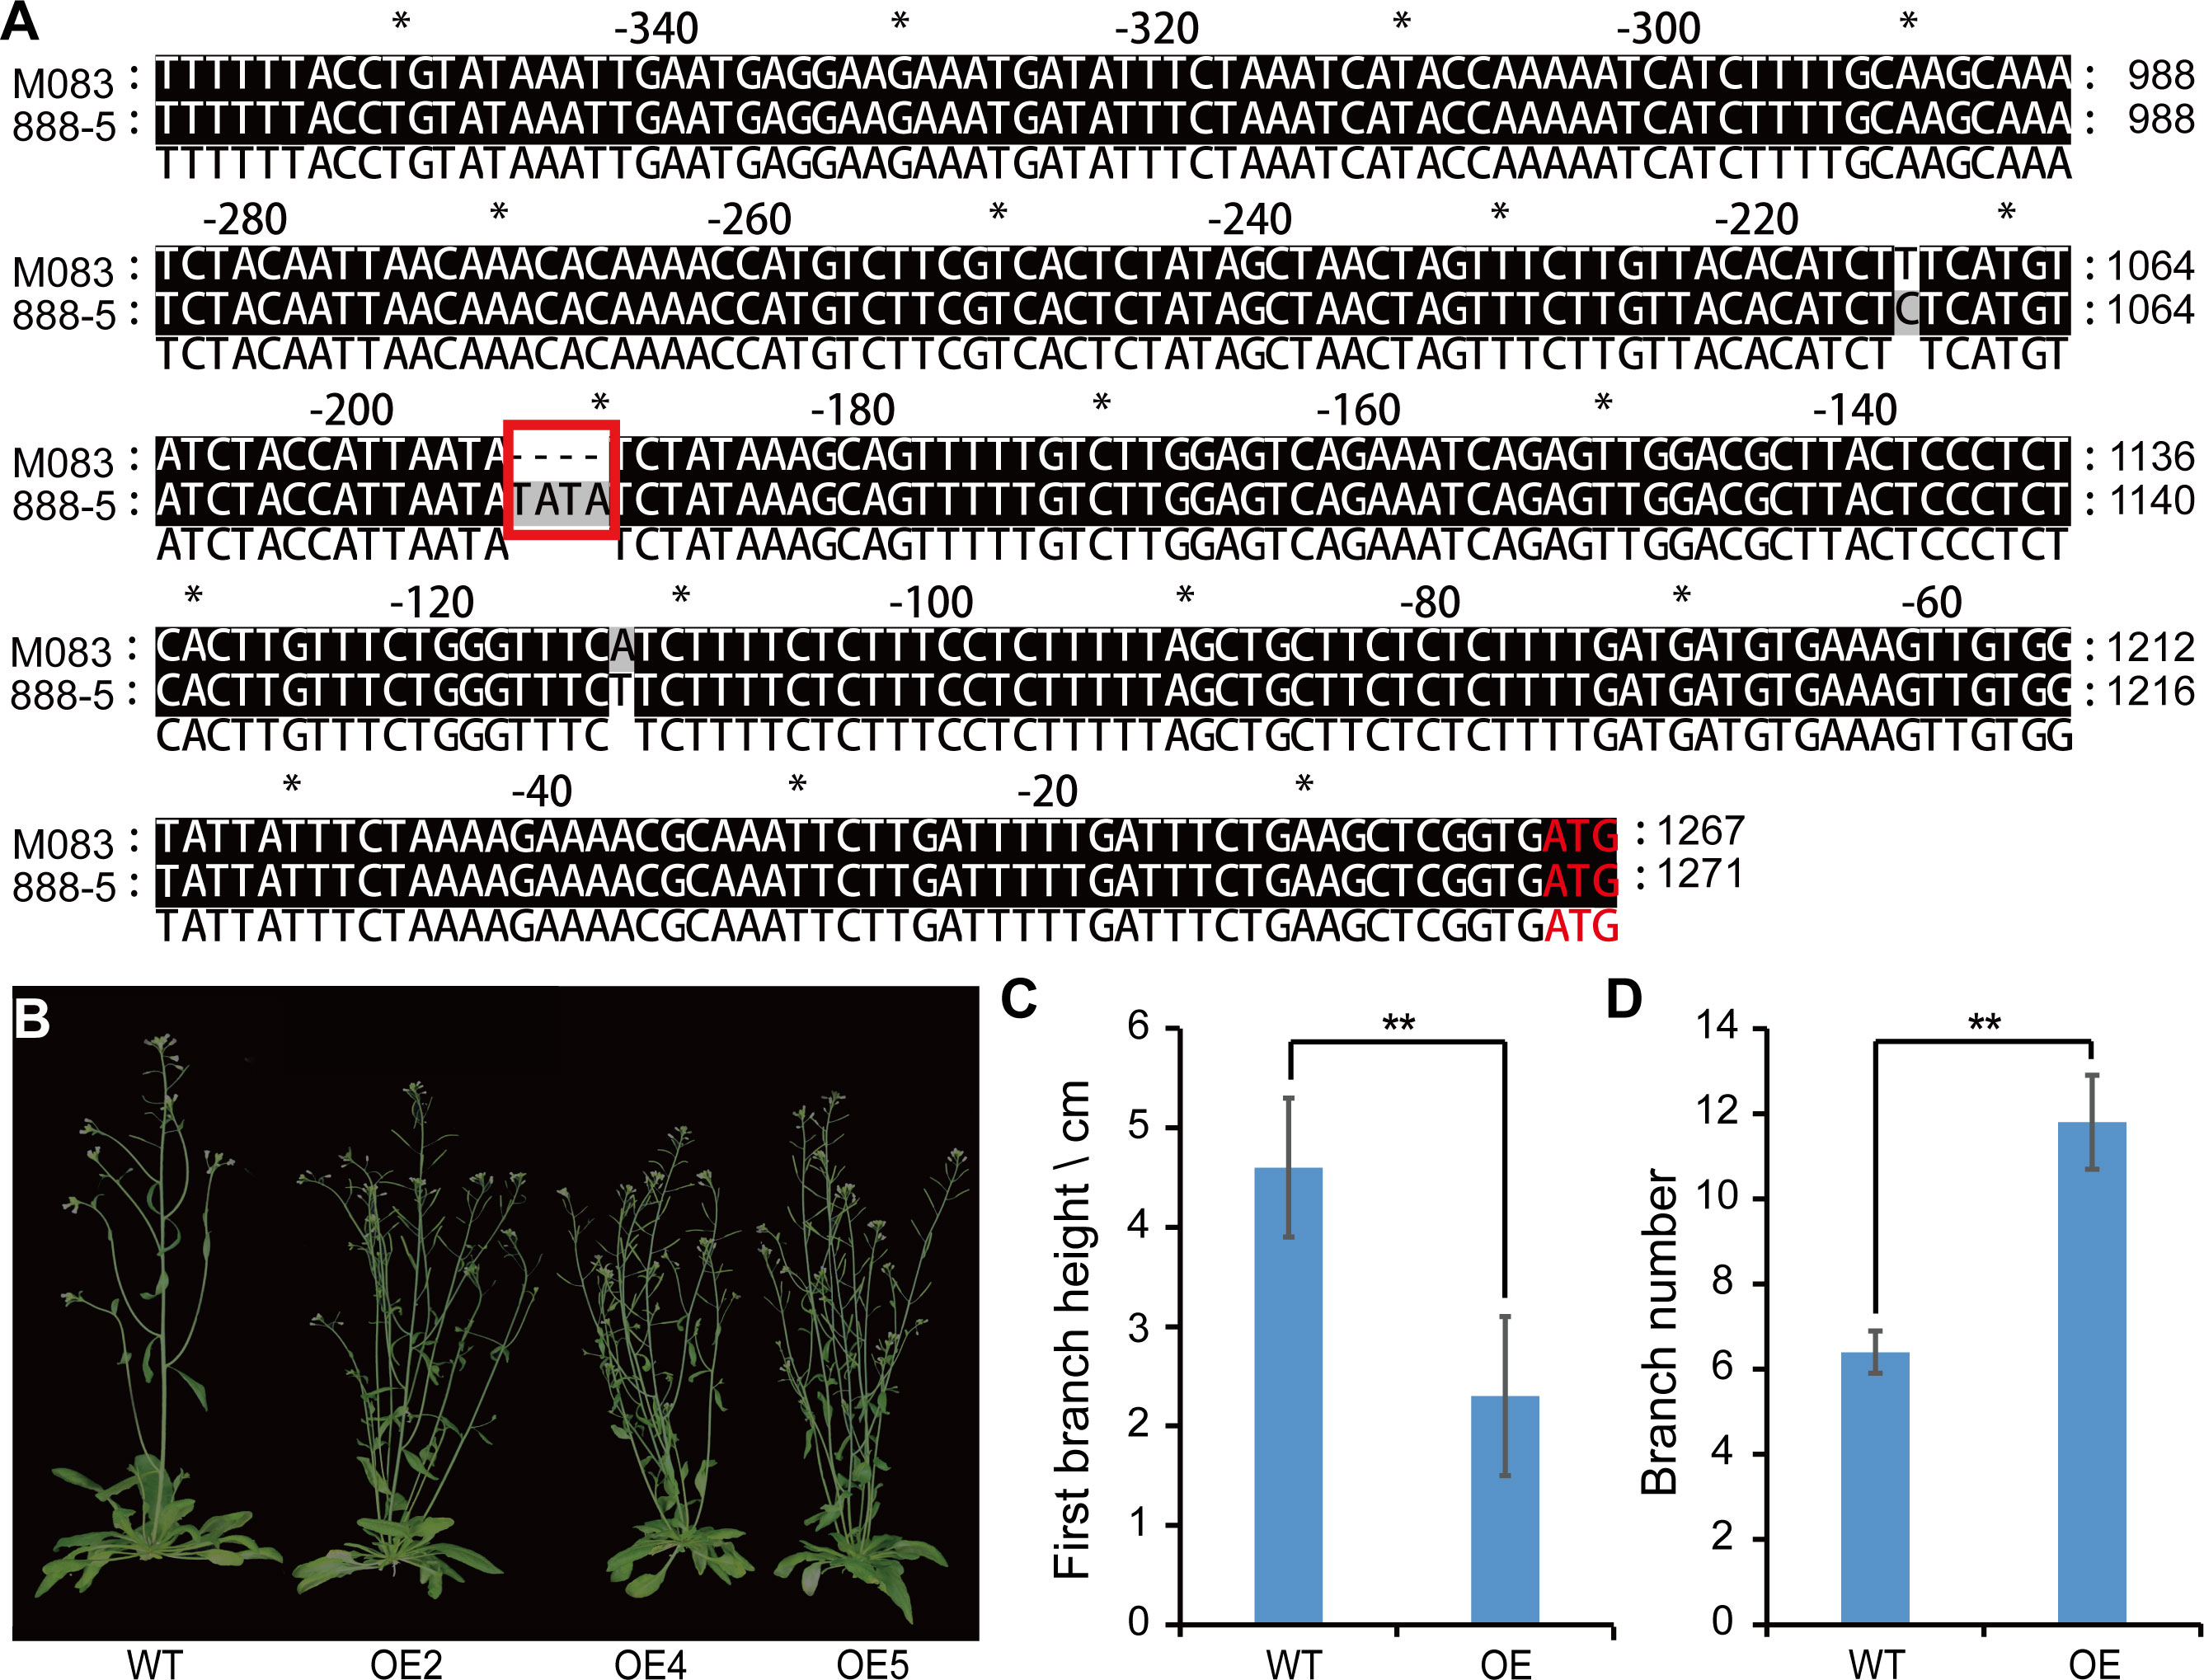
Figure 6 Sequence analysis and phenotypic comparison of wild type (WT) plants and the BnaA02.TCP1M083-OE lines in Arabidopsis. (A) Alignment of BnaA02.TCP1 promotor sequences between 888-5 and M083. The red rectangle represents the nucleotide change between 888-5 and M083. (B) Phenotype comparison of WT and BnaA02.TCP1M083 overexpression (OE) lines in Arabidopsis at the grain filling stage. (C, D) Digital comparison of (C) FBH and (D) branch number between WT and OE lines in Arabidopsis. Data are presented as means ± SD (n = 10). The double asterisks represent a significant difference determined using Student’s t-test at P < 0.01.
Discussion
Comparisons with previous study of FBH
Improvements in traits of agronomic importance are the primary objective of crop improvement programs. Most agronomic traits are controlled by complex or quantitative loci (Abe et al., 2012). With the increase in rapeseed yield demand, labor cost, and decrease of farmer profits, many challenges require a quantum leap in seed yield, reducing yield loss caused by biotic and abiotic stresses, and applying gene editing and genome breeding biotechnology tools (Liu et al., 2022). As a component of plant architecture, FBH is not as important as other traits, such as plant height and flowering time, but it is also a concern for breeders. Appropriate branch height can significantly increase rapeseed yield during practical production (Cai et al., 2016), so the underlying molecular mechanisms must be elucidated. However, only a few studies have reported on FBH in rapeseed, and studied on cloning genes related to FBH still lacking.
Chen et al. (2007) identified 10 QTLs distributed on chromosomes A02, A07, A08, C04, C06, and C07, associated with the height of the lowest primary effective branch using two rapeseed populations. Another study detected four peak SNPs located on chromosomes A02, A07, A08, and A09 using GWAS with 333 collected rapeseed accessions (Zheng et al., 2017). Candidate genes for FBH were identified, but no functional genes discovered or demonstrated. In this study, we used an F10 RIL population derived from M083 × 888-5 cross in QTL analysis of FBH. Nineteen QTLs were identified on chromosomes A02, A09, A10, C06, and C07 (Figure 3A; Table 2). The QTLs located on chromosome A10 were different from QTLs associated with FBH in previous studies, while the QTLs on chromosome A02 were consistent with previous study, which suggests that our results were reliable, novel, and worthy of further investigation. Using the same RIL population, Zhang et al. (2019b) performed QTL mapping for flowering time and Sclerotinia resistance traits. Nineteen QTLs for flowering time and twenty-five QTLs for Sclerotinia resistance were identified. Interestingly, qFBH02-1 and qFBH02-3 identified in the current study co-localized with QTLs controlling flowering time. qFBH02-3 and qFBH02-4 were consistently correlated with the QTLs of Sclerotinia resistance, indicating that qFBH02-3 might have pleiotropic effects on controlling FBH, flowering time, and Sclerotinia resistance.
Association and linkage mapping combination for rapid candidate interval identification
QTL identification, followed by mapping and cloning of candidate genes/QTLs are central to agronomic traits analysis. Linkage mapping, a traditional QTL mapping method, was used to accurately and slowly detect QTL regions with genetic makers. GWAS has been widely used to detect variations associated with complex agronomic traits in natural populations with the development of whole-genome sequencing over last 10 years, which may circumvent the cumbersome procedures for fine mapping (Jaganathan et al., 2020; Wang et al., 2020a). The complex genetic background of allotriploid rapeseed and the agronomic traits usually affected by the environment complicate integral and accurate detection using a single method. Therefore, integrating association and linkage mapping would be quick and accurate. Previous studies have used this approach to map QTL in crops (Sun et al., 2016; Han et al., 2018; Wang et al., 2020b; Zhang et al., 2020). In this study, only a single locus contained 26 SNPs associated with the FBH trait was identified in the natural population with GWAS (Figure 2A), which is very different from linkage mapping results (Table 2). The reasons may be the association population size was small, SNPs with low MAF were filleted out (MAF< 0.05), and trait was influenced by environment (Qiu et al., 2015). Therefore, major QTL could be detected but minor QTLs can’t in small panel size (Si et al., 2016). Meanwhile, these significant SNPs were co-located with qFBH2-3, detected using linkage mapping in multiple environments and exhibited high phenotypic variation (Figure 4). Overall, the findings of the present study suggest that the qA02.FBH interval would be the major QTL for FBH (Figure 4C).
BnaA02.TCP possibly affected rapeseed plant architecture by mediating strigolactone signaling
Hormones are crucial regulators of plant growth and development. Several studies have demonstrated that strigolactone is an important factor that regulates axillary bud growth and a determinant of plant architecture (Doebley et al., 1995; Martín-Trillo and Cubas, 2010; Dixon et al., 2020; Wang et al., 2020c). In plants, it remains unclear which and how genes involved in the strigolactone pathway could be utilized in breeding, but one possibility is that strigolactones regulate transcription of the TCP-domain transcription factor in shoot branching (Dun et al., 2012). In this study, BnaA02.TCP1 was differentially expressed at the transcriptional level in parental SAM tissues owing to TATA variation in the promoter region (Figures 5D, 6A). BnaA02.TCP1M083-OE plants showed lower FBH and more branches compared with wild type in Arabidopsis (Figures 6B-D). Although BnaA02.TCP1 over-expression and loss-of-function in rapeseed and the proteins interactions remain elusive in this study, the above findings are still credible, because rapeseed originates from Arabidopsis (Chalhoub et al., 2014). Therefore, we concluded that BnaA02.TCP1 closely related Arabidopsis TCP proteins, may be involved in strigolactone pathway activity to regulate the growth of rapeseed axillary buds.
Conclusion
In this context, the genetic mechanism underlying FBH was analyzed through multiple strategies (integrating GWAS, linkage mapping, and gene expression analysis) in B. napus. In summary, 26 SNPs and 19 QTLs associated with FBH were identified in 324 accessions and RIL population derived from M083 and 888-5, respectively. Meta-analysis revealed that one unique QTL for FBH was co-located on chromosome A02. An integrated analysis of allelic variations, syntenic genes, and DEGs identified 11 candidate genes for FBH. Among 11 genes, BnaA02g13010D was confirmed as the target gene according to haplotype analysis and full-length gene sequencing, which revealed that TATA insertion/deletion in the promoter region was closely linked to significantly phenotypic differences. BnaA02.TCP1M083 overexpression resulted in decreased branch height and increased branch number in Arabidopsis. Therefore, our data suggested that BnaA02.TCP1 might play important role as regulator of FBH and provided a genetic basis for shaping ideal architecture in B. napus.
Data availability statement
The original contributions presented in the study are publicly available. This data can be found here: NGDC (https://ngdc.cncb.ac.cn/gsa), CRA008925.
Author contributions
ZD, ZL, YX, JH, XCh, and SL designed the research. ZD, CZ, XCu, YL, MT, CT, and JH performed the experiments. ZD and JH analyzed the data. YL provided the materials and phenotypic data. ZD, XCh, and JH wrote and revised the manuscript. All authors contributed to the article and approved the submitted version.
Funding
This research was funded by National Key Research and Development Program of China (2021YFD1600500), Young Top-notch Talent Cultivation Program of Hubei Province for CT, National Natural Science Foundation of China (31770250), and Precursor projects of Guizhou province for biological breeding supporting by science and technology in 2022 (Fine identification and evaluation of crop germplasm resources).
Conflict of interest
The authors declare that the research was conducted in the absence of any commercial or financial relationships that could be construed as a potential conflict of interest.
The reviewer JD declared a shared affiliation with the authors ZD, MT, XC, CZ, CT, YL, JH, XCh, SL to the handling editor at the time of the review.
Publisher’s note
All claims expressed in this article are solely those of the authors and do not necessarily represent those of their affiliated organizations, or those of the publisher, the editors and the reviewers. Any product that may be evaluated in this article, or claim that may be made by its manufacturer, is not guaranteed or endorsed by the publisher.
Supplementary material
The Supplementary Material for this article can be found online at: https://www.frontiersin.org/articles/10.3389/fpls.2022.1080999/full#supplementary-material
Supplementary Figure 1 | Alignment of the deduced amino acid sequence between 888-5 and M083. The red rectangle represents the TCP domain.
Supplementary Figure 2 | Expression levels of BnaA02.TCP1 in wild-type (WT) and transgenic Arabidopsis plants (OE2, OE4, and OE5).
References
Abe, A., Kosugi, S., Yoshida, K., Natsume, S., Takagi, H., Kanzaki, H., et al. (2012). Genome sequencing reveals agronomically important loci in rice using MutMap. Nat. Biotechnol. 30, 174–178. doi: 10.1038/nbt.2095
Cai, G., Yang, Q., Chen, H., Yang, Q., Zhang, C., Fan, C., et al. (2016). Genetic dissection of plant architecture and yield-related traits in Brassica napus. Sci. Re.p. 6, 21625. doi: 10.1038/srep21625
Chalhoub, B., Denoeud, F., Liu, S., Parkin, I. A., Tang, H., Wang, X., et al. (2014). Early allopolyploid evolution in the post-neolithic Brassica napus oilseed genome. Science 345, 950–953. doi: 10.1126/science.1253435
Chen, Y., Dan, Z., Gao, F., Chen, P., Fan, F., Li, S. (2020). Rice GROWTH-REGULATING FACTOR7 modulates plant architecture through regulating GA and indol-3-acetic acid metabolism. Plant Physiol. 184, 393–406. doi: 10.1104/pp.20.00302
Chen, W., Zhang, Y., Liu, X., Chen, B., Tu, J., Fu, T. (2007). Detection of QTL for six yield-related traits in oilseed rape (Brassica napus) using DH and immortalized F2 populations. Theor. Appl. Genet. 115, 849–858. doi: 10.1007/s00122-007-0613-2
Dixon, L. E., Pasquariello, M., Boden, S. A. (2020). TEOSINTE BRANCHED1 regulates height and stem internode length in bread wheat. J. Exp. Bot. 71, 4742–4750. doi: 10.1093/jxb/eraa252
Doebley, J., Stec, A., Gustus, C. (1995). teosinte branched1 and the origin of maize: evidence for epistasis and the evolution of dominance. Genetics 141, 333–346. doi: 10.1093/genetics/141.1.333
Dun, E., De Saint Germain, A., Rameau, C., Beveridge, C. A. (2012). Antagonistic action of strigolactone and cytokinin in bud outgrowth control. Plant Physiol. 158, 487–498. doi: 10.1104/pp.111.186783
Fan, S., Zhang, L., Tang, M., Cai, Y., Liu, J., Liu, H., et al (2021). CRISPR/Cas9-targeted mutagenesis of the BnaA03.BP gene confers semi-dwarf and compact architecture to rapeseed (Brassica napus L.). Plant Biotechnol. J. 19, 2383–2385. doi: 10.1111/pbi.13703
Gao, Y., Zhang, D., Li, J. (2015). TCP1 modulates DWF4 expression via directly interacting with the GGNCCC motifs in the promoter region of DWF4 in Arabidopsis thaliana. J. Genet. Genomics 42, 383–392. doi: 10.1016/j.jgg.2015.04.009
Gou, J., Fu, C., Liu, S., Tang, C., Debnath, S., Flanagan, A., et al. (2017). The miR156-SPL4 module predominantly regulates aerial axillary bud formation and controls shoot architecture. New Phytol. 216, 829–840. doi: 10.1111/nph.14758
Guo, W., Chen, L., Chen, H., Yang, H., You, Q., Bao, A., et al. (2020). Overexpression of GmWRI1b in soybean stably improves plant architecture and associated yield parameters, and increases total seed oil production under field conditions. Plant Biotechnol. J. 18, 1639–1641. doi: 10.1111/pbi.13324
Guo, Z., Fujioka, S., Blancaflor, E. B., Miao, S., Gou, X., Li, J. (2010). TCP1 modulates brassinosteroid biosynthesis by regulating the expression of the key biosynthetic gene DWARF4 in Arabidopsis thaliana. Plant Cell 22, 1161–1173. doi: 10.1105/tpc.109.069203
Han, K., Lee, H. Y., Ro, N. Y., Hur, O. S., Lee, J. H., Kwon, J. K., et al. (2018). QTL mapping and GWAS reveal candidate genes controlling capsaicinoid content in Capsicum. Plant Biotechnol. J. 16, 1546–1558. doi: 10.1111/pbi.12894
Jaganathan, D., Bohra, A., Thudi, M., Varshney, R. K. (2020). Fine mapping and gene cloning in the post-NGS era: advances and prospects. Theor. Appl. Genet. 133, 1791–1810. doi: 10.1007/s00122-020-03560-w
Kuai, J., Li, X., Ji, J., Li, Z., Xie, Y., Wang, B., et al (2020). Response of leaf carbon metabolism and dry matter accumulation to density and row spacing in two rapeseed (Brassica napus L.) genotypes with differing plant architectures. Crop J. 10, 680–691. doi: 10.1016/j.cj.2021.10.006
Khush, G. S. (2001). Green revolution: The way forward. Nat. Rev. Genet. 2, 815–822. doi: 10.1038/35093585
Liu, K., Cao, J., Yu, K., Liu, X., Gao, Y., Chen, Q., et al. (2019). Wheat TaSPL8 modulates leaf angle through auxin and brassinosteroid signaling. Plant Physiol. 181, 179–194. doi: 10.1104/pp.19.00248
Liu, S., Raman, H., Xiang, Y., Zhao, C., Huang, J., Zhang, Y. (2022). De novo design of future rapeseed crops: Challenges and opportunities. Crop J. 10, 587–596. doi: 10.1016/j.cj.2022.05.003
Liu, S., Wang, H., Zhang, J., Fitt, B. D., Xu, Z., Evans, N., et al. (2005). In vitro mutation and selection of doubled-haploid Brassica napus lines with improved resistance to Sclerotinia sclerotiorum. Plant Cell Rep. 24, 133–144. doi: 10.1007/s00299-005-0925-0
Liu, C., Zheng, S., Gui, J., Fu, C., Yu, H., Song, D., et al. (2018). Shortened basal internodes encodes a gibberellin 2-oxidase and contributes to lodging resistance in rice. Mol. Plant 11, 288–299. doi: 10.1016/j.molp.2017.12.004
Livak, K. J., Schmittgen, T. D. (2001). Analysis of relative gene expression data using real-time quantitative PCR and the 2-∆∆T method. Methods 25, 402–408. doi: 10.1006/meth.2001.1262
Li, M., Yeung, J., Cherny, S., Sham, P. (2012). Evaluating the effective numbers of independent tests and significant p-value thresholds in commercial genotyping arrays and public imputation reference datasets. Hum. Genet. 131, 747–756. doi: 10.1007/s00439-011-1118-2
Li, W., Yu, Y., Wang, L., Luo, Y., Peng, Y., Xu, Y., et al. (2021). The genetic architecture of the dynamic changes in grain moisture in maize. Plant Biotechnol. J. 19, 1195–1205. doi: 10.1111/pbi.13541
Lo, S., Ho, T., Liu, Y., Jiang, M., Hsieh, K., Chen, K., et al. (2017). Ectopic expression of specific GA2 oxidase mutants promotes yield and stress tolerance in rice. Plant Biotechnol. J. 15, 850–864. doi: 10.1111/pbi.12681
Luo, Z., Wang, M., Long, Y., Huang, Y., Shi, L., Zhang, C., et al. (2017). Incorporating pleiotropic quantitative trait loci in dissection of complex traits: Seed yield in rapeseed as an example. Theor. Appl. Genet. 130, 1569–1585. doi: 10.1007/s00122-017-2911-7
Martín-Trillo, M., Cubas, P. (2010). TCP genes: a family snapshot ten years later. Trends Plant Sci. 15, 31–39. doi: 10.1016/j.tplants.2009.11.003
McCouch, S., Cho, Y., Yano, M., Paule, E., Blinstrue, M., Kinosita, T. (1997). Report on QTL nomenclature. Rice Genet. Newsl. 14, 11–13.
Qiu, X., Pang, Y., Yuan, Z., Xing, D., Xu, J., Dingkuhn, M., et al. (2015). Genome-wide association study of grain appearance and milling quality in a worldwide collection of Indica rice germplasm. PloS One 10, e0145577. doi: 10.1371/journal.pone.0145577
Reinhardt, D., Kuhlemeier, C. (2002). Plant architecture. EMBO Reps. 3, 846–851. doi: 10.1093/embo-reports/kvf177
Sarlikioti, V., De Visser, P. H., Buck-Sorlin, G. H., Marcelis, L. F. (2011). How plant architecture affects light absorption and photosynthesis in tomato: towards an ideotype for plant architecture using a functional-structural plant model. Ann. Bots. 108, 1065–1073. doi: 10.1093/aob/mcr221
Schneider, A., Godin, C., Boudon, F., Demotes-Mainard, S., Sakr, S., Bertheloot, J. (2019). Light regulation of axillary bud outgrowth slong plant sxes: sn overview of the roles of dugars and hormones. Front. Plant Sci. 10, 1296. doi: 10.3389/fpls.2019.01296
Shen, Y., Xiang, Y., Xu, E., Ge, X., Li, Z. (2018). Major co-localized QTL for plant height, branch initiation height, stem diameter, and flowering time in an alien introgression derived Brassica napus DH population. Fron. Plant Sci. 9, 390. doi: 10.3389/fpls.2018.00390
Shen, J., Zhang, Y., Ge, D., Wang, Z., Song, W., Gu, R., et al. (2019). CsBRC1 inhibits axillary bud outgrowth by directly repressing the auxin efflux carrier CsPIN3 in cucumber. Proc. Natl. Acad. Sci. U. S. A. 116, 17105–17114. doi: 10.1073/pnas.1907968116
Si, L., Chen, J., Huang, X., Gong, H., Luo, J., Hou, Q., et al. (2016). OsSPL13 controls grain size in cultivated rice. Nat. Genet. 48, 447–456. doi: 10.1038/ng.3518
Sun, F., Liu, J., Hua, W., Sun, X., Wang, X., Wang, H. (2016). Identification of stable QTLs for seed oil content by combined linkage and association mapping in Brassica napus. Plant Sci. 252, 388–399. doi: 10.1016/j.plantsci.2016.09.001
Sun, Z., Su, C., Yun, J., Jiang, Q., Wang, L., Wang, Y., et al. (2019). Genetic improvement of the shoot architecture and yield in soya bean plants via the manipulation of GmmiR156b. Plant Biotechnol. J. 17, 50–62. doi: 10.1111/pbi.12946
Tamura, K., Peterson, D., Peterson, N., Stecher, G., Nei, M., Kumar, S. (2011). MEGA5: molecular evolutionary genetics analysis using maximum likelihood, evolutionary distance, and maximum parsimony methods. Mol. Biol. Evol. 28, 2731–2739. doi: 10.1093/molbev/msr121
Tang, J., Chu, C. (2017). MicroRNAs in crop improvement: fine-tuners for complex traits. Nat. Plants 3, 17077. doi: 10.1038/nplants.2017.77
Teichmann, T., Muhr, M. (2015). Shaping plant architecture. Front. Plant Sci. 6, 233. doi: 10.3389/fpls.2015.00233
Tian, J., Wang, C., Xia, J., Wu, L., Xu, G., Wu, W., et al. (2019). Teosinte ligule allele narrows plant architecture and enhances high-density maize yields. Science 365, 658–664. doi: 10.1126/science.aax5482
Turner, S. (2014). qqman: An R package for visualizing GWAS results using Q-Q and manhattan plots. bioRxiv 005165. doi: 10.1101/005165
Voorrips, R. E. (2002). MapChart: software for the graphical presentation of linkage maps and QTLs. J. Hered. 93, 77–78. doi: 10.1093/jhered/93.1.77
Wang, S., Basten, C., Zeng, Z. (2005). Windows QTL cartographerver. 2.5 (Raleigh, NC: NC State Department of Statistics).
Wang, Q., Hasson, A., Rossmann, S., Theres, K. (2016). Divide et impera: boundaries shape the plant body and initiate new meristems. New Phytol. 209, 485–498. doi: 10.1111/nph.13641
Wang, Y., Jiao, Y. (2018). Axillary meristem initiation-a way to branch out. Curr. Opin. Plant Biol. 41, 61–66. doi: 10.1016/j.pbi.2017.09.001
Wang, Y., Li, J. (2006). Genes controlling plant architecture. Curr. Opin. Biotechnol. 17, 123–129. doi: 10.1016/j.copbio.2006.02.004
Wang, Y., Li, J. (2008). Molecular basis of plant architecture. Annu. Rev. Plant Biol. 59, 253–279. doi: 10.1146/annurev.arplant.59.032607.092902
Wang, Y., Shang, L., Yu, H., Zeng, L., Hu, J., Ni, S., et al. (2020c). A strigolactone biosynthesis gene contributed to the green revolution in rice. Mol. Plant 13, 923–932. doi: 10.1016/j.molp.2020.03.009
Wang, B., Smith, S., Li, J. (2018). Genetic regulation of shoot architecture. Annu. Rev. Plant Biol. 69, 437–468. doi: 10.1146/annurev-arplant-042817040422
Wang, Q., Tang, J., Han, B., Huang, X. (2020a). Advances in genome-wide association studies of complex traits in rice. Theor. Appl. Genet. 133, 1415–1425. doi: 10.1007/s00122-019-03473-3
Wang, T., Wei, L., Wang, J., Xie, L., Li, Y. Y., Ran, S., et al. (2020b). Integrating GWAS, linkage mapping and gene expression analyses reveals the genetic control of growth period traits in rapeseed (Brassica napus L.). Biotechnol. Biofuels 13, 134. doi: 10.1186/s13068-020-01774-0
Wang, J., Yu, H., Xiong, G., Lu, Z., Jiao, Y., Meng, X., et al. (2017). Tissue-specific ubiquitination by IPA1 INTERACTING PROTEIN1 modulates IPA1 protein levels to regulate plant srchitecture in rice. Plant Cell 29, 697–707. doi: 10.1105/tpc.16.00879
Yang, J., Wang, M., Li, W., He, X., Teng, W., Ma, W., et al. (2019). Reducing expression of a nitrate-responsive bZIP transcription factor increases grain yield and N use in wheat. Plant Biotechnol. J. 17, 1823–1833. doi: 10.1111/pbi.13103
Zeng, Z. B. (1994). Precision mapping of quantitative trait loci. Genetics 136, 1457–1468. doi: 10.1093/genetics/136.4.1457
Zhang, C., Dong, S., Xu, J., He, W., Yang, T. (2019a). PopLDdecay: A fast and effective tool for linkage disequilibrium decay analysis based on variant call format files. Bioinformatics 35, 1786–1788. doi: 10.1093/bioinformatics/bty875
Zhang, Z., Ersoz, E., Lai, C. Q., Todhunter, R., Tiwari, H., Gore, M., et al. (2010). Mixed linear model approach adapted for genome-wide association studies. Nat. Genet. 42, 355–360. doi: 10.1038/ng.546
Zhang, X., Guan, Z., Li, Z., Liu, P., Ma, L., Zhang, Y., et al. (2020). A combination of linkage mapping and GWAS brings new elements on the genetic basis of yield-related traits in maize across multiple environments. Theor. Appl. Genet. 133, 2881–2895. doi: 10.1007/s00122-020-03639-4
Zhang, F., Huang, J., Tang, M., Cheng, X., Liu, Y., Tong, C., et al. (2019b). Syntenic quantitative trait loci and genomic divergence for sclerotinia resistance and flowering time in brassica napus. J. Integr. Plant Biol. 61, 75–88. doi: 10.1111/jipb.12754
Zhang, X., Lin, Z., Wang, J., Liu, H., Zhou, L., Zhong, S., et al. (2019c). The tin1 gene retains the function of promoting tillering in maize. Nat. Commun. 10, 5608. doi: 10.1038/s41467-019-13425-6
Zhao, W., Wang, X., Wang, H., Tian, J., Li, B., Chen, L., et al. (2016). Genome-wide identification of QTL for seed yield and yield-related traits and construction of a high-density consensus map for QTL comparison in Brassica napus. Front. Plant Sci. 7, 17. doi: 10.3389/fpls.2016.00017
Zhao, C., Xie, M., Liang, L., Yang, L., Han, H., Qin, X., et al. (2022). Genome-wide association analysis combined with quantitative trait loci mapping and dynamic transcriptome unveil the genetic control of seed oil content in Brassica napus L. Front. Plant Sci. 13, 929197. doi: 10.3389/fpls.2022.929197
Zheng, M., Peng, C., Liu, H., Tang, M., Yang, H., Li, X., et al. (2017). Genome-wide association study reveals candidate genes for control of plant height, branch initiation height and branch number in rapeseed (Brassica napus L.). Front. Plant Sci. 8, 1246. doi: 10.3389/fpls.2017.01246
Zheng, B., Cui, C., Zhang, J., Li, H., Chai, L., Jiang, J. (2019). Correlation analysis of yield per plant and agronomic traits in breeding lines in Brassica napus L. J. Plant Genet. Res. 20, 113–121. doi: 10.13430/j.cnki.jpgr.20180705001
Keywords: Brassica napus, first branch height, RIL, GWAS, TCP1
Citation: Dong Z, Tang M, Cui X, Zhao C, Tong C, Liu Y, Xiang Y, Li Z, Huang J, Cheng X and Liu S (2022) Integrating GWAS, linkage mapping and gene expression analyses reveal the genetic control of first branch height in Brassica napus L. Front. Plant Sci. 13:1080999. doi: 10.3389/fpls.2022.1080999
Received: 26 October 2022; Accepted: 01 December 2022;
Published: 15 December 2022.
Edited by:
Lin Chen, Institute of Animal Sciences, Chinese Academy of Agricultural Sciences, ChinaReviewed by:
Xuehai Zhang, Henan Agricultural University, ChinaJinwu Deng, Oil Crops Research Institute, Chinese Academy of Agricultural Sciences, China
Guo Jian, Yangzhou University, China
Copyright © 2022 Dong, Tang, Cui, Zhao, Tong, Liu, Xiang, Li, Huang, Cheng and Liu. This is an open-access article distributed under the terms of the Creative Commons Attribution License (CC BY). The use, distribution or reproduction in other forums is permitted, provided the original author(s) and the copyright owner(s) are credited and that the original publication in this journal is cited, in accordance with accepted academic practice. No use, distribution or reproduction is permitted which does not comply with these terms.
*Correspondence: Xiaohui Cheng, Y2hlbmd4aWFvaHVpQGNhYXMuY24=; Junyan Huang, aHVhbmdqeUBvaWxjcm9wcy5jbg==
†ORCID: Zhixue Dong, orcid.org/0000-0003-0327-1490
Minqiang Tang, orcid.org/0000-0002-8590-1814
Xiaobo Cui, orcid.org/0000-0002-1583-840X
Chuanji Zhao, orcid.org/0000-0002-2100-2510