
94% of researchers rate our articles as excellent or good
Learn more about the work of our research integrity team to safeguard the quality of each article we publish.
Find out more
ORIGINAL RESEARCH article
Front. Plant Sci. , 01 December 2022
Sec. Plant Abiotic Stress
Volume 13 - 2022 | https://doi.org/10.3389/fpls.2022.1071657
Sorghum has recently attracted much attention for its tolerance in high salt environment. However, the effect and regulatory mechanism of the gibberellic acid (GA3)-mediated alleviation of salt stress in sorghum remains unclear. Herein, we reported that a GA3 concentration of 50 mg/L is optimal for sorghum (“Jitian 3”) development under salt stress. We conducted a whole-transcriptome analysis between GA3-treated and control sorghum leaves under salt stress, and we identified 1002 differentially expressed (DE)-messenger RNAs (mRNAs), 81 DE-long non-coding RNAs (lncRNAs), 7 DE-circular RNAs (circRNAs), and 26 DE-microRNA (miRNAs) in sorghum following GA3 treatment. We also identified a majority of DE-mRNAs and non-coding RNAs (ncRNAs) targets that serve essential roles in phenylpropanoid biosynthesis and plant hormone networks. In addition, we generated a competitive endogenous RNA (ceRNA)-miRNA-target gene network, and 3 circRNAs (circRNA_2746, circRNA_6515, circRNA_5622), 4 lncRNAs (XR_002450182.1, XR_002452422.1, XR_002448510.1, XR_002448296.1) and 4 genes (LOC8056546, LOC8062245, LOC8061469, LOC8071960) probably act as valuable candidates for the regulation of the GA3-mediated alleviation of salt stress in sorghum. Our findings uncovered potential mRNA and non-coding RNAs that contribute to GA3 regulation, thus offering a basis for the future investigation of underlying mechanisms of salt stress in sorghum.
Salinity is a resource-based ecological challenge that is widely distributed, and is a major abiotic stressor affecting crop production everywhere (Song et al., 2011). In salt stress, crop roots cannot efficiently absorb water and nutrients from the soil, which damages plant cells, organs, and tissues, reduces metabolism, and promotes growth inhibition, which, in turn, reducing crop yield and quality (Negrao et al., 2017). Sorghum is an important source for food, brewing, energy, and forage production. It is one of the cereal crops with medium salt-tolerance capacity, and it is of great value to developing and utilizing saline soils. However, sorghum still encounters low emergence and suppressed metabolism in soils with high salt concentrations. Among the economic and efficacious approaches to improving and developing these saline soils is the screening of salt tolerant oil crops (Li et al., 2010). Studies have reported that the effect of salt stress on plant growth can be effectively mitigated to a specific range by the exogenous administration of hormonal gibberellins (Muniandi et al., 2018; Camara et al., 2018). Earlier studies demonstrated that gibberellic acid enhances seed germination, seed salt tolerance and minimizes the salt-mediated inhibition of seedling growth (Muhammad and Eui Shik, 2007; Nasri et al., 2012; Chunthaburee et al., 2014). It was also demonstrated that GA3 administration minimizes the harmful influences of salinity while increasing salinity resistance in plants (Ahmad, 2010). Sorghum (“Jitian 3”) is a salt-tolerant seed cultivar that has been commonly employed in China for over 40-50 centuries in arid, semiarid and water-logged areas. Although the regulatory mechanism behind sorghum response to salt stress is well-reported (Sun et al., 2020; Punia et al., 2021; Wu et al., 2022), the significance of gibberellins in sorghum development and underlying mechanisms under salt stress remains poorly understood.
High-throughput omics tools, such as metabolomics, proteomics and transcriptomics, are critical to determining the transcriptional modulation and metabolic parameters of salinity tolerance. Various plant salt-resistant genes were identified using transcriptome sequencing (Zhang et al., 2013; Zhang et al., 2020; Hussain et al., 2021; Wu et al., 2022). In several early transcriptome analyses of Arabidopsis thaliana, salt stress produced hundreds of differentially expressed genes (DEGs) (Zhang et al., 2013). Zhang et al. (2020) indicated that the Cynanchum auriculatum leaves have a relatively abundant gene expression and regulatory activities that cope with salt stress. Hussain et al. (2021) provided a detailed understanding of how TF pathways and ABA interact to cause stress responses is essential to improve tolerance to drought and salinity stress. Wu et al. (2022) identified important genes related to membrane lipid regulation in sweet sorghum under salt stress by transcriptome analysis. With the application of high-throughput sequencing technology, an increasing number of non-coding RNAs (ncRNAs) including long non-coding RNAs (lncRNAs), circular RNAs (circRNAs) and microRNA (miRNAs), have also been discovered in plant tissues. Such ncRNAs are present in Arabidopsis, wheat, maize and rice, and are known to serve critical functions in multiple biological processes involved in plant growth and stress response (Yu et al., 2019). However, no comprehensive studies have as yet characterized the transcriptome-wide distribution of ncRNA and mRNA in the sorghum, underscoring a novel direction for the ongoing molecular studies on the bottleneck of alleviating salt stress. Herein, our study determined the optimal GA3 concentration required for salt stress alleviation in sorghum (“Jitian 3”). Additionally, we performed a comparative whole-transcriptome analysis of sorghum leaves and identified the differentially expressed ncRNAs (circRNA, lncRNA, miRNA) and mRNAs related to GA3-mediated alleviation of salt stress. Based on these results and the prediction of the target transcript, we established a competitive endogenous RNA (ceRNA) network to indicate key mRNA–miRNA–lncRNA/circRNA interactions. Our findings will enhance our understanding of the role of exogenous gibberellic acid (GA3) in regulating salt tolerance in sorghum.
The homogeneous and healthy sorghum seed cultivar was “Jitian 3”, which was gifted to us by the Agricultural Research Institute in Hebei Province. Our research design followed a factorial format, with 1 salinity concentration (150 mM NaCl) and 5 GA3 concentrations (namely, 0, 25, 50, 75, and 100 mg/L). All experiments were completed three times. Healthy and plump seeds of the same size were disinfected with 1% sodium hypochlorite solution for 15 min, repeatedly rinsed with distilled water, and then placed in a glass petri dish with a cap of 15 cm in inner diameter and a filter paper of 15 cm in diameter. 100 seeds were evenly placed into the dish, and 50 ml of 1/2 Hoagland nutrient solution was injected. Each treatment was repeated 3 times. 10 ml of 150 mm NaCl treatment solution was added to each petri dish, and then the dishes were placed in an incubator with a photoperiod of 12h/12h (day/night) and a temperature of 25°C to promote germination, until the seedlings developed 1 leaf and 1 bud. Next, we planted seeds with similar bud lengths in a plastic tray (50 cm long; 30 cm wide; 5 cm high) with pre-formed air holes on the bottom. Then, all pots (5 cm in top diameter and 2.5 cm in bottom diameter) were filled with quartz sand, and up to 3 seeds were planted per pot approximately 3 cm deep, and 10 ml of GA3 solution of different concentrations was sprayed every 10 days on average. Data and samples were arbitrarily collected on day 40 from 1 of 3 replicates per group. Finally, these samples, along with 0 mg/L (control group) and 50 mg/L GA3 (treated group), were examined and used for further whole-transcriptome analyses.
Plant samples were obtained on day 40 after planting. In total, 6 sorghum leaves were harvested from GA3-treated (GL_A, n= 3) and control plants (GL_B, n= 3) before rinsing with distilled water. We next measured the true leaf dimensions, as well as the leaf length and leaf width. After cleaning, the roots were further rinsed with distilled water before separating the plants into roots, stems, and leaves. The fresh weights were recorded. Dry weights were assessed after the samples were dried in an oven at 70 °C for 72 h until the plant achieved a constant weight for biomass assessment (Dai et al., 2012).
The anatomical observation was performed as reported in the Zhao et al. (2020) publication. Fresh leaves were carved into 1 × 1 cm pieces before being fixed in 2.5% glutaraldehyde at 4°C for at least 4 h, followed by thrice rinsing in 0.1 M phosphate buffer for 15 min each, then another fixing in 1% osmium tetroxide for 4 h, with subsequent dehydration in 100% acetone and acetone that included anhydrous sodium sulfate for 15 min each, prior to embedding in Spurr resin. The specimens were carved again before double-staining with uranyl acetate and lead citrate. The mesophyll cells and chloroplasts were visualized and photographed using a transmission electron microscopy (TEM) (HT7700, HITACHI, Japan).
RNA isolation and qualification of Sorghum leaves were performed according to the previous reports (Sui et al., 2015). Total RNA isolation was done with TRIzol (Thermo Fisher Scientific, MA, USA), as per kit directions. RNA quality evaluations were performed on 1% agarose gels, whereas, RNA purity assessment employed a NanoPhotometer spectrophotometer (IMPLEN, CA, USA). RNA quantification was done with a Qubit RNA Assay Kit in a Qubit 2.0 Fluorometer (Life Technologies, CA, USA), and integrity assessment via the Agilent 2100 Bioanalyzer (Agilent Technologies, Santa Clara, CA, USA).
All sequencing programs were performed by the OE Biotech Co., Ltd (Shanghai, China) (Cao et al., 2022). The circRNA-, lncRNA-, miRNA-, and mRNA-seq details are summarized in a prior publication (Shi et al., 2021). The raw data are in the NCBI Sequence Read Archive (SRA) database, under accession numbers PRJNA878791 and PRJNA858876.
GO analysis was done via Blast2GO and the GO database (Conesa et al., 2005). KEGG network analysis was conducted using the KEGG network database (www.kegg.jp/kegg/kegg1.html) (Kanehisa and Goto, 2000).
To elucidate the association among the mRNAs, miRNAs, lncRNAs, and circRNAs, a ceRNA modulatory axis was generated employing the circRNA/lncRNA−miRNA−mRNA data and the ceRNA hypothesis. The miRNA−mRNA, miRNA−lncRNA, and miRNA−circRNA pairs were estimated via the psRobot (Wu et al., 2012). Pairwise associations among the miRNA−mRNA, miRNA−lncRNA, and miRNA−circRNA relationships were assessed via the Spearman correlation coefficient (SCC) and paired expression profile data (He et al., 2020). The association axis was generated with the Cytoscape software (https://cytoscape.org).
Real-time qRT-PCR was conducted with BIO-RAD CFX Connect™ Optics Module (Bio-Rad, USA). Extracted RNA (1 μg) from sorghum was used to contract cDNA with the superscript first-strand synthesis system (PrimeScript® RT Reagent Kit With gDNA Eraser, TaKaRa, Japan). Primer-BLAST in NCBI (https://www.ncbi.nlm.nih.gov/tools/primer-blast/) was used to design specific primers. GAPDH (circRNA, lncRNA, and mRNA) and U6 (for miRNA) served as the endogenous controls. The employed primer sequences are summarized in Supplemental Table S1.
Data analyses were performed via Student’s t test (two-tailed) using the SPSS v.20 (IBM Corp, Armonk, NY, USA) and GraphPad Prism 8.0 software (GraphPad Inc., La Jolla, CA, USA), and are presented as mean ± SEM. *p < 0.05 and **p < 0.01 indicated significance.
We examined the phenotypic variations of sorghum following exposure to different concentrations of GA3. GA3 application significantly promoted sorghum development at 50 mg/L GA3 treatment (S2) (Figure 1A), and enhanced the values for several characteristics, including leaf width, leaf length, as well as fresh and dry weights (Figure 1B). To further assess the 50 mg/L GA3-mediated effect on sorghum leaf ultrastructure, we examined the mesophyll cells and sorghum leaf chloroplasts via TEM. As depicted in Figure 1C, salt stress closed almost all sorghum leaf stomata in control plants. Interestingly, in the 50 mg/L GA3-treated plants, the stomatal aperture was considerably broader than in controls. Based on our TEM results, the mesophyll cells showed marked deformity under salt stress, and they were abnormally shaped. Moreover, relative to controls, the mesophyll cell ultrastructure in the 50 mg/L GA3–treated leaves and the chloroplasts and starch granules was intact.
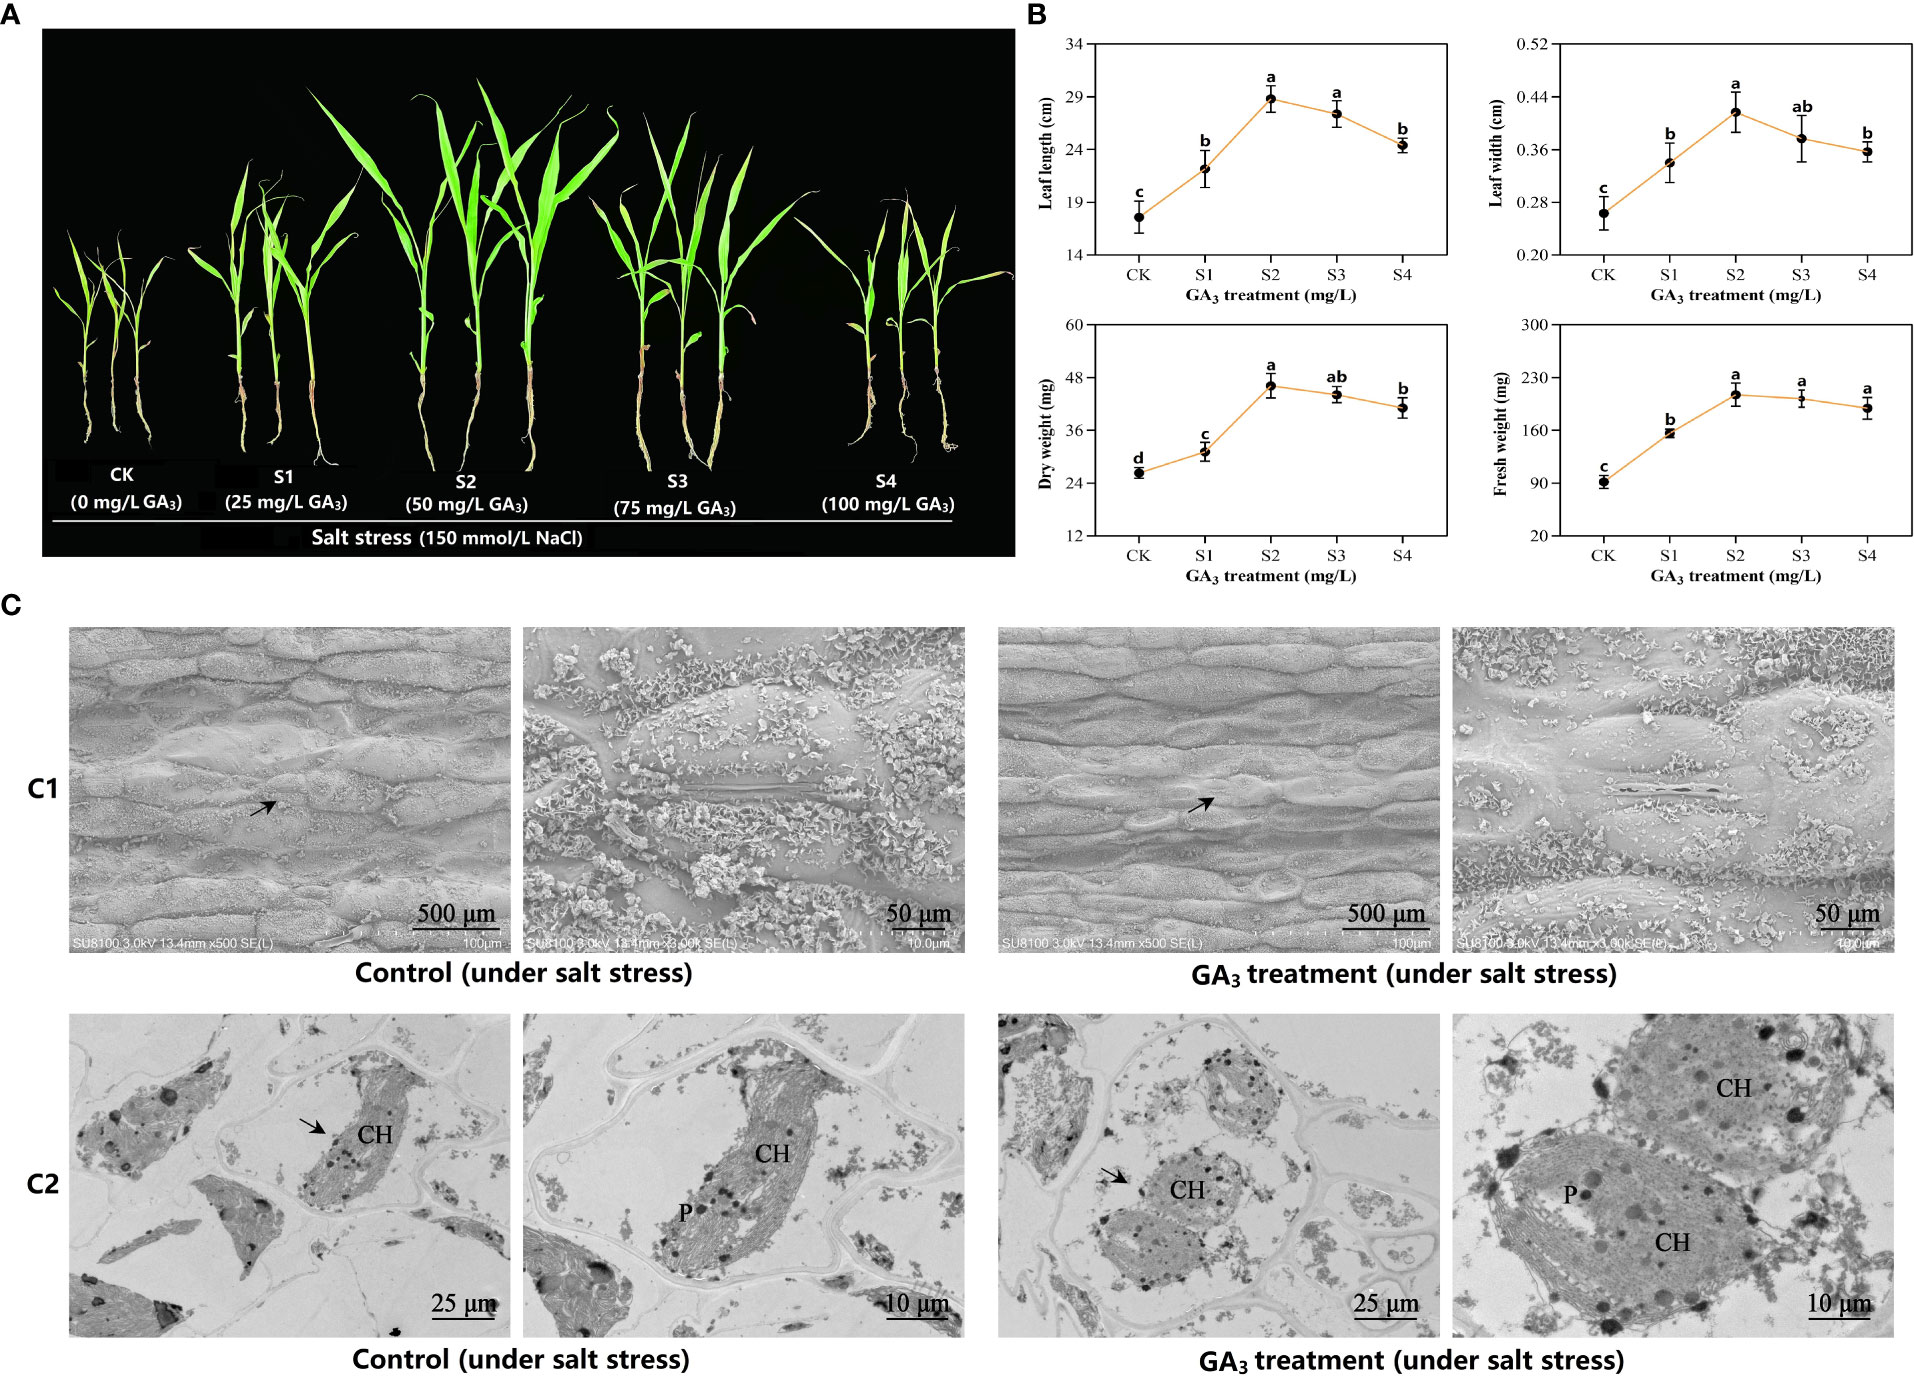
Figure 1 Sorghum phenotypic and leaf ultrastructure differences after exposure to exogenous gibberellic acid (GA3) under salt-stress. (A) Phenotypic observation. All sorghum plants were exposed to 150 mM NaCl to induce salt stress. CK refers to the control plants under salt stress. S1–S4 denotes the experimental leaves with 25 mg/L GA3, 50 mg/L GA3, 75 mg/L GA3, and 100 mg/L GA3 exposure, respectively, under salt stress. (B) Morphologic variations. Six sorghum plants were selected from the GA3-treated (n= 3) and control groups (n= 3) for morphologic evaluation, which included assessment of the plant leaf width, leaf length, as well as fresh and dry weights. All data are provided as mean ± SD, and Superscript distinct small letters represent a marked difference (p< 0.05), whereas, superscript same small letters represent no obvious difference (p> 0.05). (C) The 50 mg/L GA3-mediated regulation of sorghum leaf anatomical structure under salt stress. C1—epidermal structure and stomatal status; C2—cellular ultrastructure. The figure on the right is an enlarged vision of the black arrow-labeled area on the left. CH, chloroplast; P, plastoglobuli.
Employing the Illumina HiSeq 2500 platform, we conducted the whole-transcriptome sequencing of six RNA libraries (GL_A1, GL_A2, GL_A3, GL_B1, GL_B2, and GL_B3). In all, we acquired 304.39 and 305.03 million raw reads and 299.65 and 300.26 million clean reads following filtration from the GL_A and GL_B libraries, respectively (Supplementary Table S2). Post quality control, principal component analysis (PCA) revealed good sample repeatability in each group (Figure 2A), which could be utilized in further analysis. In addition, |log2 (fold change) | > 1 and p ≤ 0.05 served as the standard cut-off for differentially expressed (DE) mRNAs (DE-mRNAs) screenings (Figure 2B). Overall, we identified 1002 DE-mRNAs, among which 576 were highly expressed (57.49%) and 426 were scarcely expressed (42.51%) from the GL_A group (Supplementary Table S3; Figure 2C). The DE-mRNAs expression profiles of both groups were visualized via a heat map. As illustrated in Figure 2D, the GL_A and GL_B DE-mRNAs were separately clustered. However, for each of these, the three replicates were clustered together. To explore the potential roles of these DE-mRNAs, we conducted Gene Ontology (GO) and Kyoto Encyclopedia of Genes and Genome (KEGG) enrichment analyses (Figures 2E, F). Most DE-mRNAs received annotations to GO terms “biological regulation”, “developmental process” and “response to stimulus” under biological process (BP); to “membrane”, “organelle” and “extracellular region” under cellular component (CC); and to “binding”, “antioxidant activity” and “transcription factor activity” under molecular function (MF) (Figure 2E). Based on the KEGG analysis, the DE-mRNAs enrichments were in 97 networks, including 41 strongly enriched KEGG axes (p ≤ 0.05) (Supplementary Table S4; Figure 2F). Among them, the “phenylpropanoid biosynthesis” (ko00940) pathway was markedly enriched in the GL_A and GL_B samples, and this pathway strongly modulates sorghum development and response to salt stress.
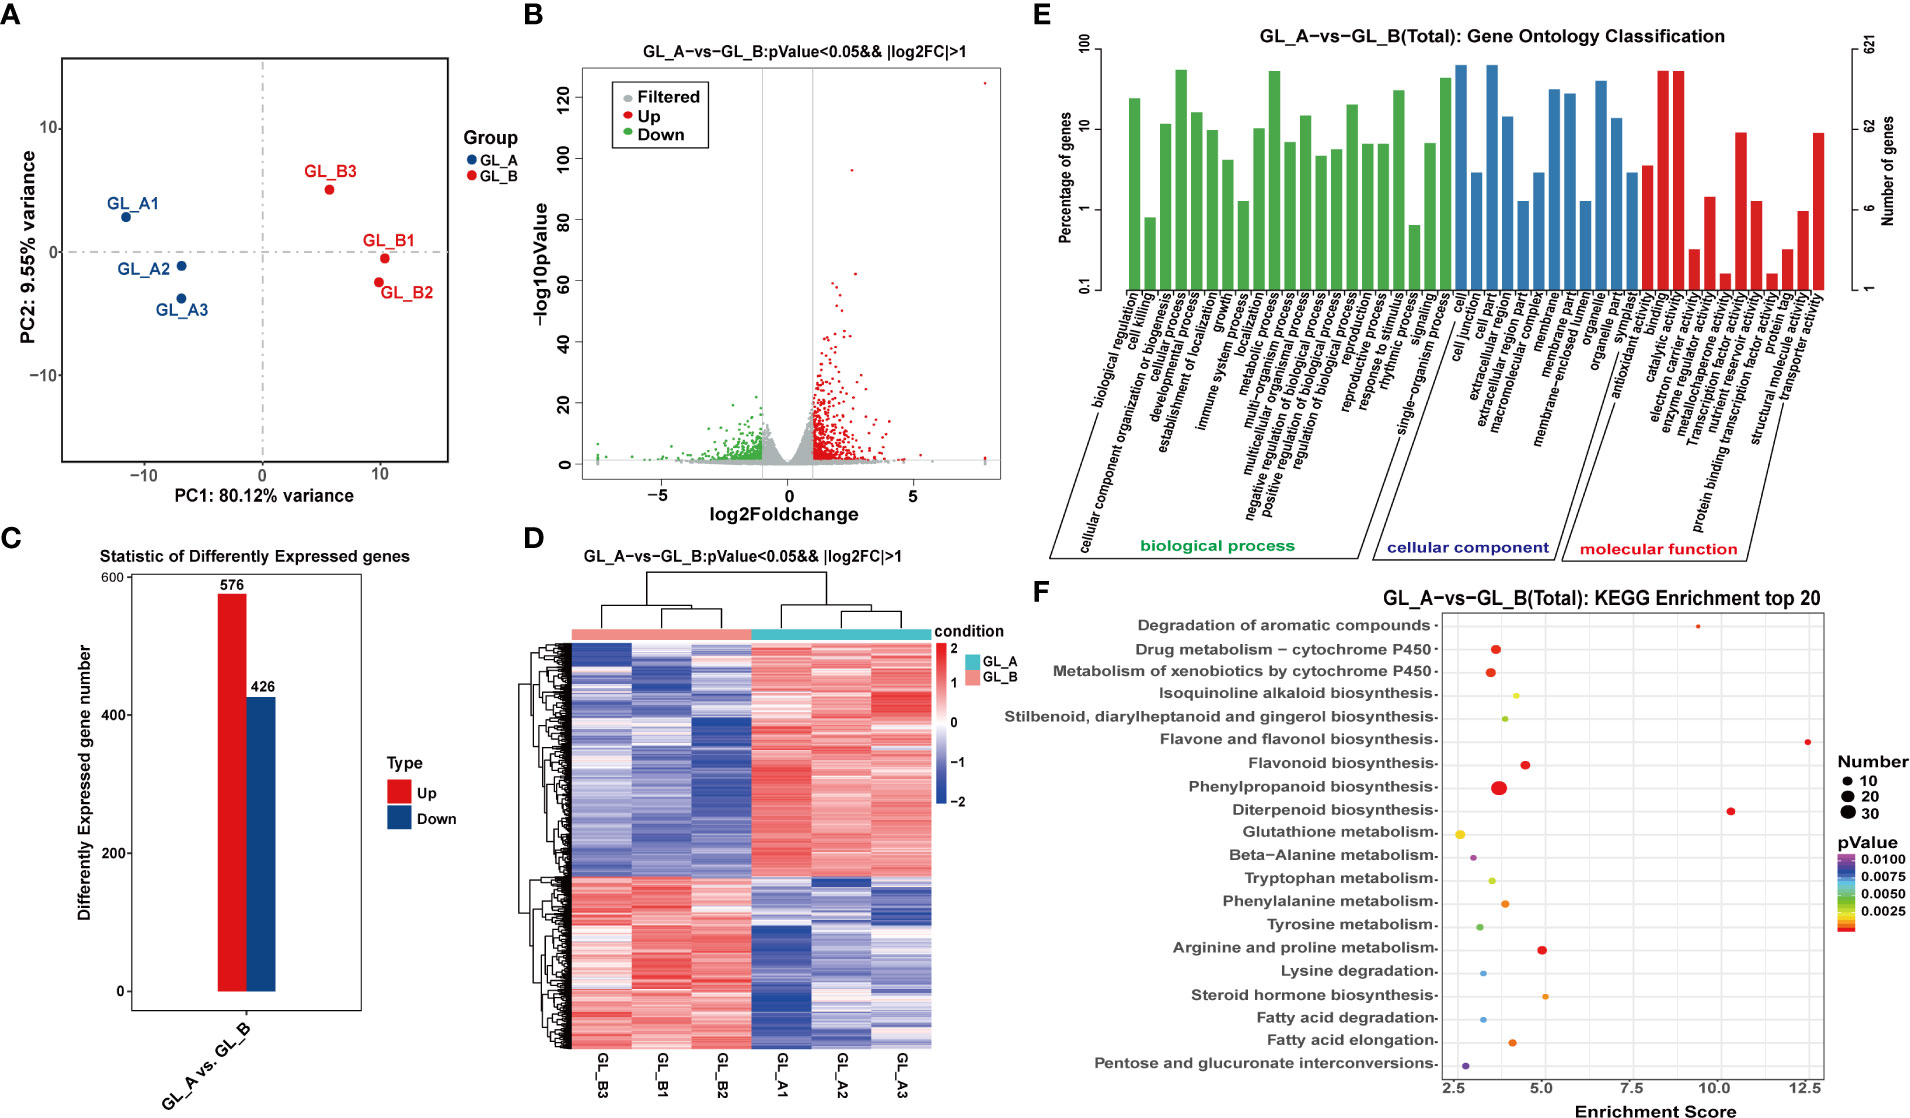
Figure 2 Screening and analysis of the GA3-treated Sorghum (“Jitian 3”) mRNA with under salt stress. (A) Principal Component Analysis (PCA) of GA3-treated (GL_A) and control (GL_B) samples; Blue dots represent GL_A samples, and red dots represent GL_B samples. (B) A volcano plot displaying the differentially expressed mRNAs (DE-mRNA) between the GL_A (n = 3) and GL_B groups (n = 3) based on RNA-seq analysis. Red dots represent upregulated DEGs; green dots represent downregulated DEGs; dotted line represents a screening threshold for DEGs; the x-axis values correspond to the log2 (fold change) value; the y-axis corresponds to the mean expression value of the −log10 (p-value) between the GA3-treated (GL_A) and control (GL_B) groups (fold change = GL_A/GL_B). (C) Statistical analysis of the DE-mRNAs in the GL_A and GL_B samples. (D) Hierarchical cluster analysis of DE-mRNAs among the six mRNA sequencing libraries; Red indicates upregulation, while blue indicates downregulation. GL_A1, GL_A2 and GL_A3 represent the three replications of GA3-treated samples; GL_B1, GL_B2 and GL_B3 represent the three replications of control samples. (E) gene ontology (GO) enrichment analysis; The x-axis shows the second level GO terms from the biological process (BP), cellular component (CC) and molecular function (MF) while the y-axis shows the number and percentage of gene enrichment. (F) Kyoto encyclopedia of genes and genome (KEGG) network enrichment analysis of DE-mRNAs. The x-axis showed an enrichment factor and the y-axis showed the pathway name; the point size represents the number of DE-mRNAs and the point color represents the p-value range.
Along with the mRNAs, we identified 869 lncRNAs employing four methods of CNCI (Sun et al., 2013), CPC (Kong et al., 2007), Pfam (Mistry et al., 2021) and PLEK (Li et al., 2014) for subsequent analyses (Figure 3A). In all, 160 DE-lncRNAs were identified in the GL_A and GL_B samples using the following parameters: | log2 (fold change) | > 1 and p ≤ 0.05. Out of the 160 DE-lncRNAs, 81 were highly expressed (50.62%), and 79 were scarcely expressed (49.38%) in the GL_A group (Figure 3B; Supplementary Table S5). Figure 3C illustrates the expression patterns of the identified DE-lncRNAs. To elucidate the physiological role of DE-lncRNAs, we performed KEGG enrichment analyses of the DE-lncRNA-targeted DE genes (Supplementary Table S6). As shown in Figure 3D, the DE-lncRNAs target genes were strongly enriched in two essential networks, namely, proteasome (ko03050) and plant hormone axes (ko04075).
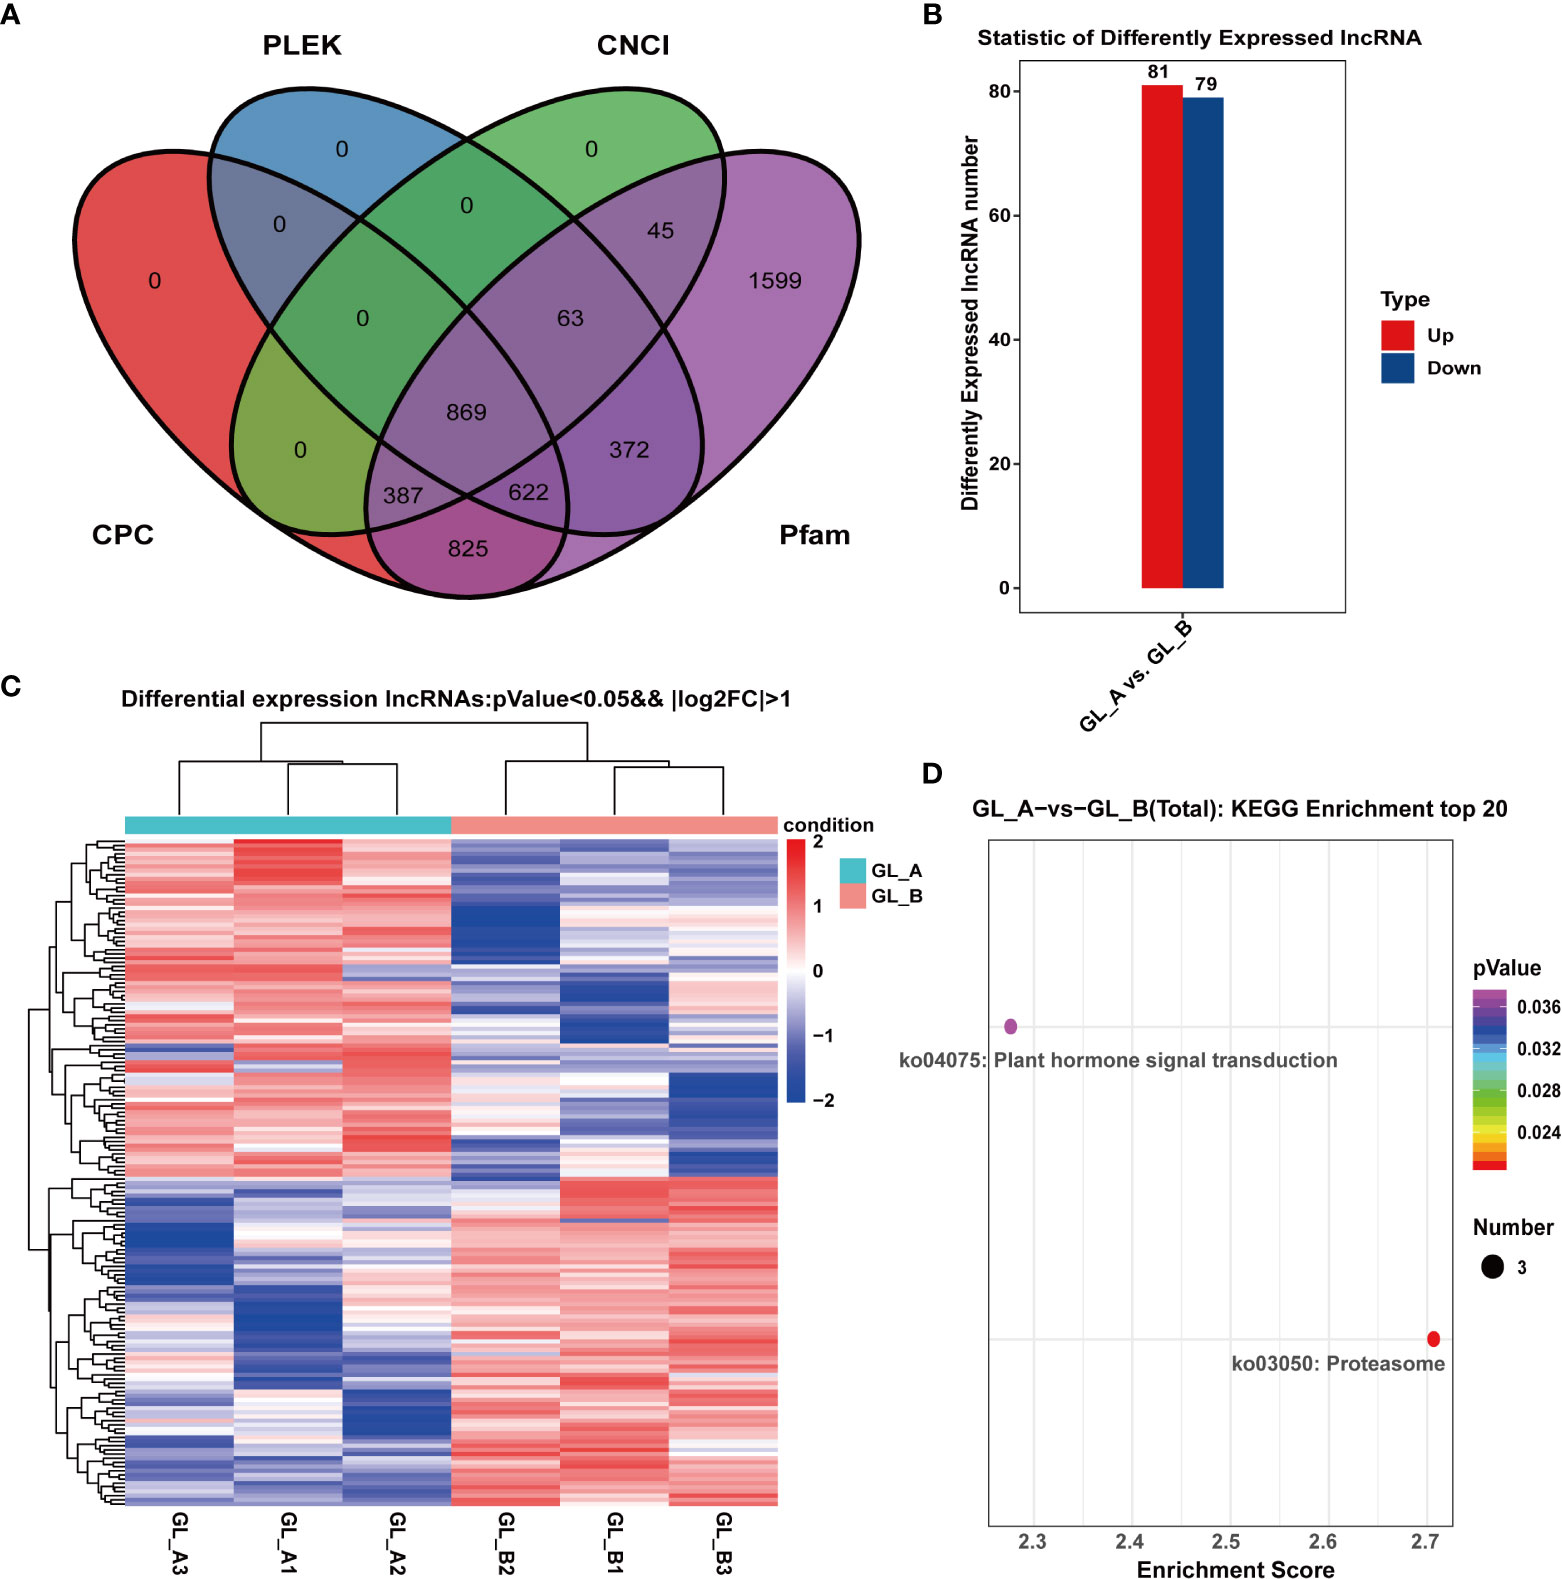
Figure 3 Screening and analysis of long-coding RNAs (lncRNAs) in the GA3-treated Sorghum (“Jitian 3”) with under salt stress. (A) Coding potential analysis of lncRNAs based on four computational approaches (CNCI, CPC, PFAM, and PhyloCSF) by venny software (https://bioinfogp.cnb.csic.es/tools/venny/index.html). (B) Statistical analysis of the differentially expressed lncRNAs (DE-lncRNAs) in the GL_A and GL_B samples; Red dots represent upregulated DE-lncRNAs; blue dots represent downregulated DE-lncRNAs. (C) Heatmap analysis of DE-lncRNAs among the six lncRNA sequencing libraries; Red indicates upregulation, while blue indicates downregulation. (D) KEGG network enrichment analysis for all DE-lncRNA targets. Scatter plot of selected signifcantly targets pathway terms for the 160 diferentially expressed lncRNAs. Counts represent the numbers of DE-lncRNA targets.
LncRNAs cis-regulate nearby genes in order to transcriptionally or post-transcriptionally modulate gene expression (Ponjavic et al., 2009). Based on the genomic assessments of DE-lncRNAs and DE-mRNAs, long (< 5000 bp) DE-mRNAs were more prevalent, relative to the long DE-lncRNAs (Figure 4A). The mean DE-mRNAs open reading frame (ORF) was longer than the mean DE-lncRNAs ORF. The DE-lncRNAs ORFs were estimated to be between 200−300 aa long (Figure 4C), while most DE-mRNAs ORFs were between 400−1400 aa long (Figure 4D). Moreover, the DE-mRNAs on average possessed fewer exons (1–2), compared to the DE-lncRNAs (Figure 4B), and the DE-mRNAs expressions were elevated, compared to the DE-lncRNAs (Figure 4E).
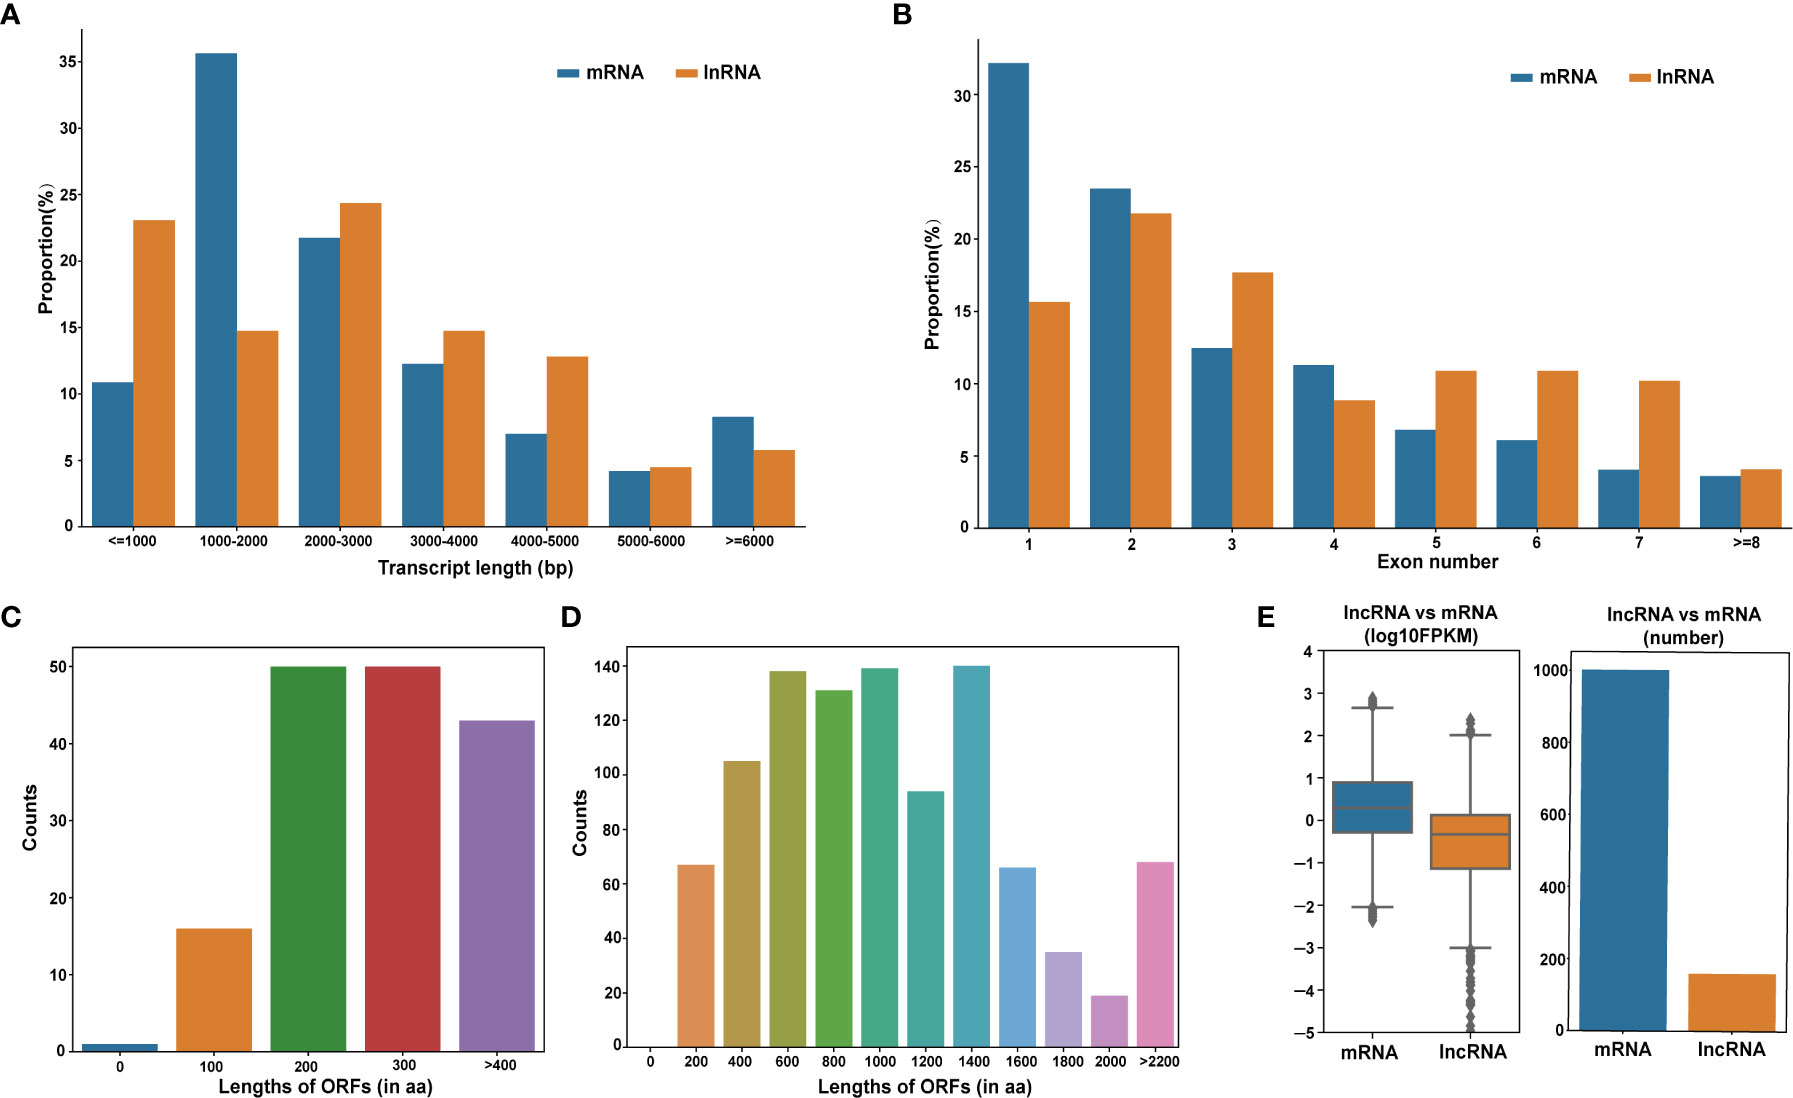
Figure 4 Evaluation of the DE-lncRNA and DE-mRNA structural and expression profiles. (A) DE-lncRNAs and DE-mRNAs transcript length distributions. (B) Structural comparison between lncRNAs and mRNAs in terms of exon number. (C, D) Open reading frames (ORF) length distribution of DE-lncRNAs and DE-mRNAs. (E) DE-lncRNA and DE-mRNA expression levels. DE-lncRNAs, differentially expressed long-coding RNAs; DE-mRNAs, differentially expressed mRNAs.
Overall, 7580 circRNAs were screened in the GL_A and GL_B samples, among which 2621 and 3173 were unique to the GL_A and GL_B samples, respectively (Figure 5A). All 7580 circRNAs were classified into five categories, including exonic (2110), antisense (1907), intergenic (818), intronic (276) and sense-overlapping (2469) (Figure 5B). The circRNAs were extensively distributed on different chromosomes, except for NW_018396446.1 and NW_018396461.1 (Figure 5C). Following identification, 7 DE-circRNAs were acquired (|log2 (fold change)| > 1 and p ≤ 0.05), which included 2 highly and 5 scarcely expressed DE-circRNAs in the GL_A group (Supplementary Table S7; Figure 5D). A heat map of the DE-circRNAs was generated to display the DE-circRNA expression profiles in the individually treated samples (Figure 5E).
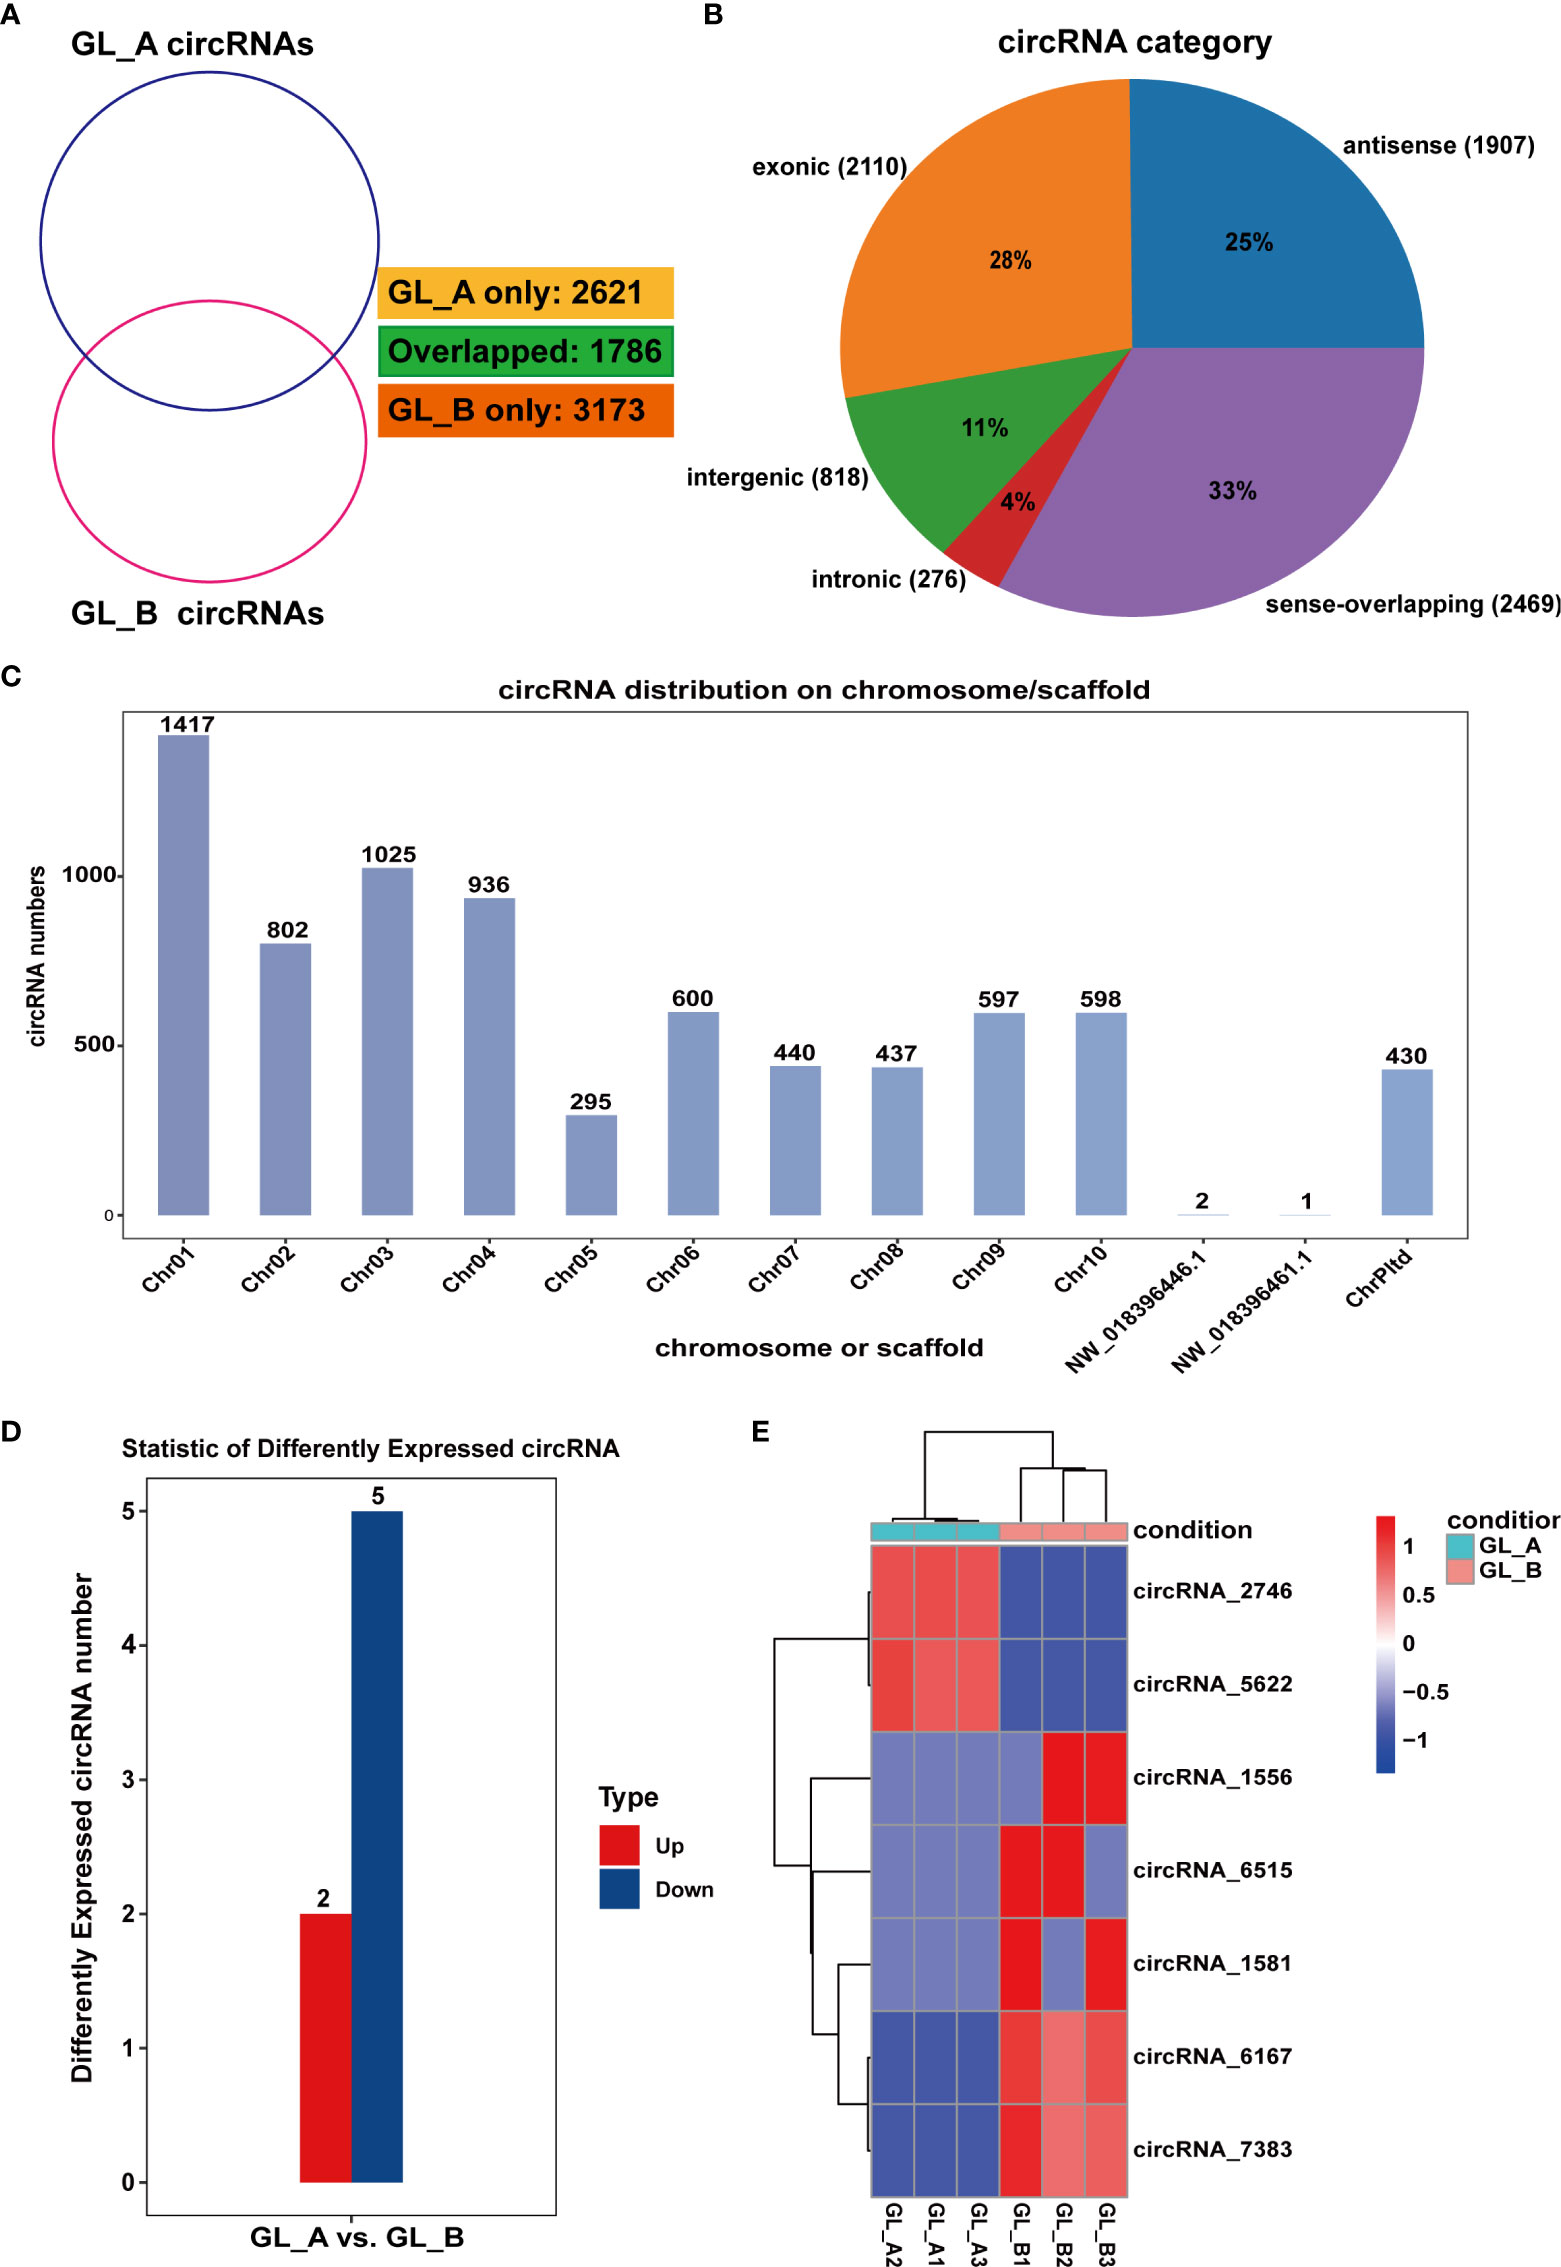
Figure 5 Screening and analysis of circular RNAs (circRNAs) in the GA3-treated Sorghum (“Jitian 3”) under salt stress. (A) Venn diagram depicting the number of circRNAs in the GA3-treated (GL_A) and control (GL_B) samples. (B) circRNAs category analysis. (C) Distribution of circRNAs on the Sorghum bicolor chromosome. (D) Statistic analysis of the number of differentially expressed circRNAs (DE-circRNAs) from the GL_A and GL_B samples. (E) Heatmap analysis of DE-circRNAs among the six circRNA sequencing libraries; Red indicates upregulation in GL_A group, while blue indicates downregulation in GL_A group.
To conduct an extensive analysis of the miRNA repertoire associated with the GA3-mediated regulation of salt stress, the GL_A and GL_B libraries were generated and subsequently sequenced. Upon filtration, 27,749,206 and 26,415,849 unique reads were retrieved from the GL_A and GL_B libraries, respectively. Overall, we screened 191 miRNAs, among which 13 and 11 were specific to the GL_A and GL_B samples, respectively (Figure 6A). The 21-nt reads were commonly found among all six libraries, followed by the 20-nt lengths (Figure 6B). This results suggested that more post-transcriptional modifcations may exist in Sorghum (“Jitian 3”) because the 21-nt sRNAs form the majority of small interfering RNAs (Xie et al., 2015). Based on our miRNA bias analysis, mature miRNAs did not typically begin with varying bases (A, C, G or U) (Figure 6C). In all, 26 DE-miRNAs with (|log2 (fold change)| > 1 and p ≤ 0.05) were screened, among which 18 were highly (69.23%) and 8 were scarcely expressed (30.77%) (Supplementary Table S8; Figure 6D). Moreover, like the DE-mRNAs and DE-lncRNAs, the DE-miRNAs in the GL_A and GL_B samples were independently clustered, and individual cases of three replicates were clustered together (Figure 6E). Furthermore, we estimated the target mRNAs of the identified DE-miRNAs using KEGG analyses. The DE-miRNAs target genes were enriched in 7 networks (Supplementary Table S9; Figure 6F). Among them, two significant pathways related to sorghum growth and salt stress response were the “phenylpropanoid biosynthesis (ko00940)” and “arginine and proline metabolism” axes (p < 0.05).
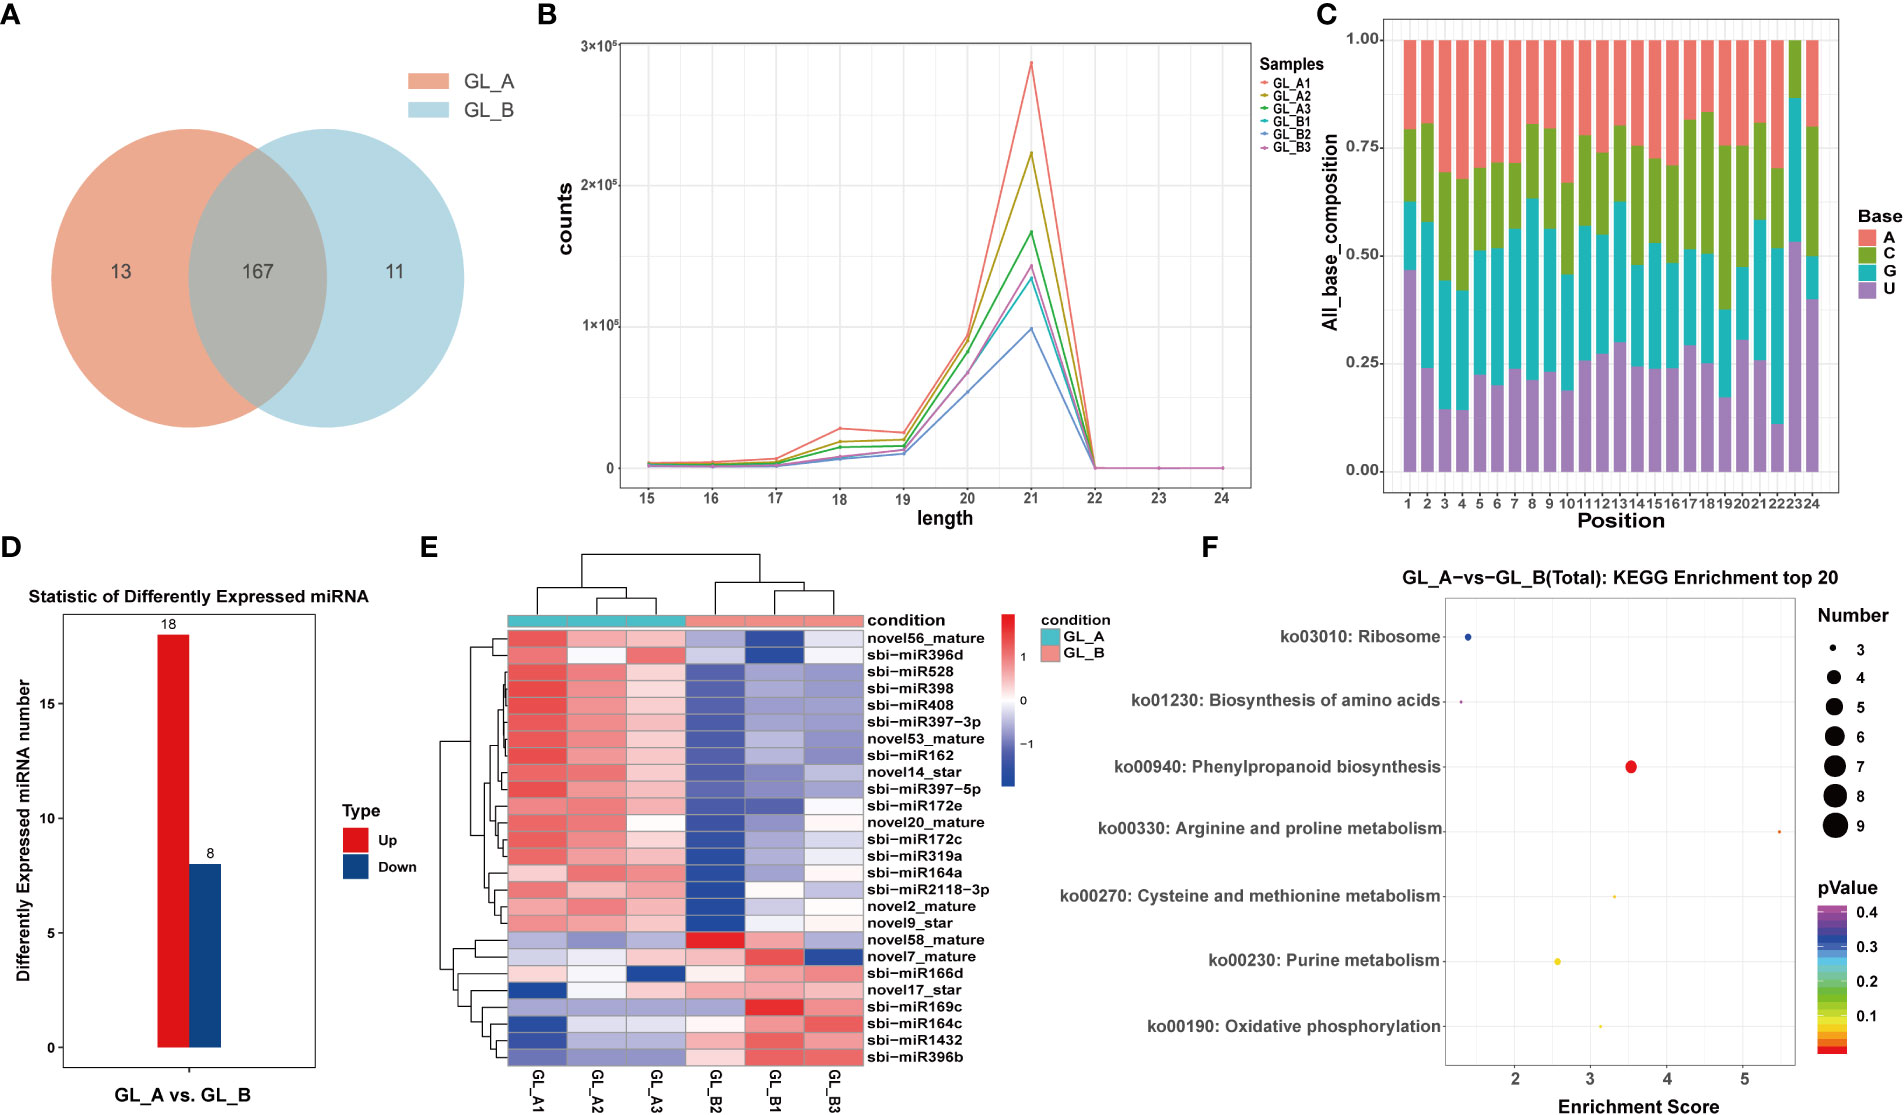
Figure 6 Screening and analysis of microRNAs (miRNAs) in the GA3-treated sorghum (“Jitian 3”) under salt stress. (A) Venn diagram illustrating the number of miRNAs in GA3-treated (GL_A) and control (GL_B) samples. (B, C) Sequence length distribution of small RNAs isolated from the six sorghum leaf libraries (A) and the nucleotide compositions of the mature miRNAs (B); GL_A1, GL_A2 and GL_A3 refer to the three GA3-treated sample replicates; GL_B1, GL_B2 and GL_B3 refer to the three control sample replicates. (D) Statistic analysis of the number of differentially expressed miRNAs (DE-miRNAs) in the GL_A and GL_B groups; Red represents upregulation in GL_A group, while blue represents downregulation in GL_A group. (E) Heatmap analysis of DE-miRNAs among the six miRNA sequencing libraries. (F) KEGG network enrichment analysis of all DE-miRNAs targets.
LncRNAs and circRNAs typically bind to the miRNA response elements in miRNAs, as part of the ceRNA axis (Salmena et al., 2011). To identify the overall modulatory axis of the protein-coding RNAs and ncRNAs associated with the GA3-mediated regulation of salt stress, ceRNA networks were generated with DE-mRNAs, DE-miRNAs, DE-lncRNAs, and DE-circRNAs, according to the ceRNA theory using the cytoscape software (https://cytoscape.org) (Figure 7). Based on the ceRNA network characteristics, we revealed three circRNAs (circRNA_2746, circRNA_6515, and circRNA_5622) and four lncRNAs (XR_002450182.1, XR_002452422.1, XR_002448510.1, and XR_002448296.1) in the core of the network, which may serve critical roles in modulating sorghum development.
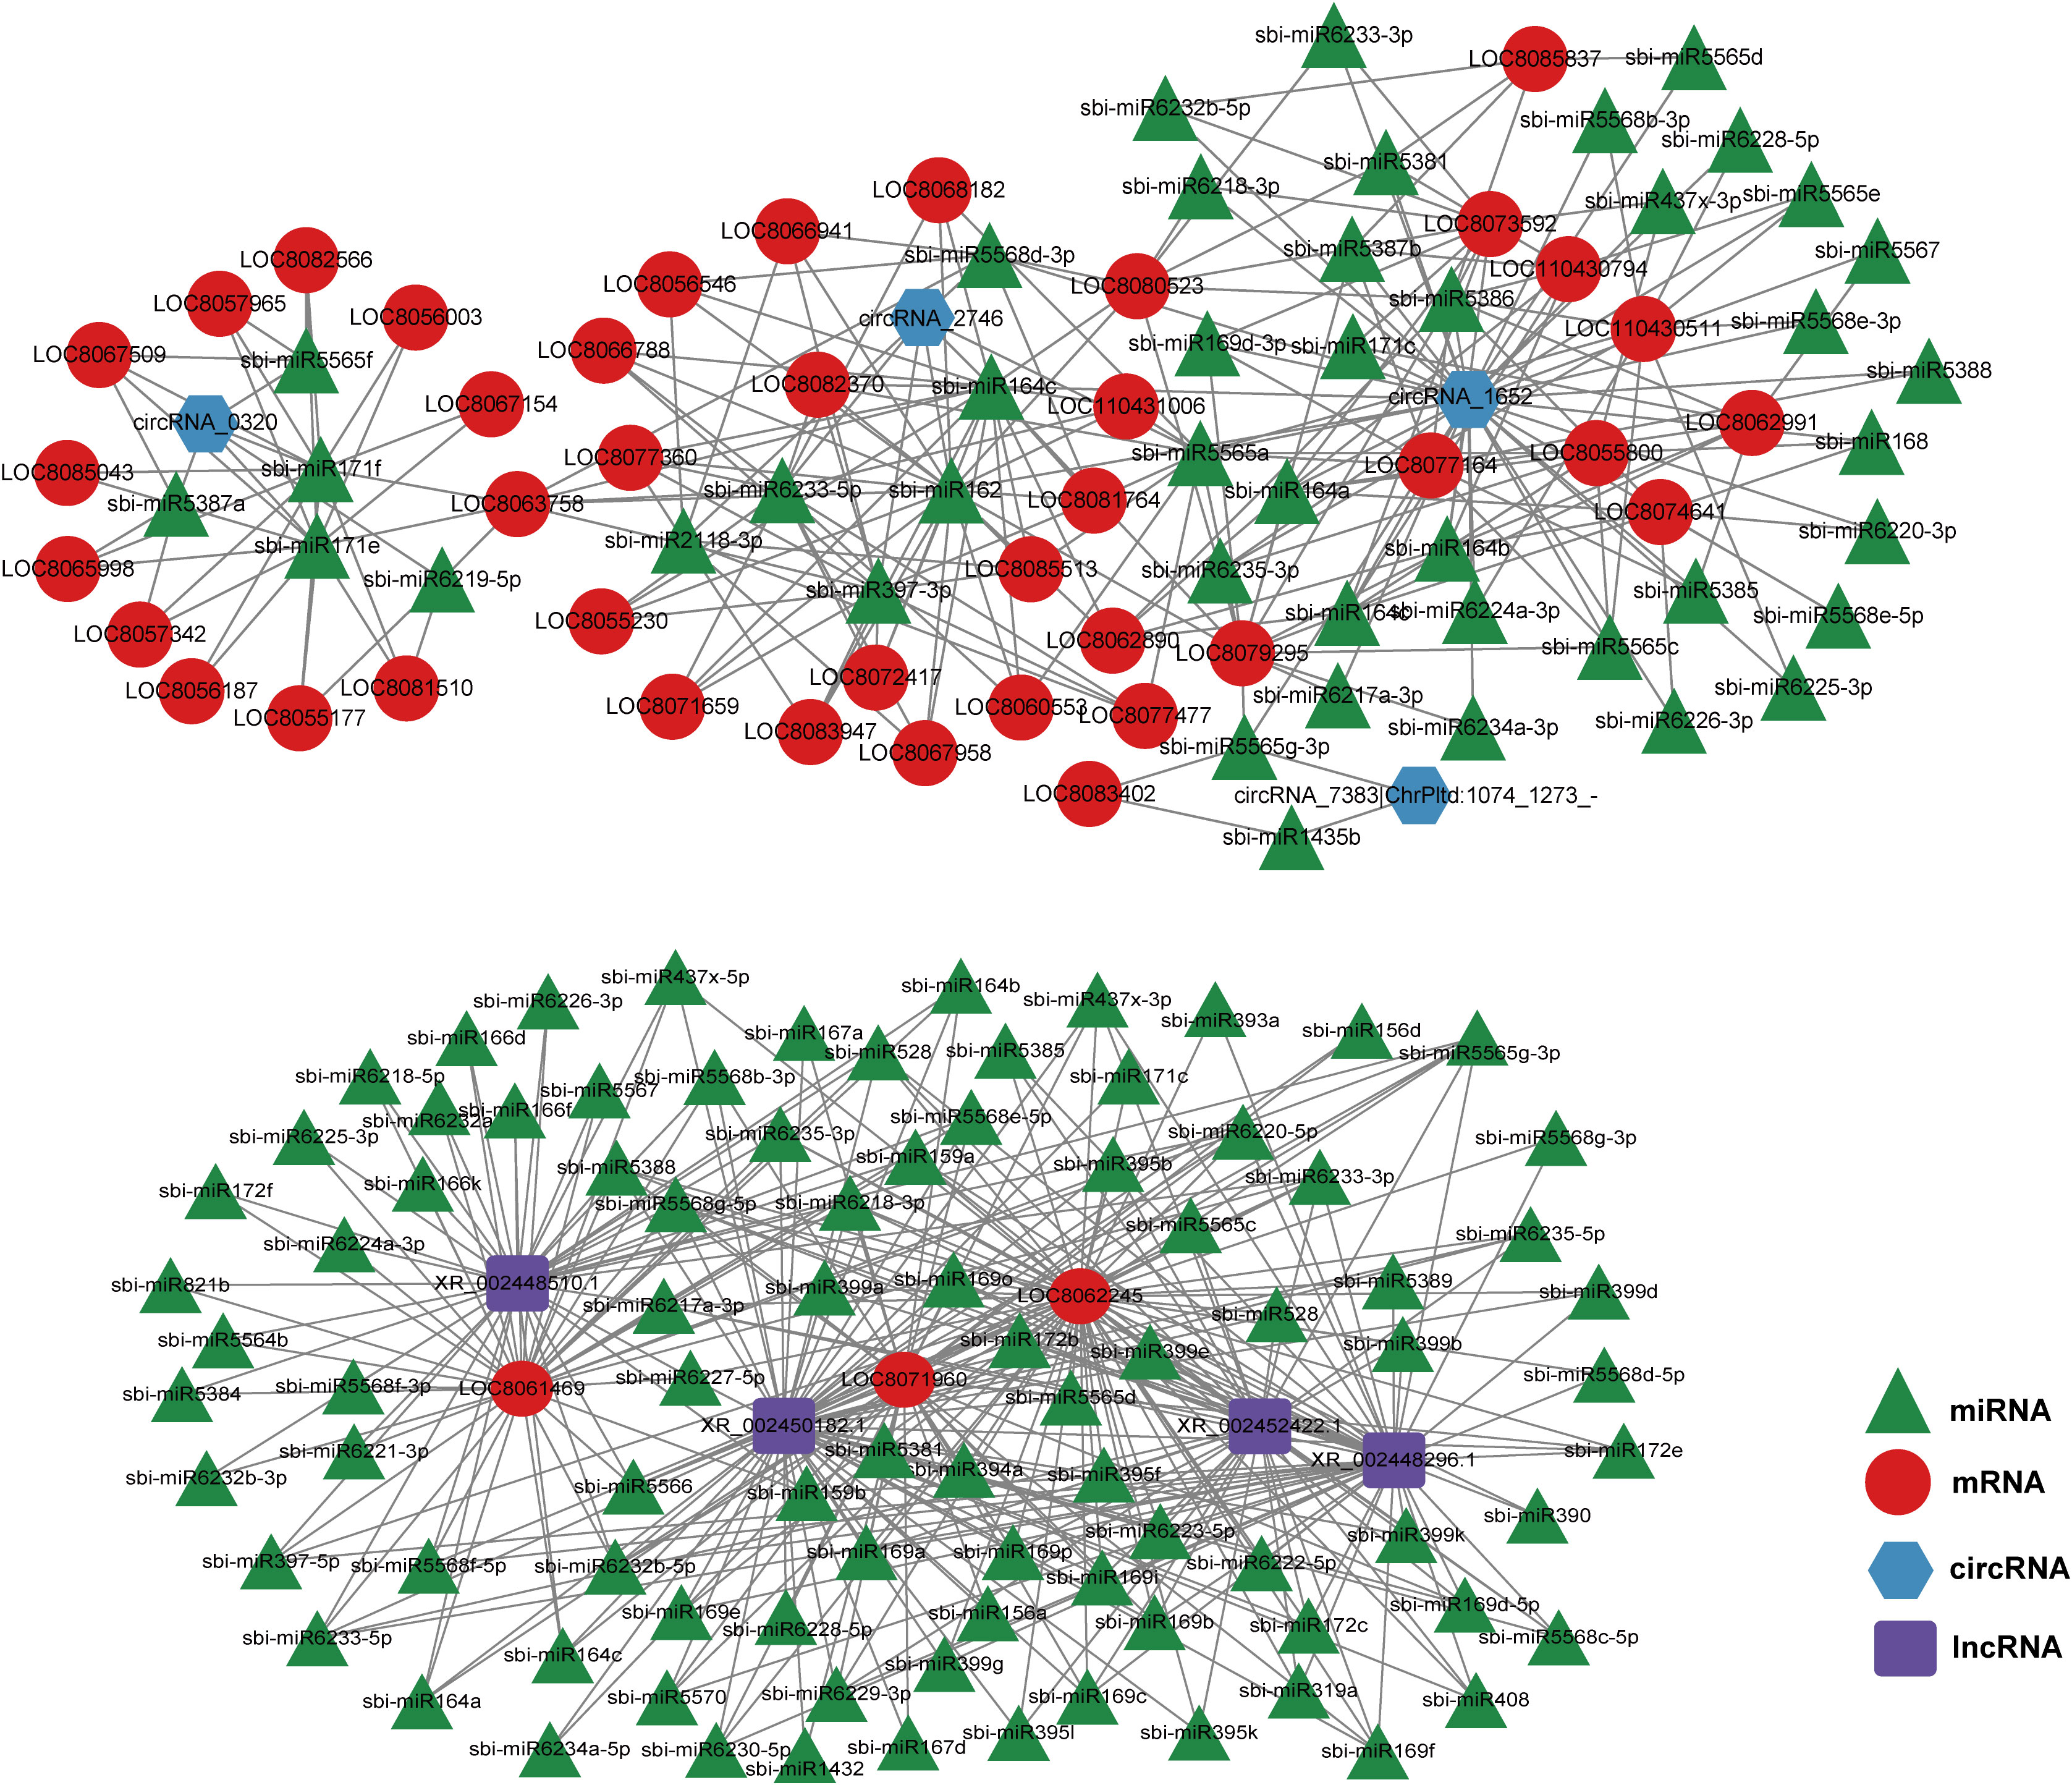
Figure 7 Competitive endogenous RNA (ceRNA) network generated using the differentially expressed (DE)-mRNAs, DE-lncRNAs, DE-circRNAs, and DE-miRNAs in sorghum (“Jitian 3”) between GL_A and GL_B groups. Red, blue, and green represent lncRNA, miRNAs, and mRNAs, respectively. ceRNA network was conducted by Cytoscape software (https://cytoscape.org/).
To further confirm the RNA-Seq results, we arbitrarily chose two DE-mRNAs (LOC8056546, LOC8062245), two DE-miRNAs (sbi-miR164c, sbi-miR528), two DE-lncRNAs (XR_002450182.1, XR_002452422.1), and two DE-circRNAs (circRNA_1652, circRNA_0320) for qRT-PCR analysis. Our findings revealed that the expression profiles were comparable to the whole-transcriptome data, indicating the dependability of the RNA sequencing results (Figure 8).
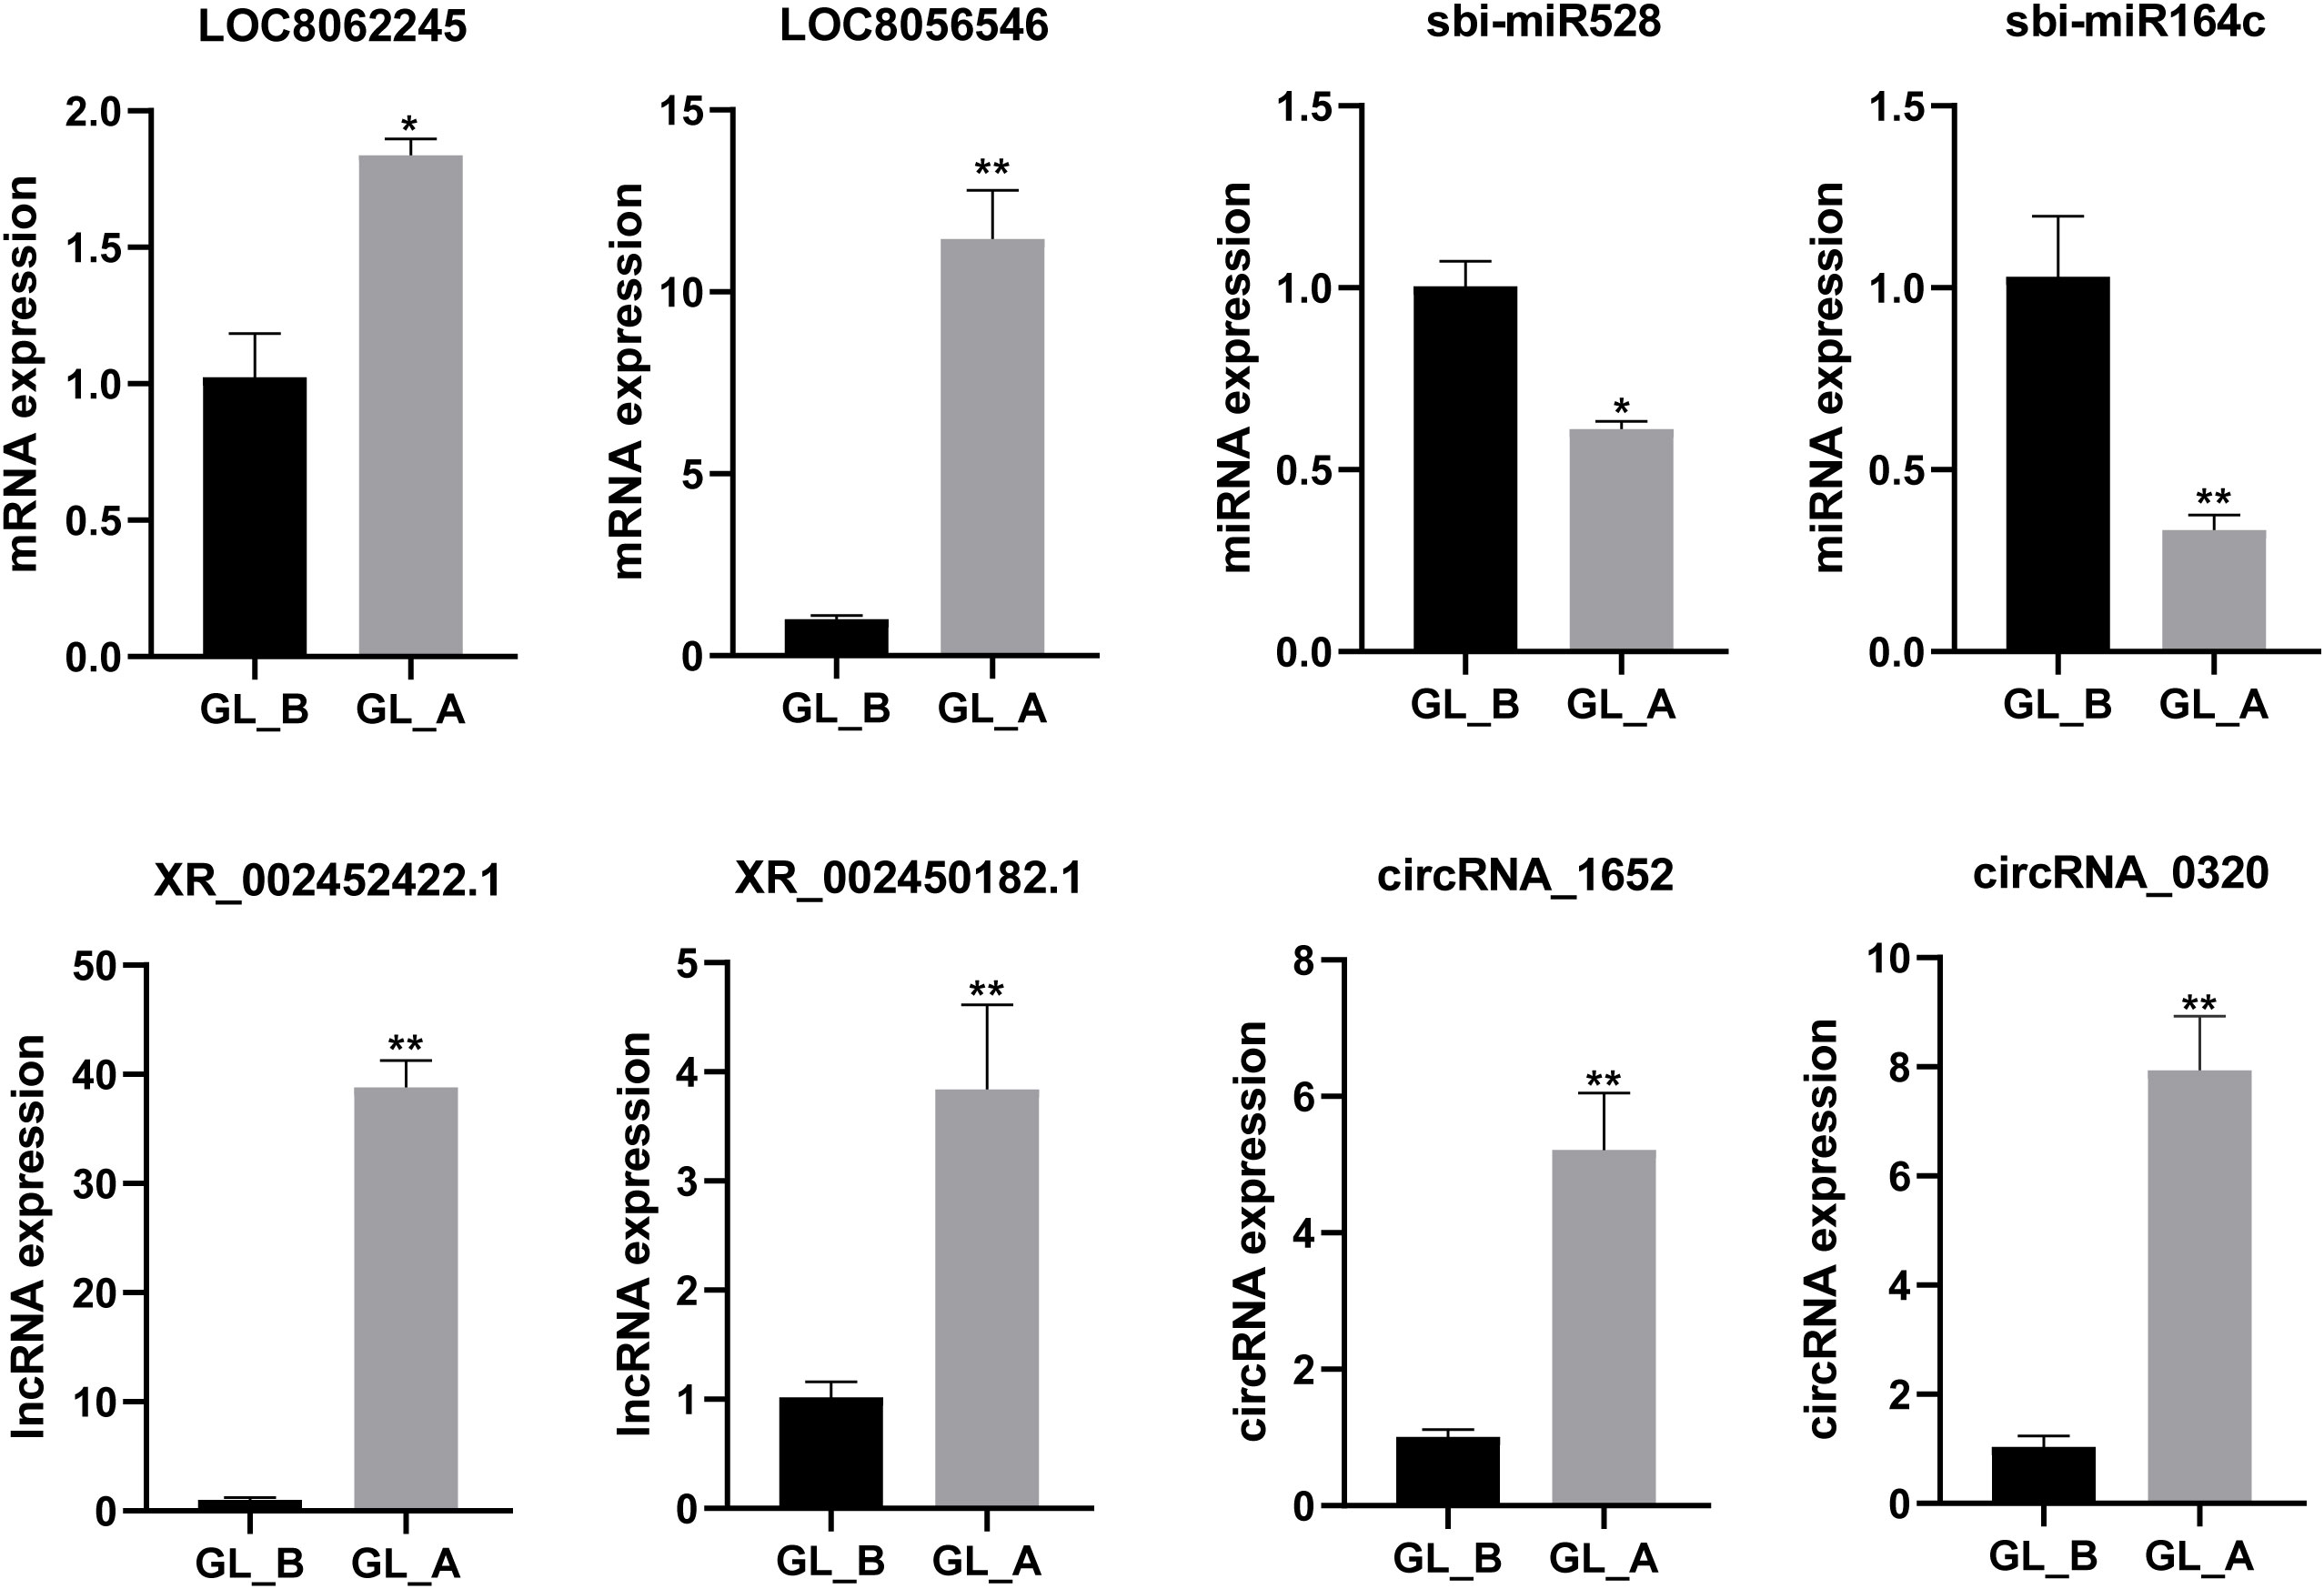
Figure 8 Quantitative real-time PCR (qRT-PCR)-mediated confirmation of select differentially expressed (DE)-mRNAs, DE-miRNAs, DE-lncRNAs, and DE-circRNAs in sorghum (“Jitian 3”) between GL_A and GL_B groups. All data are provided as mean ± SEM, n = 3, *p < 0.05, **p < 0.01.
Plants are highly vulnerable to abiotic stressors in early development. Salt stress is a key factor limiting sorghum germination under saline conditions. Previous studies concluded that low concentrations (< 50 mM) of NaCl promotes germination, while high concentrations (> 100 mM) of NaCl significantly inhibits germination (Rubio et al., 2020). Exogenous plant growth phytohormone administration was shown to be highly efficacious in alleviating the negative impacts of salinity. Among them, gibberellins are established promoters of plant growth under saline stress (Camara et al., 2018; Muniandi et al., 2018). Although salinity stress induces multiple adverse reactions in plants, gibberellins can remove the harmful substances brought on by salt stress, and maintain intercellular stability by modulating photosynthesis, the antioxidant system, osmotic substances, and ion balance (Jiao et al., 2019). Herein, we examined the influence of various GA3 concentrations on the morpho-physiological and leaf ultrastructure variations of sorghum (“Jitian 3”) under high salinity conditions. We next confirmed the optimal GA3 concentration (50 mg/L) required for minimizing most salt stress. In contrast, exogenous gibberellin administration promotes the essential protein synthesis needed for sorghum growth and endohydrolase activity, which has positive effects on augmenting plant height and resisting salt stress in sorghum (Kim et al., 2009). It is well known that plants have a complex response to salt stress. Under salt stress, plants first respond at the genetic level using transcriptional regulation, then they synthesize RNA coding for proteins associated with salt stress, and lastly, they utilize fine control of metabolite biosynthesis, which regulates plant metabolism and osmotic balance (Hasanuzzaman and Fujita, 2022).
Over the past decade, high-throughput approaches have enriched the identification of key elements in plant stress tolerance (Hernández et al., 2017). A better comprehension of the tolerance molecular mechanism can advance the development of salt-resistant sorghum lines using genetic engineering. Furthermore, the extensive screening and analysis of ceRNA axes associated with GA3 modulation remains incomplete. Prior reports revealed that lncRNAs and circRNAs (as ceRNAs) modulate one another via association with shared miRNA response elements (Ala et al., 2013). Hence, the ceRNAs modulatory axis, generated by lncRNAs, circRNAs, miRNAs, and mRNAs associating with miRNA response elements is critical to the post-transcriptional gene modulation in numerous biological processes. In this study, we employed a comparative whole-transcriptome analysis to reveal 1002 DE-mRNAs, 81 DE-lncRNAs, 26 DE-miRNAs, and 7 DE-circRNAs in GA3-treated samples, compared to controls. We generated the first ever GA3-associated ceRNA-miRNA-target gene modulatory axis to offer a foundation for additional investigation on the underlying mechanism behind salt stress regulation. We also conducted KEGG analyses to examine the likely roles of DE-mRNAs, DE-lncRNAs, DE-circRNAs, and DE-miRNAs targets. Following GA3 exposure, the enriched networks including numerous genes correlated with the phenylpropanoid biosynthesis and plant hormone axes. The phenylpropanoid pathway serves an essential function in plant development as well as their response to environmental stress (Sharma et al., 2019). Plant hormones mediate salinity signals to modulate plant growth adaptation, which play an essential role in regulating salt responses (Yu et al., 2020). Associations among mRNAs, miRNAs, lncRNAs, and circRNAs modulate gene expression, and thus, the competitive endogenous RNA (ceRNA) hypothesis was put forth (Salmena et al., 2011). The ceRNA axis was generated and examined in numerous plants, demonstrating crucial functions in plant growth (Fan et al., 2018; Xu et al., 2016). Nevertheless, the ceRNAs modulatory network belonging to the vernalization axis remains undetermined. Therefore, a closer examination of the associations between mRNAs, miRNAs, lncRNAs, and circRNAs in sorghum development and stress response is both urgent and necessary. In this study, we conducted the ceRNA network and screened three circRNAs (circRNA_2746, circRNA_6515, circRNA_5622), four lncRNAs (XR_002450182.1, XR_002452422.1, XR_002448510.1, XR_002448296.1), four genes (LOC8056546, LOC8062245, LOC8061469, LOC8071960) as valuable candidates for regulating the GA3-mediated alleviation of salt stress in sorghum. However, limited investigations assessed the function of the aforementioned lncRNAs and circRAs in sorghum leaf development. Additional investigations are necessary to fully elucidate the activities of these GA3 regulation-associated ceRNAs, ncRNAs, and target genes in modulating sorghum salt response.
In conclusion, a whole-transcriptome sequencing was performed using GA3-treated and control sorghum (“Jitian 3”) leaves under salt stress, and a total of 1002 DE-mRNAs, 81 DE-lncRNAs, 26 DE-miRNAs, and 7 DE-circRNAs were identified. Functional analyses revealed that DE-mRNAs and DE-ncRNAs target mRNAs were primarily enriched in the phenylpropanoid biosynthesis, plant hormone proteasome, as well as arginine and proline metabolism axes. Moreover, we constructed a circRNA/lncRNA−miRNA–target gene regulatory ceRNA network in sorghum, and identified several ncRNA (circRNA_2746, circRNA_6515, circRNA_5622, XR_002450182.1, XR_002452422.1, XR_002448510.1, XR_002448296.1) and mRNAs (LOC8056546, LOC8062245, LOC8061469, LOC8071960) that contribute to the GA3-mediated alleviation of salt stress in sorghum (“Jitian 3”). This evidence highlights the importance of mRNAs and ncRNAs in the molecular regulation of salt stress response in sorghum.
The original contributions presented in the study are publicly available. This data can be found here: NCBI, PRJNA878791 and PRJNA858876.
YW and GZ planned and designed the experiments. YW and JL performed the experiments. YW analyzed the data and wrote the manuscript. All authors contributed to the article and approved the submitted version.
This work was supported by the China National Key R&D Program (2022YFE0113400), the National Natural Science Funds (32102411), the Natural Science Foundation of Jiangsu Province of China (BK20200924), the Natural Science Foundation of Jiangsu Higher Education Institutions of China (20KJB210005), Jiangsu Association for Science and Technology young Scientific and technological Talents Project—supported by Yanqing Wu.
We thank OE Biotech Co., Ltd (Shanghai, China) for RNA-seq and Zhou Xuan for assistance with data upload.
The authors declare that the research was conducted in the absence of any commercial or financial relationships that could be construed as a potential conflict of interest.
All claims expressed in this article are solely those of the authors and do not necessarily represent those of their affiliated organizations, or those of the publisher, the editors and the reviewers. Any product that may be evaluated in this article, or claim that may be made by its manufacturer, is not guaranteed or endorsed by the publisher.
The Supplementary Material for this article can be found online at: https://www.frontiersin.org/articles/10.3389/fpls.2022.1071657/full#supplementary-material
Supplementary Table 1 | Real-time PCR primers and sequences.
Supplementary Table 2 | Summary of sequencing data from whole-transcriptome sequencing.
Supplementary Table 3 | Summary of differentially expressed (DE)-mRNAs identified in the GA3-exposed (GL_A) and control (GL_B) sorghum (“Jitian 3”).
Supplementary Table 4 | KEGG network enrichment analysis of the differentially expressed (DE) mRNAs in sorghum (“Jitian 3”).
Supplementary Table 5 | A list of differentially expressed (DE)-lncRNAs in the GA3-exposed (GL_A) and control (GL_B) sorghum (“Jitian 3”).
Supplementary Table 6 | KEGG network enrichment analysis of the differentially expressed (DE)-lncRNAs target genes in sorghum (“Jitian 3”).
Supplementary Table 7 | A list of differentially expressed (DE)-circRNAs in the GA3-exposed (GL_A) and control (GL_B) sorghum (“Jitian 3”).
Supplementary Table 8 | A list of differentially expressed (DE)-miRNAs in the GA3-exposed (GL_A) and control (GL_B) sorghum (“Jitian 3”).
Supplementary Table 9 | KEGG network enrichment analysis of the differentially expressed (DE)-miRNAs target genes in sorghum (“Jitian 3”).
Ahmad, P. (2010). Growth and antioxidant responses in mustard (Brassica juncea l.) plants subjected to combined effect of gibberellic acid and salinity. Arch. Agron. Soil Sci. 56, 575–588. doi: 10.1080/03650340903164231
Ala, U., Karreth, F. A., Bosia, C., Pagnani, A., Taulli, R., Léopold, V., et al. (2013). Integrated transcriptional and competitive endogenous RNA networks are cross-regulated in permissive molecular environments. Proc. Natl. Acad. Sci. U. S. A. 110, 7154–7159. doi: 10.1073/pnas.1222509110
Camara, M. C., Vandenberghe, L. P. S., Rodrigues, C., Oliveira, J., Faulds, C., Bertrand, E., et al. (2018). Current advances in gibberellic acid (GA3) production, patented technologies and potential applications. Planta 248, 1–14. doi: 10.1007/s00425-018-2959-x
Cao, W., Wang, R., Cao, J., Gao, J., Zhao, X., Gan, L., et al. (2022). Genome-wide identification and characterization of long noncoding RNAs in maize under rice black streaked dwarf virus infection. Plant Pathol. 71, 741–749. doi: 10.1111/ppa.13512
Chunthaburee, S., Sanitchon, J., Pattanagul, W., Theerakulpisut, P. (2014). Alleviation of salt stress in seedlings of black glutinous rice by seed priming with spermidine and gibberellic acid. Not. Bot. Horti. Agrobot. 42, 1003–1012. doi: 10.15835/nbha4229688
Conesa, A., Gotz, S., Garcia-Gomez, J. M., Terol, J., Talon, M., Robles, M. (2005). Blast2GO: a universal tool for annotation, visualization and analysis in functional genomics research. Bioinformatics 21, 3674–3676. doi: 10.1093/bioinformatics/bti610
Dai, L. Y., Zhang, L. J., Ruan, Y. Y., Hu, K. (2012). Research on physiological characteristics and the assessment of tolerance of different varieties of sweet sorghum seedlings to saline-sodic stress. Agric. Res. Arid Areas 30, 77–83. doi: 10.3969/j.issn.1000-7601.2012.02.014
Fan, G. Q., Wang, Z., Zhai, X. Q., Cao, Y. B. (2018). ceRNA cross-talk in paulownia witches’ broom disease. Int. J. Mol. Sci. 19, 2463. doi: 10.3390/ijms19082463
Hasanuzzaman, M., Fujita, M. (2022). Plant responses and tolerance to salt stress: Physiological and molecular interventions. Int. J. Mol. Sci. 23, 4810. doi: 10.3390/ijms23094810
He, X. Y., Guo, S. R., Wang, Y., Wang, L. W., Shu, S., Sun, J. (2020). Systematic identification and analysis of heat-stress-responsive lncRNAs, circRNAs and miRNAs with associated co-expression and ceRNA networks in cucumber (Cucumis sativus l.). Physiol. Plant 168, 736–754. doi: 10.1111/ppl.12997
Hernández, J. A., Barba-Espín, G., Clemente-Moreno, M. J., Díaz-Vivancos, P. (2017). Plant responses to salinity through an antioxidative metabolism and proteomic point of view. Springer Int. Publ., 173–200. doi: 10.1007/978-3-319-42183-4_8
Hussain, Q., Asim, M., Zhang, R., Khan, R., Farooq, S., Wu, J. (2021). Transcription factors interact with ABA through gene expression and signaling pathways to mitigate drought and salinity stress. Biomolecules 11, 1159. doi: 10.3390/biom11081159
Jiao, X. R., Zhi, W. F., Liu, G. J., Zhu, G. L., Feng, G. N., Nimir, N. E. A., et al. (2019). Responses of foreign GA3 application on seedling growth of castor bean (Ricinus communis l.) under salinity stress conditions. Agronomy-Basel 9, 274. doi: 10.3390/agronomy9060274
Kanehisa, M., Goto, S. (2000). KEGG: Kyoto encyclopedia of genes and genomes. Nucleic Acids Res. 28, 27–30. doi: 10.1093/nar/28.1.27
Kim, S. K., Sohn, E. Y., Joo, G. J., Lee, I. J. (2009). Influence of jasmonic acid on endogenous gibberellin and abscisic acid in salt-stressed chard plant. J. Environ. Biol. 30, 333–338
Kong, L., Zhang, Y., Ye, Z. Q., Liu, X. Q., Zhao, S. Q., Wei, L., et al. (2007). CPC: assess the protein-coding potential of transcripts using sequence features and support vector machine. Nucleic Acids Res. 35, W345–W349. doi: 10.1093/nar/gkm391
Li, G., Wan, S. W., Zhou, J., Yang, Z. Y., Qin, P. (2010). Leaf chlorophyll fluorescence, hyperspectral reflectance, pigments content, malondialdehyde and proline accumulation responses of castor bean (Ricinus communis l.) seedlings to salt stress levels. Ind. Crop Prod. 31, 13–19. doi: 10.1016/j.indcrop.2009.07.015
Li, A. M., Zhang, J. Y., Zhou, Z. Y. (2014). PLEK: A tool for predicting long non-coding RNAs and messenger RNAs based on an improved k-mer scheme. BMC Bioinf. 15, 311. doi: 10.1186/1471-2105-15-311
Mistry, J., Chuguransky, S., Williams, L., Qureshi, M., Salazar, G. A., Sonnhammer, E. L. L., et al. (2021). Pfam: The protein families database in 2021. Nucleic Acids Res. 49, D412–D419. doi: 10.1093/nar/gkaa913
Muhammad, J., Eui Shik, R. (2007). Gibberellic acid (GA3) enhance seed water uptake, germination and early seedling growth in sugar beet under salt stress. Pak. J. Biol. Sci. 10, 654–658. doi: 10.3923/pjbs.2007.654.658
Muniandi, S. K. M., Hossain, M. A., Abdullah, M. P., Shukor, N. A. (2018). Gibberellic acid (GA3) affects growth and development of some selected kenaf (Hibiscus cannabinus l.) cultivars. Ind. Crops Prod. 118, 180–187. doi: 10.1016/j.indcrop.2018.03.036
Nasri, N., Mahmoudi, H., Baatour, O., M,Rah, S., Kaddour, R., Lachâal, M. (2012). Effect of exogenous gibberellic acid on germination, seedling growth and phosphatase activities in lettuce under salt stress. Afr. J. Biotechnol. 11, 11967–11971. doi: 10.5897/AJB12.339
Negrao, S., Schmockel, S. M., Tester, M. (2017). Evaluating physiological responses of plants to salinity stress. Ann. Bot. 119, 1–11. doi: 10.1093/aob/mcw191
Ponjavic, J., Oliver, P. L., Lunter, G., Ponting, C. P. (2009). Genomic and transcriptional Co-localization of protein-coding and long non-coding RNA pairs in the developing brain. PloS Genet. 5, e1000617. doi: 10.1371/journal.pgen.1000617
Punia, H., Tokas, J., Malik, A., Sangwan, S., Rani, A., Yashveer, S., et al. (2021). Genome-wide transcriptome profiling, characterization, and functional identification of NAC transcription factors in sorghum under salt stress. Antioxid. (Basel) 10, 1605. doi: 10.3390/antiox10101605
Rubio, F., Nieves-Cordones, M., Horie, T., Shabala, S. (2020). Doing ‘business as usual’comes with a cost: Evaluating energy cost of maintaining plant intracellular k+ homeostasis under saline conditions. New Phytol. 225, 1097–1104. doi: 10.1111/nph.15852
Salmena, L., Poliseno, L., Tay, Y., Kats, L., Pandolfi, P. P. (2011). A ceRNA hypothesis: the Rosetta stone of a hidden RNA language? Cell 146, 353–358. doi: 10.1016/j.cell.2011.07.014
Sharma, A., Shahzad, B., Rehman, A., Bhardwaj, R., Landi, M., Zheng, B. S. (2019). Response of phenylpropanoid pathway and the role of polyphenols in plants under abiotic stress. Molecules 24, 2452. doi: 10.3390/molecules24132452
Shi, F. Y., Xu, H. Z., Liu, C. H., Tan, C., Ren, J., Ye, X. L., et al. (2021). Whole-transcriptome sequencing reveals a vernalization-related ceRNA regulatory network in chinese cabbage (Brassica campestris l. ssp. pekinensis). BMC Genomics 22, 819. doi: 10.1186/s12864-021-08110-2
Song, J., Shi, G. W., Gao, B., Fan, H., Wang, B. S. (2011). Waterlogging and salinity effects on two suaeda salsa populations. Physiol. Plant. 141, 343–351. doi: 10.1111/j.1399-3054.2011.01445.x
Sui, N., Yang, Z., Liu, M., Wang, B. S. (2015). Identification and transcriptomic profiling of genes involved in increasing sugar content during salt stress in sweet sorghum leaves. BMC Genom. 16, 534. doi: 10.1186/s12864-015-1760-5
Sun, L., Luo, H. T., Bu, D. C., Zhao, G. G., Yu, K. T., Zhang, C. H., et al. (2013). Utilizing sequence intrinsic composition to classify protein-coding and long non-coding transcripts. Nucleic Acids Res. 41, e166. doi: 10.1093/nar/gkt646
Sun, X., Zheng, H. X., Li, J. L., Liu, L. N., Zhang, X. S., Sui, N., et al. (2020). Comparative transcriptome analysis reveals new lncRNAs responding to salt stress in sweet sorghum. Front. Bioeng. Biotechnol. 8. doi: 10.3389/fbioe.2020.00331
Wu, F. H., Chen, Z. T., Zhang, F. N., Zheng, H. X., Li, S. M., Gao, Y. P., et al. (2022). Identification and transcriptome analysis of genes related to membrane lipid regulation in sweet sorghum under salt stress. Int. J. Mol. Sci. 23, 5465. doi: 10.3390/ijms23105465
Wu, H. J., Ma, Y. K., Chen, T., Wang, M., Wang, X. J. (2012). PsRobot: a web-based plant small RNA meta-analysis toolbox. Nucleic Acids Res. 40, W22–W228. doi: 10.1093/nar/gks554
Xie, F. L., Jones, D. C., Wang, Q. L., Sun, R. R., Zhang, B. H. (2015). Small RNA sequencing identifies miRNA roles in ovule and fibre development. Plant Biotechnol. J. 13, 355–369. doi: 10.1111/pbi.12296
Xu, X. W., Zhou, X. H., Wang, R. R., Peng, W. L., An, Y., Chen, L. L. (2016). Functional analysis of long intergenic non-coding RNAs in phosphate-starved rice using competing endogenous RNA network. Sci. Rep. 6, 20715. doi: 10.1038/srep20715
Yu, Z. P., Duan, X. B., Luo, L., Dai, S. J., Ding, Z. J., Xia, G. M. (2020). How plant hormones mediate salt stress responses. Trends Plant Sci. 25, 1117–1130. doi: 10.1016/j.tplants.2020.06.008
Yu, Y., Zhang, Y. C., Chen, X. M., Chen, Y. Q. (2019). Plant noncoding RNAs: Hidden players in development and stress responses. Annu. Rev. Cell Dev. Biol. 35, 407–431. doi: 10.1146/annurev-cellbio-100818-125218
Zhang, L., Gao, Y. K., Pan, H. T., Hu, W. J., Zhang, Q. X. (2013). Cloning and characterisation of a primula heat shock protein gene, PfHSP17.1, which confers heat, salt and drought tolerance in transgenic arabidopsis thaliana. Acta Physiol. Plant 35, 3191–3200. doi: 10.1007/s11738-013-1354-2
Zhang, M., Hong, L. Z., Gu, M. F., Wu, C. D., Zhang, G. (2020). Transcriptome analyses revealed molecular responses of cynanchum auriculatum leaves to saline stress. Sci. Rep. 10, 449. doi: 10.1038/s41598-019-57219-8
Keywords: sorghum, gibberellic acid (GA3), whole-transcriptome, salt stress, ceRNA
Citation: Wu Y, Liu J and Zhou G (2022) Whole-transcriptome analyses of Sorghum leaves identify key mRNAs and ncRNAs associated with GA3-mediated alleviation of salt stress. Front. Plant Sci. 13:1071657. doi: 10.3389/fpls.2022.1071657
Received: 16 October 2022; Accepted: 16 November 2022;
Published: 01 December 2022.
Edited by:
Keshav Dahal, Agriculture and Agri-Food Canada (AAFC), CanadaReviewed by:
Quaid Hussain, Zhejiang Agriculture & Forestry University, ChinaCopyright © 2022 Wu, Liu and Zhou. This is an open-access article distributed under the terms of the Creative Commons Attribution License (CC BY). The use, distribution or reproduction in other forums is permitted, provided the original author(s) and the copyright owner(s) are credited and that the original publication in this journal is cited, in accordance with accepted academic practice. No use, distribution or reproduction is permitted which does not comply with these terms.
*Correspondence: Guisheng Zhou, Z3N6aG91QHl6dS5lZHUuY24=
†These authors have contributed equally to this work
Disclaimer: All claims expressed in this article are solely those of the authors and do not necessarily represent those of their affiliated organizations, or those of the publisher, the editors and the reviewers. Any product that may be evaluated in this article or claim that may be made by its manufacturer is not guaranteed or endorsed by the publisher.
Research integrity at Frontiers

Learn more about the work of our research integrity team to safeguard the quality of each article we publish.