 Zhongchun Xiao
 Chao Zhang
 Cunmin Qu3
 Kun Lu
 Jiana Li
94% of researchers rate our articles as excellent or good
Learn more about the work of our research integrity team to safeguard the quality of each article we publish.
Find out more
ORIGINAL RESEARCH article
Front. Plant Sci., 08 December 2022
Sec. Crop and Product Physiology
Volume 13 - 2022 | https://doi.org/10.3389/fpls.2022.1067121
This article is part of the Research TopicGenetics, Breeding and Engineering to Enhance Oil Quality and YieldView all 11 articles
Increasing oil production is a major goal in rapeseed (Brassica napus) molecular breeding programs. Identifying seed oil content (SOC)-related candidate genes is an important step towards achieving this goal. We performed quantitative trait locus (QTL) mapping of SOC in B. napus using a high-density SNP genetic map constructed from recombinant inbred lines and the Illumina InfiniumTM 60K SNP array. A total of 26 QTLs were detected in three years on A01, A03, A05, A06, A09, C01, C03 and C05, which accounted for 3.69%~18.47% of the phenotypic variation in SOC. Of these, 13 QTLs are reported here for the first time. 1713 candidate genes in the 26 QTLs confidence interval were obtained. We then identified differentially expressed genes (DEGs) between the high- and low-SOC accessions, to narrow down our focus to 21 candidate genes (Y1-Y21) related to SOC, and we will focus on 11 (Y1-Y11) candidate genes that contribute to the formation of high-SOC. In addition to providing insight into the genetic basis of SOC in B. napus, the loci identified and candidate genes in this study can be used in molecular breeding strategies to increase SOC in this important seed crop.
Due to its low saturated fatty acid content, rapeseed (Brassica napus) oil is considered a healthy edible vegetable oil. Increasing oil production, by increasing seed yield and seed oil content (SOC), is a major goal of B. napus breeding. Tremendous progress has been made towards increasing B. napus oil production, especially in China, due to the development of next-generation sequencing technology and SNP markers. B. napus breeders in China have produced germplasm with a SOC of 55–60%, with the potential to increase it to 75% (Hu et al., 2013; Hua et al., 2016). Therefore, there is a broad prospect for improving the SOC of B. napus in China.
The SOC of B. napus is a complex quantitative trait, controlled by multiple genes and environmental effects (Si et al., 2003; Liu et al., 2016). Previous studies have shown that the SOC of B. napus is mainly determined by the maternal genotype, and the photosynthesis of maternal silique pericarps plays an important role in regulating SOC (Hua et al., 2012; Wang et al., 2010). As for the QTL mapping of SOC in B. napus, the previous studies have mapped many related QTLs. However, due to differences in the subsets of accessions used, genetic maps, localization methods, and environmental differences in the populations used for QTL mapping, the QTLs associated with SOC in B. napus obtained by predecessors are also very different. Out of 14 and 10 SOC-related QTLs discovered in the DY and RNSL DH populations, respectively, only one was detected simultaneously in both populations (Delourme et al., 2006). Yan et al. (2009) detected 11 QTLs related to SOC in three different environments using the B. napus recombinant inbred line (RIL) population. These QTLs were mainly distributed on C05 and C06 chromosome, with a single QTL accounting for 5.19-13.57% of the phenotypic variation. Chen et al. (2010) detected 27 SOC-related QTLs distributed in 14 linkage groups under nine different environments, using a B. napus DH population, of which a single QTL explained 4.2-30.2% of the phenotypic variation (Chen et al., 2010). Zhao et al. (2012) reconstructed a map using the SG-DH population and detected nine SOC-related QTLs, located on chromosomes A01, A05, A07, A09, C02, C03, C06 and C08, under 11 different growth regimes, which together accounted for 57.79% of the phenotypic variation (Zhao et al., 2012). Wang et al. (2013) constructed a B. napus KNDH population using “KenC-8” and “N53-2” and identified 24 SOC-related QTLs (Wang et al., 2013). Sun et al. (2016) constructed two F2 populations and obtained 40 SOC-related QTLs using linkage mapping under different environments (Sun et al., 2016).
In this study, we aimed to identify candidate genes associated with SOC by combining QTL mapping and transcriptome sequencing between extremely high- and low-SOC B. napus accessions. We created a high-generation RIL containing 186 strains, and constructed a high-density genetic linkage map, consisting of 8,575 SNP markers and 1,201 clusters across the 6140.2cM B. napus genome, using the 60K SNP chip. Finally, a total of 26 SOC-related QTLs were detected. Meanwhile, based on differential expression genes (DEGs) between the high- and low-SOC accessions from our previous study (Xiao et al., 2019), we identified 21 candidate genes, which could be useful for further gene cloning and molecular breeding for higher SOC in B. napus.
The high-seed oil content (SOC; 44.57%) B. napus accession, GH06, was used as the female parent and a low-SOC (36.69%) accession, ZY821, as the male parent. Starting from the F2 generation, plants were self-fertilized using the one grain transfer method. In the 10th generation, a high-generation recombinant inbred line (RIL) population containing 186 strains was constructed and cultivated in the rapeseed planting base of Xiema Town, Beibei District, Chongqing (29°45′39.99” N, 106°22′38.47”E, 238.57 m), for three consecutive years (2016-2018). All field experiments followed a randomized complete block design with two replicates. From each accession, 30 plants were grown in three rows per plot, with 10 plants per row, with a row spacing of 40 cm, and a plant spacing of 20 cm. The trial was managed in a conventional manner to ensure a consistent growth environment for all accessions. At maturity, five representative plants were collected from the middle of each plot. The oil content of the desiccated seeds was measured by near-infrared reflectance spectroscopy (NIRS DS2500).
The SOC data from three consecutive years were compared using a Student’s t-test in Microsoft Excel 2013, and the normal distribution map was generated using Origin Pro 8.0. The correlation analysis of the RIL population was performed using DPS7.05 statistical analysis software. Best linear unbiased prediction (BLUP) for SOC was evaluated using an R script (http://www.eXtension.org/pages/61006). The coefficient of variation was calculated using the formula CV = σ/μ, where σ is the standard deviation and μ is the average.
Five young leaves of each accession were mixed, and DNA was extracted for SNP marker analysis. DNA samples were pretreated, chip hybridized, eluted, single base extended, stained, and embedded according to Illumina’s InfiniumTM HD Assay Ultra instructions. The chip was scanned using Illumina HiSCAN, and the results were analyzed using GenomeStudio genotyping software v2011, to obtain the genotype of each accession. The SNP genetic map was constructed using MSTmap software (Wu et al., 2008), and all markers were grouped using a minimum threshold LOD score of 5.0. The order of markers on each linkage group was calculated using the minimum recombination frequency between the markers. The SNP genetic map included 8,575 SNP markers and 1,201 bins, and covered 6340.2 cM of the B. napus genome.
The QTL mapping of SOC was performed in WinQTLCart 2.5 software (Silva Lda et al., 2012) using the composite interval mapping (CIM) method. The LOD threshold was set to 2.0. Each QTL was named after the year and the italic lowercase “q”, followed by the trait name, chromosome, and QTL serial number. For example, 2016-qOCA05-1 indicates the first QTL for SOC on chromosome A05 in 2016.
One low-SOC (CQ46: Ningyou12, 33.0% of SOC) and two high-SOC (CQ24: SWU47, 42.7% of SOC and CQ52: Zhongshuang11, 43.3% of SOC) lines were selected for transcriptome sequencing (RNA Seq), and DEGs were obtained in seeds 30 days after flowering on the main inflorescence (30SM) and on the primary branch (30SB) based on our previous research (Xiao et al., 2019), and the RNA-Seq datasets presented in this study can be found in online repositories. The names of the repository/repositories and accession number(s) can be found below: BIG Data Center under BioProject accession number PRJNA602979.
To screen for candidate genes related to SOC, we combined all candidate genes in the QTL confidence interval, with DEGs between extremely high- and low- SOC accessions in 30SM and 30SB. Finally, candidate genes that are up-regulated and down-regulated in both 30SM and 30SB of high-SOC rapeseed (CQ24 and CQ52) are identified to be important candidate genes related to SOC, and candidate genes that contribute to the formation of high-SOC will be focused on in this study.
Total cDNA was synthesized from 1,000 ng RNA according to the manufacturer’s instructions (Perfect Real Time; TaKaRa Biotechnology, Dalian, China). qRT-PCR Primers are listed in Table S3. Each reaction contained 10 μL TBGreen II (TakaRa), 2.0 μL cDNA, 1.6 μL primer, 0.4 μL ROX Reference Dye II, and distilled water to a final volume of 20 μL. The PCR program was as follows: 95 °C for 30 s and 35 cycles of 95 °C for 5 s, followed by 56-62 °C (depending on the primers used) for 30 s. Each reaction including three biological replicates, relative expression levels were obtained using the 2−ΔΔCt method, and BnACTIN7 was used as internal control.
In current study, extensive phenotypic variations of seed oil content (SOC) were found (Table 1), and seed oil content (SOC, % of seed weight) phenotypes in three environments (2016CQ-2018CQ) of 186 lines for QTL mapping are shown in Table S1. SOC ranged from 31.32% to 42.6%, with an average of 37.2%, in 2016CQ, from 30.97% to 43.87%, with an average of 38.81%, in 2017CQ, and from 34.18% to 43.54%, with an average of 39.11%, in 2018CQ. The coefficient of variation (CV) was 6.59%, 5.95% and 5.09% in 2016CQ, 2017CQ, and 2018CQ, respectively. This indicated that the variation of SOC in the three environments is small and stable. The SOC varied continuously in the three environments and approached a normal distribution (Figure 1), indicating that this trait is controlled by multiple genes.
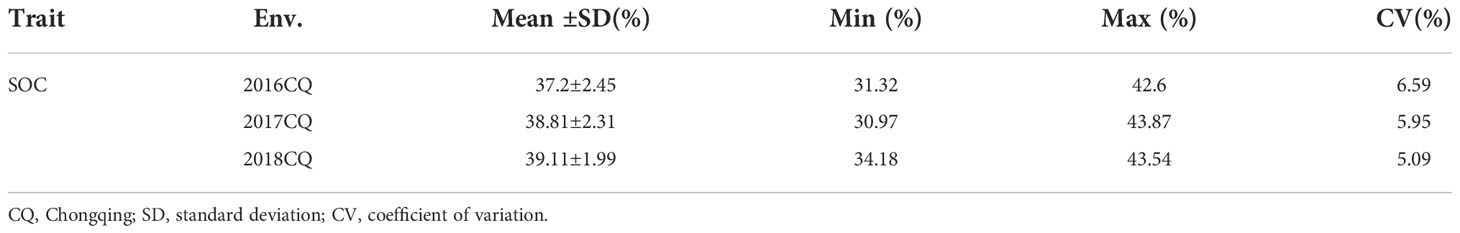
Table 1 Phenotypic variation in seed oil content (SOC) in the recombinant inbred line (RIL) population.
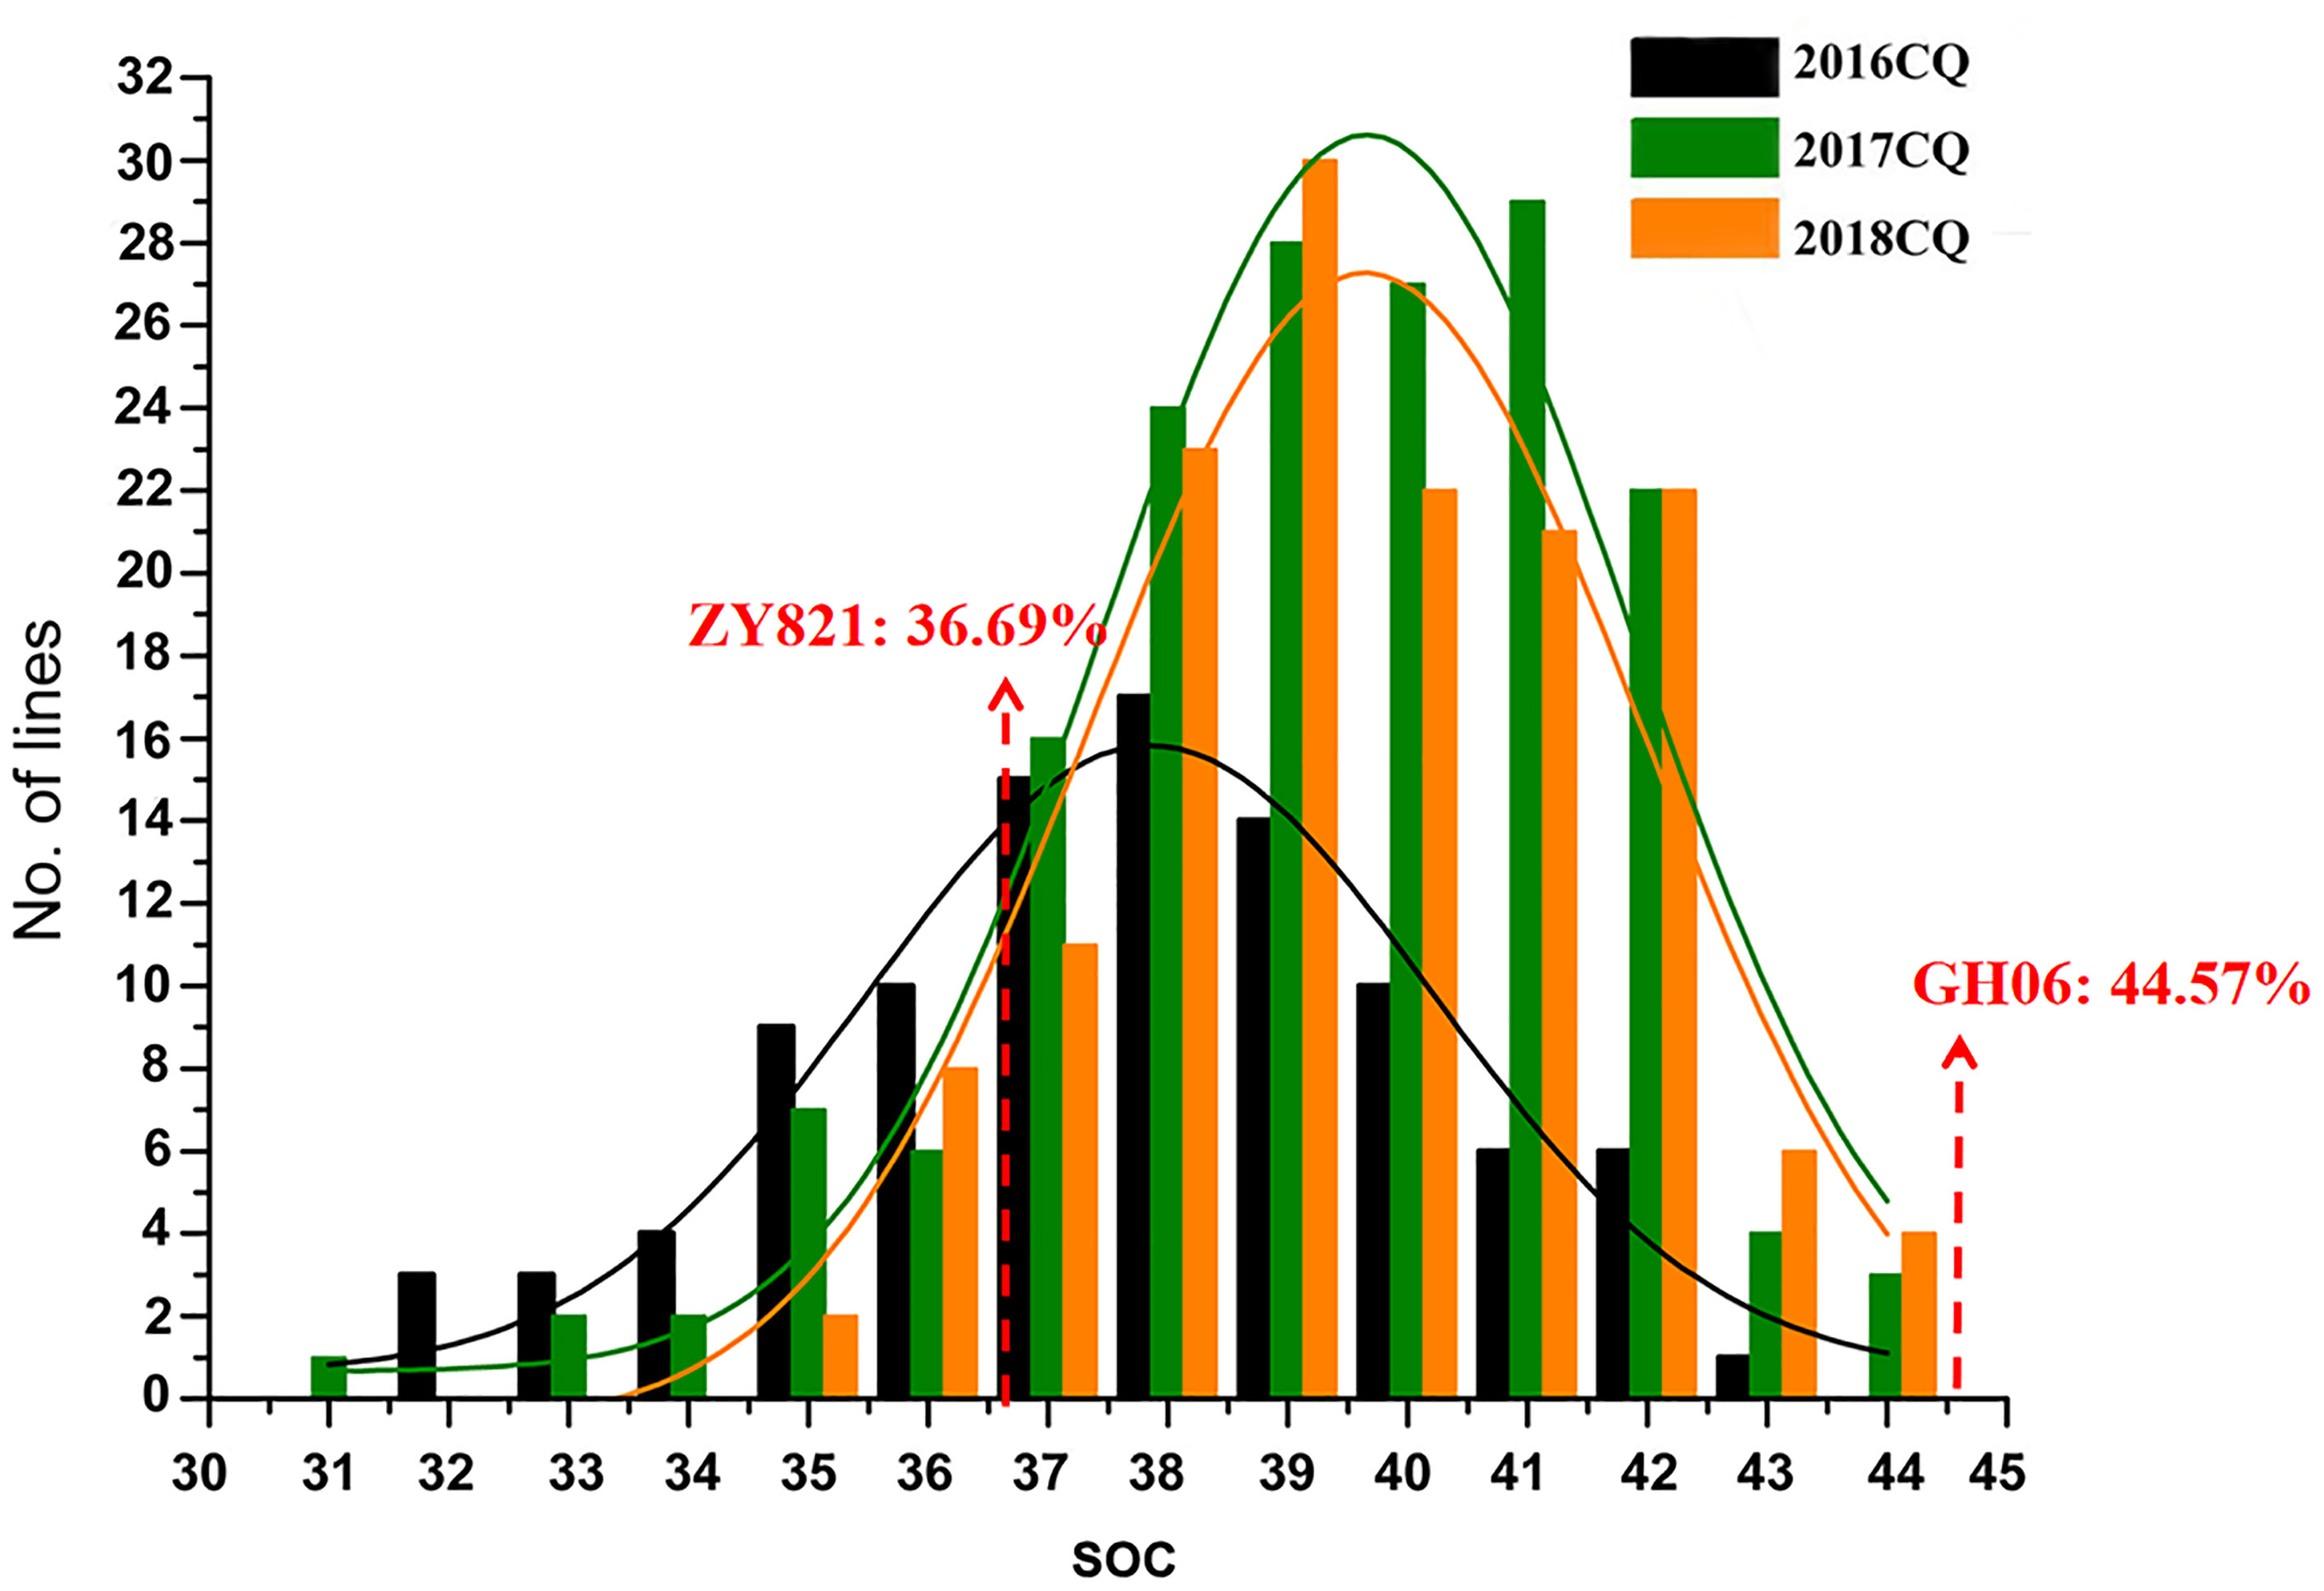
Figure 1 Frequency distribution of seed oil content (SOC, % of seed weight) of RIL populations in different environments. “CQ “refers to Chongqing and “No. of Lines” represents the number of accessions.
The phenotypic correlation analysis between SOC and 12 other traits indicated (Table 2) that there was positive correlation between SOC and oil + protein content, erucic acid, glucosinolate, linolenic acid, economic yield, biological yield, and harvest index. Besides, there was negative correlation between SOC and protein content, linoleic acid, stearic acid, oleic acid, and palmitic acid. And the significance of the correlation between SOC and other traits was shown in Table 2. Therefore, increasing the SOC has an extremely important role in production practice.

Table 2 Correlation coefficients of seed oil content (SOC) with 12 other traits in a B. napus RIL population grown in different environments.
QTL mapping for SOC was performed using the composite interval mapping (CIM) method. When the LOD value was≥2.0, we detected 26 SOC-related QTLs in three environments, located on chromosomes A01, A03, A05, A06, A09, C01, C03 and C05 (Table 3, Figure 2). These QTLs explained 3.69-18.47% of the phenotypic variation (R2). The QTL 2017-qOCA09-2, located at 30.08-30.31 Mb on chromosome A09, explained the highest proportion of the phenotypic variation (18.47%). We also identified several overlapping QTLs: 2016-qOCA09-1 and 2017-qOCA09-2; 2016-qOCA09-2 and BLUP-qOCA09-1; 2018-qOCA09-1 and BLUP-qOCA09-2; 2016-qOCA05-1 and 2016-qOCA05-2; 2018-qOCA03-1 and 2018-qOCA03-2; and 2018-qOCA05-1 and 2018-qOCA05-2. The additive effects of these overlapping QTLs are positive, indicating that the synergistic genes affecting SOC are mainly derived from the female parent (GH06), which is consistent with maternal control of SOC in B. napus (Hua et al., 2012).
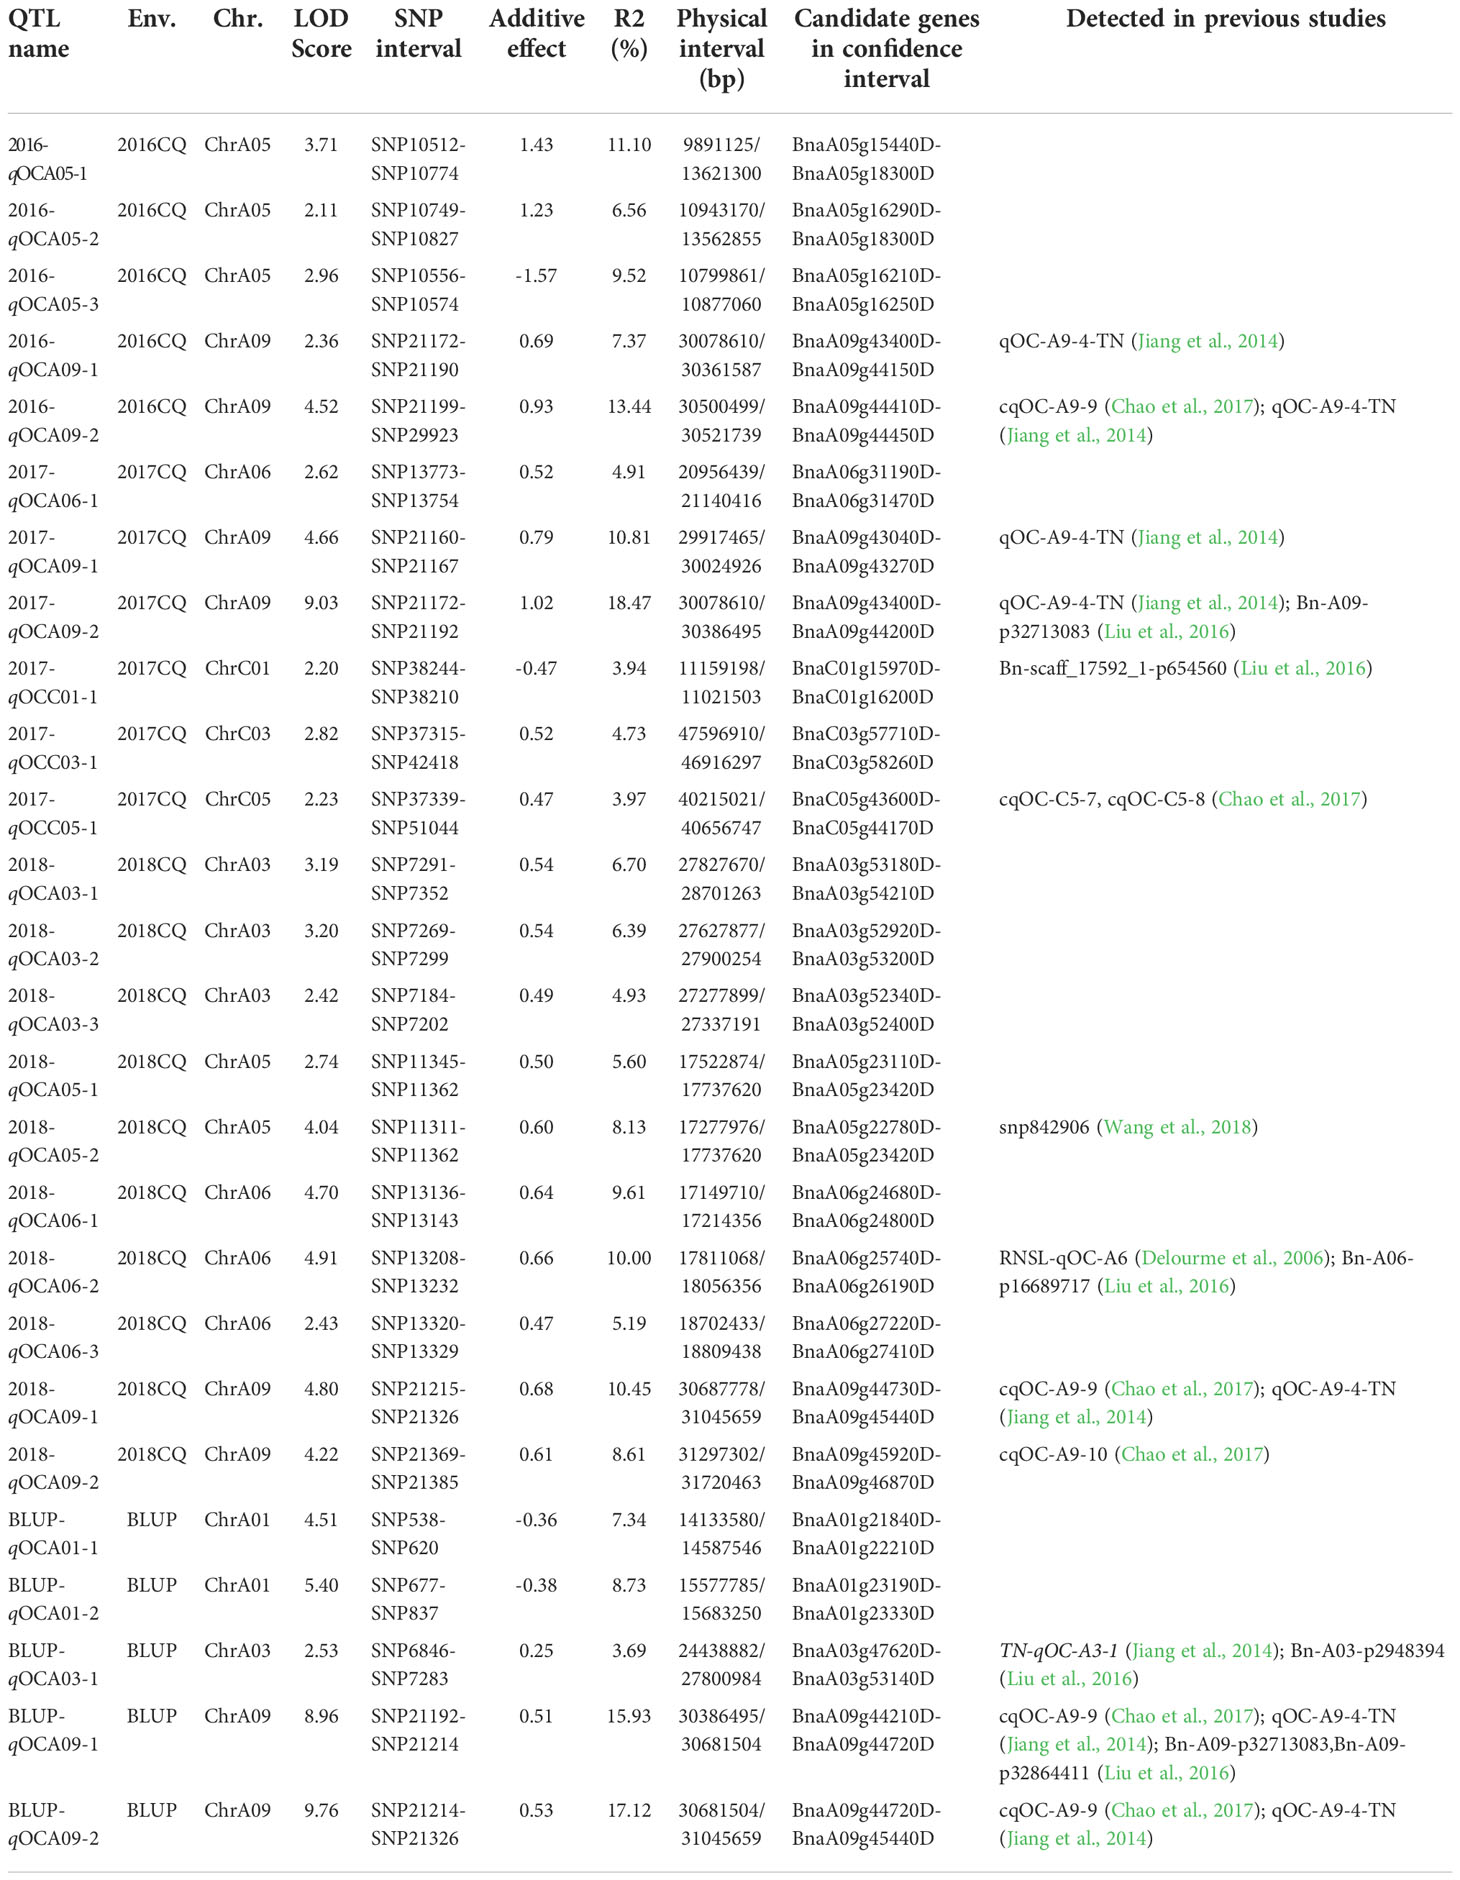
Table 3 QTL for seed oil content (SOC) detected from the RIL population in three environments.
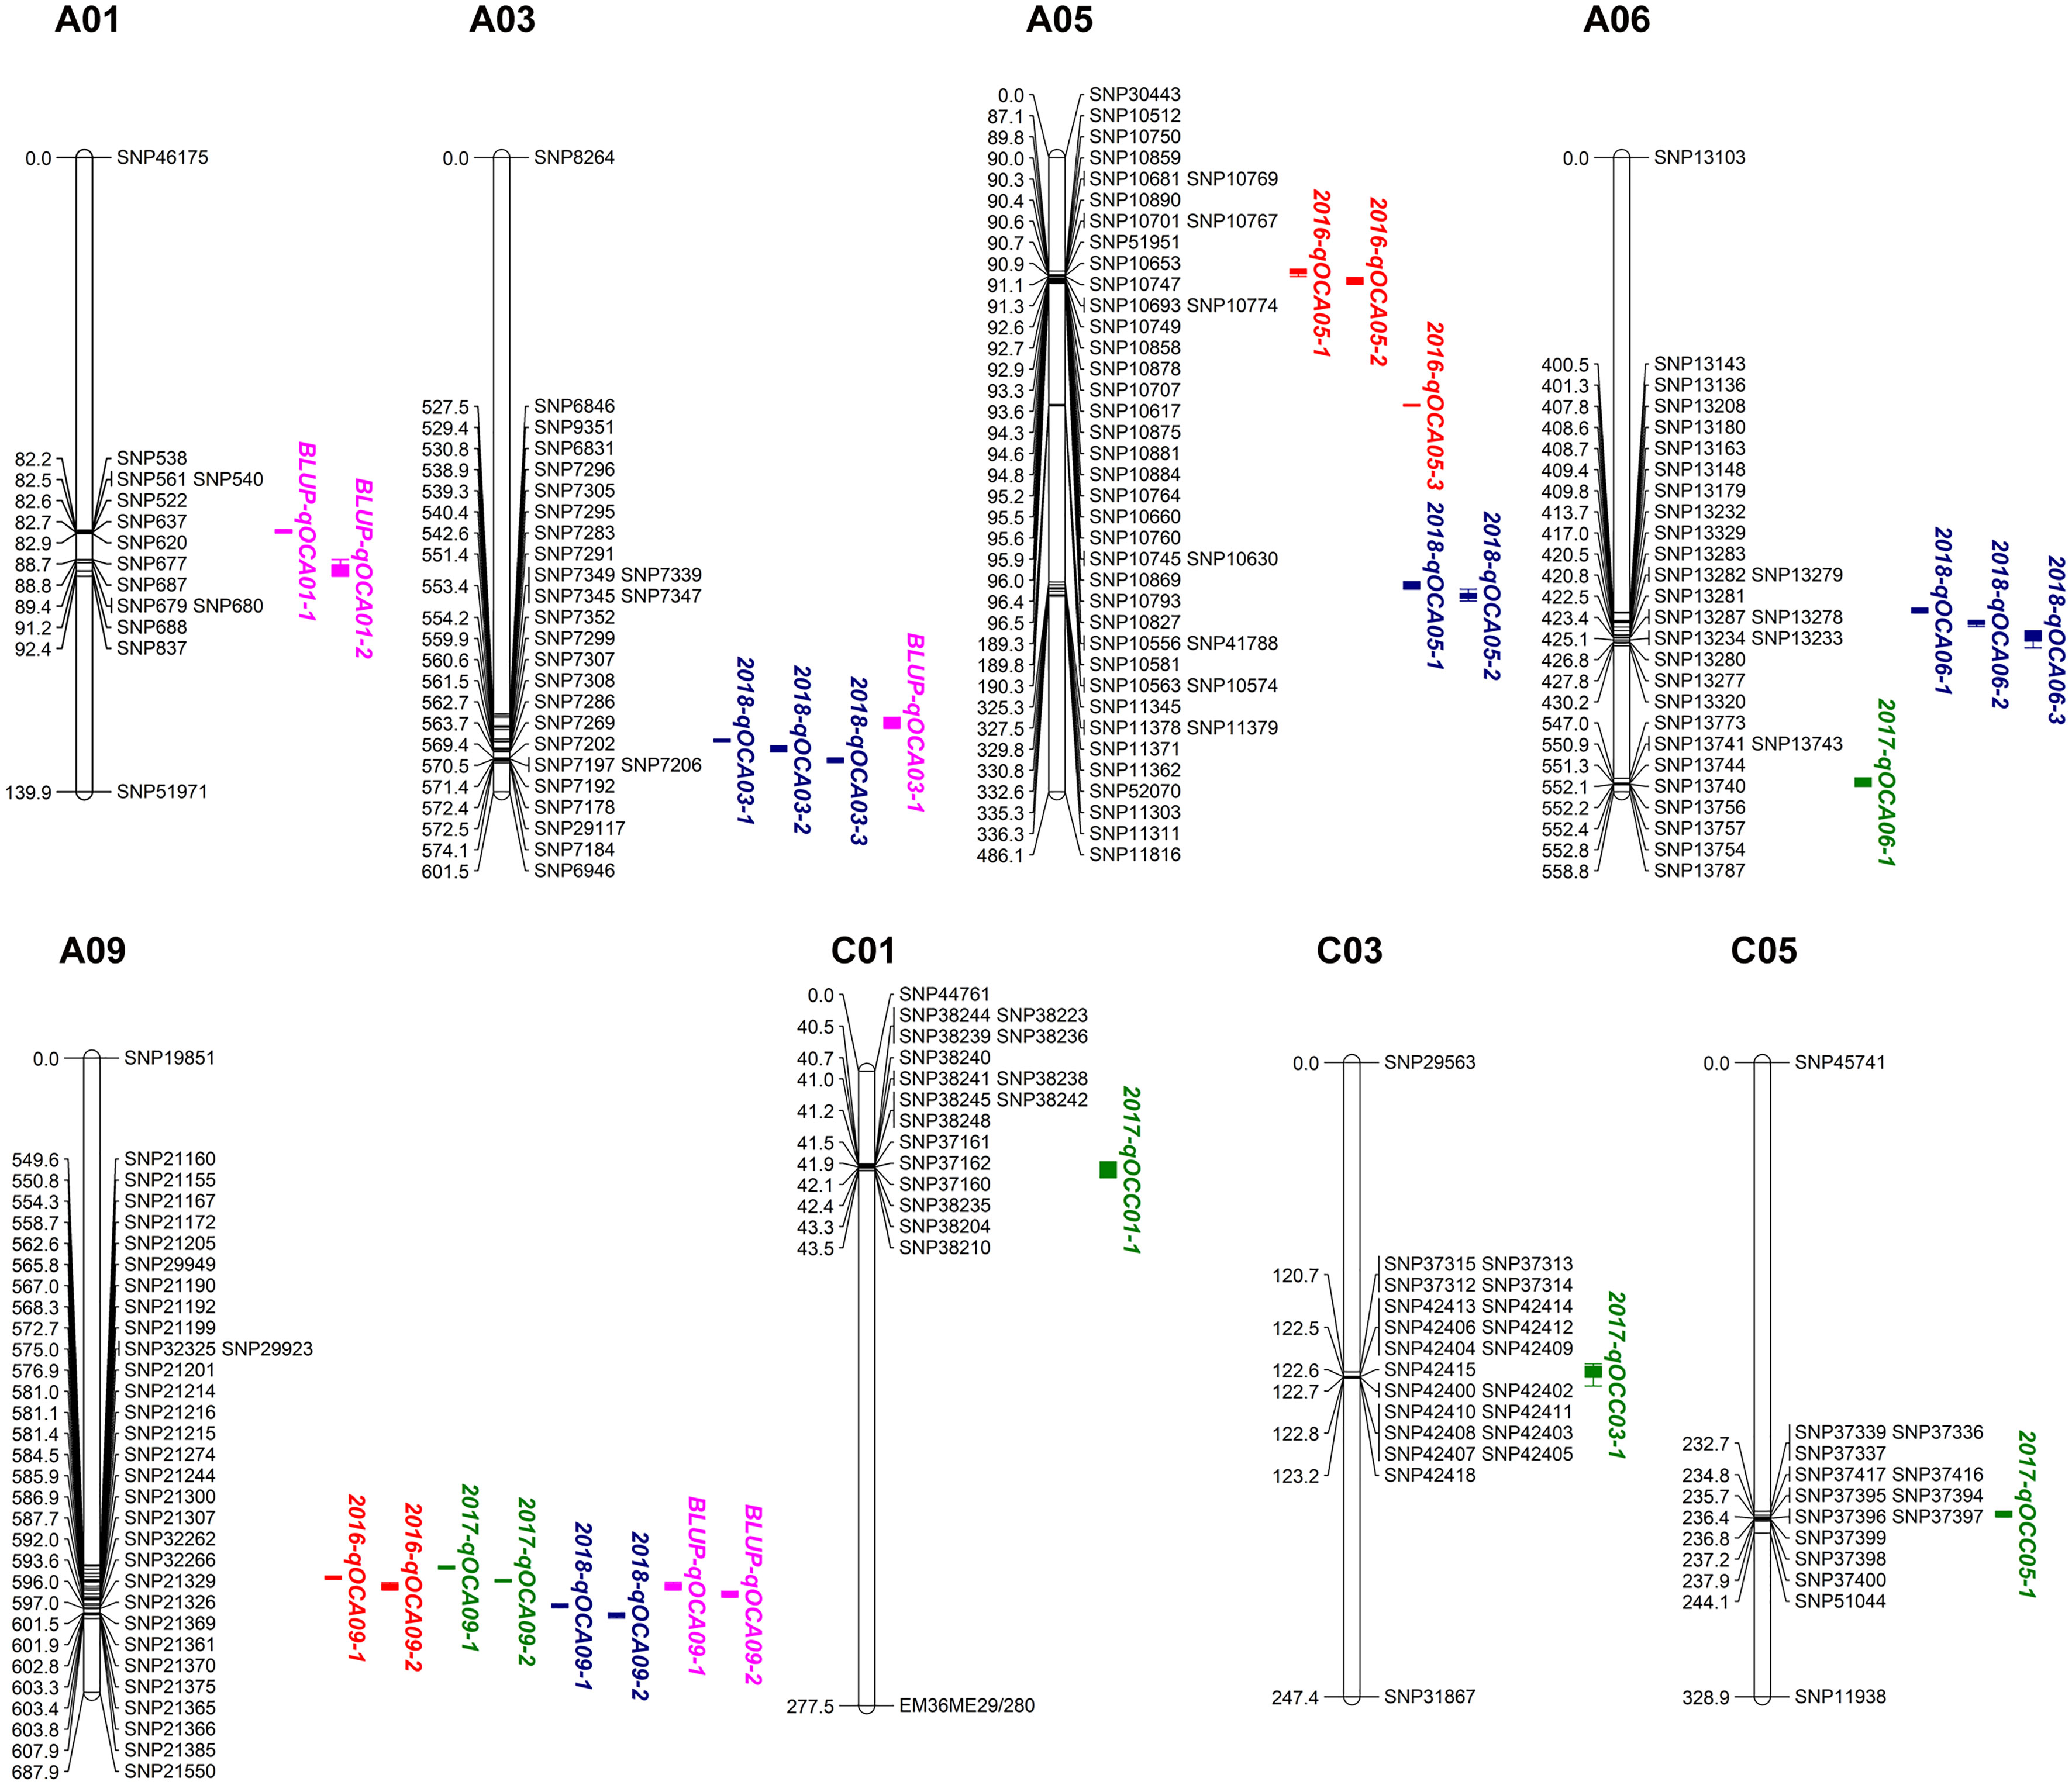
Figure 2 Putative QTL locations of seed oil content on the SNP genetic map. Red, green, blue and pink fonts represent QTL detected in 2016CQ, 2017CQ, 2018CQ and BLUP, respectively.
We identified a total of 1,713 candidate genes within the mapping interval of the 26 SOC-related QTLs (Table S2). These were compared with the genes that were differentially expressed in 30SM and 30SB between extremely high- and low- oil content accessions. Finally, 11 genes that were up-regulated in both high- oil content (CQ24 and CQ52) accessions compared to low- oil content (CQ46) accession were screened as important candidate genes (Y1-Y11) that contribute to the formation of high SOC, and 10 genes that were down-regulated in both high- oil content (CQ24 and CQ52) accessions compared to low- oil content (CQ46) accession (Y12-Y21) were also considered candidate genes that affect SOC, and the details are listed in Table 4.
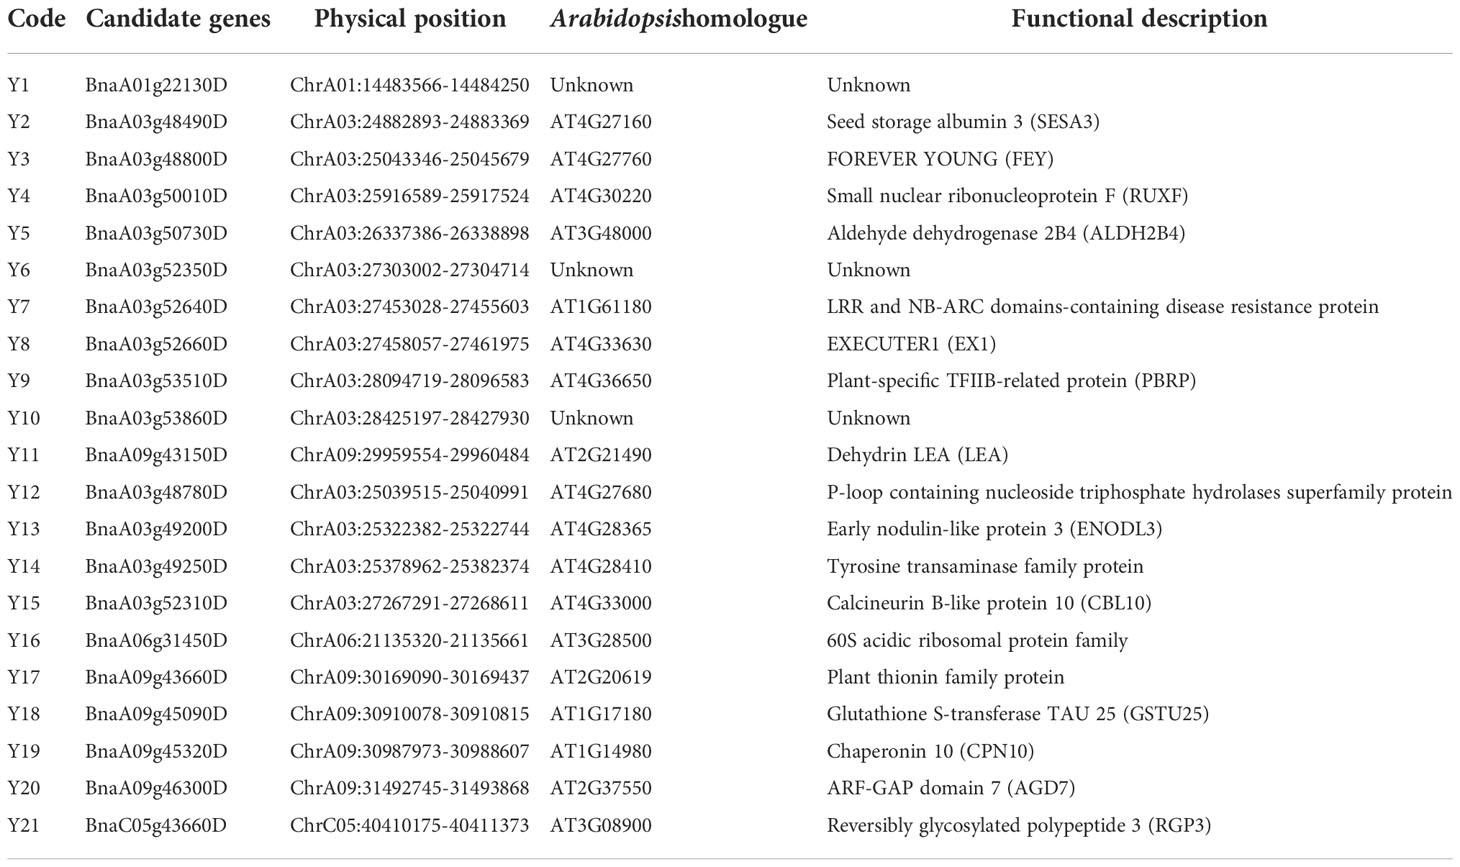
Table 4 Identification of candidate genes by combining QTL mapping with RNA-Seq.
To confirm the accuracy of the RNA-Seq results, 11 candidate genes (Y1-Y11) were performed qRT-PCR analysis, and the expression levels of these genes in 30SM and 30SB between high-SOC (CQ24 and CQ52) and low-SOC accessions (CQ46) by qRT-PCR and transcriptome sequencing (RNA-Seq) are shown in Figure 3. And the qRT-PCR results showed highly consistent with RNA-Seq, which fully demonstrated the reliability and accuracy of the RNA-Seq data.
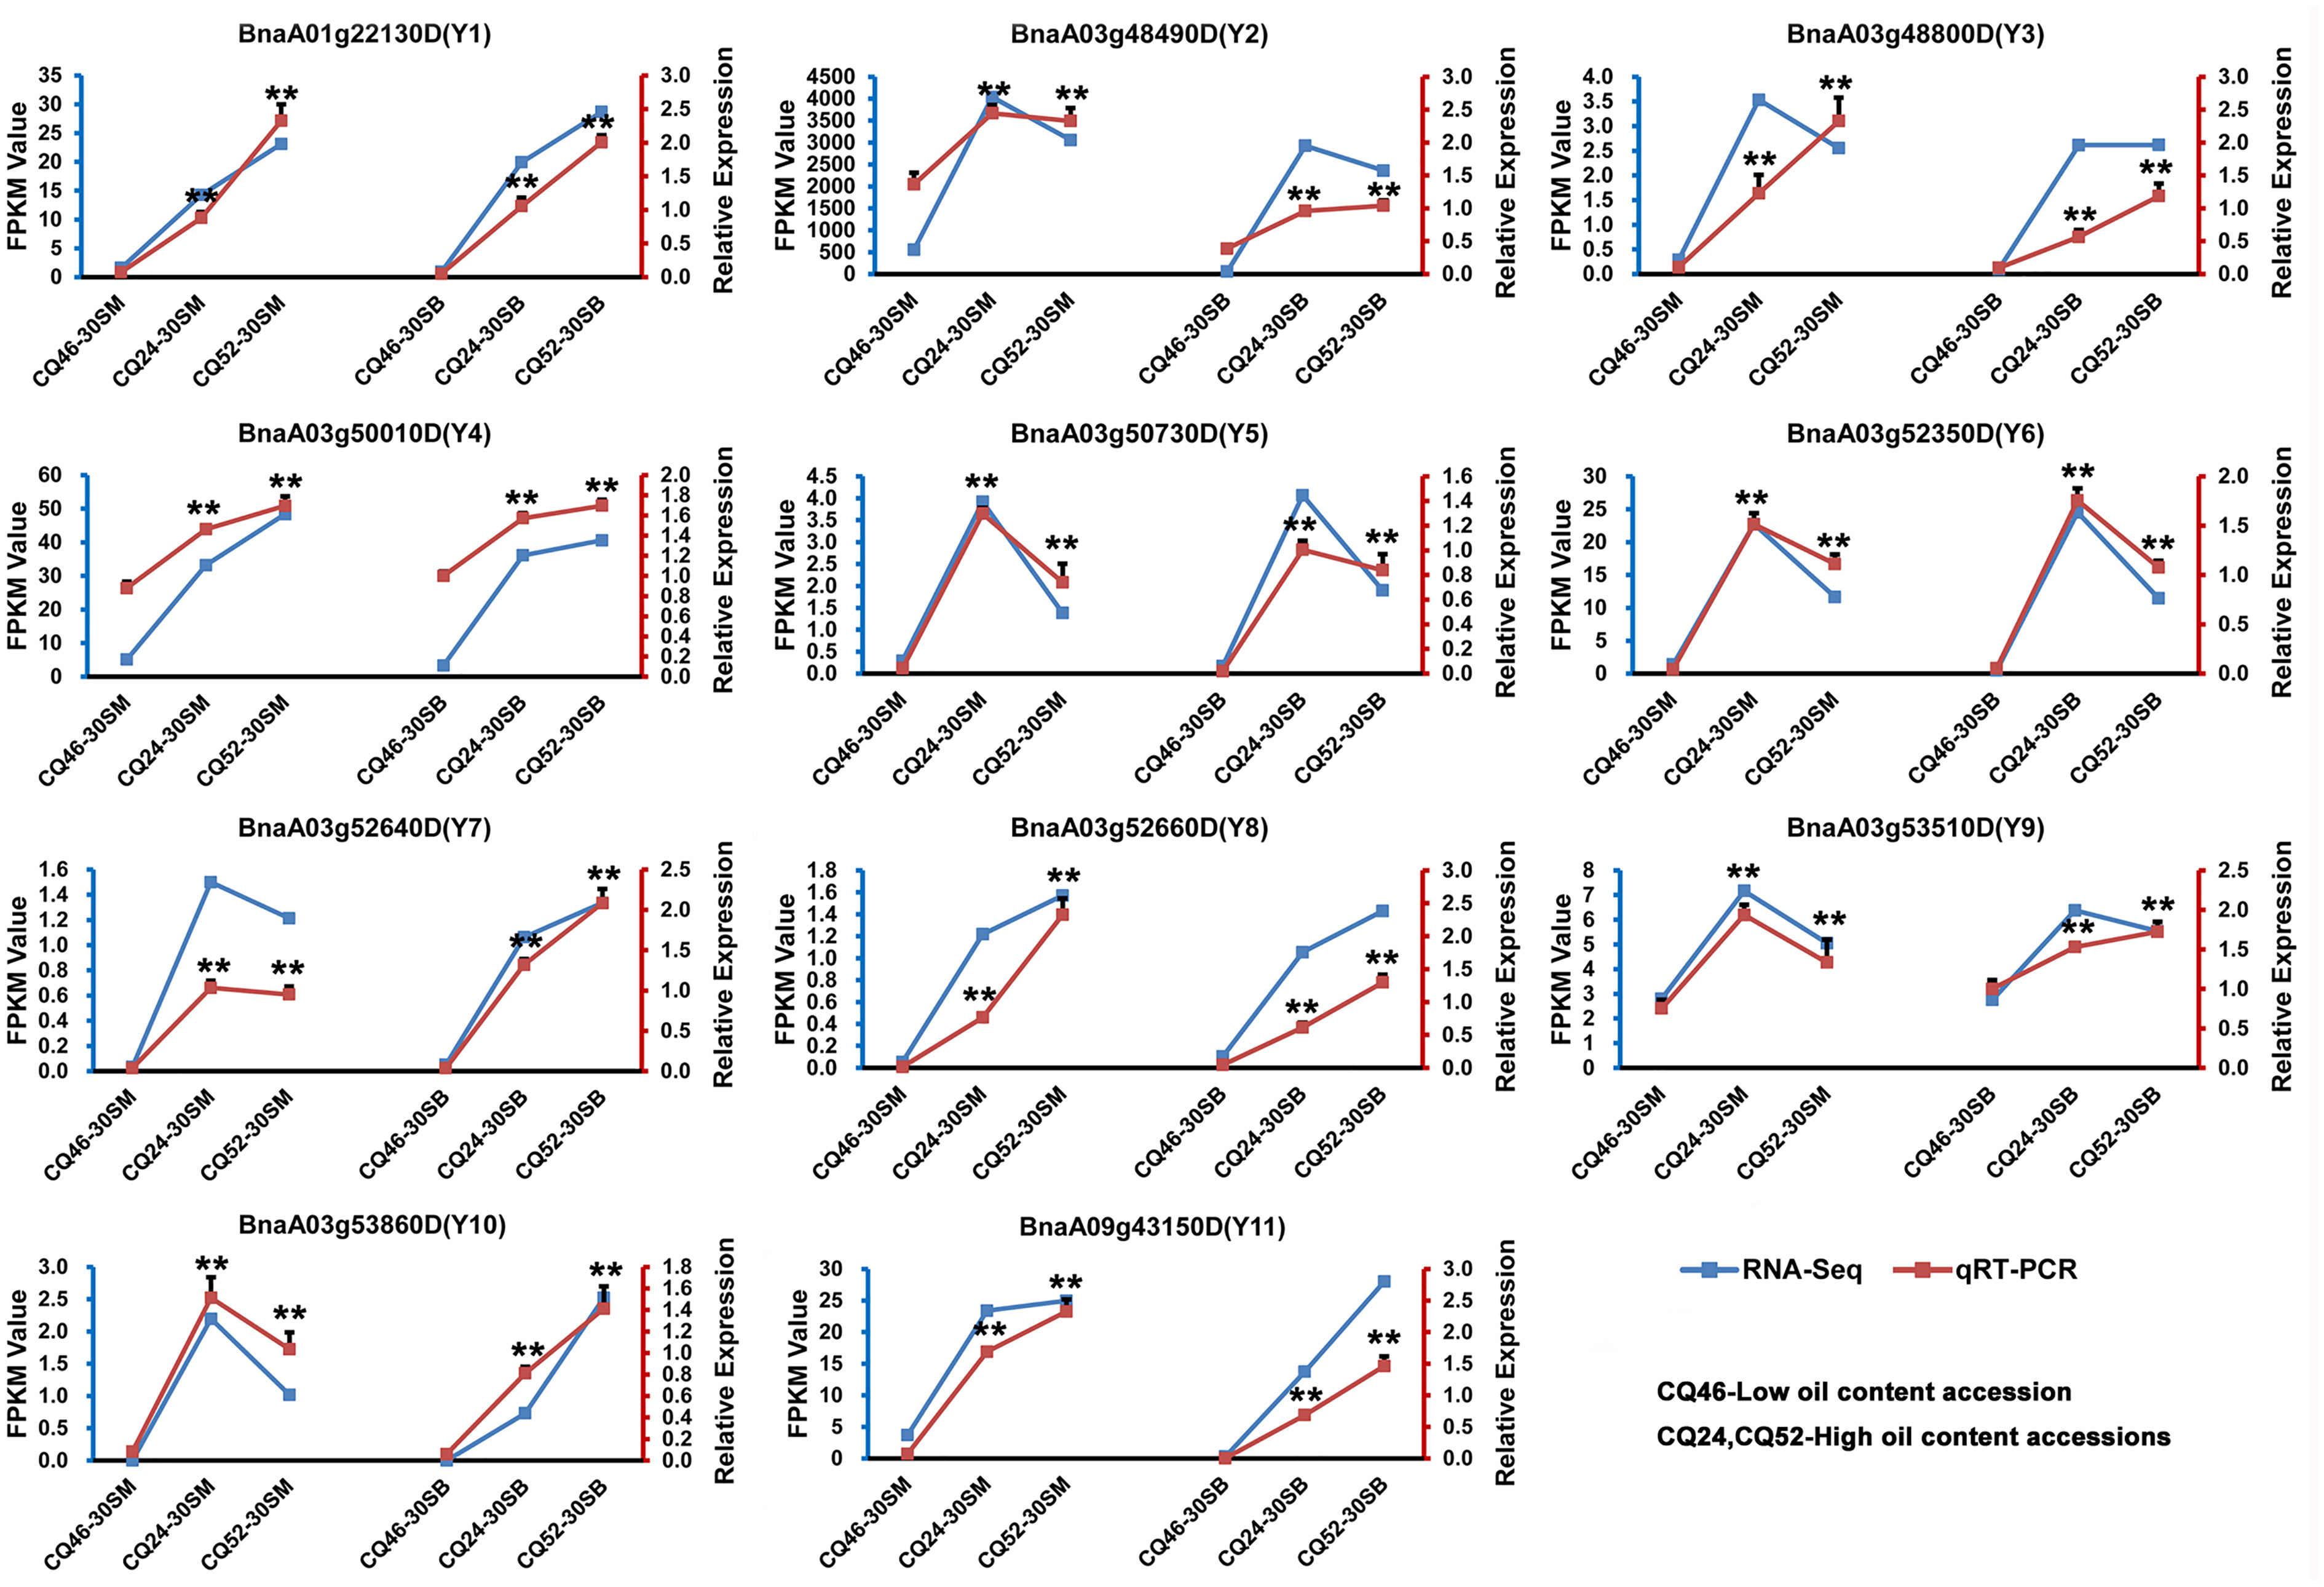
Figure 3 qRT-PCR analysis confirmed the accuracy of transcriptome sequencing by validating the expression patterns of 11 candidate genes in seeds 30 days after flowering on the main inflorescence (30SM) and on the primary branch (30SB). The blue line represents the RNA-Seq results and the red line represents the qRT-PCR results. **Denotes significance differences with P < 0.01, based on Student’s t-test.
To explore the role of candidate genes in seed development, we investigated the expression profiles of all 21 genes in B. napus ZS11 seeds at different developmental stages in the RNA-Seq dataset (BioProject ID PRJNA358784). The accuracy of the transcriptome sequencing has been verified in previous studies (Zhou et al., 2017; Di et al., 2018). 11 candidate genes (Y1-Y11) were expressed in seeds, but the levels often varied at different developmental stages (Figure 4; Table S4). For example, BnaA03g48490D (Y2) and BnaA09g43150D (Y11) were not expressed early in seed development, but were highly expressed in the middle and late stages. BnaA01g22130D (Y1), BnaA03g50010D (Y4), BnaA03g52350D (Y6), BnaA03g53510D (Y9), and BnaA03g53860D (Y10) showed little difference in expression over the course of seed development. BnaA03g48800D (Y3) was expressed in the middle stage of seed development, but was expressed at low levels in the early and late stages. BnaA03g50730D (Y5) exhibited relatively low expression across all stages. BnaA03g52640D (Y7) was expressed at higher levels in the middle and late stages than in the early stage, and the expression level of BnaA03g52660D (Y8) was higher in the late stage than in the early and middle stages of seed development. However, 5 candidate genes (Y12-Y15, Y20) were virtually unexpressed throughout seed development. Y16 and Y17 were only expressed early in seed development. The Y18 was expressed in small amounts throughout seed development, Y19 and Y21 genes were expressed during early and middle seed development. In general, the up-regulated candidate gene (Y1-Y11) in high-SOC accessions had higher expression levels than the down-regulated candidate gene (Y12-Y21) in the whole development process of seeds in B. napus.These results indicate that The up-regulated expression of 11 candidate genes may be more conducive to the formation of high-SOC. in B. napus.
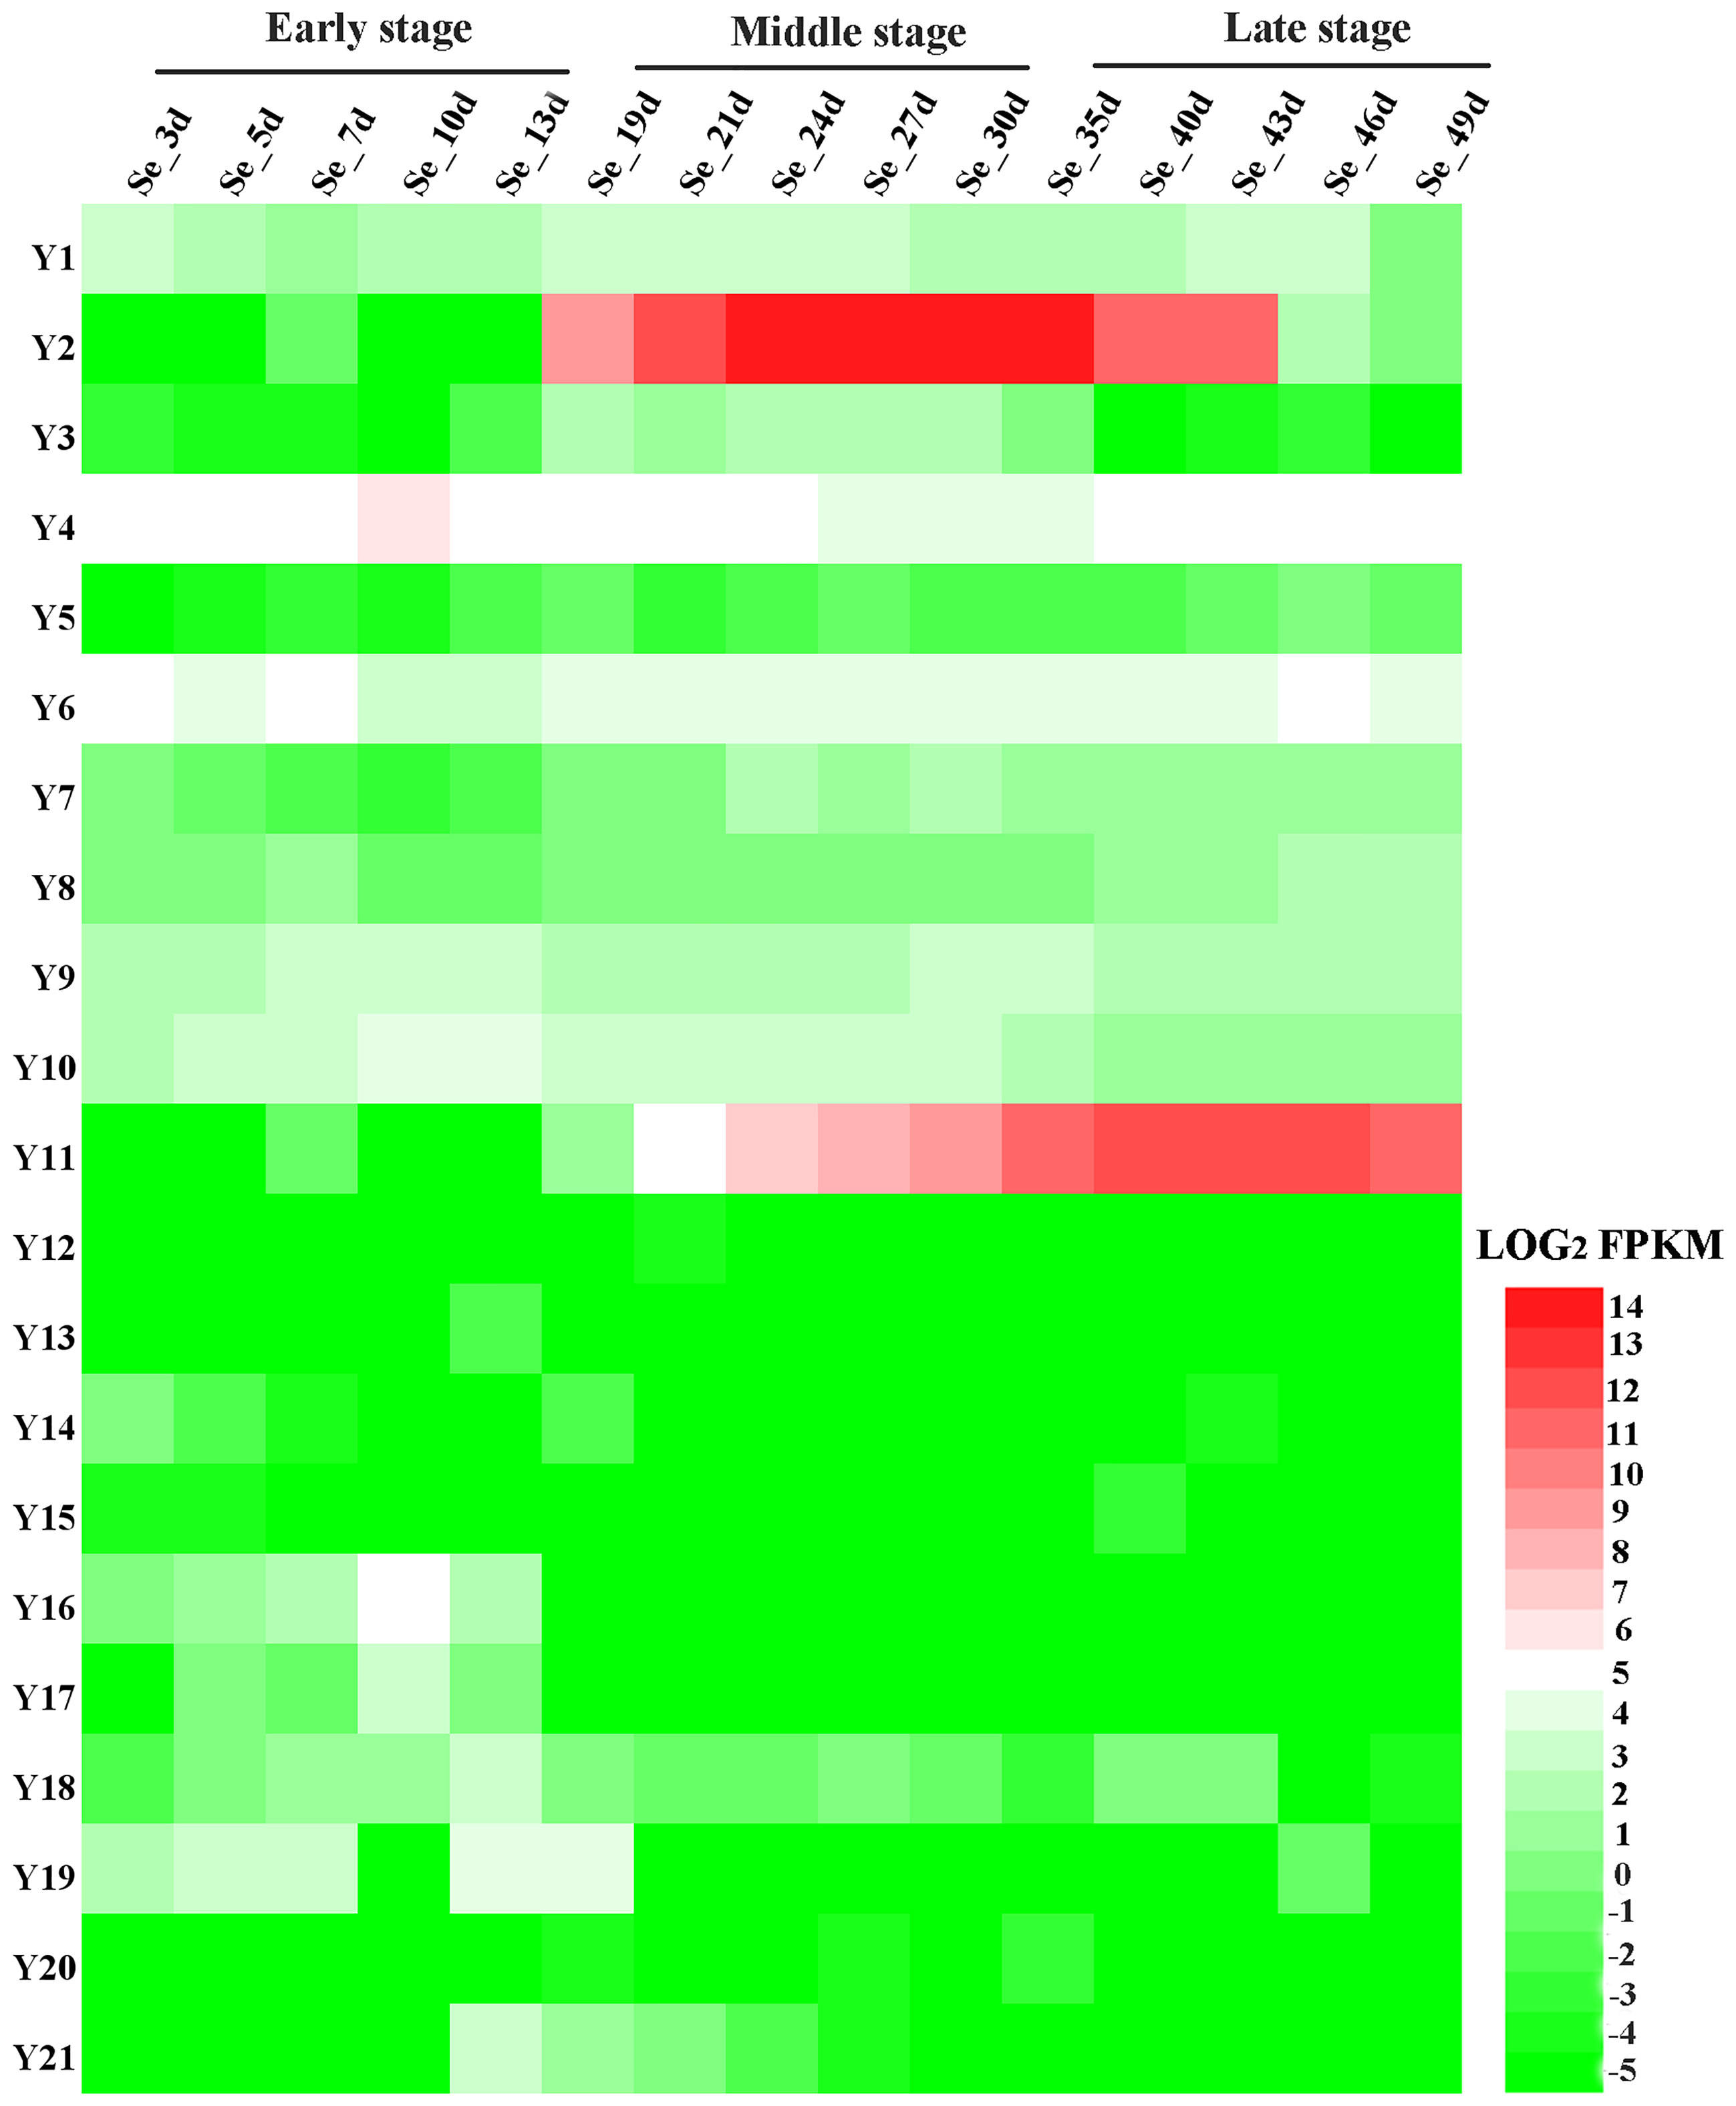
Figure 4 Expression patterns of 21 candidate genes in seeds at different developmental stages in B. napus. Se-3d, 5d, 7d, 10d, 13d, 19d, 21d, 24d, 27d, 30d, 35d, 40d, 43d, 46d, 49d represent seeds from B. napus ZS11, collected on the indicated number of days after pollination. The heatmap was drawn using Heatmap Illustrator (HemI) (Deng et al., 2014). The bar on the lower right corner represents LOG2FPKM; green and red represent low and high expression levels, respectively.
B. napus is an important oil crops around the world. Increasing SOC is a major goal of B. napus breeding (Mollers and Schierholt, 2002; Vigeolas et al., 2007; Tan et al., 2011; Fu et al., 2017). In current study, we found that there is a significant positive correlation between SOC and economic yield and harvest index (Table 2). In B. napus breeding, enhancing the SOC may increase both economic yield and harvest index. Therefore, discovering genetic loci that control SOC, and uncovering their genetic mechanism are key to developing high-SOC varieties. Meanwhile, it is an effective way to identify candidate genes related to SOC and improve the SOC of B. napus by genetic engineering technology.
Although there have been many efforts to map QTLs controlling SOC, the loci discovered are different due to the use of different markers and populations. In current study, a new recombinant inbred population (RIL) containing 186 lines was constructed from a cross between ‘GH06’ and ‘ZY821’, two varieties with significant difference in SOC. A total of 26 QTLs were obtained, of which 13 are novel (Table 3). We were able to determine if they overlapped on the chromosomes by comparing the physical positions of QTLs obtained in this study with QTLs related to SOC obtained in previous studies using Darmor-bzh v4.1 reference genome of Brassica napus (Chalhoub et al., 2014). In this study, 2018-qOCA06-2 overlaps with the RNSL-qOC-A6 obtained by Delourme et al (Delourme et al., 2006), BLUP-qOCA03-1 overlaps with the TN-qOC-A3-1, and 2016-qOCA09-1, 2016-qOCA09-2, 2017-qOCA09-1, 2017-qOCA09-2, 2018-qOCA09-1, BLUP-qOCA09-1, BLUP-qOCA09-2 overlap with qOC-A9-4-TN obtained by Jiang et al (Jiang et al., 2014). 2016-qOCA09-2, 2018-qOCA09-1, BLUP-qOCA09-1, BLUP-qOCA09-2 overlap with the cqOC-A9-9, 2018-qOCA09-2 overlaps with cqOC-A9-10, 2017-qOCC05-1 overlaps with cqOC-C5-7 and cqOC-C5-8 obtained in Chao’s study (Chao et al., 2017). Besides, the BLUP-qOCA03-1 overlaps with the Bn-A03-p2948394, 2018-qOCA06-2 overlaps with Bn-A06-p16689717, and 2017-qOCA09-2 overlaps with Bn-A09-p32713083, BLUP-qOCA09-1 overlaps with Bn-A09-p32713083 and Bn-A09-p32864411, and 2017-qOCC01-1 overlaps with Bn-scaff_17592_1-p654560 detected by Liu et al (Liu et al., 2016). The 2018-qOCA05-2 obtained in this study overlaps with the snp842906 obtained from Wang et al (Wang et al., 2018). The detected QTLs overlapped within our study and with other QTLs identified by others, indicating high reliability for further analysis.
In this study, 21 candidate genes (Y1-Y21) were screened related to SOC. However, 11 up-regulated candidate genes (Y1-Y11) in high-SOC accessions were considered to be candidates for the formation of high-SOC. Therefore, we will focus on these 11 candidate genes. Among all the 11 candidate genes (Y1-Y11) related to high-SOC formation, only Y1 (BnaA01g22130D), Y9 (BnaA03g53510D) and Y10 (BnaA03g53860D) were located in the novel QTL regions, and the remaining eight candidate genes were located in the overlapped QTLs detected previously. And there were seven candidate genes in the overlapped BLUP-qOCA03-1 locus detected previously, which indicated that the BLUP-qOCA03-1 may be a key locus associated with high SOC, which could provide a basis for marker-assisted breeding. And the homologous genes and functional descriptions of these genes in Arabidopsis thaliana were shown in Table 4. Among them, BnaA01g22130D (Y1), BnaA03g52350D (Y6) and BnaA03g53860D (Y10) are new proteins that have not been reported. The Arabidopsis homologs of other 8 candidate genes perform a variety of functions in growth, defense, and development (Table 4). Of these, we found BnaA03g48490D (Y2) is a putative seed storage albumin (AtSESA3). BnaA03g48800D (Y3) encodes an oxidoreductase required for proper development of the Arabidopsis vegetative shoot apex (Callos et al., 1994). BnaA03g50010D (Y4) is AT4G30220 (AtRUXF) is a putative SmF component of Sm accessory ribonucleoprotein complex. BnaA03g50730D (Y5) encodes a putative (NAD+) aldehyde dehydrogenase. BnaA03g52640D (Y7) is LRR and NB-ARC domains-containing disease resistance protein. BnaA03g52660D (Y8) is a protein putatively involved in plastid to nucleus signaling (Lee et al., 2007). BnaA03g53510D (Y9) is a general transcription factor for RNA polymerase I (Imamura et al., 2008). And we find BnaA09g43150D (Y11), the Late embryogenesis-abundant (LEA) homolog, to be the most compelling candidate because of its direct role in embryogenesis. LEA proteins are considered to be a large and highly diverse family involved in normal plant growth, seed development and the abiotic stress response (Chen et al., 2019; Jin et al., 2019). To date, LEA proteins have been identified in Arabidopsis (Hundertmark and Hincha, 2008), rice (Oryza sativa) (Wang et al., 2007), apple (Malus domestica) (Liang et al., 2012), tomato (Solanum lycopersicum) (Cao and Li, 2015), black popular (Populus trichocarpa) (Lan et al., 2013), and sweet orange (Citrus sinensis L. Osb.) (Pedrosa et al., 2015). Furthermore, Liang et al. (2016) identified 108 BnLEA genes in the B. napus genome and classified them into eight families based on their conserved domains (Liang et al., 2016). A study showed that overexpression (OE) of different copies of the drought response genes LEA3 (not Y11) enhanced both drought tolerance and oil content in Brassica napus and Arabidopsis, and seed size, seed weight and membrane stability were also improved in OE lines. In contrast, oil content and drought tolerance were decreased in the AtLEA3 mutant (atlea3) of Arabidopsis and in BnLEA-RNAi B. napus RNAi lines (Liang et al., 2019). Therefore, we speculate that the candidate gene Y11 obtained in this study has an important function in improving seed oil content and abiotic resistance in B. napus.
To date, the gene function in B. napus of the 11 candidate genes (Y1-Y11) that contribute to the formation of high-SOC were highlighted in this study has not been reported. We hypothesize that the 11 novel genes identified in our study influence the SOC of B. napus. Therefore, in the following research, we plan to explore these genes further to provide a basis for the molecular breeding of high-SOC B. napus.
We detected 26 QTLs associated with SOC in B. napus, that explained 3.69-18.47% of the phenotypic variation. Thirteen of these QTLs are reported here for the first time. And 1,713 candidate genes from the 26 QTLs mapping interval were obtained. Meanwhile, an analysis of DEGs between high- and low-SOC accessions revealed 21 candidate genes (Y1-Y21) related to SOC, and 11 candidate genes (Y1-Y11) contributing to the formation of high-SOC were highlighted. Current findings provide key information about the genetic loci associated with SOC, facilitating molecular breeding for higher SOC in B. napus.
The RNA-Seq datasets presented in this study can be found in online repositories. The names of the repository/repositories and accession number(s) can be found below: BIG Data Center under BioProject accession number PRJNA602979. And CQ46-30SM corresponds to CQ46-30ZS, CQ24-30SM corresponds to CQ24-30ZS, CQ52-30SM corresponds to CQ52-30ZS, CQ46-30SB corresponds to CQ46-30CS, CQ24-30SB corresponds to CQ24-30CS, CQ52-30SB corresponds to CQ52-30CS.
JL and ZX conceived and designed the experiments. ZX, CZ, CQ, and LW performed the experiments. LZ, BY, and KL analyzed the data. ZX and JL wrote and revised the manuscript. All authors contributed to the article and approved the submitted version.
This research was funded by the growth project of young scientific and technological talents in general colleges and universities in Guizhou Province (Qianjiaohe KY [2022] 101), Science and technology support project of Qianxinan Prefecture (2022QXN22728), Doctoral Research Fund project (20XYBS19), National Key R & D Program of China (2018YFD0200903; 2018YFD0100504), the “111”Project (B12006), Modern Agro-industry Technology Research System (CARS-13), Fundamental Research Funds for the Central Universities (XDJK2018C095; XDJK2017B030).
We extend our thanks to the reviewers for their careful reading and helpful comments on this manuscript.
The authors declare that the research was conducted in the absence of any commercial or financial relationships that could be construed as a potential conflict of interest.
All claims expressed in this article are solely those of the authors and do not necessarily represent those of their affiliated organizations, or those of the publisher, the editors and the reviewers. Any product that may be evaluated in this article, or claim that may be made by its manufacturer, is not guaranteed or endorsed by the publisher.
The Supplementary Material for this article can be found online at: https://www.frontiersin.org/articles/10.3389/fpls.2022.1067121/full#supplementary-material
Callos, J. D., DiRado, M., Xu, B., Behringer, F. J., Link, B. M., Medford, J. I. (1994). The forever young gene encodes an oxidoreductase required for proper development of the arabidopsis vegetative shoot apex. Plant J. 6 (6), 835–847. doi: 10.1046/j.1365-313x.1994.6060835.x
Cao, J., Li, X. (2015). Identification and phylogenetic analysis of late embryogenesis abundant proteins family in tomato (Solanum lycopersicum). Planta 241 (3), 757–772. doi: 10.1007/s00425-014-2215-y
Chalhoub, B., Denoeud, F., Liu, S., Parkin, I. A., Tang, H., Wang, X., et al. (2014). Plant genetics. early allopolyploid evolution in the post-neolithic Brassica napus oilseed genome. Science 345 (6199), 950–953. doi: 10.1126/science.1253435
Chao, H. B., Wang, H., Wang, X. D., Guo, L. X., Gu, J. W., Zhao, W. G., et al. (2017). Genetic dissection of seed oil and protein content and identification of networks associated with oil content in Brassica napus. Sci. Rep. 7, 46295. doi: 10.1038/Srep46295
Chen, G., Geng, J. F., Rahman, M., Liu, X. P., Tu, J. X., Fu, T. D., et al. (2010). Identification of QTL for oil content, seed yield, and flowering time in oilseed rape (Brassica napus). Euphytica 175 (2), 161–174. doi: 10.1007/s10681-010-0144-9
Chen, Y., Li, C., Zhang, B., Yi, J., Yang, Y., Kong, C., et al. (2019). The role of the late embryogenesis-abundant (LEA) protein family in development and the abiotic stress response: A comprehensive expression analysis of potato (Solanum tuberosum). Genes (Basel) 10 (2), 148. doi: 10.3390/genes10020148
Delourme, R., Falentin, C., Huteau, V., Clouet, V., Horvais, R., Gandon, B., et al. (2006). Genetic control of oil content in oilseed rape (Brassica napus l.). Theor. Appl. Genet. 113 (7), 1331–1345. doi: 10.1007/s00122-006-0386-z
Deng, W. K., Wang, Y. B., Liu, Z. X., Cheng, H., Xue, Y. (2014). HemI: A toolkit for illustrating heatmaps. PloS One 9 (11), e111988. doi: 10.1371/journal.pone.0111988
Di, F. F., Jian, H. J., Wang, T. Y., Chen, X. P., Ding, Y. R., Du, H., et al. (2018). Genome-wide analysis of the PYL gene family and identification of PYL genes that respond to abiotic stress in Brassica napus. Genes 9 (3), 156. doi: 10.3390/Genes9030156
Fu, Y., Zhang, D. Q., Gleeson, M., Zhang, Y. F., Lin, B. G., Hua, S. J., et al. (2017). Analysis of QTL for seed oil content in Brassica napus by association mapping and QTL mapping. Euphytica 213 (1), 17. doi: 10.1007/s10681-016-1817-9
Hua, W., Liu, J., Wang, H. Z. (2016). Molecular regulation and genetic improvement of seed oil content in Brassica napus l. Front. of Agric. Sci. and Eng. 3 (3), 186–194. doi: 10.15302/J-Fase-2016107
Hua, W., Li, R. J., Zhan, G. M., Liu, J., Li, J., Wang, X. F., et al. (2012). Maternal control of seed oil content in Brassica napus: the role of silique wall photosynthesis. Plant J. 69 (3), 432–444. doi: 10.1111/j.1365-313X.2011.04802.x
Hu, Z. Y., Hua, W., Zhang, L., Deng, L. B., Wang, X. F., Liu, G. H., et al. (2013). Seed structure characteristics to form ultrahigh oil content in rapeseed. PloS One 8 (4), e62099. doi: 10.1371/journal.pone.0062099
Hundertmark, M., Hincha, D. K. (2008). LEA (Late embryogenesis abundant) proteins and their encoding genes in arabidopsis thaliana. BMC Genomics 9, 118. doi: 10.1186/1471-2164-9-118
Imamura, S., Hanaoka, M., Tanaka, K. (2008). The plant-specific TFIIB-related protein, pBrp, is a general transcription factor for RNA polymerase I. EMBO J. 27 (17), 2317–2327. doi: 10.1038/emboj.2008.151
Jiang, C. C., Shi, J. Q., Li, R. Y., Long, Y., Wang, H., Li, D. R., et al. (2014). Quantitative trait loci that control the oil content variation of rapeseed (Brassica napus l.). Theor. and Appl. Genet. 127 (4), 957–968. doi: 10.1007/s00122-014-2271-5
Jin, X. F., Cao, D., Wang, Z. J., Ma, L. L., Tian, K. H., Liu, Y. L., et al. (2019). Genome-wide identification and expression analyses of the LEA protein gene family in tea plant reveal their involvement in seed development and abiotic stress responses. Sci. Rep. 9 (1), 14123. doi: 10.1038/S41598-019-50645-8
Lan, T., Gao, J., Zeng, Q. Y. (2013). Genome-wide analysis of the LEA (late embryogenesis abundant) protein gene family in populus trichocarpa. Tree Genet. Genomes 9 (1), 253–264. doi: 10.1007/s11295-012-0551-2
Lee, K. P., Kim, C., Landgraf, F., Apel, K. (2007). EXECUTER1- and EXECUTER2-dependent transfer of stress-related signals from the plastid to the nucleus of arabidopsis thaliana. Proc. Natl. Acad. Sci. U.S.A. 104 (24), 10270–10275. doi: 10.1073/pnas.0702061104
Liang, Y., Kang, K., Gan, L., Ning, S., Xiong, J., Song, S., et al. (2019). Drought-responsive genes, late embryogenesis abundant group3 (LEA3) and vicinal oxygen chelate, function in lipid accumulation in Brassica napus and arabidopsis mainly via enhancing photosynthetic efficiency and reducing ROS. Plant Biotechnol. J. 17 (11), 2123–2142. doi: 10.1111/pbi.13127
Liang, D., Xia, H., Wu, S., Ma, F. W. (2012). Genome-wide identification and expression profiling of dehydrin gene family in malus domestica. Mol. Biol. Rep. 39 (12), 10759–10768. doi: 10.1007/s11033-012-1968-2
Liang, Y., Xiong, Z. Y., Zheng, J. X., Xu, D. Y., Zhu, Z. Y., Xiang, J., et al. (2016). Genome-wide identification, structural analysis and new insights into late embryogenesis abundant (LEA) gene family formation pattern in Brassica napus. Sci. Rep. 6, 24265. doi: 10.1038/Srep24265
Liu, S., Fan, C. C., Li, J. N., Cai, G. Q., Yang, Q. Y., Wu, J., et al. (2016). A genome-wide association study reveals novel elite allelic variations in seed oil content of Brassica napus. Theor. and Appl. Genet. 129 (6), 1203–1215. doi: 10.1007/s00122-016-2697-z
Mollers, C., Schierholt, A. (2002). Genetic variation of palmitate and oil content in a winter oilseed rape doubled haploid population segregating for oleate content. Crop Sci. 42 (2), 379–384. doi: 10.2135/cropsci2002.3790
Pedrosa, A. M., Martins, C. D. S., Goncalves, L. P., Costa, M. G. C. (2015). Late embryogenesis abundant (LEA) constitutes a Large and diverse family of proteins involved in development and abiotic stress responses in sweet orange (Citrus sinensis l. osb.). PloS One 10 (12), e0145785. doi: 10.1371/journal.pone.0145785
Silva Lda, C., Wang, S., Zeng, Z. B. (2012). Composite interval mapping and multiple interval mapping: procedures and guidelines for using windows QTL cartographer. Methods Mol. Biol. 871, 75–119. doi: 10.1007/978-1-61779-785-9_6
Si, P., Mailer, R. J., Galwey, N., Turner, D. W. (2003). Influence of genotype and environment on oil and protein concentrations of canola (Brassica napus l.) grown across southern Australia. Aust. J. of Agric. Res. 54 (4), 397–407. doi: 10.1071/AR01203
Sun, F. M., Liu, J., Hua, W., Sun, X. C., Wang, X. F., Wang, H. Z. (2016). Identification of stable QTLs for seed oil content by combined linkage and association mapping in Brassica napus. Plant Sci. 252, 388–399. doi: 10.1016/j.plantsci.2016.09.001
Tan, H., Yang, X., Zhang, F., Zheng, X., Qu, C., Mu, J., et al. (2011). Enhanced seed oil production in canola by conditional expression of Brassica napus LEAFY COTYLEDON1 and LEC1-LIKE in developing seeds. Plant Physiol. 156 (3), 1577–1588. doi: 10.1104/pp.111.175000
Vigeolas, H., Waldeck, P., Zank, T., Geigenberger, P. (2007). Increasing seed oil content in oil-seed rape (Brassica napus l.) by over-expression of a yeast glycerol-3-phosphate dehydrogenase under the control of a seed-specific promoter. Plant Biotechnol. J. 5 (3), 431–441. doi: 10.1111/j.1467-7652.2007.00252.x
Wang, X. F., Liu, G. H., Yang, Q., Hua, W., Liu, J., Wang, H. Z. (2010). Genetic analysis on oil content in rapeseed (Brassica napus l.). Euphytica 173 (1), 17–24. doi: 10.1007/s10681-009-0062-x
Wang, X. D., Wang, H., Long, Y., Li, D. R., Yin, Y. T., Tian, J. H., et al. (2013). Identification of QTLs associated with oil content in a high-oil Brassica napus cultivar and construction of a high-density consensus map for QTLs comparison in b. napus. PloS One 8 (12), e80569. doi: 10.1371/journal.pone.0080569
Wang, B., Wu, Z. K., Li, Z. H., Zhang, Q. H., Hu, J. L., Xiao, Y. J., et al. (2018). Dissection of the genetic architecture of three seed-quality traits and consequences for breeding in Brassica napus. Plant Biotechnol. J. 16 (7), 1336–1348. doi: 10.1111/pbi.12873
Wang, X. S., Zhu, H. B., Jin, G. L., Liu, H. L., Wu, W. R., Zhu, J. (2007). Genome-scale identification and analysis of LEA genes in rice (Oryza sativa l.). Plant Sci. 172 (2), 414–420. doi: 10.1016/j.plantsci.2006.10.004
Wu, Y. H., Bhat, P. R., Close, T. J., Lonardi, S. (2008). Efficient and accurate construction of genetic linkage maps from the minimum spanning tree of a graph. PloS Genet. 4 (10), e1000212. doi: 10.1371/journal.pgen.1000212
Xiao, Z., Zhang, C., Tang, F., Yang, B., Zhang, L., Liu, J., et al. (2019). Identification of candidate genes controlling oil content by combination of genome-wide association and transcriptome analysis in the oilseed crop Brassica napus. Biotechnol. Biofuels 12, 216. doi: 10.1186/s13068-019-1557-x
Yan, X. Y., Li, J. N., Fu, F. Y., Jin, M. Y., Liu, L. Z., et al. (2009). Co-location of seed oil content, seed hull content and seed coat color QTL in three different environments in Brassica napus L. Euphytica 170, 355–364. doi: 10.1007/s10681-009-0006-5
Zhao, J. Y., Huang, J. X., Chen, F., Xu, F., Ni, X. Y., Xu, H. M., et al. (2012). Molecular mapping of arabidopsis thaliana lipid-related orthologous genes in Brassica napus. Theor. and Appl. Genet. 124 (2), 407–421. doi: 10.1007/s00122-011-1716-3
Keywords: Brassica napus, seed oil content, QTL mapping, differentially expressed genes (DEGs), candidate genes
Citation: Xiao Z, Zhang C, Qu C, Wei L, Zhang L, Yang B, Lu K and Li J (2022) Identification of candidate genes regulating seed oil content by QTL mapping and transcriptome sequencing in Brassica napus. Front. Plant Sci. 13:1067121. doi: 10.3389/fpls.2022.1067121
Received: 11 October 2022; Accepted: 24 November 2022;
Published: 08 December 2022.
Edited by:
Hongbo Chao, Zhengzhou University, ChinaReviewed by:
Jun Li, Oil Crops Research Institute, Chinese Academy of Agricultural Sciences, ChinaCopyright © 2022 Xiao, Zhang, Qu, Wei, Zhang, Yang, Lu and Li. This is an open-access article distributed under the terms of the Creative Commons Attribution License (CC BY). The use, distribution or reproduction in other forums is permitted, provided the original author(s) and the copyright owner(s) are credited and that the original publication in this journal is cited, in accordance with accepted academic practice. No use, distribution or reproduction is permitted which does not comply with these terms.
*Correspondence: Jiana Li, bGpuMTk1MEBzd3UuZWR1LmNu
Disclaimer: All claims expressed in this article are solely those of the authors and do not necessarily represent those of their affiliated organizations, or those of the publisher, the editors and the reviewers. Any product that may be evaluated in this article or claim that may be made by its manufacturer is not guaranteed or endorsed by the publisher.
Research integrity at Frontiers
Learn more about the work of our research integrity team to safeguard the quality of each article we publish.