 Fernanda R. Castro-Moretti1
 Jean-Christophe Cocuron2
 Humberto Castillo-Gonzalez3
 Efrain Escudero-Leyva4,5
 Priscila Chaverri3,4Oliveiro Guerreiro-Filho6
 Jason C. Slot7
 Ana Paula Alonso1,2*
- 1BioDiscovery Institute and Department of Biological Sciences, University of North Texas, Denton, TX, United States
- 2BioAnalytical Facility, University of North Texas, Denton, TX, United States
- 3Department of Plant Science and Landscape Architecture, University of Maryland, College Park, MD, United States
- 4School of Biology and Natural Products Research Center Centro de Investigaciones en Productos Naturales (CIPRONA), University of Costa Rica, San Jose, Costa Rica
- 5Centro Nacional de Alta Technologia-Consejo Nacional de Rectores (CeNAT-CONARE), National Center for Biotechnological Innovations (CENIBiot), San Jose, Costa Rica
- 6Coffee Center Agronomic Institute, Campinas, Sao Paulo, Brazil
- 7Department of Plant Pathology, The Ohio State University, Columbus, OH, United States
Introduction: Products of plant secondary metabolism, such as phenolic compounds, flavonoids, alkaloids, and hormones, play an important role in plant growth, development, stress resistance. The plant family Rubiaceae is extremely diverse and abundant in Central America and contains several economically important genera, e.g. Coffea and other medicinal plants. These are known for the production of bioactive polyphenols (e.g. caffeine and quinine), which have had major impacts on human society. The overall goal of this study was to develop a high-throughput workflow to identify and quantify plant polyphenols.
Methods: First, a method was optimized to extract over 40 families of phytochemicals. Then, a high-throughput metabolomic platform has been developed to identify and quantify 184 polyphenols in 15 min.
Results: The current metabolomics study of secondary metabolites was conducted on leaves from one commercial coffee variety and two wild species that also belong to the Rubiaceae family. Global profiling was performed using liquid chromatography high-resolution time-of-flight mass spectrometry. Features whose abundance was significantly different between coffee species were discriminated using statistical analysis and annotated using spectral databases. The identified features were validated by commercially available standards using our newly developed liquid chromatography tandem mass spectrometry method.
Discussion: Caffeine, trigonelline and theobromine were highly abundant in coffee leaves, as expected. Interestingly, wild Rubiaceae leaves had a higher diversity of phytochemicals in comparison to commercial coffee: defense-related molecules, such as phenylpropanoids (e.g., cinnamic acid), the terpenoid gibberellic acid, and the monolignol sinapaldehyde were found more abundantly in wild Rubiaceae leaves.
1. Introduction
Plant secondary metabolites are byproducts of primary metabolism. They play important roles during plant development, reproduction and stress response (Patra et al., 2013; Ma et al., 2016; Böttger et al., 2018; Kessler and Kalske, 2018; Jain et al., 2019). Because plants are sessile organisms, they must endure environmental and biotic pressure. The production of phytochemicals is part of their response to these stresses. Besides their importance for plant adaptation, growth and development, plant secondary compounds are valuable resources for the food, pharmaceutical, and biofuel industries (Boudet, 2007; Korkina, 2007; Cragg and Newman, 2013; Chiocchio et al., 2021). Alkaloids, phenolics, and terpenoids are the three main families that comprise secondary metabolites produced by plants. They are synthesized through malonic acid, mevalonic acid, methylerythritol-phosphate, and shikimate pathways (Jain et al., 2019). Because of their vast structural/chemical diversity, low solubility, and small quantities in plant tissues, the recovery, identification and quantification of phytochemicals are particularly challenging.
Genetics studies in combination with metabolic profile are key for plant breeding and insertion of desired traits, such as specific polyphenols. Recovering lost attributes due to domestication using wild relatives in the breeding program is a promising strategy. However, it has been mostly applied to crops such as rice, wheat, barley and potatoes (McSorley and Phillips, 1992; Peleg et al., 2005; Feuillet et al., 2008; Spooner et al., 2014; Brar and Khush, 2018). Despite the limited number of studies on coffee leaf and other Rubiaceae metabolic content, the presence of phenolic compounds has been previously described (Souard et al., 2018; Cangeloni et al., 2022; Montis et al., 2022). Caffeine, chlorogenic acids, mangiferin and trigonelline are the main phytochemicals found in coffee leaves (Cangeloni et al., 2022). Indole alkaloids are the most common secondary metabolite class throughout Rubiaceae species, although other classes of alkaloids, terpenes and flavonoids have also been reported (Martins and Nunez, 2015). For example, akuamigine, vincoside, yohimbine and other indole alkaloids have been detected in the Rubiaceae Uncaria spp. (Laus and Teppner, 1996; Ndagijimana et al., 2013; Xie et al., 2013). Different species of Gardenia sp. produce iridoids, such as genipin and gardenoside, as well as flavonoids and triterpenes (Chen et al., 2009; Kunert et al., 2009; Yang et al., 2013; Wang et al., 2015). Many members the Rubiaceae family have been studied for their secondary metabolites with medicinal properties (Chen et al., 2009; Ahmad and Salim, 2015; Martins and Nunez, 2015). For instance, species that are used in traditional medicine from the genera Borreria and Spermacoce contain alkaloids, flavonoids, iridoids, and terpenoids (Conserva and Ferreira Júnior, 2012). Additionally, medicinal plants with known anti-inflammatory and antioxidant properties, such as species from the genera Rytignia and Canthium multiflorum, have bioactive compounds like tannins, saponins and flavonoids, coumarins and terpenoids (Chandra Kala, 2015). Therefore, it is important to develop efficient methodologies to monitor plant polyphenols, which will guide breeding programs and boost phytochemical discovery.
In order to fully grasp the diversity of phytochemicals present in leaves of coffee and other Rubiaceae species, i) a single extraction procedure allowing to recover the vast diversity phytochemical families is needed, ii) an untargeted metabolomics approach is required to detect unknown/new polyphenols, and iii) high-throughput targeted metabolomics method is necessary to quantify a maximum of secondary compounds within a single run. Developing a fast methodology that isolates most of the secondary metabolites present in leaves is challenging.
Metabolomics is the ideal technique for detecting small quantities of phytochemicals (Jorge et al., 2016; Cocuron et al., 2019; Castro-moretti et al., 2020). Nuclear magnetic resonance (NMR) and mass spectrometry (MS) are the most common analytical tools for performing plant metabolomics. MS coupled with liquid or gas chromatography (LC and GC, respectively) is a preferred method due to its higher sensitivity and lesser amount of sample requirements (de Falco and Lanzotti, 2018; Liu et al., 2019; Perez de Souza et al., 2019). In this study, two MS instruments were used: a high-resolution quadrupole time-of-flight (HR-Q-TOF) for untargeted metabolomics, and a highly sensitive triple quadrupole for targeted quantification of known metabolites. On one hand, untargeted studies are designed to detect a broad range of molecules in a biological sample (Patti et al., 2012; Perez de Souza et al., 2019). It is common to use spectral libraries to attempt compound identification (Dunn et al., 2012; Perez de Souza et al., 2019; Jez et al., 2021). On the other hand, targeted metabolomics is used to quantify known metabolites using analytical standards (Patti et al., 2012; Roberts et al., 2012; Sawada and Yokota Hirai, 2013). Although complementary, these two approaches have been rarely combined (Montis et al., 2022).
Other approaches have attempted to isolate and quantify plant secondary metabolites; however, a limited number of families (one or two) and compounds (less than 40) were monitored (Sun et al., 2013; Orcic et al., 2014; Bataglion et al., 2015; Lin et al., 2015; Jaini et al., 2017; Cocuron et al., 2019; Gulcin et al., 2019; Marchetti et al., 2019; Quatrin et al., 2019). In this study, a single-extraction method was developed to recover 42 distinct families of phytochemicals. Untargeted and targeted metabolomics were combined to study the secondary metabolites present in coffee and wild Rubiaceae leaves. More specifically, a state-of-the-art targeted approach allowing the quantification of 184 phytochemicals was developed and was used to validate the identity of 74 compounds highlighted by the untargeted analysis. Combining both techniques and instruments along with an optimized extraction method resulted in a sensitive and thorough pipeline to detect, classify and quantify secondary metabolites in leaves of coffee and other Rubiaceae species. We anticipate that this thorough pipeline will boost the process of detection, classification and quantification of polyphenols in leaves of coffee and other Rubiaceae, and will be further applied to other plant organs and species.
2. Materials and methods
2.1. Chemicals
LC-MS-grade acetic acid, acetonitrile, methanol, DMSO, and water were ordered from Thermo Fisher Scientific (Hampton, NH). All non-labeled standards as well as trans-cinnamic acid-β,2,3,4,5,6-d6 were purchased from MilliporeSigma (Burlington, MA). N,N-dimethyltryptamine (N,N-DMT), bufotenin (5-OH-DMT) and psilocybin standards were obtained from Cayman Chemical (Ann Arbor, MI).
2.2. Preparation of standard stocks and working solutions
Stock solutions of dihydrokaempferol, dihydroquercetin, mitragynine, luteolin, luteolin-7-O-glucoside, naringenin, phloretin, piceid, prunetin, pterostilbene, orientin, quercetin, quercitrin, reserpine, rhamnazin, rhamnetin, schaftoside, spiraeoside, swertiajaponin, swertisin, tectochrysin, tricin, vicenin 2 and 3, vincosamide and yohimbine were prepared at 1,000 µM. Acacetin-7-O-rutinoside, afzelin, apigenin-7-glucuronide, calycosin, corynanthine, harmane, hordenine, ipriflavone, tomatidine, xanthohumol, sophoricoside, rauwolscine, idaein, keracyanin and neobavaisoflavone were prepared at 100 µM. All other stock solutions were prepared at 10,000 µM, using methanol or DMSO as solvents. Working solutions were prepared to final concentrations of 100, 50, 10 and 1 µM in methanol/water (40:60; v/v).
2.3. Leaf collection
Untargeted and targeted metabolomic analyses were performed using commercial coffee leaves (Coffea arabica cv. Obatã IAC 1669-20 - CC) that were collected in San José, Costa Rica, at the Coopetarrazú plantation. Three mature leaves were harvested from four trees and kept on ice during transportation to the laboratory, where they were flash-frozen in liquid nitrogen, and lyophilized until dryness. Wild Rubiaceae leaves were collected from the two species Isertia hankeana and Simira maxonii (WR1 and WR2, respectively) in a private rainforest of the Golfito (Puntarenas) region of Costa Rica. Three leaves were collected from each tree, one tree per species and kept in ice during their transportation to the laboratory. Then they were flash-frozen in liquid nitrogen and lyophilized (Labconco Freezone, South Kansas City, KS) until dryness. To optimize the extraction and LC-MS/MS method, mature leaves from the wild coffee species Coffea liberica var. dewevrei and Coffea salvatrix were used from plants grown in field conditions, collected at the Agronomic Institute in Campinas (São Paulo, Brazil). Four leaves were collected from each tree, two trees per species, kept in dry ice during harvest and transportation to the laboratory and then they were frozen in liquid nitrogen prior lyophilization until dryness. All collected leaves were lyophilized using a freeze dryer Labconco Freezone 12 plus (South Kansas City, KS). Dried leaves were ground into a fine powder using 15 mL plastic jars with four 20 mm metal beads in a tissue homogenizer Geno/Grinder 2010 from Spex (Metuchen, NJ) for two rounds of 30 sec at 1,750 rpm. Wild Rubiaceae leaves were collected from the same tree, grown in very different environmental conditions in comparison to CC; to mitigate variations due to leaf maturity level, light exposure, etc., and to focus on polyphenol differences across species, the ground powder was pooled, homogenized and divided into five pseudoreplicates per species.
2.4. Intracellular secondary metabolite extraction
The extraction of leaf secondary metabolites was performed after grinding and weighting 10 mg of powdered leaf material. Metabolites were extracted by adding 10 µL of 1 mM trans-cinnamic acid-β,2,3,4,5,6-d6 and 490 µL of 100% methanol followed by grinding with one 5 mm metal bead at 30 Hz for 5 min using a mixer mill MM400 from Retsch (Haan, Germany). Then, the extracts were sonicated at 35-40°C for 20 min and centrifuged at 9,600 g for 5 min at room temperature. The supernatants were transferred to 1.5 mL microcentrifuge tubes. The remaining pellets were resuspended in 500 µL of methanol/water (30:70, v/v), sonicated for 20 min at 35-40 °C, and spun down under the same conditions as mentioned before. The supernatants were combined to the first ones, and then, 500 µL of extracts were filtered through 3 kDa Amicon filtering devices (MilliporeSigma, Burlington, MA) at 14,000 g for 60 min at room temperature. The resulting eluates were stored at -20°C until LC-MS/MS analysis.
2.5. Untargeted metabolomics
The analysis of the metabolites was carried out using an Exion ultra high-performance liquid chromatography system coupled with a high-resolution mass spectrometer TripleTOF6600+ from AB Sciex (Framingham, MA).
2.5.1. HPLC conditions
The compounds were separated using a C18 Symmetry column (75 x 4.6 mm, 3.5 µm) with a Symmetry C18 pre-column (20 x 3.9 mm; 5µm) from Waters (Milford, MA) as previously described (Cocuron et al., 2019). The temperatures of the column compartment and the autosampler were kept at 30 °C and 15 °C, respectively. The analytes were eluted using a gradient of 0.1% (v/v) acetic acid in acetonitrile (Solvent A) and 0.1% (v/v) acetic acid in water (Solvent B) under a flow rate of 0.8 mL/min. The following gradient was applied: 0-1.0 min, 98% B; 1.0-16.0 min, 98-42% B; 16.0-21.0 min, 42-20% B; 21.0-26.0 min, 20-10% B; 26.0-28.0 min, 10% B; 28.0-28.1, 10-98% B; 28.1-30.0 min, 98% B.
2.5.2. High-resolution discovery using triple TOF
2.5.2.1. Data-dependent acquisition
The mass spectrometer was set to scan metabolites from m/z 100-1500 amu in negative or positive mode. For the negative polarity the ion spray voltage was 4,500 V, the accumulation time was 100 msec, the declustering potential and collision energy were 60 V and 10 V, respectively. MS/MS spectra were acquired over m/z 30-1500 amu with an accumulation time of 25 msec. Parameters such as declustering potential, collision energy, collision energy spread were set to 60 V, 45 V and 15 V, respectively. The parameters for the positive mode were very similar to the ones for the negative mode except for the ion spray voltage, and the declustering potential that were 5,000 V and 35 V, respectively. The total cycling time was 0.65 sec.
The parameters for the electrospray source ionization such as curtain gas (nitrogen), nebulizing gas, heating gas, and the temperature of the source were fixed at 40 psi, 70 psi, 70 psi, and 650 °C, respectively. The source conditions were the same for the negative and positive polarities. An atmospheric-pressure chemical ionization (APCI) negative or positive calibration solution was delivered by a calibrant delivery system every 5 samples to correct for any mass drift that may occur during the run. MS spectra were acquired using Analyst TF 1.8.1 software (AB Sciex, Framingham, MA). It is important to note that the data-dependent acquisition (DDA) was run in negative and positive modes, on a mixture composed of CC, WR1 and WR2 extracts. The precursor ions present in this mixture were then used for the sequential window acquisition of all theoretical mass spectra (SWATH-MS) scan survey.
2.5.2.2. Data-independent acquisition using SWATH-MS
The precursor ion data obtained from the DDA (negative and positive ionizations) were used to generate short overlapping precursor ion windows which are the core of the SWATH-MS mode. Briefly, all precursors ions from the DDA mode (negative or positive polarity) as well as their intensities were exported to an excel file in which a total of 20 variable SWATH-MS windows were created with one amu overlapping mass. These SWATH-MS windows for the negative or positive polarity were saved as a “.txt” file, and uploaded to Analyst to build the mass spectrometry part of the LC-HR-MS/MS acquisition method. It is important to note that the source, MS scan and MS/MS scan parameters for the SWATH-MS mode were the same than the ones used for the DDA scan survey.
For the sequence injection, the total 15 biological samples were placed randomly in the autosampler. Two quality controls (QC) consisting of an equal mixture of each leaf extract, and two blanks containing the internal standard, trans-cinnamic acid-β,2,3,4,5,6-d6 in methanol: water (40:60, v/v), were included; one was injected at the beginning of the sequence, and the other at the end.
2.5.3. Data processing
A non-targeted screening MQ4 workflow was designed using the software SciexOS v.1.6.1 (Sciex, Framingham, MA) with the Smart Confirmation Search algorithm. Results were sorted by purity, 0.02 Da as precursor mass tolerance, and 0.4 Da as fragment mass tolerance. The intensity threshold was set to 0.05 and minimal purity to 10%. All extract samples, blanks with internal standard, and QCs were considered for constructing the processing method. Quality of the processed data was assessed as follows: i) the difference in the area of the internal standard between the sample extracts and the blanks was less than 5%; and ii) a Principal Component Analysis (PCA) including the QCs was performed for the metabolites monitored in negative and positive modes and showed clustering of the two QCs (Supplemental Figure 1), which is indicative of a low variance. Then, data obtained from untargeted metabolomics were analyzed using the software XCMS (Tautenhahn et al., 2012) with the following parameters: method UPL/UHD Q-TOF matchedFilter; ppm error of 15; minimum peak width of 5; maximum peak width of 20; signal/noise threshold of 6; mzdiff of 0.01; integration method 1; prefilter peaks 3; noise filter 0; and retention time correction method obiwarp. Once peak picking, alignment and integration was performed, a table with mass to charge ratio, retention time, and normalized intensity of each feature (by the intensity of the internal standard, trans-cinnamic acid-β,2,3,4,5,6-d6) was generated. This table was then used for statistical analyses (see 2.7. Statistical Analyses). Further data curation was performed: features with signal intensity lower than 1,000,000.00 count per second were excluded, as well as the features not present on all replicates. Then, the feature with the highest intensity was selected for each peak group. Features from positive and negative ionization were merged and, when the same feature was present in both modes, the one with the highest intensity was selected. Metabolite identification was performed using the software SciexOS v.1.6.1 (Sciex, Framingham, MA) with spectral libraries from the National Institute of Standards and Technology (NIST, Gaithersburg, MA) and a homemade library.
2.6. Targeted metabolomics using LC-MS/MS scheduled multiple reaction monitoring
2.6.1. LC-MS/MS conditions
The detection and quantification of phytochemicals was performed as previously described by (Cocuron et al., 2019) with some slight modifications concerning the LC gradient and the use of scheduled multiple reaction monitoring (sMRM).
The 184 phytochemicals considered in this study were optimized one by one by direct infusion after having been diluted to 1 µM with acetonitrile/water solution (50:50; v/v) containing 0.1% of acetic acid as an additive. The flow for the direct infusion was set to 10 µL/min, and parameters such as declustering potential (DP), collision energy (CE), cell exit potential (CXP) were determined for the five most abundant product ions derived from each precursor ion (see Table 1). The compound optimization was done automatically for the negative and positive polarities using Analyst 1.7 software (AB Sciex, Framingham, MA). The source optimization for the electrospray ionization was conducted using different values for the curtain gas (25, 30, 35, 40 V), the nebulizer gas (GS1; 40, 45, 50, 55, 60, 65 V), the heating gas (GS2; 40, 45, 50, 55, 60, 65 V), the collision activated dissociation (CAD; low, medium, high), the temperature (300, 350, 400, 450, 500, 550, 600, 650°C), and the ionspray voltage (IS; 3000, 3500, 4000, 4500, 5000 V).
Table 1 Compound-dependent parameters for scheduled MRM scan survey, per metabolite and their chemical class (family): retention time (RT) in minutes, precursor mass (Q1) and product mass (Q3), declustering potential (DP), collision energy (CE) and collision cell exit potential (CXP) in volts.
The compounds were detected and quantify using an Agilent 1290 Infinity II liquid chromatography system coupled to a hybrid Triple Quadrupole 6500+ from ABSciex (Framingham, MA). The extracts were kept at 10°C in an auto-sampler, and the phytochemicals were separated at 30°C using a reverse phase C18 Symmetry column (4.6 x 75 mm; 3.5 µm) coupled to a Symmetry C18 pre-column (3.9 x 20 mm; 5 µm) from Waters (Milford, MA). The liquid chromatography gradient was made of 0.1% (v/v) acetic acid in acetonitrile (A) and 0.1% (v/v) acetic acid in water (B). The total LC-MS/MS run was 15 min with a flow rate of 800 µL/min. The following gradient was applied to resolve the polyphenols: B= 0-1.0 minute 98%, 1.0-7.0 min 42%, 7.0-9.0 min 20%, 9.0-11.0 min 10%, 11.0-13.0 min 10%, 13.0-13.1 min 98%, and 13.1-15.0 min 98%. The injection needle was rinsed with 50% aqueous methanol. Five µL of external standard mixtures and 5 µL of biological sample were injected onto the column.
Electrospray ionization with polarity switch was applied to the extracts to acquire mass spectra of the different analytes. The settling time between each polarity was 15 msec. Phytochemicals were simultaneously detected as precursor ion/product ion pair using multiple reaction monitoring (MRM) at first to record the retention time for each of the polyphenols considered in this study (see Table 1). The retention times for the compounds were reported in the LC-MS/MS method to create scheduled MRM with MRM detection windows of 60 sec. The cycling time was set to 1.1 sec and the dwell time varied depending on the number of MRMs triggered at a specific point of time during the LC-MS/MS acquisition. The dwell time ranged from 3 to 250 msec. The source parameters for both modes were identical, and they were as followed: 4,500 V for the ionspray voltage, 40 V for the curtain gas, 550°C for the temperature, 50 psi for the nebulizer gas (GS1), 60 psi for the heating gas (GS2), and “Medium” for the collision activated dissociation (CAD).
2.6.2. Data acquisition and processing
Analyst 1.7 software (AB Sciex, Framingham, MA) was used to acquire the data whereas MultiQuant v3.0.3 (AB Sciex, Framingham, MA) was used to integrate the peaks corresponding to the different phytochemicals. Metabolite quantification was performed as previously explained (Arias et al., 2022). Briefly, the total amount of each analyte was calculated using the trans-cinnamic acid-β,2,3,4,5,6-d6 internal standard area, and the known concentration of its corresponding external standard run in parallel to the samples.
2.6.3. Standard curves: Limit of detection, limit of quantification, and linearity range
To determine the limits of detection (LOD) and quantification (LOQ), and the linearity range, standard curves were generated for each metabolite as previously described (Cocuron et al., 2014; Cocuron et al., 2019) with at least six points. Each standard curve was performed in five replicates.
2.6.4. Recovery efficiency, matrix effect, and accuracy intra- and inter- assay
Recovery efficiency (RE) and accuracy intra- and inter- assay were determined using five coffee leaf pseudoreplicates as previously described (Cocuron et al., 2019). To assess the matrix effect (ME), five coffee leaf pseudoreplicates were used according to the procedure previously published (Cocuron et al., 2017) and the following equation:
In these conditions, a negative value indicates an ion suppression whereas a positive value depicts an ion enhancement due to ME.
2.7. Statistical analyses
Principal component analysis (PCA), partial-least square discriminant analysis (PLS-DA), heatmap and ANOVA-simultaneous component analysis (ASCA), for both untargeted and targeted analyses, were performed after log-transformation and auto-scaling, using MetaboAnalyst 5.0 (Chong et al., 2018).
3. Results
3.1. Untargeted metabolomics
First, the extraction procedure was optimized using a standard mixture containing alkaloids, cinnamate esters, and flavonoids. For that purpose, different solvents/additive and multiple sonication time/temperature combinations were tested: i) defatting beforehand of after extraction with hexanes; ii) methyl ter-butyl ether, ethyl acetate, different percentages of methanol/water as solvents; iii) acetic acid (1%) as additive; iv) under sonication for 10 to 30 min, at temperatures varying from 25 to 40 °C (data not shown). The extracts were injected in the LC-HR-Q-TOF using the same column and solvents described in Cocuron et al. (2019) but a different gradient (see Materials and Methods section). The method which resulted in the best recovery for the most diverse set of metabolites was using two rounds of extraction: the first one 100% methanol, and the second one methanol/water (30:70, v/v) with sonication rounds of 20 min each at 35-40 °C. This procedure was adopted to extract phytochemicals from coffee and wild Rubiaceae leaves.
Leaves from three different Rubiaceae species were collected in Costa Rica: i) one commercial coffee (CC), Coffea arabica cv. Obatã IAC 1669-20 from a plantation, and ii) two wild Rubiaceae, Isertia hankeana (WR1) and Simira maxonii (WR2) from the rainforest. Leaves were freeze-dried and reduced to powder. Secondary metabolites were extracted from leaf powder using the optimized extraction procedure described above, adding a filtering step , and analyzed via LC-HR-Q-TOF in positive and negative modes.
Runs in the positive and negative mode resulted in 19,000 and 24,000 features, respectively. Principal component analysis (PCA) of unprocessed data (wiff files) from the positive mode, obtained by the untargeted analysis of the leaf extracts, resulted in three widely separated clusters, grouping the five pseudoreplicates from each plant species together (Figure 1). The principal component (PC 1) explained 53.7% of the variance, separating the CC from WR1 and WR2, whereas the PC 2 explained 38.8% of the variance, separating all species. This can be interpreted as those three plant species having significantly different metabolic profiles.
Figure 1 PCA analysis performed on features from untargeted metabolomic analysis in the positive mode of leaf extracts of commercial coffee (CC) and two wild Rubiaceae species (WR1 and WR2) collected in Costa Rica. The extractions and analyses were performed with five pseudoreplicates per species.
After chromatogram alignment, data curation was performed on peak intensities, excluding features with signal lower than one million counts per second and not present on all five pseudoreplicates. Features from positive and negative modes were merged, and when they were present on both modes, only the ones with the highest area were selected. This resulted in 324 features in total within the three species extracts and their pseudoreplicates (Supplemental Table 1). National Institute of Standards and Technology (NIST17, Gaithersburg, MD) and in-house library identified 69 and 81 metabolites in the negative mode and the positive mode, respectively. As previously mentioned, for phytochemicals detected in both modes, the highest area was reported (Table 2). Thirty-one families of phytochemicals were identified: flavone, flavone C-glycoside, flavonol, indole alkaloid, monolignol phenylpropanoid and triterpenoid were the most common families of compounds found in leaf extracts (Table 2). Interestingly, flavones and terpenes were among the families of phytochemicals that were not present in CC but were detected in the wild Rubiaceae leaves (Table 2). For instance, 6,2’-dihydroxyflavone, afzelin and apigenin were the flavones not detected in CC leaves extracts. Also, robinin, bisdemethoxycurcumin, and madecassic acid were only detected in the wild Rubiaceae leaves WR1 and WR2, while epicatechin, vicenin 2, isoquercetrin, 2,3-dehydrosilybin, theobromine, theophylline, trans-3-coumaric acid, and neomangiferin were only present in CC (Table 2).
Table 2 Families of phytochemical detected by untargeted metabolomics.
To validate the findings from the metabolomic profiling, a targeted metabolomic approach was conducted using known quantities of commercially available phytochemical standards.
3.2. Targeted metabolomics
3.2.1. Method development
One hundred eighty-four phytochemical standards were individually infused in a triple quadruple to optimize the mass spectrometry parameters (declustering potential - DP, collision energy - CE and collision cell exit potential - CXP) associated with precursor/product ion (Q1/Q3) as shown in Table 1. A multiple reaction monitoring (MRM) scan survey was implemented using these parameters. For the liquid chromatography part, the same column, solvents, and additive than the untargeted metabolomics were used. Mixtures of standards were injected into the LC-MS/MS to obtain the retention time for each phytochemical (Table 1). It is important to note that standards with the same Q1/Q3 transition were separated by their retention times, except for hesperetin and homoeriodictyol, isovitexin and vitexin, vicenin 3 and schaftoside, morin and tricetin, luteolin-7,3’-Di-O-glucoside and kaempferol-3-O-sophoroside, luteolin-7-O-glucoside and Kaempferol-7-O-glucoside, genistein-7-O-glucuronide and baicalin. For the LC-MS/MS analysis of the 184 phytochemicals, polarity switching (between positive and negative modes) was used within the same run, and MRM windows (aka scheduled MRM) were set up for each compound according to its retention time.
A calibration curve was performed for each standard to determine the limits of quantification, detection, and the linearity range (Table 3). The coefficients of correlations were all above 0.98. Acacetin-7-O-rutinoside was the compound with the lowest limits of quantification and detection, at 0.11 and 0.03 fmol, respectively. On the other hand, 2-hydroxyconiferaldehyde was the compound with highest limits of quantification and detection, at 1724.63 and 517.39 fmol, respectively. Tricetin, 2,5-dihydroxybenzoic acid and 4,5-di-O-caffeoylquinic acid were the compounds with the widest range of quantification, from 32.77 to 1,250,000.00 fmol, 81.92 to 1,250,000.00 fmol and 163.84 to 2,500,000.00 fmol, respectively (Table 3).
Table 3 Range, linearity coefficient (R2), limit of quantification (LOQ) and limit of detection (LOD) of secondary metabolites analyzed in this study.
Recovery efficiency (RE) and matrix effect (ME) were assessed for each metabolite. Ninety percent of the metabolites were recovered with an efficiency of at least 50%. Keracyanin and enoxolone were the compounds with the lowest REs of 23.3 and 28.9%, respectively (Table 4). On the other hand, 5-hydroxytryptophan and 3,4-di-O-caffeoylquinic acid had REs over 100 (Table 4). In parallel, ion suppression or enhancement was measured (i.e. ME > ± 30%) for less than 30% of the phytochemicals. For instance, there was a strong negative ME for 3,4-di-O-caffeoylquinic acid and naringin, underlying ion suppression from the sample matrix. Similarly, 4,5-dicaffeoylquinic acid and gossypetin were the compounds with the highest positive ME, indicating ion enhancement (Table 4).
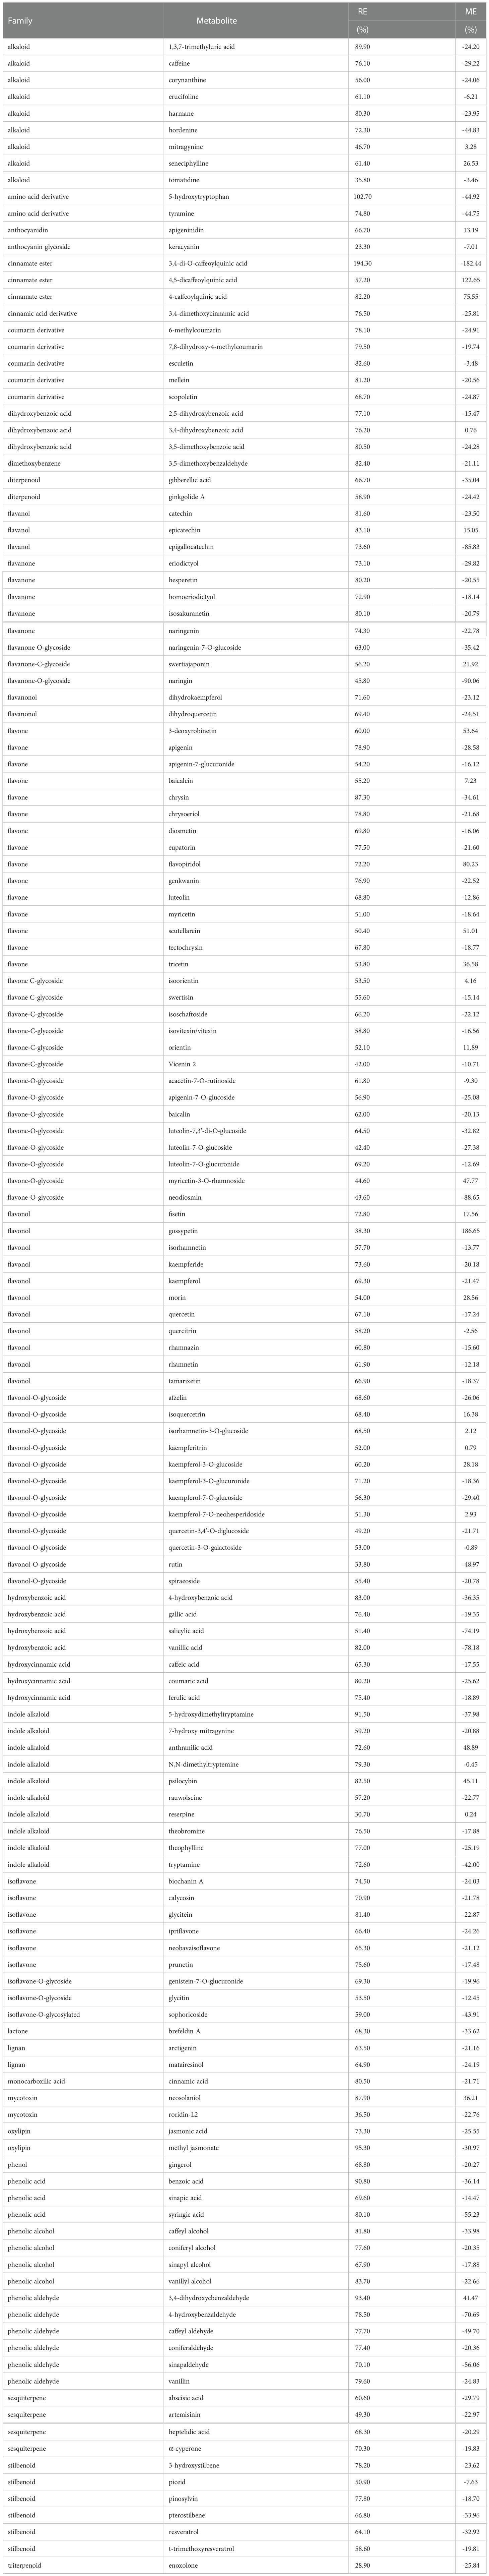
Table 4 Recovery efficiency (RE) of secondary metabolites and matrix effect (ME) from coffee leaf extracts.
To verify the method accuracy, at least one representative of each major phytochemical family was added to coffee leaf extracts at three concentrations: 0.25, 0.5, and 1µM. Intra-day and inter-day accuracy percentages were determined by re-injecting the samples on the same day and on three different days, respectively (Table 5). Out of the 25 phytochemicals tested, 18 and 22 had intra-day and inter-day accuracies above 75%, respectively.
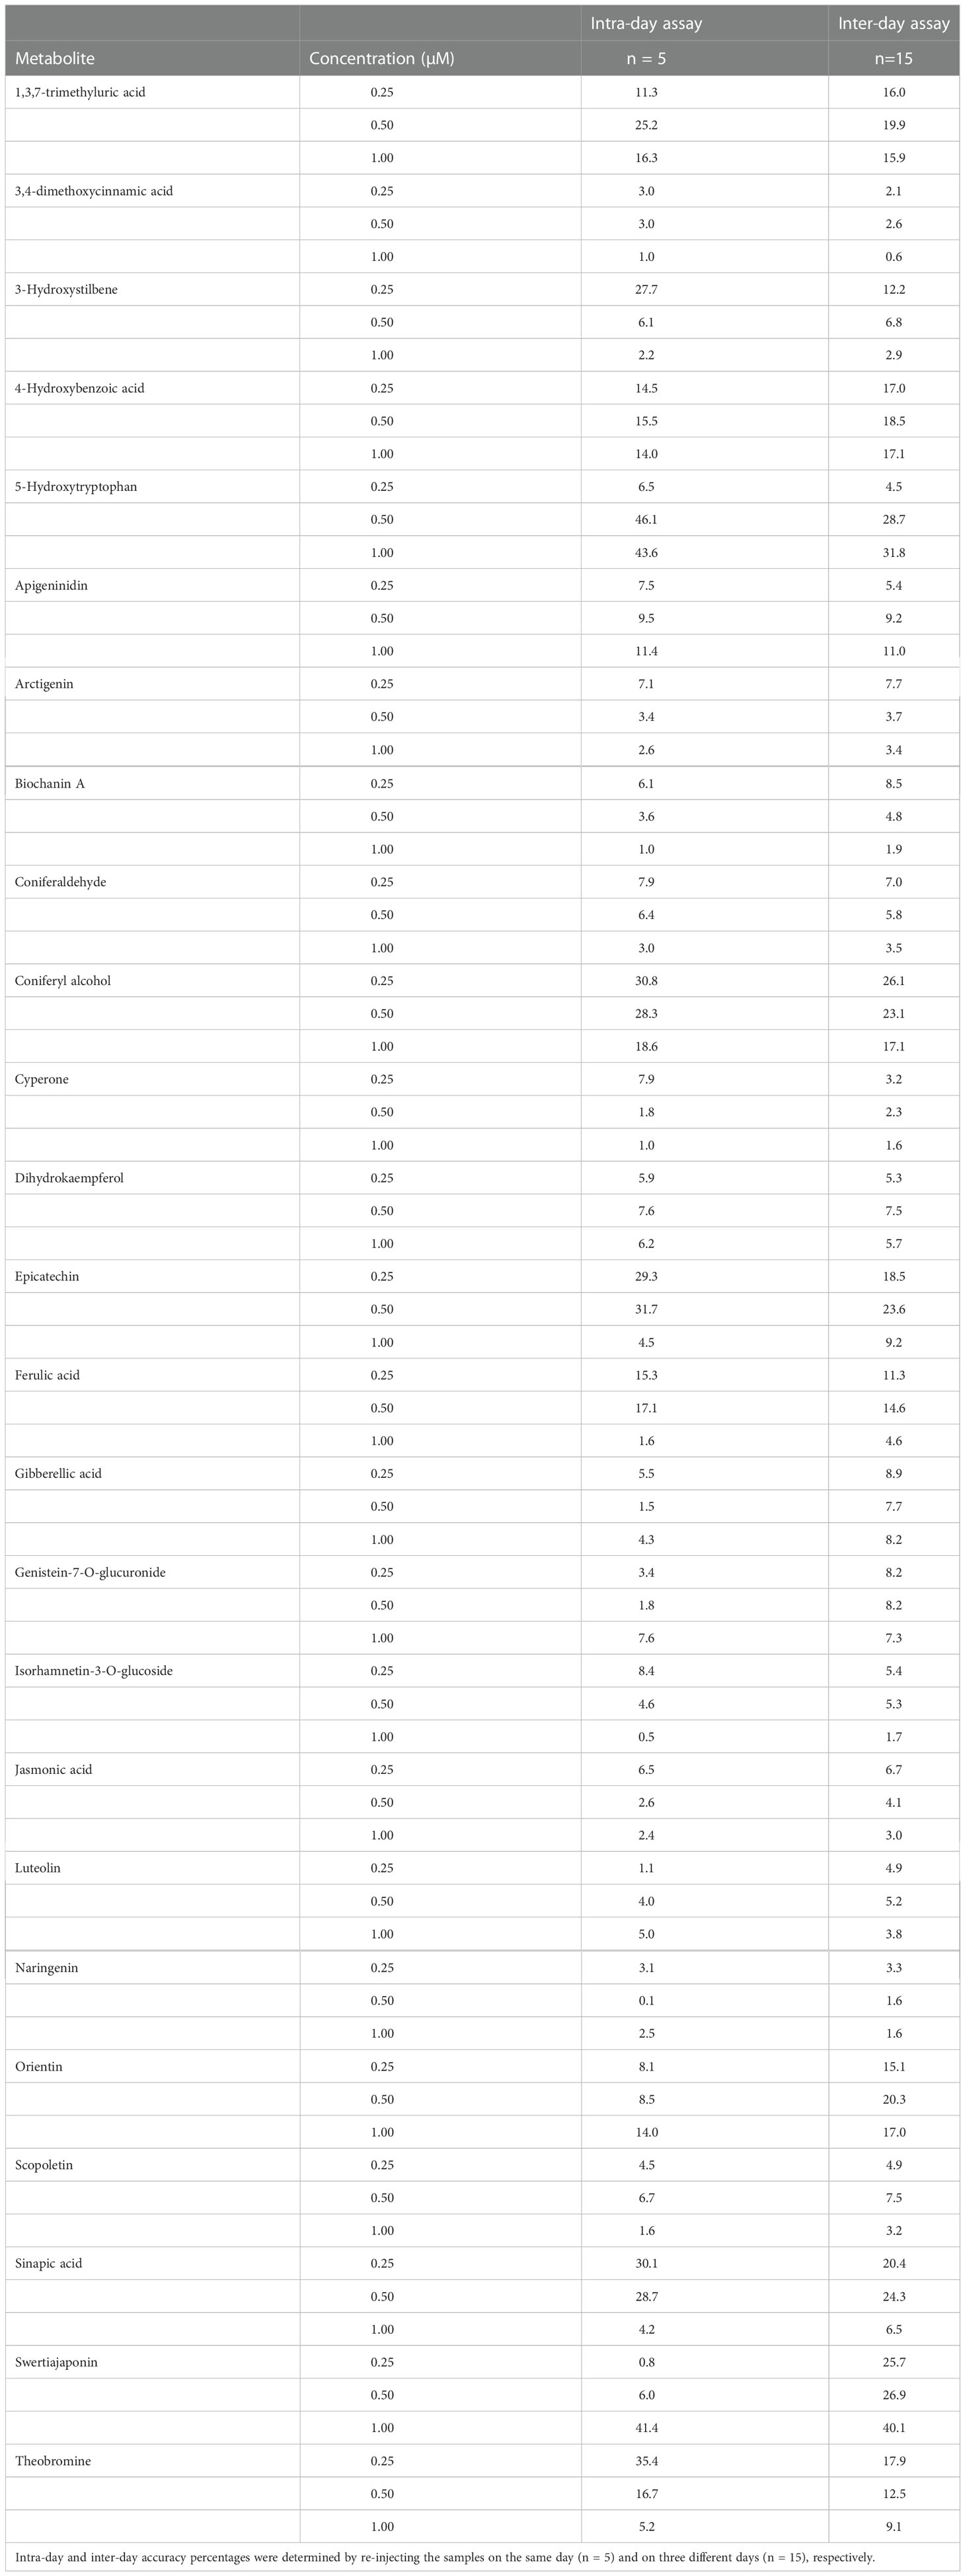
Table 5 Intra and inter-day accuracy percentages for secondary metabolites added at three different concentrations (0.25, 0.5 and 1 µM) to coffee leaf extracts.
3.2.2. Application of the analytical method to quantify phytochemicals in leaf extracts from commercial coffee and wild Rubiaceae
Validation of the method was performed using the same biological samples and extracts as the untargeted metabolomics (Supplemental Table 2). From the 184 phytochemicals monitored by LC-MS/MS, 74 were quantifiable in at least one of the Rubiaceae species. Interestingly, all the 74 phytochemicals were significantly different in at least one comparison by ANOVA (p<0.05). The PCA was consistent with the one from the untargeted metabolomic analysis (Figure 1), resulting in three separate clusters (Figure 2). The principal component 1 (PC 1) explained 70.1% of the variance, separating the CC from the wild Rubiacaea, whereas the PC 2 explained 28.9% of the variance, separating all species.
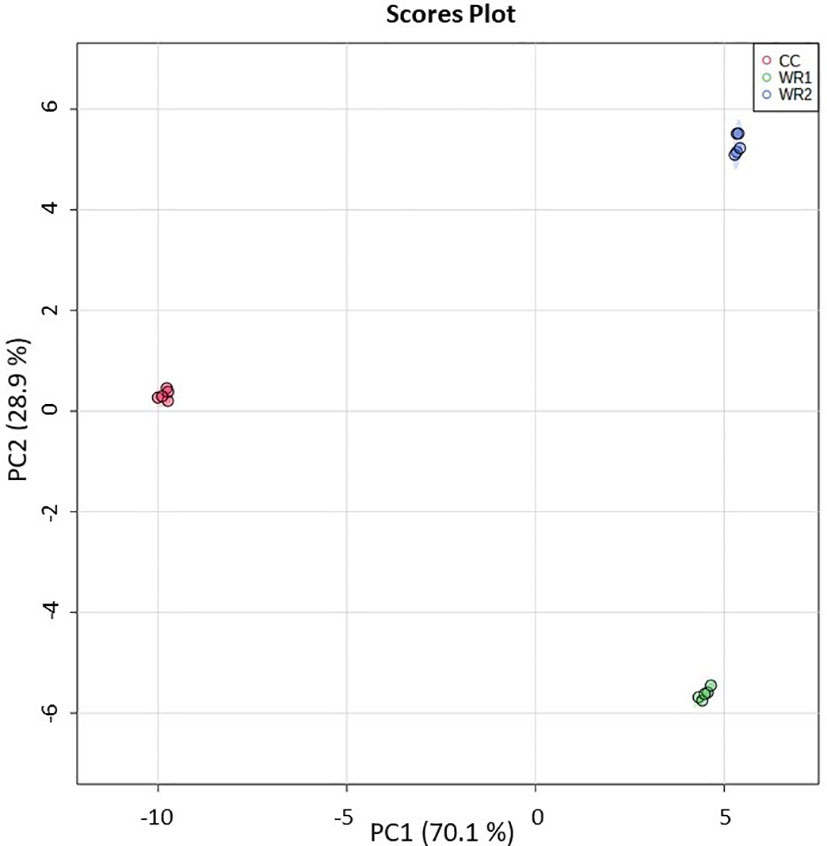
Figure 2 PCA analysis performed on targeted metabolomic analysis data from extracts of commercial coffee (CC) and two wild Rubiaceae species (WR1 and WR2). The extractions and analyses were performed with five pseudoreplicates per species. The shaded regions represent the 95% confidence intervals.
Targeted metabolomic analysis revealed compounds that were highly concentrated in commercial coffee leaf extracts when compared to wild Rubiaceae extracts (Figure 3; Supplemental Table 2). Caffeoylquinic acids, like 3, 4 and 5-caffeoylquinic acids, caffeine, trigonelline, vincenin 2, theobromine and others were more abundant in CC (Figure 3). Also, similarly to what was found in the untargeted analysis, some compounds were more abundant and even sometimes found exclusively in wild Rubiaceae leaf extracts. For instance, the levels of benzoic acid, 3,4-dimethylcinnamic acid and kaempferol-7-O-neohesperidoside, were the highest in WR1 in comparison to CC and WR2 (Figure 3). Cinnamic acid, yohimbine, corynanthine/rauwolscine, syringic acid, kaempferol were abundant in WR1 but absent in CC (Figure 3). Similarly, the levels of keracyanin, luteolin-7-O-glucoside, idaein, gibberellic acid, sinalpadehyde and sinapyl-alcohol were found to be the highest in WR2, while harmane and vincosamide, abundant in WR2, were not detected in CC (Figure 3).
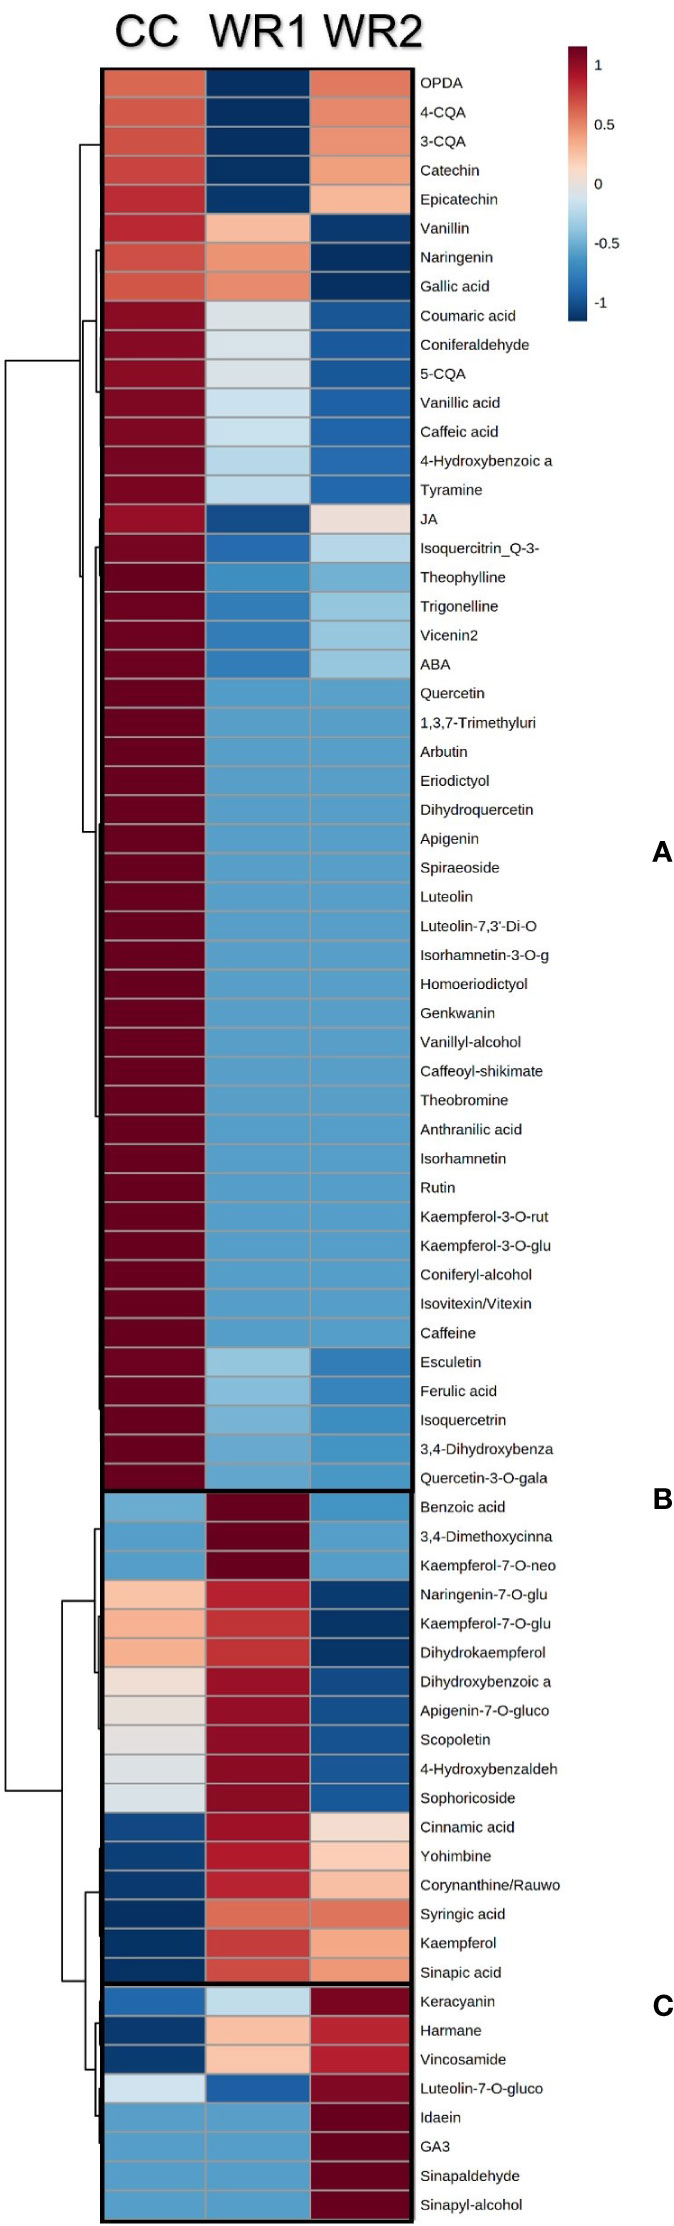
Figure 3 Heatmap analysis of the polyphenols from extracts of coffee (CC) and two wild Rubiaceae (WR1 and WR2) detected by targeted metabolomics. The metabolomics data were normalized by log transformation, mean-centered, and divided by the standard deviation of each variable. Ward’s hierarchical clustering algorithm was used to group metabolites that have the same distribution pattern in the heat map. Color scale represents metabolite relative intensity, with the darkest red and blue symbolizing the highest and the lowest values, respectively. Boxes highlight metabolites that are higher in CC (A), in WR1 (B), and WR2 (C).
To determine the consistency between untargeted and targeted results, an ANOVA-simultaneous comparative analysis (ASCA) was performed on the 74 polyphenols quantified in our samples, and it revealed that both techniques display similar results. Figure 4 are three examples of phytochemicals—caffeine, vicenin and 3-caffeoylquinic acid (3-CQA)—that were found to be significantly more abundant in CC using the untargeted (U) metabolomics. These results were validated by a quantitative targeted (T) approach, which confirmed that the three polyphenols were the highest in CC. These examples illustrate the consistency between the untargeted and targeted metabolomics in our pipeline. Figure 5 depicts the workflow of the metabolomic platform to identify and quantify polyphenols using liquid chromatography mass spectrometry.
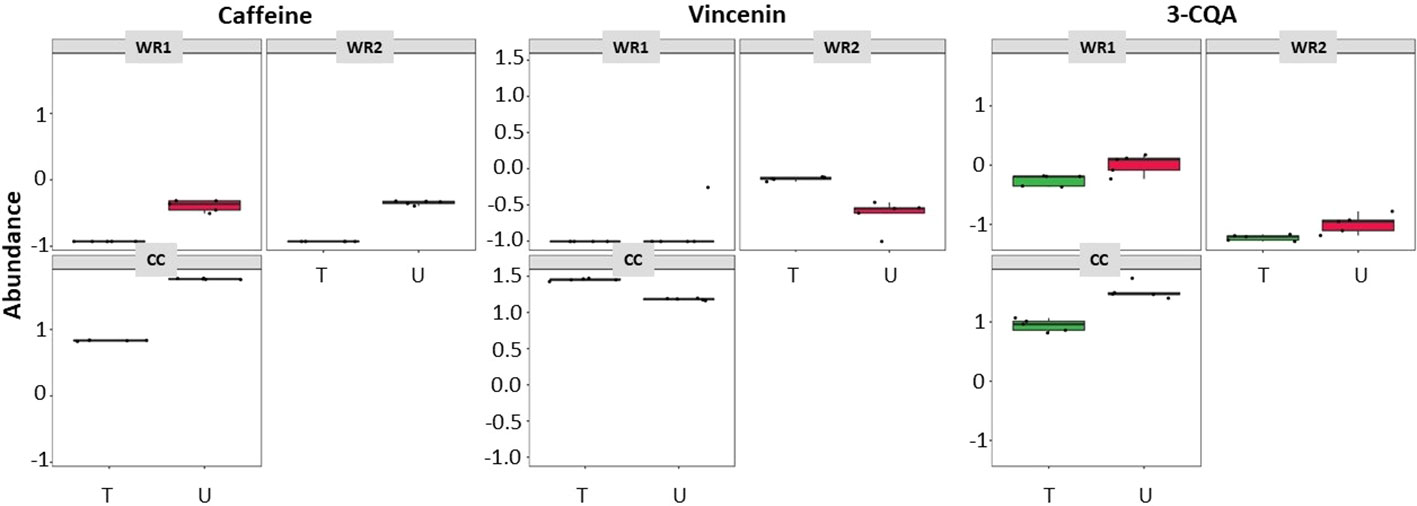
Figure 4 ASCA showing similarities of metabolites detected in coffee and wild Rubiaceae leaf extracts detected by targeted (T - green boxes) and untargeted (U – red boxes) metabolomics. 3-CQA is 3-caffeoylquinic acid.
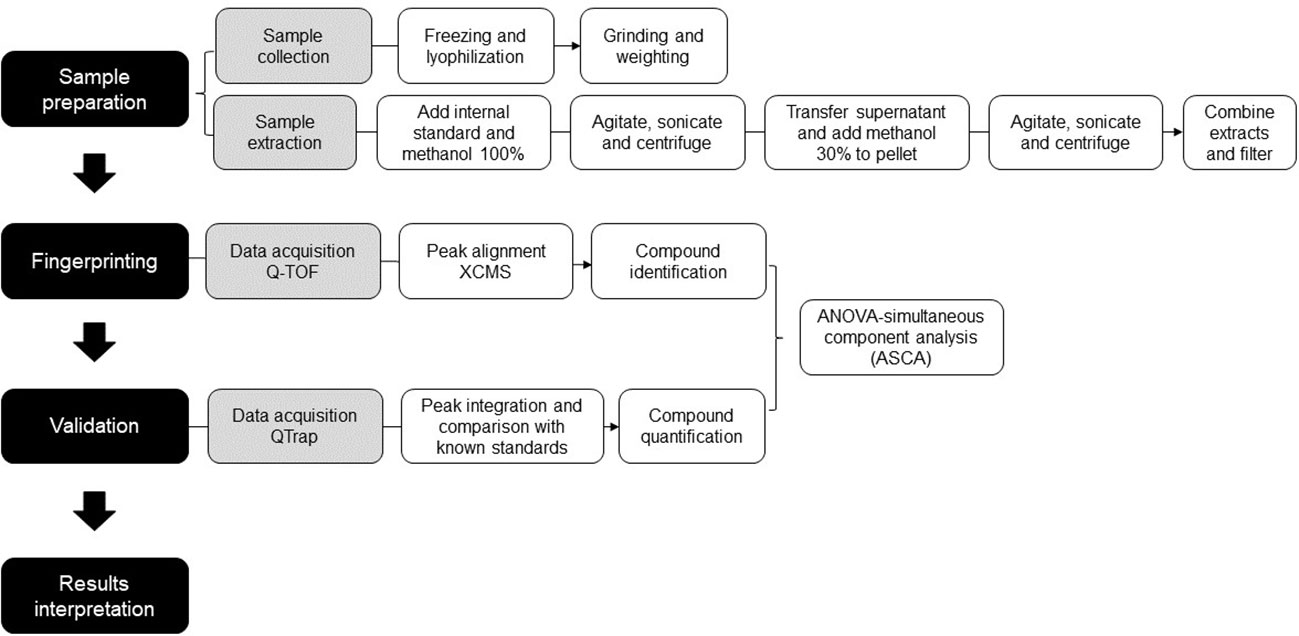
Figure 5 Workflow of the metabolomic platform to identify and quantify polyphenols using liquid chromatography mass spectrometry.
4. Discussion
Plant secondary metabolites belong to a wide variety of chemical families and are present at very small concentrations, which makes it challenging to recover with a single extraction procedure and to quantify with a sensitive enough analytical technique. Moreover, most phytochemicals are poorly soluble in water, photosensitive and not thermostable, requiring careful procedures for their handling and storage. Choosing the right solvent composition and solid to liquid ratio is critical for isolating plant metabolites (Zhang et al., 2011). In general, the most common solvents are ethanol, methanol, chloroform, and water in different proportions for plant secondary metabolite extraction (Silva et al., 1998; Abubakar and Haque, 2020). Nonetheless, chloroform has a low polarity and is a carcinogen, therefore it is recommended to avoid it (Davidson et al., 2008). In the present study, methanol and water resulted in the most efficient mixture of solvents to recover polyphenols from coffee leaves, combined with sonication at 35-40°C. Indeed, ultrasonication has been widely used to reach higher yields of natural compounds (Annegowda et al., 2010; Masson et al., 2010; Hasan et al., 2017). For instance, ultrasonic-assisted extraction has been used in coffee leaves to improve the extraction of caffeine, trigonelline, rutin, chlorogenic acids, and mangiferin (Chen et al., 2020b). Furthermore, steroidal alkaloids have been successfully recovered from potato peel using ultrasound assisted extraction, obtaining at least 1.5 times more compounds in comparison with other extraction technique (Hossain et al., 2014). A comparative study in Hibiscus spp. concluded that using methanol and sonication resulted in better yields of phytosterols (Soares Melecchi et al., 2006). Sonication was also used to successfully extract quinones and flavonoids of six different species of Dosera sp. (Marczak et al., 2005). Other extraction techniques cited in literature involve microwave-assisted extraction, pressurized-liquid extraction and supercritical fluid extraction (Zhang et al., 2011; Abubakar and Haque, 2020). However, those are more time consuming and costly techniques (Roopashree and Naik, 2019).
Untargeted metabolomics aims to capture the whole metabolome (Matsuda et al., 2009), while targeted analysis focuses on the use of commercially available standards to detect and measure the quantity of metabolites present in a biological sample (Shimizu et al., 2018). It is therefore essential to have previous knowledge of the sample composition before performing targeted analysis. Most studies perform untargeted or targeted analysis, but usually do not combine both. However, the combination of both approaches, like the present study, creates a powerful tool to differentiate profiles and then detect/quantify the differences highlighted by metabolite fingerprinting, confirming the results. For instance, untargeted and targeted associated research on three Coffea sp. could differentiate the species metabolic profiles of leaf and fruit extracts. Additionally, five phytochemicals (caffeine, mangiferin and three caffeoylquinic acids) were identified, corroborating the identity of the differentiated metabolites between species and tissues (Montis et al., 2022). Also, Zhang et al. characterized cyclopeptides in 20 species of Rubia sp. (Rubiaceae) using LC-MS/MS (Zhang et al., 2018). Similarly to our study, the authors combined untargeted and targeted metabolomics using LC coupled to a triple TOF and a triple quadrupole, respectively, which provides reliability, precision, and sensitivity, with the additional advantage of requiring very small amounts of plant tissue. Nevertheless, our study reports an extraction that can be performed in less than two hours, and was optimized to recover a wide variety of compounds (over 40 families of phytochemicals). Indeed, 90% of the phytochemicals in our study had a recovery higher than 50%. Finally, 184 phytochemicals can be quantified in a sensitive and specific manner within a single LC-MS/MS run of 15min with polarity switch, which is particularly suitable for high-throughput analyses.
Our study compared the leaf phytochemical profiles from one commercial coffee and two wild Rubiaceae species. First, the untargeted metabolomics analysis identified 31 families of phytochemicals, of which flavone, flavone C-glycoside, flavonol, indole alkaloid, monolignol phenylpropanoid and triterpenoid were the most common families (Table 2). Several flavones and terpenes were not present in CC. Indeed, flavones 6,2’-dihydroxyflavone, afzelin and apigenin, the flavonoid tiliroside, flavonol nepetin-7-glucoside and the glycosylflavone robinin were not detected in CC leaves. Interestingly, flavonoids are the most abundant secondary metabolites in human diet (Alara et al., 2021): afzelin has been reported to have anti-inflammatory action (Kim et al., 2019a) while apigenin is an antioxidant and has anticancer properties (Shankar et al., 2017; Kim et al., 2019b). Flavonoids also play important roles in plant development and response to stress (Du Fall and Solomon, 2011; Nakabayashi and Saito, 2015). For example, robinin has been associated with plant drought resilience, as Chrysanthemum plants previously treated with this flavone had enhanced response to water stress and were able to maintain turgor pressure (Elansary et al., 2020). Gibberellic, sumaresinolic and madecassic acids, and soyasaponin were also absent in CC leaf extracts. Gibberellic acid is a plant hormone with multiple functions in growth regulation, flowering and stress response signaling (Bari and Jones, 2009; Schwechheimer and Willige, 2009; Iftikhar et al., 2019; Nagar et al., 2021). Madecassic acid, on the other hand, has been shown to have some medicinal properties, such as anti-inflammatory effects (Won et al., 2010), anti-colitis (Xu et al., 2017), and potential anti-cancer agent (Zhang et al., 2014; Valdeira et al., 2019). Equivalently, soyasaponins have been associated with health promoting properties, such as anti-inflammatory, anti-microbial, and cardiovascular protective activities (Guang et al., 2014; Lee et al., 2020; Wang et al., 2020).
Then, the targeted metabolomic analysis identified several compounds that were highly concentrated in CC or WR leaves (Figure 3; Supplemental Table 2). The most abundant compounds in CC leaves were chlorogenic acids (3,4 and 5-caffeoylquinic acids), caffeine, trigonelline, vicenin 2 and theobromine, which is consistent with previous reports (Campa et al., 2012; Funlayo et al., 2017; Chen, 2019; Cangeloni et al., 2022). Chlorogenic acids are well-known compounds for their antimicrobial activities (Sung and Lee, 2010; Su et al., 2014; Martínez et al., 2017). Indeed, they were shown to have deleterious effects on coffee microbial pathogens: a study showed that coffee plants supplied with silicon–a resistance inducer–had higher levels of chlorogenic acids and were therefore more resistant to Hemilea vastatrix, the causal agent of rust (Rodrigues et al., 2011). Caffeine content is one of the most important traits for coffee selection, either to bean processing for beverage consumption or for the pharmaceutical industry (Sawynok, 1995; Leroy et al., 2006; Patay et al., 2017; Carvalho et al., 2019). Having a resourceful method for caffeine detection and quantification, along with other desirable traits, would aid coffee breeders and studies on cultivar development. However, additional research is needed to correlate leaf and berry/bean composition in coffee to perform cultivar selection at earlier stages and speed up the breeding process. The content in kaempferol-7-O-neohesperidoside, kaempferol, yohimbine, corynanthine/rauwolscine, 3,4-dimethylcinnamic, cinnamic, benzoic and syringic acids were more abundant in WR1 leaves. A study in Litchi chinensis seeds revealed that kaempferol-7-O-neohesperidoside had a high cytotoxic activity against lung cancer cells (Xu et al., 2011). Similarly, kaempferol has also shown anti-cancer (Chen et al., 2020a; Kluska et al., 2021; Felice et al., 2022), anti-oxidant (Simunkova et al., 2021) and anti-malarial activities (Somsak et al., 2018), confirming more therapeutic uses of flavonoids. Alkaloids like yohimbine have promising clinical applications (Boğa et al., 2019; Saini et al., 2022), like anti-cancer activity (Jabir et al., 2022), and may be used as chemical markers for botanical selection (Osman et al., 2019). Several polyphenols were more abundant in WR2: harmane, vincosamide, keracyanin, idaein, gibberellic acid, luteolin-7-O-glycoside, synapaldehyde, and sinapyl-alcohol. Anthocyanins play important roles not only in plant reproduction, but also in response to abiotic and biotic stresses (Liu et al., 2018). Additionally, keracyanin and idaein were proven to have potential anti-inflammatory and anti-cancer activities (Natarajan et al., 2016; Santamarina et al., 2021). Monolignols, key components for lignin biosynthesis, are crucial element for cell wall protection against stresses (Gallego-Giraldo et al., 2018; Xie et al., 2018). Synapaldehyde increases reactive oxygen species in plants and has anti-fungal activity (Millan et al., 2022). Also, this metabolite was more abundant in sugarcane resistant to the causal agent of ratoon stunting (Castro-Moretti et al., 2021), associating its role to plant defense. Overall, WR leaves had a higher diversity of phytochemicals in comparison to the CC. This may be due to the farmer selection of CC for fruit size, caffeine content, and yield at the detriment of other stress resistance and adaptation traits.
5. Conclusions
The present study reports: i) the optimization of an extraction procedure to recover 42 distinct families of phytochemicals from leaves, ii) the development of a robust and sensitive LC-MS/MS method to quantify 184 secondary metabolites, and iii) the complementarity between the untargeted and targeted metabolomics. This approach was applied to characterize the phytochemicals in three different species of Rubiaceae, including two wild species and one commercial coffee. The new targeted metabolomics approach was used to validate the identity of 74 compounds highlighted by the untargeted analysis. This work describes a sensitive and thorough pipeline (Figure 5) to detect, classify and quantify secondary metabolites in leaves of coffee and other Rubiaceae, and can be further applied to other plant organs and species.
Data availability statement
The original contributions presented in the study are included in the article/Supplementary Material. Further inquiries can be directed to the corresponding author.
Author contributions
FC-M, J-CC, PC, JCS, and APA designed and conceptualized the project and method development; HC-G, EE-L, PC, and OG-F collected the leaves and prepared plant materials; FC-M and J-CC tested the different extraction methods, performed the LC-MS/MS method development, and method validation; FC-M. performed data processing and statistical analyses; FC-M, J-CC, and APA drafted the manuscript; APA, JCS and PC supervised, coordinated the project, and acquired funding for the project. All authors have read and agreed to the published version of the manuscript.
Funding
This study was funded in part by National Science Foundation grant DEB-1638999 to JCS, PC and APA, and University of Costa Rica Vice rectory of Research grants B9662 and B7176 to PC. Samples were collected under the Institutional Biodiversity Commission (University of Costa Rica) resolutions VI07723-2018 and VI5152-2016.
Acknowledgments
The authors would like to thank Pedro Juarez for helping with the collection and Rubiaceae identification in Costa Rica, Mariana C. Cia and Camila P. Carvalho for helping with plant collection in Brazil, and Mônica Veneziano Labate for access to the freeze dryer. All authors thank the BioAnalytical Facility (BAF) at the University of North Texas for providing the infrastructure and support to perform the metabolomic analyses.
Conflict of interest
The authors declare that the research was conducted in the absence of any commercial or financial relationships that could be construed as a potential conflict of interest.
Publisher’s note
All claims expressed in this article are solely those of the authors and do not necessarily represent those of their affiliated organizations, or those of the publisher, the editors and the reviewers. Any product that may be evaluated in this article, or claim that may be made by its manufacturer, is not guaranteed or endorsed by the publisher.
Supplementary material
The Supplementary Material for this article can be found online at: https://www.frontiersin.org/articles/10.3389/fpls.2022.1057645/full#supplementary-material
Supplementary Figure 1 | PCA scores plot showing clustering of quality control samples for untargeted metabolomics in positive mode (A) and negative mode (B). QC, quality control; CC, commercial coffee; WR1 and WR2, wild Rubiaceae species.
References
Abubakar, A. R., Haque, M. (2020). Preparation of medicinal plants: Basic extraction and fractionation procedures for experimental purposes. J. Pharm. Bioallied Sci. 12, 1. doi: 10.4103/JPBS.JPBS_175_19
Ahmad, R., Salim, F. (2015). Oxindole alkaloids of uncaria (Rubiaceae, subfamily cinchonoideae): A review on its structure, properties, and bioactivities. Stud. Nat. Prod. Chem. 45, 485–525. doi: 10.1016/B978-0-444-63473-3.00012-5
Alara, O. R., Abdurahman, N. H., Ukaegbu, C. I. (2021). Extraction of phenolic compounds: A review. Curr. Res. Food Sci. 4, 200–214. doi: 10.1016/J.CRFS.2021.03.011
Annegowda, H. V., Anwar, L. N., Mordi, M. N., Ramanathan, S., Mansor, S. M. (2010). Influence of sonication on the phenolic content and antioxidant activity of terminalia catappa l. leaves. Pharmacognosy Res. 2, 368. doi: 10.4103/0974-8490.75457
Arias, C. L., Quach, T., Huynh, T., Nguyen, H., Moretti, A., Shi, Y., et al. (2022). Expression of AtWRI1 and AtDGAT1 during soybean embryo development influences oil and carbohydrate metabolism. Plant Biotechnol. J. 20, 1327–1345. doi: 10.1111/PBI.13810
Bari, R., Jones, J. D. G. (2009). Role of plant hormones in plant defence responses. Plant Mol. Biol. 69, 473–488. doi: 10.1007/s11103-008-9435-0
Bataglion, G. A., Da Silva, F. M. A., Eberlin, M. N., Koolen, H. H. F. (2015). Determination of the phenolic composition from Brazilian tropical fruits by UHPLC–MS/MS. Food Chem. 180, 280–287. doi: 10.1016/J.FOODCHEM.2015.02.059
Boğa, M., Bingül, M., Özkan, E. E., Şahin, H. (2019). Chemical and biological perspectives of monoterpene indole alkaloids from rauwolfia species. Stud. Nat. Prod. Chem. 61, 251–299. doi: 10.1016/B978-0-444-64183-0.00007-5
Böttger, A., Vothknecht, U., Bolle, C., Wolf, A. (2018). ““Plant secondary metabolites and their general function in plants,”,” in Lessons on caffeine, cannabis & co. learning materials in biosciences (Cham: Springer), 3–17. doi: 10.1007/978-3-319-99546-5_1
Boudet, A. M. (2007). Evolution and current status of research in phenolic compounds. Phytochemistry 68, 2722–2735. doi: 10.1016/J.PHYTOCHEM.2007.06.012
Brar, D. S., Khush, G. S. (2018). Wild relatives of rice: A valuable genetic resource for genomics and breeding research. In: Mondal, T., Henry, R. (eds). The Wild Oryza Genomes. Compendium of Plant Genomes (Cham: Springer). doi: 10.1007/978-3-319-71997-9_1
Campa, C., Mondolot, L., Rakotondravao, A., Bidel, L. P. R., Gargadennec, A., Couturon, E., et al. (2012). A survey of mangiferin and hydroxycinnamic acid ester accumulation in coffee (Coffea) leaves: biological implications and uses. Ann. Bot. 110, 595–613. doi: 10.1093/aob/mcs119
Cangeloni, L., Bonechi, C., Leone, G., Consumi, M., Andreassi, M., Magnani, A., et al. (2022). Characterization of extracts of coffee leaves (Coffea arabica l.) by spectroscopic and chromatographic/spectrometric techniques. Foods 11, 2495. doi: 10.3390/FOODS11162495
Carvalho, H. F., da Silva, F. L., de Resende, M. D. V., Bhering, L. L. (2019). Selection and genetic parameters for interpopulation hybrids between kouilou and robusta coffee. Bragantia 78, 52–59. doi: 10.1590/1678-4499.2018124
Castro-Moretti, F. R., Cocuron, J. C., Cia, M. C., Cataldi, T. R., Labate, C. A., Alonso, A. P., et al. (2021). Targeted metabolic profiles of the leaves and xylem sap of two sugarcane genotypes infected with the vascular bacterial pathogen leifsonia xyli subsp. xyli. Metabolites 11, 234. doi: 10.3390/metabo11040234
Castro-moretti, F. R., Gentzel, I. N., Mackey, D., Alonso, A. P. (2020). Metabolomics as an emerging tool for the study of plant–pathogen interactions. Metabolites 10 (2), 52. doi: 10.3390/metabo10020052
Chandra Kala, S. (2015). Medicinal attributes of family rubiaceae. Int. J. Pharm. Biol. Sci. 5, 179–181. doi: 10.4103/0973-7847.95866
Chen, X. (2019). A review on coffee leaves: Phytochemicals, bioactivities and applications. Crit. Rev. Food Sci. Nutr. 59, 1008–1025. doi: 10.1080/10408398.2018.1546667
Chen, X., Ding, J., Ji, D., He, S., Ma, H. (2020b). Optimization of ultrasonic-assisted extraction conditions for bioactive components from coffee leaves using the taguchi design and response surface methodology. J. Food Sci. 85, 1742–1751. doi: 10.1111/1750-3841.15111
Chen, S., Ma, J., Yang, L., Teng, M., Lai, Z. Q., Chen, X., et al. (2020a). Anti-glioblastoma activity of kaempferol via programmed cell death induction: involvement of autophagy and pyroptosis. Front. Bioeng. Biotechnol. 8. doi: 10.3389/FBIOE.2020.614419/BIBTEX
Chen, Q. C., Zhang, W. Y., Youn, U. J., Kim, H. J., Lee, I. S., Jung, H. J., et al. (2009). Iridoid glycosides from gardeniae fructus for treatment of ankle sprain. Phytochemistry 70, 779–784. doi: 10.1016/J.PHYTOCHEM.2009.03.008
Chiocchio, I., Mandrone, M., Tomasi, P., Marincich, L., Poli, F. (2021). Plant secondary metabolites: An opportunity for circular economy. Mol 26, 495. doi: 10.3390/MOLECULES26020495
Chong, J., Soufan, O., Li, C., Caraus, I., Li, S., Bourque, G., et al. (2018). MetaboAnalyst 4.0: towards more transparent and integrative metabolomics analysis. Nucleic Acids Res. 46, W486–W494. doi: 10.1093/nar/gky310
Cocuron, J.-C., Anderson, B., Boyd, A., Alonso, A. P. (2014). Targeted metabolomics of physaria fendleri, an industrial crop producing hydroxy fatty acids. Plant Cell Physiol. 55, 620–633. doi: 10.1093/pcp/pcu011
Cocuron, J.-C., Casas, M. I., Yang, F., Grotewold, E., Alonso, A. P. (2019). Beyond the wall: high-throughput quantification of plant soluble and cell-wall bound phenolics by liquid chromatography tandem mass spectrometry. J. Chromatogr. A 1589, 93–104. doi: 10.1016/J.CHROMA.2018.12.059
Cocuron, J. C., Tsogtbaatar, E., Alonso, A. P. (2017). High-throughput quantification of the levels and labeling abundance of free amino acids by liquid chromatography tandem mass spectrometry. J. Chromatogr. A 1490, 148–155. doi: 10.1016/J.CHROMA.2017.02.028
Conserva, L. M., Ferreira Júnior, J. C. (2012). Borreria and spermacoce species (Rubiaceae): A review of their ethnomedicinal properties, chemical constituents, and biological activities. Pharmacogn. Rev. 6, 46–55. doi: 10.4103/0973-7847.95866
Cragg, G. M., Newman, D. J. (2013). Natural products: A continuing source of novel drug leads. Biochim. Biophys. Acta - Gen. Subj. 1830, 3670–3695. doi: 10.1016/J.BBAGEN.2013.02.008
Davidson, I. W. F., Sumner, D. D., Parker, J. C. (2008). Chloroform: A review of its metabolism, teratogenic, mutagenic, and carcinogenic potential. Drug Chem. Toxicol. 5 (1), 1–87. doi: 10.3109/01480548209017822
de Falco, B., Lanzotti, V. (2018). NMR spectroscopy and mass spectrometry in metabolomics analysis of salvia. Phytochem. Rev. 17, 951–972. doi: 10.1007/S11101-018-9550-8
Du Fall, L. A., Solomon, P. S. (2011). Role of cereal secondary metabolites involved in mediating the outcome of plant-pathogen interactions. Metabolites 1, 64–78. doi: 10.3390/metabo1010064
Dunn, W. B., Erban, A., Weber, R. J. M., Creek, D. J., Brown, M., Breitling, R., et al. (2012). Mass appeal: metabolite identification in mass spectrometry-focused untargeted metabolomics. Metabolomics 91 9, 44–66. doi: 10.1007/S11306-012-0434-4
Elansary, H. O., Abdel-Hamid, A. M. E., Yessoufou, K., Al-Mana, F. A., El-Ansary, D. O., Mahmoud, E. A., et al. (2020). Physiological and molecular characterization of water-stressed chrysanthemum under robinin and chitosan treatment. Acta Physiol. Plant 42, 1–14. doi: 10.1007/S11738-020-3021-8/FIGURES/12
Felice, M. R., Maugeri, A., De Sarro, G., Navarra, M., Barreca, D. (2022). Molecular pathways involved in the anti-cancer activity of flavonols: A focus on myricetin and kaempferol. Int. J. Mol. Sci. 23, 4411. doi: 10.3390/IJMS23084411
Feuillet, C., Langridge, P., Waugh, R. (2008). Cereal breeding takes a walk on the wild side. Trends Genet. 24, 24–32. doi: 10.1016/J.TIG.2007.11.001
Funlayo, A. A., Adenuga, O. O., Mapayi, E. F., Olaniyi, O. O. (2017). Coffee: Botany, distribution, diversity, chemical composition and its management. J. Agric. Vet. Sci. 10, 57–62. doi: 10.9790/2380-1007035762
Gallego-Giraldo, L., Posé, S., Pattathil, S., Peralta, A. G., Hahn, M. G., Ayre, B. G., et al. (2018). Elicitors and defense gene induction in plants with altered lignin compositions. New Phytol. 219, 1235–1251. doi: 10.1111/nph.15258
Guang, C., Chen, J., Sang, S., Cheng, S. (2014). Biological functionality of soyasaponins and soyasapogenols. J. Agric. Food Chem. 62, 8247–8255. doi: 10.1021/JF503047A/ASSET/IMAGES/LARGE/JF-2014-03047A_0001.JPEG
Gulcin, I., Kaya, R., Goren, A. C., Akincioglu, H., Topal, M., Bingol, Z., et al. (2019). Anticholinergic, antidiabetic and antioxidant activities of cinnamon (cinnamomum verum) bark extracts: polyphenol contents analysis by LC-MS/MS. Int. J. Food Prop. 22, 1511–1526. doi: 10.1080/10942912.2019.1656232
Hasan, M. M., Bashir, T., Bae, H. (2017). Use of ultrasonication technology for the increased production of plant secondary metabolites. Molecules. 22(7), 1046. doi: 10.3390/molecules22071046.
Hossain, M. B., Tiwari, B. K., Gangopadhyay, N., O’Donnell, C. P., Brunton, N. P., Rai, D. K. (2014). Ultrasonic extraction of steroidal alkaloids from potato peel waste. Ultrason. Sonochem. 21, 1470–1476. doi: 10.1016/J.ULTSONCH.2014.01.023
Iftikhar, A., Ali, S., Yasmeen, T., Arif, M. S., Zubair, M., Rizwan, M., et al. (2019). Effect of gibberellic acid on growth, photosynthesis and antioxidant defense system of wheat under zinc oxide nanoparticle stress. Environ. pollut. 254, 113109. doi: 10.1016/J.ENVPOL.2019.113109
Jabir, N. R., Khan, M. S., Alafaleq, N. O., Naz, H., Ahmed, B. A. (2022). Anticancer potential of yohimbine in drug-resistant oral cancer KB-ChR-8-5 cells. Moleuclar Biol. Rep. 49, 9565–9573. doi: 10.1007/s11033-022-07847-7
Jaini, R., Wang, P., Dudareva, N., Chapple, C., Morgan, J. A. (2017). Targeted metabolomics of the phenylpropanoid pathway in arabidopsis thaliana using reversed phase liquid chromatography coupled with tandem mass spectrometry. Phytochem. Anal. 28, 267–276. doi: 10.1002/PCA.2672
Jain, C., Khatana, S., Vijayvergia, R. (2019). Bioactivity of secondary metabolites of various plants: A review. Artic. Int. J. Pharm. Sci. Res. 10, 494–504. doi: 10.13040/IJPSR.0975-8232.10(2).494-04
Jez, J. M., Topp, C. N., Alvarez, S., Naldrett, M. J. (2021). Mass spectrometry based untargeted metabolomics for plant systems biology. Emerg. Top. Life Sci. 5, 189–201. doi: 10.1042/ETLS20200271
Jorge, T. F., Mata, A. T., António, C. (2016). Mass spectrometry as a quantitative tool in plant metabolomics. Philos. Trans. R. Soc A Math. Phys. Eng. Sci. 374 (2079), 20150370. doi: 10.1098/RSTA.2015.0370
Kessler, A., Kalske, A. (2018). Plant secondary metabolite diversity and species interactions. Annu. Rev. Ecol. Evol. Syst. 49, 115–138. doi: 10.1146/annurev-ecolsys-110617-062406
Kim, M., Jung, J., Jeong, N. Y., Chung, H. J. (2019b). The natural plant flavonoid apigenin is a strong antioxidant that effectively delays peripheral neurodegenerative processes. Anat. Sci. Int. 94, 285–294. doi: 10.1007/S12565-019-00486-2/FIGURES/6
Kim, J. H., Kim, M., Kim, J. M., Lee, M. K., Seo, S. J., Park, K. Y. (2019a). Afzelin suppresses proinflammatory responses in particulate matter-exposed human keratinocytes. Int. J. Mol. Med. 43, 2516–2522. doi: 10.3892/IJMM.2019.4162/HTML
Kluska, M., Juszczak, M., Żuchowski, J., Stochmal, A., Woźniak, K. (2021). Kaempferol and its glycoside derivatives as modulators of etoposide activity in HL-60 cells. Int. J. Mol. Sci. 22, 3520. doi: 10.3390/IJMS22073520
Korkina, L. G. (2007). Phenylpropanoids as naturally occurring antioxidants: From plant defense to human health. Cell. Mol. Biol. 53, 15–25. doi: 10.1170/T772
Kunert, O., Sreekanth, G., Babu, G. S., Rao, B. V. R. A., Radhakishan, M., Kumar, B. R., et al. (2009). Cycloartane triterpenes from dikamali, the gum resin of gardenia gummifera and gardenia lucida. Chem. Biodivers. 6, 1185–1192. doi: 10.1002/CBDV.200800339
Laus, G., Teppner, H. (1996). The alkaloids of an uncaria rhynchophylla (Rubiaceae-coptosapelteae). Phyton (Horn, Austria)36, 185–196.
Lee, K. S., Woo, S. Y., Lee, M. J., Kim, H. Y., Ham, H., Lee, D. J., et al. (2020). Isoflavones and soyasaponins in the germ of Korean soybean [Glycine max (L.) merr.] cultivars and their compound-enhanced BMP-2-induced bone formation. Appl. Biol. Chem. 63, 1–8. doi: 10.1186/S13765-020-00508-Y/FIGURES/2
Leroy, T., Ribeyre, F., Bertrand, B., Charmetant, P., Dufour, M., Montagnon, C., et al. (2006). Genetics of coffee quality. Braz. J. Plant Physiol. 18, 229–242. doi: 10.1590/S1677-04202006000100016
Lin, Y., Xu, W., Huang, M., Xu, W., Li, H., Ye, M., et al. (2015). Qualitative and quantitative analysis of phenolic acids, flavonoids and iridoid glycosides in yinhua kanggan tablet by UPLC-QqQ-MS/MS. Mol. 20, 12209–12228. doi: 10.3390/MOLECULES200712209
Liu, Y., Tikunov, Y., Schouten, R. E., Marcelis, L. F. M., Visser, R. G. F., Bovy, A. (2018). Anthocyanin biosynthesis and degradation mechanisms in solanaceous vegetables: A review. Front. Chem. 6. doi: 10.3389/FCHEM.2018.00052/BIBTEX
Liu, X., Zhou, L., Shi, X., Xu, G. (2019). New advances in analytical methods for mass spectrometry-based large-scale metabolomics study. TrAC Trends Anal. Chem. 121, 115665. doi: 10.1016/J.TRAC.2019.115665
Ma, D., Li, Y., Zhang, J., Wang, C., Qin, H., Ding, H., et al. (2016). Accumulation of phenolic compounds and expression profiles of phenolic acid biosynthesis-related genes in developing grains of white, purple, and red wheat. Front. Plant Sci. 7. doi: 10.3389/FPLS.2016.00528/BIBTEX
Marchetti, L., Pellati, F., Graziosi, R., Brighenti, V., Pinetti, D., Bertelli, D. (2019). Identification and determination of bioactive phenylpropanoid glycosides of aloysia polystachya (Griseb. et moldenke) by HPLC-MS. J. Pharm. Biomed. Anal. 166, 364–370. doi: 10.1016/J.JPBA.2019.01.033
Marczak, L., Kawiak, A., Łojkowska, E., Stobiecki, M. (2005). Secondary metabolites in in vitro cultured plants of the genus drosera. Phytochem. Anal. 16, 143–149. doi: 10.1002/PCA.833
Martínez, G., Regente, M., Jacobi, S., Del Rio, M., Pinedo, M., de la Canal, L. (2017). Chlorogenic acid is a fungicide active against phytopathogenic fungi. pestic. Biochem. Physiol. 140, 30–35. doi: 10.1016/J.PESTBP.2017.05.012
Martins, D., Nunez, C. (2015). Secondary metabolites from rubiaceae species. Molecules 20, 13422–13495. doi: 10.3390/molecules200713422
Masson, P., Alves, A. C., Ebbels, T. M. D., Nicholson, J. K., Want, E. J. (2010). Optimization and evaluation of metabolite extraction protocols for untargeted metabolic profiling of liver samples by UPLC-MS. Anal. Chem. 82, 7779–7786. doi: 10.1021/ac101722e
Matsuda, F., Yonekura-Sakakibara, K., Niida, R., Kuromori, T., Shinozaki, K., Saito, K. (2009). MS/MS spectral tag-based annotation of non-targeted profile of plant secondary metabolites. Plant J. 57, 555–577. doi: 10.1111/J.1365-313X.2008.03705.X
McSorley, R., Phillips, M. S. (1992). Origin, evolution, population genetics and resources for breeding of wild barley, hordeum spontaneum, in the fertile crescent. Barley Genet. Biochem. Mol. Biol. Biotechnol., 19–43.
Millan, A. F. S., Gamir, J., Farran, I., Larraya, L., Veramendi, J. (2022). Identification of new antifungal metabolites produced by the yeast metschnikowia pulcherrima involved in the biocontrol of postharvest plant pathogenic fungi. Postharvest Biol. Technol. 192, 111995. doi: 10.1016/J.POSTHARVBIO.2022.111995
Montis, A., Souard, F., Delporte, C., Stoffelen, P., Stévigny, C., Van Antwerpen, P. (2022). Targeted and untargeted mass spectrometry-based metabolomics for chemical profiling of three coffee species. Molecules 27 (10), 3152. doi: 10.3390/MOLECULES27103152
Nagar, S., Singh, V. P., Arora, A., Dhakar, R., Singh, N., Singh, G. P., et al. (2021). Understanding the role of gibberellic acid and paclobutrazol in terminal heat stress tolerance in wheat. Front. Plant Sci. 12. doi: 10.3389/FPLS.2021.692252/BIBTEX
Nakabayashi, R., Saito, K. (2015). Integrated metabolomics for abiotic stress responses in plants. Curr. Opin. Plant Biol. 24, 10–16. doi: 10.1016/j.pbi.2015.01.003
Natarajan, T., Anandhi, M., Aiswarya, D., Ramkumar, R., Kumar, S., Perumal, P. (2016). Idaein chloride induced p53 dependent apoptosis in cervical cancer cells through inhibition of viral oncoproteins. Biochimie 121, 13–20. doi: 10.1016/J.BIOCHI.2015.11.008
Ndagijimana, A., Wang, X., Pan, G., Zhang, F., Feng, H., Olaleye, O. (2013). A review on indole alkaloids isolated from uncaria rhynchophylla and their pharmacological studies. Fitoterapia 86, 35–47. doi: 10.1016/J.FITOTE.2013.01.018
Orcic, D., Franciškovic, M., Bekvalac, K., Svircev, E., Beara, I., Lesjak, M., et al. (2014). Quantitative determination of plant phenolics in urtica dioica extracts by high-performance liquid chromatography coupled with tandem mass spectrometric detection. Food Chem. 143, 48–53. doi: 10.1016/J.FOODCHEM.2013.07.097
Osman, A. G., Haider, S., Chittiboyina, A. G., Khan, I. A. (2019). Utility of alkaloids as chemical and biomarkers for quality, efficacy, and safety assessment of botanical ingredients. Phytomedicine 54, 347–356. doi: 10.1016/J.PHYMED.2018.03.064
Patay, E. B., Fritea, L., Antonescu, A., Antonescu, A., Dobjanschi, L. (2017). Coffea arabica: A plant with rich content in caffeine. The Question of Caffeine. (London, United Kingdom: IntechOpen) doi: 10.5772/intechopen.68149
Patra, B., Schluttenhofer, C., Wu, Y., Pattanaik, S., Yuan, L. (2013). Transcriptional regulation of secondary metabolite biosynthesis in plants. biochim. Biophys. Acta - Gene Regul. Mech. 1829, 1236–1247. doi: 10.1016/J.BBAGRM.2013.09.006
Patti, G. J., Yanes, O., Siuzadak, G., Siuzdak, G. (2012). Metabolomics: the apogee of the omics triology. Nat. Rev. Mol. Cell Biol. 13, 263–269. doi: 10.1038/nrm3314
Peleg, Z., Fahima, T., Abbo, S., Krugman, T., Nevo, E., Yakir, D., et al. (2005). Genetic diversity for drought resistance in wild emmer wheat and its ecogeographical associations. Plant Cell Environ. 28, 176–191. doi: 10.1111/J.1365-3040.2005.01259.X
Perez de Souza, L., Alseekh, S., Naake, T., Fernie, A. (2019). Mass spectrometry-based untargeted plant metabolomics. Curr. Protoc. Plant Biol. 4, e20100. doi: 10.1002/CPPB.20100
Quatrin, A., Pauletto, R., Maurer, L. H., Minuzzi, N., Nichelle, S. M., Carvalho, J. F. C., et al. (2019). Characterization and quantification of tannins, flavonols, anthocyanins and matrix-bound polyphenols from jaboticaba fruit peel: A comparison between myrciaria trunciflora and m. jaboticaba. J. Food Compos. Anal. 78, 59–74. doi: 10.1016/J.JFCA.2019.01.018
Roberts, L. D., Souza, A. L., Gerszten, R. E., Clish, C. B. (2012). Targeted metabolomics. Curr. Protoc. Mol. Biol. 98, 30.2.1–30.2.24. doi: 10.1002/0471142727.MB3002S98
Rodrigues, F. A., Carré-Missio, V., Jham, G. N., Berhow, M., Schurt, D. A. (2011). Chlorogenic acid levels in leaves of coffee plants supplied with silicon and infected by hemileia vastatrix. Trop. Plant Pathol. 36, 404–408. doi: 10.1590/S1982-56762011000600010
Roopashree, K. M., Naik, D. (2019). Advanced method of secondary metabolite extraction and quality analysis. J. Pharmacogn. Phytochem. 8, 1829–1842.
Saini, N., Grewal, A. S., Lather, V., Gahlawat, S. K. (2022). Natural alkaloids targeting EGFR in non-small cell lung cancer: Molecular docking and ADMET predictions. Chem. Biol. Interact. 358, 109901. doi: 10.1016/J.CBI.2022.109901
Santamarina, A. B., Pisani, L. P., Baker, E. J., Marat, A. D., Valenzuela, C. A., Miles, E. A., et al. (2021). Anti-inflammatory effects of oleic acid and the anthocyanin keracyanin alone and in combination: effects on monocyte and macrophage responses and the NF-kappa b pathway. Food Funct. 12, 7909–7922. doi: 10.1039/D1FO01304A
Sawada, Y., Yokota Hirai, M. (2013). ). integrated LC-MS/MS system for plant metabolomics. Comput. Struct. Biotechnol. J. 4, e201301011. doi: 10.5936/CSBJ.201301011
Sawynok, J. (1995). Pharmacological rationale for the clinical use of caffeine. Drugs 49, 37–50. doi: 10.2165/00003495-199549010-00004
Schwechheimer, C., Willige, B. C. (2009). Shedding light on gibberellic acid signalling. Curr. Opin. Plant Biol. 12, 57–62. doi: 10.1016/J.PBI.2008.09.004
Shankar, E., Goel, A., Gupta, K., Gupta, S. (2017). Plant flavone apigenin: An emerging anticancer agent. Curr. Pharmacol. Rep. 3, 423. doi: 10.1007/S40495-017-0113-2
Shimizu, T., Watanabe, M., Fernie, A. R., Tohge, T. (2018). Targeted LC-MS analysis for plant secondary metabolites. Methods Mol. Biol. 1778, 171–181. doi: 10.1007/978-1-4939-7819-9_12/COVER
Silva, G. L., Lee, I.-S., Kinghorn, A. D. (1998). “Special problems with the extraction of plants,” in Natural products isolation. methods in biotechnology. Ed. Cannell, R. J. (Totowa: Humana Press), 343–363. doi: 10.1007/978-1-59259-256-2_12
Simunkova, M., Barbierikova, Z., Jomova, K., Hudecova, L., Lauro, P., Alwasel, S. H., et al. (2021). Antioxidant vs. prooxidant properties of the flavonoid, kaempferol, in the presence of Cu(II) ions: A ROS-scavenging activity, fenton reaction and DNA damage study. Int. J. Mol. Sci. 22 (4), 1619. doi: 10.3390/IJMS22041619
Soares Melecchi, M. I., Péres, V. F., Dariva, C., Zini, C. A., Abad, F. C., Martinez, M. M., et al. (2006). Optimization of the sonication extraction method of hibiscus tiliaceus l. flowers. Ultrason. Sonochem. 13, 242–250. doi: 10.1016/J.ULTSONCH.2005.02.003
Somsak, V., Damkaew, A., Onrak, P. (2018). Antimalarial activity of kaempferol and its combination with chloroquine in plasmodium berghei infection in mice. J. Pathog. 2018, 1–7. doi: 10.1155/2018/3912090
Souard, F., Delporte, C., Stoffelen, P., Thévenot, E. A., Noret, N., Dauvergne, B., et al. (2018). Metabolomics fingerprint of coffee species determined by untargeted-profiling study using LC-HRMS. Food Chem. 245, 603–612. doi: 10.1016/J.FOODCHEM.2017.10.022
Spooner, D. M., Ghislain, M., Simon, R., Jansky, S. H., Gavrilenko, T. (2014). Systematics, diversity, genetics, and evolution of wild and cultivated potatoes. Bot. Rev. 80, 283–383. doi: 10.1007/S12229-014-9146-Y/FIGURES/8
Su, Y., Ma, L., Wen, Y., Wang, H., Zhang, S. (2014). Studies of the in vitro antibacterial activities of several polyphenols against clinical isolates of methicillin-resistant staphylococcus aureus. Molecules 19, 12630–12639. doi: 10.3390/molecules190812630
Sun, D., Dong, L., Guo, P., Shi, X., Gao, J., Ren, Y., et al. (2013). Simultaneous detection of flavonoids and phenolic acids in herba lysimachiae and herba desmodii styracifolii using liquid chromatography tandem mass spectrometry. Food Chem. 138, 139–147. doi: 10.1016/J.FOODCHEM.2012.09.096
Sung, W. S., Lee, D. G. (2010). Antifungal action of chlorogenic acid against pathogenic fungi, mediated by membrane disruption. Pure Appl. Chem. 82, 219–226. doi: 10.1351/PAC-CON-09-01-08/MACHINEREADABLECITATION/RIS
Tautenhahn, R., Patti, G. J., Rinehart, D., Siuzdak, G. (2012). XCMS online: A web-based platform to process untargeted metabolomic data. Anal. Chem. 84, 5035–5039. doi: 10.1021/ac300698c
Valdeira, A. S. C., Darvishi, E., Woldemichael, G. M., Beutler, J. A., Gustafson, K. R., Salvador, J. A. R. (2019). Madecassic acid derivatives as potential anticancer agents: Synthesis and cytotoxic evaluation. J. Nat. Prod. 82, 2094–2105. doi: 10.1021/ACS.JNATPROD.8B00864/ASSET/IMAGES/LARGE/NP-2018-00864R_0003.JPEG
Wang, F., Gong, S., Wang, T., Li, L., Luo, H., Wang, J., et al. (2020). Soyasaponin II protects against acute liver failure through diminishing YB-1 phosphorylation and Nlrp3-inflammasome priming in mice. Theranostics 10, 2714–2726. doi: 10.7150/THNO.40128
Wang, Y., Liu, H., Shen, L., Yao, L., Ma, Y., Yu, D., et al. (2015). Isolation and purification of six iridoid glycosides from gardenia jasminoides fruit by medium-pressure liquid chromatography combined with macroporous resin chromatography. J. Sep. Sci. 38, 4119–4126. doi: 10.1002/jssc.201500705
Won, J. H., Shin, J. S., Park, H. J., Jung, H. J., Koh, D. J., Jo, B. G., et al. (2010). Anti-inflammatory effects of madecassic acid via the suppression of NF-κB pathway in LPS-induced RAW 264.7 macrophage cells. Planta Med. 76, 251–257. doi: 10.1055/S-0029-1186142
Xie, S., Shi, Y., Wang, Y., Wu, C., Liu, W., Feng, F., et al. (2013). Systematic identification and quantification of tetracyclic monoterpenoid oxindole alkaloids in uncaria rhynchophylla and their fragmentations in q-TOF-MS spectra. J. Pharm. Biomed. Anal. 81–82, 56–64. doi: 10.1016/J.JPBA.2013.03.017
Xie, M., Zhang, J., Tschaplinski, T. J., Tuskan, G. A., Chen, J. G., Muchero, W. (2018). Regulation of lignin biosynthesis and its role in growth-defense tradeoffs. Front. Plant Sci. 9. doi: 10.3389/fpls.2018.01427
Xu, X., Wang, Y., Wei, Z., Wei, W., Zhao, P., Tong, B., et al. (2017). Madecassic acid, the contributor to the anti-colitis effect of madecassoside, enhances the shift of Th17 toward treg cells via the PPARγ/AMPK/ACC1 pathway. Cell Death Dis. 838, e2723–e2723. doi: 10.1038/cddis.2017.150
Xu, X., Xie, H., Hao, J., Jiang, Y., Wei, X. (2011). Flavonoid glycosides from the seeds of litchi chinensis. J. Agric. Food Chem. 59, 1205–1209. doi: 10.1021/JF104387Y/ASSET/IMAGES/LARGE/JF-2010-04387Y_0001.JPEG
Yang, L., Peng, K., Zhao, S., Zhao, F., Chen, L., Qiu, F. (2013). 2-methyl-l-erythritol glycosides from gardenia jasminoides. Fitoterapia 89, 126–130. doi: 10.1016/J.FITOTE.2013.05.018
Zhang, X., Bi, Q., Wu, X., Wang, Z., Miao, Y., Tan, N. (2018). Systematic characterization and quantification of rubiaceae-type cyclopeptides in 20 rubia species by ultra performance liquid chromatography tandem mass spectrometry combined with chemometrics. J. Chromatogr. A 1581–1582, 43–54. doi: 10.1016/J.CHROMA.2018.10.049
Zhang, H. F., Yang, X. H., Wang, Y. (2011). Microwave assisted extraction of secondary metabolites from plants: Current status and future directions. Trends Food Sci. Technol. 22, 672–688. doi: 10.1016/J.TIFS.2011.07.003
Keywords: LC-MS/MS, phenolics, phytochemicals, Rubiaceae, secondary metabolism
Citation: Castro-Moretti FR, Cocuron J-C, Castillo-Gonzalez H, Escudero-Leyva E, Chaverri P, Guerreiro-Filho O, Slot JC and Alonso AP (2023) A metabolomic platform to identify and quantify polyphenols in coffee and related species using liquid chromatography mass spectrometry. Front. Plant Sci. 13:1057645. doi: 10.3389/fpls.2022.1057645
Received: 29 September 2022; Accepted: 14 December 2022;
Published: 06 January 2023.
Edited by:
Marta Sousa Silva, University of Lisbon, PortugalReviewed by:
Emmanuelle Meudec, Institut National de recherche pour l’agriculture, l’alimentation et l’environnement (INRAE), FranceMelissa Hamner Mageroy, Norwegian Institute of Bioeconomy Research (NIBIO), Norway
Copyright © 2023 Castro-Moretti, Cocuron, Castillo-Gonzalez, Escudero-Leyva, Chaverri, Guerreiro-Filho, Slot and Alonso. This is an open-access article distributed under the terms of the Creative Commons Attribution License (CC BY). The use, distribution or reproduction in other forums is permitted, provided the original author(s) and the copyright owner(s) are credited and that the original publication in this journal is cited, in accordance with accepted academic practice. No use, distribution or reproduction is permitted which does not comply with these terms.
*Correspondence: Ana Paula Alonso, QW5hcGF1bGEuQWxvbnNvQHVudC5lZHU=