 Shunli Wang†
 Xiaoning Liu
 Xiuxin Zhang
- Key Laboratory of Biology and Genetic Improvement of Flower Crops (North China), Ministry of Agriculture and Rural Affairs, Institute of Vegetables and Flowers, Chinese Academy of Agricultural Sciences, Beijing, China
Light quality strongly impacts the growth and flower quality of ornamental plants. The optimum light quality for the growth and flowering of Hippeastrum remains to be validated. In the present study, we investigated the effect of the red/blue light ratio of LEDs on the growth and flowering quality of H. hybrid ‘Red Lion’. Two LEDs with red/blue light ratio of 1:9 (R10B90) and 9:1 (R90B10) were designed. LEDs of white light were the control. In the earlier vegetative and reproductive growth phase, R90B10 increased the biomass of the bulbs, leaves, and flowers. Compared with the control and R10B90 group, R90B10 LEDs delayed flowering by 2.30 d and 3.26 d, respectively. Based on chlorophyll contents, photosynthetic capacity, chlorophyll fluorescence parameters, and carbohydrate contents, the photosynthesis rate was higher in the R10B90 group. Optimal red and blue light intensity promoted the accumulation of carbohydrates and early flowering and prolonged the flowering period of H. hybrid. Microscopic analysis showed that stomatal density was high, and the number of chloroplasts was large in the R10B90 treatment group, which enhanced photosynthesis. Particularly, R10B90 promoted the expression of seven key genes related to chlorophyll synthesis. R10B90 also promoted early overexpression of the HpCOL gene that promotes early flowering. Thus, higher blue light and 10% red light intensities promote early and extended flowering, while higher red light and 10% blue light promote vegetative plant growth but delay flowering.
Introduction
The Hippeastrum genus, also referred to as Amaryllis, originated from the tropical and subtropical regions of Central and South America, mainly in Brazil, Peru, and Bolivia. Members of this genus are monocotyledonous plants in the Amaryllidaceae family, comprising 75 species (Wang et al., 2018). Most members of the Hippeastrum genus have large and colorful flowers of ornamental value (Byamukama et al., 2006). Amaryllis is a favourite flower for Christmas and New Year decorations worldwide (Silberbush et al., 2003). Hippeastrum hybrids were introduced into China at the beginning of the 20th century, and after cultivar screening for better ornamental characteristics, domestication, and cultivation over time, they have been adapted in many provinces in China, especially in Yunnan and Guangdong (Shi et al., 2014). Many cut and potted amaryllis flowers are popular in China and are always part of the serving during the Chinese Spring Festival. However, the low temperature in North China in the winter season does not favor the cultivation of Amaryllis in the region. Likewise, forcing culture of Amaryllis is always used to achieve year-round flowering because its flowering time can easily be manipulated (De Hertogh and Gallitano, 2000).
Genetic and environmental factors influence the growth, development, and reproduction of higher plants (Fantini and Facella, 2020). Light quantity and quality are important environmental factors that influence numerous plant processes, including photosynthesis, germination, flowering, and several other metabolic/physiological processes light (Ramalho et al., 2002). Light quality, quantity, periodicity, and duration are reflected through the content of photosynthetic pigments and the expression of genes for various photoreceptors (Thomas, 2006; Fantini and Facella, 2020). Red light is absorbed by billin-containing phytochromes, whereas blue light is absorbed by flavin-containing cryptochromes and/or phototropin (Lin, 2000; Chaves et al., 2011; Petroutsos et al., 2016). Red (R) and blue (B) light influences plant shoot and stem elongation, and flowering in petunia, rose, and poinsettia (Islam et al., 2012; Abidi et al., 2013; Terfa et al., 2013; Gautam et al., 2015; Fukuda et al., 2016). Supplementary blue light increases the biomass and yield of tomatoes grown in the greenhouse (Kaiser et al., 2019). Manipulation of light quality with artificial light systems has been used to improve the production of commercial crops.
Light-emitting diodes (LEDs) have several advantages over natural light, including solid-state, long-lasting, and provide a narrow light spectrum suitable for flowering and metabolism of many horticultural plants, both of which increase the yield and improve the quality of the products (Gautam et al., 2015; Kaiser et al., 2019; Naznin et al., 2019; Virsile et al., 2020). Therefore, it is important to investigate how LED light affects plant growth and development. Previous studies showed that blue and red lights from LEDs enhance the growth, pigmentation, and antioxidant capacity of horticultural crops (Naznin et al., 2019). However, the best combination of red and blue light for the optimal growth and flowering of members in the Hippestrum genus is still unclear.
Four red/blue light ratios, including a red/blue light ratio of 9:1 (R90B10), 7:3 (R70B30), 5:5 (R50B50), 1:1:1 (R33B33W33), 1:9 (R10B90), and white light, affected growth and development of H. hybridum ‘Red Lion’ were investigated in our lab. It was showed that R90B10 and R10B90 significantly affect the growth and flowering quality of H. × hybridum. However, the precise mechanisms underlying this process are unclear.
In the present study, the effect of the red/blue light ratio of LEDs on the growth and flowering quality of Amaryllis under forcing-culture was investigated. Two LEDs with a red/blue light ratio of 9:1 (R90B10) and 1:9 (R10B90) were used. White LED light (at a color temperature of 6500 K) was used as the control. The effect of the red/blue LED light on the morphological characteristics, photosynthesis rate, chlorophyll content, physiological substance contents, and flowering quality of Amaryllis were investigated. The effect of the red/blue LED light on chlorophyll fluorescence as well as stomatal and chloroplast ultrastructure of leaves was also investigated using a microscope. The effect of the red/blue LED light on the expression of chlorophyll synthesis and flowering-related genes was analyzed using qRT-PCR. The findings of this research provide practical evidence on how to improve the cultivation of Amaryllis in a controlled environment.
Materials and methods
Plant materials and growth conditions
A total of 300 H. × hybridum ‘Red Lion’ bulbs were purchased from Beijing Dadongliu Nursery, Beijing, China. Of these, 270 bulbs with 17 - 19 cm circumference were selected for the experiments. The bulbs were stored at 4 ± 1°C for about 50 days to break dormancy. After pre-chilling, the bulbs were planted in plastic containers 20 cm wide in peat and perlite substrates mixed at the ratio of 2: 1. The 270 bulbs were randomly divided into three groups (n = 90 each) for further experiments. Before planting, the outer black-brown scales, wilted roots, and damaged tissues of the basal plate were removed. The bulbs were then soaked in 0.1% carbendazol solution for 40 min and wiped off using sterile tissue paper. The potted bulbs were incubated in a growth chamber under three different light quality conditions. The experiment was performed at the Institute of Vegetables and Flowers, Chinese Academy of Agricultural Sciences in Beijing, China. The day/night temperature was maintained at 23 ± 2°C, and the air humidity was about 65% - 80%.
LED light treatments
Two light spectra of 90% red plus 10% blue LEDs (R90B10) and 10% red plus 90% blue LEDs (R10B90) were used in this study, selected according to the findings of previous studies. White LED (color temperature of 6500 K) was the control. Each treatment comprised three replications, each 30 pots. The photoperiod was 14 h, and photosynthetic photo flux density (PPFD) was 200 ± 5 µmol m-2 s-1. The LED lights were designed by EBIOSM Biotechnology CO. Ltd. (Beijing, China), and they consisted of 1.78 m × 0.08 m × 0.02 m linear fixtures, which were an array of five LEDs. The culture shelf height was 1.2 m. The photoperiod was 16 h of light and 8 h darkness. A light-shielding cloth was used in each treatment to prevent the effect of outside light.
Measurements of morphological characteristics of ‘Red Lion’
After bulb planting, the morphological characteristics, including plant height, bulbs diameter, leaf number, leaf length, leaf width, the ratio of leaf length, and width, among others, of ‘Red Lion’ Amaryllis were recorded, and plant morphological changes were also photographed every 14 d for six phases, on 0 d, 14 d, 28 d, 42 d, 56 d and 72 d. Each measurement and the experiments were conducted in triplicate.
To determine the effects of red and blue light quality on the flowering quality of ‘Red Lion’, the flower number, length, width and diameter, scape number and diameter, initial flowering period (days at the first flower opening), flower period of a single flower, each scape (days from the first flower opening to the last flower withered of each scape) and each whole plant (days from the first flower opening to the last flower withered of each plant), plant height at the blooming stage, and the ratio of flower and leaf number were measured after 42 d. For every parameter, at least nine plants were randomly selected for each treatment to be measured.
Measurements of petal chromatic aberration
The petal color chromatic aberration of ‘Red Lion’ at the blooming stage (42 d - 56 d) in each treatment was measured with a hand-held color analyzer (CM-2500D, Konica Minolta, Japan) in a room, according to the CIE L*a*b* system. The petals were collected from at least three plants, and the exterior, middle, and interior of the petals were measured separately, and the average value was used in the subsequent analyses.
Measurement of chlorophyll content, photosynthetic capacity, and chlorophyll fluorescence parameters
The relative chlorophyll content in ‘Red Lion’ leaf from 14 d - 70 d was determined with SPAD-502 chlorophyll content analyzer (Shimadzu Corp., Kyoto, Japan). Three potted plants for each treatment were randomly selected, and three leaves were chosen in each plant for the measurement. The middle leaf segments were selected for the analysis, and the process was repeated three times. Finally, the average value was calculated for subsequent analyses.
The photosynthetic parameters, including photosynthetic rate (Pn), stomatic conductance (Gs), intercellular CO2 concentration (Ci), and transpiration rate (Tr), were measured between 9:00 am and 11:00 am on three continuous days using a CIRAS-3 portable photosynthesis system (Lufthansa Technology Group, Beijing, China) under ambient 400 μmol·mol-1 CO2 concentrations, 1200 μmol m-2 s-1 photon flux density. The leaf selection was the same as that for the relative chlorophyll content.
The chlorophyll fluorescence parameters were measured by a portable fluorometer chlorophyll fluorometer (DUal-PAM-100, Walz, Effeltrich Germany) on the same day as previously described (Yang et al., 2016), but with minor modifications. The selected leaves were adapted in the dark for 30 min before each measurement. Minimum fluorescence (F0) was estimated under a low light intensity of 0.1 μmol·m-2·s-1, whereas the maximum fluorescence (Fm) was determined by a white light-saturating pulse of 6,000 μmol·m-2·s-1 for 0.8 s. When the fluorescence decreased from the maximum rate of almost F0, 40 µmol·m-2·s-1 actinic light was used to induce fluorescence kinetics. The chlorophyll fluorescence parameters, including the maximal efficiency of PSII photochemistry (Fv/Fm), potential photochemical activity (Fv/Fo), the actual efficiency of PSII photochemistry (ΦPSII), photochemical quenching coefficient (qP), and non-photochemical quenching coefficient (qN) were calculated. In the Rapid Light Curve window, the photosynthetically active radiation (PAR) was set as 0, 81, 186, 281, 396, 531, 701, 801, 926, and 1076 µmol·m-2·s-1 at an interval of 20 s. The light response curve was used to obtain the PSII relative electron transfer rate (ETR) and initial quantum yield (α), according to the following formula:
The ultrastructure of chloroplast under a transmission electron microscope
The ultrastructure of leaf chloroplasts under different light qualities on different days (14 d and 56 d) was observed using a TEM as previously described by Oi et al. (2020). Briefly, small leaf segments (approx. 1 mm ×2 mm) were cut from the middle portion of the leaf blades and soaked in 3.0% glutaraldehyde fixative solution for 3 h. The samples were washed four times with 0.1 M phosphate buffer (pH=7.2) and fixed in 1% OsO4 dissolved in cacodylate buffer for 2 h at 20 °C. The samples were dehydrated through serial ethanol concentration (30%, 50%, 70%, 80%, 90%, 95%, and 100%) for 15 min in each concentration. After dehydration three times in acetone (15 min each time), the leaf samples were embedded in propylene oxide resin, soaked in an epoxy resin-accelerated mixture, and incubated at 45 °C in the oven for 24 h and thereafter at 60 °C oven for 24 h. The leaf samples were cut transversely into 60 nm thick sections using an ultramicrotome equipped with a diamond knife (EM UC6, Leica, Germany). The leaf sections were stained with lead citrate and uranyl acetate and observed under a transmission electron microscope (Hitachi H-7500, Tokyo, Japan).
Observation of the stomata
Based on the morphology and photosynthesis efficiency results, mature leaves under different light quality treatments were collected at 28 d for observation using a SEM. The leaf section samples were processed as described by Liu et al. (2021) and observed by a Hitachi S-4700 SEM (Tokyo, Japan).
Measurements of the mass for the bulbs, leaves, and flowers
The bulbs and leaves at 14 d, 28 d, 42 d, 56 d, and 70 d were collected for measurement of fresh and dry mass by an electronic balance. Fresh bulb samples were weighted and dried in an oven at 80 °C before reweighing until they attained a constant weight. Hierarchical clustering was performed based on their weight using the MeV (Multi Experiment Viewer) tool (https://www.tm4.org/mev.html) (Wang et al., 2020).
Measurements of the sucrose, glucose, and fructose contents in the bulbs
Bulbs at 0 d, 14 d, 28 d, and 70 d were collected to measure sucrose, glucose, and fructose content. The three components were measured as described by Liu et al. (2021). Differences between groups were assessed by analysis of variance using the SAS software, v. 9.2.
For the sample preparation, bulb scales were ground into powder in liquid nitrogen, and 1.00 g of sample was added to 100 ml of ultrapure water and mixed through ultrasonic shaking for 30 min. The mixture was centrifuged at 16,000 g for 10 min, and the supernatant was filtered through a 0.2 μm filter membrane and diluted 2000 times with diluted water. The contents of the three above sugar were determined by ion chromatograph (DIONEX ICS-3000, Thermo, USA) using a DIONEX ICS-3000 ion chromatography system (Thermo Fisher, Carlsbad, CA, USA), according to the manufacturer’s instructions.
Total RNA extraction and gene expression analysis
Flower buds and flowers were collected from 0 d to 70 d, while leaf samples were collected from 14 d to 70 d. The samples were immediately frozen in liquid nitrogen and stored at -80 °C until further analysis. The total RNA from the samples was collected, extracted and reverse transcribed to cDNA synthesis according to Wang et al. (2015, 2020) protocol. The primers for amplifying photosynthesis and flowering-related genes were designed by Primer 5.0 (PRIMER Biosoft, San Francisco, CA, USA). Details of the primers are shown in Table S1. The HpEF-1α and HpGAPDH2 genes were used as reference genes (Liu et al., 2018). The qRT-PCR reaction system was performed as described by Wang et al. (2015) and Zhu et al. (2018). Each qRT-PCR analysis was performed in triplicate.
Results
The light quality affected the plant growth and the onset and duration of flowering of ‘Red Lion’
Compared with that in control and R90B10 group, at day 14, the leaf growth was slower in the R10B90 group (Figure 1; Table S2). Further analysis showed that the leaf length of ‘Red Lion’ R10B90 group reached 49.72 ± 2.20 cm at 42 d of blooming, shorter than those 55.72 ± 1.44 cm and 52.81 ± 1.26 cm for Red Lion in the R90B10 and control group, respectively (Figure 1; Table S2). At 56 d, the leaf length in the R10B90 group reached 57.25 ± 2.04 cm, shorter than 58.49 ± 2.11 cm and 59.91 ± 1.18 cm for Red Lion in the R90B10 and control groups, respectively (Figure 1; Table S2). However, the leaf width at 56 d for Red Lion in the R10B90 group was 4.98 ± 0.10 cm. In the R10B90 group, the ratio of length and width of the leaf was 11.51 ± 0.48, implying that the plant was architecturally compact. The leaf length of Red Lion in the R90B10 group was 62.23 ± 2.64 cm, which was longer than that of Red Lion in the R10B90 (59.37 ± 2.28 cm) and control (59.89 ± 2.15 cm) groups (Figure 1; Table S2). The results suggest that R90B10 promotes leaf growth, including leaf length and width, while the ratio of leaf length and width in R10B90 is much more proper (Table S2). The average length of the longest root and fibrous root and the number of fibrous roots were the longest and highest, respectively, in the R90B10 and control groups, but the number of roots was fewer in the R10B90 group (Table S3). These root characteristics suggest that R90B10 promotes plant growth. However, the bulb at 70 d and at 0 d was biggest in the R10B90 group, moderate in the R90B10 group, and smallest in the control group (Table S3), implying that R10B90 improved bulb growth.
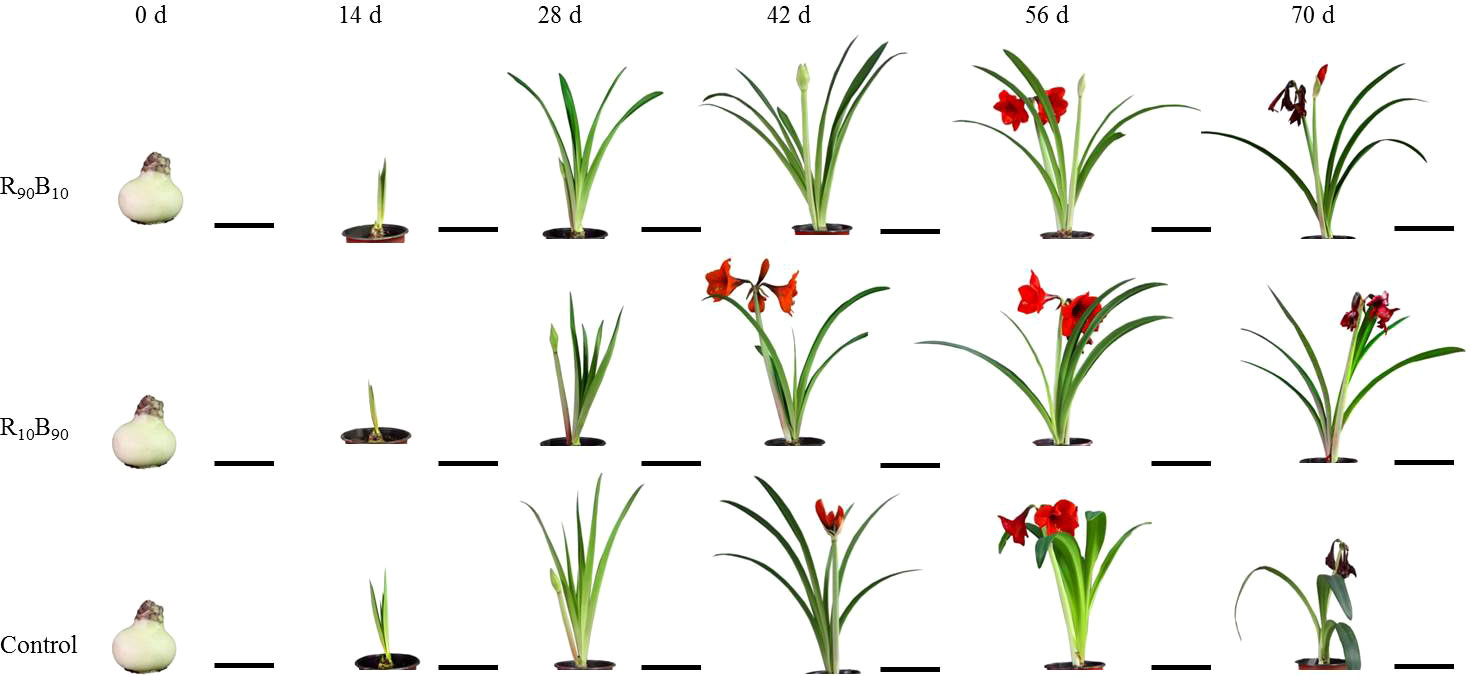
Figure 1 The changes in the morphological characteristics of ‘Red Lion’ at six growth periods under different light quality treatments. R90B10 and R10B90 represent combinations of 90% red light and 10% blue light, and 10% red light plus 90% blue light, respectively. The bar value of 0 d and 14 d was 10 cm, while at 28 d - 70 d was 20 cm in.
Regarding the flowering period, flower bud appeared latest in R90B10 group but earlier in the R10B90 group (Figure 1). Flower opening in the R10B90 first occurred 2.23 d and 4.26 d earlier than in the control and R90B10 treatment (Table 1). There was a significant difference in the flowering period of the whole plant among the three groups (Table 1). The flowering period of the whole plant in group R10B90 was 18.25 ± 0.48 days, 1.92 d, and 3.45 d longer than those in the control and R90B10 groups, respectively (Figure 1, Table 1). The leaf growth results and flowering period analysis implied that a higher red light intensity promoted vegetative growth, especially leaf length, but delayed the time to flowe. In contrast, high blue light promoted flowering, improved the vegetative growth, and prolonged the flowering period of the whole plants (Figure 1, Table 1 and Table S2).
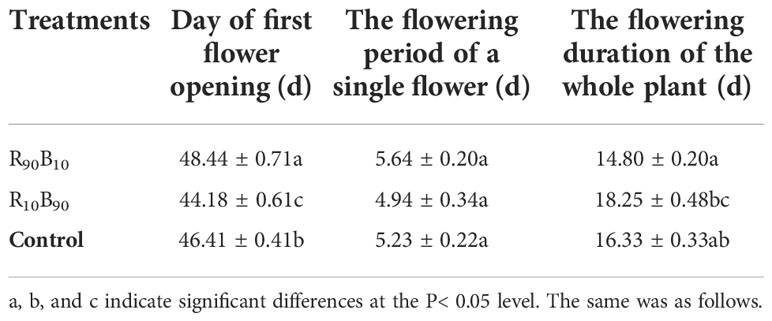
Table 1 The effect of light quality on flowering period and duration of ‘Red Lion’.
Flowering quality analysis and flower color identification
To investigate the effects of different light quality on the flowering quality, flowering quality-related parameters, including the number of scapes, flowers, and leaves, the scape height, scape and flower diameter, the maximum petal height, the maximum petal width, plant height, crown width, and the ratio of the number of flower to the leaves were analyzed. There were significant differences in the maximum petal length and crown width between the light quality groups. The stalk length, maximum petal length, and crown width were lengthier in the R90B10 group, reaching 2.66 ± 0.35 cm, 12.23 ± 0.19 cm, and 70.88 ± 3.51 cm, respectively (Table 2), implying that R90B10 promoted both vegetative and reproductive growth. The crown width was narrower for the R10B90 group (Table 2), suggesting the R10B90 treatment promoted compacted plant architecture formation (Figure 1).
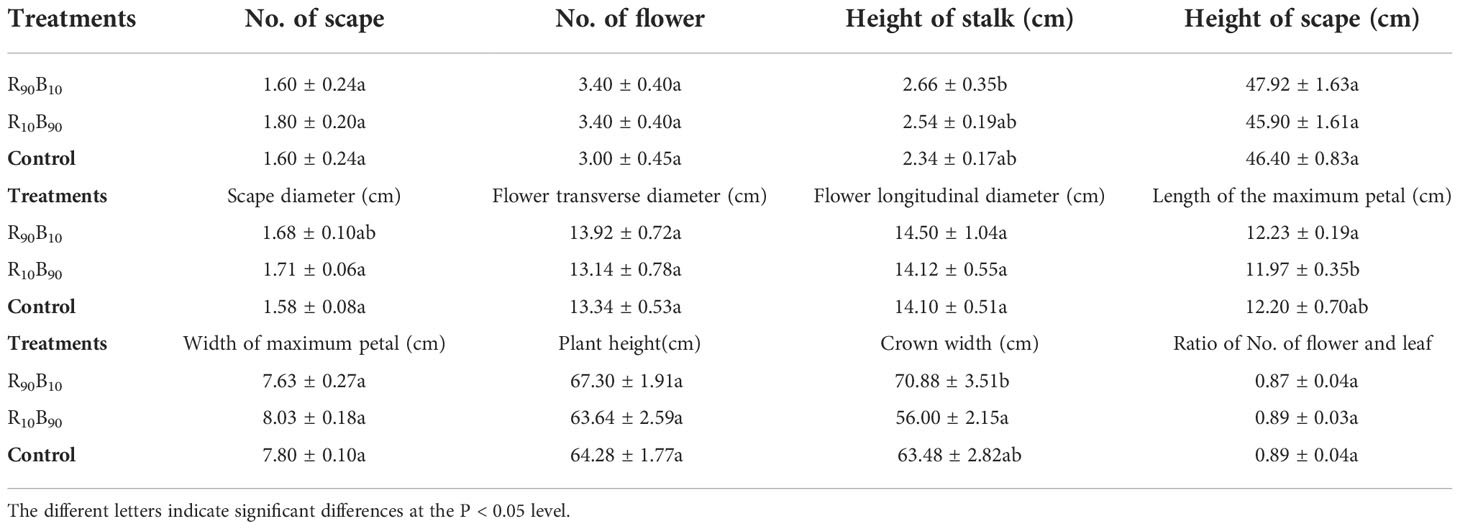
Table 2 The effect of light quality on the flower quality parameters of ‘Red Lion’.
The chromatic flower color parameters under different light quality treatments were recorded using the CIE L*a*b* color system (Table S4). There was no significant difference in the CIE L*a*b* c* values between two treatments, but hc was lower in the two treatment groups (Table S4). The flower pigmentation results showed that the flowers in the R90B10, and R10B90 groups were dark red and light red, respectively (Figure 2A).
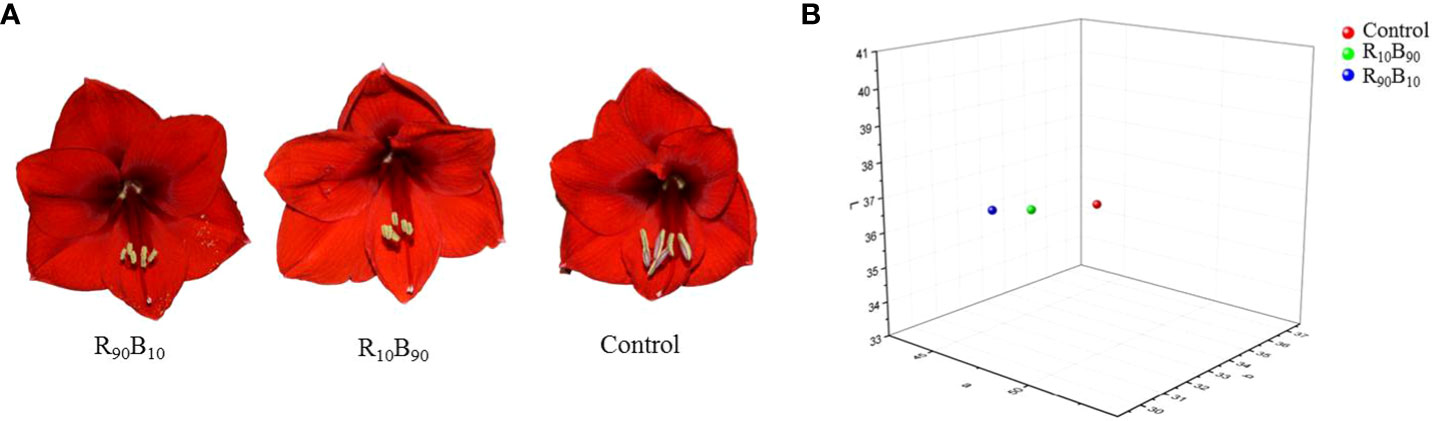
Figure 2 The morphological (A) and the distribution of chromatic coordinates of flower color (B) under three different light quality treatments.
Tri-dimensional graphics analysis showed that there was no difference in the color of flowers in the R90B10 and control group (in the same room), but those in the R10B90 were in a different room (Figure 2B). These results suggested that R90B10 and R10B90 treatments all affected the flower color of ‘Red Lion’ (Figure 2).
Photosynthetic measurements and analysis of chlorophyll contents
The four photosynthetic parameters are shown in Figure 3. At 56 d - 70 d, the highest net photosynthetic rate (Pn) was observed in the R10B90 treatment, while Pn was similar in two treatment groups but were both higher than in control group (Figure 3A). At 0 d, 56 d, the lowest Pn was observed in the R90B10 treatment. There was high photosynthesis in mature leaves of plants in the two light quality groups. Transpiration rate (Tr) was also high in two treatment groups at 14 d, 28 d, and 42 d, relative to the control (Figure 3B), and remained high in R10B90 at 56 d and 70 d. However, the Tr in R90B10 was comparable to the control group at 56 d and 70 (Figure 3B). Gs trend was similar to that of Tr, except at 56 d (Figure 3C). These findings further indicated that R10B90 enhanced photosynthesis. The intracellular CO2 concentration was lower in the treatment groups than in the control group from 14 d to 42 d, different from Pn and Tr, but it was higher in the R90B10 group at in the R10B90 group at 56 d and 70 d (Figure 3D). These results suggested that compared with that of white LEDs, red and blue light enhances photosynthesis efficiency in ‘Red Lion’.
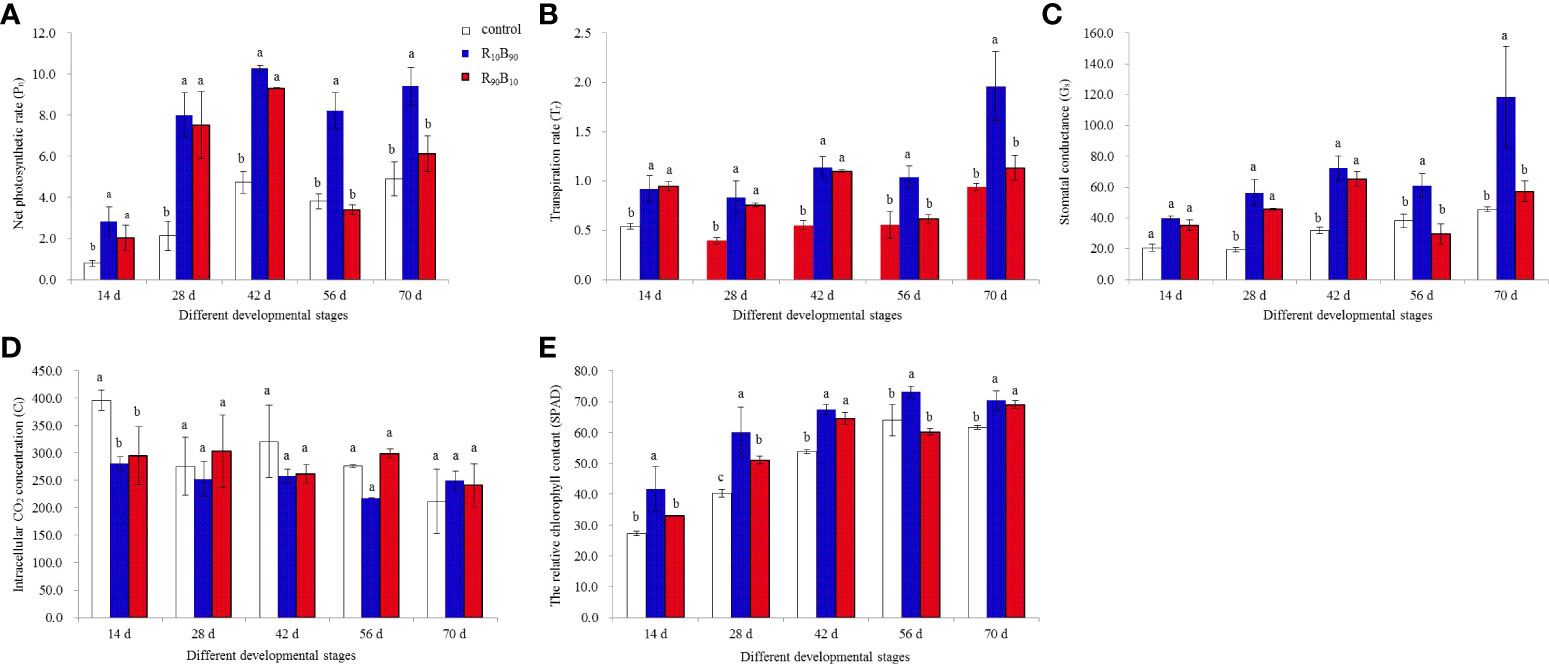
Figure 3 The effect of light quality on the net photosynthetic rate (Pn) (A), transpiration rate (Tr) (B), intracellular CO2 concentration (Ci) (C), stomatal conductance (Gs) (D), and the relative chlorophyll content (SPAD) (E) in leaves. Different letters in the same column indicate significant differences at P< 0.05.
The relative chlorophyll content (SPAD) gradually increased with plant growth, except at 56 d for plants in the R90B10 group, which decreased (Figure 3E). Generally, the chlorophyll content was highest for Red lion plants in the R10B90 group, followed by R90B10, both of which were higher than plants in the control group (Figure 3E).
Chlorophyll fluorescence measurements
Chlorophyll fluorescence was used to assess plant photosynthesis rate. It also reflects the absorption, transmission, dissipation, and distribution of light energy in photosynthetic systems (Liu et al., 2020). The potential photochemical efficiency (Fv/Fm) increased at 14 d - 42 d and decreased at 56 d - 72 d in the treatment and control group over for the whole developmental stages and peaked at 0.827 ± 0.005, 0.825 ± 0.006, and 0.819 ± 0.005, at 42 d, 56 d, and 42 d, respectively, in R10B90, R90B10, and control, respectively (Figure 4A; Table S5). Generally, Fv/Fm was higher in the leaves of Red lion in the R10B90 group than in the R90B10 groups, but both were higher than the control group (Figure 4A). The photosystem II reaction center was stronger under higher blue light. The photochemical efficiency (ΦPSII) was higher in the R10B90 than in the R90B10 group from 14 d to 56 d, and it was sharply increased at 70 d in the R90B10 group, peaking at 0.161 ± 0.011 (Figure 4B; Table S5). Generally, blue light improved the photochemical efficiency in the leaf in most of the developmental stages.
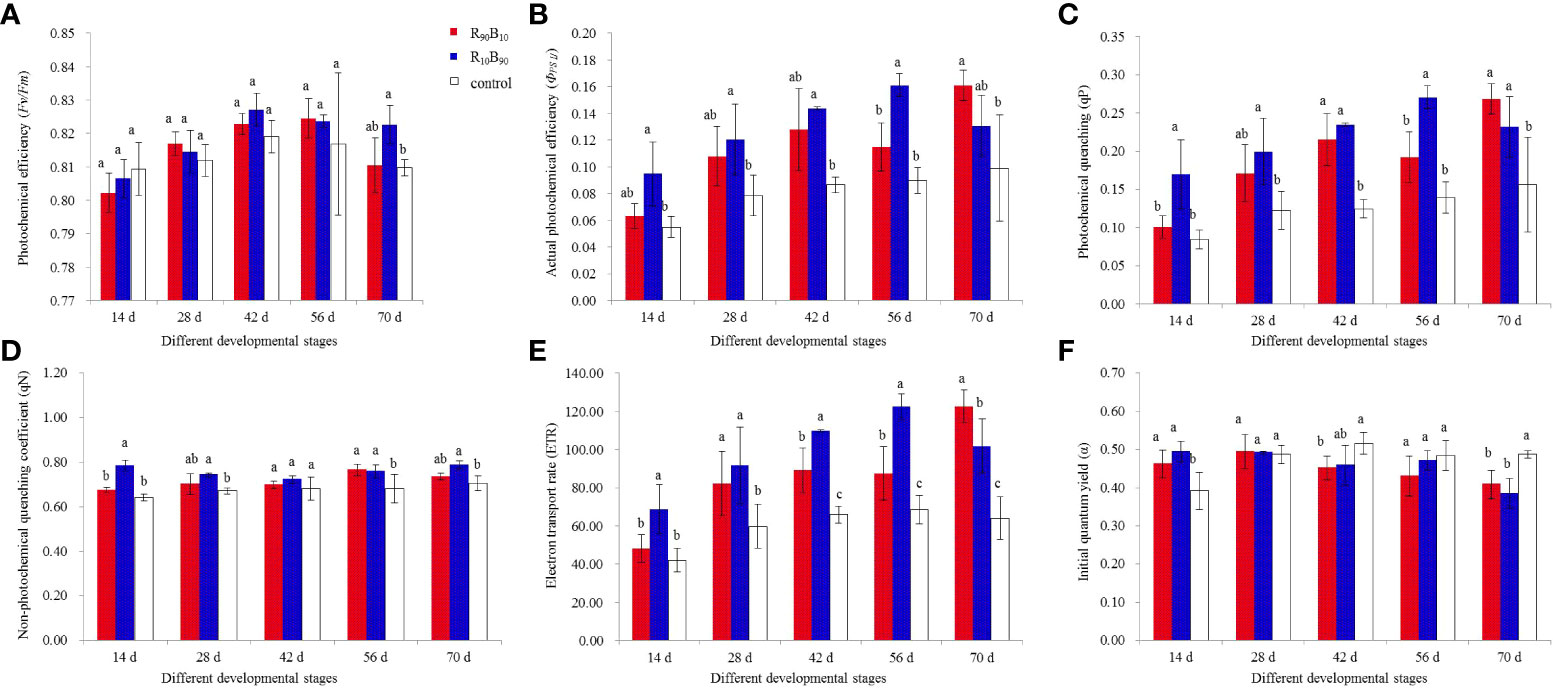
Figure 4 The effect of light quality on photochemical efficiency (Fv/Fm) (A), photochemical efficiency (ΦPSII) (B), photochemical quenching (qP) (C), non-photochemical quenching coefficient (qN) (D), electron transport rate (ETR) (E), and initial quantum yield (α) (F). Different letters in the same column indicate a significant difference at P< 0.05.
The trend in the photochemical quenching (qP) was similar to that of ΦPSII, which was significantly higher in the R10B90 treatment group from 14 d to 56 d (Figure 4C). Meanwhile, the maximum qP (0.268 ± 0.02) in the R90B10 treatment group occurred at 70 d (Figure 4C; Table S5). The trend in the non-photochemical quenching coefficient (qN) was similar to that of qP (Figure 4D). In contrast, qP, qN was highest in the R10B90 group at 70 d, reaching a maximum of 0.787 ± 0.018 (Figure 4D; Table S5). In general, higher blue light (R10B90) enhanced qN. Meanwhile, the electron transfer rate (ETR) was significantly higher in the treatment groups than in control (Figure 4E). The initial quantum yield (α) was higher in the R10B90 group than in the control group but was lower in the R90B10 group than the control group at 14 d (Figure 4F). Chlorophyll fluorescence rates suggested that an optimal combination of blue and red light enhanced ‘Red Lion’ growth.
The chloroplast ultrastructure
The chloroplast structure is very important for plant growth and photosynthesis. The leaves at the initial developmental stage and flower blooming stage were selected for chloroplast ultrastructure observation. At 14 d, chloroplast appeared long ellipse or shuttle across the treatments and the control group, and the chloroplast was closed to the cell membrane, suggestive of good chloroplast development across the treatments. Meanwhile, immature starch granules were observed, but grana and stroma lamella were not clearly observed (Figure 5A). At 56 d, the chloroplast structure developed into ellipse type, and all the structures had well developed (Figure 5B). In the control group, the starch granules were closely packed and small; and grana lamella and osmiophilic granule were apparent. The starch and osmiophilic granules were smaller in the R10B90 group than in the other two groups, but the starch granules were large in control group. The grana thylakoid density was higher in the R10B90, and grana lamella was well packed (Figure 5B), suggesting all of which enhanced photosynthesis in Red Lion. The number and volume of starch granules were all larger in the R90B10 treatment than in the other two treatments. The grana lamella was also well packed, and only a few osmiophilic granules were present (Figure 5B). Overall, the two light treatments did not destroy the ultrastructure of chloroplast, but the chloroplast development in the R10B90 and R90B10 groups was better than in the control treatment.
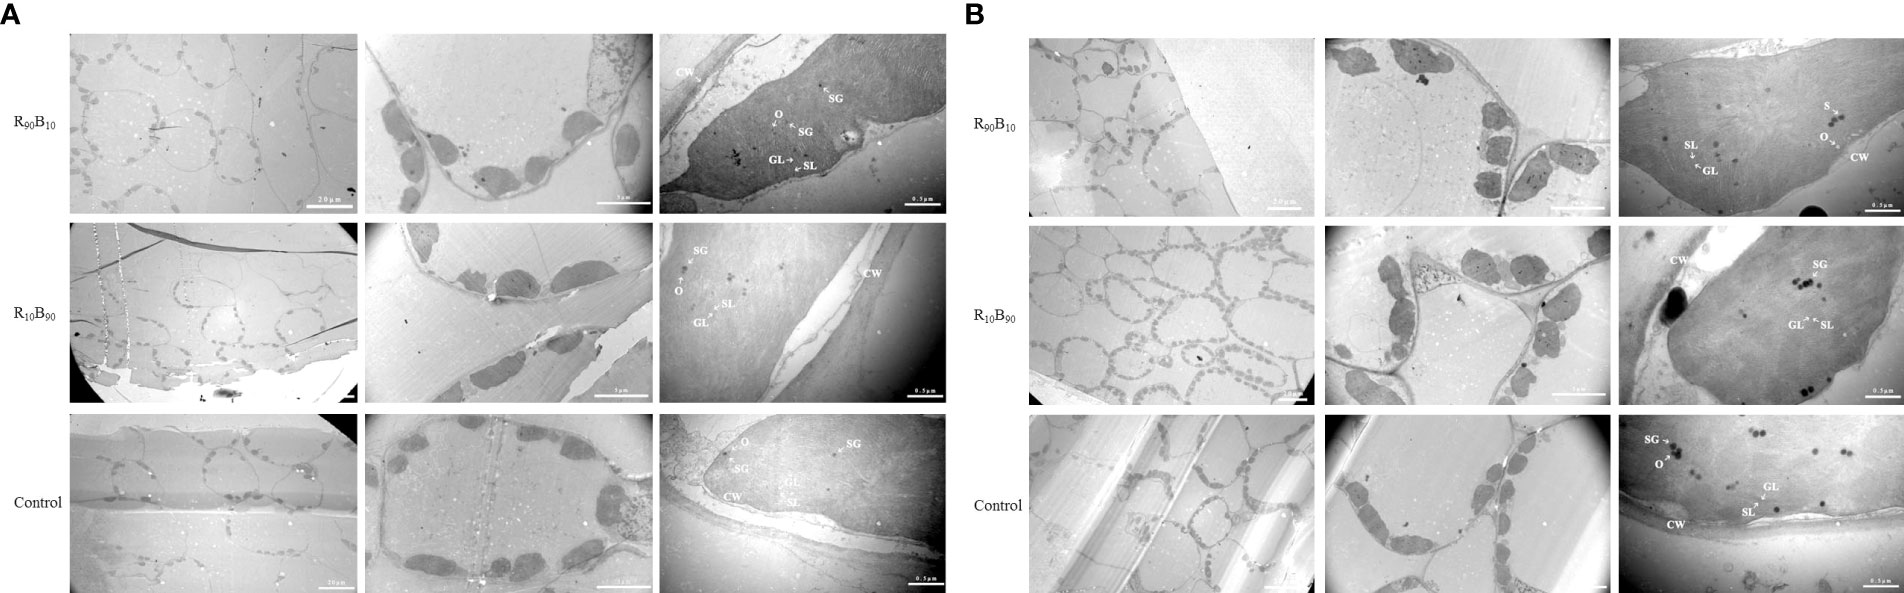
Figure 5 The effect of light quality on the chloroplast ultrastructure of ‘Red Lion’ under TEM at 14 d (A) and 56 d (B). CW, GL, O, SG, and SL represent cell walls, grana lamella, osmiophilic granule, starch granule, and stroma lamella, respectively.
The chloroplast grew more during leaf development (from 14 d to 56 d) and the number of chloroplast reached to 2.5, 9.33, and 3.5, respectively, in the R90B10, R10B90, and control groups (Figure 5; Table 3). The number of chloroplasts was highest in the R10B90 group (Table 3), implying that higher blue light intensity increased the numbers of chloroplasts and, thus, high photosynthesis.
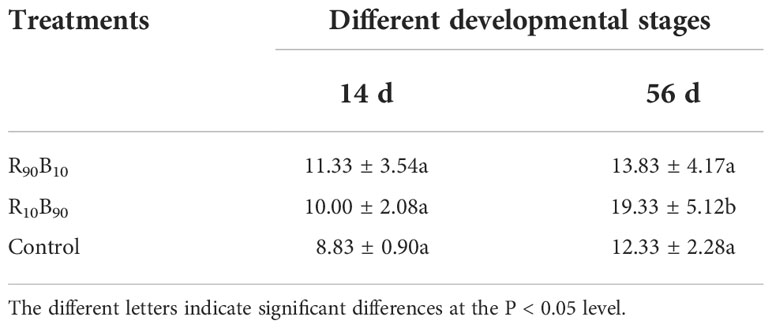
Table 3 The effect of light quality on the numbers of chloroplast in the leaves of ‘Red Lion’ at 14 d and 56 d.
Stomatal analysis using a scanning electron microscope
The stomatal movement affects the photosynthetic efficiency of plants. The density and size of the stomata were significantly different under the light treatments (Figure S1; Table 4). Particularly, the stomatal density was highest in the R10B90 group, peaking at 65.63 ± 4.13 per mm2, which was 2.60 times more than in the R90B10 group (Table 4). The stomata were also the largest in the R90B10 group, followed by the control group and the R10B90 group. In contrast, the stomata width was the smallest in the R90B10 group, reaching around 14.3 ± 1.33 µm (Figure S1; Table 4). The stomatal area in the R10B90 and the control group was larger than in the R90B10 group. The stomata always widely opened in the R10B90 and R90B10 than in the control group (Figure S1), which enhanced photosynthesis.
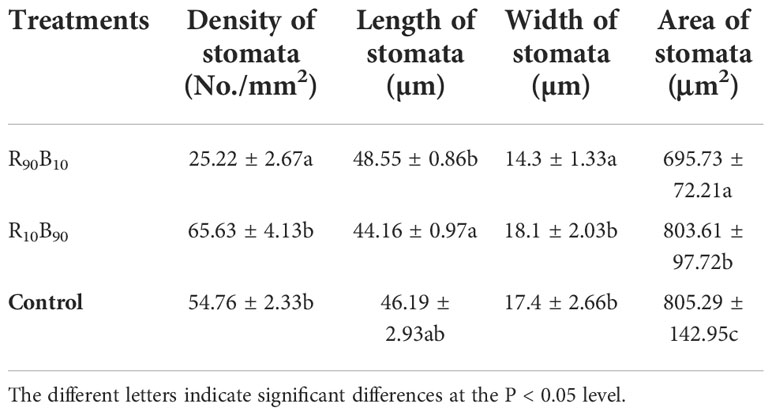
Table 4 The effect of light quality on stomatal characteristics of ‘Red Lion’ leaf at 28 d.
Changes in the fresh and dry weight of bulbs, leaves, and flowers
Fresh and dry weight of bulbs, leaves, flowers, and the total sum of three organs were determined to investigate the effects of different light qualities on plant carbohydrate accumulation and consumption, respectively. The hierarchical clustering analysis (HCA) of the fresh and dry weight of different organs showed that the treatments could not be clustered together at 28 d and 42 d (Figure 6A) during the rapid flower bud development stage and flowering stage, respectively (Figures 1, 6A). It was deduced that the fresh and dry was significantly different in these two stages. Meanwhile, HCA analysis further revealed that the trends in the dry and fresh mass of the mentioned organs were the same at 70 d and 28 d (Figure 6A).
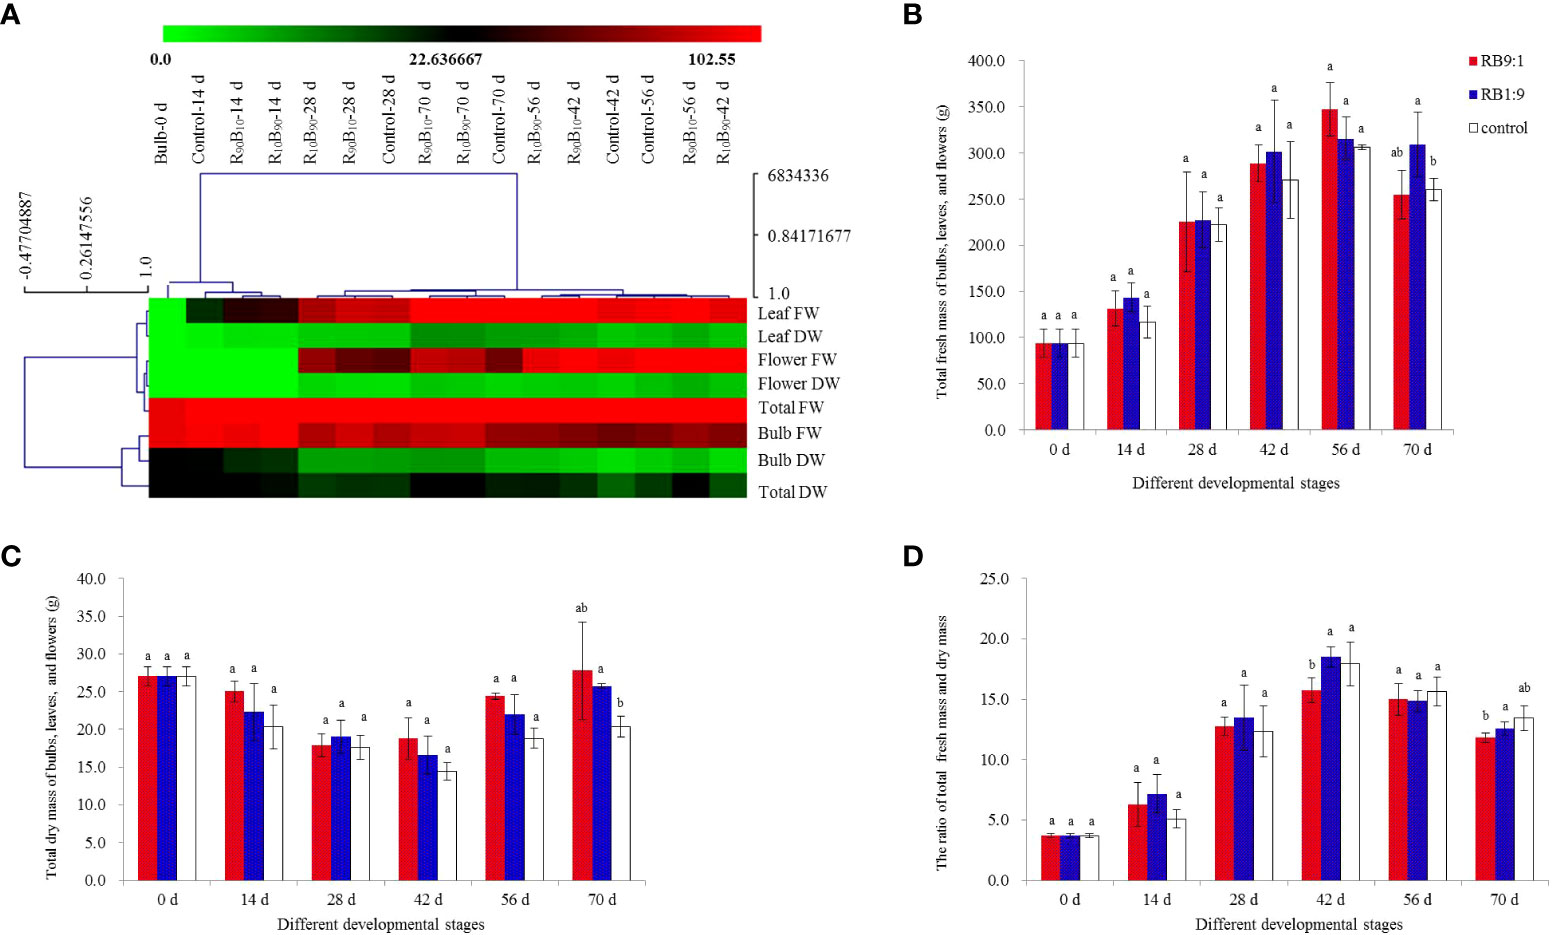
Figure 6 Hierarchical clustering analysis (HCA) for the effect of light quality on the fresh and dry mass of red lion bulb, leaf, flower, and the sum of three. (A) total fresh mass (B), dry mass (C), and the ratio of fresh and dry mass (D). Different letters indicate significant differences at P< 0.05.
The total fresh mass of ‘Red Lion’ in different treatment groups increased continuously from 14 d to 56 d and then decreased at 70 d, and the mass was higher in the R90B10 and R10B90 groups than in the control group (Figure 6B). Meanwhile, the total fresh mass of total three organs was highest in the R10B90 group. The total dry weight of the Red Lion decreased from 0 d - 42 d, across the three treatments and was lowest at the flowering stage (42 d), but it increased from 56 d - 72 d (Figure 6C). In general, the dry mass of the R90B10 and R10B90 groups was higher than the control group, though statistically insignificant across the three groups (Figure 6C), indicating a high accumulation of dry matter. The lower fresh and dry weight ratio in the treatment groups at 56 d and 72 d was also suggestive of high carbohydrate accumulation (Figure 6D).
The fresh mass of bulbs decreased with the reproductive growth period. The dry mass of bulbs and the fresh and dry mass ratio showed similar patterns as those of the total biomass of bulbs, leaves, and flowers (Figure S2). From 14 d to 42 d, the fresh weight of bulbs across the three treatment groups decreased sharply and was lowest in the control group at 42 d and remained 57.69 ± 6.69 g in this group. The highest weight was reached at 70 d, reaching 84.01 ± 4.89 g in the R10B90 group (Figure S2A). These results suggested that flowering needs carbohydrates, and the larger bulk of the carbohydrates are accumulated at 56 d - 70 d. The total dry mass was highest for the bulbs, leaves, and flowers; and the change in the mass of bulbs affected the growth and flowering of ‘Red Lion.’ Collectively, the fresh weight of bulbs in the R90B10 and R10B90 group remained high in the whole developmental stages, while the dry mass of bulbs in the two treatment groups was high at 28 d - 70 d (Figure S2B). For the decrease pattern of dry weight of bulbs, it is thought that flowering needed nutrients from the bulbs, but the need for carbohydrates was lower in the R10B90 than in the other two treatments (Figure S2B). The fresh and dry weight ratio of the bulbs further indicated that plant growth was very active at 42 d, and the dry weight was higher in R10B90 and R90B10 groups at 56 d - 70 d (Figure S2C).
The fresh and dry weights of leaves in the three treatments all increased and compared with those in the control group, and they were high in R10B90 and R90B10 groups at almost all the developmental stages (Figures S2D–S2F). Generally, a combination of red and blue light improved leaf growth and accumulation of carbohydrates in the leaves. At 56 d and 70 d, the fresh weight of leaf in R10B90 were significantly higher than in the other two treatments, reaching 128.20 ± 9.49 g and 146.10 ± 11.66 g, respectively (Figure S2D; Table S5). Meanwhile, the dry weight of leaves at 56 d was highest in R10B90, moderate in R90B10, and lowest in the control group (Figure S2E). Between 14 d to 42 d, the dry weight of leaves was highest in the R90B10 group. The ratio of the fresh and dry weight of leaves was high in R10B90 at 42 d and the control group at 56 d (Figure S2F). In general, blue and red light improved the leaf growth, increased the fresh and dry mass, and promoted the accumulation of carbohydrates in ‘Red Lion’ leaf. Given the higher mass accumulation of bulbs at 56 d (Figures S2A, B), it was thought carbohydrates are transferred to bulbs from 56 d.
Flower bud appeared at 28 d. It was found that fresh and dry weights of flowers in the three groups increased from 28 d - 56 d, and decreased at 70 d (Figures S2G, S2H). At 56 d, the highest fresh and dry flower mass was observed in the R90B10 group, followed by R10B90, and control (Figure S2H). The probable reason is that the earlier flowering in the R10B90 group corrected with earlier weight accumulation from 28 d to 42 d, which then decreased during the flower-withering period from 56 d to 70 d. Meanwhile, the ratio of fresh and dry weight of flowers has not significantly different among three groups (Figure S2I).
Glucose, fructose, and sucrose accumulation in the bulbs of Red Lion
Glucose, fructose, and sucrose contents in the Red lion bulbs were measured at 0 d, 14 d, 42 d, and 70 d over the growth, flowering, and fresh and dry mass changes. The glucose content increased in the three groups, peaking at xyz. In contrast, the fructose content decreased (Figures 7A, B). The highest glucose content at 42 d was in the R10B90 treatment, which corresponded with the rapid growth of other plant parts (Figure 1). Compared with the R10B90 and the control group, the fructose content was highest in R10B90 treatment at 42 d. The sucrose content decreased and was high in the R90B10 treatment at 14 d (Figure 7C). It was deduced that sucrose participates in the flowering of Red lion. Therefore, the high concentration of non-structural carbohydrates, including glucose, fructose, and sucrose at 42 d in R10B90 might be responsible for the rapid flowering of the Red lion. The contents of the three sugars decreased rapidly before 14 d and then increased between 42 d and 70 d (Figure 7C). These results indicated that blue and red light promoted the accumulation of non-structural carbohydrates (glucose, fructose, and sucrose) in the red lion (Figure 7D).
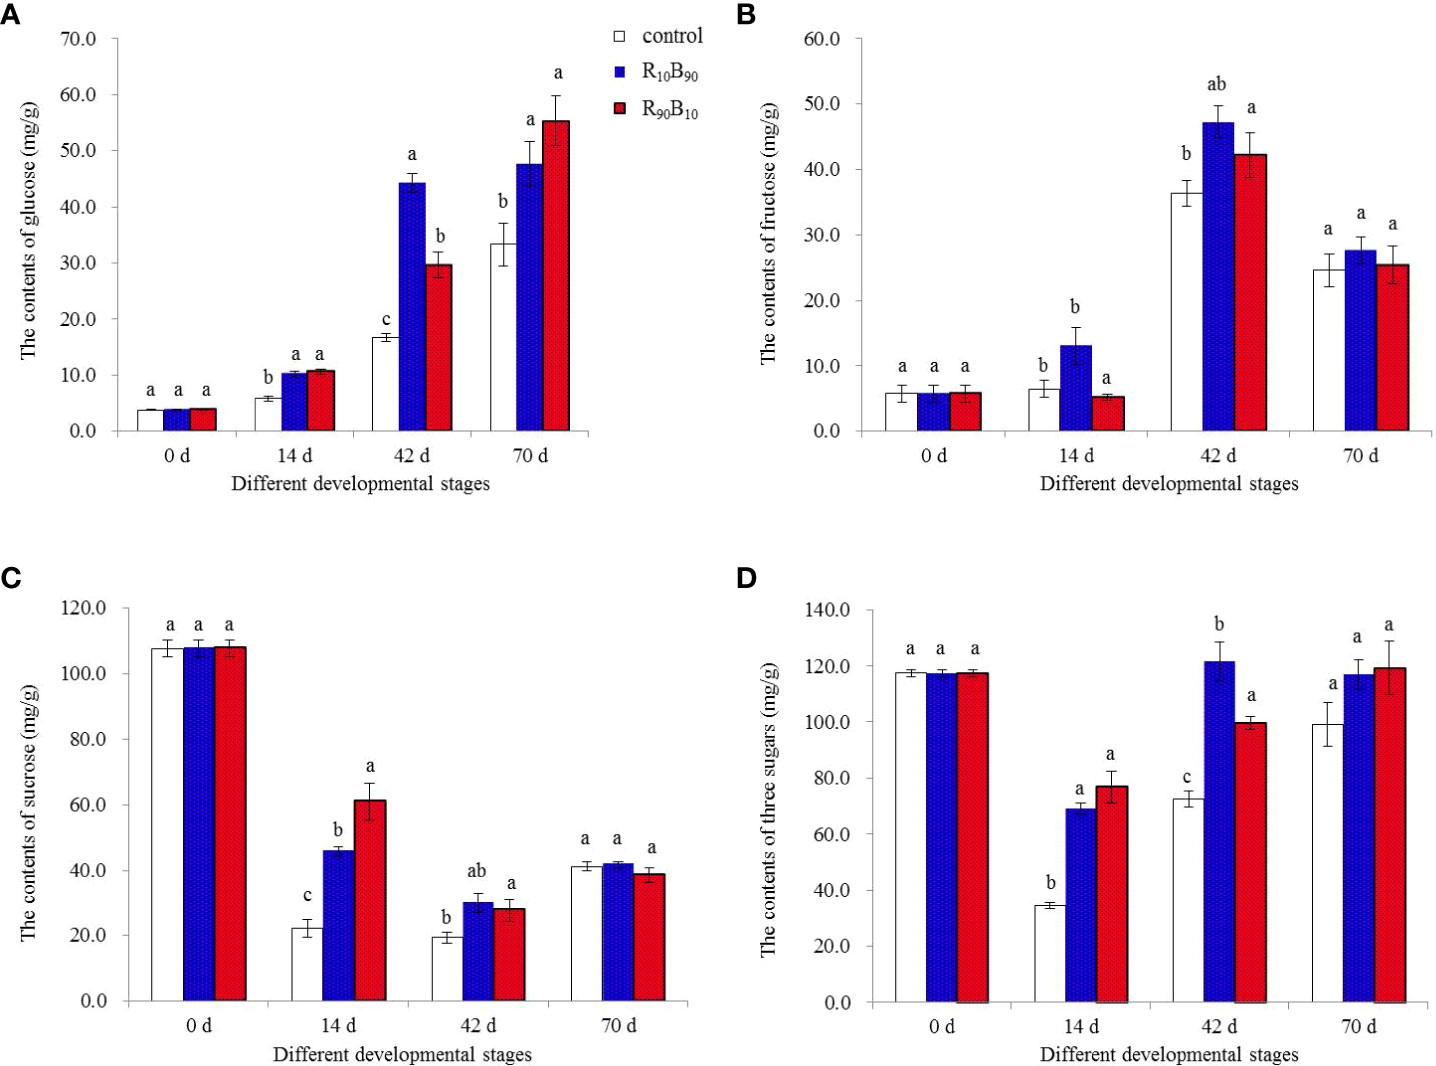
Figure 7 The effect of light quality on the glucose (A), fructose (B), sucrose (C), and total sugars (D) content at important developmental stages at 0 d, 14 d, 42 d, and 70 d. Different letters in the same column indicate a significant difference at P< 0.05.
Expression analysis of chlorophyll biosynthesis and flowering-related genes
Chlorophyll is an indispensable component for photosynthesis. The present study investigated the effect of red and white light on the expression of seven chlorophyll biosynthesis-related genes. The expression of the HpHEMA1 gene at 14 d, 42 d, 56 d, and 70 d was inconsistent across the three groups. However, the gene was overexpressed in the R10B90 group at 56 d and 70 d (Figure 8A). The expression of the HpHEML gene, which regulates 5-aminolaevulinic acid synthesis, was generally overexpressed in the two light treatments than in the control group. The expression was highest in the R10B90 group at 14 d. The gene was also overexpressed at 56 d and 70 d in two treatment groups (Figure 8B). The expression of HpCHLH/D/I was significantly high in the two treatment groups at almost all the developmental stages (Figures 8C–E). The expression of HpPOR, which participates in the divinyl protochlorophyllide a to divinyl chlorophyllide synthesis, was also overexpressed in the two light treatment groups (Figure 8F). The expression of HpCAO, chlorophyll an oxygenase gene, was very high in R10B90 group, and the lowest expression in this group was observed at 42 d (Figure 8G). In general, high blue light intensity promoted the expression of chlorophyll synthesis genes. High chlorophyll content on its part enhanced the photosynthesis rate in Red Lion.
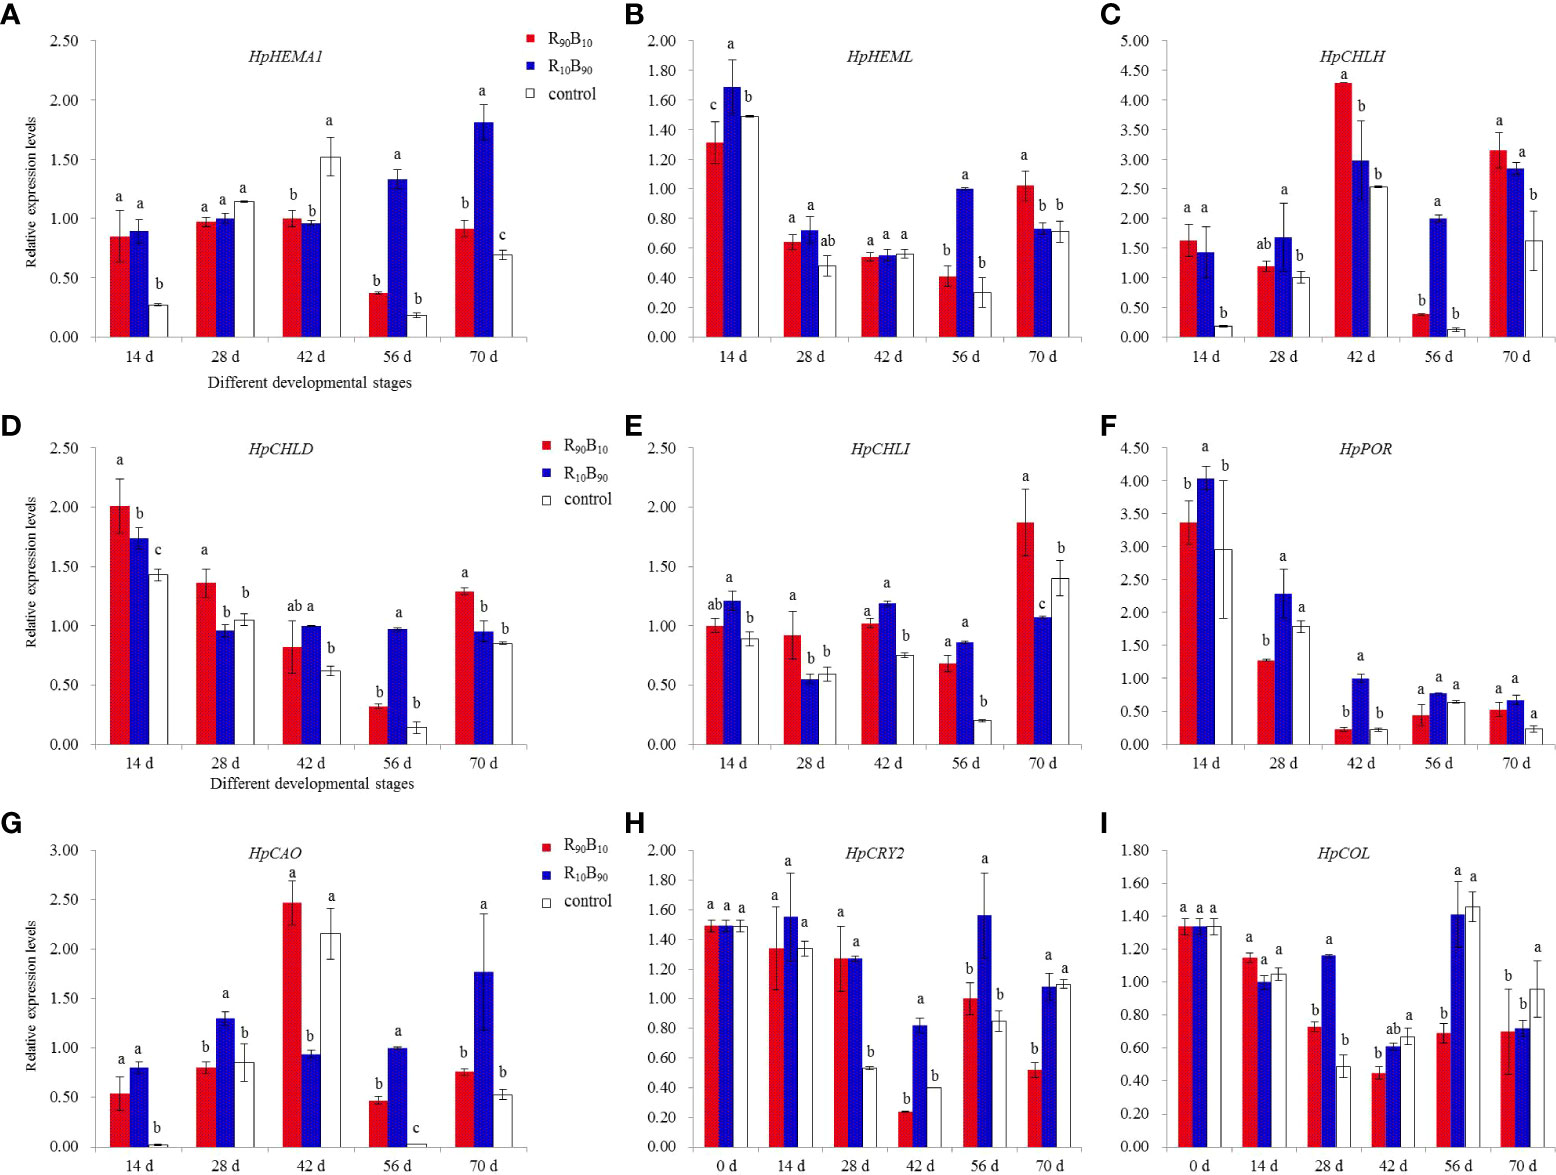
Figure 8 The effect of light quality on expression analysis for seven genes related to chlorophyll biosynthesis and two genes related to flowering time of H. ybrid. (A–I) was corresponded to the expression profile of HpHEMA1, HpHEML, HpCHLH, HpCHLD, HpCHLI, HpPOR, HpCAO, HpCRY2, and HpCOL, respectively. Different letters in the same column indicate significant differences at P < 0.05.
The blue-white light intensity affected the expression of photoreceptor and flowering related genes. For instance, blue light increased the expression of PHYA, CRY2, and CONSTANTS (CO). The expression of the HpCRY2 gene also varied with the flowering gene. CONSTANTS-LIKE and HpCOL genes were selected for gene expression analysis at the flower budding and across the whole developmental stages. Before flowering, the expression of HpCRY2 and HpCOL was higher at 28 d both in R10B90 and R90B10 treatments, while HpCRY2 was strongly expressed at the flowering period from 42 d to 56 d (Figures 8H, I). The high expression of HpCRY2 and HpCOL at 28 d extended the flowering time. Meanwhile, blue light could promote the expression of HpCRY2 (perceived blue light), which regulates flower bud formation. In the leaf, HpCRY2 was highly expressed in R10B90 and R90B10 treatment at 28 d, and 56 d, respectively (Figure S3). It was deduced that blue light induced HpCRY2 expression in leaf and flower buds, and high expression of HpCRY2 promoted flowering of ‘Red Lion’.
Discussion
LED lights are more effective than fluorescent lamp lights in promoting plant vegetative growth, and varying the intensity and duration of red and blue light affects shoot elongation and flowering (Li et al., 2012; Gautam et al., 2015). Red and blue lights are often used to improve the yields and quality of crops cultivated in the greenhouse (Kaiser et al., 2019). LEDs with R90B10, and R10B90 combinations and white LEDs were designed to investigate the effects of red and white light intensities on the vegetative and reproductive growth of ‘Red Lion’. We found that R10B90 and R90B10 significantly affected the vegetative growth and flower quality of ‘Red Lion’ under forcing culture.
R90B10 light combination promoted vegetative growth of ‘Red Lion’ under forcing culture
Optimal blue light increases the total biomass, yield, and the number of tomato fruits (Kaiser et al., 2019), while red light increases the fresh weights of shoots, leaves, and the height of preilla plant (Nguyen and Oh, 2021). High red light intensity (R90B10) induces vegetative growth in lettuce and perilla, particularly the leaf length, scape, and plant height (Naznin et al., 2019; Nguyen and Oh, 2021). Red LEDs improved fresh weight of perilla roots (Nguyen and Oh, 2021), while R90B10 promotes fibrous root growth of ‘Red Lion’. It was deduced that red light affected plant root development. Nevertheless, higher blue light (R10B90) inhibited leaf growth but promoted flower biomass and total biomass growth, lower bud growth, and flowering at 28 d and 42 d, and at 70 d, respectively. R10B90 promotes leaf widening and repressed an increase in crown width of ‘Red Lion’. This implies that R10B90 also promotes compacted plant formation of ‘Red Lion’. Red light reduced shoot elongation and also resulted in more compact plants in Petunia × hybrid (Gautam et al., 2015), indicating that 1/10 red light quality affected the growth of ‘Red Lion’. The present study revealed that red and blue light combination might promote optimal ‘Red Lion’ growth. A combination of blue and red light has been used in closed plant production systems (Hogewoning et al., 2010).
R10B90 light combination promoted photosynthesis and chlorophyll synthesis in ‘Red Lion’ under induced condition
Plants are often exposed to rapidly alternating light intensity and quality. Red and blue light affect leaf photosynthesis (Zhang et al., 2019). The chlorophyll a, chlorophyll b, and total chlorophyll content of lettuce and kale increased under 91%R + 9%B and 95%R + 5% B light, respectively (Naznin et al., 2019). R10B90 also increased chlorophyll content and photosynthesis (Figure 3). Low red light, in combination with blue light (R10B90), promotes chlorophyll synthesis and the photosynthetic capacity of ‘Red Lion’, and Pn reached to 9.86, which was two times higher than in the control group. In vegetables, there is a positive correlation between the total chlorophyll content and the blue light intensity (Naznin et al., 2019). In rice, compared with blue light, red light decreased the chlorophyll content by 45% (Hamdani et al., 2019), consistent with our results. R70B30 treatment, but not B100, increased the secretion of chlorophyll a + b (Zhang et al., 2019). It was further suggested that blue light intensity affects chlorophyll synthesis.
The chlorophyll biosynthesis process comprises 15 reactions catalyzed by 27 enzymes (Beale, 2005). Glutamyl-tRNA reductase (HEMA) is the primary enzyme that regulates chlorophyll synthesis, while the glutamate-1-semialdehyde aminomutase 1 (HEML) gene codes for an important enzyme that catalyzes 5 aminolevulinic acid synthesis. At 56 d, the leaf well developed (Figure 3). The chlorophyll content and Pn were high in the R10B90 group, and the expression levels of HpHEMA and HpHEML were all highest, compared with those in the R90B10 group and control group (Figures 3, 7). Magnesium chelatase is another key enzyme in the process of chlorophyll synthesis, which catalyzes the insertion of Mg2+ into protoporphyrin IX to form magnesium protoporphyrin IX, composed of three subunits, CHLH, CHLD, and CHLI (Moradi and Ismail, 2007). The expression levels of three genes were also high at 56 d in the R10B90 group (Figures 3, 7). The protochlorophyllide oxidoreductase (POR) gene regulates divinyl protochlorophyllide a synthesis, and it was highly expressed in the leaves at 14 d, 28 d, and 32 d in the R10B90 group. Chlorophyll oxygenase (CAO) is an important enzyme in the chlorophyll cycle (Wang and Grimm, 2021), and it was also highly expressed in leaf in the R10B90 group. Thus, a combination of blue and red light (R10B90) significantly increased the expression of the above seven genes in well-developed leaves of ‘Red Lion’. High expression of these genes induced chlorophyll synthesis and the corresponding photosynthesis. Blue light also increases the total chlorophyll contents in the seedlings of Chinese cabbage (Li et al., 2012).
The photosynthetic rate in leaves corresponded with the chlorophyll content and growth rate of ‘Red Lion.’ The net photosynthetic rate at ambient CO2 and stomatal conductance were highest in the R10B90 group with high chlorophyll content. Meanwhile, the stomata density and the stomatal opening degree were also high in the R10B90 group. Previous studies have shown that blue light promotes stomatal development, increases stomatal density, and promotes stomatal opening. High red light intensity and low red light intensity increase the number but reduce the size of stomata in chrysanthemum seedlings (Ramalho et al., 2002; Kim et al., 2004), consistent with our findings. High blue light, in combination with red light, promotes stomatal opening and conductance (Shimazaki et al., 2007). Thus, blue and red light combinations enhance photosynthesis of ‘Red Lion’.
Increasing the proportion of blue light during the leaf growth enhances the photosynthetic capacity of cucumbers and tomatoes (Hogewoning et al., 2010; Kaiser et al., 2019). Chlorophyll fluorescence parameters showed that except for the initial quantum yield (α), R10B90 increased the maximum quantum efficiency of photosystem II photochemistry (Fv/Fm), photosystem II quantum yield (ΦPSII), photochemical quenching (qP), non-photochemical quenching (qN), and electron transfer rate (ETR). Blue light increases transpiration rate and the photochemical efficiency (Fv/Fm) in perilla (Nguyen and Oh, 2021).Likewise, high blue light in combination with high or low red light intensity increased Fv/Fm, qP, and ETR in P. ahipa (Ramalho et al., 2002). These results suggested that optimal ratios of blue and red light intensities improve the photochemical efficiency of photosystem II and electron transport and, thus, photosynthesis. Meanwhile, the expression of blue-light receptor gene HpCRY2 increased under the R10B90 group with high blue light combination.
Red and blue light affected the accumulation of physiological molecules and flowering time of ‘Red Lion’
Total biomass analysis showed that both fresh and dry mass was higher in the R90B10 group than in the R10B90 group, but both higher than the control from 42 d - 70 d, which corresponded with the growth of reproductive structures. R10B90 promoted the accumulation of fresh, dry biomass and the total biomass, consistent with previous studies (Kaiser et al., 2019; Naznin et al., 2019). A combination of blue and red light promotes reproductive growth (Li et al., 2012). Optimal blue light increases fruit yields (Kaiser et al., 2019). R10B90 and R90B10 promoted vegetative growth but not an increase in the dry mass. It was deduced that flowering consumed carbohydrates, and given the different flowering periods in the three treatments. Thus, the total biomass in the latter stages varies. The lower dry mass in the R10B90 group on 14 d was caused by its early flowering.
Non-structural carbohydrates as energy substrates and sugar signaling trigger flowering (Liu et al., 2021). We found that compared to the control group, glucose, fructose, and sucrose content were significantly high in the R10B90 and R90B10 groups. In related research, red light significantly increased the sucrose and soluble sugar contents (Li et al., 2012), consistent with our results. It was deduced that higher red light intensity promoted sucrose accumulation. The higher glucose and fructose contents might have contributed to ‘earlier Red Lion’ flowering. CO is a key gene that regulates the flowering time in many plants (Wang, 2019; Liu et al., 2021). Overexpression of Vigna radiata COL2 gene (VrCOL2) accelerated flowering in Arabidopsis under short-day conditions (Liu et al., 2021). High expression of CO affected the expression levels of CAPRICE family genes to achieve early flowering (Wada and Tominaga-Wada, 2015). High expression of HpCOL gene in R10B90 promoted early flowering of ‘Red Lion’(Figures 1, 8I). HpCRY2 was highly expressed in the flower bud and flowers in the R10B90 group. Light quality can affect the beginning of the flowering of plants. Previous studies have shown that rose, chrysanthemum, petunia, and Arabidopsis flower early under blue light than white light (Masuda and Takamiya, 2004; Abidi et al., 2013; Fan et al., 2014). Compared with white light, blue plus red light lengthens the flowering duration of Chinese cabbage (Li et al., 2012). On the other hand, blue light enhances pigmentation (Naznin et al., 2019), and the two lights brighten the flower color. It can be concluded that higher blue light intensity promotes early flowering and prolongs the flowering period of ‘Red Lion’.
In the present study, based on the growth and photosynthesis, contents of non-structural carbohydrates, and gene expression investigation, it was deduced that R10B90 promoted early flowering while R90B10 promoted both vegetable and reproductive growth and delayed flowering. However, both R10B90 and R90B10 promote chlorophyll synthesis by inducing the expression of related genes (Figure 9). High chlorophyll contents enhance photosynthesis rate by increasing light capturing and transfer efficiency, with high carbohydrates, such as glucose, fructose, and sucrose being the end products (Figure 9). R10B90 promoted early flowering by inducing the expression of HpCOL and HpCRY2. The expression of the two genes also increased the fructose and sucrose contents in bulbs and prolonged the flowering period (Figure 9). Meanwhile, R90B10 induced early flowering and shorted the flowering period (Figure 9).
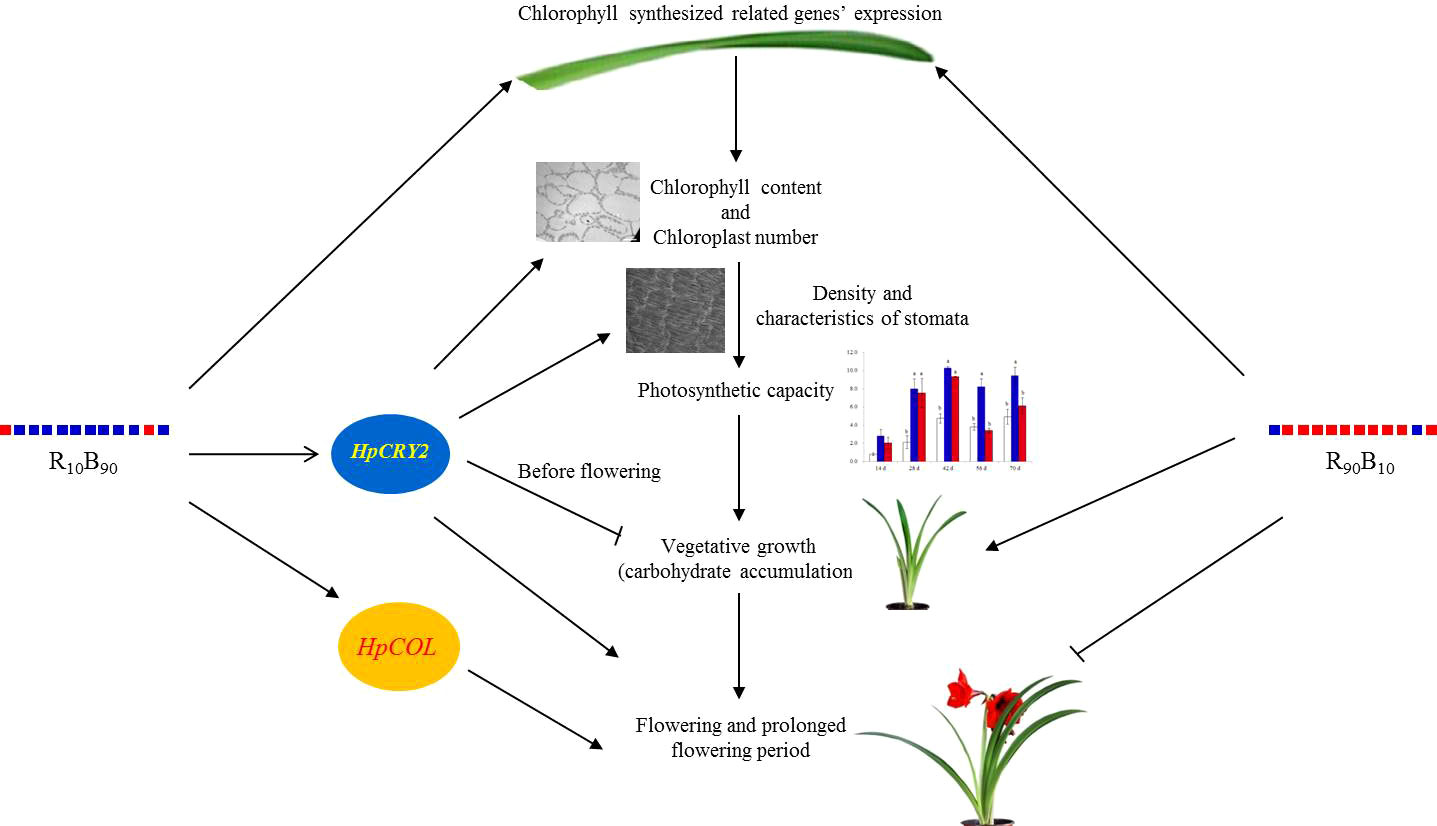
Figure 9 The probable mechanism of how blue and red light combination regulated vegetative and reproductive growth of ‘Red Lion’ under forcing-culture.
Conclusion
Suitable light quality is essential for plant growth and development. R10B90 and R90B10 induced chlorophyll synthesis and increased the photosynthesis rate. Higher blue light and low (1/10) red light intensity (R10B90) promoted early flowering and prolonged the flowering period of ‘Red Lion’ under forcing culture. Moreover, R10B90 promoted the accumulation of non-structural carbohydrates and plant compaction. The higher red light and low blue light (with 1/10) intensity (R90B10) promoted vegetative and reproductive growth and delayed flowering. However, R90B10 shortened the flowering period. Both R10B90 and R90B10 improved flower color by increasing the production of the flower color pigment.
Data availability statement
The original contributions presented in the study are included in the article/Supplementary Material. Further inquiries can be directed to the corresponding authors.
Author contributions
SW designed the experiments, drafted the manuscript and analyzed experimental data. XNL performed the experiments. XNL, JX, and XR participated in some data analysis. SW, YZ and XZ supervised the project. The authors take responsibility for all aspects of the reliability and freedom from bias of the data presented and their interpretation. All authors contributed to the article and approved the submitted version.
Funding
The work was supported by China Agriculture Research System (CARS-21), China Association for Science and Technology Foundation for Young Scholars (2015QRNC001), and the Agricultural Science and Technology Innovation Program (ASTIP) of the Chinese Academy of Agricultural Sciences (CAAS-ASTIPIVFCAAS). The funding bodies have no role in the study design, data collection and analysis, decision to publish, or preparation of the manuscript.
Acknowledgments
We thank mogoedit for its linguistic assistance during the preparation of this manuscript.
Conflict of interest
The authors declare that the research was conducted in the absence of any commercial or financial relationships that could be construed as a potential conflict of interest.
Publisher’s note
All claims expressed in this article are solely those of the authors and do not necessarily represent those of their affiliated organizations, or those of the publisher, the editors and the reviewers. Any product that may be evaluated in this article, or claim that may be made by its manufacturer, is not guaranteed or endorsed by the publisher.
Supplementary material
The Supplementary Material for this article can be found online at: https://www.frontiersin.org/articles/10.3389/fpls.2022.1048770/full#supplementary-material
Supplementary Figure 1 | The effect of different light qualities on the stomatal morphology of ‘Red Lion’ leaves at 28 d under 200 × and 2000 × magnification.
Supplementary Figure 2 | The changes in fresh and dry mass and the ratio of the fresh and dry mass of bulb (A), leaf (B), and flower (C) under different blue and red light intensities. Different letters indicate significant differences at P< 0.05.
Supplementary Figure 3 | The effect of different light qualities on the expression of the HpCRY2 gene in leaves. Different letters indicate a significant difference at P< 0.05.
References
Abidi, F., Girault, T., Douillet, O., Guillemain, G., Sintes, G., Laffaire, M., et al. (2013). Blue light effects on rose photosynthesis and photomorphogenesis. Plant Biol. 15, 67–74. doi: 10.1111/j.1438-8677.2012.00603.x
Beale, S. I. (2005). Green genes gleaned. Trends Plant science. 10, 309–312. doi: 10.1016/j.tplants.2005.05.005
Byamukama, R., Jordheim, M., Kiremire, B., Namukobe, J., Andersen, ØM. (2006). Anthocyanins from flowers of Hippeastrum cultivars. Scientia Horticulturae. 109, 262–266. doi: 10.1016/j.scienta.2006.05.007
Chaves, I., Pokorny, R., Byrdin, M., Hoang, N., Ritz, T., Brettel, K., et al. (2011). The cryptochromes: blue light photoreceptors in plants and animals. Annu. Rev. Plant Biol. 62, 335–364. doi: 10.1146/annurev-arplant-042110-103759
De Hertogh, A. A., Gallitano, L. (2000). Influence of photoperiod and day/night temperatures on flowering of Amaryllis (Hippeastrum) cv. Apple Blossom. Acta Horticulturae. 515, 129–134. doi: 10.17660/ActaHortic.2000.515.15
Fantini, E., Facella, P. (2020). Cryptochromes in the field: how blue light influences crop development. Physiologia Plantarum. 169, 336–346. doi: 10.1111/ppl.13088
Fan, H. M., Wang, X. W., Sun, X., Li, Y. Y., Sun, X. Z., Zheng, C. S. (2014). Effects of humic acid derived from sediments on growth, photosynthesis and chloroplast ultrastructure in chrysanthemum. Scientia Horticulturae. 177, 118–123. doi: 10.1016/j.scienta.2014.05.010
Fukuda, N., Ajima, C., Yukawa, T., Olsen, J. E. (2016). Antagonistic action of blue and red light on shoot elongation in petunia depends on gibberellin, but the effects on flowering are not generally linked to gibberellin. Environ. Exp. Botany. 121, 102–111. doi: 10.1016/j.envexpbot.2015.06.014
Gautam, P., Terfa, M. T., Olsen, J. E., Torre, S. (2015). Red and blue light effects on morphology and flowering of Petunia × hybrida. Scientia Horticulturae. 184, 171–178. doi: 10.1016/j.scienta.2015.01.004
Hamdani, S., Khan, N., Perveen, S., Qu, M., Jiang, J., Govindjee, et al. (2019). Changes in the photosynthesis properties and photoprotection capacity in rice (Oryza sativa) grown under red, blue, or white light. Photosynthesis Res. 139, 107–121. doi: 10.1007/s11120-018-0589-6
Hogewoning, S. W., Trouwborst, G., Maljaars, H., Poorter, H., van Ieperen, W., Harbinson, J. (2010). Blue light dose–responses of leaf photosynthesis, morphology, and chemical composition of Cucumis sativus grown under different combinations of red and blue light. J. Exp. Botany. 61, 3107–3117. doi: 10.1093/jxb/erq132
Islam, A. M., Kuwar, G., Clarke, J. L., Blystad, D. R., Gislerød, H. R., Olsen, J. E., et al. (2012). Artificial light from light emitting diodes (LEDs) with a high portion of blue light results in shorter poinsettias compared to high pressure sodium (HPS) lamps. Scientia Horticulturae. 147, 136–143. doi: 10.1016/j.scienta.2012.08.034
Kaiser, E., Ouzounis, T., Giday, H., Schipper, R., Heuvelink, E., Marcelis, L. F. M. (2019). Adding blue to red supplemental light increases biomass and yield of greenhouse-grown tomatoes, but only to an optimum. Front. Plant Sci. 9, 2002. doi: 10.3389/fpls.2018.02002
Kim, S. J., Hahn, E. J., Heo, J. W., Paek, K. Y. (2004). Effects of LEDs on net photosynthetic rate, growth and leaf stomata of chrysanthemum plantlets in vitro. Scientia Horticulturae. 101, 143–151. doi: 10.1016/j.scienta.2003.10.003
Lin, C. (2000). Plant blue-light receptors. Trends Plant Science. 5, 337–342. doi: 10.1016/S1360-1385(00)01687-3
Li, H. M., Tang, C. M., Xu, Z. G., Liu, X. Y., Han, X. L. (2012). Effects of different light sources on the growth of non-heading chinese cabbage (Brassica campestris l.). J. Agric. Science. 4, 262–273. doi: 10.5539/jas.v4n4p262
Liu, Z. Y., Shi, Y. T., Xue, Y. Q., Wang, X. P., Huang, Z., Xue, J. Q., et al. (2021). Non-structural carbohydrates coordinate tree peony flowering both as energy substrates and as sugar signaling triggers, with the bracts playing an essential role. Plant Physiol. Biochem. 159, 80–88. doi: 10.1016/j.plaphy.2020.12.012
Liu, X. T., Wang, S. L., Xue, J. Q., Xue, Y. Q., Lv, Y. M., Zhang, X. X. (2018). Selection of reference genes for quantitative real-time pCR in different tissue and organ of barbadoslily. Acta Hortic. Sinica. 45 (5), 919–930. doi: 10.16420/j.issn.0513-353x.2017-0780
Liu, C. Y., Zhang, Q. Q., Zhu, H., Cai, C. M., Li, S. (2021). Characterization of mungbean CONSTANS-LIKE genes and functional analysis of CONSTANS-LIKE 2 in the regulation of flowering time in Arabidopsis. Front. Plant Sci. 12, 608603. doi: 10.3389/fpls.2021.608603
Liu, H. J., Zhu, Q. D., Pei, X. X., Xing, G. Z., Ou, X. Q., Li, H. (2020). Comparative analysis of the photosynthetic physiology and transcriptome of a high-yielding wheat variety and its parents. Crop J. 8, 1037–1048. doi: 10.1016/j.cj.2020.01.004
Masuda, T., Takamiya, K. I. (2004). Novel insights into the enzymology, regulation and physiological functions of light-dependent protochlorophyllide oxidoreductase in angiosperms. Photosynthesis Res. 81, 1–29. doi: 10.1023/B:PRES.0000028392.80354.7c
Moradi, F., Ismail, A. M. (2007). Responses of photosynthesis, chlorophyll fluorescence and ROS-scavenging systems to salt stress during seedling and reproductive stages in rice. Ann. Botany. 99, 1161–1173. doi: 10.1093/aob/mcm052
Naznin, M. T., Lefsrud, M., Gravel, V., Azad, M. O. K. (2019). Blue light added with red LEDs enhance growth characteristics, pigments content, and antioxidant capacity in lettuce, spinach, kale, basil, and sweet pepper in a controlled environment. Plants (Basel). 8, 93. doi: 10.3390/plants8040093
Nguyen, T. K. L., Oh, M. M. (2021). Physiological and biochemical responses of green and red perilla to LED-based light. J. Sci. Food Agriculture. 101, 240–252. doi: 10.1002/jsfa.10636
Oi, T., Enomoto, S., Nakao, T., Arai, S., Yamane, K., Taniguchi, M. (2020). Three-dimensional ultrastructural change of chloroplasts in rice mesophyll cells responding to salt stress. Ann. Botany. 125, 833–840. doi: 10.1093/aob/mcz192
Petroutsos, D., Tokutsu, R., Maruyama, S., Flori, S., Greiner, A., Magneschi, L., et al. (2016). A blue-light photoreceptor mediates the feedback regulation of photosynthesis. Nature 537, 563–566. doi: 10.1038/nature19358
Ramalho, J. C., Marques, N. C., Semedo, J. N., Matos, M. C., Quartin, V. L. (2002). Photosynthetic performance and pigment composition of leaves from two tropical species is determined by light quality. Plant Biol. 4, 112–120. doi: 10.1055/s-2002-20443
Shimazaki, K. I., Doi, M., Assmann, S. M., Kinoshita, T. (2007). Light regulation of stomatal movement. Annu. Rev. Plant Biol. 58, 219–247. doi: 10.1146/annurev.arplant.57.032905.105434
Shi, F. R., Xue, J. Q., Mu, D., Wang, S. L., Zhang, X. X. (2014). Studies on differences of dybridization efficiency and related reasons of 17 Hippeastrum cultivars. Acta Hortic. Sinica. 41, 553–563. Available at: https://www.ahs.ac.cn/CN/Y2014/V41/I3/553.
Silberbush, M., Ephrath, J. E., Alekperov, C., Ben-Asher, J. (2003). Nitrogen and potassium fertilization interactions with carbon dioxide enrichment in Hippeastrum bulb growth. Scientia Horticulturae. 98, 85–90. doi: 10.1016/S0304-4238(02)00205-4
Terfa, M. T., Solhaug, K. A., Gislerød, H. R., Olsen, J. E., Torre, S. (2013). A high proportion of blue light increases the photosynthesis capacity and leaf formation rate of Rosa × hybrida but does not affect time to flower opening. Physiologia Plantarun. 148, 146–159. doi: 10.1111/j.1399-3054.2012.01698.x
Thomas, B. (2006). Light signals and flowering. J. Exp. Botany. 57, 3387–3393. doi: 10.1093/jxb/erl071
Virsile, A., Brazaityte, A., Vastakaite-Kairiene, V., Miliauskiene, J., Jankauskiene, J., Novickovas, A., et al. (2020). The distinct impact of multi-color LED light on nitrate, amino acid, soluble sugar and organic acid contents in red and green leaf lettuce cultivated in controlled environment. Food Chem. 310, 125799. doi: 10.1016/j.foodchem.2019.125799
Wada, T., Tominaga-Wada, R. (2015). CAPRICE family genes control flowering time through both promoting and repressing CONSTANS and FLOWERING LOCUS T expression. Plant Science. 241, 260–265. doi: 10.1016/j.plantsci.2015.10.015
Wang, S. L., Gao, J., Xue, J. Q., Xue, Y., Li, D. D., Guan, D. D. (2019). De novo sequencing of tree peony (Paeonia suffruticosa) transcriptome to identify critical genes involved in flowering and floral organ development. BMC Genomics 20, 572. doi: 10.1186/s12864-019-5857-0
Wang, S., Beruto, M., Xue, J., Zhu, F., Liu, C., Yan, Y., et al. (2015). Molecular cloning and potential function prediction of homologous SOC1 genes in tree peony. Plant Cell Rep. 34, 1459–1471. doi: 10.1007/s00299-015-1800-2
Wang, Y., Chen, D. F., He, X. F., Shen, J. X., Xiong, M., Wang, X., et al. (2018). Revealing the complex genetic structure of cultivated amaryllis (Hippeastrum hybridum) using transcriptome-derived microsatellite markers. Sci. Rep. 8, 10645. doi: 10.1038/s41598-018-28809-9
Wang, P., Grimm, B. (2021). Connecting chlorophyll metabolism with accumulation of the photosynthetic apparatus. Trends Plant Science. 26, 484–495. doi: 10.1016/j.tplants.2020.12.005
Wang, S. L., Ren, X. X., Xue, J. Q., Xue, Y. Q., Cheng, X. D., Hou, X. G., et al. (2020). Molecular characterization and expression analysis of the SQUAMOSA PROMOTER BINDING PROTEIN−LIKE gene family in Paeonia suffruticosa. Plant Cell Rep. 39, 1425–1441. doi: 10.1007/s00299-020-02573-5
Yang, S. H., Wei, J. J., Ge, H. (2016). The altitudinal effects on photosynthesis of Rosa platyacantha from the tianshan mountains in northwestern China. Photosynthetica 54, 572–580. doi: 10.1007/s11099-016-0649-0
Zhang, Y. Q., Kaiser, E., Zhang, Y. T., Yang, Q. C., Li, T. (2019). Red/blue light ratio strongly affects steady-state photosynthesis, but hardly affects photosynthetic induction in tomato (Solanum lycopersicum). Physiologia Plantarum. 167, 144–158. doi: 10.1111/ppl.12876
Zhu, F. Y., Wang, S. L., Xue, J. Q., Li, D. D., Ren, X. X., Xue, Y. Q., et al. (2018). Morphological and physiological changes, and the functional analysis of PdSPL9 in the juvenile-to-adult phase transition of paeonia delavayi. Plant Cell Tissue Organ Culture. 133, 325–337. doi: 10.1007/s11240-018-1384-y
Keywords: Hippeastrum, blue light, red light, LEDs, photosynthesis, chlorophyll florescence, flowering
Citation: Wang S, Liu X, Liu X, Xue J, Ren X, Zhai Y and Zhang X (2022) The red/blue light ratios from light-emitting diodes affect growth and flower quality of Hippeastrum hybridum ‘Red Lion’. Front. Plant Sci. 13:1048770. doi: 10.3389/fpls.2022.1048770
Received: 20 September 2022; Accepted: 01 November 2022;
Published: 01 December 2022.
Edited by:
Tangchun Zheng, Beijing Forestry University, ChinaReviewed by:
Xiaomei Sun, Shenyang Agricultural University, ChinaXiangtao Zhu, Zhejiang Agriculture and Forestry University, China
Copyright © 2022 Wang, Liu, Liu, Xue, Ren, Zhai and Zhang. This is an open-access article distributed under the terms of the Creative Commons Attribution License (CC BY). The use, distribution or reproduction in other forums is permitted, provided the original author(s) and the copyright owner(s) are credited and that the original publication in this journal is cited, in accordance with accepted academic practice. No use, distribution or reproduction is permitted which does not comply with these terms.
*Correspondence: Yanning Zhai, emhhaXlhbm5pbmdAY2Fhcy5jbg==; Xiuxin Zhang, emhhbmd4aXV4aW5AY2Fhcy5jbg==
†These authors have contributed equally to this work