 Sizhou Chen1,2
 Jiazhi Shen1
 Kai Fan2
 Wenjun Qian2Honglian Gu3Yuchen Li4
 Jie Zhang2Xiao Han2
 Yu Wang2*
 Zhaotang Ding1*
- 1Tea Research Institute, Shandong Academy of Agricultural Sciences, Jinan, Shandong, China
- 2Tea Research Institute, Qingdao Agricultural University, Qingdao, Shandong, China
- 3Key Laboratory of Tea Biology and Tea Processing of Ministry of Agriculture, Anhui Agricultural University, Hefei, Anhui, China
- 4International Tea Science and Technology Innovation Institute, Nanjing Agricultural University, Nanjing, Jiangsu, China
Drought tolerance and quality stability are important indicators to evaluate the stress tolerance of tea germplasm resources. The traditional screening method of drought resistant germplasm is mainly to evaluate by detecting physiological and biochemical indicators of tea plants under drought stresses. However, the methods are not only time consuming but also destructive. In this study, hyperspectral images of tea drought phenotypes were obtained and modeled with related physiological indicators. The results showed that: (1) the information contents of malondialdehyde, soluble sugar and total polyphenol were 0.21, 0.209 and 0.227 respectively, and the drought tolerance coefficient (DTC) index of each tea variety was between 0.069 and 0.81; (2) the comprehensive drought tolerance of different varieties were (from strong to weak): QN36, SCZ, ZC108, JX, JGY, XY10, QN1, MS9, QN38, and QN21; (3) by using SVM, RF and PLSR to model DTC (drought tolerance coefficient) data, the best prediction model was selected as MSC-2D-UVE-SVM (R2 = 0.77, RMSE = 0.073, MAPE = 0.16) for drought tolerance of tea germplasm resources, named Tea-DTC model. Therefore, the Tea-DTC model based on hyperspectral machine-learning technology can be used as a new screening method for evaluating tea germplasm resources with drought tolerance.
1. Introduction
With global warming, drought has become one of the major natural disasters (Sharma and Kumar, 2005). This problem is becoming more and more serious (Farooq et al., 2012). It is reported that drought reduced tea production by 14-33%, resulting in 6-19% plant death (Cheruiyot et al., 2010). Under drought stress, the yield and quality of tea plants will decline, seriously restricting tea production. At present, the cultivation of drought-resistant tea varieties by traditional methods is not only long in a cycle, low in efficiency, but also large in investment, which limits the cultivation speed of new varieties. Therefore, it is urgent to find a short cycle, high efficiency, and comprehensive evaluation method to speed up the selection of drought-resistant tea varieties.
Cultivating drought resistant tea variety is one of the effective ways to deal with drought stress. At present, the traditional method of cultivating drought resistant tea varieties not only has a long period, low efficiency, but also has a large investment, which limits the cultivation speed of new varieties. Therefore, it is urgent to find a method with short cycle, high efficiency and comprehensive evaluation to speed up the selection of drought resistant tea germplasm resources and the breeding of new drought resistant tea varieties. In order to evaluate the drought tolerance of tea germplasm resources, our research team used three machine learning models (Sizhou et al., 2021), SVM, RF and PLS, to model malondialdehyde (MDA), electrolyte leakage (EL), maximum efficiency of light system (Fv/Fm), soluble sugar (SS) and drought damage degree (DDD) of tea. The results showed that the CARS-PLS model of MDA was the best among the four physiological and biochemical indicators (Rcal=0.96, Rp=0.92, RPD=3.51). UVE-SVM model performs best in DDD (Rcal=0.97, Rp=0.95, RPD=4.28). Therefore, by using hyperspectral imaging technology to establish a machine learning model, the drought degree of tea seedlings under drought stress can be monitored. This method is not only fast and accurate, but also nondestructive.
In the past few years, many studies have recorded and explained the physiological and biochemical reactions of plants under drought conditions. Under drought stress, the content of soluble sugar in tea will slowly increase, making osmotic pressure increase, so as to improve the water holding capacity of cells (Palta et al., 2012). Drought stress will cause tea to produce too many active oxygen species and their derivatives (Impa et al., 2012), such as malondialdehyde. The increase of its content will lead to changes in cell membrane permeability, leading to plant senescence and death. The growth of tea plants is slow and often stops. The quality indicators of tea plants, such as the synthesis of tea polyphenols, will be affected, and their contents will gradually decrease (Upadhyaya et al., 2012). In the process of rehydration, the physiological activity of plants will tend to be normal or even better. Our research team’s previous research results show that MDA and SS can largely reflect the degree of stress on tea plants, and are positively correlated with the degree of stress. In this experiment, the factor of tea tree quality stability under drought stress was added. Because tea tree contains high content of polyphenols, its content changes with the change of stress degree. After comparing several indicators, it is believed that polyphenols are representative components of quality, and its content is negatively correlated with the degree of stress. This phenomenon has also been confirmed in the results of this experiment. Therefore, we choose the MDA, SS and total polyphenol as indicators to evaluate the drought tolerance of tea plants.
In this study, hyperspectral imaging technology was used to comprehensively evaluate the drought tolerance of different tea germplasm resources, including drought tolerance, post-stress recovery, and quality maintenance. CRITICAL method is based on the contrast strength of evaluation indicators and the conflict between indicators to comprehensively measure the objective weight of indicators, so we used the method to analyze the information expression of different types of physiological and biochemical data in the overall performance, and the three indexes of malondialdehyde, soluble sugar, and total polyphenol contents were weighted respectively to calculate the drought tolerance coefficient (DTC) of tea plants. MSC, SNV, 1D, 2D, S-G and other methods were used to preprocess hyperspectral data, and multiple feature band filtering algorithms such as UVE, CARS and SPA were used to extract feature bands. SVM, PLSR, RF and other modeling algorithms were used to model the characteristic band and stress tolerance index, and used to screen tea drought resistant germplasm resources.
2. Materials and methods
2.1. Experimental design
The experiment was conducted at the scientific research greenhouse of Qingdao Agricultural University. The temperature of the greenhouse was 30° C during the day, the lighting time was 12 hours, the average light intensity was 10.6klus, and the temperature at night was 24° C, without light. There were ten tea varieties, including SCZ, ZC 108, MS 9, QN 1, QN 21, QN 36, QN 38, JGY, JX, and XY 10. The age of seedlings is three-year-old. There are 28 plants for each variety, with a total of 280 experimental seedlings. The test soil is mixed (40% subsoil, 40% matrix soil, 10% vermiculite, and 10% perlite). Tea seedlings were sterilized and planted in pots. The pre-culture stage was from November 24, 2021, to December 8, 2021, during which the soil moisture was maintained at 60% ~ 80%, the air humidity was maintained at 50%, and the greenhouse was ventilated for 2 ~ 4 hours every day. After the pre-culture stage, to simulate the natural water loss of tea plants under drought conditions, all water supply was stopped, and other conditions remained unchanged. The sampling started on December 9, 2021, with a sampling interval of 3 days. The sampling time was from 10:00 to 14:00 during the day when the physiological activity of tea plants is relatively significant. Four canopy samples were taken for each variety, with a total of 40 samples (Wei et al., 2009; Cao et al., 2015). The samplings were repeated five times during the drought stress. On December 28, 2021, the drought stress test was stopped and the rehydration test was started. The culture conditions were the same as those in the pre-culture stage, and the sampling interval was 3 days. Four canopy samples were collected for each variety, with a total of 40 samples. These samplings were repeated twice in the rehydration stage, and the test deadline was January 7, 2022. Two hundred and eighty samples were collected in this test. We used PMS710 soil moisture meter to measure and record the sample soil moisture during the test. Figure 1 shows the average soil relative humidity of the sample plants measured at each sampling.
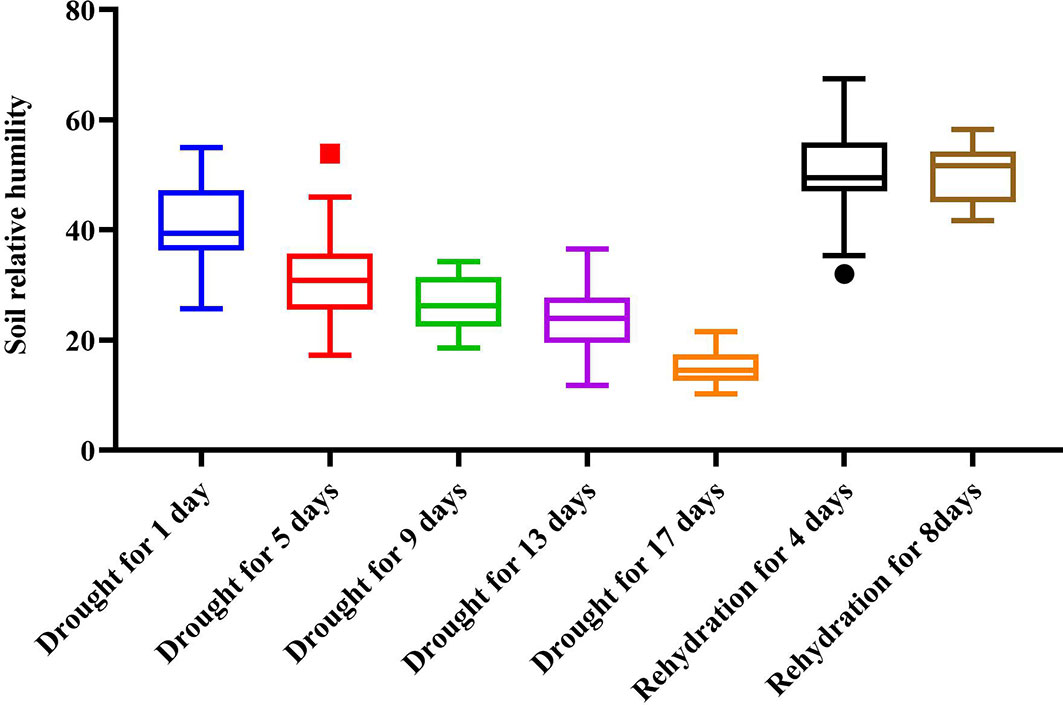
Figure 1 Value and trend of soil relative water content during the stress test.
2.2. Data acquisition
2.2.1. Acquisition and correction of hyperspectral data
Hyperspectral image acquisition system equipment mainly includes GaiaField Pro-V10 HSI camera (Jiangsu Dualix Imaging Technology Co., Ltd, China), Light source (color temperature light source is 3000 K, Hsia-ls-t-200w, China), supporting computer, darkroom and other components. Camera parameter settings: the exposure time is 22ms, the built-in lens pushing speed is 15s/cube, the spectral scanning range is 400 ~ 1000nm, the spectral interval is 1.667nm, the number of scanning bands is 360 bands, the image spatial resolution is 960 * 1040 (2X), the collected data size is 960 * 1101 * 360, the camera field of view angle is 22°, and the maximum DN value is 65552. Use the above equipment to collect the hyperspectral images of the tea tree canopy. The object distance is 20cm. Before and after the shooting, take the whiteboard and the black background respectively for later calibration. Specview (Jiangsu Dualix Imaging Technology Co., Ltd, China) is used to process and correct the original hyperspectral images sampled each time to obtain accurate hyperspectral image reflectance (between 0 and 1). In the software envi5.3 (Research Systems Inc., Boulder Co., United States), the mask method is used to extract the average spectral data of each hyperspectral image (Figure 2), and a 280 * 360 spectral matrix is obtained to facilitate subsequent processing. Leaf samples taken by hyperspectral camera will be used as samples for physiological and biochemical tests.
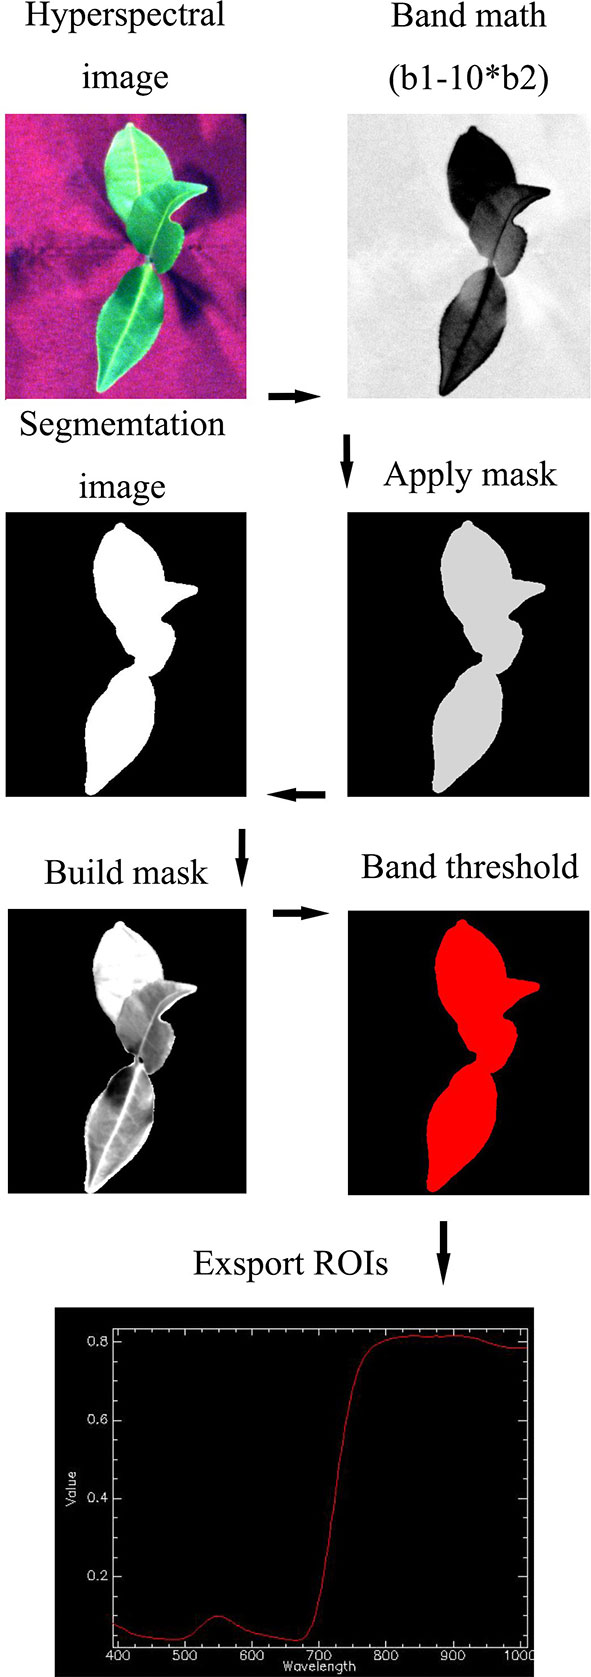
Figure 2 Flowchart of spectral data extraction.
2.2.2. Acquisition and analysis of physiological and biochemical indexes
To obtain more accurate data, the physiological and biochemical indexes of the samples were measured immediately after the hyperspectral images of the top view of the samples were collected. During the determination, each sample has 3 technical replicates, and the average value is taken as the test measurement value.
Determination of malondialdehyde content: the malondialdehyde content of the leaves corresponding to the hyperspectral images was determined using the malondialdehyde content Kit (Suzhou Grace Biotechnology Co., Ltd, Suzhou, China).
Determination of soluble sugar content: the soluble sugar content of the leaves corresponding to the hyperspectral images was determined by using the soluble sugar content Kit (Suzhou grace Biotechnology Co., Ltd, Suzhou, China).
Determination of total phenol: the total phenol content of the whole canopy was determined using the total phenol method Kit (Suzhou grace Biotechnology Co., Ltd, Suzhou, China). The content data of physiological and biochemical components of tea leaves measured with the kit are shown in supplementary Table 1
2.2.3. Acquisition of DTC index of tea germplasm resources
To more intuitively understand the performance of different tea varieties at different stages, after obtaining the above physiological and biochemical data, the Tukey HSD method in SPSS software was used to analyze the significance of the data (P< 0.05), and different indicators were used to evaluate the difference of tea germplasm resources under water stress. The contribution degree of three indicators in drought evaluation is analyzed by using the CRITICAL objective weighting method, and the information amount and weight of different indicators were compared and obtained a comprehensive indicator DTC (Drought Tolerance Coefficient) which can comprehensively evaluate the drought tolerance, recovery ability and quality maintenance ability of tea plants.
2.3. Preprocessing of spectral data
To eliminate the influence of surface scattering, different scattering levels, and optical path changes on the diffuse reflection spectrum, improve the signal-to-noise ratio of spectral data, eliminate the baseline shift of spectral data caused by environmental interference, and diffuse reflection and spectrum overlap, we used standard normal variable transformation (SNV) (Sandak et al., 2016), multivariate scattering correction (MSC) (Zhao et al., 2005; Shao et al., 2012), S-G smoothing (Lu et al., 2019)(Savitzky-Golay). The first-order differential (Tian et al., 2005) (1D) and the second-order (Chu, 2004) differential (2D) preprocess the extracted spectral data in different combinations. The relevant formula is as follows:
Where , m is the number of wavelength points, k = 1, 2, …, m
Where X is the original spectral matrix of the sample, X(i), m(i), b(i), X(i)(msc)is the average value of the surface original spectrum, the regression constant, the regression coefficient, and the MSC correction spectrum of the i the sample.
Where , Xi is the spectral data point before and after S-G smoothing, Wj is a weight factor obtained by smoothly moving the window using the window width 2R + 1.
2.4. Selection of characteristic wavelength
To improve the operational efficiency and accuracy of the model, we used three algorithms, namely continuous projection algorithm (SPA), competitive adaptive reweighted sampling (CARS), and uninformative variable elimination (UVE), to screen the whole bands (Chen and Chen, 2005; Wu et al., 2009; Shi et al., 2018), and obtain the characteristic bands with the strongest correlation with the dependent variable as the input of the model.
2.5. Model establishment and evaluation
In this study, a total of 280 data sets of tea canopy were collected, and each data set was composed of average hyperspectral data and DTC. The data set was divided into training sets (210) and validation sets (70) according to the ratio of 3:1. After the spectral data were processed in the above process, the corresponding prediction models were established by using support vector machine (SVM), random forest (RF) and partial least squares regression (PLSR) (Vapnik, 1998; Carrascal et al., 2010; Dong and Huang, 2013; Li, 2013; Zhou, 2016). The stability and accuracy of the model were evaluated by the determination coefficient (R2), root means square error (RMSE), and mean absolute percentage error (MAPE) (Dodge, 2006; Aptula et al., 2010; Alam Akbar and Subiakto, 2013). R2, RMSE, and MAPE are calculated as follows:
Where n is the number of samples, yi is the true value of the sample target variable, is the target variable value predicted using the regression model.
3. Results and analysis
3.1. Comprehensive analysis of tea germplasm resources with drought tolerance and establishment of DTC
It can be seen from Figure 3 that the index difference among different treatments is high, in which the content of malondialdehyde and soluble sugar was positively correlated with the stress time, and the content of total phenol is negatively correlated. The physiological indexes of different varieties of tea plants changed during drought stress. The contents of malondialdehyde and soluble sugar of all varieties increased first and then decreased, and reached a peak from 13 to 17 days of drought. Among them, the MDA content of ‘JX’ reached the highest value of 19.18nmol/g on the 13th day of drought, and the soluble sugar of ‘XY 10’ reached the highest value of 40.15mg/g on the 17th day of drought. The content of total phenol decreased first and then increased, and reached the lowest level on the 17th day of the drought. Among them, the content of ‘ZC 108’ was the lowest, 2.15mg/g. Under the same stress treatment, the difference in component content among varieties decreased with the increase of stress time. On the first day of drought stress, the highest MDA content of ‘JGY’ was 37.06% higher than that of ‘QN 38’. On the 17th day of drought stress, the highest MDA content of ‘QN 38’ was 36.68% higher than that of Xinyang 10. On the first day of drought stress, the highest SS content of ‘MS 9’ was 56.94% higher than that of Xinyang 10. On the 17th day of drought stress, the highest SS content of ‘XY 10’ was 29.32% higher than that of ‘QN 1’, with a relative decrease of 17.62%. On the first day of drought stress, the highest TP content of ‘JGY’ was 56.12% higher than that of ‘JX’. On the 17th day of drought stress, the highest TP content of ‘QN 1’ was 55.69% higher than that of ‘JX’. To better understand the relationship between drought tolerance and water stress of different varieties, we statistically analyzed the content changes of physiological and biochemical indexes of tea varieties in different periods. The fluctuation range of indexes is shown in Figure 4, and the descriptive statistical results are shown in Table 1.
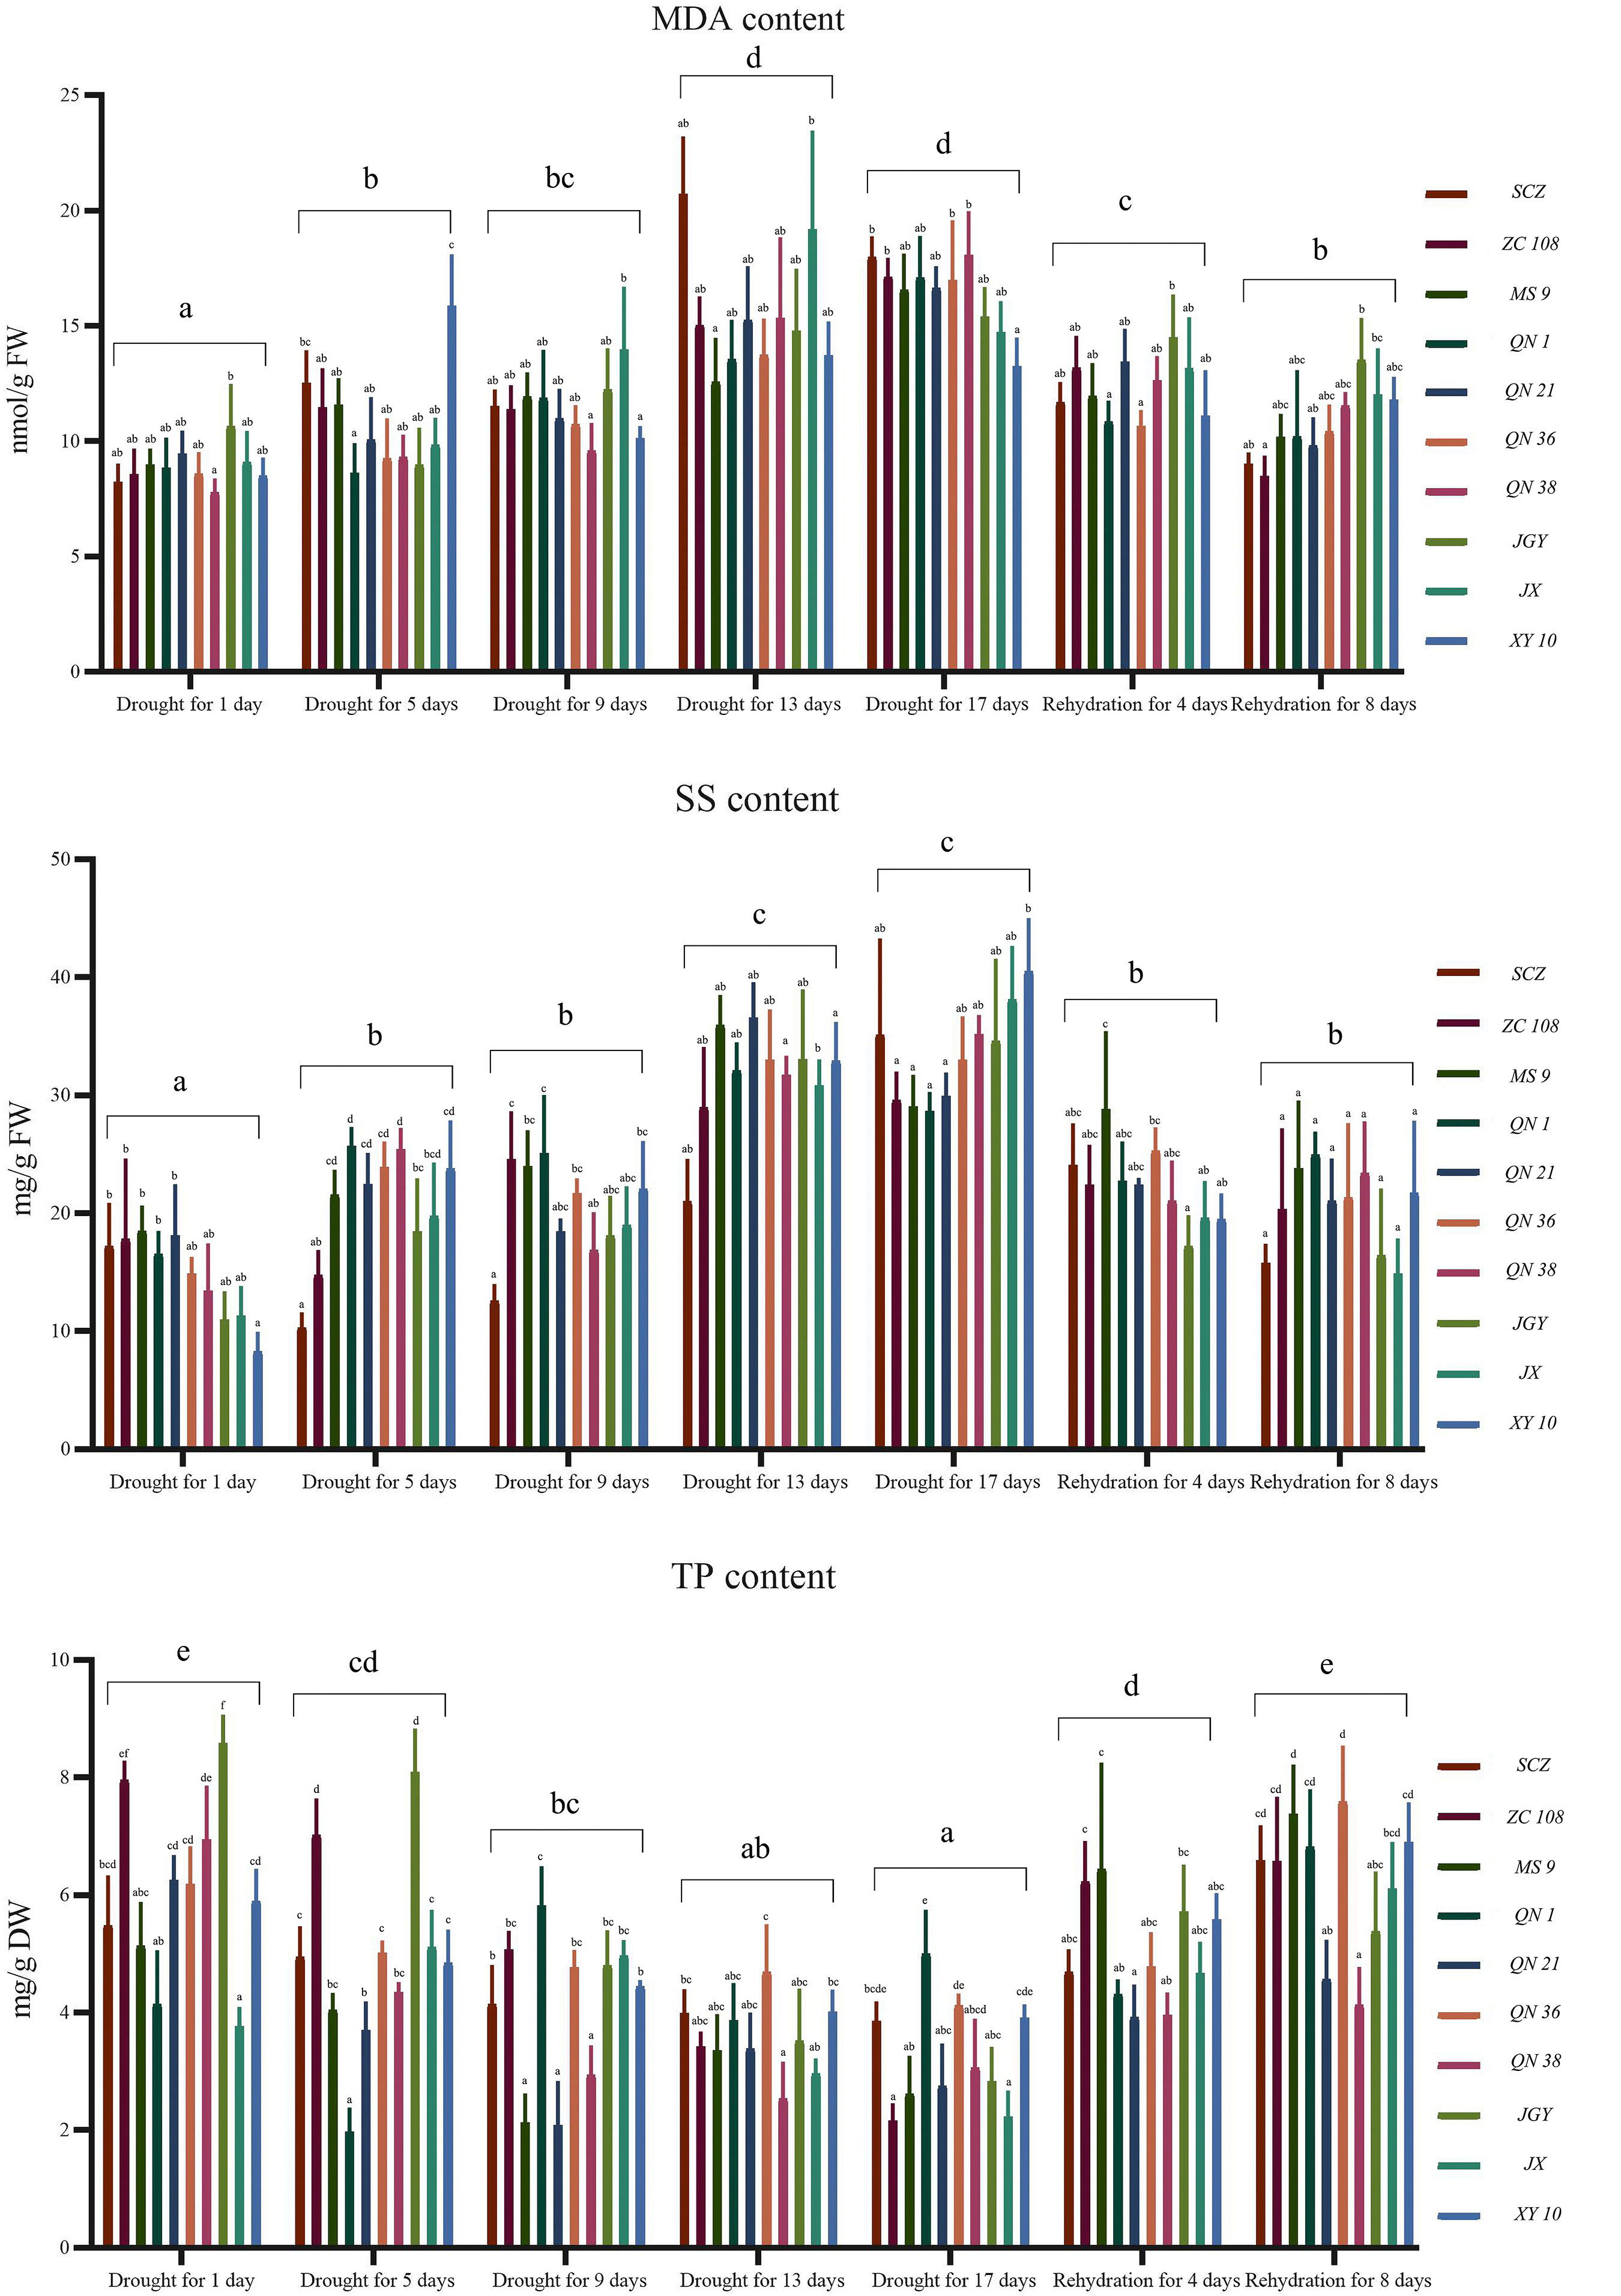
Figure 3 Statistical analysis of physiological and biochemical indexes (malondialdehyde, soluble sugar and total polyphenol content) data of tea germplasm resources in different periods. MDA, malondialdehyde; SS, soluble sugar; TP, total phenol.
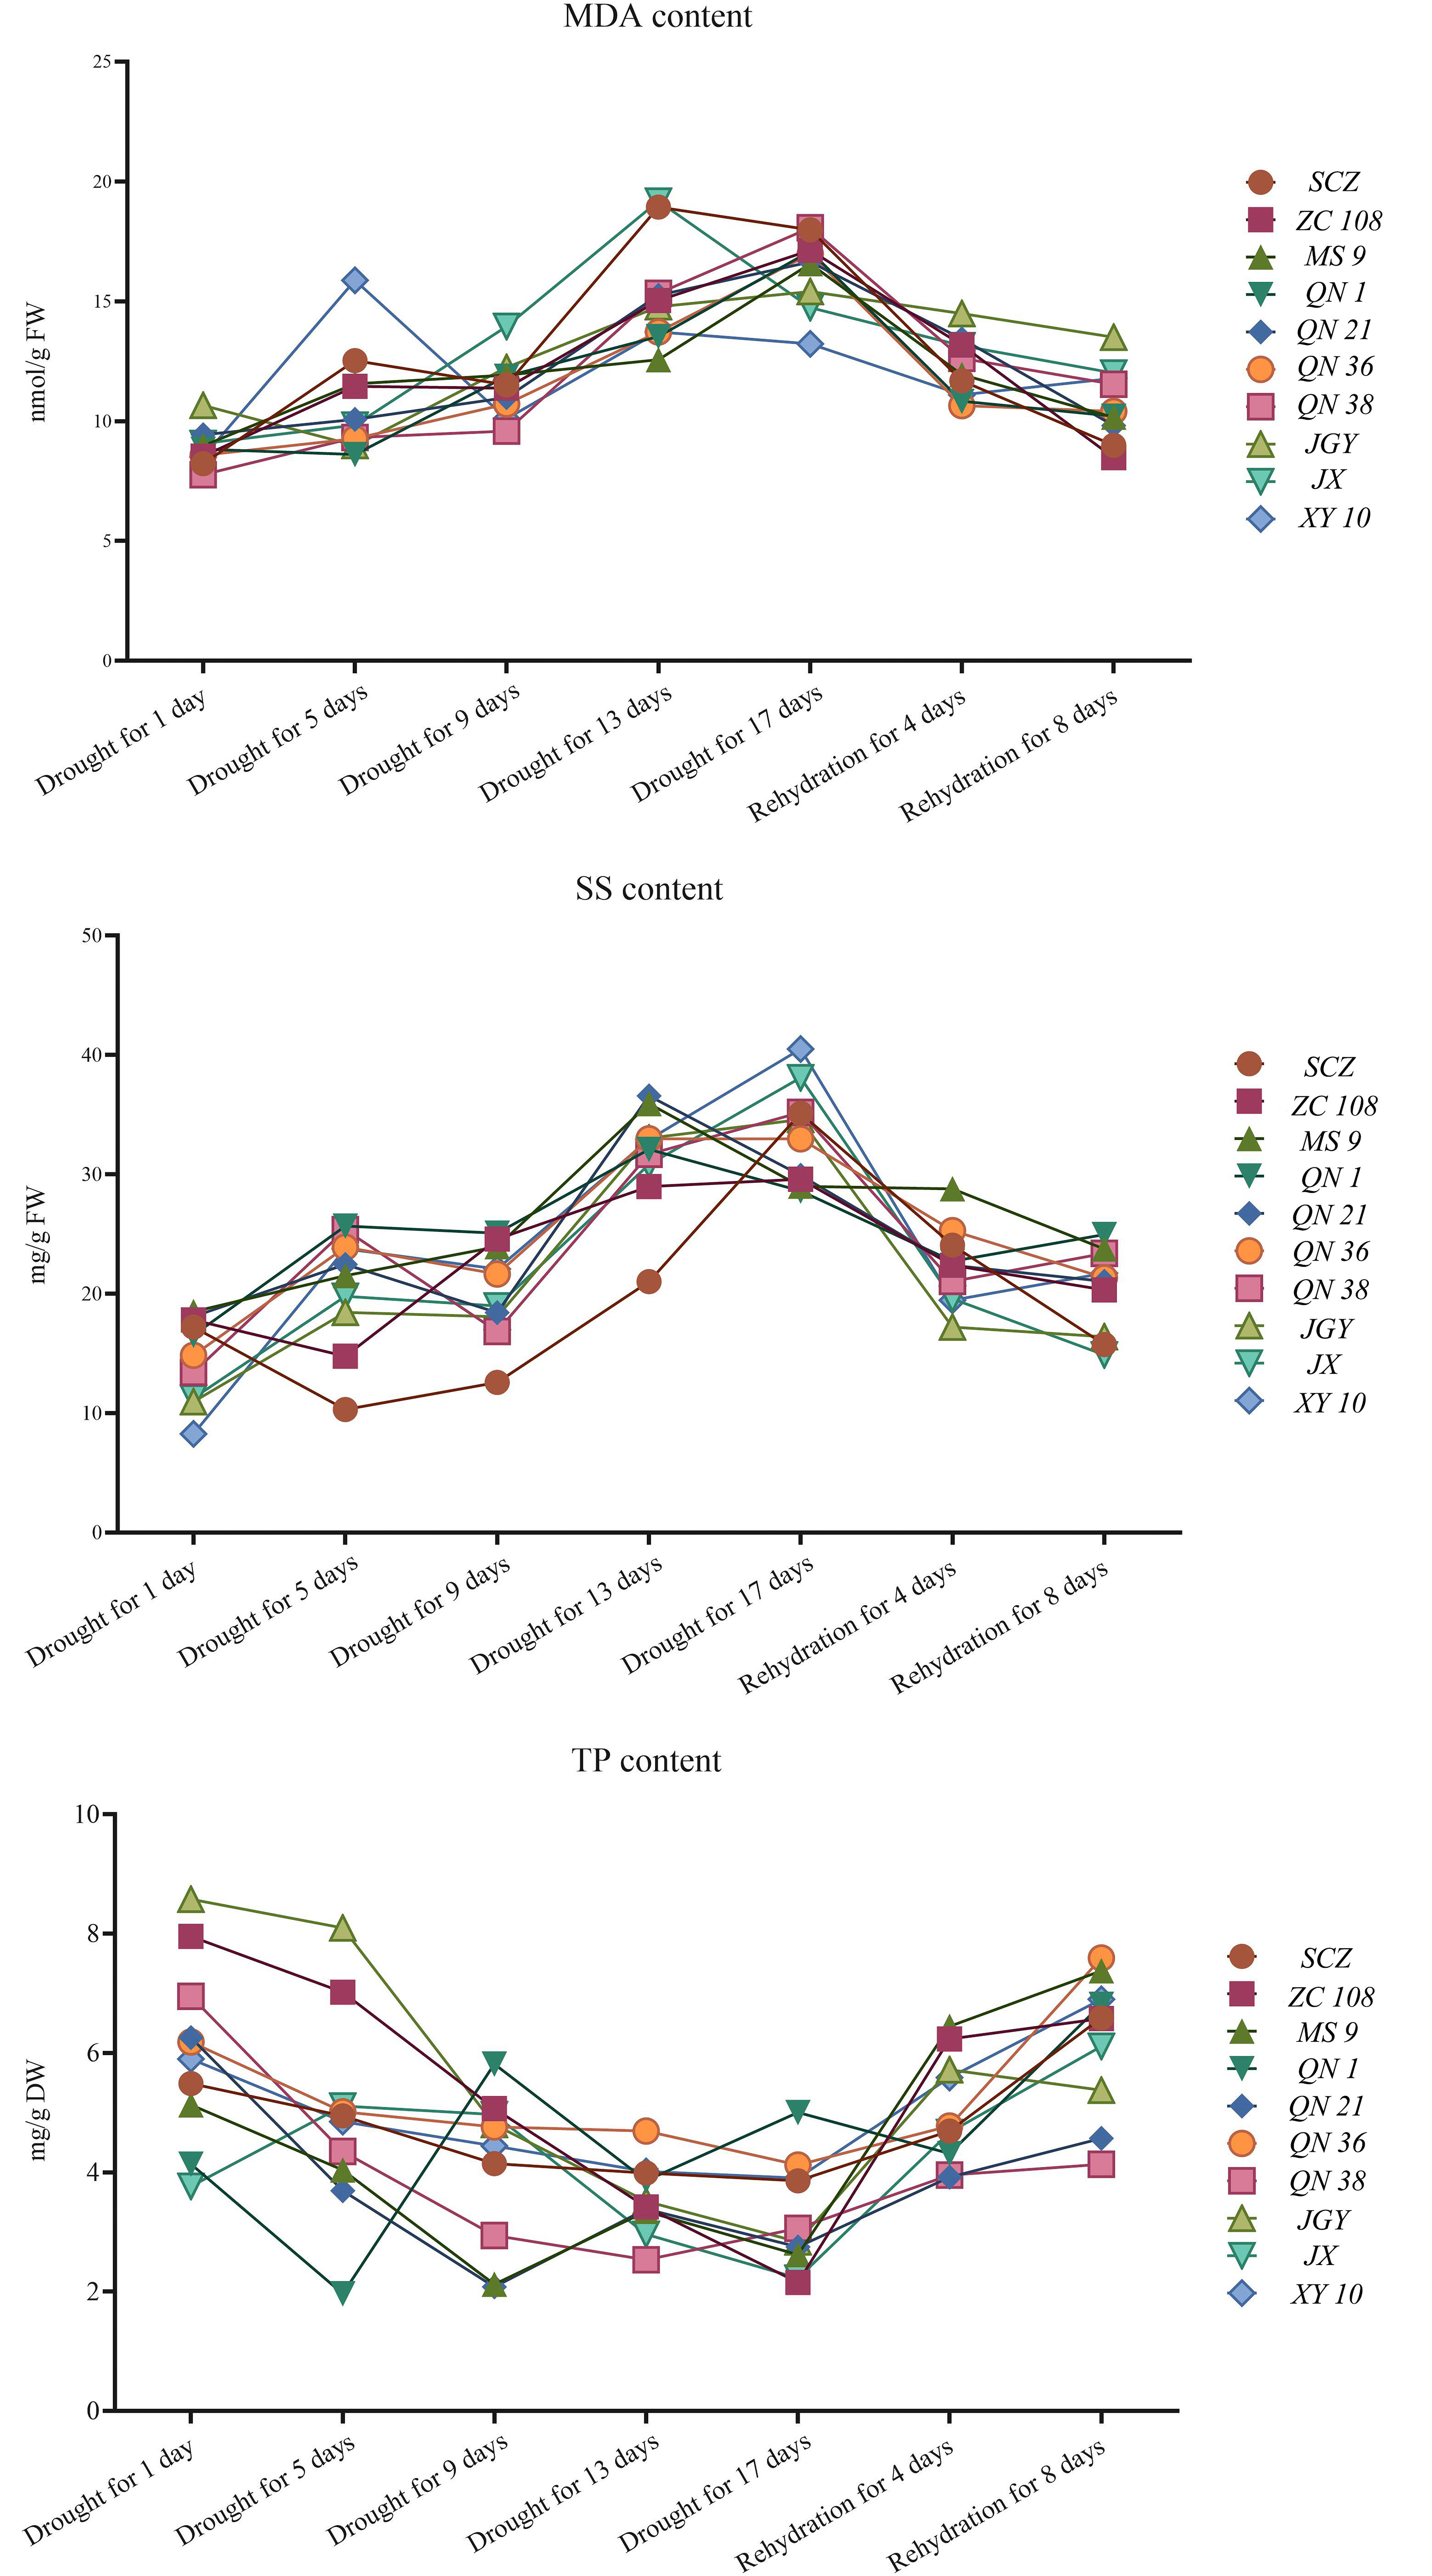
Figure 4 Change trend of physiological indexes (malondialdehyde, soluble sugar and tea polyphenol content) of tea germplasm resources.
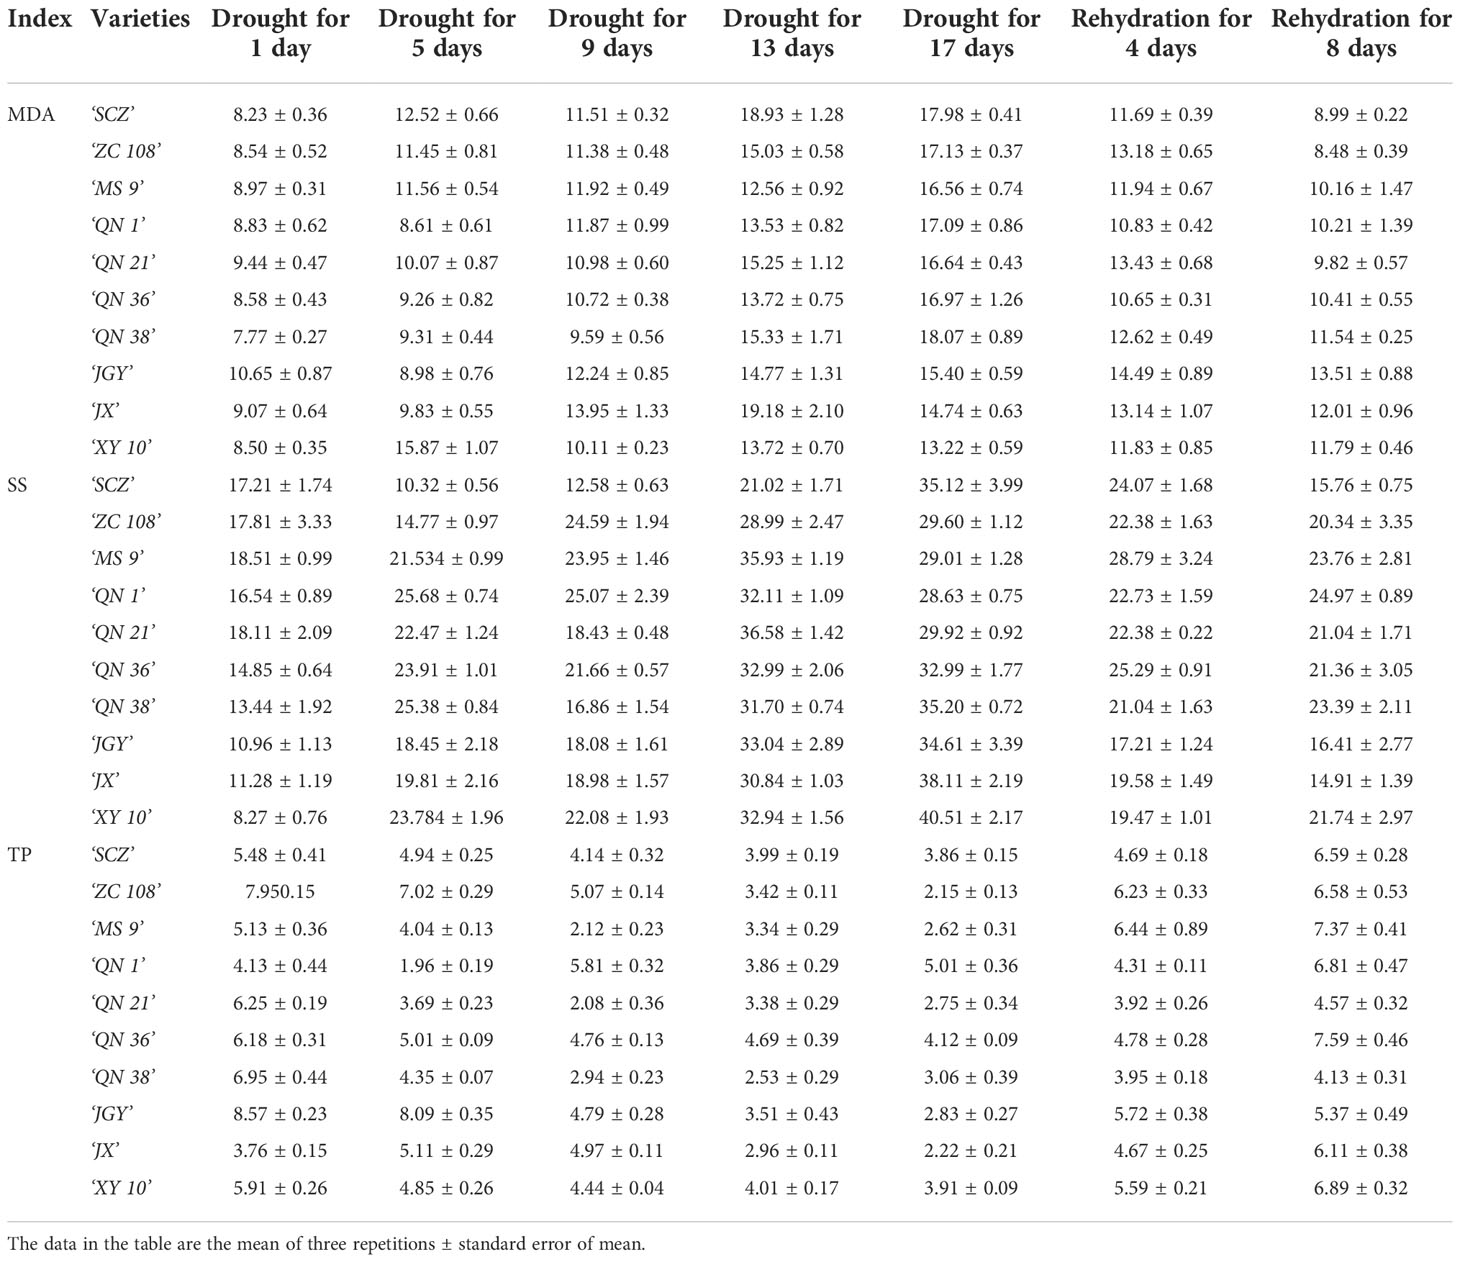
Table 1 Changes of physiological and biochemical data of tea germplasm resources in different periods.
Through the analysis of the change trend chart and descriptive data of malondialdehyde content, it is known that the average value and dispersion coefficient of ‘MS 9’, ‘QN 1’, ‘QN 36’, ‘QN 38’, and ‘XY 10’ are low, and the oxidative metabolic activity is low during the water stress period, and the comprehensive performance is good. Through the analysis of the change trend chart of soluble sugar content and descriptive data, it is known that the average value and dispersion coefficient of ‘ZC 108’, ‘MS 9’, ‘QN 1’, ‘QN 21’, and ‘QN 36’ were low, the osmotic pressure was maintained well, and the comprehensive performance is good. According to the analysis of the change trend chart of total phenol content and descriptive data, the total phenol content of ‘ZC 108’, ‘QN 1’, ‘QN 36’, ‘JX’, and ‘XY 10’ remained at a high level and the dispersion coefficient was small, and the quality retention ability was strong during the stress period. However, the above assessments are all identification of single indicators and do not meet the conditions for comprehensive assessment and identification (Liang et al., 2014).
To further more comprehensively and directly identify the tea germplasm resources with drought tolerance, we used the CRITICAL objective weighting method to analyze the content of malondialdehyde, soluble sugar, and total polyphenols. It was found that the information contents of MDA, SS, and TP were 0.21, 0.209, and 0.227 respectively, accounting for 32.57%, 32.32%, and 35.11% respectively. We used the range method to make the data of physiological and biochemical indexes positively correlated with stress time. After weighted calculation for all individuals, we obtained the DTC index of each tea individual. The higher the DTC index, the stronger the drought tolerance ability, the lower the DTC index, and the weaker the drought tolerance ability. The DTC distribution of each variety is shown in Figure 5.
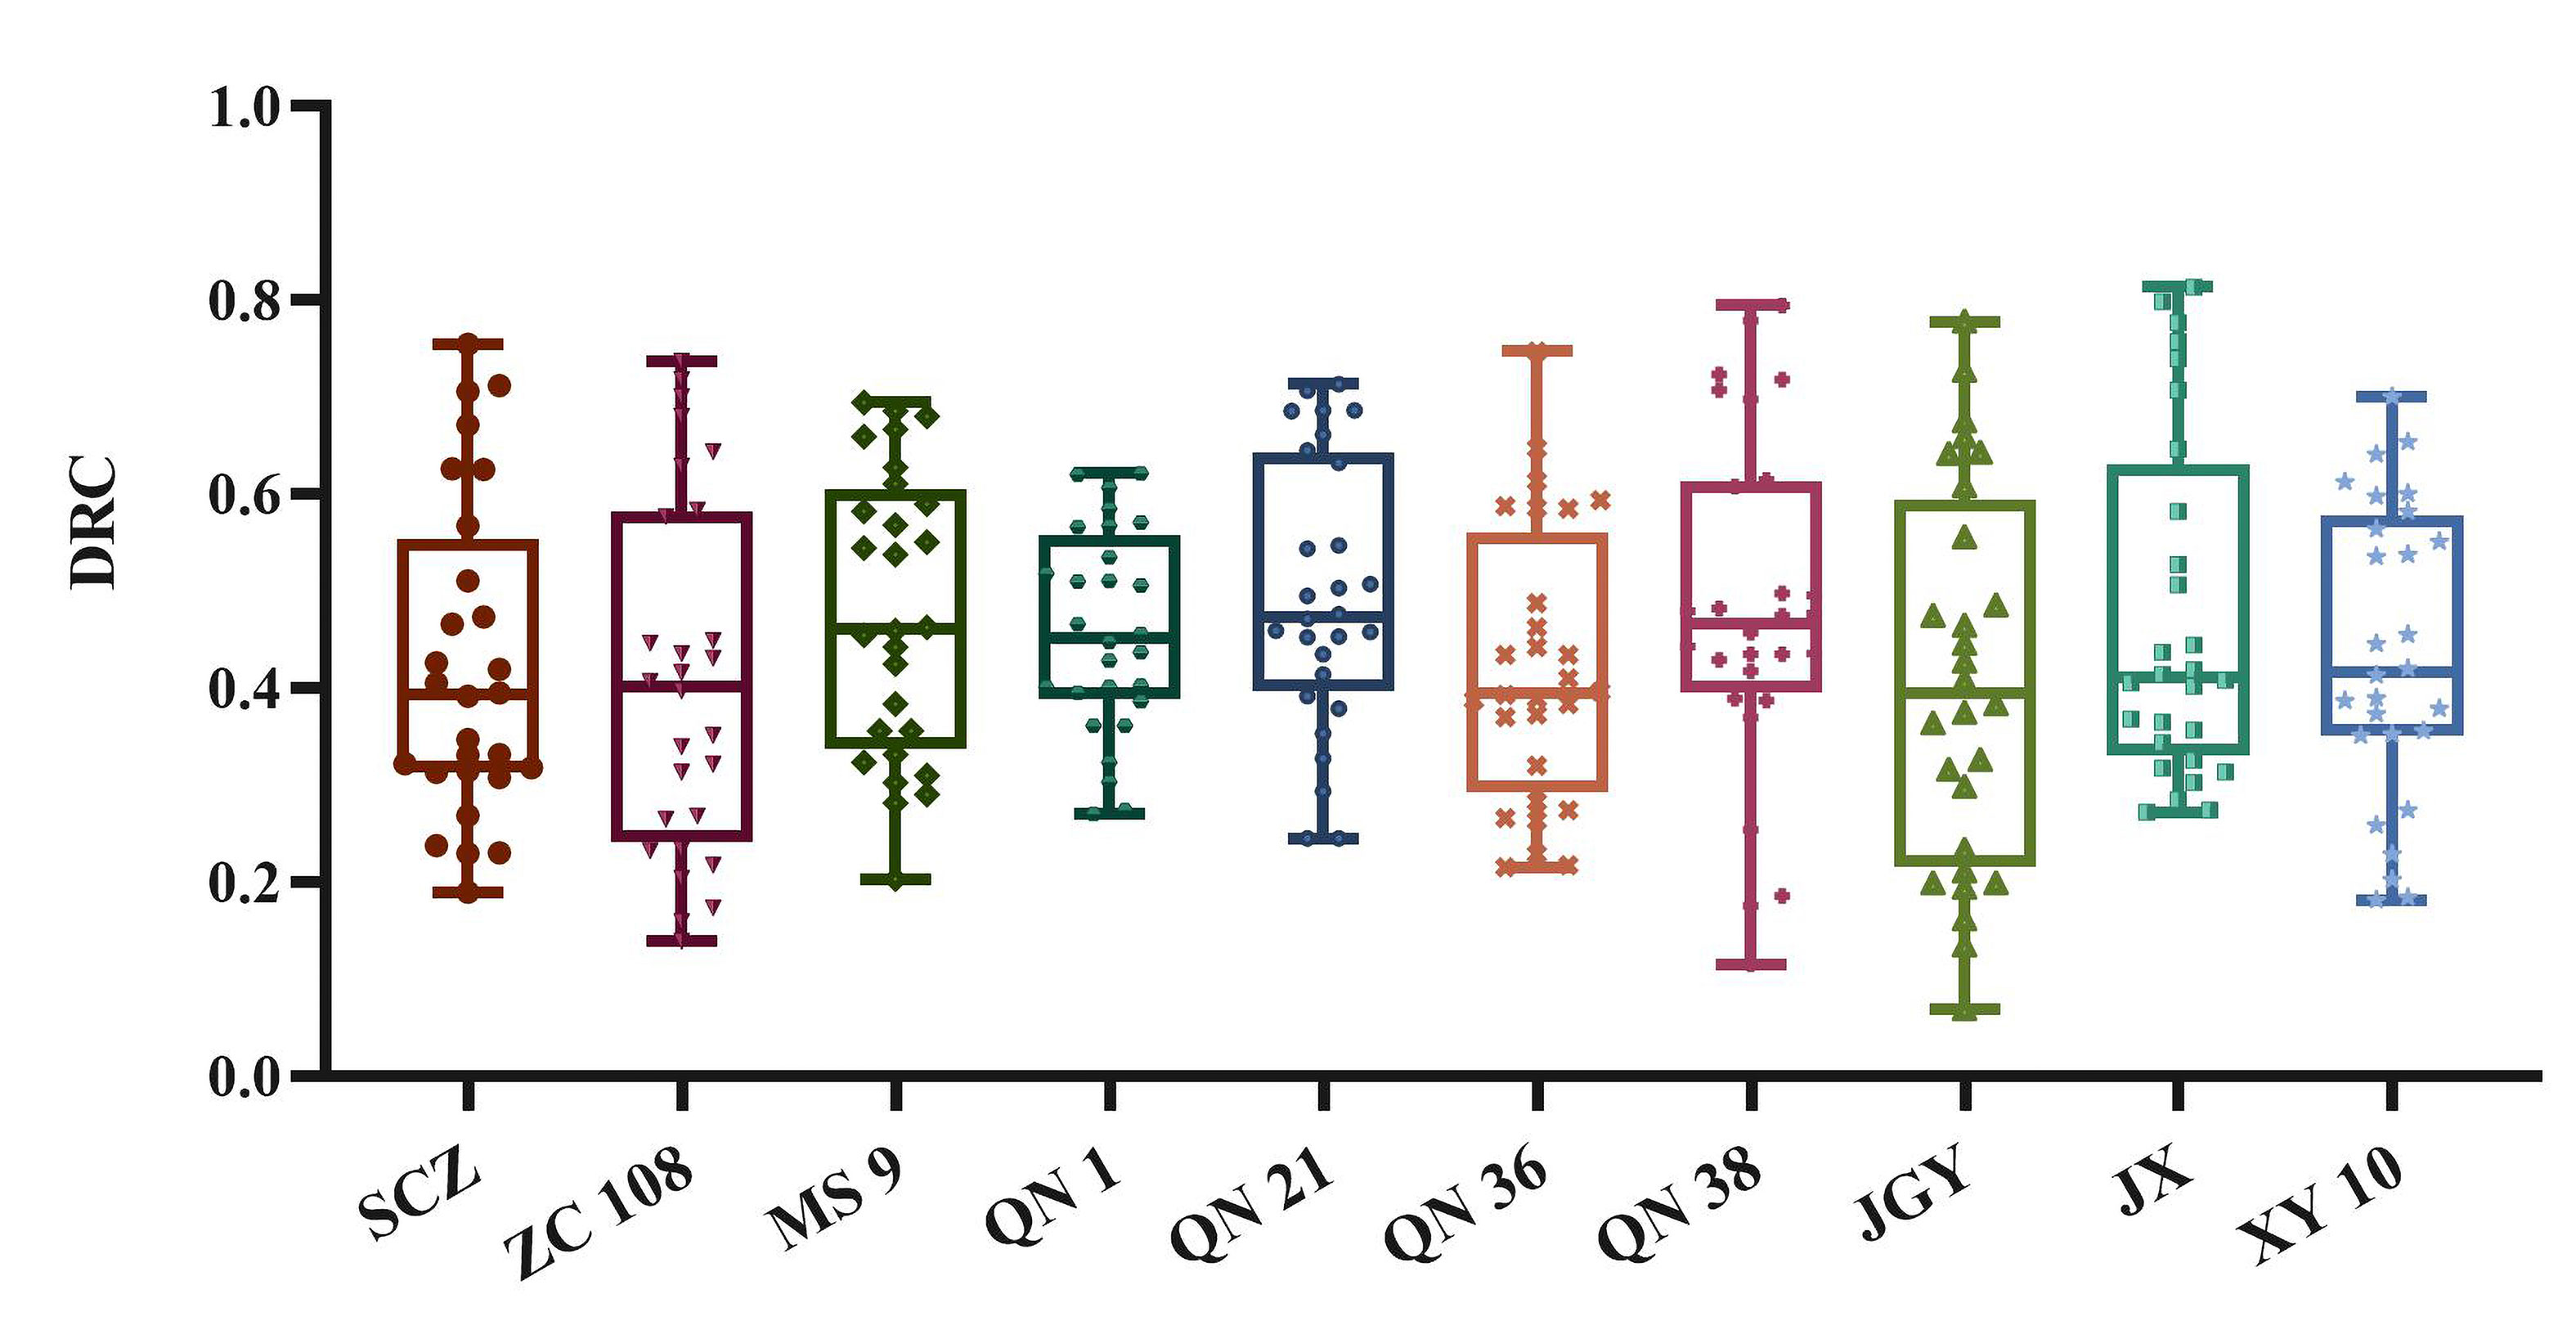
Figure 5 Statistical analysis results and distribution of DTC of different tea germplasm resources.
It can be seen from Figure 5 that in the distribution with small dispersion, ‘QN1’, ‘QN 21’, and ‘MS 9’ account for a high proportion. As shown in Table 2, by comparing the percentages of different varieties in the overall median and the overall average, the comprehensive drought tolerance of all varieties is ranked. The ranking results from high to low are: QN 36, SCZ, ZC 108, JX, JGY, XY 10, QN 1, MS 9, QN 38 and QN 21. Among them, ‘QN 38’ and ‘QN 21’ had good drought tolerance, but their quality stability is poor. The reason may be that the polyphenol content of these two varieties is lower than that of other varieties during drought stress or water sufficiency period, so the comprehensive score is low.
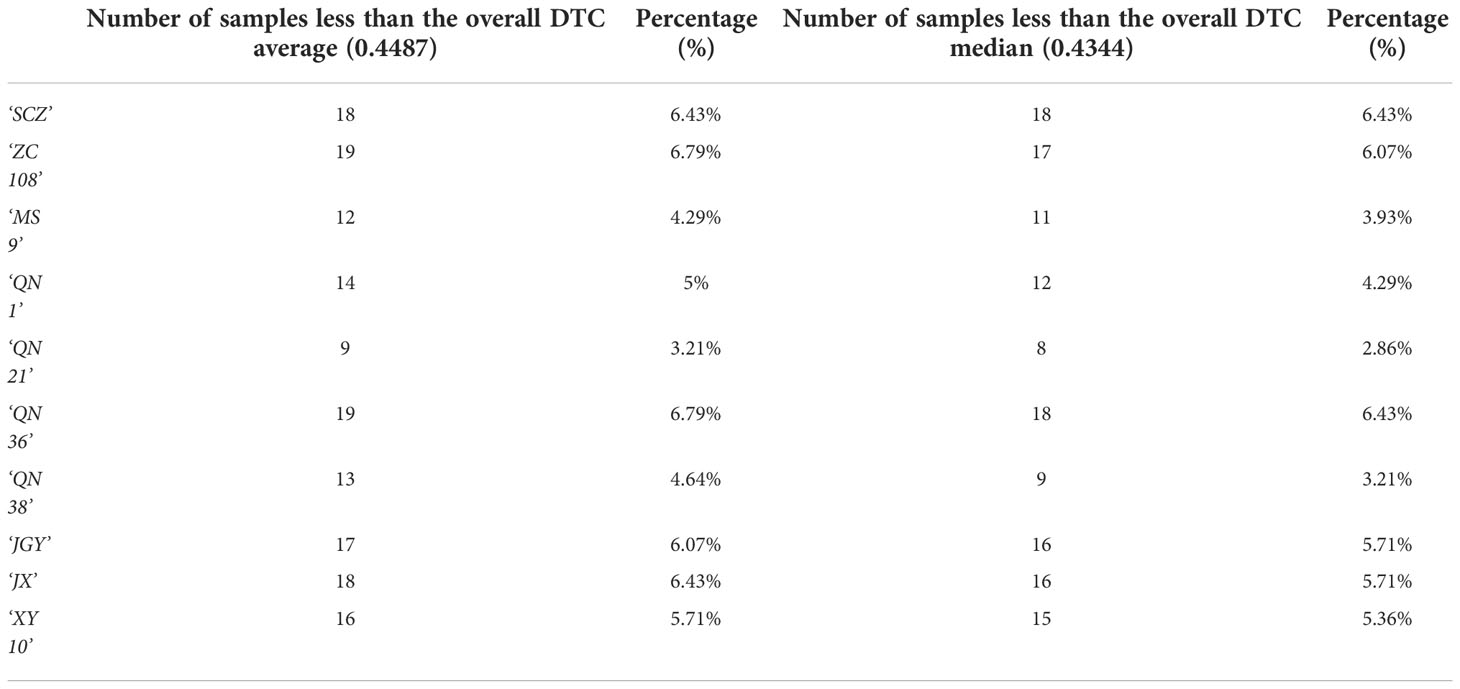
Table 2 Proportion of DTC of different tea germplasm resources in all tested individuals.
In the traditional methods, the destructive detection is time-consuming and laborious, and the manual observation of tea seedlings has a certain delay error and subjective error. Therefore, we recorded not only the spectral data, but also the phenotypic change data of the samples during the test to ensure that there was no obvious change in the aboveground part of the samples during the test. As shown in Figure 6, in this experiment, there was little difference in the phenotype of the aboveground tissues of various tea varieties before and after stress, at the end of stress, and the end of rehydration. On the contrary, the root system of the underground part of tea seedlings developed and grew. Therefore, it is difficult to select varieties and individuals with both drought tolerance and quality maintenance ability by observing the difference in the aboveground part of tea germplasm resources during drought stress. Hyperspectral imaging technology has changed the traditional methods of germplasm resource identification and can speed up the selection process of tea drought-resistant varieties in terms of time and efficiency.
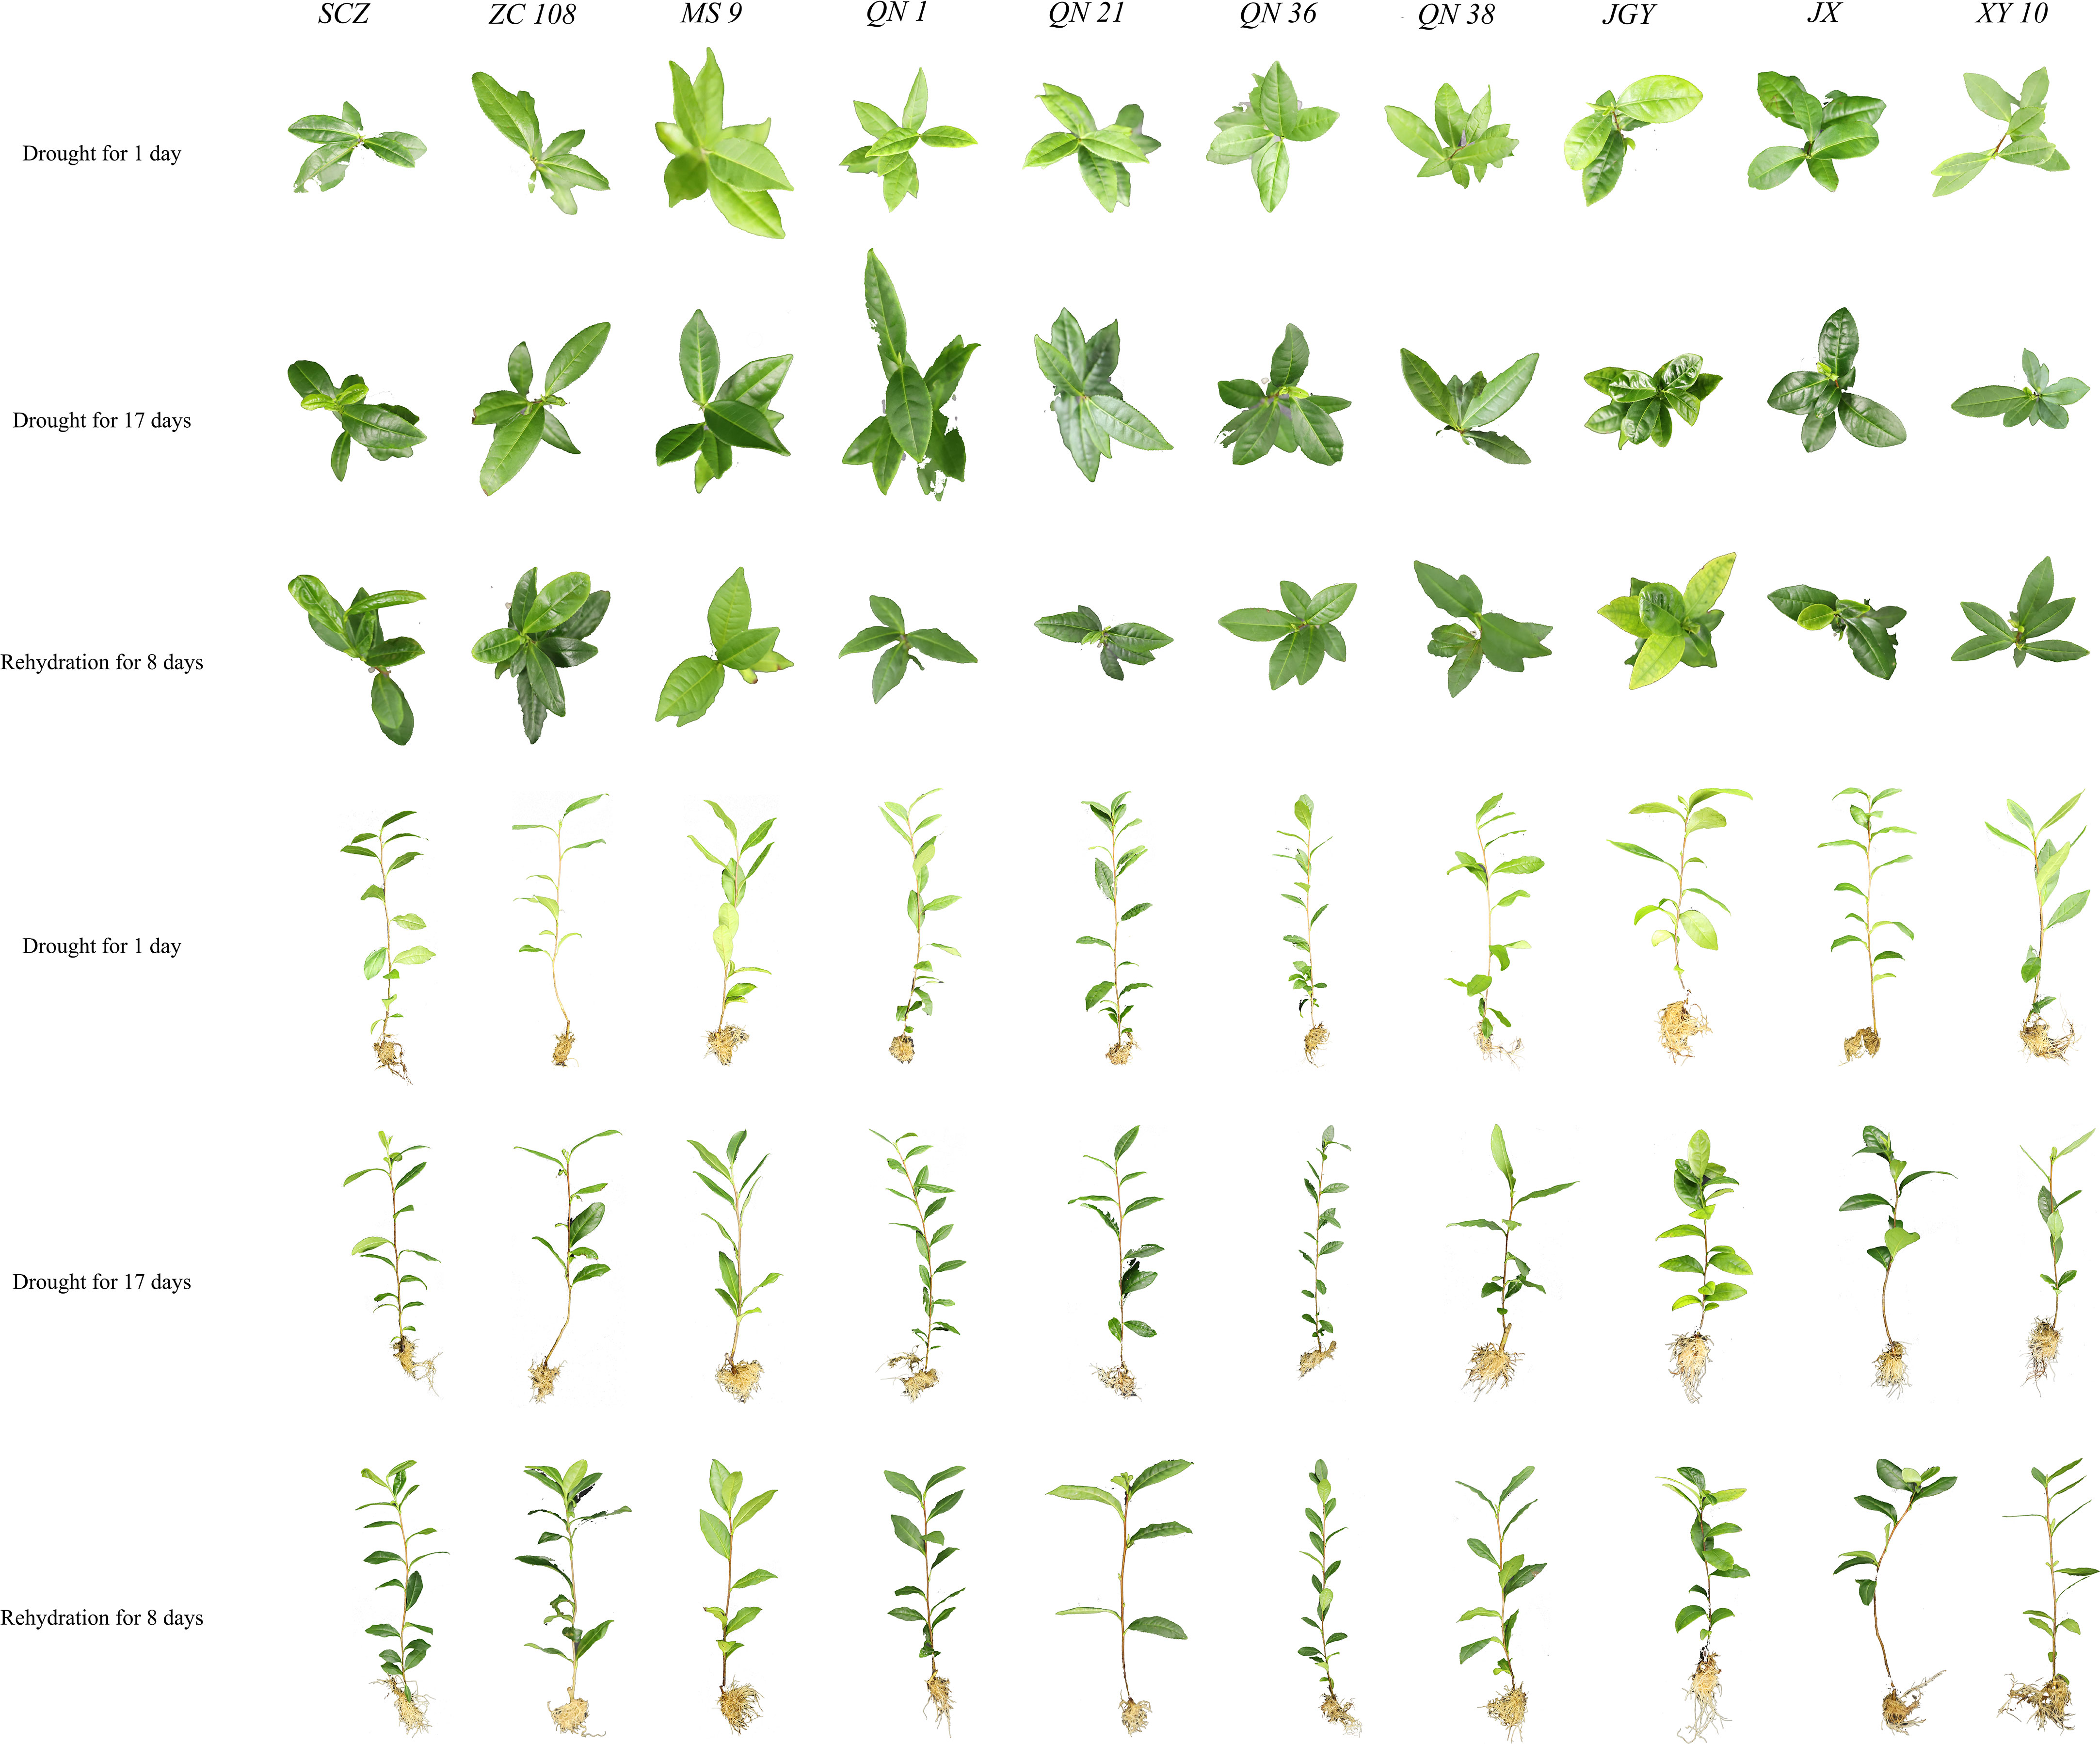
Figure 6 Phenotypic changes of ten tea germplasm resources in three experimental stages (drought for 1day, drought for17days and rehydration for 8days).
3.2. Processing results of hyperspectral data
To improve the reliability of spectral data, the preprocessing visualization data of average spectral data of all samples are shown in Figure 7. Compared with the original data, the spectral data after MSC correction enhances the correlation between the spectral data. SNV expand the upper and lower limits of the data and eliminated the diffuse reflection of most of the data. To enhance the stability of the data and improve the signal-to-noise ratio, we subsequently used the optimal S-G smoothing and differentiation method to process the hyperspectral data. The data after the S-G smoothing and differentiation method were smoother in distribution and has convexity. The data visualization is shown in Figure 7 (d). After the later evaluation of the model, we found that such processing is more conducive to the later feature filtering algorithm to extract feature bands.
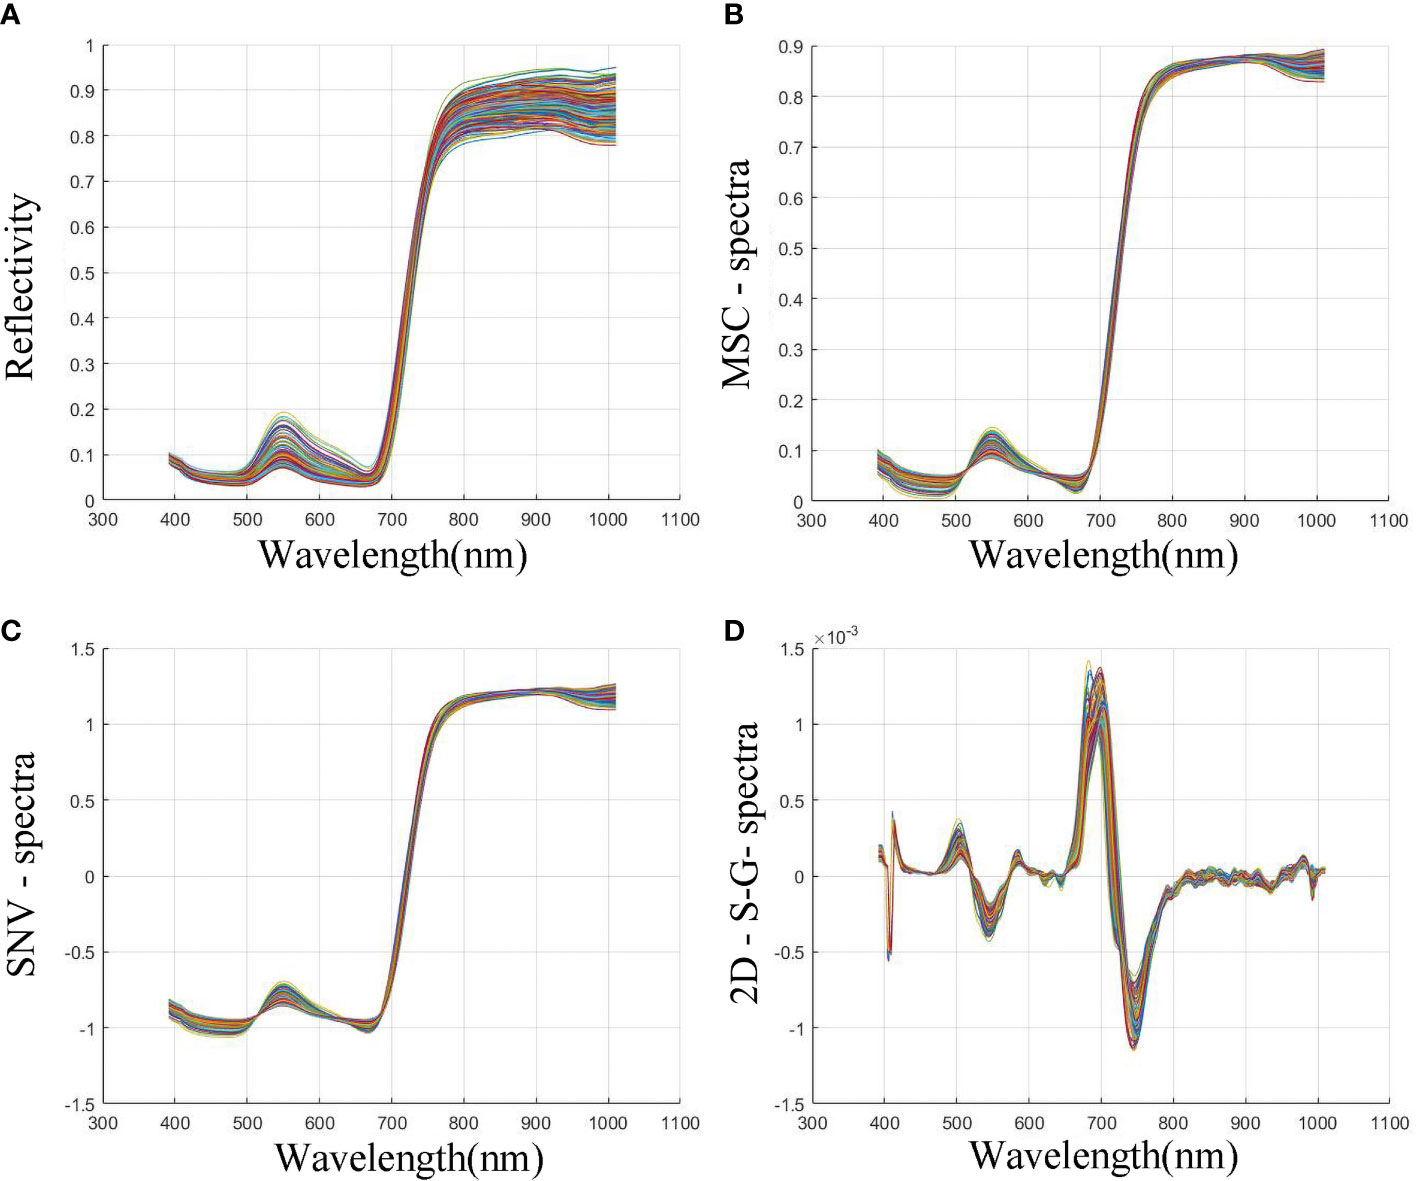
Figure 7 Changes of spectral data under different pretreatment methods. (A) Original bands image; (B) Bands image after MSC processing; (C) Bands image after SNV processing; (D) Bands image after second-order differential and S-G method processing.
For the preprocessed average spectral data and dependent variable data set, SPA, CARS, and UVE algorithms were used to screen the characteristic bands. The variable screening results of the three algorithms are shown in Figure 8. The optimal characteristic bands screened by SPA, CARS, and UVE algorithms are 95, 42, and 63 respectively. The characteristic bands screened by the SPA algorithm are sparsely distributed between 500 ~ 800nm, the characteristic bands screened by the CARS algorithm are sparsely distributed within 600 ~ 800, the characteristic bands screened by the UVE algorithm are distributed around 550nm and 600nm, and between 700 ~ 800nm. The characteristic bands screened by the three algorithms are mainly distributed between 391 ~ 440nm and 800 ~ 1000nm. This may be because, in the visible light range of 400-700nm (Wang et al., 2018), tea absorbs a large amount of visible light. However, under drought stress, tea photosynthesis weakens visible light reflection increases and the original spectral reflectance of the canopy increases. In the near-infrared range of 700-1000 nm, the changes in the internal structure of the leaves affected the spectral reflectance of the canopy (Mu et al., 2012; Xu et al., 2017). We will continue to study the relationship between this band interval and tea phenotype.

Figure 8 The characteristic bands screened by SPA, CARS and UVE algorithms.
The original band data set, the spectral data set with different preprocessing, and the optimal characteristic band data set were respectively input into SVM, RF, and PLSR algorithms. The model evaluation results of different treatment methods are shown in Figure 9. Table 3 records more detailed model data. It can be seen from the scatter plot that the models established based on the original spectral data set have the worst effect, such as None-SVM, None-PLSR, and None-RF models, among them, the PLSR model (, RMSEte = 0.84, MAPEte = 0.19) based on the original spectrum performs best and has a good prediction effect, but the prediction error is not meeting expectations. To further reduce the prediction error, we established a model based on scattering correction. But these models have poor prediction accuracy and a long calculation time, among them, the MSC-PLSR model (, RMSEte = 0.09, MAPEte = 0.19) performs best. The prediction effect of this model performs quite ordinary, but the prediction error is small. To further improve the prediction effect and reduce the prediction error, we established a model based on scattering correction and mathematical transformation processing (1D, 2D, and S-G). Among them, the MSC-2D (5)-PLSR model (, RMSEte = 0.076, MAPEte = 0.16) performs best. The prediction effect and prediction error of this model are excellent. To improve the operation speed of the model and improve the prediction accuracy of the model, we established a model based on scattering correction. Among the models of mathematical transformation processing and feature filtering algorithm, the MSC-2D (3)-UVE-SVM model (, RMSEte = 0.073, MAPEte = 0.16) is the best. The prediction accuracy and prediction error of this model are the best among all models, which improves the accuracy of prediction and reduces the calculation time of model prediction. This shows that, the accuracy of the model established based on a variety of algorithms has been greatly improved, which may be because a variety of preprocessing algorithms have improved the signal-to-noise ratio of spectral data, increased the analysis and regression ability of linear and nonlinear data, and provided a more diversified calculation method for the model (Zhang et al., 2019). Through the comparison of all the above prediction models, it can be found that: the prediction accuracy of the PLSR model is moderate, and the prediction error is larger than that of the RF model and SVM model. The model established by the RF algorithm is mediocre in prediction accuracy and prediction error, and the SVM model is better than the former in prediction accuracy and prediction error.

Figure 9 Visualization of evaluation index of all modeling methods.
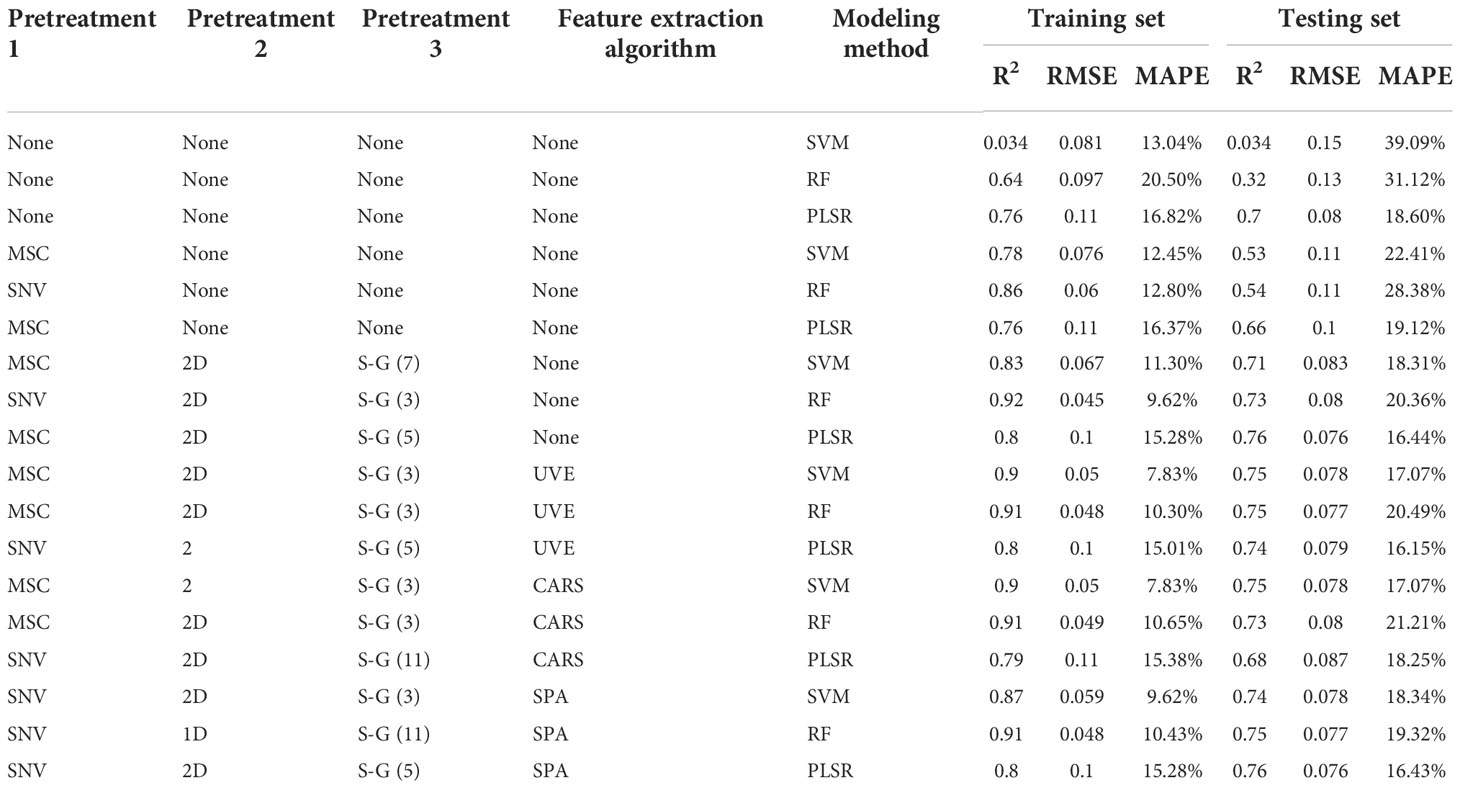
Table 3 Evaluation results of different prediction models.
After comparing the accuracy and error of all prediction models, we screened three models for horizontal comparison. These three models are MSC-2D (3)-UVE-SVM, MSC-2D (3)-UVE-RF and SNV-2D (5)-UVE-PLSR. Figure 10 shows the prediction and regression diagrams of SVM, RF and PLSR respectively. According to the regression degree and prediction trend shown in Figure 10, it can be seen that in this experiment, the various indexes of this SVM model are slightly better than those of RF and PLSR models, so the optimal prediction model combination of drought-resistant tea germplasm DTC is MSC-2D (3)-UVE-SVM model (, RMSEte = 0.073, MAPEte = 0.16).
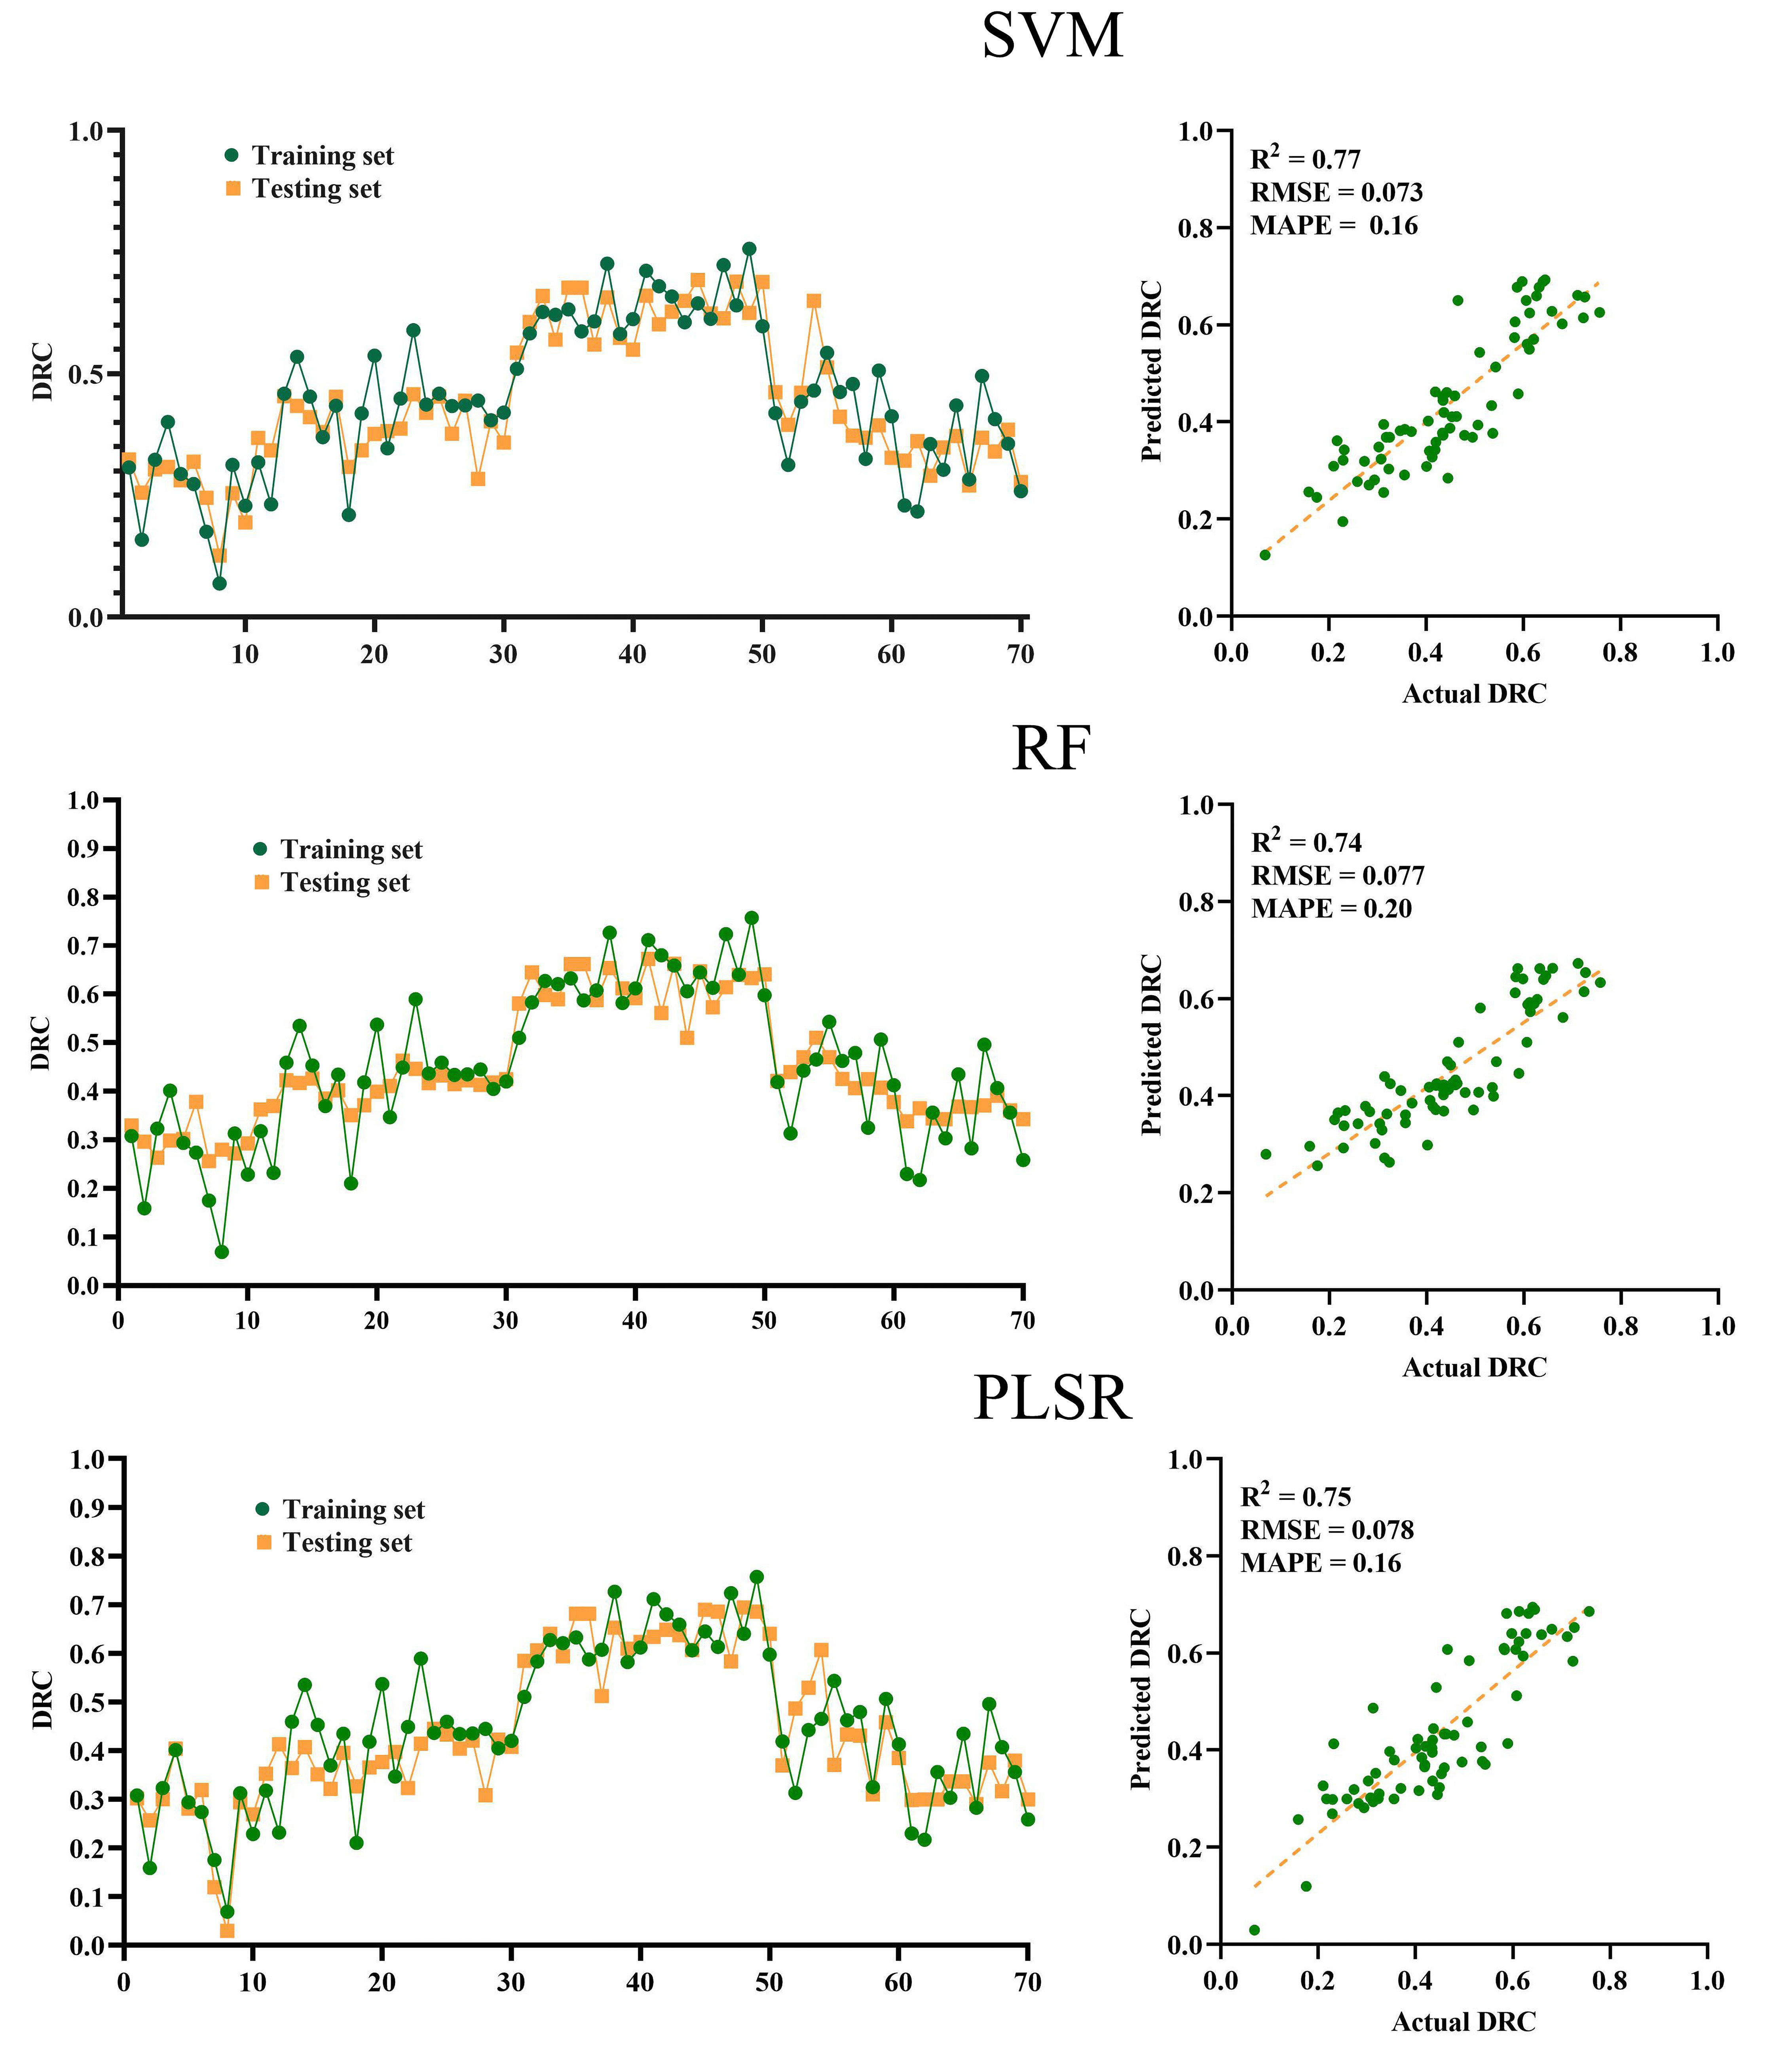
Figure 10 Modeling results and regression graphs of the three optimal algorithms (Top down are SVM, RF and PLSR).
4. Conclusion
In this experiment, drought and rehydration experiments were conducted on several tea germplasm resources, physiological, biochemical, and hyperspectral data were collected, the weights of different physiological and biochemical indexes in evaluating the drought tolerance of tea plants were analyzed, and the original spectral data were cut and processed by different algorithms, and the corresponding DTC prediction model was established, and the feasibility and advantages of this method were analyzed. The results of physiological and biochemical detection and analysis showed that the tea germplasm resources with drought tolerance from strong to weak were: QN 36, SCZ, ZC 108, JX, JGY, XY 10, QN1, MS 9, QN 38, and QN 21, and the best tea germplasm resource with drought tolerance model established in this experiment was MSC-2D (3)-UVE-SVM model (, RMSEte = 0.073, MAPEte = 0.16), this means that the screening of tea germplasm resources with drought tolerance can be completed before there is no obvious phenotypic change in the aboveground part of tea germplasm resources. Therefore, using the hyperspectral camera to screen tea germplasm resources with drought tolerance is an efficient method. The model not only achieves the expected effect but also has high prediction accuracy. Through the research and application of this model, the identification and evaluation of tea germplasm resources with long seedling stage and small phenotypic change can be realized, so as to accelerate the artificial breeding process of drought resistant tea germplasm resources.
Data availability statement
The raw data supporting the conclusions of this article will be made available by the authors, without undue reservation.
Author contributions
SC, carried out the experiment, collected and organized data, processed the hyperspectral image of tea leaves and wrote the manuscript. JS, KF and WQ participated in designing the experiment and reviewed the manuscript. ZD and YW, raised the hypothesis underlying this work, designed the experiment, and helped organize the manuscript structure and directed the study. HG, YL, JZ and XH participated in designing the experiment and directed the study. All authors contributed to the article and approved the submitted version.
Funding
This research was funded by the Innovation project of Shandong Academy of Agricultural Sciences (CXGC2022E18, CXGC2022B03); the Technology System of Modern Agricultural Industry in Shandong Province (SDAIT-19-01); The Special Foundation for Distinguished Taishan Scholar of Shandong Province (No. ts201712057); the Rizhao science and technology innovation project (2020cxzx1104); Qingdao people's livelihood plan (21-1-4-ny-2-nsh).
Conflict of interest
The reviewer JZ declared a shared affiliation with the author JS to the handling editor at the time of review.
The authors declare that the research was conducted in the absence of any commercial or financial relationships that could be construed as a potential conflict of interest.
Publisher’s note
All claims expressed in this article are solely those of the authors and do not necessarily represent those of their affiliated organizations, or those of the publisher, the editors and the reviewers. Any product that may be evaluated in this article, or claim that may be made by its manufacturer, is not guaranteed or endorsed by the publisher.
Supplementary material
The Supplementary Material for this article can be found online at: https://www.frontiersin.org/articles/10.3389/fpls.2022.1048442/full#supplementary-material
References
Alam Akbar, H., Subiakto, S. (2013). Stock price forecasting accuracy analysis using mean absolut deviation (MAD) and mean absolute percentage error (MAPE) on smoothing moving average and exponential moving average indicator (Empirical study 10 LQ 45 stock with largest capitalization from pe. Indonesian. J. Business. Adm. 2. Available at: https://www.neliti.com/publications/68283/stock-price-forecasting-accuracy-analysis-using-mean-absolut-deviation-mad-and-m
Aptula, A. O., Jeliazkova, N. G., Schultz, T. W., Cronin, M. T. D. (2010). The better predictive model: High q2 for the training set or low root mean square error of prediction for the test set. Mol. Inf. 24, 385–396. doi: 10.1002/qsar.200430909
Cao, D., Lin-Long, M. A., Jin, X. F., Gong, Z. M. (2015). Research advance of resistance to abiotic stresses of tea. Hunan. Agric. Sci. 10, 152–154. doi: 10.16498/j.cnki.hnnykx.2015.10.043
Carrascal, L. M., Galván, I., Gordo, O. (2010). Partial least squares regression as an alternative to current regression methods used in ecology. Oikos 118, 681–690. doi: 10.1111/j.1600-0706.2008.16881.x
Chen, B., Chen, D. (2005). The application of uninformative variables elimination in near-infrared spectroscopy. Spectronic. Instruments. Anal. 4, 26–30. Available at: https://en.cnki.com.cn/Article_en/CJFDTOTAL-GQFX200504008.htm
Cheruiyot, E. K., Mumera, L. M., Ng’etich, W. K., Hassanali, A., Wachira, F. N. (2010). High fertilizer rates increase susceptibility of tea to water stress. J. Plant Nutr. 33, 115~129. doi: 10.1080/01904160903392659
Chu, X. (2004). Progress and application of spectral data pretreatment and wavelength selection methods in NIR analytical technique. Prog. In. Chem. 16, 528–542. doi: 10.1016/j.jco.2003.08.015
Dodge, Y. (2006). Coefficient of determination. Alphascript. Publ. 31, 63–64. doi: 10.1007/0-387-26336-5_378
Dong, S. S., Huang, Z. X. (2013). A brief theoretical overview of random forests. J. Integration. Technol. 2, 1–7. https://en.cnki.com.cn/Article_en/CJFDTOTAL-JCJI201301001.htm
Farooq, M., Hussain, M., Wahid, A., Siddique, K. (2012). Drought stress in plant: An overview. Plant Responses. to. Drought. Stress. 1–33. doi: 10.1007/978-3-642-32653-0_1
Impa, S. M., Nadaradjan, S., Jagadish, S. V. K. (2012). Drought stress induced reactive oxygen species and anti-oxidants in plants (New York: Springer).
Li, X. H. (2013). Using “random forest”for classification and regression. Chin. J. Appl. Entomol. 50, 1190–1197. doi: 10.7679/j.issn.2095-1353.2013.163
Liang, X. D., Zeng, C. W., Li, J. J. (2014). Evaluation and selection of drought-resistance of oat varieties. Xinjiang. Agric. Sci. 51, 2150–2155. doi: 10.6048/j.issn.1001-4330.2014.11.031
Lu, Y. B., Liu, W. Q., Zhang, Y. J., Zhang, K., Ying, H. E., You, K., et al. (2019). An adaptive hierarchical savitzky-golay spectral filtering algorithm and its application. Spectrosc. Spectral. Anal. 9, 2657–2663. doi: 10.3964/j.issn.1000-0593(2019)09-2657-07
Mu, Y. C., Wang, R., Sun, W. T., Gong, L., Wang, Y. Q., Li, X. W. (2012). Effect of water stress on chloroplast ultrastructure of maize. Liaoning. Agric. Sci. 5, 7–12. doi: 10.3969/j.issn.1002-1728.2012.05.002
Palta, J. A., Berger, J. D., Bramley, H. (2012). “Plant responses to drought stress,” in Plant responses to drought stress: From morphological to molecular features. (Springer Link)
Sandak, J., Sandak, A., Meder, R. (2016). Assessing trees, wood and derived products with near infrared spectroscopy: Hints and tips. J. Near. Infrared. Spectrosc. 24, 485–505. doi: 10.1255/jnirs.1255
Shao, X., Min, Z., Cai, W. (2012). Multivariate calibration of near-infrared spectra by using influential variables. Anal. Methods 4, 467–473. doi: 10.1039/c2ay05609g
Sharma, P., Kumar, S. (2005). Differential display-mediated identification of three drought-responsive expressed sequence tags in tea [Camellia sinensis (L.) o. kuntze]. J. Biosci. 30, 231–235. doi: 10.1007/BF02703703
Shi, Y., Sun, D. M., Xiong, J., Wei, F., Ma, S. C. (2018). Analysis of artificial cow-bezoar by near-infrared spectroscopy coupled with competitive adaptive reweighted sampling method. Chin. Pharm. J. 53, 1216–1221. doi: 10.11669/cpj.2018.14.014
Sizhou, C., Yuan, G., Kai, F., Yujie, S., Danni, L., Jiazhi, S., et al. (2021). Prediction of drought-induced components and evaluation of drought damage of tea plants based on hyperspectral imaging. Front. Plant Sci. 12. doi: 10.3389/FPLS.2021.695102
Tian, G. Y., Yuan, H. F., Chu, X. L., Liu, H. Y. (2005). Near infrared spectra (NIR) analysis of octane number by WaveletDenoising-derivative method. Spectrosc. Spectral. Anal. 25, 516. doi: 10.1016/j.saa.2004.06.052
Upadhyaya, H., Dutta, B. K., Sahoo, L., Panda, S. K. (2012). Comparative effect of Ca, K, Mn and b on post-drought stress recovery in tea [Camellia sinensis (L.) O kuntze]. Am. J. Plant Sci. 3, 443–460. doi: 10.4236/ajps.2012.34054
Vapnik, V. N. (1998). Statistical learning theory. Encyclopedia. Sci. Learn. 41, 3185–3185. doi: 10.1007/978-1-4419-1428-6_5864
Wang, Z. L., Chen, J. X., Cheng, Y. J., Fan, Y. F., Feng, W., Hao-Chen, L. I., et al. (2018). Assessing the soluble sugar of maize leaves in drought stress based on hyperspectral data. J. Sichuan. Agric. Univ. 36, 436–443. doi: 10.16036/j.issn.1000-2650.2018.04.003
Wei, C. L., Ye-Yun, L. I., Jiang, C. J. (2009). Progresses of stress physiology and applications of molecular biology in tea plant. J. Anhui. Agric. Univ. 3, 335–339. doi: 10.13610/j.cnki.1672-352x.2009.03.018
Wu, D., Wu, H. X., Cai, J. B., Huang, H., He, Y. (2009). Classifying the species of exopalaemon by using visible and near infrared spectra with uninformative variable elimination and successive projections algorithm. J. Infrared. Millimeter. Waves. 28, 423–427. doi: 10.3321/j.issn:1001-9014.2009.06.006
Xu, D. Q., Liu, X. L., Wang, W., Chen, M., Kan, H. C., Li, C. F., et al. (2017). Hyper-spectral characteristics and estimation model of leaf chlorophyll content in cotton under waterlogging stress. Chin. J. Appl. Ecol. 28, 3289–3296. doi: 10.13287/j.1001-9332.201710.013
Zhang, T. T., Zhao, B., Yang, L. M., Wang, J. H., Sun, Q., Science, C. O. (2019). Determination of conductivity in sweet corn seeds with algorithm of GA and SPA based on hyperspectral imaging technique. Spectrosc. Spectral. Anal. 39, 2608–2613. doi: 10.3964/j.issn.1000-0593(2019)08-2608-06
Zhao, Q., Zhang, G. L., Chen, X. D. (2005). Effects of multiplicative scatter correction on a calibration model of near infrared spectral analysis. Optics. Precis. Eng. 13, 53–58. doi: 10.1088/1009-0630/7/5/006
Keywords: tea germplasm resources, hyperspectral imaging, machine learning, nondestructive testing, drought tolerance
Citation: Chen S, Shen J, Fan K, Qian W, Gu H, Li Y, Zhang J, Han X, Wang Y and Ding Z (2022) Hyperspectral machine-learning model for screening tea germplasm resources with drought tolerance. Front. Plant Sci. 13:1048442. doi: 10.3389/fpls.2022.1048442
Received: 19 September 2022; Accepted: 14 November 2022;
Published: 01 December 2022.
Edited by:
Andreia Michelle Smith-Moritz, University of California, Davis, United StatesReviewed by:
Jiye Zheng, Shandong Academy of Agricultural Sciences, ChinaZhang Kaixing, Shandong Agricultural University, China
Xingxing Wang, State Key Laboratory of Cotton Biology (CAAS), China
Copyright © 2022 Chen, Shen, Fan, Qian, Gu, Li, Zhang, Han, Wang and Ding. This is an open-access article distributed under the terms of the Creative Commons Attribution License (CC BY). The use, distribution or reproduction in other forums is permitted, provided the original author(s) and the copyright owner(s) are credited and that the original publication in this journal is cited, in accordance with accepted academic practice. No use, distribution or reproduction is permitted which does not comply with these terms.
*Correspondence: Zhaotang Ding, ZHp0dGVhQDE2My5jb20=; Yu Wang, d2FuZ3l1dGVhQDE2My5jb20=