 Chong Zhang1,2,3
 Wenping Xie1,2
 Huiwen Fu1,2
 Yuting Chen1,2
 Hua Chen1,2
 Tiecheng Cai1,2
 Qiang Yang1,2
 Yuhui Zhuang1,2
 Xin Zhong1,2Kun Chen1,2Meijia Gao1,2
 Fengzhen Liu3
 Yongshan Wan3
 Manish K. Pandey4
 Rajeev K. Varshney1,5*
 Weijian Zhuang1,2*
- 1Key Laboratory of Ministry of Education for Genetics, Breeding and Multiple Utilization of Crops, College of Agriculture, Institute of Oil Crops Research, Research Center for Genetics and Systems Biology of Leguminous Oil Plants, Fujian Agriculture and Forestry University, Fuzhou, China
- 2State Key Laboratory of Ecological Pest Control for Fujian and Taiwan Crops, Fujian Agriculture and Forestry University, Fuzhou, China
- 3State Key Laboratory of Crop Biology, Shandong Key Laboratory of Crop Biology, College of Agronomy, Shandong Agricultural University, Tai’an, China
- 4Center of Excellence in Genomics and Systems Biology (CEGSB), International Crops Research Institute for the Semi-Arid Tropics (ICRISAT), Hyderabad, India
- 5Murdoch’s Centre for Crop and Food Innovation, State Agricultural Biotechnology Centre, Food Futures Institute, Murdoch University, Murdoch, WA, Australia
Bacterial wilt disease (BWD), caused by Ralstonia solanacearum is a major challenge for peanut production in China and significantly affects global peanut field productivity. It is imperative to identify genetic loci and putative genes controlling resistance to R. solanacearum (RRS). Therefore, a sequencing-based trait mapping approach termed “QTL-seq” was applied to a recombination inbred line population of 581 individuals from the cross of Yueyou 92 (resistant) and Xinhuixiaoli (susceptible). A total of 381,642 homozygous single nucleotide polymorphisms (SNPs) and 98,918 InDels were identified through whole genome resequencing of resistant and susceptible parents for RRS. Using QTL-seq analysis, a candidate genomic region comprising of 7.2 Mb (1.8–9.0 Mb) was identified on chromosome 12 which was found to be significantly associated with RRS based on combined Euclidean Distance (ED) and SNP-index methods. This candidate genomic region had 180 nonsynonymous SNPs and 14 InDels that affected 75 and 11 putative candidate genes, respectively. Finally, eight nucleotide binding site leucine rich repeat (NBS-LRR) putative resistant genes were identified as the important candidate genes with high confidence. Two diagnostic SNP markers were validated and revealed high phenotypic variation in the different resistant and susceptible RIL lines. These findings advocate the expediency of the QTL-seq approach for precise and rapid identification of candidate genomic regions, and the development of diagnostic markers that are applicable in breeding disease-resistant peanut varieties.
1. Introduction
Bacterial wilt that is caused by Ralstonia solanacearum (R. solanacearum), is the most damaging bacterial disease that globally affects over 50 and 450 botanical families and plant species, respectively, including several economically important crops such as tobacco, peanut, tomato, and pepper (Salanoubat et al., 2002; Zhang et al., 2017). R. solanacearum is a free-living saprophyte that endures in soil and aquatic habitats for long durations (Genin and Boucher, 2004). R. solanacearum mostly infects plant roots, propagates in the xylem, disseminates into the stem, and then to the entire plant resulting in wilt and eventual death (Schell, 2000). Bacterial wilt disease often significantly reduces, by 10~30%, the yield and quality of peanut and other important crops; it may also result in complete yield loss (Zhang et al., 2017). Currently, no effective pesticide and biological control method exists to control this pathogen because of its wide host range and durable survival ability (Yu et al., 2011). Nevertheless, cultivating crop varieties that are genetically resistant has efficiently controlled this disease (Sunkara et al., 2014; Reddy, 2016), leading to the development and release of many resistant varieties of the peanut. However, there exists a looming threat of a breakdown of this genetic resistance in China, due to similar resistance mechanisms in both the cultivated varieties (such as Xiekangqing, Taishan Zhenzhu) and wild species (Janila et al., 2016; Luo et al., 2020). Despite the current search for varieties whose resistance is conferred via alternate mechanisms, it is imperative to determine the genomic regions and genes that encode resistance to augment the development of new varieties via genomics-assisted breeding (GAB) (Pandey et al., 2020).
Through analysis of various plant genomes, map-based cloning of plant genes that confer resistance to R. solanacearum was conducted for a few crop species. In Arabidopsis, a recessive RRS1-R encoding a Tir-NBS-LRR resistant protein with a WRKY domain in resistant line Nd-1 was first identified and cloned by fine mapping (Deslandes et al., 2003). It conferred resistance to GMI1000 when transferred into Col-5 variants with the dominant susceptible allele. Furthermore, another resistant gene RPS4 was in the reverse orientation and directly upstream of RRS1-R. This physical association triggered host resistance to the pathogen (Narusaka et al., 2009). Relatedly, RRS1-R associated with RPS4 is a dimer that recognizes PopP2 of R. solanacearum to trigger RRS (Narusaka et al., 2014). In Arabidopsis, three quantitative trait loci (QTLs) for RRS were identified in 100 F9 recombinant inbred lines (RILs) from another cross of Col-0 × Ler (Godiard et al., 2003). A putative leucine-rich repeat receptor-like kinase (LRR-RLK) gene named ERECTA was cloned and found to trigger RRS (Godiard et al., 2003). Recently, in peanut, two genes AhRRS5 and AhRLK1 (also known as AhCLAVATA1), encoding an NBS-LRR resistance protein and a receptor-like protein kinase, respectively, were identified by reverse genetics. Transgenic tobaccos that overexpressed these two genes conferred a significantly increased level of resistance to RRS, indicating that both R genes and RLKs are involved in resistance mechanisms against BWD (Zhang et al., 2017; Zhang et al., 2019). Hitherto, no resistance genes from other plants have been cloned and characterized by the map-based method.
Recently, several QTLs associated with RRS were effectively identified by QTL mapping in many crop species, including tomato (Thoquet et al., 1996; Carmeille et al., 2006; Wang et al., 2013; Shin et al., 2020), pepper (Mimura et al., 2009) (Du et al., 2019), potato (Habe et al., 2019), eggplant (Lebeau et al., 2013; Salgon et al., 2017), tobacco (Wang et al., 2013) and Medicago truncatula (Ben et al., 2013). Up to now, both sequencing-based trait mapping and gene discovery techniques are highly utilized due to low sequencing costs and the development of new methods that elucidate genomic loci and candidate genes associated with specific traits (Varshney et al., 2019; Pandey et al., 2020). Such efforts facilitate faster development of diagnostic markers which can be employed in GAB to accelerate the development of new peanut varieties (Pandey et al., 2020). In peanut, Zhao et al. (Zhao et al., 2016) first reported mapping QTL for RRS on the B02 chromosome using a moderately dense linkage map of 237 SSR and SNP markers. By combining restriction-site-associated DNA sequencing (RAD-seq) and bulk segregant analysis (BSA) techniques, they developed resistant-related SNP markers from the RIL population of crosses between resistant (Yueyou 92) and susceptible (Xinhuixiaoli) varieties. The two detected QTLs (qBW-1 and qBW-2) in the aforementioned RRS study accounted for 21% and 12% of the resistance phenotypic variance in the F2 generation, respectively. Only two side-by-side QTLs were found at the qBW-1 locus on the B02 chromosome in the F8 generation. The resistant resource of Yueyou 92 was from a Chinese landrace Xiekangqing, which is a major source of parental types used for breeding BWD-resistant variants in South China (Janila et al., 2016; Luo et al., 2020).
The rapid QTL-seq approach is critical for identifying genomic regions of a trait of interest in plants and identifies QTLs based on BSA and next-generation sequencing (Takagi et al., 2013). QTL-seq was the preferred choice of a fast and effective method that identifies and maps QTLs of target traits in crop plants (Takagi et al., 2013). For example, it was to identify QTLs of the target trait in rice (Arikit et al., 2019; Bommisetty et al., 2020; Lei et al., 2020; Yang et al., 2021), cucumber (Lu et al., 2014; Cao et al., 2021; Zhang et al., 2021), chickpea (Das et al., 2014; Singh et al., 2016; Srivastava et al., 2017), tomato (Illa et al., 2015; Topcu et al., 2021), oilseed rape (Wang et al., 2016; Tudor et al., 2020; Dong et al., 2021), maize (Chen et al., 2018; Wang et al., 2021), and peanut (Pandey et al., 2017; Clevenger et al., 2018; Luo et al., 2019; Kumar et al., 2020; Luo et al., 2020; Topcu et al., 2021). In peanut, it was used to map genomic loci and candidate genes for the development of diagnostic markers for RRS in 195 RILs obtained by crossing Yuanza 9102 and Xuzhou 68-4 (Luo et al., 2019). A major and stable QTL (qBWRB02.1) on chromosome B02 was identified, which was significantly associated with RRS in three environments. Moreover, two SNP sites were confirmed in diverse breeding lines and cultivars. Unlike Yueyou 92, Yuanza 9102 was derived from the wild species Arachis diogoi that was resistant to BWD (Janila et al., 2016; Luo et al., 2019). A stable QTL for RRS was finely mapped via both linkage mapping and QTL-seq tools in a resistant peanut cultivar (Luo et al., 2020). Two hundred and sixty-eight RILs were sequenced, and the phenotypes of variants from the cross between Xuhua 13 (susceptible) and Zhonghua 6 (resistant) among five environments were evaluated. Using both SSR- and SNP-based genetic maps, the QTL qBWRB02-1 was identified on chromosome B02 as previously reported (Zhao et al., 2016), and this accounted for 37.79–78.86% phenotypic variation across the five environments. Two adjacent candidate QTL regions in the qBWRB02-1 locus were segmented into qBWRB02-1-1 (2.81-4.24 Mb) and qBWRB02-1-2 (6.54-8.75 Mb) (Luo et al., 2020). QBWRB02-1-1 accounted for 49.43–68.86% phenotypic variation explained (PVE), which was higher than that for qBWRB02-1-2 (3.96–6.48% PVE). Moreover, this was validated by competitive allele-specific PCR (KASP) markers in different RILs and natural populations (Luo et al., 2020).
In this study, we utilized a QTL-seq approach to identify concomitant genomic regions, candidate resistance genes and diagnostic markers in a bacterial wilt-resistant peanut variety, Yueyou92. A 7.2 Mb candidate genomic region was elucidated on chromosome 12 significantly associated with RRS. This study reports successful discovery of followed by candidate resistance genes and validated markers for potential use in marker-assisted selection (MAS) for RRS in peanut breeding programs.
2 Materials and methods
2.1 Plant material and growth
Yueyou 92 (YY92), a variety that is highly resistant to BWD, was bred by the Guangdong Academy of Agricultural Sciences, China. It stemmed from Xiekangqing, which was resistant to R. solanacearum strains from different parts of China. In comparison, Xinhuixiaoli (XHXL) was a Chinese landrace that was highly susceptible to BWD. Their resistance validation was stable during multiple years of field assessment (Figure 1). A RIL population containing 581 lines was developed from the cross Yueyou 92 × Xinhuixiaoli using the single seed descent (SSD) method. A total of 581 F13 RILs were used for trait mapping for RRS. To assess the diagnostic markers, we utilized 18 resistant and 18 susceptible RILs for genotyping using allele-specific markers. All the RILs and parents were cultivated in a field in Yangzhong County (Sanming, Fujian, China).
Figure 1 Phenotypic variations and construction of the extreme bulks for resistance to Ralstonia solanacearum infections. (A) Comparative evaluation of the stability of the resistance between the two parents in the three different crop seasons (2016_Spring, 2016_Autumn, and 2017_Spring). (B) Frequency distribution of disease indexes in the RIL population at three different times. The y-axis represented the number of plants, whereas the x-axis represented the disease index. The red dashed box represented the resistant bulk (R-bulk), and the green dashed box represented the susceptible bulk (S-bulk). (C) Classification of bacterial wilt disease severity. Disease severity was classified using the following scale: 1 = the inoculated leaflets either had wilt or were absent but the entire plant was intact and lacked wilt; 2 = the main stem/branches of the inoculated leaves had wilt and chlorosis; 3 = the lateral branches of the inoculated leaves had wilt or were faded green, but the main stem was green; 4 = the entire plant had wilted and died, but all its branches were green. 5 = the entire plant had wilted and dried up. Bar: 1 cm. (D) Phenotypic variations among the RILs selected for the development of extreme bulks for bacterial wilt resistance. Based on mean values from three environments each with three replications, the 30 RILs with the lowest disease index and the 30 RILs with the highest disease index were used to construct susceptible and resistant bulks.
2.2 Pathogen inoculation and resistance phenotyping
The 581 RILs were evaluated for RRS in three independent crop seasons i.e., in 2016 spring and autumn (2016S and 2016A) and in 2017 spring (2017S). The RILs of F11, F12, and F13 generations and parents were cultivated in two-row plots with 20 seeds in each season. One-month to 40-day-old RILs seedlings were inoculated via a previously described artificial method (Zhao et al., 2016; Zhang et al., 2017). Resistance phenotyping of the RILs was performed 25 days after inoculation in the different seasons. Disease symptoms were classified into six disease severity ratings (Figure 1C): (0) = the inoculated leaflets either remained green or were yellow at inoculating sites, but the entire plant was intact and lacked wilt; (1) = the inoculated leaflets had either wilted or fallen off, but the entire plant was intact and lacked wilt; (2) = the main stem/branches of the inoculated leaves had wilt and chlorosis; (3) = the leaves of non-inoculated branches had wilt or were faded green, but the main stem was green; (4) = the entire plant had wilted and died, and all its branches were greenish; and (5) = the entire plant had wilted, dried, and was brownish. The disease index (DI) was calculated using the following formula:
Where,xi : disease grade value, xmax : the highest disease grade value, and yi: the number of diseased plants corresponding to the disease rating.
The average DI was calculated for the three replications in a single environment. Statistical analysis of variance (ANOVA) was performed using the DPS7.5 software (Date Processing System, Science Press, China), Values are expressed as the mean ± standard deviation or standard error as indicated. Differences between groups were evaluated using one-way ANOVA. Statistical significance was set at P<0.05.
2.3 Extreme bulks construction and whole genome resequencing
The average DI for each RIL was calculated based on phenotyping data from the 2016S, 2016A, and 2017S seasons. We selected 30 resistant and 30 susceptible lines to construct the extreme R/S pool. To develop the resistant bulk (R-Bulk) for RRS, we selected 30 RILs with a low mean disease index and pooled the same amount of DNA from each into one. Similarly, DNA samples of 30 RILs with a high mean disease index were pooled to construct the susceptible bulk (S-Bulk) for RRS. The genomic DNA of these two extreme pools and those of the two parents was used to construct DNA sequencing libraries. Paired-end reads (151 bp) of four libraries were generated via the Illumina HiSeq 2500 platform (Illumina, Inc., USA) with a sequencing depth of approximately 30× of the cultivated peanut genome (~2.7 Gb) for each pool and about 40× for parental plants. The raw sequencing data of the four libraries have been deposited in the NCBI Sequence Read Archive (SRA) under the BioProject ID PRJNA851221.
2.4 SNP/InDel genotype detection and annotation
A QTL-seq approach was used to identify the QTLs for RRS (Figure S1) (Takagi et al., 2013). The quality of re-sequenced raw reads from the four libraries was checked. Low-quality reads (those with a proportion of uncalled bases >5%) and adapter sequences were culled. High-quality reads (those with more than 95% nucleotide base calls and high Phred quality scores) were aligned and mapped to the reference genome using the BWA software package (http://bio-bwa.sourceforge.net/) with the default parameters (Li and Durbin, 2009). For further analysis, the genome sequences of allotetraploid progenitors of the cultivated peanut Arachis hypogaea (Shitouqi) were downloaded from the Peanut Genome Resource website (http://peanutgr.fafu.edu.cn/) and used as the reference sequences. Duplicated reads were identified and filtered using Picard (http://broadinstitute.github.io/picard/) after mapping the clean reads to the reference genome. To determine the locations and effects of the SNP/InDel variants, we detected and filtered variants in the four libraries using the Genome Analysis Toolkit (GATK, https://software.broadinstitute.org/gatk/) (Cingolani et al., 2012) and annotated using SnpEff software (V.5.0e; https://pcingola.github.io/SnpEff/) (Reumers et al., 2012).
2.5 Identification of candidate genomic regions
To identify the candidate genomic regions associated with RRS, we further filtered high-quality reads from S-bulk and R-bulk libraries by removing unpaired reads. To equalize the number of reads from each bulk, the filtered reads of the R-bulk were randomly reduced to the same number of the filtered reads of the S-bulk. During the analysis, the SNP sites with genotypes that differed between the two bulks were used to calculate both the sequencing depth of each base in the different bulks and the Euclidean Distance (ED) value of each site. To eliminate the background noise, the original ED value was processed by power. In this study, the fifth power of the original ED was taken as the correlation value to eliminate the background noise. Then the distance method was used to fit the ED value. For every SNP and InDel in each bulk, ED values were calculated with the formula:
Each A, G, C, and T letter represented the frequency of its corresponding DNA nucleotide in the resistant and susceptible bulks. The higher the ED value, the stronger the association between the variant with the target characteristic.
The SNP index value was calculated as follows:
ΔSNP-index = SNP-index (aa)- SNP-index (ab)
ΔSNP-index was calculated by subtracting the SNP-index of the R-bulk from the SNP-index of the S-bulk. SNP-index plots were generated using sliding window analysis with a window size of 2 Mb and increments of 50 Kb. The SNPs with SNP-index <0.3 or read depth<10 in both bulks were culled (Supplementary Figure 1). The SNP index of remaining SNPs as calculated from each bulk was physically plotted onto the 20 cultivated peanut chromosomes. ΔSNP index was calculated by subtracting the SNP index of the resistant bulk from the SNP index of the susceptible bulk. Notably, only those SNPs that had homozygous alleles in both bulks were selected for ΔSNP index calculation. Furthermore, SNP positions were considered as the causal SNPs responsible for the trait of interest if they passed the criterion ΔSNP index = -1. ΔSNP index = -1 indicated that the allele called in resistant bulk was the same as that of the resistant parent while an alternate base was called in susceptible bulk (Supplementary Figure 3). This analysis was also used in the InDel correlation analysis (Supplementary Figure 4). The DISTANCE method was used to fit ΔSNP-indexes and ED values, and the regions above the correlation threshold value (add value) were selected as those related to traits.
The candidate genomic regions related to RRS had the following significant ΔSNP/InDel index requirements: ΔSNP/InDel index significantly deviated from the statistical confidence intervals under the null hypothesis of no QTLs at a P < 0.01 level, and SNP/InDel-index significantly deviated from 0.5 in both bulks. Moreover, the ED values for SNP and InDel were remarkably higher than 0.29 and 0.28, respectively. Finally, the two sets of genomic regions identified from the S-bulk and R-bulk assemblies were combined and considered the genomic regions associated with RRS.
2.6 Diagnostic marker development and validation
To validate the identified genomic regions for RRS, SNPs with different alleles in both bulks and near the intersection terminal were identified and a special marker was developed to narrow the candidate region. For the RIL lines under R. solanacearum treatments and with the highest and lowest DI values, we randomly selected 18 of each of these two groups, then extracted DNA from them as well as the parents and the other selected samples. The total volume for the PCR reaction was 20 μl, comprising DNA template: 50 ng, 2×PCR Master Mix: 5 μl, forward primer: 10 μM, and reverse primer: 10 μM. The PCR cycling conditions were as follows: 94°C, 3 min; 30–35 cycles of 94°C, 30 s; 56°C, 30 s; 72°C, 30 s; final extension at 72°C, 10 min. After PCR amplification, the targeted amplicons were identified via 1.2% agarose gel electrophoresis.
3 Results
3.1 Phenotype diversity and construction of extreme RRS bulks
To investigate variation in RRS levels of cultivated peanuts, we utilized the resistant “Yueyou 92” (RP) and susceptible “Xinhuixiaoli” (SP) varieties as parents to create multiple generations of segregating RILs populations (Figure 1A). The resistance rate was evaluated based on the severity of R. solanacearum infections in RILs, which was calculated as a disease index (DI). The DI value of Yueyou 92 was significantly lower than that of Xinhuixiaoli in three consecutive crop seasons (Figure 1A and Supplementary Table 1). The RILs population had a wide segregation of phenotype variations that formed two peaks of resistance distributions, displaying the main QTLs for RRS regulation (Figure 1B and Supplementary Table 1). Based on the mean values of the disease index in the three field environments, the 30 RILs with the lowest disease index (10.22–20.00%) and the 30 RILs with the highest index (81.68–92.79%) were selected for construction of the resistant (R-bulk) and susceptible bulks (S-bulk) respectively (Figure 1D and Supplementary Table 1). Furthermore, phenotypic identification of R- and S-bulk resistance in the greenhouse was like that in the field environment (Supplementary Figure 1).
3.2 Genome sequencing and SNP/InDel discovery and evaluation
Whole genome sequencing of the parents and the bulks DNA samples was performed on the Illumina HiSeq platform. A total of 114.67 and 103.10 Gb reads were generated for Yueyou 92 and Xinhuixiaoli, and 108.38 and 96.92 Gb for R-bulk and S-bulk respectively. Approximately 97.69% of the reads correctly mapped to the cultivated peanut cv. Shitouqi reference genome (Table 1). An average coverage depth of 42× and 37× of the reference genome was achieved by Yueyou 92 and Xinhuixiaoli reads respectively, and 38× and 34× depth for the R-bulk and S-bulk, respectively (Table 1). The mapping results showed that the genome was evenly covered, indicating that the sequencing randomness was good (Supplementary Figure 2).
Table 1 Summary of whole genome re-sequencing of parents and bulk lines for bacterial wilt resistance.
SNPs/InDels were detected and extracted by the GATK software package. A total of 585,258 SNPs and 167,249 InDels were detected between two parents and 126,900 SNPs and 46,013 InDels were detected between the extreme pools, respectively. The occurrence of the SNPs was 3.5 times more than that of the InDels (Supplementary Table 2; Supplementary Figure 3). After filtering, 381,642 and 98,918 high-quality and homozygous SNP and InDel sites were respectively obtained (Supplementary Table S3). Based on the annotations, 72.7% and 55.4% of the SNPs and InDels, respectively, were in the intergenic region between the extreme pools. Approximately 15% of SNPs and 25% of InDels were upstream and downstream of genes, ~10% of variants in introns, and only ~3% of SNPs and 2.6% of InDels were in the coding region of the two bulks. About 34.6% and 54.7% of the SNPs in the CDS region caused synonymous and nonsynonymous coding variants, respectively. Similarly, Approximately 22.0% of the InDels in the CDS region caused frameshift variants (Supplementary Tables 2, 3).
3.3 Candidate genomic regions for RRS
Using the genome sequences of Arachis hypogaea (Shitouqi) as reference, the Euclidean distance (ED) and SNP index, including the ΔSNP-index, were calculated for each genome-wide high-quality SNPs, from RP and SP (Figure 2; Supplementary Figure 6; Supplementary Figure 8). Then, candidate genomic regions for RRS were identified based on ED and ΔSNP-index plots through sliding window analysis of deviations from the threshold value at a 99% confidence level. By using an ED association algorithm, a major peak on Chr12 was identified for RRS, spanning 0–15.19 Mb with an ED > 0.29 (P<0.01) for the SNP. A 6.40 Mb (0.77–7.17 Mb) interval on Chr02 was also identified. By SNP-index and ΔSNP-index, only a genomic interval of 5.83 Mb (4.16–9.99 Mb) on Chr12 deviated from the threshold with the confidence level of P<0.01 (Figure 2; Supplementary Figure 7; Supplementary Figure 9), indicating the interval on Chr12 as the main region controlling the RRS. Moreover, the ED and InDel-indexes (referring to principles of ΔSNP-index) for each identified genomic InDel were calculated for RP and SP. The regions of similarity were confirmed at intervals of 0-7.0 Mb and 0-15 Mb on Chr02 and Chr12, respectively, for ED mapping and 7.49–9.99 Mb on Chr12 for InDel-index association (Supplementary Figures 6-9). Once more, the candidate region on Chr12 was robust with a P<0.01 confidence level for both methods. As SNP-indexes enabled fine mapping, the 7.2 Mb (1.8–9.0 Mb) and 5.83 Mb (4.16–9.99 Mb) intervals on Chr12 were collectively identified as candidate region associated with RRS, at 95% and 99% confidence levels, respectively (Figure 3).
Figure 2 Euclidean distance (ED) value distribution of SNPs/InDels and SNP/InDel-index of R- and S-bulks and Δ(SNP/InDel-index) plots generated by sliding-window analyses of 20 cultivated peanut chromosomes. (A, B) Euclidean distance (ED) value distribution of SNPs and InDels in 20 chromosomes. The x-axis represents the chromosome name, the colored dots represent ED values, the black lines represent the fitted ED values (with 2Mb windows sliding in 10 kb steps), and the red dotted lines represent associated thresholds. (C, D) SNP/InDel-index of R- and S-bulks and Δ(SNP/InDel-index) plots generated by sliding-window analysis of cultivated peanut chromosomes. The physical positions of chromosomes are displayed on the X-axis and the average SNP/InDel-index in each 2-Mb physical interval with a 10-kb sliding window is displayed on the Y-axis. Two candidate genomic regions (marked in yellow) were defined using the criteria: average SNP/InDel-index > 0.9 in the R-bulks and average P < 0.05. The red, blue, and green lines represent the thresholds at confidence levels of 0.99, 0.95, and 0.90, respectively.
3.4 Genetic confirmation of candidate genomic region
To confirm the candidate genomic regions associated with RRS by the QTL-seq approach, we remapped the linkage group (LG) of the existing genetic map to the previously published and newly developed SNP markers. The QTL map had two QTLs located in LG1 (ChrB02) and LG10 in F2, which explained 21% and 12% of phenotype variations, and one QTL with two adjoining peaks in LG1 (ChrB02) in F8 (Zhao et al., 2016). The QTL on ChrB02 was located between SNP markers SNP79 and SNP129 in LG1, for which the LOD value was 3.91 and over 6.22, respectively (Zhao et al., 2016). We remapped the SNP markers to the cultivated peanut reference genome. The SNP79 and SNP129 markers were at 1.2 Mb and 9.2 Mb on Chr12, respectively, corroborating identified candidate genomic region through QTL-seq approach (Supplementary Figure 10). Recently, QTL analyses based on SLAF-seq were conducted to detect the candidate QTL region that confers RRS, and the concomitant genotyping and phenotyping data was used for mapping. This resulted in the identification of a consistent region between the SNP marker loci Marker7969064 and Marker7795914 (unpublished data), which explained 45% of the phenotype variations. Marker7969064 and Marke7795914 were located at 6.2 Mb and 8.7 Mb on Chr12, respectively (Supplementary Figure 10). The candidate genomic region associated with RRS as per QTL mapping corroborated that from the QTL-seq method. These results supported QTL-seq results, which revealed the candidate genomic region is associated with RRS.
3.5 Candidate genes associated with RRS
To narrow down the genomic regions and validate effective SNPs associated with RRS on Chr12, we selected a genomic region spanning 7.2 Mb on Chr12 and with 1807 effective SNPs and 629 InDels. Function annotation analysis of the 1807 SNPs revealed 503 intergenic SNPs; 461 intronic; 357 and 225 that were upstream and downstream of genes, respectively; two, six, and eight in 5’ UTR, 3’ UTR, and splice site regions, respectively; and 67 synonymous and 180 nonsynonymous (two resulted in stop codons) (Supplementary Table 4). Notably, 22 genes with nonsynonymous SNPs were predicted to encode for the NBS-LRR type disease resistance proteins, including AH12G01510, AH12G01540, AH12G01550, AH12G01560, AH12G01570, AH12G01600, AH12G01900, AH12G01920, AH12G01980, AH12G02020, AH12G02090, AH12G02120, AH12G02130, AH12G02310, AH12G02330, AH12G02370, AH12G02390, AH12G02410. AH12G02880, AH12G03230, AH12G03600 and AH12G06320 (Table 2). The AH12G01460 and AH12G06300 encode a receptor-like kinase protein and exocyst subunit Exo70 family protein B2 subunit respectively. AH12G03290 and AH12G05320 both encode Serine/threonine-protein phosphatase 7. The other putative candidate genes encoded various kinds of proteins (Table 3). Notably, eight of 22 candidate NBS-LRR resistant genes were identified with high confidence as important candidate genes with the ΔSNP values above 0.60 (Figure 4). Moreover, among the 629 InDels, 152 and 189 were in the intergenic and intronic regions, respectively, 146 and 114 were upstream and downstream of genes, respectively, five and four in 5’ UTR and 3’ UTR regions, respectively, nine and five resulted in frame shifts and codon changes respectively (Supplementary Table 5). The 180 nonsynonymous SNPs affected 75 putative candidate genes associated with RRS (Table 2), whereas 14 InDels affected 11 genes (Table 3). Among them, six in NBS-LRR genes AH12G01920, AH12G01980, AH12G02090, AH12G02390, AH12G02440, AH12G02600 affected the encoded functions as well as ΔSNP-index results (Table 3). Taken together, these results support the hypothesis that the six NBS-LRR resistance genes might act as the candidate genes related to RRS.
Table 2 Identification of SNPs in putative candidate genes in the genomic region for resistance to on chromosome 12.
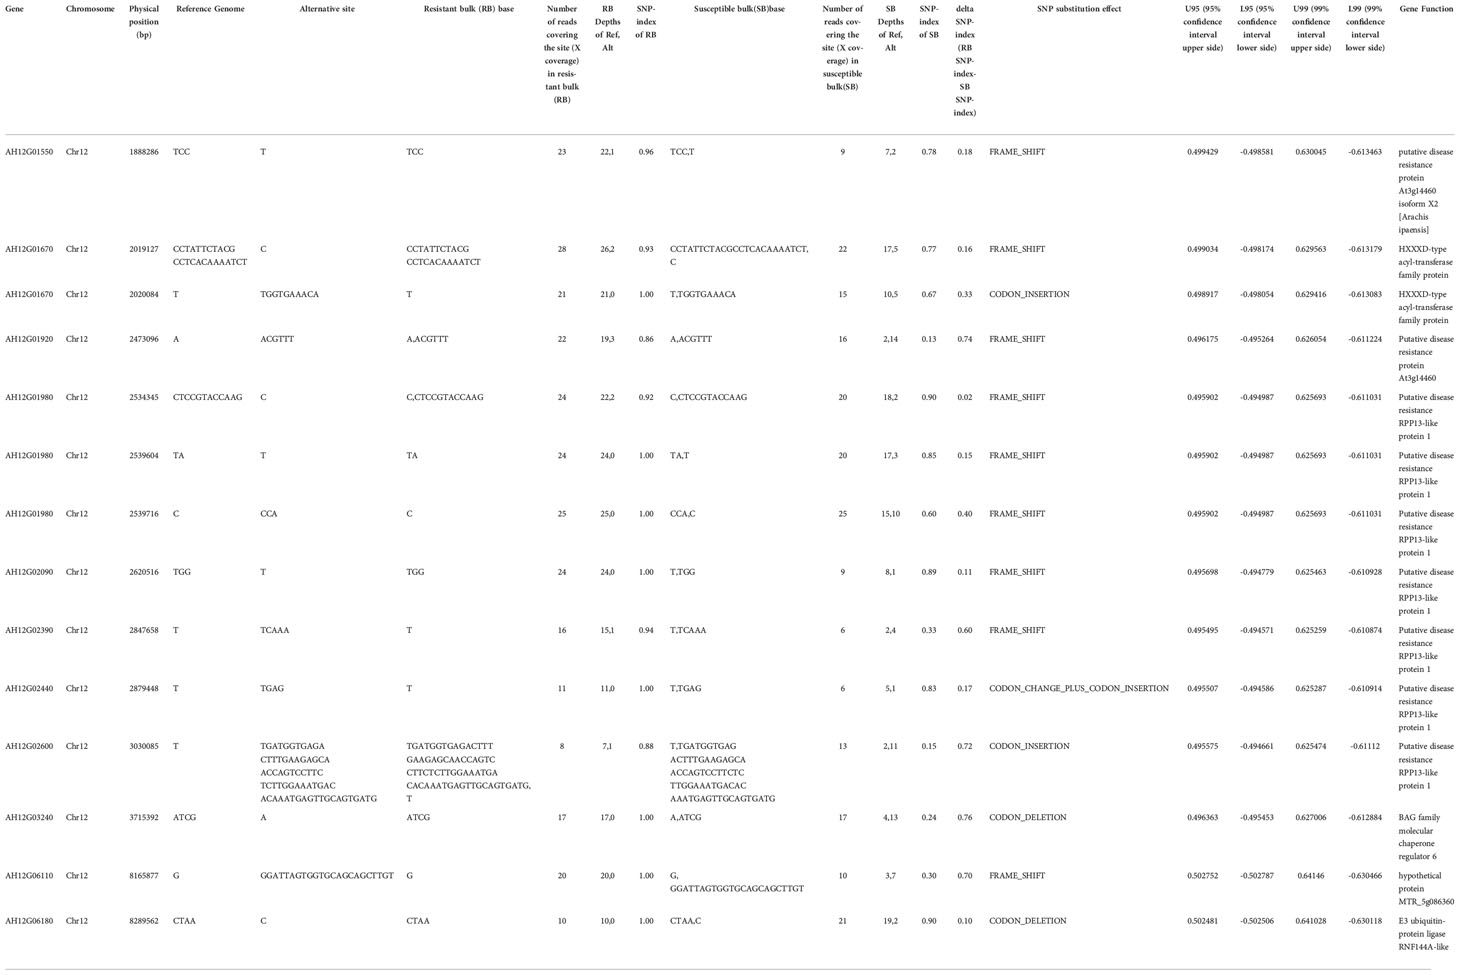
Table 3 Identification of InDels in putative candidate genes in the genomic region for resistance to on chromosome 12.
3.6 Allele-specific marker development and validation
To evaluate the specificity of the allele marker of the resistant and susceptible peanut cultivars, we targeted 44 SNPs from candidate NBS-LRR genes for RRS for the development of allele-specific markers (Supplementary Table 6). Allele-specific primers for 44 SNPs were successfully generated. All 44 allele-specific markers were checked for polymorphisms between parental genotypes of the RIL population (YY92 and XHXL). Of the 44 markers, 30 allele markers had good amplification, whereas 14 markers did not yield amplicons with clear bands from samples of parental genotypes. Of the 30 amplified markers, two markers (qRRS18 and qRRS19) in AH12G03230 and AH12G06320 genes co-segregated with RRS and may thus be deployed for RRS breeding (Figure 5). These two polymorphic markers were validated on a panel of diverse genotypes containing the resistant parent (Yueyou 92), 18 introgression-resistant RIL lines (YX131, YX189, YX284, YX303, YX636, YX712, YX759, YX905, YX962, YX540, YX544, YX793, YX802, YX875, R160, R201, R215 and R739), the susceptible parent (Xinhuixiaoli), and 18 susceptible RIL lines (YX32, YX68, YX160, YX211, YX293, YX554, YX622, YX840, YX178, R123, R592, YX57, YX80, YX95, YX299, YX469, YX707 and YX939). The primers for the diagnostic marker ‘qRRS18’ amplified a 302-bp fragment in the susceptible parent and different susceptible RIL lines, but none in the resistant genotypes (Figure 5A). In contrast, primers for another diagnostic marker ‘qRRS19’ amplified 217-bp fragment in the resistant genotypes and none in susceptible lines (Figure 5G). Most importantly, these two diagnostic markers (qRRS18 + qRRS19) could be further developed and used to distinguish between homozygotes and heterozygotes in the segregating population; i.e., susceptible lines will have a 302-bp allele from the marker ‘qRRS18’ and resistant lines will have a 217-bp allele from the marker ‘qRRS19’. These two markers can be used as diagnostic marks for breeding resistant bacterial wilt varieties via MAS approach.
4 Discussion
With the advent of complete genome sequencing of diploid progenitor species and cultivated tetraploid variants, the QTL-seq approach is an increasingly popular sequencing-based method for the identification of candidate genomic regions associated with target traits in peanut (Varshney et al., 2019; Pandey et al., 2020). As it only requires whole genome sequences of parents and extreme trait bulks from the mapping population, it is economical, efficient, fast, and cost-effective (Takagi et al., 2013). Traditional QTL mapping methods are limited in the fine mapping of target genes and QTLs because they lack both high-density genetic maps and a series of near-isogenic lines (Pandey et al., 2017). Despite not having a large segregation population as a prerequisite, the QTL-seq approach was successful in identifying candidate genes for many crop traits (Das et al., 2014; Lu et al., 2014; Illa et al., 2015; Singh et al., 2016; Wang et al., 2016; Pandey et al., 2017; Srivastava et al., 2017; Chen et al., 2018; Clevenger et al., 2018; Luo et al., 2019; Bommisetty et al., 2020; Kumar et al., 2020; Lei et al., 2020; Tudor et al., 2020; Zhao et al., 2020; Cao et al., 2021; Dong et al., 2021; Topcu et al., 2021; Wang et al., 2021; Yang et al., 2021; Zhang et al., 2021). In the present study, a QTL-seq approach was successfully applied to identify genomic regions and candidate genes for RRS using resequencing data of both parental genotypes and pooled samples of the RIL population (Yueyou 92×Xinhuixiaoli) (Supplementary Figure 1), which corroborated our previously reported QTL mapping findings (Zhao et al., 2016).
The use of a common reference genome that is associated with deep sequencing and large bulks should result in highly accurate maps. As per the original QTL-seq approach (Takagi et al., 2013), the genome assemblies of either one or both parents were used as reference to analyze the SNP variants in the two extreme bulks based on diploid reference genomes due to the unavailability of the cultivated peanut genome (Pandey et al., 2017; Luo et al., 2019; Kumar et al., 2020; Chen et al., 2021). Candidate genomic regions were then associated with target traits by the ΔSNP index method (Takagi et al., 2013). The choice of the parental reference genome possibly affects this association of candidate genomic regions due to differing levels of alignment errors (Luo et al., 2019). Moreover, the algorithm uses the reference genomes to replace the parental genomes in bigger diversity areas, which may cause erroneous assemblies of the parent genomes, especially for wild diploid ancestors (unpublished data). To increase the reliability of identified genomic regions and candidate genes, we used the Arachis hypogaea Shitouqi genome as a reference. Shitouqi (A. h. fastigiata var. vulgaris), belongs to the subsp. fastigiata, as does the parents of the population, and its high-quality genome sequence was recently reported (Zhuang et al., 2019). Based on a large RIL population of 581 individual lines from the cross of resistant YY92 and susceptible Xinhuixiaoli, 30 resistant and 30 susceptible lines were selected to respectively construct the extreme R and S-bulks (Figure 1 and Supplementary Table 1). We generated 108.38 and 96.92 Gb of sequence reads at a sequencing depth of 38× and 34× for the R- and S-bulks, respectively (Table 1). Nearly 98% of these reads were correctly mapped onto the reference genome. High densities of homozygous SNPs (381,642) and InDels (98,918) between parents were identified by resequencing for RRS mapping (Supplementary Tables 2, 3). The candidate region of 5.73 Mb on Chr12 was identified by combining the ED and ΔSNP/InDel index algorithms for both SNPs and InDels (Figures 2, 5; Table 2; Supplementary Tables 2, 3) at a P<0.01 confidence level. These aided the precise and accurate discovery of candidate genomic regions, genes, and SNPs/Indels markers associated with RRS.
The clear extreme phenotypic differences between parents as well as those of the pooled population were the crucial prerequisite for candidate gene mapping via the QTL-seq approach (Zhao et al., 2020; Chen et al., 2021). An R2R3-MYB transcription factor gene named AhTc1 was mapped and characterized as associated with purple testa via the QTL-seq approach. Allele-specific markers were developed, which demonstrated that the marker pTesta1089 was closely linked with purple testa (Zhao et al., 2020). Chen et al. identified AhRt1 bHLH transcriptional factor as the candidate gene that regulates the red testa color of peanut via QTL-sequencing analyses. An AhRt1 diagnostic marker was then developed for validating and distinguishing different populations and peanut varieties (Chen et al., 2021). The phenotype evaluation of plant disease resistance traits is a challenge for map-based gene cloning. Unlike the testa color phenotype, disease resistance traits are complicated and affected by the environment, especially those for resistance to peanut bacterial wilt. As usual, the identification method in the disease nursery was used for the resistant evaluation. The survival rate was calculated from the number of dead plants until the point of harvesting for QTL mapping of BWR (Luo et al., 2019). However, the natural identification method was affected by the temperature, the soil environment, and anthropogenic effects. In our previous study, artificial inoculation by the leaf-cutting method was successfully used to evaluate the resistance to bacterial wilt via high throughput sequencing for QTL mapping of the cultivated peanut (Zhao et al., 2016). The resistance phenotyping in this study validated the accuracy of our previous findings (Zhao et al., 2016). The disease symptoms were classified into six disease severity ratings, and the resistance level of different lines was calculated by the disease index (Figure 1 and Supplementary Table 1). The phenotype of different lines was truly reflective of the disease resistance as per the DI method and the candidate genomic region was then accurately identified by the QTL-seq approach (Figure 2 and Supplementary Figures 6-9). This method is clearly valuable in the phenotyping of RRS for large populations in a cost-effective and practicable manner.
Hitherto, the main stable QTLs of RRS in the peanut were successfully identified through the original QTL method and QTL-seq approach (Luo et al., 2020). We previously reported SSR and SNP marker-based genetic linkage maps obtained through the classical QTL mapping (Zhao et al., 2016). Two major QTLs (qBW-1 and qBW-2) were identified for RRS, which were in the LG1 and LG10 linkage groups based on RAD- and BSA-seq techniques in F2 plants. One QTL linked to two QTL peaks on ChrB02 was identified in an F8 RIL population (Zhao et al., 2016). Luo et al. reported one QTL named qBWRB02.1 that possibly spanned a 5.14 Mb (0.81–5.95 Mb) interval on chromosome B02 based on its flanking SSR markers (Luo et al., 2020). Via the QTL-seq approach, they then identified a 2.07 Mb genomic region on ChrB02 associated with RRS across three environments (Luo et al., 2020). Two adjacent genomic regions (2.81–4.24 Mb and 6.54–8.75 Mb) on chromosome B02 were identified within the confidential interval of qBWRB02-1 and thus designated as qBWRB02-1-1 and qBWRB02-1-2 based on two diploids reference genomes (Luo et al., 2019). In the present study, by using the QTL-seq approach (Supplementary Figure 1), a major peak on Chr12 spanning a 7.2 Mb (1.8–9.0 Mb) interval with a confidence level of P<0.05, 5.73 Mb of this peak had a confidence level of P<0.01 was identified as the candidate genomic region for RRS, corroborating RAD-seq findings (Zhao et al., 2016) and SLAF-seq techniques (Figure 3 and Supplementary Figure 10, unpublished). These revealed the precise identification of the candidate genomic region via the QTL-seq approach. In China, peanut cultivars that are resistant to bacterial wilt, originate from Xiekangqing, Taishan Zhenzhu, and the wildtype species (A.diogoi). Two major QTLs that were both named qBWRB02.1, were identified from the cross of Yuanza 9102 × Xuzhou 68-4. Yuanza 9102 is a popular resistant cultivar whose resistance stemmed from A.diogoi (Luo et al., 2020). Two major QTLs, qBWRB02-1-1 and qBWRB02-1-2, were fine-mapped from the cross of Zhonghua 6 × Xuhua 13. The resistance phenotype of Zhonghua 6 stemmed from the Chinese landrace Taishan Zhenzhu (Luo et al., 2019) whereas that of Yueyou92 stemmed from the Chinese landrace Xiekangqing, which is the parental type for many RRS breeding programs in South China (Janila et al., 2016; Luo et al., 2020). These candidate genomic regions associated with RRS were also mapped onto an interval of 10 Mb on chromosome 12.
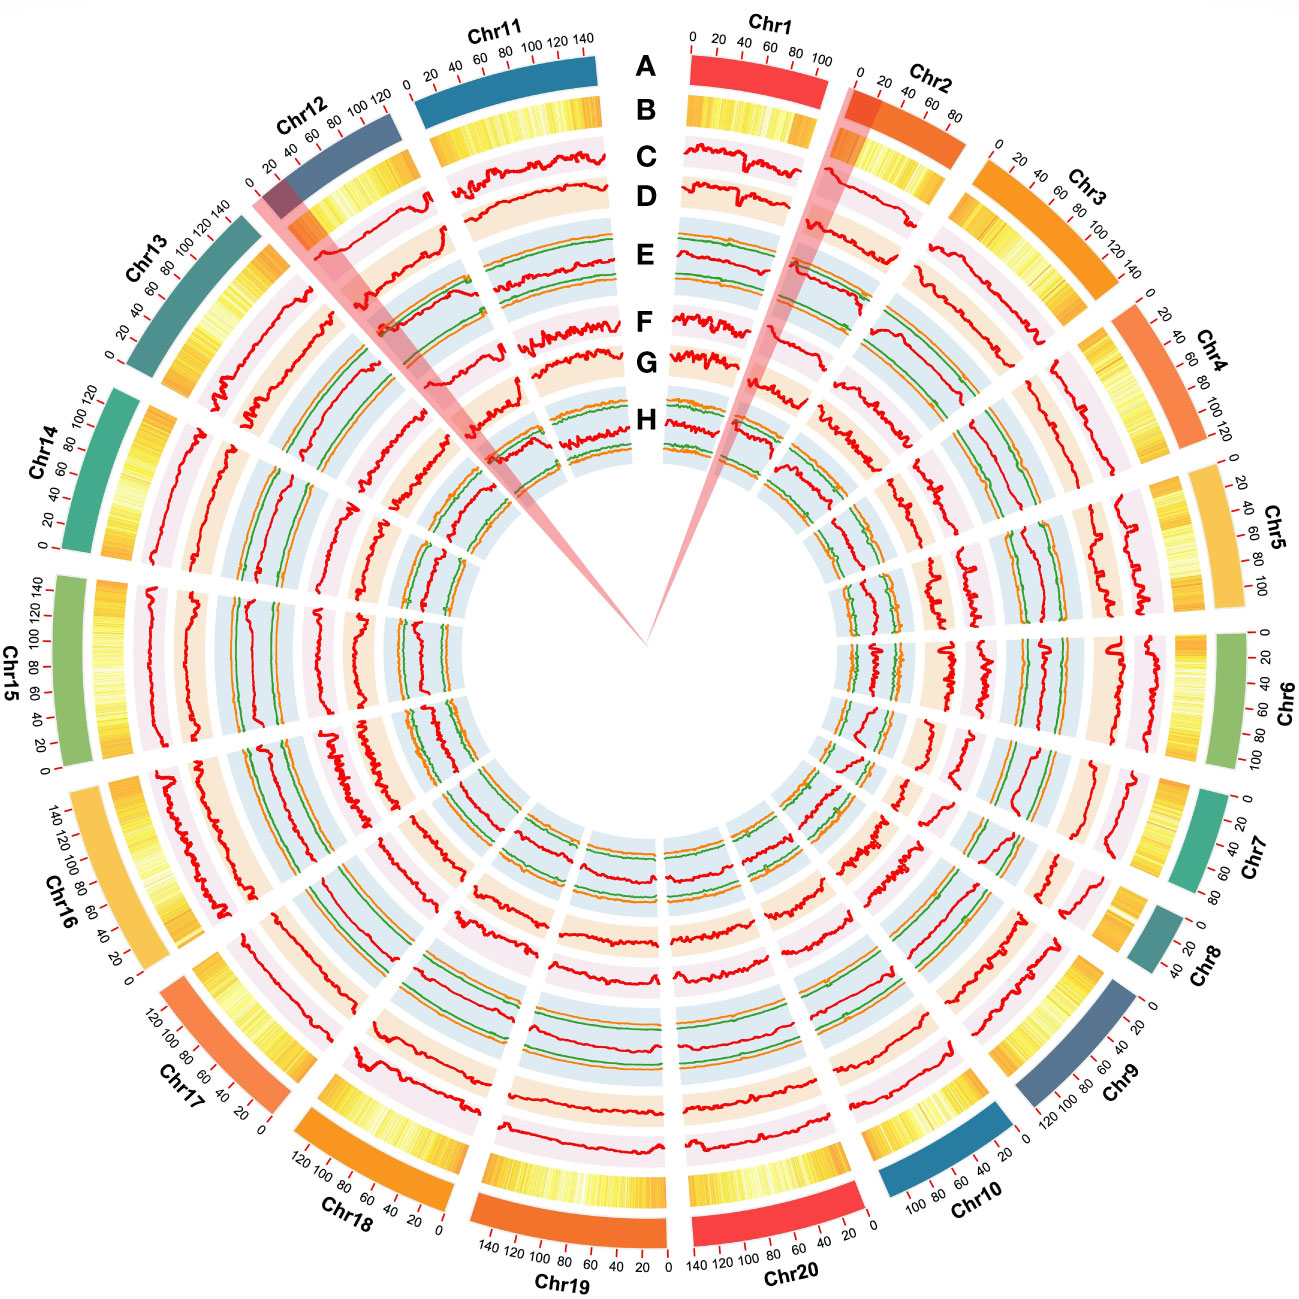
Figure 3 Genome-wide summary of the putative genomic regions associated with resistance to Ralstonia solanacearum infections. (A) Chromosomes of the cultivated peanut reference genome. (B) The genome-wide density of total genes. (C, D) Plots of SNP-index of R- and S-bulks generated by sliding-window analyses of cultivated peanut chromosomes. (E) ΔSNP-index plot generated by using the Shitouqi assembly as a reference genome. Label definitions from outside to inside: upper probability values at 99% (orange) and 95% (green) confidence levels. ΔSNP-index, lower probability values at 95% (green), and 99% (orange) confidence levels. (F, G) InDel-index of R- and S-bulks plots generated by sliding-window analyses of cultivated peanut chromosomes. (H) ΔInDel-index plot generated by using the Shitouqi assembly as a reference genome. Label definitions from outside to inside: upper probability values at 99% (orange) and 95% (green) confidence levels. ΔSNP-index, lower probability values at 95% (green) and 99% (orange) confidence levels.
QTL-seq approach was demonstrated as an effective method for the identification of putative SNPs associated with RRS. These could be developed into allele markers by using either different genotypes or diagnostic markers after the validation (Luo et al., 2019). Allele-specific markers that can be identified via agarose gel electrophoresis are the most cost-effective assays for genotyping a breeding population to select plants with the desired allele (Pandey et al., 2017). Here, 1807 effective SNPs and 629 InDels were identified. They span a 7.2 Mb genomic region on chromosome 12 that is associated with RRS. A total of 180 nonsynonymous SNPs and 14 InDels respectively affected 75 and 11 candidate genes that encode RRS (Tables 2, 3, Supplementary Tables 4 and 5). The putative RRS-encoding NBS-LRR gene had 44 SNPs, which were targeted for the development of allele-specific markers. Despite designing primers for both alleles of each SNP, amplification of markers was often observed for only one of the allele pairs. Nonamplification of a few markers may be due to DNA template-primer mismatches (You et al., 2008; Pandey et al., 2017). In this study, polymorphic SNP markers were selected as diagnostic markers. Of the 30 amplified markers, two markers (qRRS18 and qRRS19) were robust and co-segregated with RRS (Figure 5). These two polymorphic markers were then validated on a panel of diverse genotypes containing naturally resistant parental types (Yueyou 92) of the RIL population, 18 introgression lines, susceptible parental types (Xinhuixiaoli), and 18 susceptible RIL lines. The ‘qRRS18’ marker amplified susceptible alleles, whereas the ‘qRRS19’ marker amplified resistant alleles. Thus, these diagnostic allele markers can be applied in MAS for RRS in peanut breeding programs.
In plants, R genes play an important role in defending against pathogens through activation of the innate immune system (Jones and Dangl, 2006; Zhang et al., 2017; Sun et al., 2020; Chang et al., 2022). Most of them belong to the NBS-LRR type, which has been identified in many crops by map-based cloning (Takken and Joosten, 2000; Hulbert et al., 2001; McDowell and Woffenden, 2003; Meyers et al., 2005). The function of the NBS-LRR genes was correlated with either protein length or SNP variants. RRS1-R was the first reported Tir-NBS-LRR gene that conferred resistance to bacterial wilt in Arabidopsis species (Deslandes et al., 2003). RRS1-S, the allele of RRS1-R found in susceptible species, encode a protein without the WRKY domain. The two genes encoded contrasting phenotypes after R. solanacearum infections (Deslandes et al., 1998; Deslandes et al., 2003). Deng et al. identified an NBS-LRR gene named PigmR. It conferred resistance to the fungus Magnaporthe oryzae in rice and its encoded protein lacked four amino acids in the leucine-rich repeat (LRR) domain when compared to the R4 gene that conferred a susceptible phenotype (Deng et al., 2017). In the present study, the predicted products of 22 of the 180 candidate genes with nonsynonymous mutations in the 7.2 Mb region, were NBS-LRR type disease resistance proteins (Table 2 and Figure 4). Notably, eight of the 22 candidate NBS-LRR genes were identified at a high confidence level as associated with RRS (Figure 4). Moreover, seven NBS-LRR genes had SNP variant sites in the LRR domain (Figure 4). The diagnostic SNP markers (qRRS18 and qRRS19) of the candidate AH12G03230 and AH12G06320 NBS-LRR genes were validated in the RIL lines (Figure 5). This indicates that AH12G03230 and AH12G06320 might be the candidate resistant genes for RRS in cultivated peanut. Therefore, based on these findings, these putative resistance genes possibly significantly contribute to RRS in peanut and should thus be targeted as candidates for fine mapping and function validation.
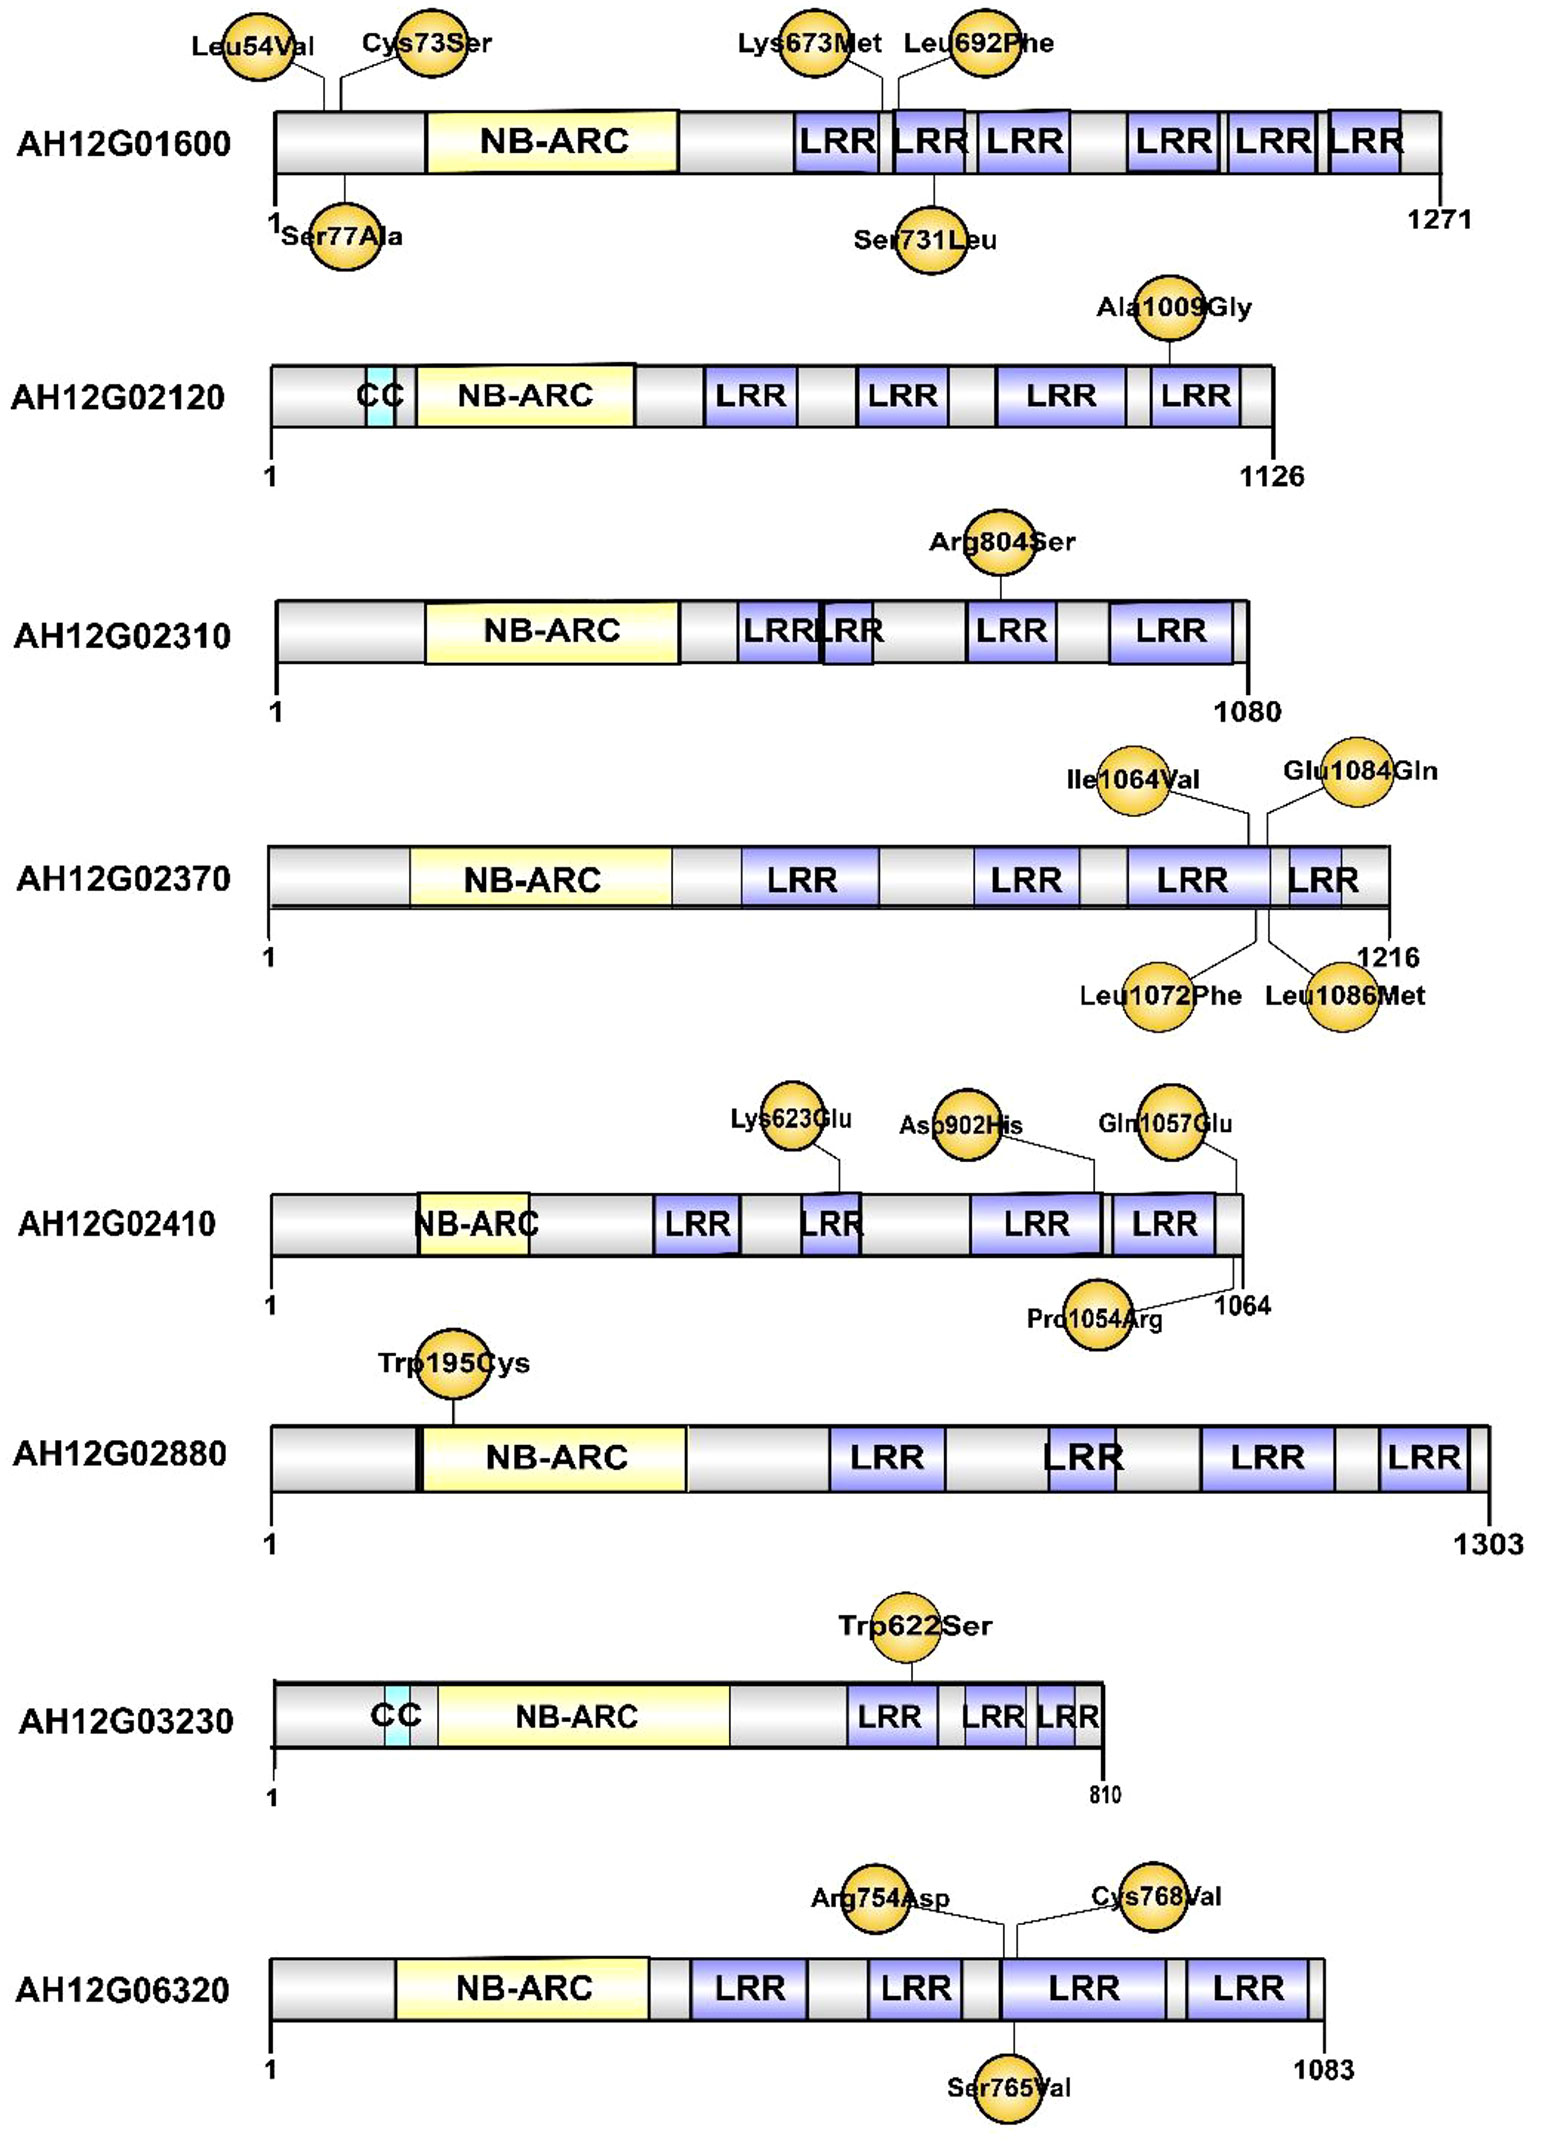
Figure 4 The putative resistance-related proteins associated with resistance to Ralstonia solanacearum infections. CC: Coil coiled. NB-ARC: Nucleotide-binding adapter shared by APAF-1 R proteins and CED-4. LRR: Leucine-rich repeat domain. The positions of amino acid changes caused by nonsynonymous SNPs are shown in yellow.
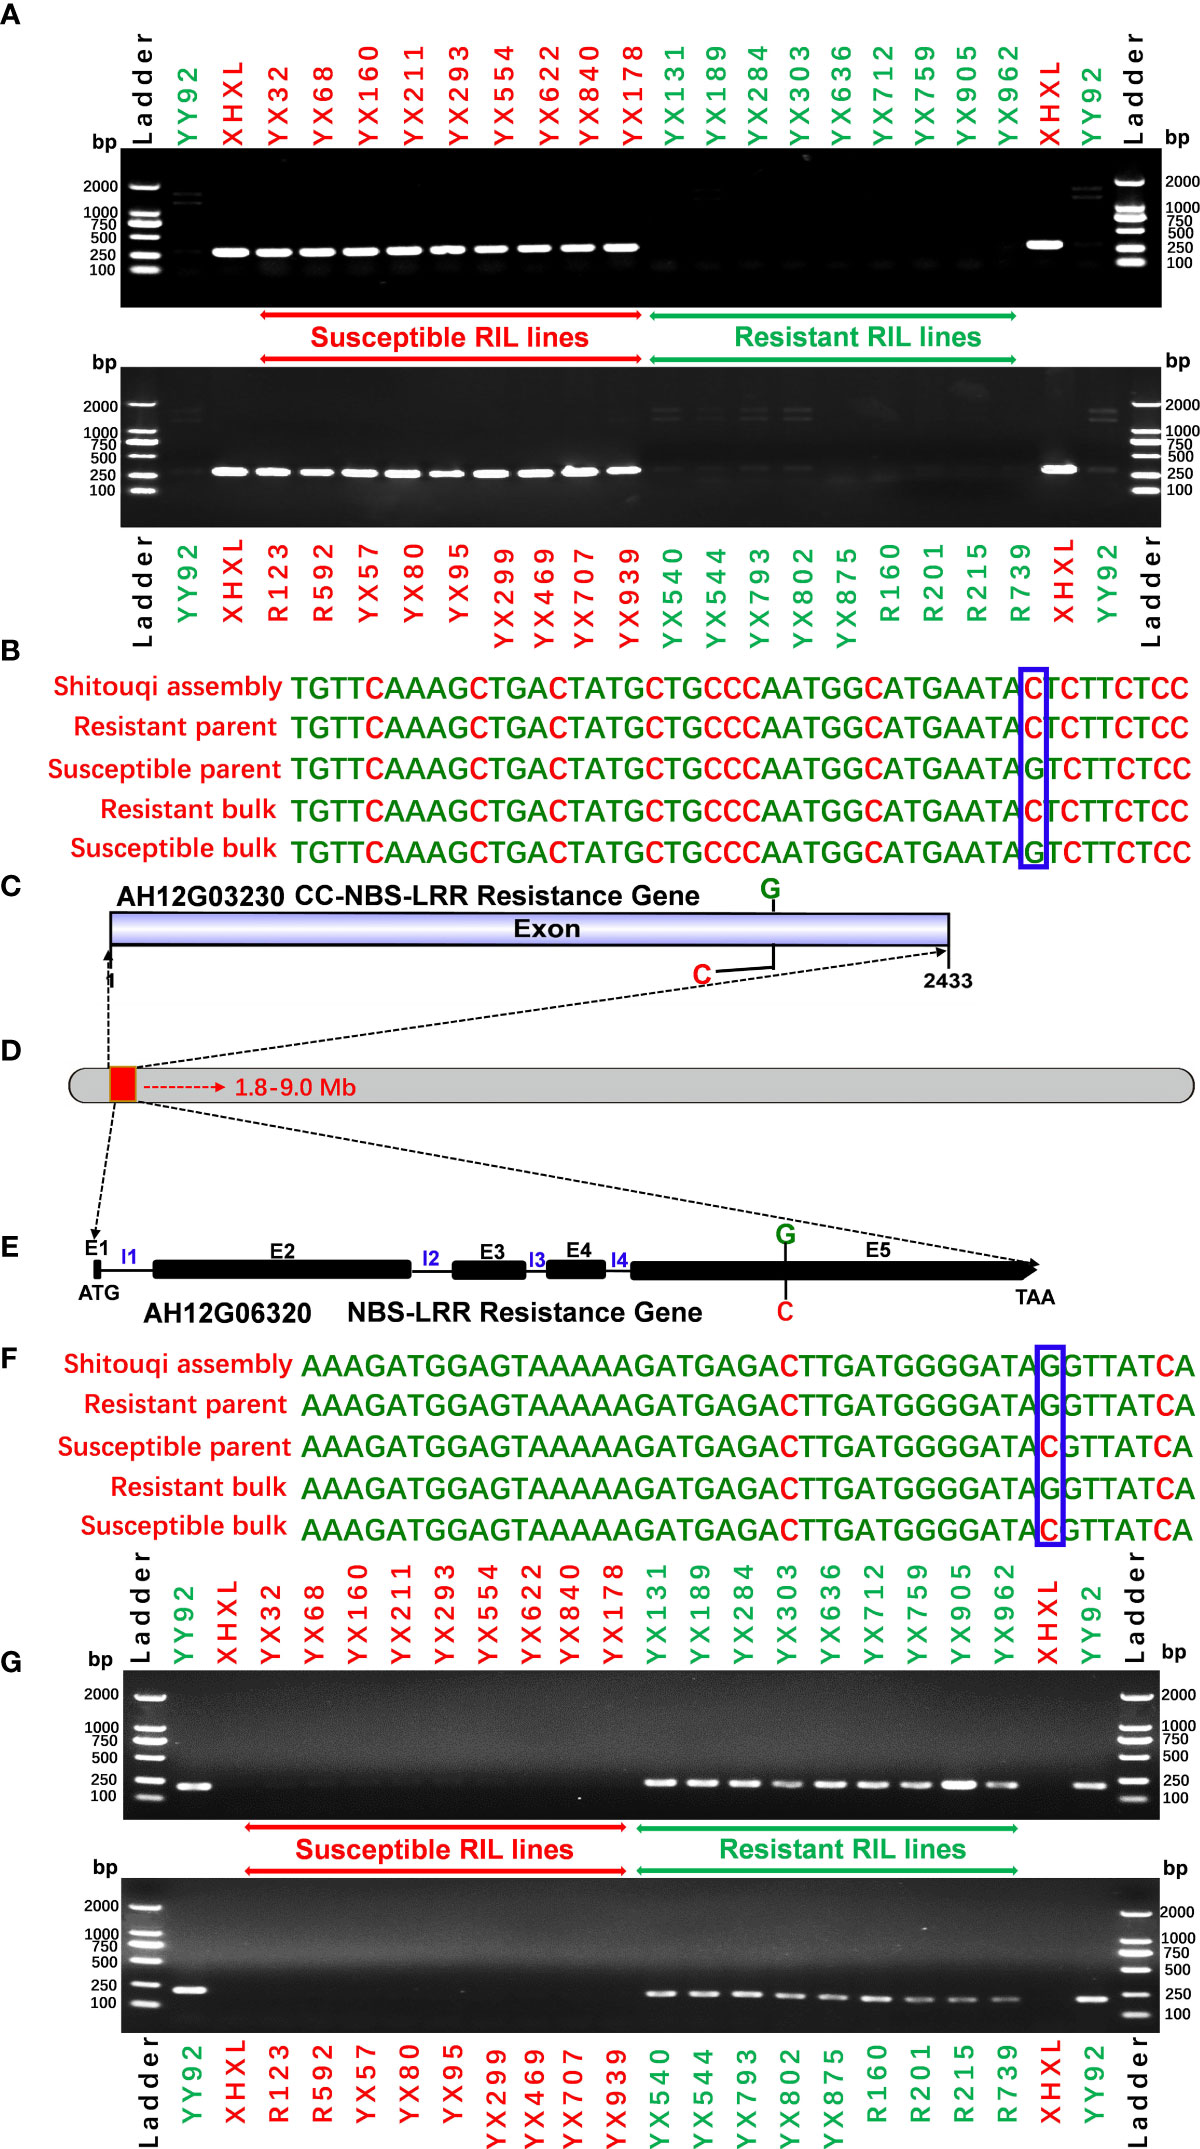
Figure 5 Validation of putative candidate gene-based markers of bacterial wilt resistance. (A) The SNP marker validation of candidate gene AH12G03230 using a validation set comprising the resistant parent YY92, susceptible parent XHXL, and susceptible and resistant RIL lines). (B) SNP variation in the AH12G03230 gene. (C)The AH12G03230 gene is predicted to encode the CC-NBS-LRR resistance protein. (D) Putative genomic region on Chromosome 12 of Arachis hypogaea that encodes resistance to Ralstonia solanacearum infections (E) The AH12G06320 gene is predicted to encode the NBS-LRR resistant protein (E1 to E5 refer to exon numbers while I1 to I4 refer to intron numbers), (F) SNP variation in the AH12G06000 gene and (G) marker validation on a validation set comprising resistant parent YY92, susceptible parent XHXL, susceptible RIL lines (YX32, YX68, YX160, YX211, YX293, YX554, YX622, YX840 and YX178, R123, R592, YX57, YX80, YX95, YX299, YX469, YX707 andYX939), and resistant RIL lines (YX131, YX189, YX284, YX303, YX636, YX712, YX759, YX905, YX962, YX540, YX544, YX793, YX802, YX875, R160, R201, R215 and R739).
5 Conclusion
In this study, the QTL-seq approach was proven as a powerful method for the successful identification of genomic regions and candidate genes of major and robust QTLs that are associated with RRS. We not only identified a 7.2 Mb genomic region on chromosome 12 containing eight candidate NBS-LRR resistance genes but also availed validated allele-specific diagnostic markers and key candidate genes for RRS breeding. The genomic information (genes) and tools (markers) could be used in genomics-assisted breeding programs to accelerate the development of peanut varieties with enhanced RRS as well as to increase insights into RRS molecular mechanisms.
Data availability statement
The original contributions presented in the study are publicly available. This data can be found here: NCBI, PRJNA851221.
Author contributions
WZ and RV conceived the original research plan and designed the experiment. CZ, WX, HF, YC, HC, TC, QY, YZ, KC, and XZ performed the experiments and analyzed the data. CZ and WX wrote the manuscript, while WZ, MP, and RV reviewed and edit the manuscript. All authors analyzed the data and approved the submitted version.
Funding
This work was supported by National Science Foundation (NSF) of China (Grant No. 32072103 and 31701463 to CZ, Grant No. U1705233 to WZ), the Science and Technology Foundation of Fujian Province of China (Grant No. 2018N0004 to CZ), the Opening Grant of Guangdong Province Key Laboratory of Plant Molecular Breeding (Grant No. GPKLPMB202203 to CZ), the Special Fund for Scientific and Technological Innovation of Fujian Agriculture and Forestry University (Grant No. KFb22011XA to CZ).
Acknowledgments
We would like to thank MogoEdit (https://www.mogoedit.com) for its English editing during the preparation of this manuscript.
Conflict of interest
The authors declare that the research was conducted in the absence of any commercial or financial relationships that could be construed as a potential conflict of interest.
Publisher’s note
All claims expressed in this article are solely those of the authors and do not necessarily represent those of their affiliated organizations, or those of the publisher, the editors and the reviewers. Any product that may be evaluated in this article, or claim that may be made by its manufacturer, is not guaranteed or endorsed by the publisher.
Supplementary material
The Supplementary Material for this article can be found online at: https://www.frontiersin.org/articles/10.3389/fpls.2022.1048168/full#supplementary-material
References
Arikit, S., Wanchana, S., Khanthong, S., Saensuk, C., Thianthavon, T., Vanavichit, A., et al. (2019). QTL-seq identifies cooked grain elongation QTLs near soluble starch synthase and starch branching enzymes in rice (Oryza sativa L.). Sci. Rep. 9, 1–10. doi: 10.1038/s41598-019-44856-2
Ben, C., Debellé, F., Berges, H., Bellec, A., Jardinaud, M.-F., Anson, P., et al. (2013). MtQRRS1, an R-locus required for Medicago truncatula quantitative resistance to Ralstonia solanacearum. New Phytol. 199, 758–772. doi: 10.1111/nph.12299
Bommisetty, R., Chakravartty, N., Bodanapu, R., Naik, J. B., Panda, S. K., Lekkala, S. P., et al. (2020). Discovery of genomic regions and candidate genes for grain weight employing next generation sequencing based QTL-seq approach in rice (Oryza sativa L.). mol. Biol. Rep. 47, 8615–8627. doi: 10.1007/s11033-020-05904-7
Cao, M., Li, S., Deng, Q., Wang, H., Yang, R. (2021). Identification of a major-effect QTL associated with pre-harvest sprouting in cucumber (Cucumis sativus L.) using the QTL-seq method. BMC Genomics 22, 1–11. doi: 10.1186/s12864-021-07548-8
Carmeille, A., Caranta, C., Dintinger, J., Prior, P., Luisetti, J., Besse, P. (2006). Identification of QTLs for Ralstonia solanacearum race 3-phylotype II resistance in tomato. theor. Appl. Genet. 113, 110–121. doi: 10.1007/s00122-006-0277-3
Chang, M., Chen, H., Liu, F., Fu, Z. Q. (2022). PTI and ETI: convergent pathways with diverse elicitors. Trends Plant Sci. 27, 113–115. doi: 10.1016/j.tplants.2021.11.013
Chen, H., Chen, X., Xu, R., Liu, W., Liu, N., Huang, L., et al. (2021). Fine-mapping and gene candidate analysis for AhRt1, a major dominant locus responsible for testa color in cultivated peanut. theor. Appl. Genet. 134, 3721–3730. doi: 10.1007/s00122-021-03924-w
Chen, Q., Song, J., Du, W. P., Xu, L. Y., Jiang, Y., Zhang, J., et al. (2018). Identification and genetic mapping for rht-DM, a dominant dwarfing gene in mutant semi-dwarf maize using QTL-seq approach. Genes Genomics 40, 1091–1099. doi: 10.1007/s13258-018-0716-y
Cingolani, P., Platts, A., Wang, L. L., Coon, M., Nguyen, T., Wang, L., et al. (2012). A program for annotating and predicting the effects of single nucleotide polymorphisms, SnpEff: SNPs in the genome of drosophila melanogaster strain w1118; iso-2; iso-3. Fly (Austin) 6, 80–92. doi: 10.4161/fly.19695
Clevenger, J., Chu, Y., Chavarro, C., Botton, S., Culbreath, A., Isleib, T. G., et al. (2018). Mapping late leaf spot resistance in peanut (Arachis hypogaea) using QTL-seq reveals markers for marker-assisted selection. front. Plant Sci. 9, 1–10. doi: 10.3389/fpls.2018.00083
Das, S., Upadhyaya, H. D., Bajaj, D., Kujur, A., Badoni, S., Gowda, C. L. L., et al. (2014). Deploying QTL-seq for rapid delineation of a potential candidate gene underlying major trait-associated QTL in chickpea. DNA Res. 22, 193–203. doi: 10.1093/dnares/dsv004
Deng, Y., Zhai, K., Xie, Z., Yang, D., Zhu, X., Liu, J., et al. (2017). Epigenetic regulation of antagonistic receptors confers rice blast resistance with yield balance. Science 355, 962–965. doi: 10.1126/science.aai8898
Deslandes, L., Olivier, J., Peeters, N., Feng, D. X., Khounlotham, M., Boucher, C., et al. (2003). Physical interaction between RRS1-R, a protein conferring resistance to bacterial wilt, and PopP2, a type III effector targeted to the plant nucleus. Proc. Natl. Acad. Sci. U.S.A. 100, 8024–8029. doi: 10.1073/pnas.1230660100
Deslandes, L., Pileur, F., Liaubet, L., Camut, S., Beynon, J., Arlat, M., et al. (1998). “Identification and mapping of RRS1, a single recessive locus in arabidopsis thaliana that confers resistance to Ralstonia solanacearum,” in Bacterial wilt disease Springer, Berlin, Heidelberg., 250–254. doi: 10.1007/978-3-662-03592-4_36
Dong, Z., Alam, M. K., Xie, M., Yang, L., Liu, J., Helal, M. M. U., et al. (2021). Mapping of a major QTL controlling plant height using a high-density genetic map and QTL-seq methods based on whole-genome resequencing in Brassica napus. G3 (Bethesda) 11, jkab118. doi: 10.1093/g3journal/jkab118
Du, H., Wen, C., Zhang, X., Xu, X., Yang, J., Chen, B., et al. (2019). Identification of a major QTL (qRRs-10.1) that confers resistance to Ralstonia solanacearum in pepper (Capsicum annuum) using SLAF-BSA and QTL mapping. int. J. Mol. Sci. 20, 5887. doi: 10.3390/ijms20235887
Genin, S., Boucher, C. (2004). Lessons learned from the genome analysis of Ralstonia solanacearum. Annu. Rev. Phytopathol. 42, 107–134. doi: 10.1146/annurev.phyto.42.011204.104301
Godiard, L., Sauviac, L., Torii, K. U., Grenon, O., Mangin, B., Grimsley, N. H., et al. (2003). ERECTA, an LRR receptor-like kinase protein controlling development pleiotropically affects resistance to bacterial wilt. Plant J. 36, 353–365. doi: 10.1046/j.1365-313X.2003.01877.x
Habe, I., Miyatake, K., Nunome, T., Yamasaki, M., Hayashi, T. (2019). QTL analysis of resistance to bacterial wilt caused by Ralstonia solanacearum in potato. Breed. Sci. 69, 592–600. doi: 10.1270/jsbbs.19059
Hulbert, S. H., Webb, C. A., Smith, S. M., Sun, Q. (2001). Resistance gene complexes: evolution and utilization. Annu. Rev. Phytopathol. 39, 285–312. doi: 10.1146/annurev.phyto.39.1.285
Illa, E., Jason, B., Huang, Z. (2015). Rapid and reliable identification of tomato fruit weight and locule number loci by QTL-seq. Theor. Appl. Genet., 128, 1329–1342. doi: 10.1007/s00122-015-2509-x
Janila, P., Variath, M. T., Pandey, M. K., Desmae, H., Motagi, B. N., Okori, P., et al. (2016). Genomic tools in groundnut breeding program: Status and perspectives. Front. Plant Sci. 7, 289. doi: 10.3389/fpls.2016.00289
Jones, J. D. G., Dangl, J. L. (2006). The plant immune system. Nature 444, 323–329. doi: 10.1038/nature05286
Kumar, R., Janila, P., Vishwakarma, M. K., Khan, A. W., Manohar, S. S., Gangurde, S. S., et al. (2020). Whole-genome resequencing-based QTL-seq identified candidate genes and molecular markers for fresh seed dormancy in groundnut. Plant Biotechnol. J. 18, 992–1003. doi: 10.1111/pbi.13266
Lebeau, A., Gouy, M., Daunay, M. C., Wicker, E., Chiroleu, F., Prior, P., et al. (2013). Genetic mapping of a major dominant gene for resistance to Ralstonia solanacearum in eggplant. Theor. Appl. Genet. 126, 143–158. doi: 10.1007/s00122-012-1969-5
Lei, L., Zheng, H., Bi, Y., Yang, L., Liu, H., Wang, J., et al. (2020). Identification of a major QTL and candidate gene analysis of salt tolerance at the bud burst stage in rice (Oryza sativa L.) using QTL-seq and RNA-seq. Rice 13, 1–14. doi: 10.1186/s12284-020-00416-1
Li, H., Durbin, R. (2009). Fast and accurate short read alignment with burrows-wheeler transform. Bioinformatics 25, 1754–1760. doi: 10.1093/bioinformatics/btp324
Lu, H., Lin, T., Klein, J., Wang, S., Qi, J., Zhou, Q., et al. (2014). QTL-seq identifies an early flowering QTL located near Flowering Locus T in cucumber. Theor. Appl. Genet. 127, 1491–1499. doi: 10.1007/s00122-014-2313-z
Luo, H., Pandey, M. K., Khan, A. W., Guo, J., Wu, B., Cai, Y., et al. (2019). Discovery of genomic regions and candidate genes controlling shelling percentage using QTL-seq approach in cultivated peanut (Arachis hypogaea L.). Plant Biotechnol. J. 17, 1248–1260. doi: 10.1111/pbi.13050
Luo, H., Pandey, M. K., Khan, A. W., Wu, B., Guo, J., Ren, X., et al. (2019). Next-generation sequencing identified genomic region and diagnostic markers for resistance to bacterial wilt on chromosome B02 in peanut (Arachis hypogaea L.). Plant Biotechnol. J. 17, 2356–2369. doi: 10.1111/pbi.13153
Luo, H., Pandey, M. K., Zhi, Y., Zhang, H., Xu, S., Guo, J., et al. (2020). Discovery of two novel and adjacent QTLs on chromosome B02 controlling resistance against bacterial wilt in peanut variety zhonghua 6. Theor. Appl. Genet. 133, 1133–1148. doi: 10.1007/s00122-020-03537-9
McDowell, J. M., Woffenden, B. J. (2003). Plant disease resistance genes: recent insights and potential applications. Trends Biotechnol. 21, 178–183. doi: 10.1016/S0167-7799(03)00053-2
Meyers, B. C., Kaushik, S., Nandety, R. S. (2005). Evolving disease resistance genes. Curr. Opin. Plant Biol. 8, 129–134. doi: 10.1016/j.pbi.2005.01.002
Mimura, Y., Kageyama, T., Minamiyama, Y., Hirai, M. (2009). QTL analysis for resistance to Ralstonia solanacearum in Capsicum accession ‘LS2341.’ J. Japanese Soc Hortic. Sci. 78, 307–313. doi: 10.2503/jjshs1.78.307
Narusaka, M., Hatakeyama, K., Shirasu, K., Narusaka, Y., Narusaka, M., Hatakeyama, K., et al. (2014). Arabidopsis dual resistance proteins, both RPS4 and RRS1, are required for resistance to bacterial wilt in transgenic Brassica crops. Plant Signaling & Behav. 9, e29130. doi: 10.4161/psb.29130
Narusaka, M., Shirasu, K., Noutoshi, Y., Kubo, Y., Shiraishi, T., Iwabuchi, M., et al. (2009). RRS1 and RPS4 provide a dual resistance-gene system against fungal and bacterial pathogens. Plant J. 60, 218–226. doi: 10.1111/j.1365-313X.2009.03949.x
Pandey, M. K., Khan, A. W., Singh, V. K., Vishwakarma, M. K., Shasidhar, Y., Kumar, V., et al. (2017). QTL-seq approach identified genomic regions and diagnostic markers for rust and late leaf spot resistance in groundnut (Arachis hypogaea L.). Plant Biotechnol. J. 15, 927–941. doi: 10.1111/pbi.12686
Pandey, M. K., Pandey, A. K., Kumar, R., Nwosu, C. V., Guo, B., Wright, G. C., et al. (2020). Translational genomics for achieving higher genetic gains in groundnut. Theor. Appl. Genet. 133, 1679–1702. doi: 10.1007/s00122-020-03592-2
Reddy, P. P. (2016). “Viral diseases and their management,” in Sustainable Crop Protection under Protected Cultivation (Singapore: Springer press), 161–176.
Reumers, J., De Rijk, P., Zhao, H., Liekens, A., Smeets, D., Cleary, J., et al. (2012). Optimized filtering reduces the error rate in detecting genomic variants by short-read sequencing. Nat. Biotechnol. 30, 61–68. doi: 10.1038/nbt.2053
Salanoubat, M., Genin, S., Artiguenave, F., Gouzy, J., Mangenot, S., Arlat, M., et al. (2002). Genome sequence Plant pathogen Ralstonia solanacearum. Nature 415, 497–502. doi: 10.1038/415497a
Salgon, S., Jourda, C., Sauvage, C., Daunay, M. C., Reynaud, B., Wicker, E., et al. (2017). Eggplant resistance to the Ralstonia solanacearum species complex involves both broad-spectrum and strain-specific quantitative trait loci. Front. Plant Sci. 8, 828. doi: 10.3389/fpls.2017.00828
Schell, M. A. (2000). Control of virulence and pathogenicity genes of Ralstonia solanacearum by an elaborate sensory network. Annu. Rev. Phytopathol. 38, 263–292. doi: 10.1146/annurev.phyto.38.1.263
Shin, I. S., Hsu, J. C., Huang, S. M., Chen, J. R., Wang, J. F., Hanson, P., et al. (2020). Construction of a single nucleotide polymorphism marker based QTL map and validation of resistance loci to bacterial wilt caused by Ralstonia solanacearum species complex in tomato. Euphytica 216, 54. doi: 10.1007/s10681-020-2576-1
Singh, V. K., Khan, A. W., Jaganathan, D., Thudi, M., Roorkiwal, M., Takagi, H., et al. (2016). QTL-seq for rapid identification of candidate genes for 100-seed weight and root/total plant dry weight ratio under rainfed conditions in chickpea. Plant Biotechnol. J. 14, 2110–2119. doi: 10.1111/pbi.12567
Srivastava, R., Upadhyaya, H. D., Kumar, R., Daware, A., Basu, U., Shimray, P. W., et al. (2017). A multiple QTL-seq strategy delineates potential genomic loci governing flowering time in chickpea. Front. Plant Sci. 8, 1105. doi: 10.3389/fpls.2017.01105
Sunkara, S., Bhatnagar-Mathur, P., Sharma, K. K. (2014). “Transgenic interventions in peanut crop improvement: Progress and prospects,” in Genetics, genomics and breeding of crop plants (Boca Raton, FL: CRC Press), 178–215.
Sun, Y., Zhu, Y. X., Balint-Kurti, P. J., Wang, G. F. (2020). Fine-tuning immunity: Players and regulators for plant NLRs. Trends Plant Sci. 25, 695–713. doi: 10.1016/j.tplants.2020.02.008
Takagi, H., Abe, A., Yoshida, K., Kosugi, S., Natsume, S., Mitsuoka, C., et al. (2013). QTL-seq: Rapid mapping of quantitative trait loci in rice by whole genome resequencing of DNA from two bulked populations. Plant J. 74, 174–183. doi: 10.1111/tpj.12105
Takken, F. L. W., Joosten, M. H. A. J. (2000). Plant resistance genes: their structure, function and evolution. Eur. J. Plant Pathol. 106, 699–713. doi: 10.1023/A:1026571130477
Thoquet, P., Olivier, J., Sperisen, C., Rogowsky, P., Laterrot, H., Grimsley, N. (1996). Quantitative trait loci determining resistance to bacterial wilt in tomato cultivar Hawaii7996. MPMI-Molecular Plant Microbe Interact. 9, 826–836. doi: 10.1094/MPMI-9-0826
Topcu, Y., Sapkota, M., Illa, E., Savithri, B., Esther, U. N. (2021). Identification of blossom-end rot loci using joint QTL−seq and linkage−based QTL mapping in tomato. Theor. Appl. Genet. 134, 2931–2945. doi: 10.1007/s00122-021-03869-0
Tudor, E. H., Jones, D. M., He, Z., Bancroft, I., Trick, M., Wells, R., et al. (2020). QTL-seq identifies BnaFT.A02 and BnaFLC.A02 as candidates for variation in vernalization requirement and response in winter oilseed rape (Brassica napus). Plant Biotechnol. J. 18, 2466–2481. doi: 10.1111/pbi.13421
Varshney, R. K., Pandey, M. K., Bohra, A., Singh, V. K., Thudi, M., Saxena, R. K. (2019). Toward the sequence-based breeding in legumes in the post-genome sequencing era. Theor. Appl. Genet. 132, 797–816. doi: 10.1007/s00122-018-3252-x
Wang, H., Cheng, H., Wang, W., Liu, J., Hao, M., Mei, D., et al. (2016). Identification of BnaYUCCA6 as a candidate gene for branch angle in Brassica napus by QTL-seq. Sci. Rep. 6, 38493. doi: 10.1038/srep38493
Wang, J.-F., Ho, F.-I., Truong, H. T. H., Huang, S.-M., Balatero, C. H., Dittapongpitch, V., et al. (2013). Identification of major QTLs associated with stable resistance of tomato cultivar ‘Hawaii 7996’ to Ralstonia solanacearum. Euphytica 190, 241–252. doi: 10.1007/s10681-012-0830-x
Wang, Y., Sun, H., Wang, H., Yang, X., Xu, Y., Yang, Z., et al. (2021). Integrating transcriptome, co-expression and QTL-seq analysis reveals that primary root growth in maize is regulated via flavonoid biosynthesis and auxin signal transduction. J. Exp. Bot. 72, 4773–4795. doi: 10.1093/jxb/erab177
Yang, L., Wang, J., Han, Z., Lei, L., Liu, H. L., Zheng, H., et al. (2021). Combining QTL-seq and linkage mapping to fine map a candidate gene in qCTS6 for cold tolerance at the seedling stage in rice. BMC Plant Biol. 21, 1–14. doi: 10.1186/s12870-021-03076-5
You, F. M., Huo, N., Gu, Y. Q., Luo, M. C., Ma, Y., Hane, D., et al. (2008). BatchPrimer3: A high throughput web application for PCR and sequencing primer design. BMC Bioinf. 9, 253. doi: 10.1186/1471-2105-9-253
Yu, S. L., Wang, C. T., Yang, Q. L., Zhang, D. X., Zhang, X. Y., Cao, Y. L., et al. (2011). Peanut genetics and breeding in China Vol. 565 (Shanghai: Shanghai Sci. Technol. Press).
Zhang, C., Badri Anarjan, M., Win, K. T., Begum, S., Lee, S. (2021). QTL-seq analysis of powdery mildew resistance in a Korean cucumber inbred line. Theor. Appl. Genet. 134, 435–451. doi: 10.1007/s00122-020-03705-x
Zhang, C., Chen, H., Cai, T., Deng, Y., Zhuang, R., Zhang, N., et al. (2017). Overexpression of a novel peanut NBS-LRR gene AhRRS5 enhances disease resistance to Ralstonia solanacearum in tobacco. Plant Biotechnol. J. 15, 39–55. doi: 10.1111/pbi.12589
Zhang, C., Chen, H., Zhuang, R. R., Chen, Y. T., Deng, Y., Cai, T. C., et al. (2019). Overexpression of the peanut CLAVATA1-like leucine-rich repeat receptor-like kinase AhRLK1 confers increased resistance to bacterial wilt in tobacco. J. Exp. Bot. 70, 5407–5421. doi: 10.1093/jxb/erz274
Zhao, Y., Ma, J., Li, M., Deng, L., Li, G., Xia, H., et al. (2020). Whole-genome resequencing-based QTL-seq identified AhTc1 gene encoding a R2R3-MYB transcription factor controlling peanut purple testa colour. Plant Biotechnol. J. 18, 96–105. doi: 10.1111/pbi.13175
Zhao, Y., Zhang, C., Chen, H., Yuan, M., Nipper, R., Prakash, C. S., et al. (2016). QTL mapping for bacterial wilt resistance in peanut (Arachis hypogaea L.). Mol. Breed 36, 1–11. doi: 10.1007/s11032-015-0432-0
Keywords: peanut, resistance to Ralstonia solanacearum, QTL-seq analysis, candidate genes, diagnostic markers
Citation: Zhang C, Xie W, Fu H, Chen Y, Chen H, Cai T, Yang Q, Zhuang Y, Zhong X, Chen K, Gao M, Liu F, Wan Y, Pandey MK, Varshney RK and Zhuang W (2023) Whole genome resequencing identifies candidate genes and allelic diagnostic markers for resistance to Ralstonia solanacearum infection in cultivated peanut (Arachis hypogaea L.). Front. Plant Sci. 13:1048168. doi: 10.3389/fpls.2022.1048168
Received: 19 September 2022; Accepted: 22 November 2022;
Published: 04 January 2023.
Edited by:
Xiyin Wang, North China University of Science and Technology, ChinaReviewed by:
Quanxi Sun, Shandong Peanut Research Institute (CAAS), ChinaTingting Chen, South China Agricultural University, China
Copyright © 2023 Zhang, Xie, Fu, Chen, Chen, Cai, Yang, Zhuang, Zhong, Chen, Gao, Liu, Wan, Pandey, Varshney and Zhuang. This is an open-access article distributed under the terms of the Creative Commons Attribution License (CC BY). The use, distribution or reproduction in other forums is permitted, provided the original author(s) and the copyright owner(s) are credited and that the original publication in this journal is cited, in accordance with accepted academic practice. No use, distribution or reproduction is permitted which does not comply with these terms.
*Correspondence: Rajeev K. Varshney, cmFqZWV2LnZhcnNobmV5QG11cmRvY2guZWR1LmF1; Weijian Zhuang, d2VpamlhbnpAZmFmdS5lZHUuY24=