- 1Department of Electronics and Communication Engineering, Birla Institute of Technology, Ranchi, India
- 2Department of Bioengineering and Biotechnology, Birla Institute of Technology, Ranchi, India
- 3Department of Electrical and Computer Engineering, Kennesaw State University, Kennesaw, GA, United States
Introduction: Plant–microbe interactions play a vital role in the development of strategies to manage pathogen-induced destructive diseases that cause enormous crop losses every year. Rice blast is one of the severe diseases to rice Oryza sativa (O. sativa) due to Magnaporthe grisea (M. grisea) fungus. Protein–protein interaction (PPI) between rice and fungus plays a key role in causing rice blast disease.
Methods: In this paper, four genomic information-based models such as (i) the interolog, (ii) the domain, (iii) the gene ontology, and (iv) the phylogenetic-based model are developed for predicting the interaction between O. sativa and M. grisea in a whole-genome scale.
Results and Discussion: A total of 59,430 interacting pairs between 1,801 rice proteins and 135 blast fungus proteins are obtained from the four models. Furthermore, a machine learning model is developed to assess the predicted interactions. Using composition-based amino acid composition (AAC) and conjoint triad (CT) features, an accuracy of 88% and 89% is achieved, respectively. When tested on the experimental dataset, the CT feature provides the highest accuracy of 95%. Furthermore, the specificity of the model is verified with other pathogen–host datasets where less accuracy is obtained, which confirmed that the model is specific to O. sativa and M. grisea. Understanding the molecular processes behind rice resistance to blast fungus begins with the identification of PPIs, and these predicted PPIs will be useful for drug design in the plant science community.
1 Introduction
Rice (Oryza sativa) is an important crop, and its production is affected by several abiotic and biotic stresses. Among biotic stresses, the Magnaporthe grisea (M. grisea) fungus is the most harmful and causes a loss of 30%–40% in yield that is enough to feed millions of people (Parker et al., 2008). Blast fungus can affect the rice plant parts like leaves, roots, panicles, and nodes during its growth period. In addition, the blast fungus is detrimental to small grains like wheat and results in a significant reduction in yield (Dean et al., 2005; Xue et al., 2012). One of the most efficient and economical means for controlling the fungal diseases is by increasing the potential of resistance in the host plant. For these diseases, genetic engineering has been a successful and cost-effective approach in the last few decades (Hulbert et al., 2001; Ribot et al., 2008). The experimental detection of protein–protein interactions (PPIs) between plant and pathogen is a cumbersome process. Until now, few numbers have been reported of experimental PPIs between O. sativa and M. grisea that are inadequate to explore the pathogenic molecular mechanism (Pellegrini et al., 1999; Jia et al. 2000; Krogh et al., 2001; Ng et al., 2003; Salwinski et al., 2004; Quevillon et al., 2005; Shoemaker and Panchenko, 2007; Wang et al., 2007; Najafabadi and Salavati, 2008; Parker et al., 2008; Ribot et al., 2008; Kumar and Nanduri, 2010; Mukhtar et al., 2011; Li et al., 2012; Maetschke et al., 2012; Mentlak et al., 2012; Park et al., 2012; Schleker et al., 2012; Simonsen et al., 2012; Meyer et al., 2013; Mosca et al., 2014; Rao et al., 2014; Sahu et al., 2014; Tully et al., 2014; Nourani et al., 2015; Li et al., 2016; Singh et al., 2016; Klopfenstein et al., 2018; Savojardo et al., 2018; Karan et al., 2019; Ma et al., 2019; Sahu et al., 2019; Loaiza et al., 2020; Lu et al., 2020; Singh et al., 2020; Wang et al., 2020; Rapposelli et al., 2021; Kumar et al., 2022; Mishra et al., 2022; Wu et al., 2015). Therefore, the computational approach is seen as an alternative method for the large-scale identification of PPIs. The computational approaches for PPI prediction include genomic data-based predictor (Barker and Pagel, 2005; Najafabadi and Salavati, 2008), protein structure (Aloy and Russell, 2002), domain details (Huang et al., 2007; Wang et al., 2007), protein sequence (Zhang et al., 2012), and semantic similarity of gene ontology (GO) annotations (Maetschke et al., 2012). The majority of these algorithms are based on data mining, which uses information from existing PPIs to predict new interactions (Jaeger et al., 2008). Among these computational methods, the interolog and domain-based methods (Wu et al., 2006; Shoemaker and Panchenko 2007; Wang et al., 2007; Simonsen et al., 2012; Tully et al., 2014; Wu et al., 2015; Singh et al., 2016; Singh et al., 2020; Wang et al., 2020; Wuchty, (2011)) are extensively used methodologies for the prediction of PPIs. The potential PPIs between Homo sapiens (H. sapiens) and Plasmodium falciparum (P. falciparum) are predicted previously (Dyer et al., 2007) using domain information of the host–pathogen system. Recently interolog and domain-based information to obtain PPIs between B. pseudomalei and human has been utilized (Loaiza et al., 2020). An earlier GO-based model was presented for yeast protein interaction (Wu et al., 2006). (Zhou et al., 2013) used domain information of H. sapiens and M. tuberculosis to obtain the PPIs. (Zhu et al., 2011) have obtained 76,585 PPIs by involving 5,049 rice proteins. Previously, a prediction network based on rice blast fungus was also established (He et al., 2008). In the present study, the authors have predicted 11,674 interactions involving 3,017 blast fungus proteins using an interolog-based approach. From different literature, it was found that computational efforts have hardly been utilized for predicting interspecies PPIs between O. sativa and M. grisea. A computer-based approach has been created for discovering known Arabidopsis thaliana PPIs and to find new PPIs on a genome-scale (Ding and Daisuke , 2019). Ma et al. 2019) have predicted the PPI networks between rice and M. grisea using the interolog and domain-based method. However, the method was not implemented at the genome scale. Also, the developed machine learning model was neither tested with the independent experimental dataset nor was it validated with another pathogen–host system to check its reliability.
In this paper, four computational models, the interolog, domain-based, GO, and phylogenetic prediction approaches, are developed to predict the PPIs on a genome-wide scale between rice and M. grisea. The high confident PPIs are obtained by intersecting all four computational methods. In the present study, a well-analyzed filtering method has been proposed to identify the potential candidate proteins for interactions. Additionally, a machine learning model using support vector machine has been developed to predict the PPIs efficiently between rice and M. grisea.
2 Materials and methods
2.1 Retrieval of protein sequences
A total of 11,054 protein sequences of M. grisea (blast fungus) genome were collected from the Broad Institute website (http://www.broadinstitute.org/annotation/genome/magnaporthe_grisea/MultiHome.html). Similarly, 66,153 protein sequences of rice genome were collected from the MSU database (ftp://ftp.plantbiology.msu.edu/pub/data/Eukaryotic_Projects/o_sativa/annotation_dbs/pseudomolecules/version_7.0/all.dir/).
2.2 Filtering of rice proteins to obtain positive-like candidate proteins
In this study, a new approach based on keyword filtering was used to obtain the probable interacting rice proteins. From different kinds of literature surveys [6-15], a set of keywords (Supplementary Tables 1 and 2) related to intraspecies and interspecies were retrieved. Another set of keywords (Supplementary Table 3) were obtained from plantTFDB v 5.0 (http://planttfdb.cbi.pku.edu.cn/). These keywords are related to the transcription factor of rice and utilized to filter positive-like candidates from the whole-genome rice sequence. The keywords present in rice protein annotation were filtered out as positive candidates. These filtered protein sequences are likely to participate in the interaction. From the above filtering process, only 3,665 rice proteins are extracted. To get homologs of 3,665 proteins, these are subjected to blast analysis against the remaining 62,488 rice proteins having an E-value of 10-5. From this analysis, a total of only 8,426 homolog proteins were also obtained. Thus, a cumulative total of 12,091 (3,665 + 8,426) positive-like rice proteins were obtained that might participate in the interactions. On the other hand, the remaining 54,062 proteins that do not participate in the interaction were considered as probable negative samples.
2.3 Filtering of M. grisea proteins to obtain positive-like candidate proteins
The positive-like candidate proteins of M. grisea were filtered out from the whole 11,054-protein sequence using transmembrane, extracellular localization, and secretory protein information. The M. grisea proteins are identified as transmembrane, when predicted transmembrane helices were more than one using TMHMM (Krogh et al., 2001). BUSCA (Savojardo et al., 2018) is used to locate extracellular localization. Finally, the SignalP (Bendtsen et al., 2004) predictor is used to identify secretory protein information. Using the above three tools, a total of 1,572 M. grisea proteins were identified as positive-like candidates. These 1,572 proteins were subjected to blast analysis against the remaining 9,482 M. grisea proteins having an E-value of 10-5 to obtain the homologs. From this analysis, a total of 4,226 homolog proteins were obtained. On the other hand, only 353 proteins were obtained in M. grisea using the TF database (http://ftfd.snu.ac.kr/index.php?a=view) and considered as positive samples. Thus, a cumulative total of 6,151 (1,572 + 4,226 + 353) proteins of M. grisea were obtained and taken as positive-like samples that might be participating in the interactions. On the other hand, the remaining 5,256 proteins were considered as negative samples that do not participate in the interactions.
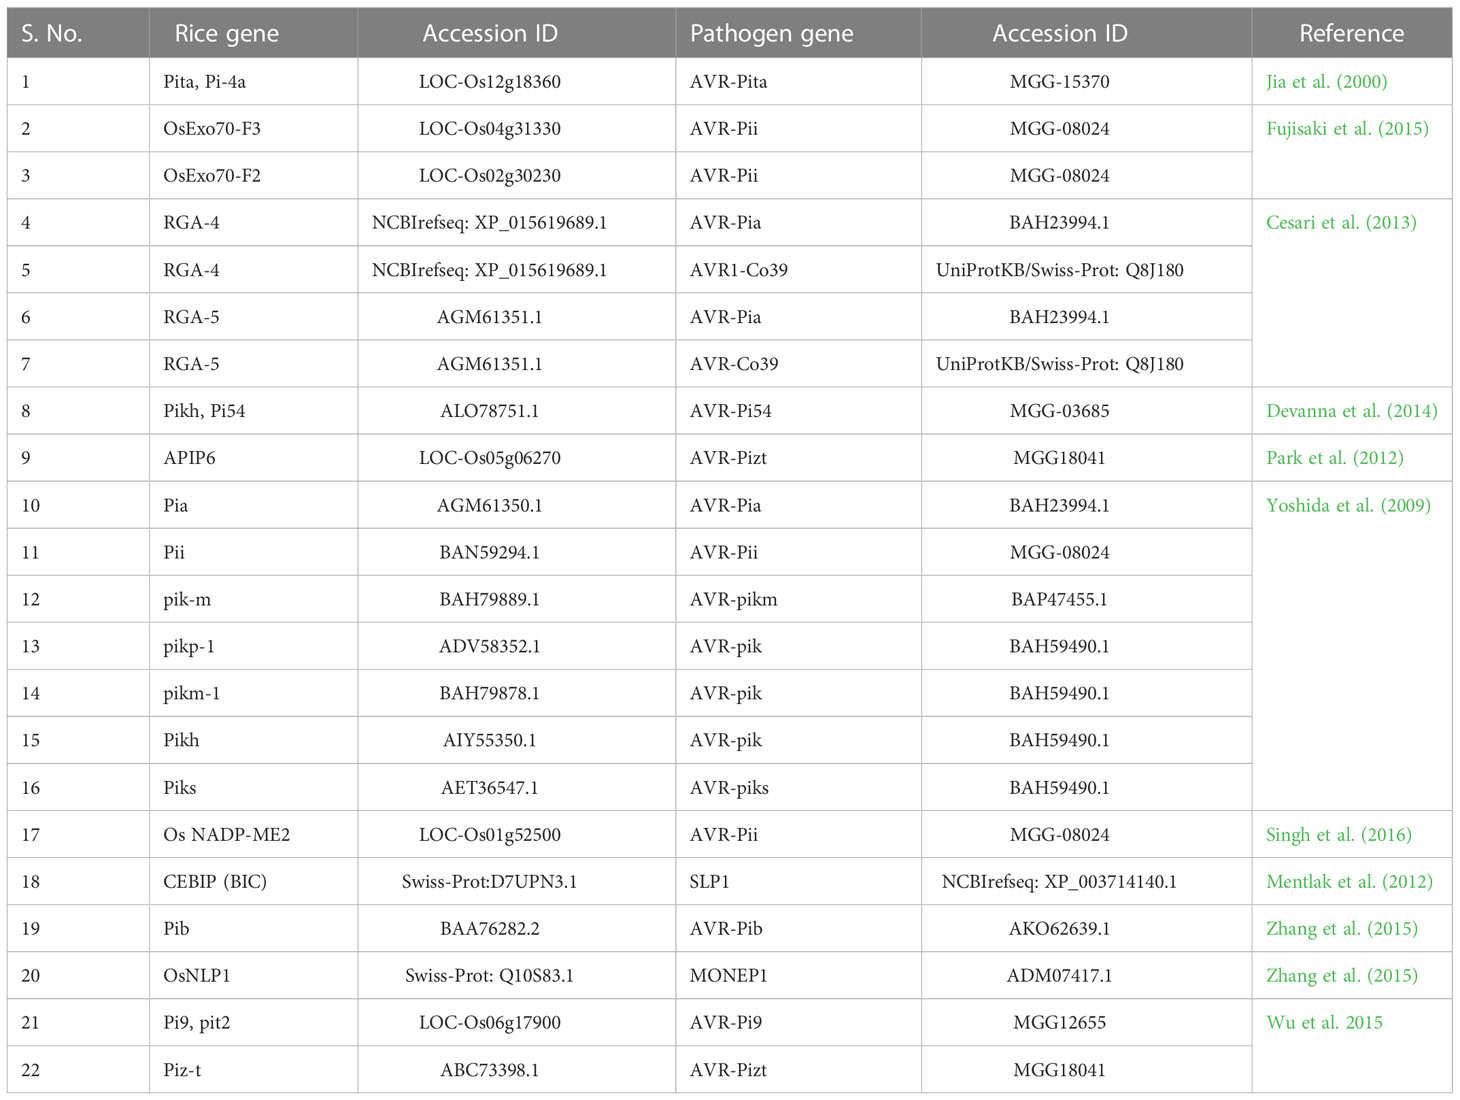
Experimentally verified PPIs were collected between rice and M. grisea (Pellegrini et al., 1999; Jia et al., 2000; Krogh et al., 2001; Ng et al., 2003; Salwinski et al., 2004; Quevillon et al., 2005; Shoemaker and Panchenko, 2007; Wang et al., 2007; Najafabadi and Salavati, 2008; Parker et al., 2008; Ribot et al., 2008; Kumar and Nanduri, 2010; Mukhtar et al., 2011; Li et al., 2012; Maetschke et al., 2012; Mentlak et al., 2012; Park et al., 2012; Schleker et al., 2012; Simonsen et al., 2012; Meyer et al., 2013; Mosca et al., 2014; Rao et al., 2014; Sahu et al., 2014; Tully et al., 2014; Nourani et al., 2015; Li et al., 2016; Singh et al., 2016; Klopfenstein et al., 2018; Savojardo et al., 2018; Karan et al., 2019; Ma et al., 2019; Sahu et al., 2019; Loaiza et al., 2020; Lu et al., 2020; Singh et al., 2020; Wang et al., 2020; Rapposelli et al., 2021; Kumar et al., 2022; Mishra et al., 2022; Wu et al., 2015) from an exhaustive literature survey and used an independent dataset Table 1.
2.4 Development of computational models to predict the PPIs in rice and M. grisea
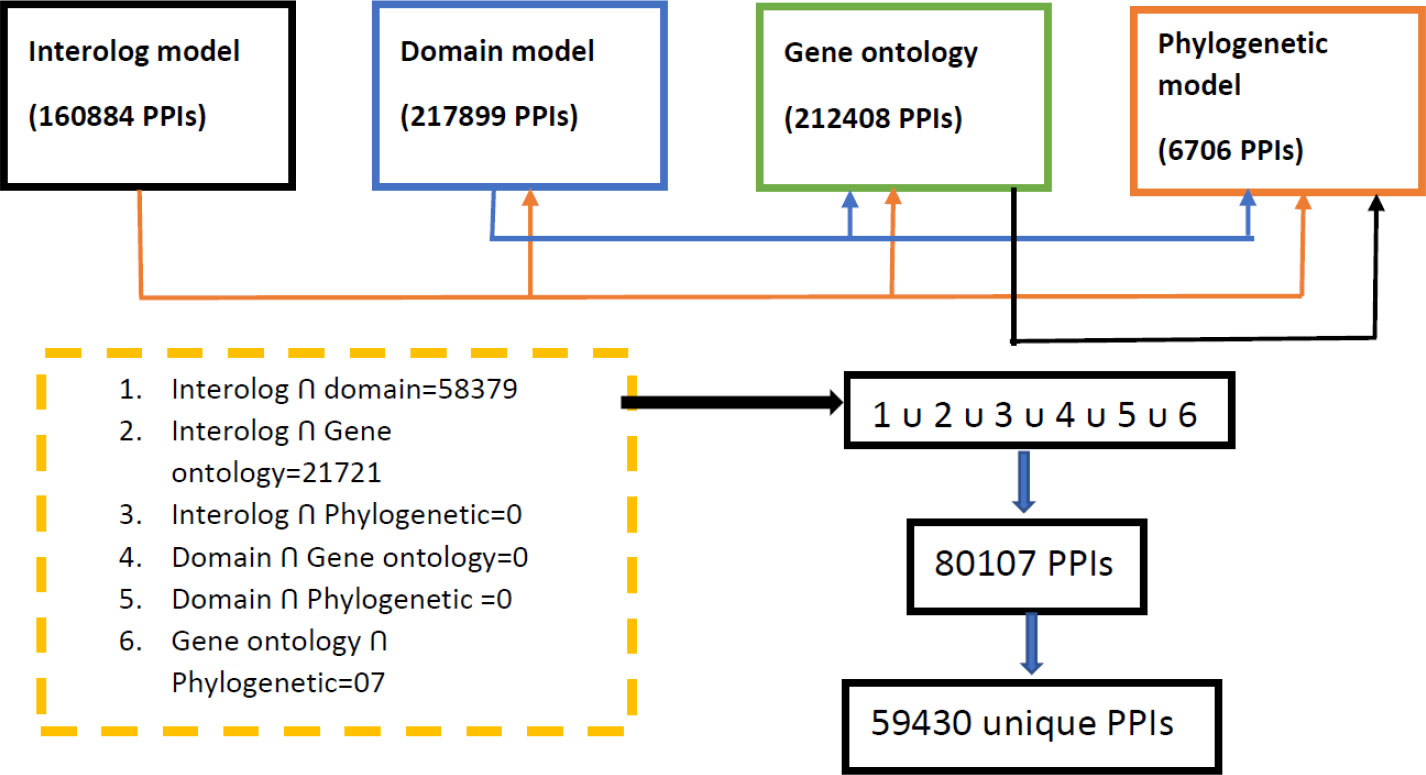
The 12,091 positive-like rice proteins as well as 6,151 positive-like M. grisea proteins were used for the development of computational models. In this study, PPI was determined using domain-based, interolog, GO, and phylogenetic-based models. Figure 1 shows a schematic representation of the entire model development.
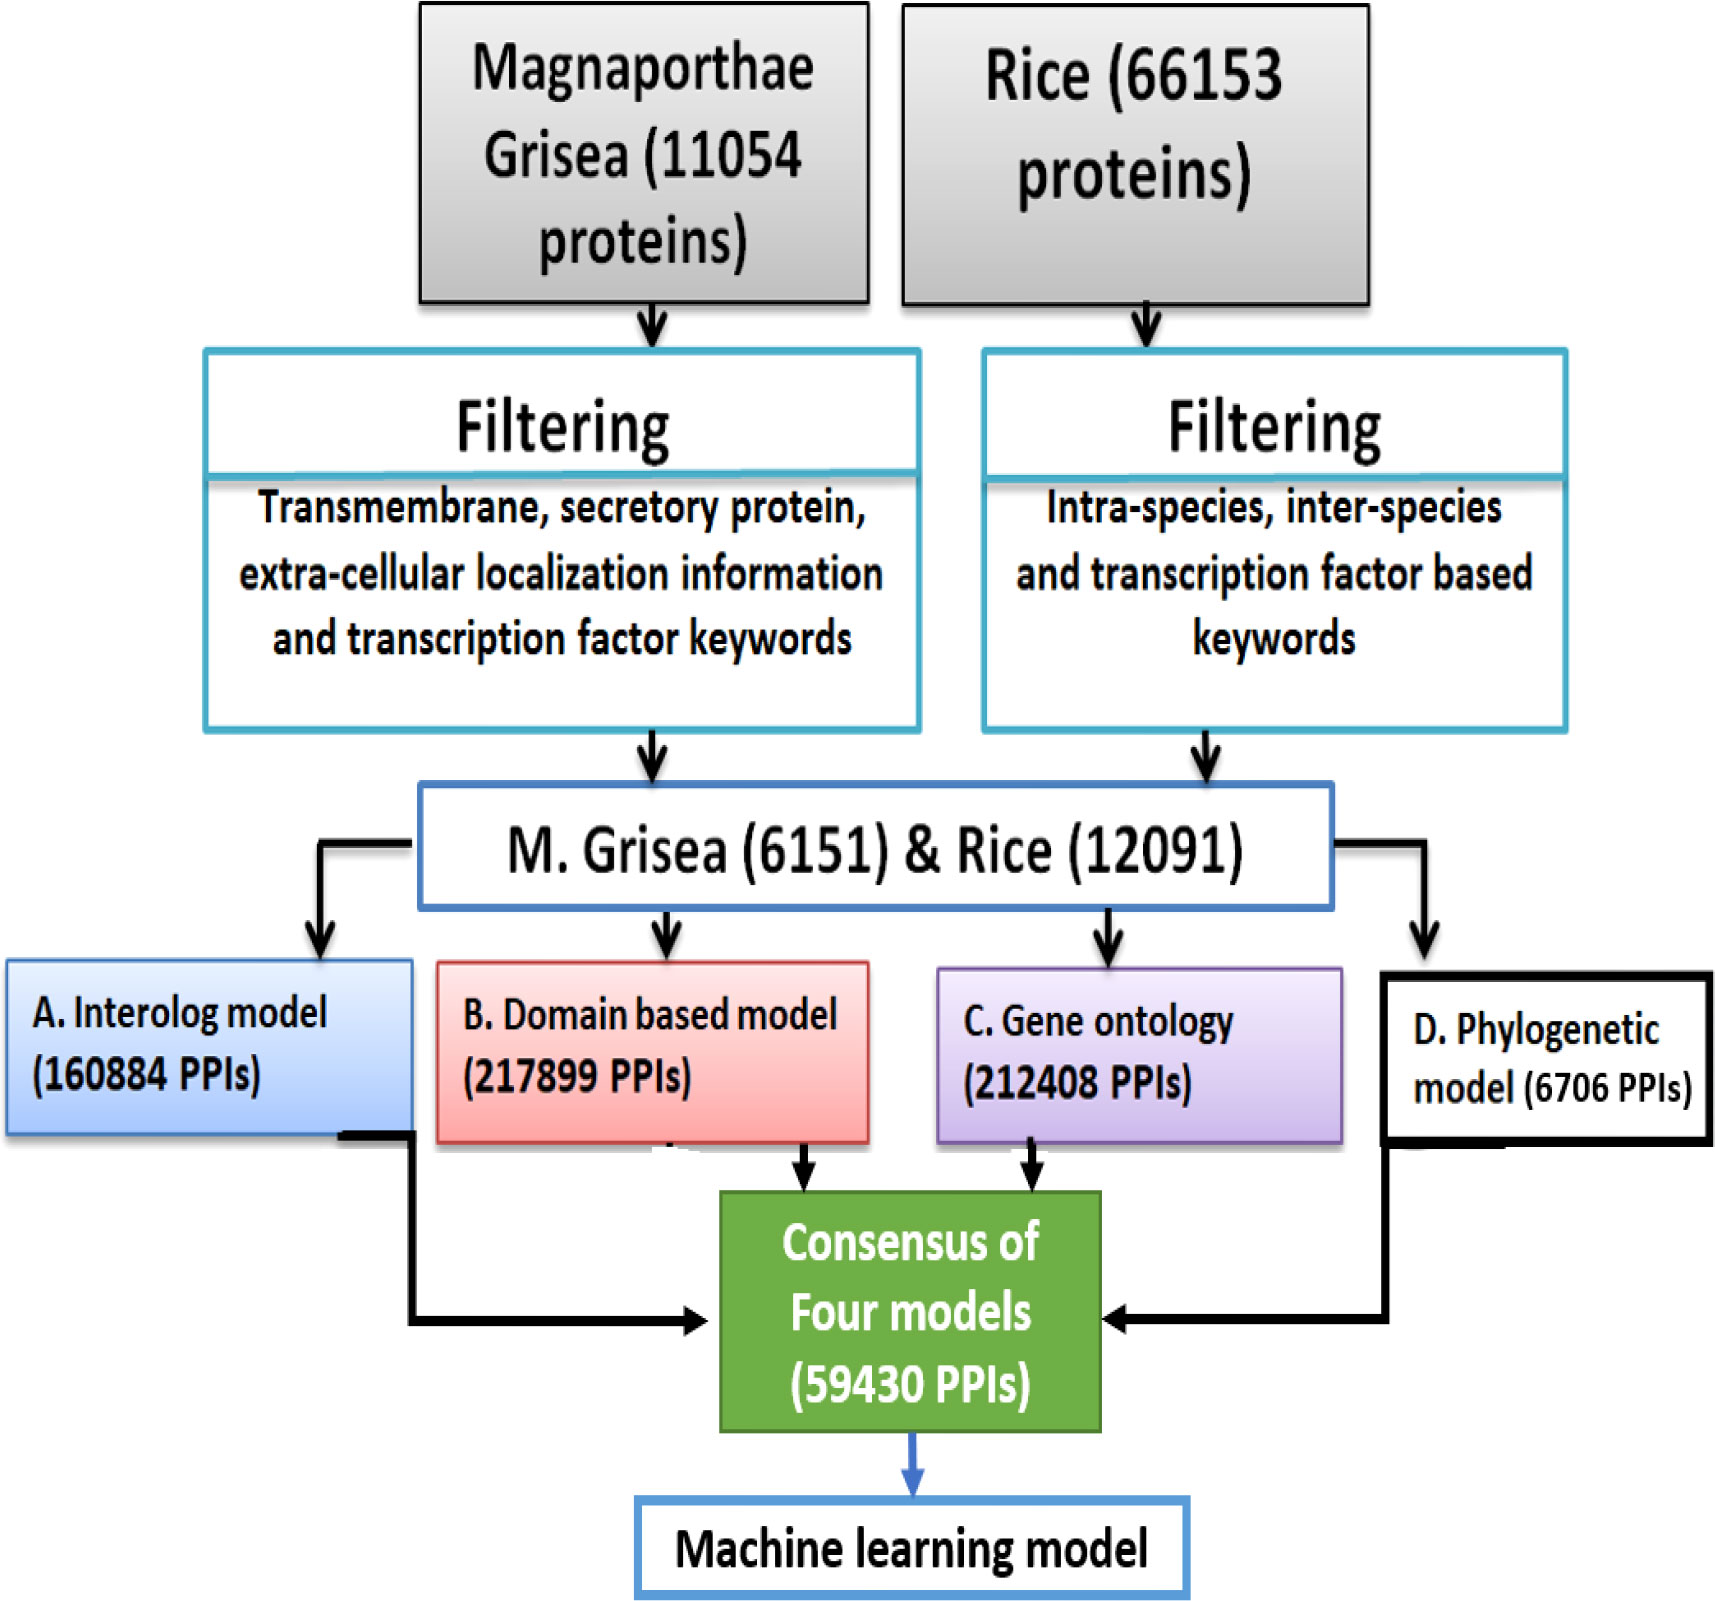
Figure 1 A schematic representation showing the overall prediction network for the proposed model development.
2.4.1 Interolog model for PPI prediction
The interolog model relies on the similarity of the protein sequences (Savojardo et al., 2018). If an interaction between their homologous proteins happens, each protein pair between the pathogen and the host is expected to interact (Meyer et al., 2013). A schematic presentation of the interolog model is shown in Figure 2. Each protein of rice and M. grisea was subjected to BLAST analysis against host and pathogen proteins in the HPIDB (Kumar and Nanduri, 2010) database having an E-value of 10-5. Like the above criteria, each protein of rice and M. grisea was also subjected to BLAST analysis against the DIP (Salwinski et al., 2004) database. If there is an experimentally confirmed interaction with their respective homologous proteins in the DIP or HPIDB databases, it is assumed that each protein pair between O. sativa and M. grisea will interact.
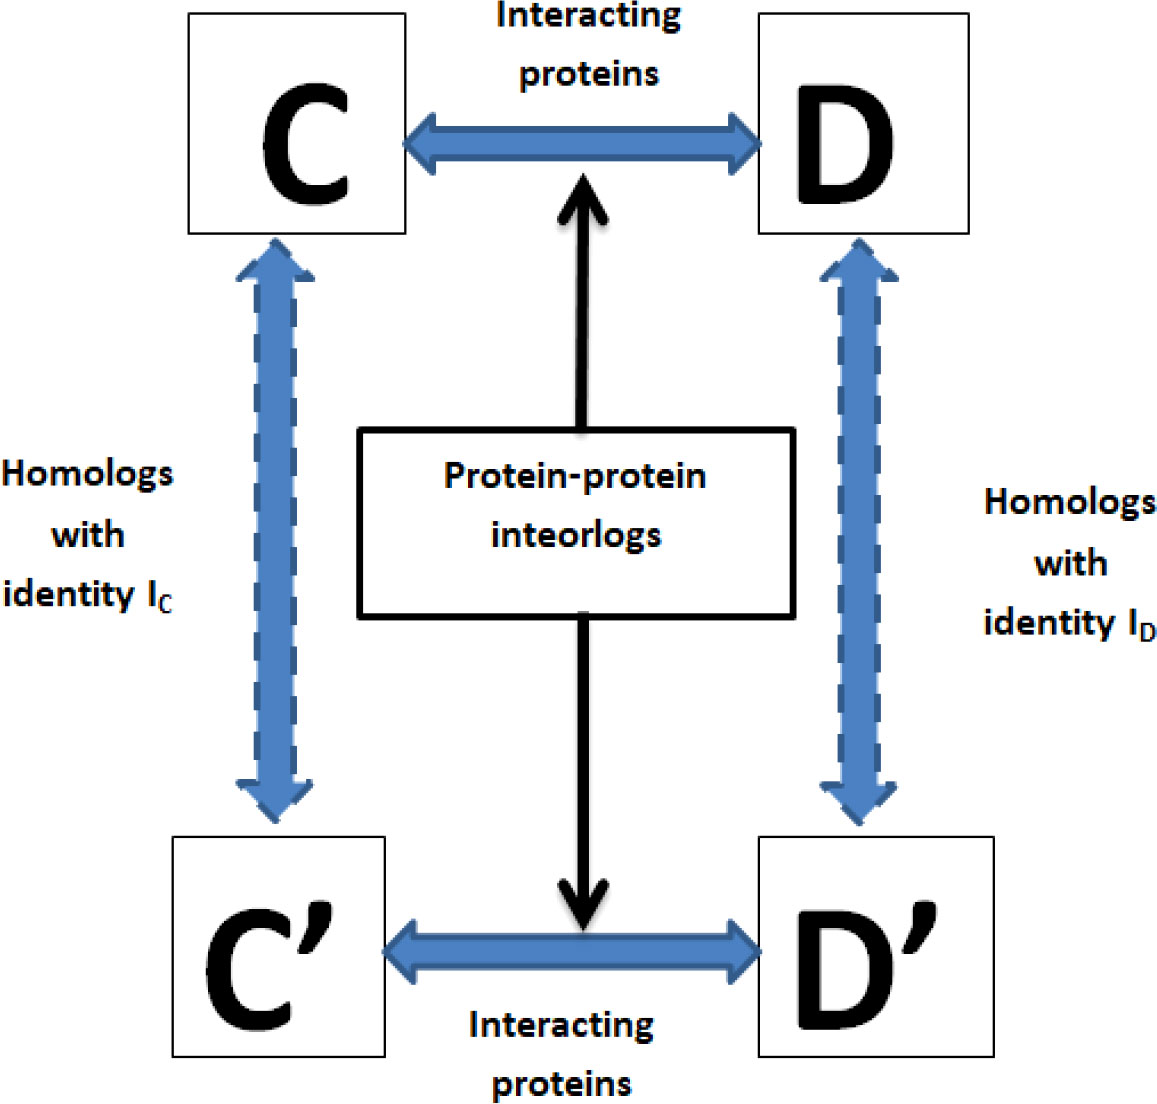
Figure 2 A schematic presentation of the interolog model for protein–protein interaction prediction. Here, (C, D) are two interacting proteins, and (C’–D’) are the proteins among which interaction needs to be predicted. Protein C’ is homologous to (C, D’) is homologous to (D), then (C’, D’) are likely to interact.
2.4.2 Domain-based model for PPI prediction
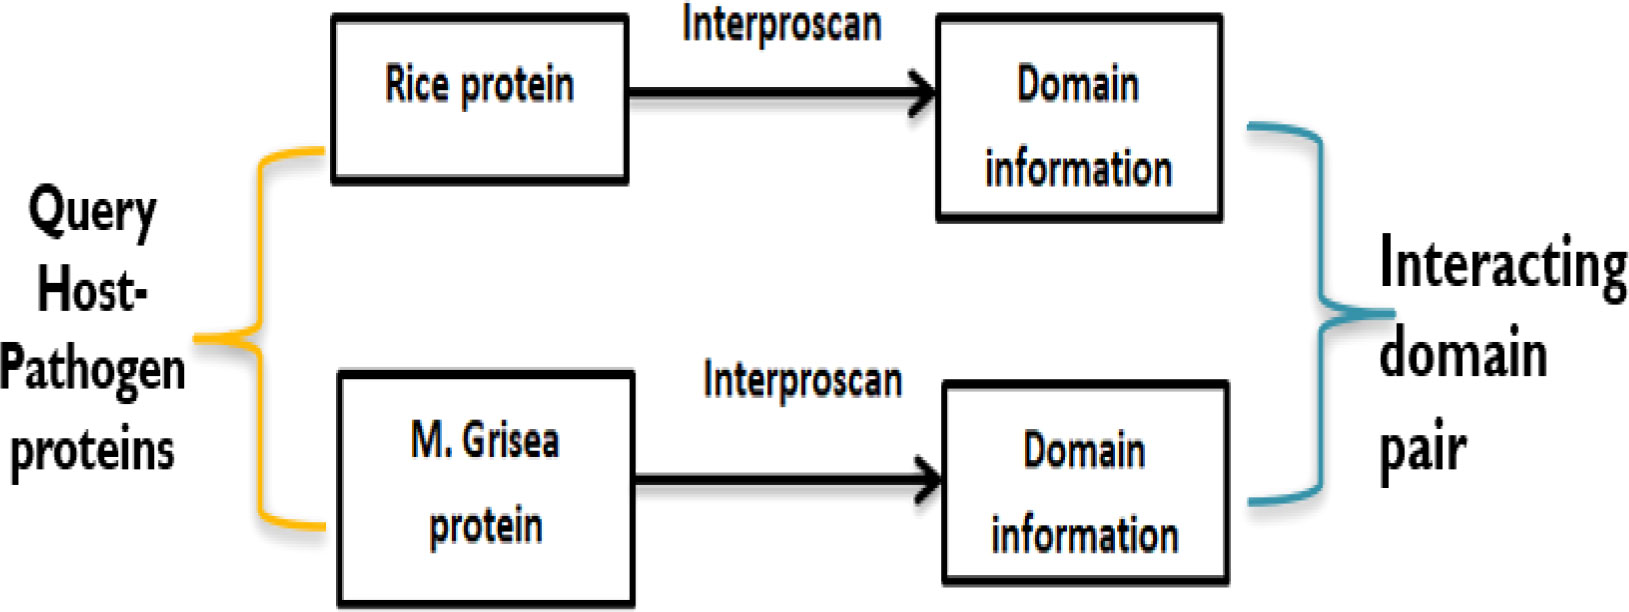
To predict potential PPIs, the domain-based method uses the knowledge of information based on domain–domain interaction that has been derived from known 3D structures of proteins. Here, if two query proteins contain a pair of interacting domains, then these two proteins are the most probable candidates to interact with each other (Ng et al., 2003). A schematic presentation of the domain-based model has been given in Figure 3. To obtain the domains related to rice and M. grisea, interproscan5 (Quevillon et al., 2005) is used. Rice and M. grisea domains were searched against the repositories of domain–domain interaction such as Instruct (Meyer et al., 2013), Pfam (El-Gebali et al., 2019), and 3did (Mosca et al. 2014). Instruct http://instruct.yulab.org/ is a database annotated to the 3D structural resolution of protein interactome networks. Pfam https://pfam.xfam.org/ is a protein domain–domain interaction database that includes their annotation and multiple sequence alignment generated using the Hidden Markov model. The Pfam database contains 16,642 domain–domain interaction pairs. The three-dimensional interacting domains 3did database https://3did.irbbarcelona.org/index.php is a set of 3D high-resolution structural models for domain–domain interactions. The 3did is composed of 14,726 domain–domain interaction pairs. If a pair of proteins contains an interacting pair of domains from the repositories, then the pair is supposed to interact (Shoemaker and Panchenko, 2007).
2.4.3 Gene ontology-based model for PPI prediction
The GO model is based on the hypothesis that proteins that interact within a cell are more likely to be in similar places or engaged in similar biological processes (Jain and Bader, 2010).
2.4.3.1 GO model development:
█ The GO term related to cellular components, biological process, and molecular function is obtained for both rice and M. grisea protein using the GO-Blast tool.
█ Resnik’s max method is used for calculating the semantic similarity score between paired GO terms [51]. Resnik’s method uses the information content specified in Jain and Bader (2010) to compute the semantic similarity (S) between ontology terms m and n for a given set C of ancestors a and b.
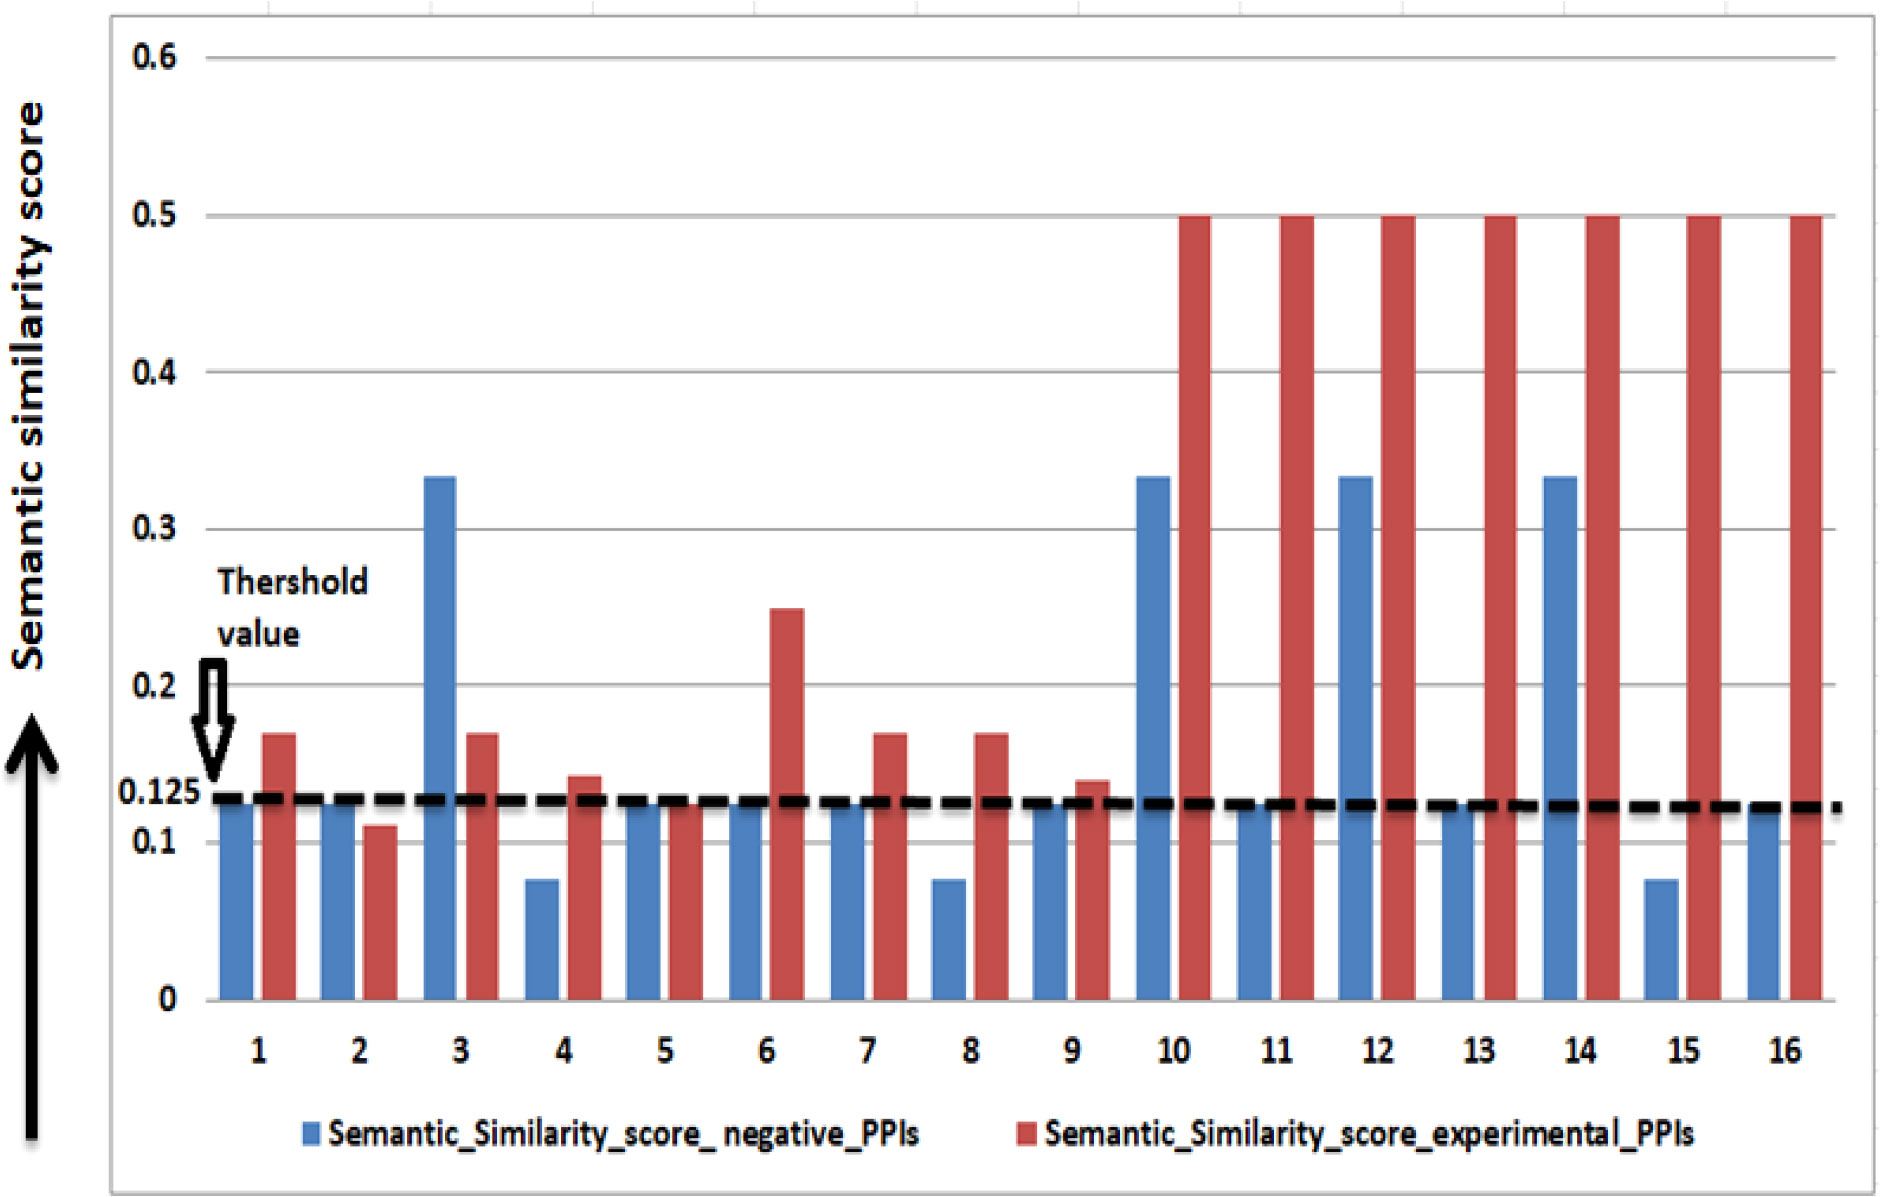
A threshold of 0.125 on the semantic similarity is obtained from 16 experimentally verified PPIs (refer to Table 2 to identify the interacting pair). The PPIs having a semantic similarity score of 0.125 or more than 0.125 is considered as potential PPIs (Figure 4).
In the GO-based model, 212,408 PPIs are predicted between 4,321 rice and 753 M. grisea proteins.
2.4.4 Phylogenetic-based model for PPI prediction
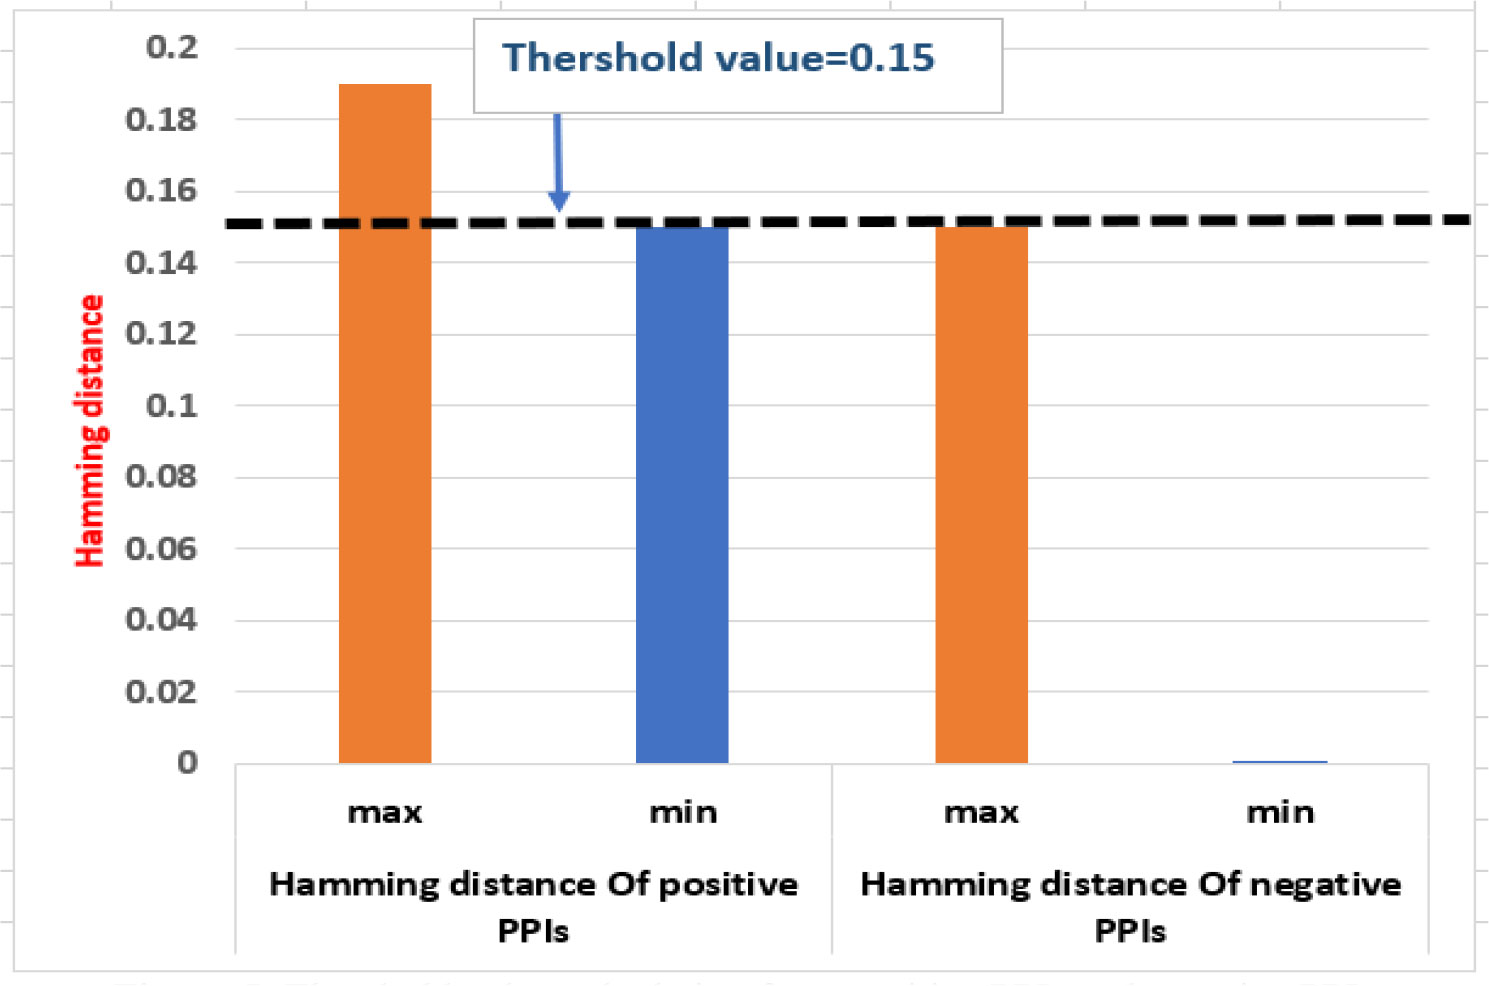
The phylogenetic profile of proteins is used for predicting the PPIs (Simonsen et al., 2012). It is based on the idea that functionally related proteins are more likely to coexist or be removed in a new species throughout evolution (Pellegrini et al., 1999). The phylogenetic profile is created by using the BLASTP (E value: 10-5) to recognize homologous proteins as present or absent in reference organisms. Each protein of rice and M. grisea was compared with the 4,045 reference organisms from UniProt using BLASTP. If any homologs are found in any reference organism, we put 1 in that place (and 0 otherwise), indicating the presence or absence of the target protein in that organism. Thus, a binary phylogenetic profile of dimension 4,145 was constructed for each protein. Subsequently, hamming distance is used to compute the similarity of the profiles. The threshold value for prediction is calculated from the positive PPIs and negative PPIs as shown in Figure 5.
If the similarity score is less than a threshold (0.15), the protein pairs are interacting. In the phylogenetic model, 6,706 PPIs are predicted between 160 rice and 477 M. grisea proteins.
2.4.5 High-confidence PPIs
From the computational approach, it is observed that all the individual unsupervised models (domain-based, interolog, GO, and phylogenetic-based models) predict the interactions efficiently. To obtain the potential PPIs, the consensus of any of the two models was selected and then all the obtained PPIs were merged as shown in Figure 6.
All the consensus interactions between possible combinations of four developed models were searched and finally a total of 59,430 unique PPI pairs are obtained (Supplementary Data Sheet 1). The whole process of obtaining final PPIs is shown in Figure 6.
2.5 Machine learning model development
The predicted PPIs from the genomic information-based methods were further used to develop a machine learning-based model that could predict PPIs efficiently. The PPIs obtained as the consensus of four genomic models were considered as positive samples. On the other hand, an equal number of negative samples were obtained from the random pairing of probable negative candidates of rice and M. grisea.
2.5.1 Features extraction
The widely used features, amino acid composition (AAC), and conjoint triad (CT) were extracted from protein sequences.
2.5.2 Amino acid composition
AAC provides a 20-dimensional feature vector for each protein. For each query protein y, let f(xi) denote the frequencies of occurrence of its 20-amino acid constituent. Hence, the amino acid composition (Px) in the query protein has been represented by
and the protein x in the composition space was defined as: P(x) = [P1(x), P2(x),…, P20(x)]. By combining their distinct AAC, each pair of host–pathogen PPI is represented by a 40-length feature vector.
2.5.3 Conjoint triad
Shen et al. (Hulbert et al., 2001) first introduced the “Conjoint triad” descriptor for the protein sequence in predicting the PPIs. Based on their electrostatic and hydrophobic properties of side chain residues, the 20 native amino acids were grouped into seven classes. Each protein was described by a 343-dimensional feature vector. In the present study, to represent each PPI, the CT descriptors of the host and pathogen proteins were concatenated, resulting in the construction of 686-dimensional feature vectors. A detailed schematic experimental depiction of the constructed machine learning model is shown in Figure 7.
3 Results and discussion
PPI has a very important role in predicting the target protein function (Rao et al., 2014). The complete protein–protein predicted network has also been visualized using the Cytoscape tool (Simonsen et al., 2012) and shown in Figure 8.
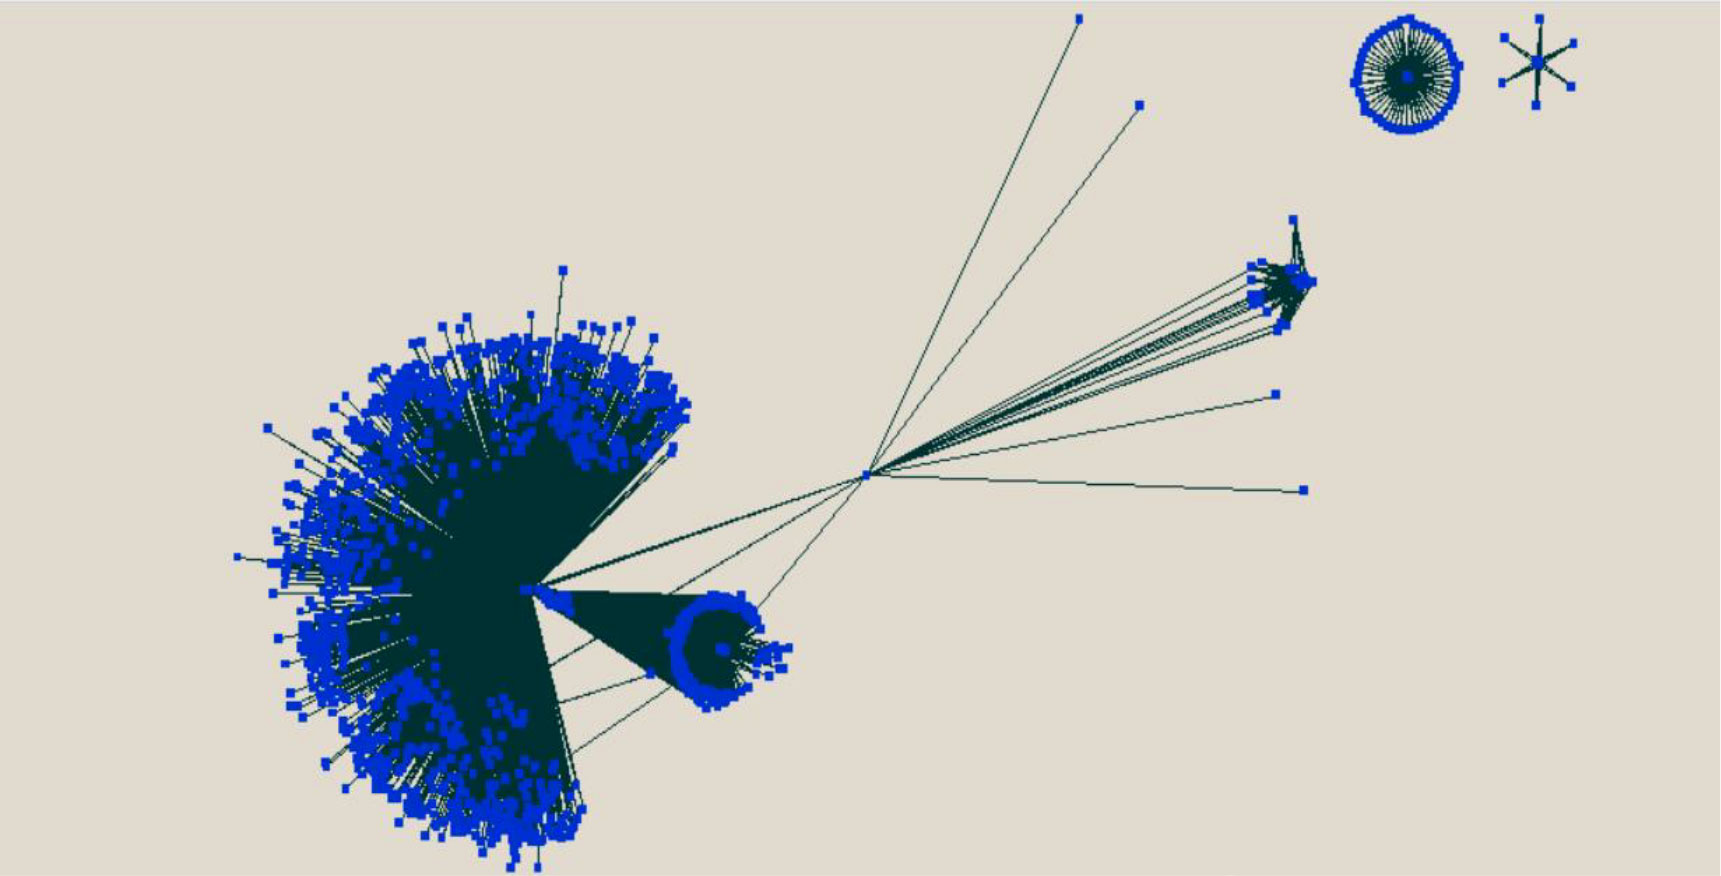
Figure 8 Visualization of the predicted protein–protein interaction between rice and M. grisea using the Cytoscape tool.
3.1 Analysis of functional enrichment of proteins involved in the interaction
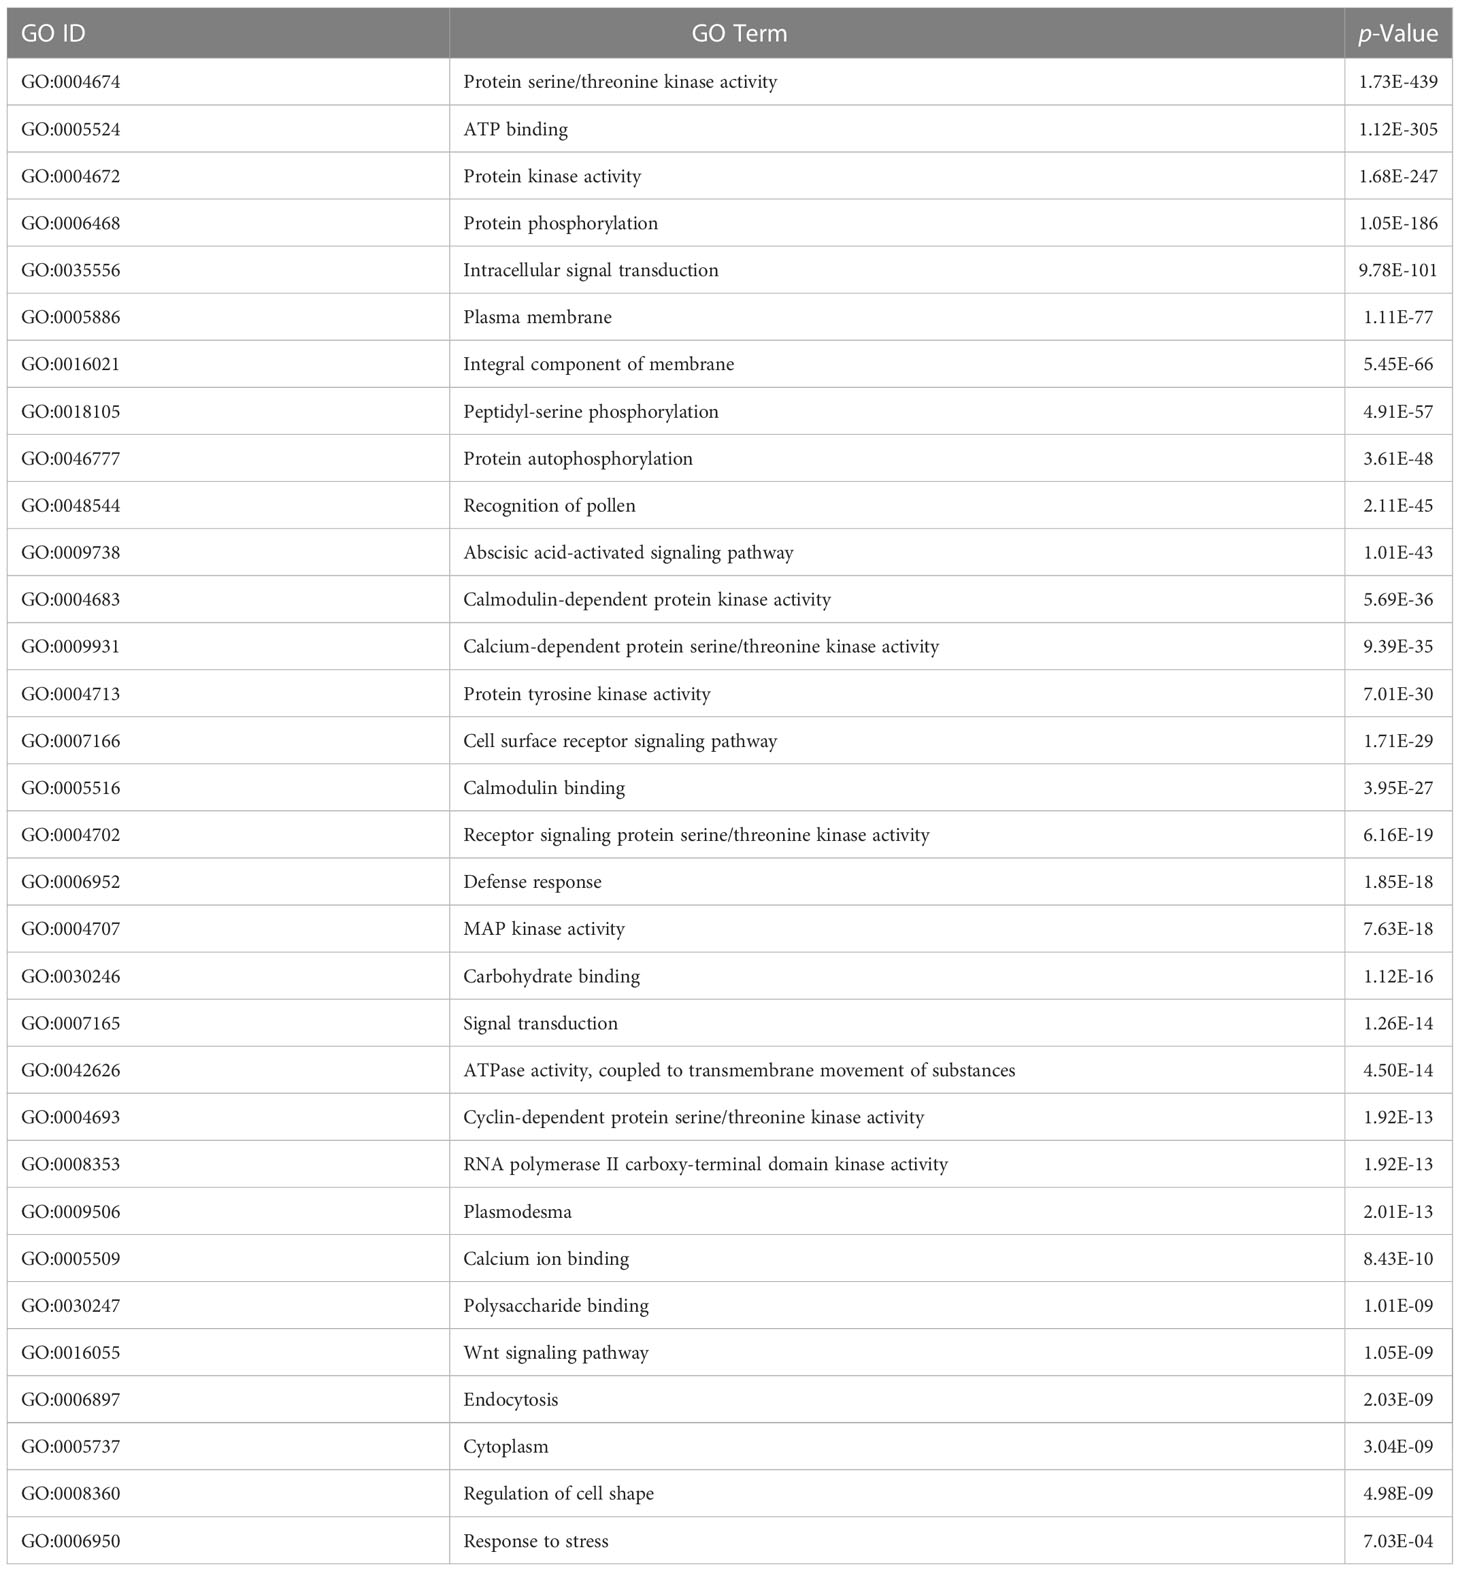
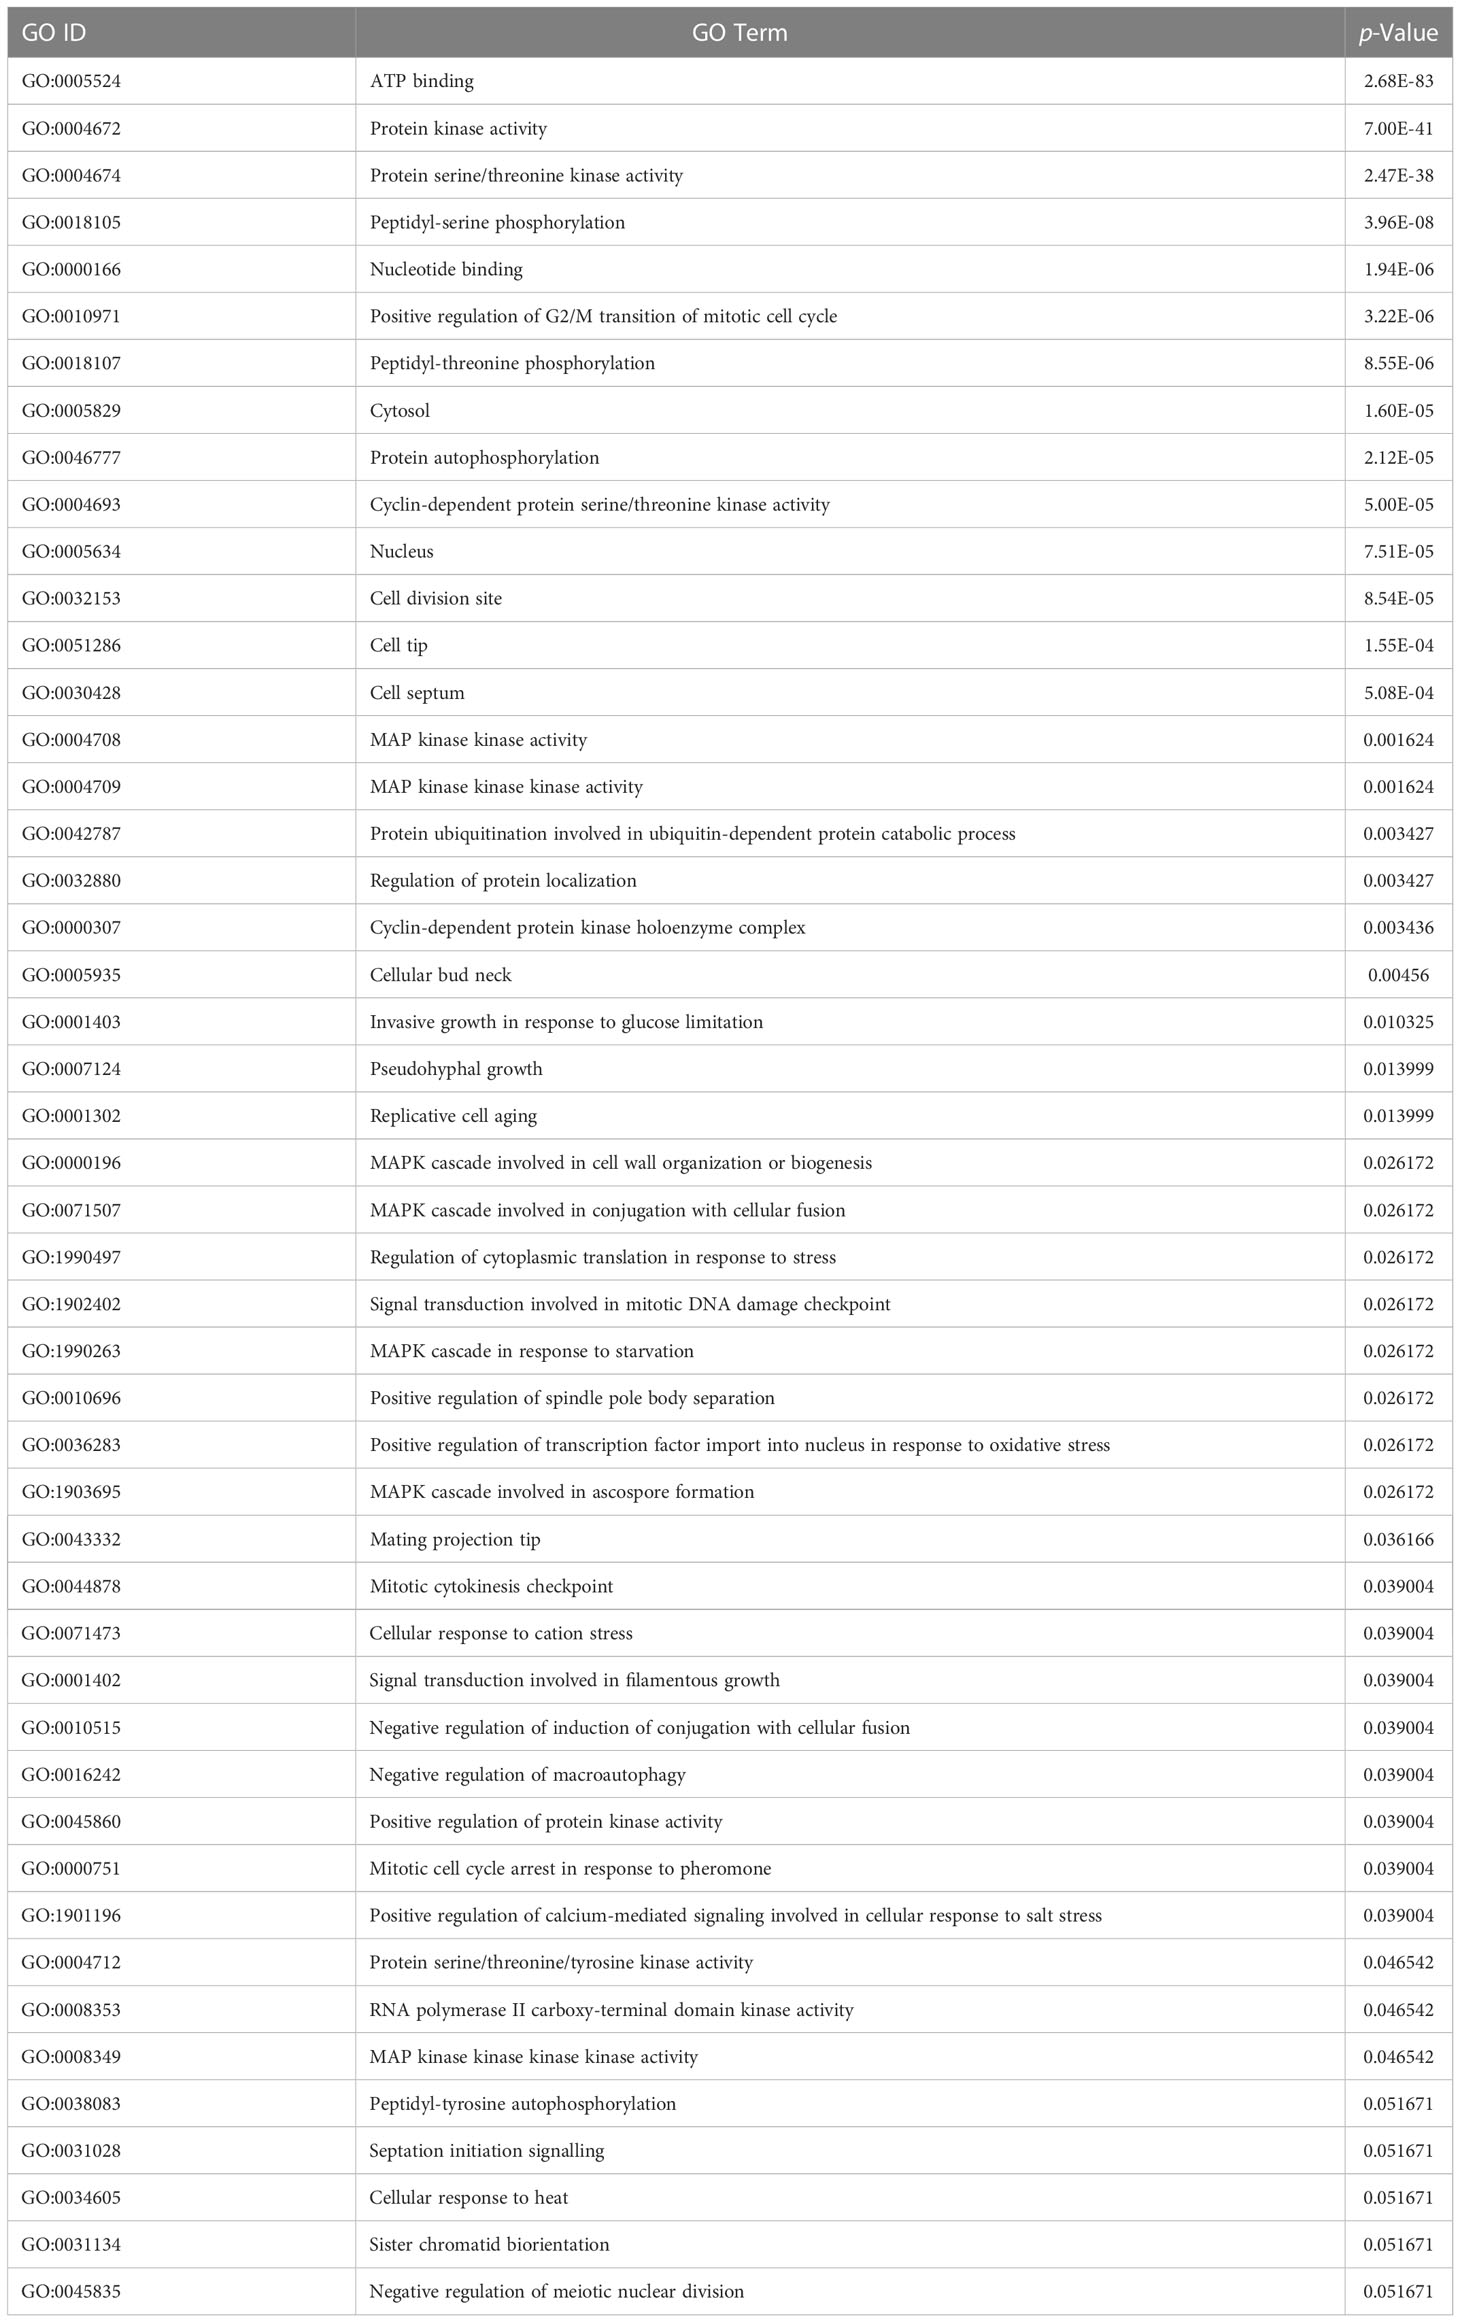
The Database for Annotation Visualization and Integrated Discovery (DAVID) v6.8 is a widely used tool to verify the functional significance of the predicted host and pathogen proteins implicated in PPIs (Dennis et al., 2003). The GO enrichment analysis is conducted to observe the functional relevance of proteins used. The enrichment analysis of rice and M. grisea proteins has been listed in Tables 3, 4, respectively. The GO terms having a p-value of less than 0.05 were identified to be enriched in predicted proteins.
It is inferred that many proteins were involved in biological processes related to metal and cadmium ions. It has been described that metal ion is required for plant defense (Fones et al., 2010; Jain and Bader, 2010). It was detected that genes are enriched with protein such as protein kinase activity, ATP binding, serine/threonine kinase activity, intracellular signal transduction, and protein phosphorylation, which are related to interaction (Jia et al., 2000; Cesari et al., 2013). Similarly, in M. grisea, the biological process such as ATP binding, protein kinase activity, protein serine/threonine kinase activity, and peptidyl-serine phosphorylation was enriched in the predicted genes. From the literature, it has been inferred that the identified biological process and function are closely related to the host–pathogen interaction (Pellegrini et al., 1999; Jia et al., 2000; Hulbert et al., 2001; Krogh et al., 2001; Aloy and Russell (2002); Dennis et al., 2003; Ng et al., 2003; Bendtsen et al., 2004; Glazko and Mushegian, 2004; Salwinski et al., 2004; Barker and Pagel, 2005; Dean et al., 2005; Quevillon et al., 2005; Chou and Shen, 2007; Dyer et al., 2007; Huang et al., 2007; He et al., 2008; Jaeger et al., 2008; Najafabadi and Salavati, 2008; Parker et al., 2008; Ribot et al., 2008; Fones et al., 2010; Jain and Bader, 2010; Kumar and Nanduri, 2010; Mukhtar et al., 2011; Bai et al., 2012; Braun and Gingras, 2012; Das et al., 2012; Li et al., 2012; Maetschke et al., 2012; Mentlak et al., 2012; Park et al., 2012; Schleker et al., 2012; Cesari et al., 2013; Meyer et al., 2013; Devanna et al., 2014; Mosca et al., 2014; Rao et al., 2014; Sahu et al., 2014; Fujisaki et al., 2015; Huo et al., 2015; Nourani et al., 2015; Li et al., 2016; Berkey et al., 2017; Klopfenstein et al., 2018; Savojardo et al., 2018; Ding and Daisuke, 2019; El-Gebali et al., 2019; Karan et al., 2019; Ma et al., 2019; Sahu et al., 2019; Loaiza et al., 2020; Lu et al., 2020; Farooq et al., 2021; Rapposelli et al., 2021; Kumar et al., 2022; Mishra et al., 2022; Shoemaker and Panchenko, 2007).
3.2 Subcellular localization of rice proteins
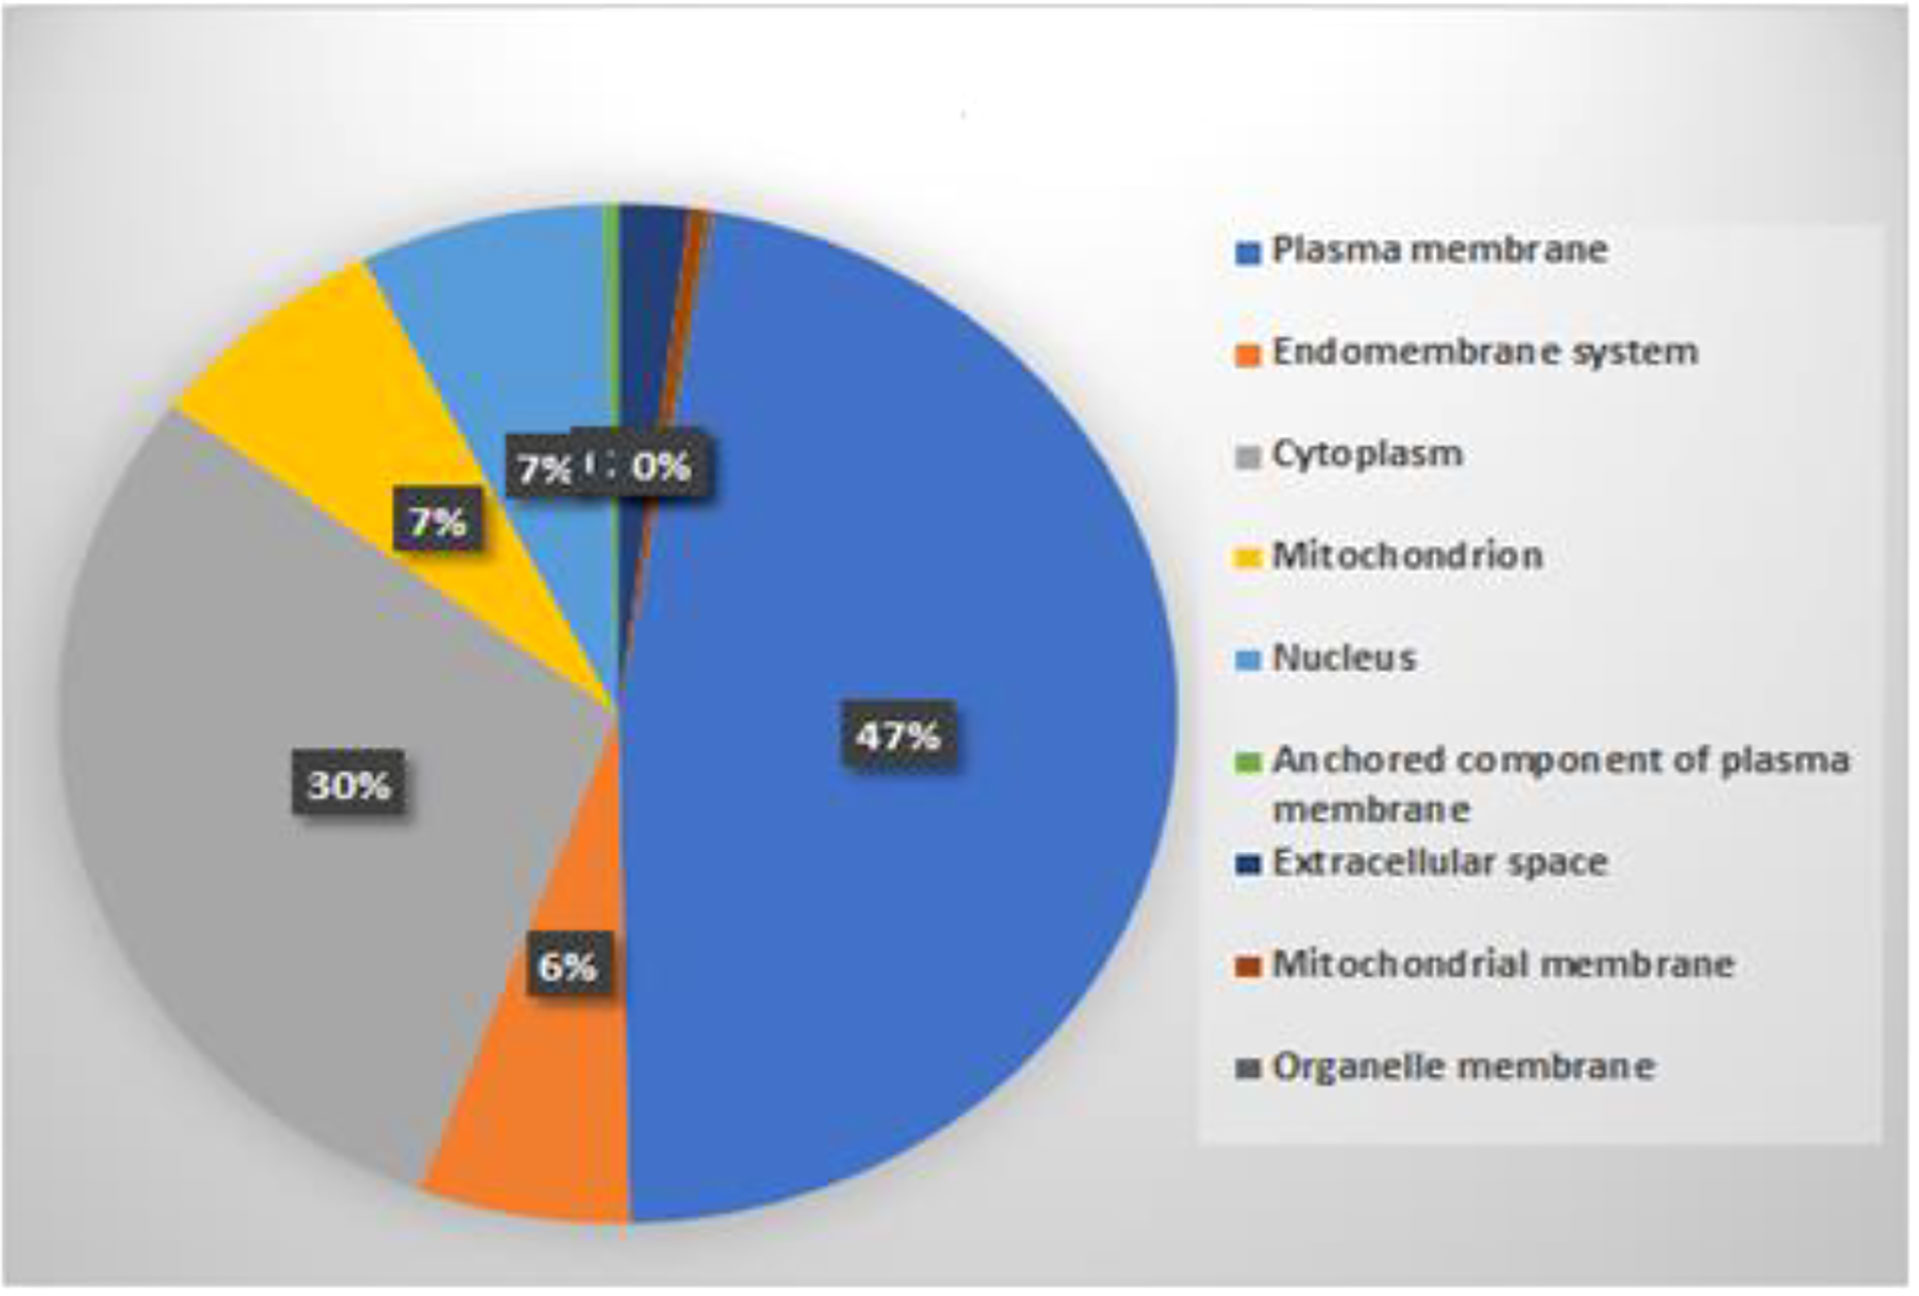
To check the location of predicted interacting rice proteins, their subcellular localization was extracted using BUSCA (Savojardo et al., 2018). Results revealed that subcellular localization of predicted proteins was distributed in the cytoplasm, plasma membrane, nucleus, mitochondria, extracellular space, and endomembrane by 46%, 29%, 7%, 7%, 2%, and 6%, respectively, as shown in Figure 9. The subcellular localization of gene product with the site of their interactions has already been reported (Bai et al., 2012; Das et al., 2012; Berkey et al., 2017; Singh et al., 2020). A detailed list of cloned blast resistance gene Pi54 overexpressed in rice for understanding its cellular and subcellular localization and response to different pathogens has been reported (Singh et al., 2020). Due to the advancement in rapid genome sequencing techniques, annotation and subcellular localization of uncharacterized plant proteins are very important. Considering this important challenge, classifiers, namely, Plant-PLoc and Plant-mSubP, have been developed and reported for large-scale subcellular location prediction for plant proteins (Chou and Shen, 2007; Sahu et al., 2019). Our predicted result infers that a major interaction occurs in the plasma membrane and cytoplasm, which is in line with the literature.
3.3 Identified hub protein in rice and M. grisea
In biological networks, PPI hubs have a significant role in the pathogenicity mechanism. The hub proteins that have many interacting partners were identified. The top 20 hub proteins with their interacting partners are shown in Figure 10.
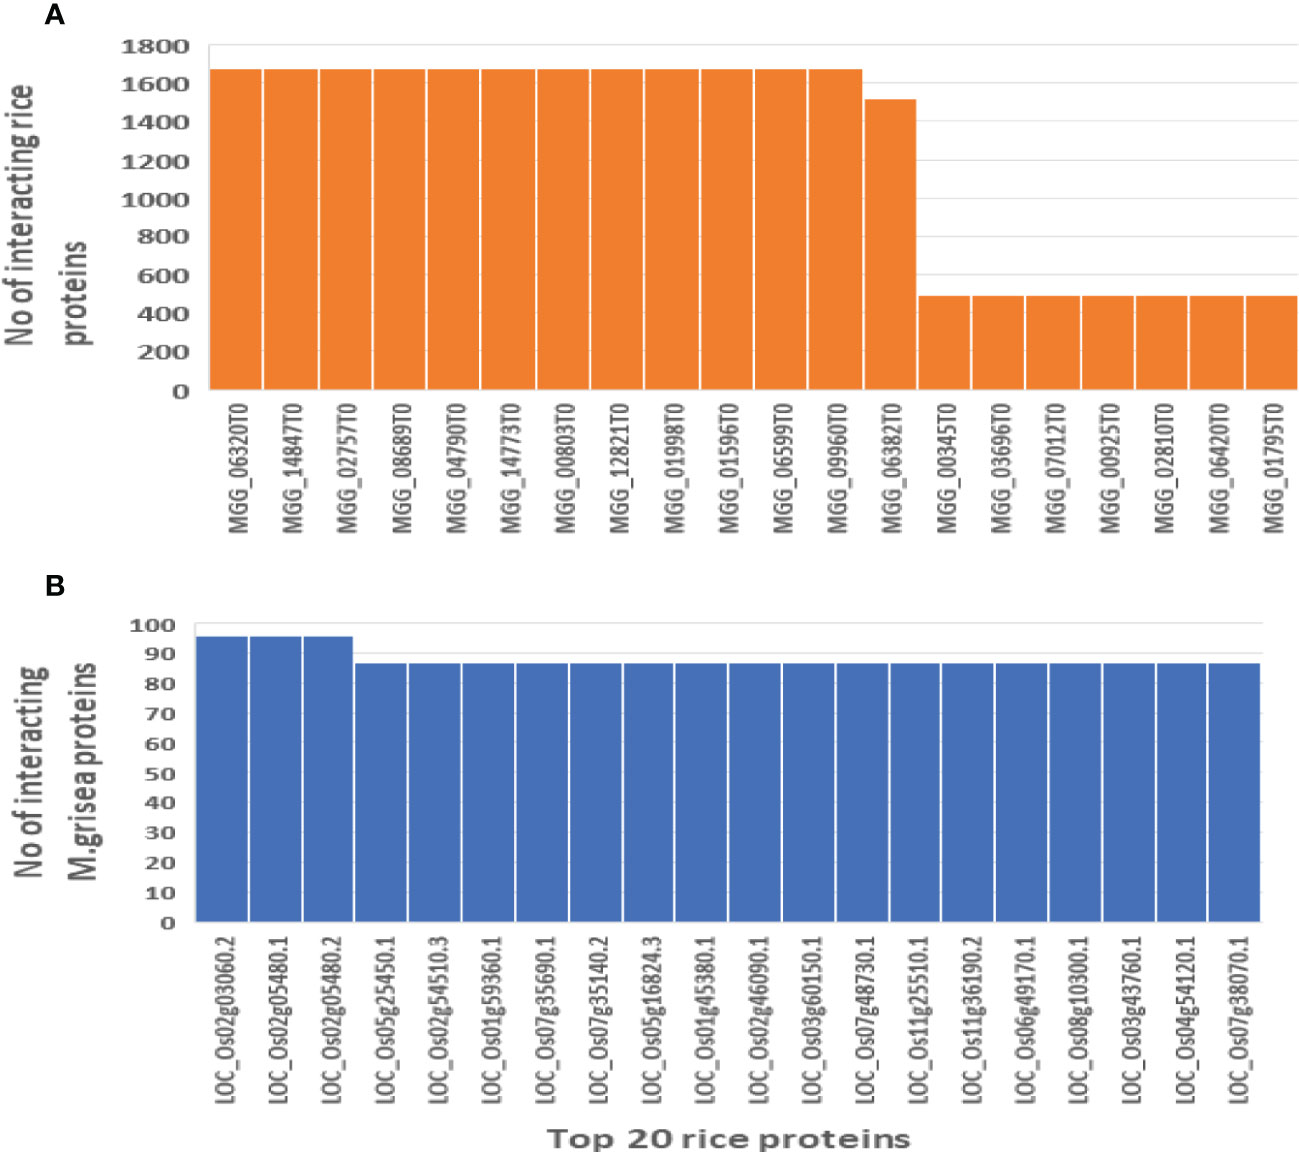
Figure 10 Hub nodes in the rice and M. grisea protein–protein interaction network. (A) Number of interactions in top 20 rice hub proteins and (B) number of interactions in top 20 M. grisea hub proteins.
These identified hub proteins might be used for drug target design. From Table 2, it is inferred that rice proteins like LOC_Os02g03060.2, LOC_Os02g05480.1, LOC_Os02g05480.2, LOC_Os05g25450.1, LOC_Os02g54510.3, and LOC_Os01g59360.1 were involved in more than 80 interactions with M. grisea. On the other hand, in case of M. grisea out of 126 proteins, 49 were involved in multiple interactions. The top 11 M. grisea proteins are MGG_06320T0, MGG_14847T0, MGG_02757T0, MGG_08689T0, MGG_04790T0, MGG_14773T0, MGG_00803T0, MGG_12821T0, MGG_01998T0, MGG_01596T0, and MGG_06599T0 (Table 2). These M. grisea pathogen proteins are interacting with more than 1,600 rice proteins, indicating that these genes are important for interaction and pathogenesis.
3.4 Development of the machine learning model
3.4.1 Training/testing schema
To develop the machine learning model, a total of 59,430 computationally predicted PPIs have been used as a positive dataset whereas a negative dataset was prepared by random pairing of the negative candidate proteins generated from a filtered non-interacting sequence of rice and M. grisea as described in Section 2. Here, a fivefold cross-validation scheme was used for model development (Karan et al., 2019; Li et al., 2016). Training accuracies of 95% and 99% were obtained with AAC and CT features, respectively (Sahu et al., 2014). SVM-based testing performance for AAC indicated its accuracy, sensitivity, and specificity as 88%, 89%, and 86%, respectively. On the other hand, SVM-based testing performance for CT provides an accuracy, sensitivity, and specificity of 89%, 84%, and 93%, respectively (Table 5). Furthermore, the model was assessed with 22 experimentally verified PPIs as an independent test set. Importantly, 21 out of 22 samples were predicted as positive based on CT features (Table 5).
3.4.2 Testing with other host–pathogen systems
The predicted model was further assessed with various host–pathogen systems to evaluate its reliability. Datasets of animal with Bacillus (set 1), hepatitis C virus (set 2), measles virus (set 3), Yersinia (set 4), and herpes virus (set 5) were used for analysis. While the dataset of the Arabidopsis thaliana plant was used for analysis with Pseudomonas syringae (set 6). The animal pathogen database was extracted from HPIDB 2.0 version while the Arabidopsis thaliana–Pseudomonas syringae database was extracted from Mukhtar et al. (2011) and Tully et al. (2014). The false-positive results are shown in Table 6. AAC feature analysis revealed that the percentage of false-positive values for sets 1 to 5 was 21%, 0.02%, 2%, 14%, and 8%, respectively. The percentage of false-positive value between Arabidopsis thaliana with Pseudomonas syringae (set) was 41%. On the other hand, CT feature analysis revealed that the percentage of false-positive values for sets 1 to 6 was 12%, 14%, 11%, 9%, 6%, and 5%, respectively. The percentage of false-positive value between Arabidopsis thaliana with Pseudomonas syringae was 15%. From Table 6, it is noticed that the prediction accuracy of average FP positive is approximately 14.33% in case of AAC and 11.6% using CT features. This revealed that the model was specific to rice and M. grisea.

Table 6 Comparative performance of amino acid composition and conjoint triad features with other host–pathogen systems.
The machine learning model performance was compared with a similar study reported previously by Ma et al. (2019) who have reported 532 potential PPIs using interolog and domain-based methods. The similar number of negative PPIs are extracted from the negative datasets obtained by the random pairing of filtered rice and M. grisea protein sequence. A machine learning model using support vector machine is developed using 532 positive and 532 negative PPIs. The obtained machine learning model was tested with 22 experimental datasets (Table 1). A total of 17 PPIs are predicted using AAC features with an accuracy of 77%. Also, the developed machine model was tested with CT features, and it provides 95% accuracy (Table 7).

Table 7 SVM-based comparative prediction result of amino acid composition and conjoint triad features in the experimental verified dataset with the Ma et al. (2019) model and our proposed model.
The main difference between the work of Ma et al. (2019) and our proposed work was in the filtering process involved. Ma et al. removed the PPIs with rice fungus proteins annotated with non-membrane and non-secreted ones from the intersection potential PPIs obtained from interolog and domain-based models. In contrast, in the present study, both rice and fungus proteins were first filtered out using a well-analyzed filtering process. The interolog and domain-based model was employed on the filtered database. The limitation of Ma et al.’s work was that the developed machine learning model was not tested with an independent dataset and other host–pathogen systems. Zheng et al. (2021) presented a computer methodology for structurally based plant–pathogen PPI prediction in rice and fungus.
PPI has a key role in predicting the functions of uncharacterized protein as well as in determining its role in the phenotypic responses. PPIs are involved in controlling the various biological processes like cell-to-cell interactions as well as metabolic and developmental processes (Braun and Gingras, 2012). Reports describing the PPIs in drug discovery (Rapposelli et al., 2021), the development of PPI modulators (Lu et al., 2020), and PPI applications in virus–host study (Farooq et al., 2021) have been published. Also, a rice protein interaction network revealing high centrality nodes and candidate pathogen effector targets (Mishra et al., 2022) and another pipeline of integrating transcriptome and interactome for elucidating central nodes in host–pathogen interactions (Kumar et al., 2022) have been published. The present study provides a genome-wide PPI between rice and M. grisea. Furthermore, it is accurate and computationally inexpensive because of its filtering process prior to computational model development. Furthermore, a validation study on predicted PPI subcellular localization may also be carried out in the future.
4 Conclusion
In this study, several computational models are developed using the interolog, domain, GO, and phylogenetic information to predict the PPI between rice and M. grisea in a genome. A total of 59,430 highly confident PPIs are predicted between 1,801 rice proteins and 135 M. grisea proteins. The GO enrichment analysis shows that the predicted proteins are involved in interactions related to functionalities. Furthermore, to assess the effectiveness of predicted PPIs, a machine learning model based on support vector machine is developed. Based on the fivefold cross-validation test, better accuracy is obtained using AAC and CT features of protein sequence. Furthermore, the proposed model was tested on 22 experimentally identified PPIs between rice and M. grisea in an independent test that resulted in the prediction of 21 PPIs as positive using CT features. The reliability of the proposed model is also checked for PPIs on various host–pathogen systems. The proposed model predicted a lower number of PPIs as positive, inferring that the method is specific to rice and M. grisea. The predicted PPIs could be a useful resource for further studies on the rice–M. grisea interaction mechanism.
Data availability statement
The original contributions presented in the study are included in the article/Supplementary Material. Further inquiries can be directed to the corresponding author.
Author contributions
BK: Methodology, Software, Writing – original draft; SM: Validation, Investigation, Writing - review & editing. SS: Methodology, review & editing; DP: Validation, Investigation; SC: review & editing. All authors contributed to the article and approved the submitted version.
Funding
This work has been supported by the DST-SERB, Govt. of India, under grant ECR/2017/000345.
Conflict of interest
The authors declare that the research was conducted in the absence of any commercial or financial relationships that could be construed as a potential conflict of interest.
Publisher’s note
All claims expressed in this article are solely those of the authors and do not necessarily represent those of their affiliated organizations, or those of the publisher, the editors and the reviewers. Any product that may be evaluated in this article, or claim that may be made by its manufacturer, is not guaranteed or endorsed by the publisher.
Supplementary material
The Supplementary Material for this article can be found online at: https://www.frontiersin.org/articles/10.3389/fpls.2022.1046209/full#supplementary-material
References
Aloy, P., Russell, R. B. (2002). Interrogating protein interaction networks through structural biology. Proc. Natl. Acad. Sci. 99 (9), 5896–5901. doi: 10.1073/pnas.092147999
Bai, S., Liu, J., Chang, C., Zhang, L., Maekawa, T., Wang, Q., et al. (2012). Structure-function analysis of barley NLR immune receptor MLA10 reveals its cell compartment specific activity in cell death and disease resistance. PloS Pathog. 8 (6), e1002752. doi: 10.1371/journal.ppat.1002752
Barker, D., Pagel, M. (2005). Predicting functional gene links from phylogenetic-statistical analyses of whole genomes. PloS Comput. Biol. 1 (1), e3. doi: 10.1371/journal.pcbi.0010003
Bendtsen, J. D., Nielsen, H., Von Heijne, G., Brunak, S. (2004). Improved prediction of signal peptides: SignalP 3.0. J. Mol. Biol. 340 (4), 783–795. doi: 10.1016/j.jmb.2004.05.028
Berkey, R., Zhang, Y., Ma, X., King, H., Zhang, Q., Wang, W., et al. (2017). Homologues of the RPW8 resistance protein are localized to the extra haustorial membrane that is likely synthesized de novo. Plant Physiol. 173 (1), 600–613. doi: 10.1104/pp.16.01539
Braun, P., Gingras, A. C. (2012). History of protein-protein interactions: From egg-white to complex networks. Proteomics. 12 (10), 1478–1498. doi: 10.1002/pmic.201100563
Cesari, S., Thilliez, G., Ribot, C., Chalvon, V., Michel, C., Jauneau, A., et al. (2013). The rice resistance protein pair RGA4/RGA5 recognizes the magnaporthe oryzae effectors AVR-pia and AVR1-CO39 by direct binding. Plant Cell 25 (4), 1463–1481. doi: 10.1105/tpc.112.107201
Chou, K. C., Shen, H. B. (2007). Large-Scale plant protein subcellular location prediction. J. Cell Biochem. 100 (3), 665–678. doi: 10.1002/jcb.21096
Das, A., Soubam, D., Singh, P. K., Thakur, S., Singh, N. K., Sharma, T. R., et al. (2012). A novel blast resistance gene, Pi54rh cloned from wild species of rice, oryza rhizomatis confers broad spectrum resistance to magnaporthe oryzae. Funct. Integr. Genomics 12, 215–228. doi: 10.1007/s10142-012-0284-1
Dean, R. A., Talbot, N. J., Ebbole, D. J., Farman, M. L., Mitchell, T. K., Orbach, M. J., et al. (2005). The genome sequence of the rice blast fungus magnaporthe grisea. Nature 434 (7036), 980–986. doi: 10.1038/nature03449
Dennis, G., Sherman, B. T., Hosack, D. A., Yang, J., Gao, W., Clifford Lane, H., et al. (2003). DAVID: Database for annotation, visualization, and integrated discovery. Genome Biol. 4, R60. doi: 10.1186/gb-2003-4-9-r60
Devanna, N. B., Vijayan, J., Sharma, T. R. (2014). The blast resistance gene Pi54of cloned from oryza officinalis interacts with avr-Pi54 through its novel non-LRR domains. PloS One 9 (8), e104840. doi: 10.1371/journal.pone.0104840
Ding, Z., Daisuke, K. (2019). Computational identification of protein-protein interactions in model plant proteomes. Sci. Rep. 9, 1–13. doi: 10.1038/s41598-019-45072-8
Dyer, M. D., Murali, T. M., Sobral, B. W. (2007). Computational prediction of host-pathogen protein–protein interactions. Bioinformatics 23 (13), i159–i166. doi: 10.1093/bioinformatics/btm208
El-Gebali, S., Mistry, J., Bateman, A., Eddy, S. R., Luciani, A., Potter, S. C., et al. (2019). The pfam protein families database in 2019. Nucleic Acids Res. 47 (D1), D427–D432. doi: 10.1093/nar/gky995
Farooq, Q. U. A., Shaukat, Z., Aiman, S., Li, C. H. (2021). Protein-protein interactions: Methods, databases, and applications in virus-host study. World J. Virol. 10 (6), 288–300. doi: 10.5501/wjv.v10.i6.288
Fones, H., Davis, C. A., Rico, A., Fang, F., Smith, J. A. C., Preston, G. M. (2010). Metal hyperaccumulation armors plants against disease. PLoSPathog 6 (9), e1001093. doi: 10.1371/journal.ppat.1001093
Fujisaki, K., Abe, Y., Ito, A., Saitoh, H., Yoshida, K., Kanzaki, H., et al. (2015). Rice Exo70 interacts with a fungal effector, AVR-pii, and is required for AVR-pii-triggered immunity. Plant J. 83 (5), 875–887. doi: 10.1111/tpj.12934
Glazko, G. V., Mushegian, A. R. (2004). Detection of evolutionarily stable fragments of cellular pathways by hierarchical clustering of phyletic patterns. Genome Biol. 5, R32. doi: 10.1186/2004-5-5-r32
He, F., Zhang, Y., Chen, H., Zhang, Z., Peng, Y. L. (2008). The prediction of protein-protein interaction networks in rice blast fungus. BMC Genomics 9 (1), 519. doi: 10.1186/1471-2164-9-519
Huang, C., Morcos, F., Kanaan, S. P., Wuchty, S., Chen, D. Z., Izaguirre, J. A. (2007). Predicting protein-protein interactions from protein domains using a set cover approach. IEEE/ACM Trans. Comput. Biol. Bioinf. 4 (1), 78–87. doi: 10.1109/TCBB.2007.1001
Hulbert, S. H., Webb, C. A., Smith, S. M., Sun, Q. (2001). Resistance gene complexes: Evolution and utilization. Annu. Rev. Phytopathol. 39 (1), 285–312. doi: 10.1146/annurev.phyto.39.1.285
Huo, T., Liu, W., Guo, Y., Yang, C., Lin, J., Rao, Z. (2015). Prediction of host-pathogen protein interactions between mycobacterium tuberculosis and homo sapiens using sequence motifs. BMC Bioinf. 16 (1), 100. doi: 10.1186/s12859-015-0535-y
Jaeger, S., Gaudan, S., Leser, U., Rebholz-Schuhmann, D. (2008). Integrating protein-protein interactions and text mining for protein function prediction. In BMC Bioinf. 9 (S8), S2. doi: 10.1186/1471-2105-9-S8-S2
Jain, S., Bader, G. D. (2010). An improved method for scoring protein-protein interactions using semantic similarity within the gene ontology. BMC Bioinf. 11 (1), 562. doi: 10.1186/1471-2105-11-562
Jia, Y., McAdams, S. A., Bryan, G. T., Hershey, H. P., Valent, B. (2000). Direct interaction of resistance gene and a virulence gene products confers rice blast resistance. EMBO J. 19 (15), 4004–4014. doi: 10.1093/emboj/19.15.4004
Karan, B., Mahapatra, S., Sahu, S. S. (2019). “Prediction of protein interactions in rice and blast fungus using machine learning,” in 2019 International Conference on Information Technology (ICIT). 33–36 (IEEE). doi: 10.1109/ICIT48102.2019.00012
Klopfenstein, D. V., Zhang, L., Pedersen, B. S., Ramirez, F., Vesztrocy, A. W., Naldi, A., et al. (2018). GOATOOLS: A Python library for gene ontology analyses. Sci. Rep. 8 (1), 1–17. doi: 10.1038/s41598-018-28948-z
Krogh, A., Larsson, B., Von Heijne, G., Sonnhammer, E. L. (2001). Predicting transmembrane protein topology with a hidden Markov model: application to complete genomes. J. Mol. Biol. 305 (3), 567–580. doi: 10.1006/jmbi.2000.4315
Kumar, N., Mishra, B., Mukhtar, M. S. (2022). A pipeline of integrating transcriptome and interactome to elucidate central nodes in host-pathogens interactions. STAR Protoc. 3 (3), 101608. doi: 10.1016/j.xpro.2022.101608
Kumar, R., Nanduri, B. (2010). HPIDB-a unified resource for host-pathogen interactions. In BMC Bioinf. 11 (S6), S16. doi: 10.1186/1471-2105-11-S6-S16
Li, Z. G., He, F., Zhang, Z., Peng, Y. L. (2012). Prediction of protein–protein interactions between ralstonia solanacearum and arabidopsis thaliana. Amino Acids 42 (6), 2363–2371. doi: 10.1007/s00726-011-0978-z
Li, Z., Liu, Z., Zhong, W., Huang, M., Wu, N., Xie, Y., et al. (2016). Large-Scale identification of human protein function using topological features of interaction network. Sci. Rep. 6, 37179. doi: 10.1038/srep37179
Loaiza, C. D., Duhan, N., Lister, M., Kaundal, R. (2020). In silico prediction of host–pathogen protein interactions in melioidosis pathogen burkholderia pseudomallei and human reveals novel virulence factors and their targets. Briefings Bioinf. 22(3), bbz162. doi: 10.1093/bib/bbz162
Lu, H., Zhou, Q., He, J., Jiang, Z., Peng, C., Tong, R., et al. (2020). Recent advances in the development of protein–protein interactions modulators: mechanisms and clinical trials. Sig Transduct Target Ther. 5, 213. doi: 10.1038/s41392-020-00315-3
Ma, S., Song, Q., Tao, H., Harrison, A., Wang, S., Liu, W., et al. (2019). Prediction of protein–protein interactions between fungus (Magnaporthegrisea) and rice (Oryza sativa l.). Briefings Bioinf. 20 (2), 448–456. doi: 10.1093/bib/bbx132
Maetschke, S. R., Simonsen, M., Davis, M. J., Ragan, M. A. (2012). Gene ontology-driven inference of protein–protein interactions using inducers. Bioinformatics 28 (1), 69–75. doi: 10.1093/bioinformatics/btr610
Mentlak, T. A., Kombrink, A., Shinya, T., Ryder, L. S., Otomo, I., Saitoh, H., et al. (2012). Effector-mediated suppression of chitin-triggered immunity by magnaporthe oryzae is necessary for rice blast disease. Plant Cell 24 (1), 322–335. doi: 10.1105/tpc.111.092957
Meyer, M. J., Das, J., Wang, X., Yu, H. (2013). INstruct: A database of high-quality 3D structurally resolved protein interactome networks. Bioinformatics 29 (12), 1577–1579. doi: 10.1093/bioinformatics/btt181
Mishra, B., Kumar, N., Shahid Mukhtar, M. (2022). A rice protein interaction network reveals high centrality nodes and candidate pathogen effector targets. Comput. Struct. Biotechnol. J. 20 (2022), 2001–2012. doi: 10.1016/j.csbj.2022.04.027
Mosca, R., Ceol, A., Stein, A., Olivella, R., Aloy, P. (2014). 3did: A catalog of domain-based interactions of known three-dimensional structure. Nucleic Acids Res. 42 (D1), D374–D379. doi: 10.1093/nar/gkt887
Mukhtar, M. S., Carvunis, A. R., Dreze, M., Epple, P., Steinbrenner, J., Moore, J., et al. (2011). Independently evolved virulence effectors converge onto hubs in a plant immune system network. Science 333 (6042), 596–601. doi: 10.1126/science.1203659
Najafabadi, H. S., Salavati, R. (2008). Sequence-based prediction of protein-protein interactions by means of codon usage. Genome Biol. 9 (5), 1–9. doi: 10.1186/gb-2008-9-5-r87
Ng, S. K., Zhang, Z., Tan, S. H. (2003). Integrative approach for computationally inferring protein domain interactions. Bioinformatics 19 (8), 923–929. doi: 10.1093/bioinformatics/btg118
Nourani, E., Khunjush, F., Durmuş, S. (2015). Computational approaches for prediction of pathogen-host protein-protein interactions. Front. Microbiol. 6. doi: 10.3389/fmicb.2015.00094
Park, C. H., Chen, S., Shirsekar, G., Zhou, B., Khang, C. H., Songkumarn, P., et al. (2012). The magnaporthe oryzae effector AvrPiz-t targets the RING E3 ubiquitin ligase APIP6 to suppress pathogen-associated molecular pattern–triggered immunity in rice. Plant Cell 24 (11), 4748–4762. doi: 10.1105/tpc.112.105429
Parker, D., Beckmann, M., Enot, D. P., Overy, D. P., Rios, Z. C., Gilbert, M., et al. (2008). Rice blast infection of brachypodium distachyon as a model system to study dynamic host/pathogen interactions. Nat. Protoc. 3 (3), 435. doi: 10.1038/nprot.2007.499
Pellegrini, M., Marcotte, E. M., Thompson, M. J. (1999). David Eisenberg,Todd o. yeates, assigning protein functions by comparative genome analysis: Protein phylogenetic profiles. Proc. Natl. Acad. Sci. 96, 4285–4288. doi: 10.1073/pnas.96.8.4285
Quevillon, E., Silventoinen, V., Pillai, S., Harte, N., Mulder, N., Apweiler, R., et al. (2005). InterProScan: protein domains identifier. Nucleic Acids Res. 33 (suppl_2), W116–W120. doi: 10.1093/nar/gki442
Rao, V. S., Srinivas, K., Sujini, G. N., Kumar, G. N. (2014). Protein-protein interaction detection: methods and analysis. Int. J. Proteomics. 147648. doi: 10.1155/2014/147648
Rapposelli, S., Gaudio, E., Bertozzi, F., Gul, S. (2021). Editorial: Protein–protein interactions: Drug discovery for the future. Front. Chem. 9. doi: 10.3389/fchem.2021.811190
Ribot, C., Hirsch, J., Balzergue, S., Tharreau, D., Nottéghem, J. L., Lebrun, M. H., et al. (2008). Susceptibility of rice to the blast fungus, magnaporthe grisea. J. Plant Physiol. 165 (1), 114–124. doi: 10.1016/j.jplph.2007.06.013
Sahu, S. S., Loaiza, C. D., Kaundal, R. (2019). Plant-mSubP: A computational framework for the prediction of single-and multi-target protein subcellular localization using integrated machine-learning approaches. AoB Plants 12 (3), 1–10. doi: 10.1093/aobpla/plz068
Sahu, S. S., Weirick, T., Kaundal, R. (2014). Predicting genome-scale arabidopsis-pseudomonas syringae interactome using domain and interolog-based approaches. In BMC Bioinf. 15 (S11), S13. doi: 10.1186/1471-2105-15-S11-S13
Salwinski, L., Miller, C. S., Smith, A. J., Pettit, F. K., Bowie, J. U., Eisenberg, D. (2004). The database of interacting proteins: 2004 update. Nucleic Acids Res. 32 (suppl_1), D449–D451. doi: 10.1093/nar/28.1.289
Savojardo, C., Martelli, P. L., Fariselli, P., Profiti, G., Casadio, R. (2018). BUSCA: An integrative web server to predict subcellular localization of proteins. Nucleic Acids Res. 46 (W1), W459–W466. doi: 10.1093/nar/gky320
Schleker, S., Garcia-Garcia, J., Klein-Seetharaman, J., Oliva, B. (2012). Prediction and comparison of salmonella-human and salmonella-arabidopsis interactomes. Chem. biodiversity 9 (5), 991–1018. doi: 10.1002/cbdv.201100392
Shoemaker, B. A., Panchenko, A. R. (2007). Deciphering protein–protein interactions. part II. computational methods to predict protein and domain interaction partners. PloS Comput. Biol. 3 (4), e43. doi: 10.1371/journal.pcbi.0030043
Simonsen, M., Maetschke, S. R., Ragan, M. A. (2012). Automatic selection of reference taxa for protein–protein interaction prediction with phylogenetic profiling. Bioinformatics 28 (6), 851–857. doi: 10.1093/bioinformatics/btr720
Singh, J., Gupta, S. K., Devanna, B. N., Singh, S., Upadhyay, A., Sharma, T. R.. (2020). Blast resistance gene Pi54 over-expressed in rice to understand its cellular and sub-cellular localization and response to different pathogens. Sci. Rep. 10, 5243. doi: 10.1038/s41598-020-59027-x
Singh, R., Dangol, S., Chen, Y., Choi, J., Cho, Y. S., Lee, J. E., et al. (2016). Magnaportheoryzae effector AVR-pii helps to establish compatibility by inhibition of the rice NADP-malic enzyme resulting in disruption of oxidative burst and host innate immunity. Molecules Cells 39 (5), 426. doi: 10.14348/molcells.2016.0094
Tully, J. P., Hill, A. E., Ahmed, H. M., Whitley, R., Skjellum, A., Mukhtar, M. S. (2014). Expression-based network biology identifies immune-related functional modules involved in plant defense. BMC Genomics 15 (1), 421. doi: 10.1186/1471-2164-15-421
Wang, R. S., Wang, Y., Wu, L. Y., Zhang, X. S., Chen, L. (2007). Analysis on multi-domain cooperation for predicting protein-protein interactions. BMC Bioinf. 8 (1), 391. doi: 10.1186/1471-2105-8-391
Wang, R., Cheng, Y., Ke, X., Zhang, X., Zhang, H., Huang, J. (2020). Comparative analysis of salt responsive gene regulatory networks in rice and arabidopsis. Comput. Biol. Chem. 85, 107188. doi: 10.1016/j.compbiolchem.2019.107188
Wu, J., Kou, Y., Bao, J., Li, Y., Tang, M., Zhu, X., et al. (2015). Comparative genomics identifies the Magnaporthe oryzaea virulence effector AvrPi9 that triggers Pi9‐mediated blast resistance in rice. New Phytol. 206 (4), 1463–1475. doi: 10.1111/nph.13310
Wu, X., Zhu, L., Guo, J., Zhang, D. Y., Lin, K. (2006). Prediction of yeast protein–protein interaction network: insights from the gene ontology and annotations. Nucleic Acids Res. 34 (7), 2137–2150. doi: 10.1093/nar/gkl219
Wuchty, S. (2011). Computational prediction of host-parasite protein interactions between p. falciparum and h. sapiens. PloS One 6 (11), e26960. doi: 10.1371/journal.pone.0026960
Xue, M., Yang, J., Li, Z., Hu, S., Yao, N., Dean, R. A., et al. (2012). Comparative analysis of the genomes of two field isolates of the rice blast fungus magnaporthe oryzae. PloS Genet. 8 (8), e1002869. doi: 10.1371/journal.pgen.1002869
Yoshida, K., Saitoh, H., Fujisawa, S., Kanzaki, H., Matsumura, H., Yoshida, K., et al. (2009). Association genetics reveals three novel avirulence genes from the rice blast fungal pathogen magnaporthe oryzae. Plant Cell 21 (5), 1573–1591. doi: 10.1105/tpc.109.066324
Zhang, Y., Zhang, D., Mi, G., Ma, D., Li, G., Guo, Y., et al. (2012). Using ensemble methods to deal with imbalanced data in predicting protein–protein interactions. Comput. Biol. Chem. 36, 36–41. doi: 10.1016/j.compbiolchem.2011.12.003
Zhang, Y., Zhang, S., Liu, H., Fu, B., Li, L., Xie, M., et al. (2015). Genome and comparative transcriptomics of African wild rice Oryza longistaminata provide insights into molecular mechanism of rhizomatousness and self-incompatibility. Mol. Plant 8 (11), 1683–1686. doi: 10.1016/j.molp.2015.08.006
Zheng, C., Liu, Y., Sun, F., Zhao, L., Zhang, L. (2021). Predicting protein–protein interactions between rice and blast fungus using structure-based approaches. Front. Plant Sci., 12, 1434. doi: 10.3389/fpls.2021.690124
Zhou, H., Rezaei, J., Hugo, W., Gao, S., Jin, J., Fan, M., et al. (2013). Stringent DDI-based prediction of h. sapiens-m. tuberculosis H37Rv protein-protein interactions. BMC Syst. Biol. 7 (S6), S6. doi: 10.1186/1752-0509-7-S6-S6
Keywords: rice, M. grisea, interolog, domain, gene ontology, phylogenetic, SVM
Citation: Karan B, Mahapatra S, Sahu SS, Pandey DM and Chakravarty S (2023) Computational models for prediction of protein–protein interaction in rice and Magnaporthe grisea. Front. Plant Sci. 13:1046209. doi: 10.3389/fpls.2022.1046209
Received: 16 September 2022; Accepted: 28 December 2022;
Published: 01 February 2023.
Edited by:
Jihong Hu, Northwest A&F University, ChinaReviewed by:
Deepak Singla, Punjab Agricultural University, IndiaRajesh Kumar Pathak, Chung-Ang University, Republic of Korea
Copyright © 2023 Karan, Mahapatra, Sahu, Pandey and Chakravarty. This is an open-access article distributed under the terms of the Creative Commons Attribution License (CC BY). The use, distribution or reproduction in other forums is permitted, provided the original author(s) and the copyright owner(s) are credited and that the original publication in this journal is cited, in accordance with accepted academic practice. No use, distribution or reproduction is permitted which does not comply with these terms.
*Correspondence: Sitanshu Sekhar Sahu, c3NzYWh1QGJpdG1lc3JhLmFjLmlu
 Biswajit Karan
 Satyajit Mahapatra
 Sitanshu Sekhar Sahu
 Dev Mani Pandey
 Sumit Chakravarty3