 Xin Lu1†
 Zhiqiang Zhou1†
 Yunhe Wang1,2
 Ruiqi Wang2Zhuanfang Hao1Mingshun Li1Degui Zhang1
 Hongjun Yong1Jienan Han1Zhenhua Wang2
 Jianfeng Weng1
 Yu Zhou2*Xinhai Li1*
- 1Institute of Crop Science, Chinese Academy of Agricultural Sciences, Beijing, China
- 2College of Agriculture, Northeast Agricultural University, Harbin, Heilongjiang, China
Maize with a high kernel protein content (PC) is desirable for human food and livestock fodder. However, improvements in its PC have been hampered by a lack of desirable molecular markers. To identify quantitative trait loci (QTL) and candidate genes for kernel PC, we employed a genotyping-by-sequencing strategy to construct a high-resolution linkage map with 6,433 bin markers for 275 recombinant inbred lines (RILs) derived from a high-PC female Ji846 and low-PC male Ye3189. The total genetic distance covered by the linkage map was 2180.93 cM, and the average distance between adjacent markers was 0.32 cM, with a physical distance of approximately 0.37 Mb. Using this linkage map, 11 QTLs affecting kernel PC were identified, including qPC7 and qPC2-2, which were identified in at least two environments. For the qPC2-2 locus, a marker named IndelPC2-2 was developed with closely linked polymorphisms in both parents, and when tested in 30 high and 30 low PC inbred lines, it showed significant differences (P = 1.9E-03). To identify the candidate genes for this locus, transcriptome sequencing data and PC best linear unbiased estimates (BLUE) for 348 inbred lines were combined, and the expression levels of the four genes were correlated with PC. Among the four genes, Zm00001d002625, which encodes an S-adenosyl-L-methionine-dependent methyltransferase superfamily protein, showed significantly different expression levels between two RIL parents in the endosperm and is speculated to be a potential candidate gene for qPC2-2. This study will contribute to further research on the mechanisms underlying the regulation of maize PC, while also providing a genetic basis for marker-assisted selection in the future.
1 Introduction
Maize (Zea mays L.) is an important food and forage crop (Yang et al., 2013) that is cultivated globally across 20.2 million ha, and, in 2020, 116.2 million tons were produced (https://www.fao.org). Maize kernels are composed of approximately 10% protein, 72% starch, and 4% fat (Peña-Rosas et al., 2014). Chickens and pigs fed approximately 60% maize diet required an average of 15.5% and 16.5% protein during their growth, respectively (http://www.chinafeeddata.org.cn). This indicates that the protein content (PC) of maize was not sufficient to cater to the protein requirements of the feed. Therefore, utilizing the natural genetic variation controlling kernel PC in maize and introducing elite genome fragments into breeding are essential to satisfying feed demands and sustainable agriculture development.
Advances in next-generation sequencing (NGS) and biotechnology platforms have been vital for plant improvements and helped plant breeders to achieve greater genetic gains (Mutalik Desai et al., 2020). NGS can be divided into two strategies: whole genome resequencing (WGR) and reduced-expression sequencing (RRS) (Scheben et al., 2017). Per sample, the cost of RRS is lower than that of WGR but WGR is not affected to the same extent by the biases that impact RRS (Davey et al., 2011). Reads from genotyping-by-sequencing (GBS), one of the most widely used RRS methods, can be amplified using restriction enzymes, ligation, and polymerase chain reaction (PCR) prior to alignment with the reference genome (Poland and Rife, 2012; He et al., 2014). This process has been improved by the barcode system, which allows for discovery using genome-wide single-nucleotide polymorphisms (SNPs) with a lower error rate and cost (Elshire et al., 2011). SNP markers can be used to standardize and scale genotyping, and are known for their flexibility and abundance in the genome (Hoskins et al., 2001; Mammadov et al., 2012). The resolution of quantitative trait locus (QTL) mapping was previously limited as early genetic maps were mainly based on low-density markers, such as simple sequence repeat (SSR) markers, random amplified polymorphic DNA, and random fragment length polymorphisms (Mathivathana et al., 2019). Enough markers were produced by the reduced representation libraries of the genome and used for highly dense and accurate genetic linkage map construction (Gonda et al., 2019). GBS has been widely used in genetic studies as an efficient tool for an increasing number of plant species, including maize (Zea mays L.), barley (Hordeum vulgare L.), wheat (Triticum aestivum L.), rice (Oryza sativa L.), sorghum [Sorghum bicolor (L.) Moench], soybean [Glycine max (L.) Merr.], and cassava (Manihot esculenta Crantz) (Spindel et al., 2013; Glaubitz et al., 2014; Rowan et al., 2015; Zhou et al., 2016; Su et al., 2017; Wang et al., 2020).
The combination of multi-layered genetic analysis will assist in the prediction of candidate genes to study complex quantitative traits (Tang et al., 2021; Zhang et al., 2022). Seventy-four loci were found to be significantly associated with kernel oil concentration and fatty acid composition (P< 1.8 × 10⁻⁶) using expression (eQTL) mapping, linkage mapping, and co-expression analysis. Five candidate genes associated with oil metabolism (LACS, WRI1a, ACP, FAD2, and COPII) were chosen to investigate potential functional polymorphisms capable of causing phenotypic changes (Li et al., 2013). In recent years, a study that combined GWAS, linkage mapping, and eQTL analysis uncovered GRMZM2G015534 and GRMZM2G143008 as being involved in amino acid biosynthesis in maize (Deng et al., 2017). Genetic analysis of maize quality traits using multi-omics can greatly reduce the required time and labor when compared to fine mapping; however, few studies have investigated the genetic basis of PC in maize kernels using combined multi-omics.
To date, subsistent genes corresponding to maize storage proteins have been cloned, including opaque1 (o1), o2, o5, o7, floury1 (fl1), fl2, fl4, mucronate (Mc), and defective endosperm B30 (De-B30) (Schmidt et al., 1990; Coleman et al., 1997; Kim et al., 2004; Kim et al., 2006; Holding et al., 2007; Myers et al., 2011; Wang et al., 2011; Wang et al., 2012; Wang et al., 2014). Nevertheless, the application of these genes in breeding is limited because of their defective endosperms. Kernel PC in maize is controlled by multiple genes with small individual and additive effects (Dudley et al., 1977), and analysis of the genetic basis of kernel PC will help to identify more favorable alleles for maize genetic improvements in the future. Genes/loci controlling PC traits can be analyzed using QTL analysis (Miao et al., 2020; Somegowda et al., 2022). Although some QTLs were detected at adjacent chromosome locations, genetic background, environmental factors, and their interactions have also been observed to have an effect in previous studies (Zhang et al., 2008; Li et al., 2009; Yang et al., 2014). Consequently, there are contrasting reports on QTL number, genetic effects, and distribution (Yang et al., 2016). Molecular marker development and the implementation of fine gene mapping to genetically improve traits could also not be achieved due to the absence of stable markers (Lozada et al., 2018; Ren et al., 2019; Ma et al., 2020; Lozada et al., 2021; Yepuri et al., 2022).
In the present study, we have constructed a recombinant inbred line (RIL) population using 275 lines derived from two elite inbred lines Ji846 and Ye3189 for the following purposes: (1) to construct a high-density linkage map based on bin markers; (2) to map QTLs for PC in maize kernels by combing phenotypes in RILs across three environments; (3) to develop PCR-based markers for major QTLs; and (4) to predict a candidate gene for a detected QTL.
2 Materials and methods
2.1 Plant materials and phenotypic evaluations
The RIL population consisted of 275 individuals and was derived from a cross between Ji846 (female) and Ye3189 (male), which are grown in the northeast spring maize area of China and are from the Lancaster and Reid heterotic groups, respectively. Compared with Ye3189, Ji846 had higher plant and ear height, more row kernel numbers, and higher resistance to maize head smut, however, it showed had lower 100-grain weight and single ear weight. The Ji846 and Ye3189 kernel type is biased towards flint and semi-dent, respectively. Phenotypic performance was evaluated in 2018 and 2019 at Gongzhuling (124.82°N, 43.50°E) and in 2019 at Harbin (126.68°N, 45.72°E); these locations are in the spring maize-growing region of China where these lines are commonly grown. A random incomplete block design was adopted for all experiments, with one-row plots, three replicates at each location, 17 plants in each row, 25 cm plant spacing, 60 cm row spacing, and a final density of 60,000 plants/ha. During the harvest period, five self-pollinating ears were collected from the center of each plot, and the samples were taken according to the standard procedure of phenotypic identification after air-drying. The kernels in the middle of the ear were mixed equally for each replication. The maize kernel PC was determined using an MPA Fourier near-infrared reflectance spectrometer (BRUKER, Germany) with a spectrum range of 4,000–12,000 cm-1, a scanning frequency of 64, and a resolution of 8 cm-1. The performance of each plot was represented by the average values for the different traits from three replicates.
2.2 Statistical analysis of phenotypic data
The raw phenotypic data were corrected using the ‘lme’ function in the R package ‘lme4’ with BLUE and the formula: Pheno ~1 + Line + (1|Rep) + (1|Env) + (1|Line : Env), where Pheno are phenotypic data representing traits. Line, Rep, and Env indicate the phenotypic data of inbred lines, the repetition in each environment, and environment, respectively. Other factors are regarded as random effects and a line that is fixed effects. Model matrix and grouping factors are separated by ‘|’, and the ‘:’ is used to represent the interactions between factors. Estimates for the phenotypic distributions, correlations, and parts of the QTL analysis were predominately based on BLUE.
According to Knapp et al. (1985), the modified formula: was employed to estimate the broad-sense heritability (H2) of traits across multiple environments, where is the genotypic variance; the estimated interaction variance values for genotype × year, genotype × location, and genotype × location × year are represented by , , and , respectively; Y, L, and R refer the number of years, locations, and replications per location, respectively; is the error variance; all variances were estimated using the ‘ASReml’ R package.
2.3 DNA isolation, sequencing, and SNP identification
Leaf tissues were collected during the tasseling vegetative stage and freeze-dried at −80°C for genomic DNA isolation and extraction using the CTAB protocol (Murray and Thompson, 1980). Deep sequence for Ji846 and Ye3189 DNA from 275 RILs was processed according to the previously published GBS method (Zhou et al., 2016), in which NlaIII (NEB) and EcoRI (NEB) were used for genomic DNA digestion with a TAA site that can be recognized by the restriction enzyme MseI. Universal primers and index primers were employed to purify PCR products using Agencourt AMPure XP (Beckman). Fragments that were 350–400 bp (including adaptors and indexes) were isolated and purified for sequencing using the Illumina HiSeq2500 (Illumina, USA) platform. The raw sequence reads of these lines are public on NCBI (Accession: PRJNA627044).
To identify SNPs in the RIL population, Burrows-Wheeler Aligner (Li and Durbin, 2009) and GATK (McKenna et al., 2010) were used for alignment and SNP identification. The SNPs of the RILs were supported by a minimum of 1 base. ANNOVAR was employed to determine the physical position of each SNP based on the B73 RefGen_V4 sequence. Variant calling errors and the ratio of SNP alleles derived from Ji846 and Ye3189 were calculated using a sliding window approach. To ensure map quality, the few base types that did not appear in the parents were considered as abnormal bases; genotypes were screened to cover at least one individual marker in all progeny to ensure the integrity of genotypes; SNPs with segregation distortion of<0.001 were filtered out using Chi-square (χ2) tests, and those on the scaffold were filtered out to obtain high-quality SNP markers for subsequent map construction.
2.4 Bin map construction of the RIL population
A window size of 15 SNPs was used to scan the genotypic data with a step size of one SNP. If 11/15 of the sites in the window came from a single parent, they were considered homozygous, if not, they were considered heterozygous. Adjacent windows with the same genotypes were merged as a single block, whereas others were considered recombination breakpoints with variant genotypes. Bins were designated based on consecutive 100-kb intervals without any breakpoints across the entire population. The R/qtl function est.map (“kosambi” method) was manipulated to calculate the genetic distance between bin makers and linkage map construction.
2.5 QTL analysis for PC phenotypes in maize kernels
Phenotypic QTL locations in each of the three environments were determined using a composite interval mapping (CIM) method with the R/qtl software package (Broman et al., 2003), and BLUE was used to conduct a joint analysis across all environments. The threshold for defining the significant QTL was a logarithm of the odds (LOD) score of 3.0 calculated using 1,000 (P< 0.05) permutations in the analysis method. The genomic region wherein the LOD peak in the range of 1.5 decreased was considered the confidence interval of the QTL. The fitqtl function in the R ‘qtl’ package was used to calculate the proportion of phenotypic variation explained by each QTL. QTLs detected in different environments with overlapping confidence intervals or peak spacing within 20 Mb were considered to be single QTLs (Frascaroli et al., 2007).
2.6 Indel marker development
Genomic DNA was isolated and extracted using the CTAB protocol (Murray and Thompson, 1980). PCR was performed in a Bio-Rad T100™Thermal Cycler, with each reaction containing 10 mmolL-1 Tris-HCl, 0. 001% gelatin, 50 mmolL-1 KCl, 2.5 mmolL-1 MgCl2, 0.15 mmolL-1 dNTP, 10% glycerol, 0.25 μmolL-1 IndelPC2-2 primer (Supplementary Table 1), 0.5 µL Taq DNA polymerase, and 20 ng DNA template. Amplification conditions were 94°C for 5 min, followed by 35 cycles at 94°C for 1 min, 60°C for 2 min, and 70°C for 2 min.
Modified polyacrylamide gel electrophoresis (4.5%) was performed using a Bio-Rad sequencing plate device (38 cm × 30 cm × 0.4 mm). TEMED and APS were added to solidify the gel. Electrophoresis was performed for approximately 1 h at 50 W with a 2.5 μL PCR product sample in 1,800 mL 1 ×TBE buffer. The gel was soaked in 10% glacial acetic acid for 30 min, washed twice with water, 0.1% AgNO3 for 30 min, washed with water quickly once, and then soaked in 1.5% NaOH until the band type was distinguished. Sixty inbred lines with the highest and lowest PC in the inbred line population were selected to verify the availability of the markers. Significant differences between groups were analyzed using the Signif function in R software, and phenotype boxplots were drawn using the boxplot function in the ggplot R package.
2.7 Prediction of candidate genes
Correlations between the normalized expression level and phenotypic identification data were assessed in the maize inbred line population, which contained 348 lines. Normalized expression level data were obtained by RNA sequencing of maize kernels 20 days after pollination (20 DAP) using 150 bp paired-end Illumina sequencing, with an average of 7.7 Gb of high-quality raw sequencing data per line (Supplementary Table 2). Inbred lines were planted in Gongzhuling and Changping in 2018 and 2019 to collect the phenotypic data. Five ears in each block were self-pollinated, and 20 immature seeds from two ears in each block in Changping in 2019 were collected at 20 DAP for RNA-seq. The correlation coefficient and P value between gene expression levels and BLUE values for the phenotypes were calculated using the Corrplot package in the R software. The filtered working gene list of the maize genome was downloaded from MaizeGDB (http://www.maizegdb.org) to identify possible candidate genes within the QTL.
2.8 qRT-PCR analysis
Zm00001d002625 expression was analyzed in inbred lines Ji846 and Ye3189. Total RNA was extracted 20 DAP from the endosperm using a FastPure® Plant Total RNA Isolation Kit (Nanjing Vazyme Biotech Co. Ltd., China). Single-stranded cDNA was synthesized using the FastKing gDNA Dispelling RT SuperMix (Tiangen Biotech Co. Ltd., China). qRT-PCR was performed in Bio-Rad iQ5, with each reaction containing 100 ng of first-stand cDNA, 0.6 μL of 10 μmmolL-1 gene-specific primers, and 10 μL of SuperReal PreMix Plus (SYBR Green) (Tiangen Biotech Co. Ltd., China). Amplification conditions were 95°C for 15 min followed by 40 cycles at 95°C for 10 s and 58°C for 30 s. Relative expression of Zm00001d002625 was calculated using the 2-ΔΔCq method (Livak and Schmittgen, 2001), and the variation in expression was estimated using three biological replicates. The maize Tubulin gene was used as an internal control to normalize the data. The primers used for real-time PCR and cDNA amplification are listed in Supplementary Table 3.
2.9 Sequence amplification of gene promoter and alignment analyses
Based on the results from QTL mapping, gene-specific primer pairs (Supplementary Table 4) were developed and used to amplify the promoter sequences of the candidate genes in Ji846 and Ye3189. PCR amplification was performed in 50 μL volumes containing 25 μL of 2×PCR buffer for KOD FX, 10 μL of 2mM dNTPs, 200 ng of genomic DNA, 1.5 μL of each forward and reverse primer (15 μmolL−1), and the suitable nuclease-free water in a T100™ Thermal Cycler (Bio-Rad Research, USA). The thermal cycling program was as follows: 95°C for 3 min, 34 cycles of 98°C for 30 s, 56°C for 30 s, and 68°C for 1 kb/min, and final extension at 68°C for 10 min. The amplified products were electrophoresed on a 1.0% agarose gel. The target bands were cut and purified using a Zymoclean™Gel DNA Recovery kit. Multiple DNA alignments were performed in DNAMAN. The transcription factor binding sites of candidate genes were predicted using a search of the PlantPAN3.0 (http://plantpan.itps.ncku.edu.tw/) database.
3 Results
3.1 Phenotype and genotype characteristics of the parental lines and RILs
The RIL population and parental lines were evaluated at Gongzhuling in 2018 and 2019, and at Harbin in 2019(Supplementary Table 5). The PC of the female inbred line Ji846 was ~27.5% higher than that of the male Ye3189 based on the BLUE values, indicating a significant difference between the two parents (P< 0.05). The PC correlation coefficients ranged from 0.54 to 0.66 among the three environments. The mean of the Ji846 × Ye3189 RIL population was close to that of the mid-parent value, and the observations were distributed normally with transgressive segregation in all environments, indicating that the alleles responsible for increasing PC reside in both parents (Figure 1). ANOVA results showed that both genetic and environmental factors had significant effects on phenotypic variation. The broad-sense heritability(h2) estimate of the kernel PC was high (81.10%), indicating that much of the phenotypic PC variation in the RIL population was genetically determined (Table 1).
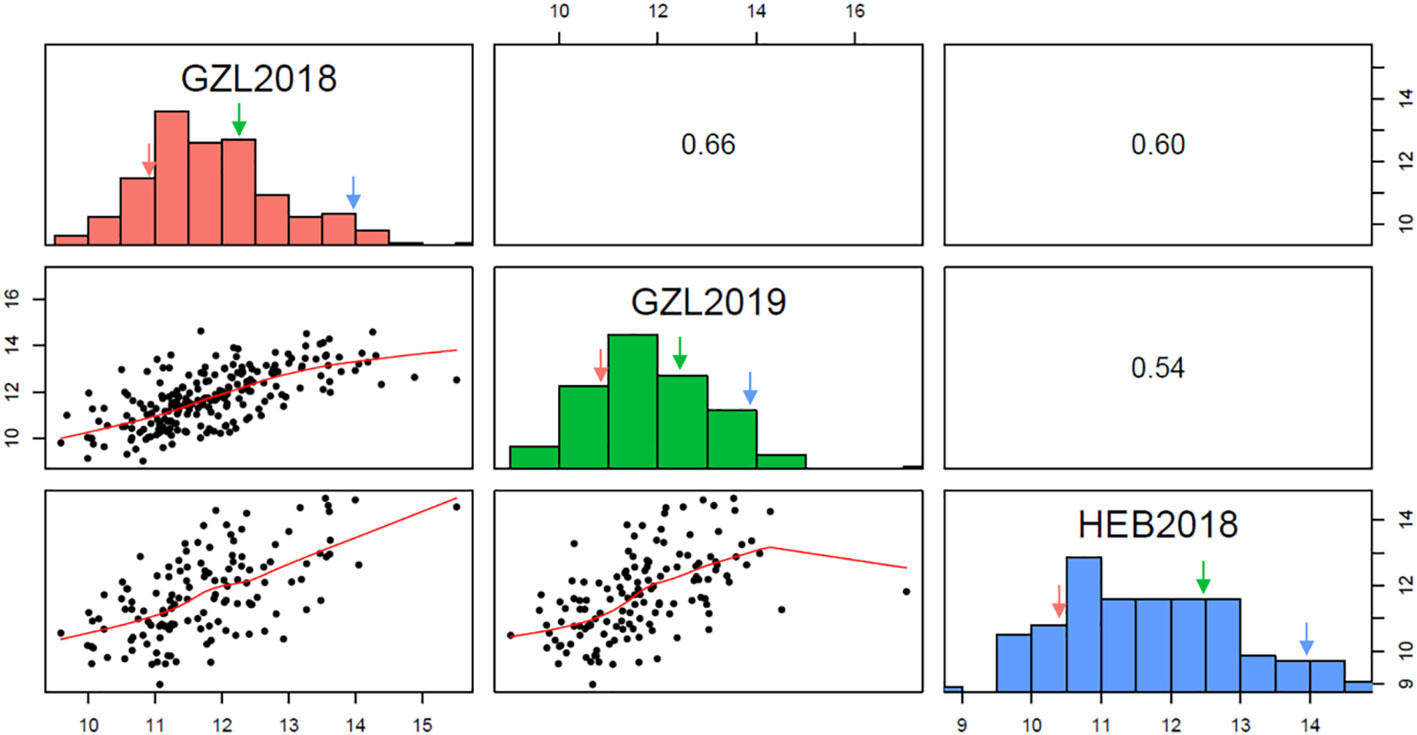
Figure 1 Frequency distribution of protein content (PC) and correlations across three environments. GZL2018, GZL2019, and HEB2018 indicate Gongzhuling in 2018, Gongzhuling in 2019, and Harbin in 2018, respectively. Red arrow: Ye3189; blue arrow: Ji846; blue arrow: mid-parent.
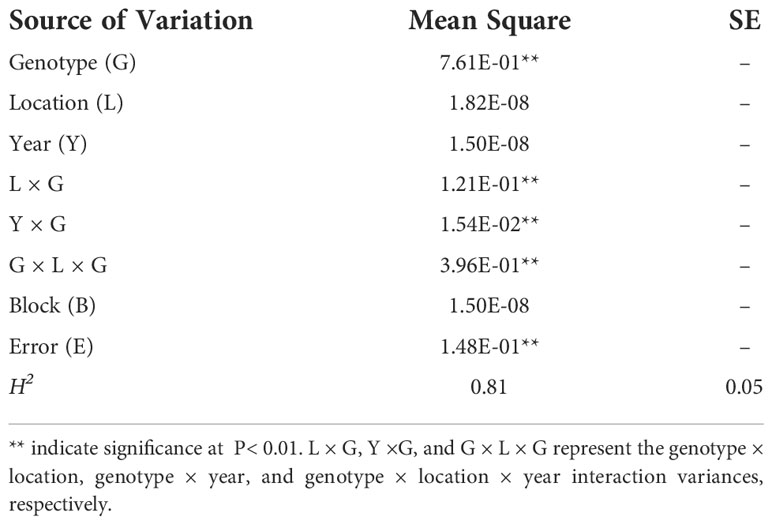
Table 1 Combined analyses of variance for protein in Ji846 × Ye3189.
3.2 SNP detection in the RIL parental lines
Ji846 and Ye3189 were sequenced at 15.21× and 13.42× coverage depths, respectively. The results showed that 185,582,944 and 177,044,073 reads were mapped to the B73 RefGen_V4 genome with mapping rates of 98.09% and 98.31% for Ji846 and Ye3189, respectively. There were 11,132,691 and 10,275,040 SNPs identified and the heterozygosis rates were 41.75% and 33.51% in each population, respectively (Figure 2). A total of 18,192,527 SNPs were annotated by ANNOVAR, and approximately 87.80% were in the intergenic region, 5.25% in the introns, 1.90% in the exons, and 4.92% within 1 kb upstream or downstream of the genes (Supplementary Table 6). In total, 2,874,990 homozygous polymorphic SNPs were obtained between Ji846 and Ye3189 as aa × bb segregation patterns. Sequencing of the 275 RILs using the GBS strategy resulted in 1,447,346–3,741,336 mapping reads, with an average sequencing depth of 11.85, and mapping rates ranged from 95.83% to 98.03%. An average of 221,271 SNPs were obtained for each line, with a minimum of 105,512 and a maximum of 320,184 (Figure 3A).
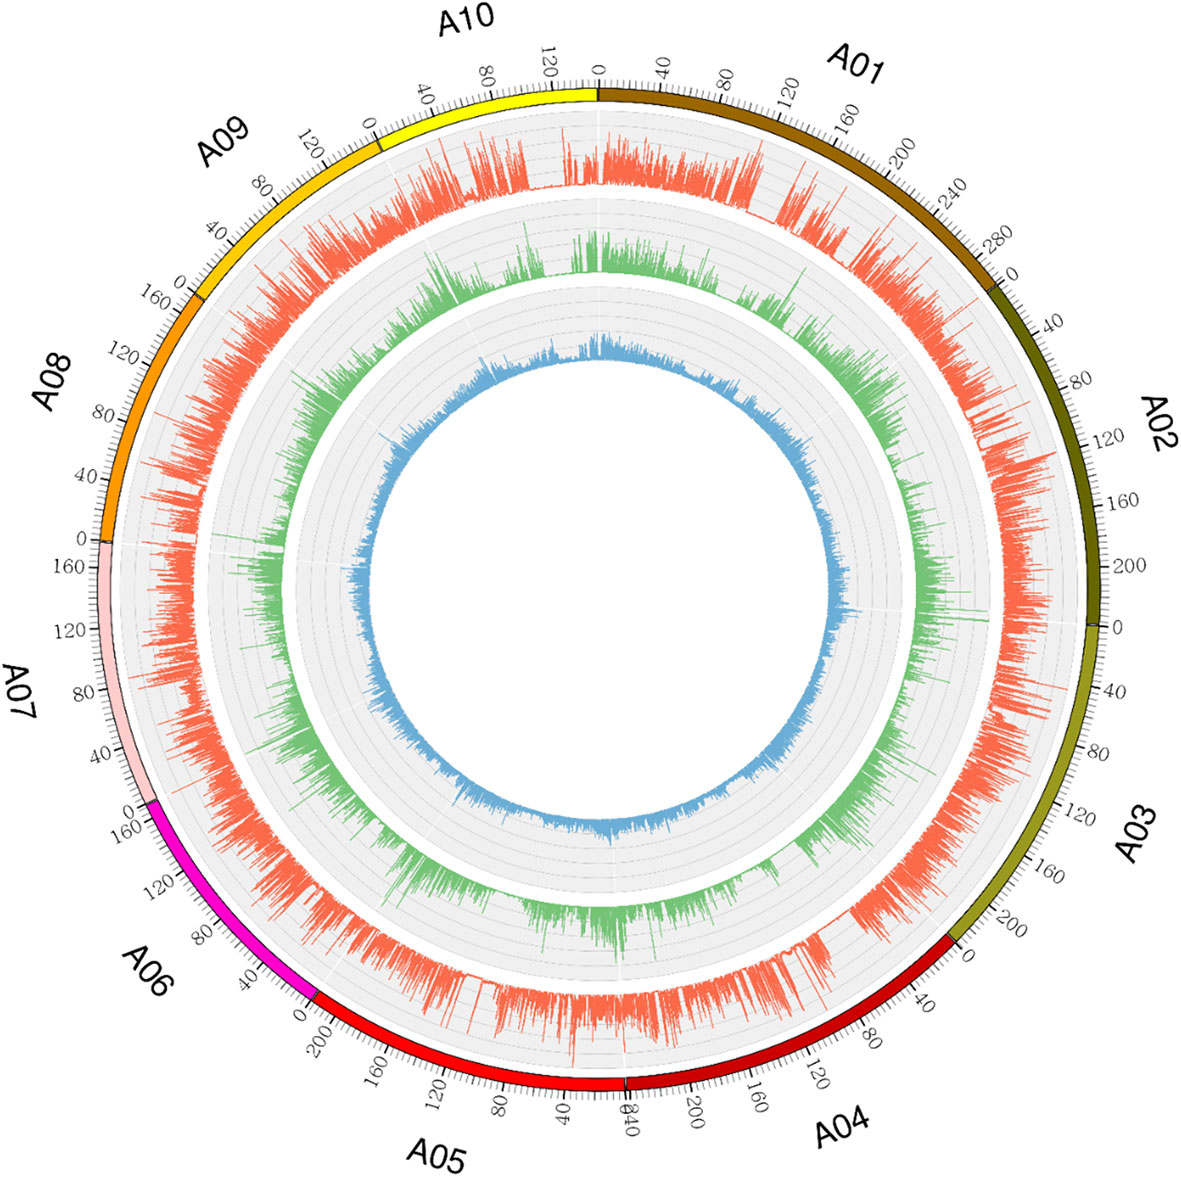
Figure 2 Genome-wide distribution of SNPs and genetic variants in the Ji846 and Ye3189 genomes. The outermost circle with scale represents the ten chromosomes. The orange histogram represents the density of SNPs that are polymorphic between Ji846 and Ye3189; the green histogram represents the density of polymorphic SNPs within the coding sequences of Ji846 and Ye3189; the blue histogram indicates the density of insertions and deletions (Indels) between Ji846 and Ye3189.
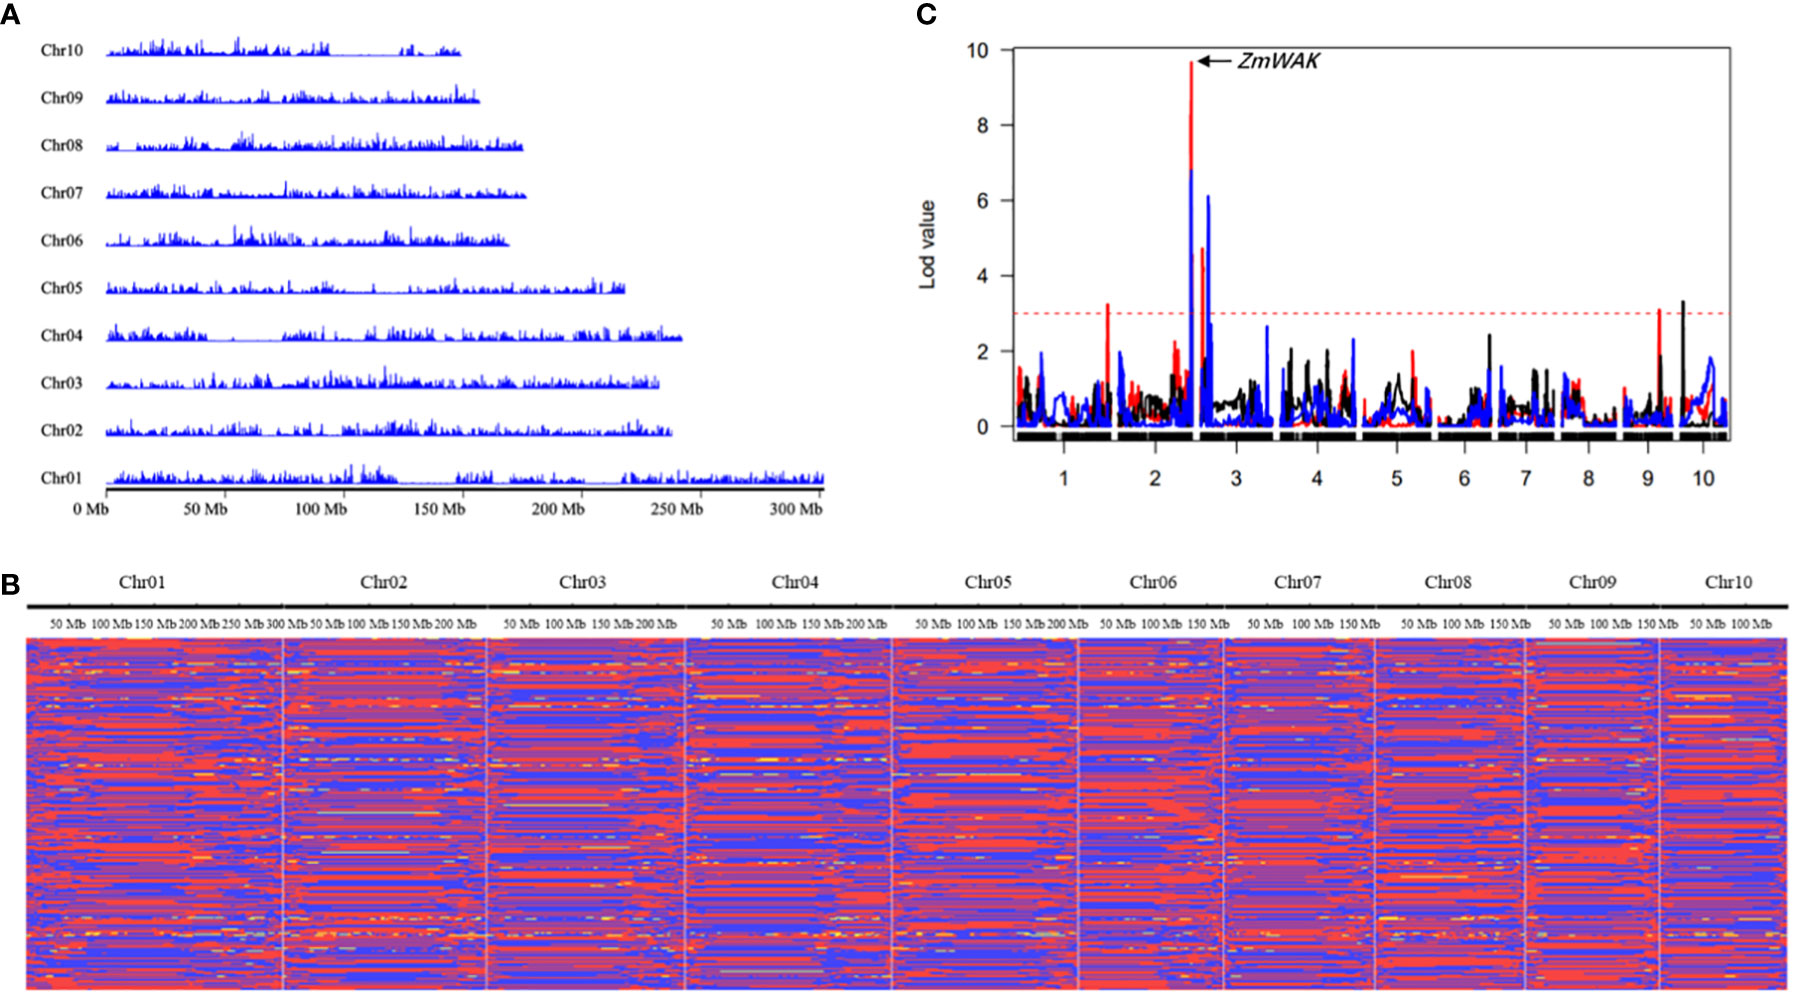
Figure 3 Genetic linkage map construction with bin markers. (A) SNP density distribution across the ten chromosomes. (B) Graphic genotype of 275 RILs. red, Ye3189 genotype; blue, Ji846 genotype; yellow, heterozygous genotypes. (C) Mapping of 2.09 and 3.04, which control maize head smut, in the RIL population. The curves with different colors represent the QTL regions according to the confidence intervals for linkage mapping under the three environments, respectively. Red, 2007 Harbin; black, 2008 Harbin; blue, 2009 Harbin; The x-axis indicates genetic positions across the maize genome in Mb. The y-axis indicates the LOD score of the detected QTL. The red dashed lines represent the LOD threshold.
3.3 Genetic linkage map construction and QTL mapping for kernel PC
After quality control and filtering, 77,680 SNPs, accounting for 2.70% of the total SNPs between Ji846 and Ye3189, were used to construct linkage maps. The sliding-window approach was applied to construct a bin map for 275 RILs. A total of 15,611 breakpoints were detected for 275 RILs with 56.7 breakpoints per individual (Supplementary Figure 1). Subsequently, there were 6,433 bin markers generated, and a high-density genetic map was constructed with a length of 2180.93 cM (Supplementary Figures 2, 3). The average distance ranged from 0.32 cM for chromosomes 2 and 3 to 0.37 cM for chromosomes 7 and 9, and the linkage interval between adjacent bins ranged from 2.32 cM to 4.64 cM, with an average of 3.31 cM (Figure 3B; Table 2). In addition, 77.79% of the bins were<300 kb in length, with 4.15% of the bins being longer than 1 Mb (Supplementary Figure 4). To evaluate the quality of the genetic map, bin markers were mapped to the maize B73 RefGen_V4 reference genome. The markers in the 10 linkage groups aligned well with the scatter plot of the B73 reference chromosome, indicating that there was appropriate collinearity between the maize B73 reference genome and identified bin markers (Supplementary Figure 5). To validate the power of this genetic map, QTLs for maize head smut, a trait previously mapped using SSR markers from this population, were mapped using the CIM function in R/qtl. QTL mapping revealed that 11.22% of the phenotypic variation could be explained by one major QTL located in a 231.15–244.44 Mb interval on chromosome 2. This locus included one cloned gene, ZmWAK (238,607,011–238,613,457), which confers quantitative resistance to maize head smut (Figure 3C) (Zuo et al., 2015). The results of this study narrowed the range of the QTL intervals, demonstrating the high resolution and accuracy of this bin map.
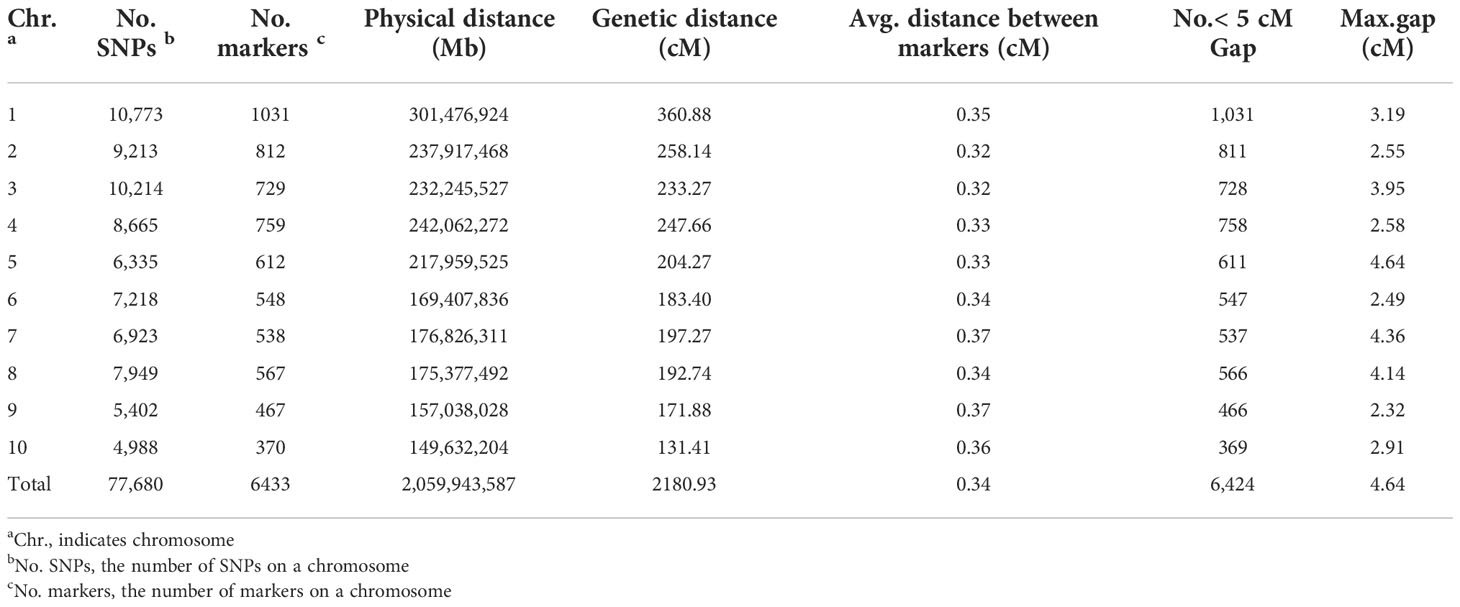
Table 2 Characteristics of the high-density genetic map derived from a cross between Ji846 and Ye3189.
QTLs for kernel PC in each environment were detected based on a linkage map. Eleven QTLs were identified, two of which were detected in multiple environments and were distributed on chromosomes 2 and 7 (Supplementary Figure 6). The confidence intervals for these 11 QTLs spanned physical distances of 1.15–14.10 Mb, with an average of 5.14 Mb. The phenotypic variation explained by each QTL ranged from 4.21% to 14.56%, with a mean of 6.82%. In addition, six QTLs for kernel PC were detected from the analysis in the three environments when combined with the BLUE values (Figure 4). The confidence intervals for these six QTLs spanned physical distances of 3.40–14.10 Mb, with an average of 6.41 Mb. The phenotypic variation explained by each QTL ranged from 4.21% to 7.76%, with a mean of 5.53% (Table 3). The qPC9 locus with a 14.56% contribution to phenotypic variation was only identified in the Gongzhuling environment in 2018, indicating that specific QTLs might be strongly expressed in a certain environment. qPC7 and qPC2-2 were identified in at least two environments as stable loci that could be used to identify candidate genes. qPC7 (Chr7:116.1-137.7 Mb) and qPC2-2 (Chr2:14.45-19.95 Mb) explained ~7.32% and ~6.01% of the phenotypic variation, respectively, and were detected in multiple environments and considered stable loci that could be used to identify candidate genes. The reported gz50 and zp27 genes, which encode 50-kDa and 27-kDa γ-zein genes, directly affected the PC of kernels and were located in qPC7, indicating the accuracy of the localization results in this study.
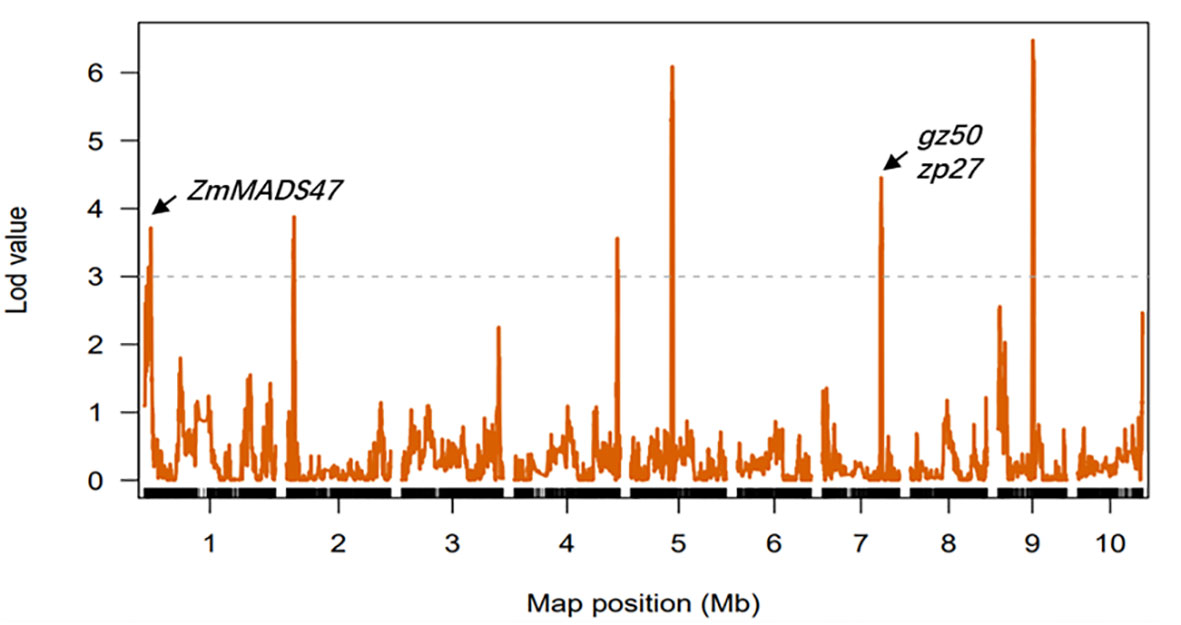
Figure 4 Mapping of QTLs for protein on the ten maize chromosomes in three different environments (combined). The curves indicate the physical positions (x-axis) of the bin markers against the LOD scores (y-axis) for QTLs detected on each of the ten chromosomes. The gray dashed lines represent the LOD threshold.
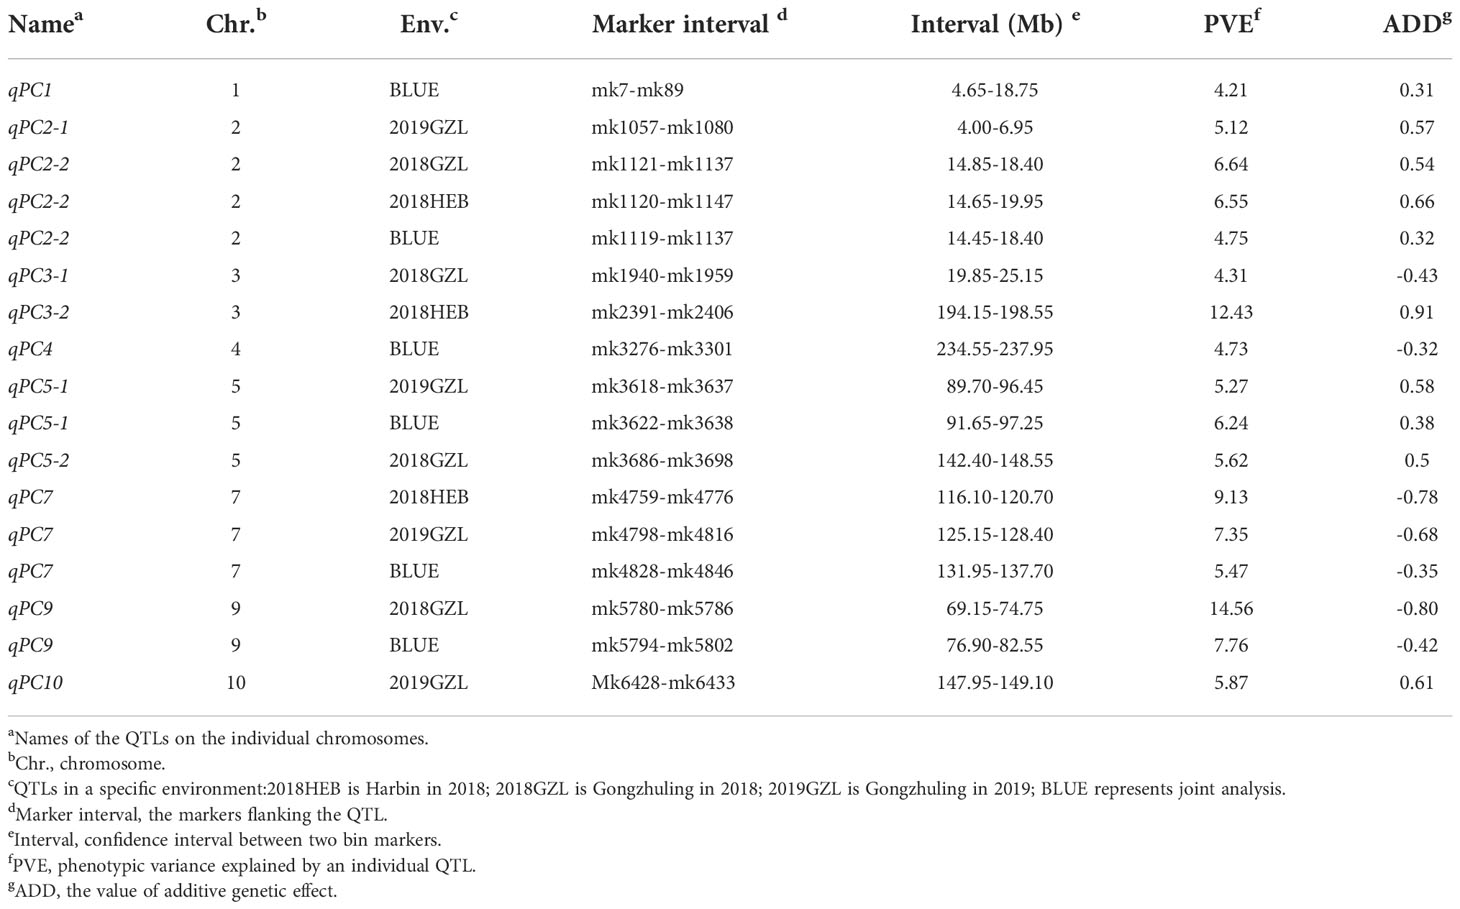
Table 3 QTLs detected for kernel protein content in the RILs.
3.4 Marker development for qPC2-2
To further verify the correlation between the qPC2-2 locus and PC trait, an insertion and deletion (Indel) marker was developed based on the variation between biparental bases. The genetic linkage analysis results implied that the strongest signal associated with the phenotype was at the qPC2-2 locus of MK1131 (Chr2:17.15 Mb) in two different environments (Figure 5A). SNPs between Ji846 and Ye3189 located in MK1131 were calculated and categorized according to their parental alleles. A total of 122 SNPs matched the Ji846 parental genotype and 129 matched the Ye3189 genotype. The phenotypic values for kernel PC in the Ji846 × Ye3189 RIL population differed significantly (P = 1.6E-03) (Figure 5B). We also developed a PCR-based marker, IndelPC2-2, with closely linked polymorphisms in both parents near MK1131 (Figure 5C), which was used to genotype 30 high and 30 low PC maize inbred lines (Figure 5D), and the phenotypes of the diverse genotypes were also significantly different (P = 1.9E-03) (Figure 5E). Therefore, IndelPC2-2 could be utilized to enhance breeding efficiency using marker-assisted selection (MAS) with the PC trait.
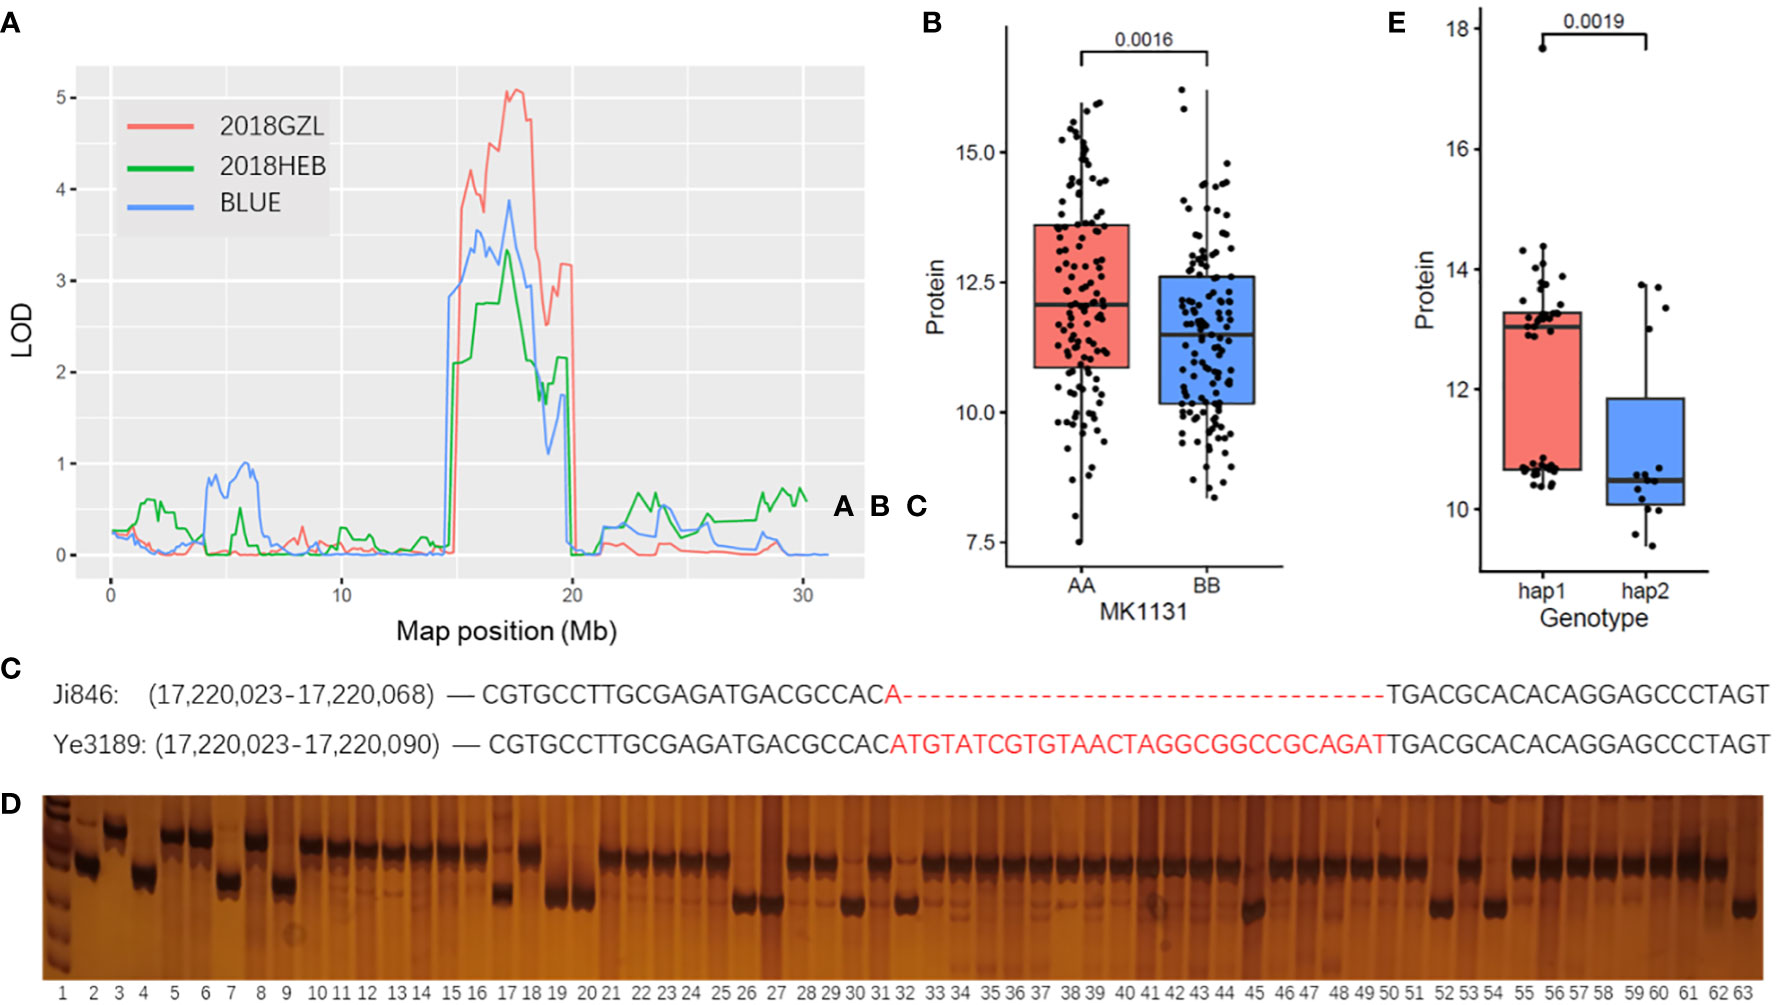
Figure 5 Distribution of the phenotypes and QTLs identified on chromosomes in the different environments assessed in this study. (A) The curves indicate the physical positions (x-axis) of bin markers against the LOD scores (y-axis) for QTLs detected on qPC2-2. Different colors represent different environments. 2018GZL and 2018HEB represent Gongzhuling and Harbin in 2018, respectively; BLUE represents joint analyses. (B) Tests for differences among phenotypic values for the BLUE values of PCs associated with MK1131 in maize inbred lines. AA represents the Ji846 genotype; BB represents the Ye3189 genotype. The y-axis indicates the phenotypic values for the BLUE values of PC. (C) Indels between Ji846 and Ye3189 around the peak position (MK1131) in qPC2-2. (D) Genotyping of maize inbred lines with 30 high and 30 low PCs using marker IndelPC2-2, lane 1: marker; lane 2: genotype of Ji846; lane 3: genotype of Ye3189; lane 4-63: genotypes of 60 inbred lines. (E) Tests for differences among phenotypic BLUE values of PCs associated with the IndelPC2-2 marker in maize inbred lines with 30 high and 30 low PCs. Hap1 represents Ye3189 genotype; hap2 represents Ji846 genotype. The y-axis indicates the phenotypic values for the BLUE values for PC.
3.5 Candidate gene prediction
To rapidly identify candidate genes within the stable QTL locus qPC2-2, correlation analysis using RNA-seq was adapted in this study. gz50 and zp27 genes are reported to encode 50-kDa and 27-kDa γ-zein genes that directly affect kernel development in qPC7. Correlation analysis using RNA-seq data from 348 inbred lines showed that only the gz50 gene expression level was significantly correlated with PC (r = 0.24, P = 6.21E-06), indicating the rationality of the adopted approach (Supplementary Table 7). For qPC2-2, the same method was adapted to predict the candidate genes in the interval Chr2:16.80 Mb to 17.25 Mb around peak marker MK1131. Four of the 12 gene expression levels were significantly correlated with the kernel PC BLUE value in the maize inbred line population (r = -0.11–0.22, P< 0.05). Furthermore, the qRT-PCR validated gz50 for qPC7, and Zm00001d002616, Zm00001d002621, Zm00001d002624, and Zm00001d002625 for qPC2-2 showed significant differences in gene expression levels in the endosperms of Ji846 and Ye3189 (20 DAP). Notably, among the four genes for qPC2-2, the expression of Zm00001d002625 (closest to MK1131) of Ye3189 was approximately 3.9 times than that in Ji846, which was the highest among the candidate genes (Figure 6). We obtained the sequence of promoter region for Zm00001d002625 gene in Ji846 and Ye3189. A 1 bp variation on 1250 bp upstream of the initiation codon in the promoter region of the Zm00001d002625 gene resulted in the absent binding motif GATCT of GATA-type transcription factors in Ji846 (Supplementary Figure 7; Supplementary Tables 8, 9). According to the maize gene annotation database (maize GDB, www.maizegdb.org), there was 60% homology between Zm00001d002625 and At4G00750 in Arabidopsis thaliana, which encodes an S-adenosyl-L-methionine-dependent methyltransferase superfamily protein; except for Zm00001d002625, none of the other three genes encoded proteins with functional annotations. SAM serves as the methylation donor in transmethylation reactions, probably causing a genome-wide disruption in storage proteins in developing endosperms due to methylation changes (Yan et al., 2022). In summary, Zm00001d002625 was speculated to be a potential candidate gene associated with kernel PC in qPC2-2.
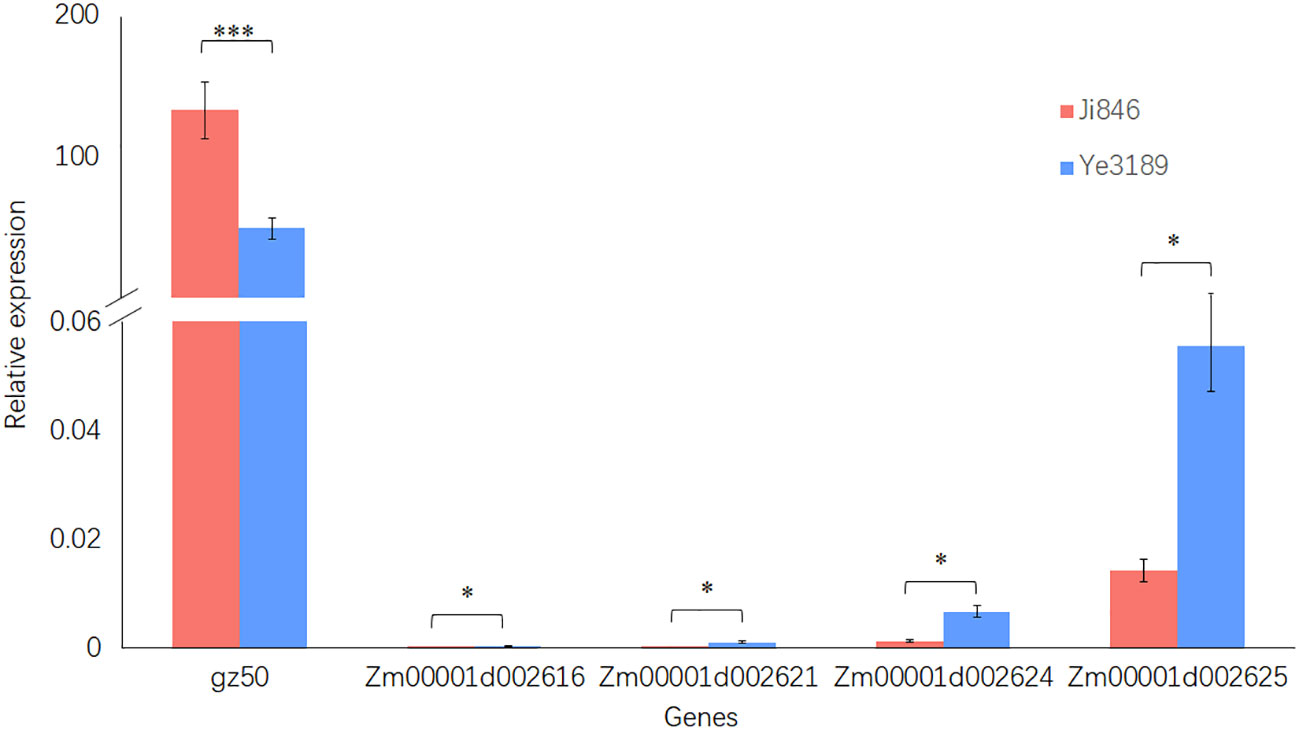
Figure 6 Relative quantitative expression analysis of Zm00001d002625 in the endosperm (20 DAP) of Ji846 and Ye3189 using qRT-PCR. The red bars represent Ji846 (high-protein parent), and the blue bars represent Ye3189 (low-protein parent). The horizontal axis of the graph indicates the different genes, and the vertical axis indicates the relative expression levels. The data are presented as the means of three biological and technical replicates ± standard errors. * and *** indicate P< 0.05 and P< 0.001, respectively, by a t-test.
4 Discussion
Improving the PC trait in maize kernels is one of the prime objectives of most breeding programs around the world. A limited number of the genes involved in starch metabolism are also known to have major effects on the PC in maize kernels based on the analysis of well-known maize mutants (Coleman et al., 1997; Kim et al., 2006; Wang et al., 2014). The identification of QTLs related to PC will thus aid in MAS breeding and the accumulation of elite alleles in natural variations using map-based cloning strategies (Raihan et al., 2016; Yang et al., 2016).
In general, segregation distortion, heterozygosity, allele switching, excessive single-cross events, and unexpected double recombinants, such as genotyping errors, occur during the construction of an SNP-based genetic linkage map (Cartwright et al., 2007). The abundance of missing data points and sequencing errors may cause an expansion of the genetic distance between markers in a genetic map or misplaced markers in the map due to the limited sequence depth (Spindel et al., 2013; Ma et al., 2020). In this study, the average effective depth of resequencing for the parents was approximately 14.32-fold; although 7,300,643 SNPs were obtained using the filtering steps, SNPS with abnormal bases, integrity, and partial separation were filtered out using stringent criteria. This resulted in 77,680 markers and samples with high-quality scores, which ensured the construction of a genetic map with a high level of accuracy (Huang et al., 2009; Jaganathan et al., 2015; Saxena et al., 2017; Mathivathana et al., 2019). The linkage map derived from the Ji846 × Ye3189 RIL population was constructed previously using 160 SSR markers and 49 AFLP markers, which covered 3,302.8 cM of the maize genome, and the average marker interval was 15.8 cM. In contrast to PCR-based SSR markers, a recombination breakpoint between the two bin markers with an average of approximately 0.34 cM can be identified using GBS, which represents a 46-fold improvement in the resolution of recombination breakpoints. Compared to the genetic linkage map constructed with general size populations for genetic dissection in the previous study, our genetic linkage map has a relatively higher resolution (Chen et al., 2014; Zhou et al., 2016; Su et al., 2017). It is worth mentioning that this population is suitable for the genetic dissection of maize quality traits due to the diversity of the kernel characteristics between parents. However, it is worth noting that many QTLs will likely be missed if only one bi-parental population is used due to the lack of polymorphism between the two parental lines. As a consequence, more elite alleles could be identified by using inbred populations and multiple parental populations. (Wang et al., 2018).
The selection of DNA-based markers, mapping functions, methods of phenotypic data collection, and mapping population type and size are all factors that affect QTL identification and analysis and the development of linkage maps (Hyne et al., 1995; Poland and Nelson, 2011; Su et al., 2016). Compared with the QTLs detected in the bi-parent population, the qPC1, qPC2-1, and qPC3-1 loci with 4.21–5.12% contributions to phenotypic variation were consistent with previous results (Dudley et al., 2004; Zhang et al., 2008; Guo et al., 2013; Yang et al., 2014; Zhang et al., 2015). The PC2-2, qPC3-2, qPC5-1, qPC5-2, qPC7, and qPC9 loci with 5.47−14.56% contributions to phenotypic variation were also similar to those identified in previous studies (Dudley et al., 2004; Zhang et al., 2008; Cook et al., 2012; Yang et al., 2014). The consistent and stable QTLs detected in diverse genetic backgrounds can be used for QTL fine-mapping and the identification of candidate genes. The previously unreported qPC4 locus demonstrated that the QTLs had a population-specific effect (Dudley et al., 2004; Yang et al., 2014). The qPC9 locus explained the largest phenotypic variation; nevertheless, it was detected only once in a sample from Gongzhuling in 2018. QTL × environment interaction is an important property of QTLs, even for highly heritable traits, such as plant height, and these interactions are trait- and gene-specific (Li et al., 2003; Mathivathana et al., 2019). In addition, it remains unclear whether inconsistent QTL detection is due to true differential trait expression across environments (Yan et al., 2003).
In our study, qPC2-2 and qPC7 were identified as environmentally stable loci, which indicates that their QTL-by-environment interaction had a smaller effect (Li et al., 2003). The interaction of QTL quantitative traits has been well established and indicates the potential of combining favorable alleles to improve plant performance (Lefebvre and Palloix, 1996; Thabuis et al., 2004; Lu et al., 2012; Chunthawodtiporn et al., 2019). Zeins, which are the main storage proteins in endosperm maize kernels, have evolved into four classes based on their chemico-physical properties: alpha (α), beta (β), gamma (γ), and delta (δ) (Moose et al., 2004; Xu and Messing, 2009; Wang et al., 2011; Xiang et al., 2018). gz50 encodes a 50-kDa γ-zein gene that directly affects kernel PC and is located in qPC7. The expression of gz50 is strictly regulated through the identification of conserved cis-elements in the promoter and corresponding transcription factors (TFs) (Zhang et al., 2019). ZmMADS47, a MADS box-containing TF in Chr1:17,963,695–17,987,258 at the qPC1 locus, was speculated to affect the PC of kernels by binding to the CATGT motif in the promoter of α-zein and 50-kDa γ-zein (Qiao et al., 2016). The 5.98% phenotypic contribution rate of qPC2-2 was lower than that of qPC7, and previous studies indicated that even QTLs with minor effects could contain genes that cause extreme changes in corresponding phenotypes (Ishii et al., 2013; Xing et al., 2015). Maize breeding is process involving pyramiding favorable alleles, and it is known that important genes or major QTLs for agronomic traits are selected and even potentially fixed in the process of maize domestication or early breeding (Doebley et al., 1997; Wang et al., 2005; Wang et al., 2018). Thus, qPC2-2 could potentially be used as a QTL in commercial breeding. A PCR-based marker, IndelPC2-2, was also developed, which may be linked to candidate genes or as a distinct regulatory element that affects the expression of candidate genes. IndelPC2-2 can be used to enhance breeding efficiency using MAS with the PC trait.
The combination of multilayered genetic analysis will accelerate QTL mapping, gene cloning, and molecular breeding in crops. Transcriptome-wide association studies with respect to a trait and analyses of the expression levels of genes across the whole genome have been conducted to assist in the prediction of candidate genes when studying complex traits (Li et al., 2013; Deng et al., 2017; Tang et al., 2021; Zhang et al., 2022). To rapidly identify candidate genes within the stable QTL locus qPC2-2, correlation analysis using RNA-seq was adapted in the present study. Zm00001d002625 is speculated to be a potential candidate gene for qPC2-2. The alteration of one base upstream of the start codon of parents resulted in the variation of C2H2-GATA family transcription factor binding element, However, there are few studies on the effect of C2H2-GATA family transcription factor on PC of maize kernels. In addition, the promoter region of the gene may not be limited to 1250 bp before ATG of the initiation codon, and there may be the presence of distal regulation. Zm00001d002625 has 60% homology with At4G00750 in Arabidopsis thaliana, which encodes an S-adenosyl-L-methionine-dependent methyltransferase superfamily protein. Previous studies have demonstrated that the SHMT4 mutation caused a disruption in storage protein composition, probably through SAM production, resulting in genome-wide methylation changes in developing endosperms (Yan et al., 2022). Zm00001d002625 may encode an S-adenosyl-L-methionine-dependent methyltransferase superfamily protein, S-adenosyl-L-methionine synthetase, which catalyzes the conversion of methionine to SAM and serves as the methylation donor in transmethylation reactions and an intermediate in polyamine and ethylene biosynthesis (Li et al., 2011).
In conclusion, herein, we constructed a high-density maize linkage map after the large-scale development of markers using GBS of an RIL population. These results indicate that this high-density map can be used for accurate and efficient QTL mapping. Using this map, we have mapped PC in maize kernels and identified stable QTLs in multiple environments. Furthermore, we have developed an Indel marker associated with PC at the qPC2-2 locus, Zm00001d002605, which was speculated to be a potential candidate gene within the QTL. This study will contribute to further research into the mechanisms that control PC, while also providing a basis for MAS in molecular breeding to further improve high-value traits.
Data availability statement
The datasets presented in this study can be found in online repositories on NCBI (Accession: PRJNA627044).
Author contributions
XL and ZZ performed the experiments and wrote the paper. YW, RW, ZH, ML, DZ, HY and JH, ZW performed the experiments and revised the paper. JW, YZ and XHL designed the experiments. All authors contributed to the article and approved the submitted version.
Funding
This work was supported by the National Key Research and Development Program (grant no. 2021YFD1201004), the Agricultural Science and Technology Innovation Program of CAAS (grant no. ZDRW202004) and the National Natural Science Foundation of China (grant no. 32001559).
Conflict of interest
The reviewer QC declared a shared affiliation with the authors YW, RW, ZW, YZ to the handling editor at the time of the review.
The remaining authors declare that the research was conducted in the absence of any commercial or financial relationships that could be construed as a potential conflict of interest.
Publisher’s note
All claims expressed in this article are solely those of the authors and do not necessarily represent those of their affiliated organizations, or those of the publisher, the editors and the reviewers. Any product that may be evaluated in this article, or claim that may be made by its manufacturer, is not guaranteed or endorsed by the publisher.
Supplementary material
The Supplementary Material for this article can be found online at: https://www.frontiersin.org/articles/10.3389/fpls.2022.1045854/full#supplementary-material
References
Broman, K. W., Wu, H., Sen, S., Churchill, G. A. (2003). R/qtl: QTL mapping in experimental crosses. Bioinformatics 19, 889–890. doi: 10.1093/bioinformatics/btg112
Cartwright, D. A., Troggio, M., Velasco, R., Gutin, A. (2007). Genetic mapping in the presence of genotyping errors. Genetics 176, 2521–2527. doi: 10.1534/genetics.106.063982
Chen, Z., Wang, B., Dong, X., Liu, H., Ren, L., Chen, J., et al. (2014). An ultra-high density bin-map for rapid QTL mapping for tassel and ear architecture in a large F2 maize population. BMC Genomics 15, 433. doi: 10.1186/1471-2164-15-433
Chunthawodtiporn, J., Hill, T., Stoffel, K., Deynze, A. V. (2019). Genetic analysis of resistance to multiple isolates of phytophthora capsici and linkage to horticultural traits in bell pepper. HortScience 54, 1143–1148. doi: 10.21273/HORTSCI13359-18
Coleman, C. E., Clore, A. M., Ranch, J. P., Higgins, R., Lopes, M. A., Larkins, B. A. (1997). Expression of a mutant α-zein creates the floury2 phenotype in transgenic maize. Proc. Natl. Acad. Sci. U.S.A. 94, 7094–7097. doi: 10.1073/pnas.94.13.7094
Cook, J. P., McMullen, M. D., Holland, J. B., Tian, F., Bradbury, P., Ross-Ibarra, J., et al. (2012). Genetic architecture of maize kernel composition in the nested association mapping and inbred association panels. Plant Physiol. 158, 824–834. doi: 10.1104/pp.111.185033
Davey, J. W., Hohenlohe, P. A., Etter, P. D., Boone, J. Q., Catchen, J. M., Blaxter, M. L. (2011). Genome-wide genetic marker discovery and genotyping using next-generation sequencing. Nat. Rev. Genet. 12, 499–510. doi: 10.1038/nrg3012
Deng, M., Li, D., Luo, J., Xiao, Y., Liu, H., Pan, Q., et al. (2017). The genetic architecture of amino acids dissection by association and linkage analysis in maize. Plant Biotechnol. J. 15, 1250–1263. doi: 10.1111/pbi.12712
Doebley, J., Stec, A., Hubbard, L. (1997). The evolution of apical dominance in maize. Nature 386, 485–488. doi: 10.1038/386485a0
Dudley, J. W., Dijkhuizen, A., Paul, C., Coates, S. T., Rocheford, T. R. (2004). Effects of random mating on marker-QTL associations in the cross of the Illinois high protein × Illinois low protein maize strains. Crop Sci. 44, 1419–1428. doi: 10.2135/cropsci2004.1419
Dudley, J. W., Lambert, R. J., De, L. (1977). Genetic analysis of crosses among corn strains divergently selected for percent oil and protein. Crop Sci. 17, 111–117. doi: 10.2135/cropsci2004.1419
Elshire, R. J., Glaubitz, J. C., Sun, Q., Poland, J. A., Kawamoto, K., Buckler, E. S., et al. (2011). A robust, simple genotyping-by-sequencing (GBS) approach for high diversity species. PloS One 6, e19379. doi: 10.1371/journal.pone.0019379
Frascaroli, E., Canè, M. A., Landi, P., Pea, G., Gianfranceschi, L., Villa, M., et al. (2007). Classical genetic and quantitative trait loci analyses of heterosis in a maize hybrid between two elite inbred lines. Genetics 176, 625–644. doi: 10.1534/genetics.106.064493
Glaubitz, J. C., Casstevens, T. M., Lu, F., Harriman, J., Elshire, R. J., Sun, Q., et al. (2014). TASSEL-GBS: a high capacity genotyping by sequencing analysis pipeline. PloS One 9, e90346. doi: 10.1371/journal.pone.0090346
Gonda, I., Ashrafi, H., Lyon, D. A., Strickler, S. R., Hulse-Kemp, A. M., Ma, Q., et al. (2019). Sequencing-based bin map construction of a tomato mapping population, facilitating high-resolution quantitative trait loci detection. Plant Genome 12, 1. doi: 10.3835/plantgenome2018.02.0010
Guo, Y., Yang, X., Chander, S., Yan, J., Zhang, J., Song, T., et al. (2013). Identification of unconditional and conditional QTL for oil, protein and starch content in maize. Crop J. 1, 34–42. doi: 10.1016/j.cj.2013.07.010
He, J., Zhao, X., Laroche, A., Lu, Z. X., Liu, H., Li, Z. (2014). Genotyping-by-sequencing (GBS), an ultimate marker-assisted selection (MAS) tool to accelerate plant breeding. Front. Plant Sci. 5. doi: 10.3389/fpls.2014.00484
Holding, D. R., Otegui, M. S., Li, B., Meeley, R. B., Dam, T., Hunter, B. G., et al. (2007). The maize floury1 gene encodes a novel endoplasmic reticulum protein involved in zein protein body formation. Plant Cell 19, 2569–2582. doi: 10.1105/tpc.107.053538
Hoskins, R. A., Phan, A. C., Naeemuddin, M., Mapa, F. A., Ruddy, D. A., Ryan, J. J., et al. (2001). Single nucleotide polymorphism markers for genetic mapping in drosophila melanogaster. Genome Res. 11, 1100–1113. doi: 10.1101/gr.178001
Huang, X., Feng, Q., Qian, Q., Zhao, Q., Wang, L., Wang., A., et al. (2009). High-throughput genotyping by whole-genome resequencing. Genome Res. 19, 1068–1076. doi: 10.1101/gr.089516.108
Hyne, V., Kearsey, M. J., Pike, D. J., Snape, J. W. (1995). QTL analysis: unreliability and bias in estimation procedures. Mol. Breed 1, 273–282. doi: 10.1007/bf02277427
Ishii, T., Numaguchi, K., Miura, K., Yoshida, K., Thanh, P. T., Htun, T. M., et al. (2013). OsLG1 regulates a closed panicle trait in domesticated rice. Nat. Genet. 45, 462-465, 465e1–2. doi: 10.1038/ng.2567
Jaganathan, D., Thudi, M., Kale, S., Azam, S., Roorkiwal, M., Gaur, P. M., et al. (2015). Genotyping-by-sequencing based intra-specific genetic map refines a ''QTL-hotspot" region for drought tolerance in chickpea. Mol. Genet. Genomics 290, 559–571. doi: 10.1007/s00438-014-0932-3
Kim, C. S., Gibbon, B. C., Gillikin, J. W., Larkins, B. A., Boston, R. S., Jung, R. (2006). The maize mucronate mutation is a deletion in the 16-kDa gamma-zein gene that induces the unfolded protein response. Plant J. 48, 440–451. doi: 10.1111/j.1365-313X.2006.02884.x
Kim, C. S., Hunter, B. G., Kraft, J., Boston, R. S., Yans, S., Jung, R., et al. (2004). A defective signal peptide in a 19-kD alpha-zein protein causes the unfolded protein response and an opaque endosperm phenotype in the maize de*-B30 mutant. Plant Physiol. 134, 380–387. doi: 10.1104/pp.103.031310
Knapp, S. J., Stroup, W. W., Ross, W. M. (1985). Exact confidence intervals for heritability on a progeny mean basis. Crop Sci. 25, 192–194. doi: 10.2135/cropsci1985.0011183X002500010046x
Lefebvre, V., Palloix, A. (1996). Both epistatic and additive effects of QTLs are involved in polygenic induced resistance to disease:a case study, the interaction pepper-phytophthora capsici leonian. Theor. Appl. Genet. 93, 503–511. doi: 10.1007/BF00417941
Li, H., Durbin, R. (2009). Fast and accurate short read alignment with burrows-wheeler transform. Bioinformatics 25, 1754–1760. doi: 10.1093/bioinformatics/btp324
Li, W., Han, Y., Tao, F., Chong, K. (2011). Knockdown of SAMS genes encoding s-adenosyl-l-methionine synthetases causes methylation alterations of DNAs and histones and leads to late flowering in rice. J. Plant Physiol. 168, 1837–1843. doi: 10.1016/j.jplph.2011.05.020
Li, H., Peng, Z., Yang, X., Wang, W., Fu, J., Wang, J., et al. (2013). Genome-wide association study dissects the genetic architecture of oil biosynthesis in maize kernels. Nat. Genet. 45, 43–50. doi: 10.1038/ng.2484
Livak, K. J., Schmittgen, T. D. (2001). Analysis of relative gene expression data using real-time quantitative PCR and the 2(-delta delta C(T)) method. Methods 25, 402–408. doi: 10.1006/meth.2001.1262
Li, Y., Wang, Y., Wei, M., Li, X., Fu, J. (2009). QTL identification of grain protein concentration and its genetic correlation with starch concentration and grain weight using two populations in maize (Zea mays l.). J. Genet. 88, 61–67. doi: 10.1007/s12041-009-0008-z
Li, Z. K., Yu, S. B., Lafitte, H. R., Huang, N., Courtois, B., Hittalmani, S., et al. (2003). QTL×environment interactions in rice. i. heading date and plant height. Theor. Appl. Genet. 108, 141–153. doi: 10.1007/s00122-003-1401-2
Lozada, D. N., Mason, E., Sukumaran, S., Dreisigacker, S. (2018). Validation of grain yield QTLs from soft winter wheat using a CIMMYT spring wheat panel. Crop Sci. 58, 1964–1971. doi: 10.2135/cropsci2018.04.0232
Lozada, D. N., Nunez, G., Lujan, P., Dura, S., Coon, D., Barchenger, D. W., et al. (2021). Genomic regions and candidate genes linked with phytophthora capsici root rot resistance in chile pepper (Capsicum annuum l.). BMC Plant Biol. 21, 601. doi: 10.1186/s12870-021-03387-7
Lu, F. H., Kwon, S. W., Yoon, M. Y., Kim, K. T., Cho, M. C., Yoon, M. K., et al. (2012). SNP marker integration and QTL analysis of 12 agronomic and morphological traits in F8 RILs of pepper (Capsicum annuum l.). Mol. Cells 34, 25–34. doi: 10.1007/s10059-012-0018-1
Mammadov, J., Aggarwal, R., Buyyarapu, R., Kumpatla, S. (2012). SNP markers and their impact on plant breeding. Int. J. Plant Genomics 2012, 728398. doi: 10.1155/2012/728398
Mathivathana, M. K., Murukarthick, J., Karthikeyan, A., Jang, W., Dhasarathan, M., Jagadeeshselvam, N., et al. (2019). Detection of QTLs associated with mungbean yellow mosaic virus (MYMV) resistance using the interspecific cross of vigna radiata × vigna umbellata. J. Appl. Genet. 60, 255–268. doi: 10.1007/s13353-019-00506-x
Ma, J., Tu, Y., Zhu, J., Luo, W., Liu, H., Li, C., et al. (2020). Flag leaf size and posture of bread wheat: genetic dissection, QTL validation and their relationships with yield-related traits. Theor. Appl. Genet. 133, 297–315. doi: 10.1007/s00122-019-03458-2
McKenna, A., Hanna, M., Banks, E., Sivachenko, A., Cibulskis, K., Kernytsky, A., et al. (2010). The genome analysis toolkit: a MapReduce framework for analyzing next-generation DNA sequencing data. Genome Res. 20, 1297–1303. doi: 10.1101/gr.107524.110
Miao, C., Xu, Y., Liu, S., Schnable, P. S., Schnable, J. C. (2020). Increased power and accuracy of causal locus identification in time series genome-wide association in sorghum. Plant Physiol. 183, 1898–1909. doi: 10.1104/pp.20.00277
Moose, S. P., Dudley, J. W., Rocheford, T. R. (2004). Maize selection passes the century mark: a unique resource for 21st century genomics. Trends Plant Sci. 9, 358–364. doi: 10.1016/j.tplants.2004.05.005
Murray, M. G., Thompson, W. F. (1980). Rapid isolation of high molecular weight plant DNA. Nucleic Acids Res. 8, 4321–4325. doi: 10.1093/nar/8.19.4321
Mutalik Desai, S. G., Vaidya, P. S., Pardo, P. A. (2020). “Commercial sector breeding of sorghum: Current status and future prospects,” in Sorghum in the 21st century: Food – fodder – feed – fuel for a rapidly changing world. Eds. Tonapi, V. A., Talwar, H. S., Are, A. K., Bhat, B. V., Reddy, C. R., Dalton, T. J. (Singapore: Springer), 333–354.
Myers, A. M., James, M. G., Lin, Q., Yi, G., Stinard, P. S., Hennen-Bierwagen, T. A., et al. (2011). Maize opaque5 encodes monogalactosyldiacylglycerol synthase and specifically affects galactolipids necessary for amyloplast and chloroplast function. Plant Cell 23, 2331–2347. doi: 10.1105/tpc.111.087205
Peña-Rosas, J. P., Garcia-Casal, M. N., Pachón, H., McLean, M. S., Arabi, M. (2014). Technical considerations for maize flour and corn meal fortification in public health: consultation rationale and summary. Ann. N. Y. Acad. Sci. 1312, 1–7. doi: 10.1111/nyas.12434
Poland, J. A., Nelson, R. J. (2011). In the eye of the beholder: the effect of rater variability and different rating scales on QTL mapping. Phytopathology 101, 290–298. doi: 10.1094/PHYTO-03-10-0087
Poland, J. A., Rife, T. W. (2012). Genotyping-by-sequencing for plant breeding and genetics. Plant Genome 5, 92–102. doi: 10.3835/plantgenome2012.05.0005
Qiao, Z., Qi, W., Wang, Q., Feng, Y., Yang, Q., Zhang, N., et al. (2016). ZmMADS47 regulates zein gene transcription through interaction with Opaque2. PloS Genet. 12, e1005991. doi: 10.1371/journal.pgen.1005991
Raihan, M. S., Liu, J., Huang, J., Guo, H., Pan, Q., Yan, J. (2016). Multi-environment QTL analysis of grain morphology traits and fine mapping of a kernel-width QTL in Zheng58 × SK maize population. Theor. Appl. Genet. 129, 1465–1477. doi: 10.1007/s00122-016-2717-z
Ren, J., Wang, Z., Du, Z., Che, M., Zhang, Y., Quan, W., et al. (2019). Detection and validation of a novel major QTL for resistance to fusarium head blight from triticum aestivum in the terminal region of chromosome 7DL. Theor. Appl. Genet. 132, 241–255. doi: 10.1007/s00122-018-3213-4
Rowan, B. A., Patel, V., Weigel, D., Schneeberger, K. (2015). Rapid and inexpensive whole-genome genotyping-by-sequencing for crossover localization and fine-scale genetic mapping. G3 (Bethesda) 5, 385–398. doi: 10.1534/g3.114.016501
Saxena, R. K., Kale, S. M., Kumar, V., Parupali, S., Joshi, S., Singh, V., et al. (2017). Genotyping-by-sequencing of three mapping populations for identification of candidate genomic regions for resistance to sterility mosaic disease in pigeonpea. Sci. Rep. 7, 1813. doi: 10.1038/s41598-017-01535-4
Scheben, A., Batley, J., Edwards, D. (2017). Genotyping-by-sequencing approaches to characterize crop genomes: choosing the right tool for the right application. Plant Biotechnol. J. 15, 149–161. doi: 10.1111/pbi.12645
Schmidt, R. J., Burr, F. A., Aukerman, M. J., Burr, B. (1990). Maize regulatory gene opaque-2 encodes a protein with a "leucine-zipper" motif that binds to zein DNA. Proc. Natl. Acad. Sci. U.S.A. 87, 46–50. doi: 10.2307/2353624
Somegowda, V. K., Prasad, K., Naravula, J., Vemula, A., Selvanayagam, S., Rathore, A., et al. (2022). Genetic dissection and quantitative trait loci mapping of agronomic and fodder quality traits in sorghum under different water regimes. Front. Plant Sci. 13. doi: 10.3389/fpls.2022.810632
Spindel, J., Wright, M., Chen, C., Cobb, J., Gage, J., Harrington, S., et al. (2013). Bridging the genotyping gap: using genotyping by sequencing (GBS) to add high-density SNP markers and new value to traditional bi-parental mapping and breeding populations. Theor. Appl. Genet. 126, 2699–2716. doi: 10.1007/s00122-013-2166-x
Su, C. F., Wang, W., Gong, S. L., Zuo, J. H., Li, S. J. (2016). Factors influencing QTL mapping accuracy under complicated genetic models by computer simulation. Genet. Mol. Res. 15, 4. doi: 10.4238/gmr15049153
Su, C., Wang, W., Gong, S., Zuo, J., Li, S., Xu, S. (2017). High density linkage map construction and mapping of yield trait QTLs in maize (Zea mays) using the genotyping-by-sequencing (GBS) technology. Front. Plant Sci. 8. doi: 10.3389/fpls.2017.00706
Tang, S., Zhao, H., Lu, S., Yu, L., Zhang, G., Zhang, Y., et al. (2021). Genome- and transcriptome-wide association studies provide insights into the genetic basis of natural variation of seed oil content in brassica napus. Mol. Plant 14, 470–487. doi: 10.1016/j.molp.2020.12.003
Thabuis, A., Palloix, A., Servin, B., Daubèze, A., Signoret, P., Hospital, F., et al. (2004). Marker-assisted introgression of 4 phytophthora capsici resistance QTL alleles into a bell pepper line: validation of additive and epistatic effects. Mol. Breed. 14, 9–20. doi: 10.1023/B:MOLB.0000037991.38278.82
Wang, B., Liu, H., Liu, Z., Dong, X., Guo, J., Li, W., et al. (2018). Identification of minor effect QTLs for plant architecture related traits using super high density genotyping and large recombinant inbred population in maize (Zea mays). BMC Plant Biol. 18, 17. doi: 10.1186/s12870-018-1233-5
Wang, H., Nussbaum-Wagler, T., Li, B., Zhao, Q., Vigouroux, Y., Faller, M., et al. (2005). The origin of the naked grains of maize. Nature 436, 714–719. doi: 10.1038/nature03863
Wang, G., Qi, W., Wu, Q., Yao, D., Zhang, J., Zhu, J., et al. (2014). Identification and characterization of maize floury4 as a novel semidominant opaque mutant that disrupts protein body assembly. Plant Physiol. 165, 582–594. doi: 10.1104/pp.114.238030
Wang, G., Sun, X., Wang, G., Wang, F., Gao, Q., Sun, X., et al. (2011). Opaque7 encodes an acyl-activating enzyme-like protein that affects storage protein synthesis in maize endosperm. Genetics 189, 1281–1295. doi: 10.1534/genetics.111.133967
Wang, G., Wang, F., Wang, G., Wang, F., Zhang, X., Zhong, M., et al. (2012). Opaque1 encodes a myosin XI motor protein that is required for endoplasmic reticulum motility and protein body formation in maize endosperm. Plant Cell 24, 3447–3462. doi: 10.1105/tpc.112.101360
Wang, N., Yuan, Y., Wang, H., Yu, D., Liu, Y., Zhang, A., et al. (2020). Applications of genotyping-by-sequencing (GBS) in maize genetics and breeding. Sci. Rep. 10, 16308. doi: 10.1105/tpc.112.101360
Xiang, X., Wu, Y., Planta, J., Messing, J., Leustek, T. (2018). Overexpression of serine acetyltransferase in maize leaves increases seed-specific methionine-rich zeins. Plant Biotechnol. J. 16, 1057–1067. doi: 10.1111/pbi.12851
Xing, A., Gao, Y., Ye, L., Zhang, W., Cai, L., Ching, A., et al. (2015). A rare SNP mutation in Brachytic2 moderately reduces plant height and increases yield potential in maize. J. Exp. Bot. 66, 3791–3802. doi: 10.1093/jxb/erv182
Xu, J. H., Messing, J. (2009). Amplification of prolamin storage protein genes in different subfamilies of the poaceae. Theor. Appl. Genet. 119, 1397–1412. doi: 10.1007/s00122-009-1143-x
Yang, G. H., Dong, Y. B., Li, Y. L., Wang, Q. L., Shi, Q. L., Zhou, Q. (2014). QTL verification of grain protein content and its correlation with oil content by using connected RIL populations of high-oil maize. Genet. Mol. Res. 13, 881–894. doi: 10.4238/2014.February.14.18
Yang, G., Dong, Y., Li, Y., Wang, Q., Shi, Q., Zhou, Q., et al. (2013). Verification of QTL for grain starch content and its genetic correlation with oil content using two connected RIL populations in high-oil maize. PloS One 8, e53770. doi: 10.1371/journal.pone.0053770
Yang, Z., Li, X., Zhang, N., Zhang, Y. N., Jiang, H. W., Gao, J., et al. (2016). Detection of quantitative trait loci for kernel oil and protein concentration in a B73 and Zheng58 maize cross. Genet. Mol. Res. 15, 3. doi: 10.4238/gmr.15038951
Yan, M., Pan, T., Zhu, Y., Jiang, X., Yu, M., Wang, R., et al. (2022). FLOURY ENDOSPERM20 encoding SHMT4 is required for rice endosperm development. Plant Biotechnol. J. 20, 1438–1440. doi: 10.1111/pbi.13858
Yan, J., Tang, H., Huang, Y., Shi, Y., Li, J., Zheng, Y. (2003). Dynamic analysis of QTL for plant height at different developmental stages in maize (Zea mays l.). Chin. Sci. Bull. 48, 7. doi: 10.1371/journal.pone.0079305
Yepuri, V., Jalali, S., Mudunuri, V., Pothakani, S., Kancharla, N., Arockiasamy, S. (2022). Genotyping by sequencing-based linkage map construction and identification of quantitative trait loci for yield-related traits and oil content in jatropha (Jatropha curcas l.). Mol. Biol. Rep. 49, 4293–4306. doi: 10.1007/s11033-022-07264-w
Zhang, Z., Dong, J., Ji, C., Wu, Y., Messing, J. (2019). NAC-type transcription factors regulate accumulation of starch and protein in maize seeds. Proc. Natl. Acad. Sci. U.S.A. 116, 11223–11228. doi: 10.1073/pnas.1904995116
Zhang, H., Jin, T., Huang, Y., Chen, J., Zhu, L., Zhao, Y. (2015). Identification of quantitative trait loci underlying the protein, oil and starch contents of maize in multiple environments. Euphytica 205, 169–183. doi: 10.1007/s10681-015-1419-y
Zhang, J., Lu, X. Q., Song, X. F., Yan, J. B., Song, T. M., Dai, J. R., et al. (2008). Mapping quantitative trait loci for oil, starch, and protein concentrations in grain with high-oil maize by SSR markers. Euphytica 162, 335–344. doi: 10.1007/s10681-007-9500-9
Zhang, Y., Zhang, H., Zhao, H., Xia, Y., Zheng, X., Fan, R., et al. (2022). Multi-omics analysis dissects the genetic architecture of seed coat content in brassica napus. Genome Biol. 23, 86. doi: 10.1186/s13059-022-02647-5
Zhou, Z., Zhang, C., Zhou, Y., Hao, Z., Wang, Z., Zeng, X., et al. (2016). Genetic dissection of maize plant architecture with an ultra-high density bin map based on recombinant inbred lines. BMC Genomics 17, 178. doi: 10.1186/s12864-016-2555-z
Keywords: maize, protein content, genotyping by sequencing, high resolution linkage map, quantitative trait loci
Citation: Lu X, Zhou Z, Wang Y, Wang R, Hao Z, Li M, Zhang D, Yong H, Han J, Wang Z, Weng J, Zhou Y and Li X (2022) Genetic basis of maize kernel protein content revealed by high-density bin mapping using recombinant inbred lines. Front. Plant Sci. 13:1045854. doi: 10.3389/fpls.2022.1045854
Received: 16 September 2022; Accepted: 29 November 2022;
Published: 15 December 2022.
Edited by:
Colin Hiebert, Agriculture and Agri-Food Canada (AAFC), CanadaReviewed by:
Zefeng Yang, Yangzhou University, ChinaQingshan Chen, Northeast Agricultural University, China
Huatao Chen, Jiangsu Academy of Agricultural Sciences (JAAS), China
Yanye Ruan, Shenyang Agricultural University, China
Copyright © 2022 Lu, Zhou, Wang, Wang, Hao, Li, Zhang, Yong, Han, Wang, Weng, Zhou and Li. This is an open-access article distributed under the terms of the Creative Commons Attribution License (CC BY). The use, distribution or reproduction in other forums is permitted, provided the original author(s) and the copyright owner(s) are credited and that the original publication in this journal is cited, in accordance with accepted academic practice. No use, distribution or reproduction is permitted which does not comply with these terms.
*Correspondence: Xinhai Li, bGl4aW5oYWlAY2Fhcy5jbg==; Yu Zhou, emhvdXl1MDkyNEAxMjYuY29t
†These authors have contributed equally to this work