 Yunsheng Wang
 Muhammad Qasim Shahid
94% of researchers rate our articles as excellent or good
Learn more about the work of our research integrity team to safeguard the quality of each article we publish.
Find out more
ORIGINAL RESEARCH article
Front. Plant Sci., 04 January 2023
Sec. Plant Systematics and Evolution
Volume 13 - 2022 | https://doi.org/10.3389/fpls.2022.1035157
Horizontal gene transfer is a rare and useful genetic mechanism in higher plants. Gastrodia elata Blume (GE) (Orchidaceae), well known as traditional medicinal material in East Asia, adopts a heterotrophic lifestyle, thus being considered to be more prone to horizontal gene transfer (HGT). GE is a “polytypic species” that currently comprised of five recognized forms according to the plant morphology. G. elata Blume forma elata (GEE) and G. elata Bl.f.glauca (GEG) are two common forms that naturally grow in different habitats with difference in altitude and latitude. G. elata Bl.f.viridis (GEV) often occurs sporadically in cultivated populations of GEE and GEG. However, the genetic relationships and genetic mechanism underpinned the divergent ecological adaptations of GEE and GEG have not been revealed. Here, we assembled a chromosome-level draft genome of GEE with 1.04 Gb. Among predicted 17,895 protein coding genes, we identified three HGTs. Meanwhile, we resequenced 10 GEE accessions, nine GEG accessions, and 10 GEV accessions, and identified two independent genetic lineages: GEG_pedigree (GEG individuals and GEV individuals collected from GEG populations) and GEE_pedigree (GEE individuals and GEV individuals collected from GEE populations), which strongly support the taxonomic status of GEE and GEG as subspecies, not as different forms. In highly differentiated genomic regions of GEE_pedigree and GEG_pedigree, three chalcone synthase-encoding genes and one Phox/Bem1p (PB1) domain of encoding Auxin (AUX)/Indoleacetic acid (IAA) were identified in selection sweeping genome regions, which suggested that differentiation between GEE_pedigree and GEG_pedigree was promoted by the selection of genes related to photoresponse and growth and development. Overall, this new genome would be helpful for breeding and utilization of GE and the new findings would deepen the understanding about ecological adaptation and evolution of GE.
Horizontal gene transfer (HGT), defined as the transfer of genetic material between non-mating species by certain means other than vertical inheritance from parents to offspring during reproduction, was firstly and frequently found to be a genetic process in prokaryotes such as viruses and bacteria (Griffith, 1928; Tatum and Lederberg, 1947). HGT plays an important role in species ecological adaption and evolution by endowing new and important traits, including antibiotic resistance, pathogenicity, photosynthetic capacity, and nitrogen fixation capacity, to the recipients (Ochman et al., 2000; Chen et al., 2021). HGT events have great implications for both basic and applied biological issues. For example, horizontally transferred genes show an inconsistent pedigree with that deduced from species phylogenies. It is also implied that individual genes or a group of genes generally cannot represent the whole genome for reconstructing the evolutionary relationship of species. Therefore, ‘Phylogenomics’ comes into being (Pascal et al., 2012), by which the tree of life has been reformulated (Burki et al., 2020). In recent years, accumulating evidence, especially that obtained from gene and genome sequencing studies, has shown that HGT is not limited to prokaryotes but can occur in a broad range of taxa. HGT is able to occur between prokaryotes and eukaryotes, and among cytoplasmic DNA, mitochondrial DNA, and nuclear genomes at different frequencies (Soucy et al., 2015). In addition, a large number of artificial gene transfers have been conducted in medicine and agriculture, which play an important role in ensuring food security and human health. The successful application of such artificial gene transfers is at least partly inspired by natural HGT. In eukaryotes, most HGT cases are found in protozoa, fungi, and animals (Slot and Rokas, 2011). In plants, most HGTs are from nuclear genome or plastid DNA to mitochondrial genome, with the rarest HGT cases observed with the plastid DNA as a recipient (Richardson and Palmer, 2007). Some HGT cases with higher plant nuclear genome as the recipient have been detected, in which the donor could be bacteria (Sieber et al., 2017; Husnik and McCutcheon, 2018), fungi (Shinozuka et al., 2020; Wang et al., 2020), or other kind of higher plants (Quispe-Huamanquispe et al., 2017; Dunning et al., 2019).
GE is a long-known traditional Chinese medicine that used to treat neurological and cerebrovascular diseases (Xu, 1992). Modern medical research has shown that GE has extensive health effects, including antidepressant, neuroprotective, anti-inflammatory, anti-dote, anxiolytic, and cognition-enhancing effects (Zhan et al., 2016). GE has no leaf nor root, and the tuber growing in the soil is the only vegetative organ. GE depends on its symbiotic fungi (i.e., Mycena osmundicola and Armillaria mellea) to provide organic nutrients for seed germination and tuber growth (Park and Lee, 2013). HGTs are frequently detected in parasitic and heterotrophic higher plant species that often closely contact at the tissue of epidermis or cortex with other species in the life circle (Xi et al., 2013; Molina et al., 2014; Yang et al., 2016). As a typical heterotrophic plant, it is not clear whether the HGT event had occurred in the G. elata genome.
GE naturally grows in mountainous areas of the narrow belt from northeast to southwest Asia, covering China, Siberia (in Russia), Northern Korea, Japan, Nepal, Bhutan, and India. According to the current taxonomy viewpoint proposed by Zhou et al. (1987), GE is a “polytypic species,” containing five different forms with different inflorescence colors and mature tuber shapes. G. elata Blume forma alba and G. elata Bl. f. flavida are the only forms found in the wild habitats with scarcity. G. elata. Bl. f. elata (GEE) and G.elata Bl. f. glauca (GEG) are commonly used as medicinal materials and are cultivated widely. G. elata Bl. f. viridis (GEV) often appears sporadically in cultivated populations of GEE and GEG. The inflorescence colors of GEE, GEG, and GEV are light red, reddish brown, and green, respectively. In general, the mature tubers of GEE are relatively slender, whereas those of GEG tend to be ellipsoidal. The mature tubers of GEV that scattered into GEE population are similar to that of GEE, and that scattered in GEG populations are similar to GEG. In addition to their significant morphological divergence, natural populations of GEE and GEG also occupy distinct niches with clear heterogeneous environments; the former are naturally distributed at altitudes in subtropical mountainous areas, while the latter are distributed in colder regions of subtropical mountainous areas, or in high latitude regions including Northeastern China, the Korean Peninsula, and the Russian Far East (Wang and Yu, 1999). However, the genetic relationships between different forms of GE remain unclear, and the genetic mechanism underlie the divergent ecological adaptability of GEE (800-1500 m altitude) and GEG (>1500 m altitude) remains unknown.
Here, we sequenced, assembled a chromosome-level draft genome of G. elata BI.f.elata, and resequenced 10 GEE accessions, nine GEG accessions, and 10 GEV accessions. The major aims of this study were to (1) contribute additional reference genome information for breeding and utilization of GE; (2) verify whether GE had experienced HGT events; (3) clarify the genetic relationships between GEE, GEG and GEV; (4) explore the genetic mechanism underlie the divergent ecological adaptability of GEE and GEG.
We first performed a genome survey on a G. elata Bl.f.elata individuals (hereafter referred as G03) (See Table S1 for more sampling information). K-mer analysis was executed based on ~ 53.54 Gb short reads that generated by the MGISEQ-2000 platform (MGI Tech Co., Ltd., Beijing, China), which revealed that G03 genome is about 1.09 Gb in size with a heterozygous rate of 0.33% (Table 1, Tables S2, S3; Figure S1). These results suggest that the genome size of G. elata BI.f.elata is smaller than that of G. elata Bl.f.glauca (1.18 Gb) (Yuan et al., 2018). We then generated approximately 130.50 Gb sub-reads with an average length of 17,007 bp using the PacBio Sequel II platform (Pacific Biosciences, Menlo Park, CA, USA) (Table S4). Based on these long-read sequencing data, we constructed a draft sequence assembly of about 1.04 Gb, with 367 contigs, an N50 of 16.87 Mb, and a GC contents of 34.29% (Tables 1, S5, S6). The size of this draft assembly covered 95.5% of the estimated genome size. We mapped short reads to this draft assembly to assess its quality, and more than 99.86% of the draft assembly were covered by short reads with > 20x coverage and only 0.04% InDel/SNPs were observed (Tables S7, S8), indicating that sequencing data is of high-quality and the draft genome assembly has high coverage. However, the Benchmarking Universal Single-Copy Orthologs (BUSCO) (https://busco.ezlab.org/) analysis showed that only 1,226 plant-specific orthologs (75.96% of the total 1,614 plant-specific orthologs) could be located in this assembly (Table S9), which was in contrasting to a with the above result that 95.5% of the estimated genome were assembled. This phenomenon may be explained by the unique characteristics of G. elata, such as the rootless and leafless morphology, and to obtain organic nutrients from its symbiotic fungi. These characteristics may incur gene loss in the evolutionary process of G. elata since it is needless to undertake corresponding metabolic functions as common plants do, which have been revealed and explained clearly by Yuan et al. (2018) and Xu et al. (2021). We obtained 379,187,951 paired-end Hi-C reads from Illumina sequencing, with 27.6% (201,724,768) mapped onto different contigs (Table S10). These Hi-C reads were applied to further anchor the contigs onto super-scaffolds or chromosomes. Finally, 198 contigs with a total length of 1.02 Gb were anchored onto the 18 chromosomes of G. elata (Table 1, Table S11; Figure S2), accounting for 98.65% and 94.20% of the contig-level assembly size and estimated genome size, respectively.
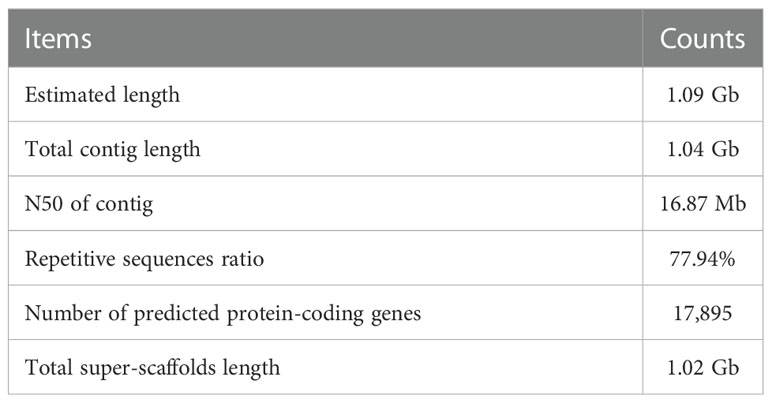
Table 1 Characteristics of G03 genome assembly.
Repetitive sequences, especially transposable elements (TEs), represent significant fractions of eukaryotic genomes and play important roles in gene regulation, chromosome structural organization, and genome evolutionary dynamics (Day et al., 2010). In contig assembly of G03 genome, about 808.2 Mb (77.94%) are repetitive sequences, of which 802.8 Mb are TEs dominated by long terminal repeats (648.6 Mb) (Tables S12, S13). A total of 17,895 protein-coding genes with an average length of 18,383.99 bp were identified in the G03 genome by a combination of three different methods, the average coding sequences and intron sequences of these protein-coding genes are 1,119.87 bp and 17,264.12 bp, respectively (Table S14). The number of annotated protein-coding genes of G. elata Bl.f.elata (17,895) is even smaller than that of G. elata Bl.f.glauca (18,969) reported by Yuan et al. (2018). Besides, non-coding RNA genes, including 25 miRNA, 1,098 tRNA, 204 rRNA, and 189 snRNA genes, were identified (Table S15; Dataset 1). Of the 17,895 predicted protein-coding genes, 15,029 (83.98%) could be functionally annotated, with 15,009 (83.87%), 11,270 (62.98%), 14,803 (82.72%), and 8,888 (49.67%) annotated by the NR, Swiss-Prot, KEGG, and GO databases, respectively (Table S16; Dataset 2). Chromosomal distribution analysis showed that the above-annotated elements were all unevenly distributed among the chromosomes of G. elata Bl.f.elata (Figure 1).
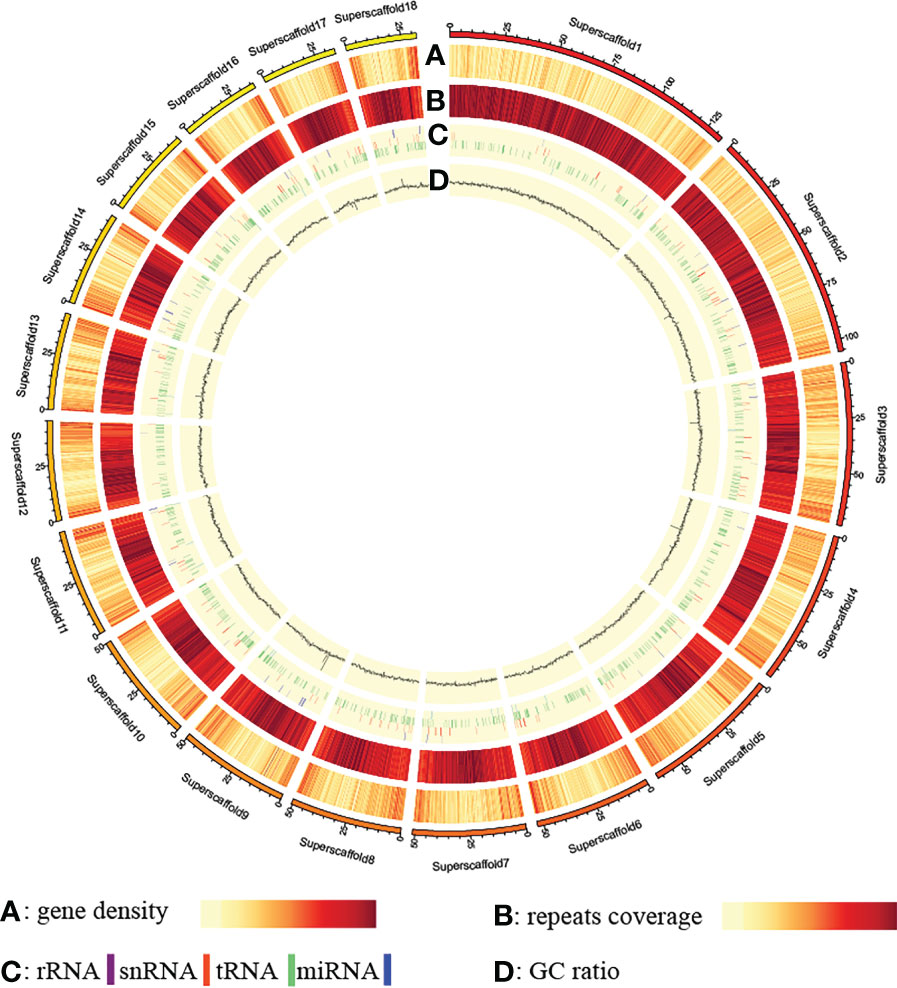
Figure 1 Distribution pattern of annotated elements along the genome.
By using the methods suggested by Li et al. (2018), rna-tia001237.1 located on superscaffold1 (124604550th–124606754th nucleotides), rna-tia016167.1 located on superscaffold8 (23043462th–23044569th nucleotides) and rna-tia007372.1 located on superscaffold17 (25965883th–25966860th nucleotides), were identified as HGTs by phylogeny and taxonomy distribution of annotated protein coding genes of G03. Phylogenetic trees of HGTs were constructed using homologs, which showed that the HTGs of GE were all from the virus genes (Figure 2; Figures S3-S5). Meanwhile, taxonomic distribution pattern of HTG homologs also showed that HTG homologs sequences in virus have the highest homology (based on the e-value of blast) with HTG sequences of Gastrodia elata (Dataset 3). Obviously, these three HTGs were evolved from viral genes. According to the all homologous trees, the HGT of rna-tia001237.1 happen between the virus donor to GE directly (Figure S3). However, HGT of rna-tia007372.1 and rna-tia016167.1 happened between the virus donor with the ancestor which shared by GE and other plant (Figures S4, S5). The GC contents of three HGTs were ranged from 49.6% to 56.8%, which were much higher than that of genome average value (34.29%) (Table 2). These results are consistent with the GC contents of genes in prokaryotes, which also usually high. The first HGT gene (rna-tia001237.1) harbored a 2,205-bp coding sequence without an intron and showed a low expression level in both tissues of G01 (GEV), and this gene was annotated as ‘uncharacterized protein’ by the Nr database and ‘major coat protein in the L-A virus’ by the InterPro database, which has high similarity to the gag-pol-like fusion protein in maize-associated totivirus 3 (Dataset 4). The second HGT gene (rna-tia016167.1) was composed of two exons with 1020 bp, and this gene expressed only in G02 (GEG), but higher expressions were detected in tuber than in flower. This gene was annotated as ‘protein FAM136A-like’ by the NR database and ‘Protein of unknown function DUF842, eukaryotic’ by the InterPro database (Dataset 4). The third HGT gene (rna-tia007372.1) was composed of three exons with 792 bp, which expressed in flower tissue of G01, G02 G03 and G04, and tuber tissue of G01, with the highest expression in flower of G04 (Dataset 4). The rna-tia007372.1 was annotated as probable monogalactosyldiacylglycerol synthase 3, chloroplastic isoform X1’ by the NR database (Dataset 4). Above results showed that rna-tia001237.1 is a young HGT and retained characteristics of the prokaryotic gene and has not been completely domesticated by the new host, while rna-tia007372.1 seem to be old HGTs and adopted by GE.
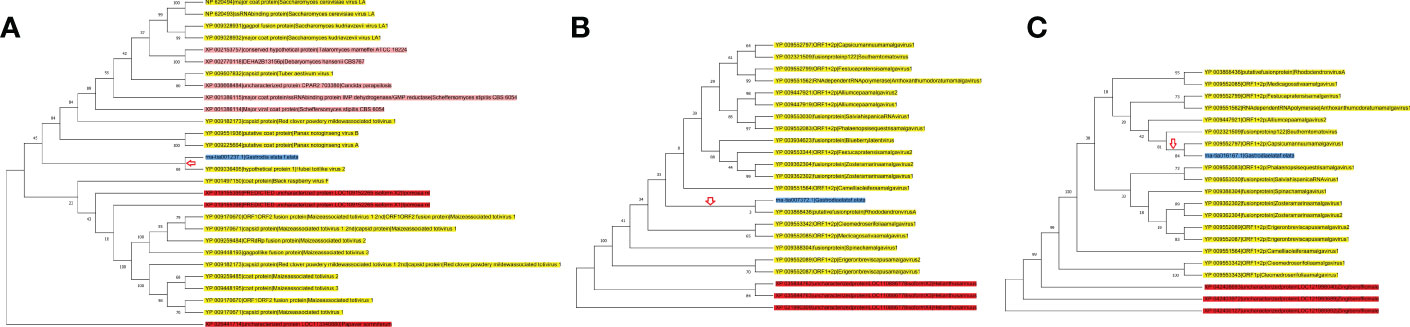
Figure 2 Maximum Likelihood (ML) phylogenetic tree of HGT homologs. (A) rna-tia001237.1; (B) rna-tia007372.1; (C) rna-tia016167.1. Terminal nodes highlighting with yellow, red, pink and blue backgrounds indicate viral, plant, fungi, and GE genes, respectively. Red arrow indicates HGTs, and numbers represent bootstrap values.

Table 2 Information of identified HGT genes.
Note: Terminal nodes highlighting with yellow, red, pink and blue backgrounds indicate viral, plant, fungi, and GE genes, respectively. Red arrow indicates HGTs, and numbers represent bootstrap values.
In total, 57,268,476-108,451,008 pairs of clean short reads composed of 8.5-16.2 Gb of clean data were obtained from the resequencing of 29 GE accessions, and more than 97.0% of reads were high quality (> Q20) in all samples, and 77.98-99.93% could be mapped onto the reference genome of G03 (Table S17). The average mapping depth was 6.51-12.78X and the mapping coverage percentage with at least 4X mapping depth reached to 74.67-96.44% for the whole genome sequence (Table S18). These results showed that the resequencing data had high genome coverage. We identified 1,524,081 high quality SNPs in GE population by analyzing the resequencing data.
To exploit the genetic relationship of the collected GE samples, phylogenetic trees were constructed based on the nuclear genome data of 30 samples. Admixture structure analysis of all samples, based on the SNP data of the total samples, revealed that all samples clustered into two clear genetic lineages (Figures 3A–C). One was GEE_pedigree, which was composed of all GEE samples and GEV samples that grow within cultivated GEE populations, and other was GEG_pedigree that composed of all GEG samples and GEV samples that grow within cultivated GEG populations. Meanwhile, we constructed the phylogenetic tree of all samples by using their chloroplast and mitochondrial genome sequences separately (Figure S6), and their results were consistent with the pattern of nuclear genome tree i.e., GEE_pedigree and GEG_pedigree clustered at different ends. Based on the above results and the fact that GEE and GEG exhibit clear differences in plant morphology and eco-geographic distribution, we proposed that the taxonomic status of both GEE and GEG should be refined as subspecies, however, GEV is still classified as a mutant form, which may origin from both GEE and GEG. Our further analysis showed significant gene flow from GEE and GEG to GEV (Figure 3D), which strengthen our assumptions.
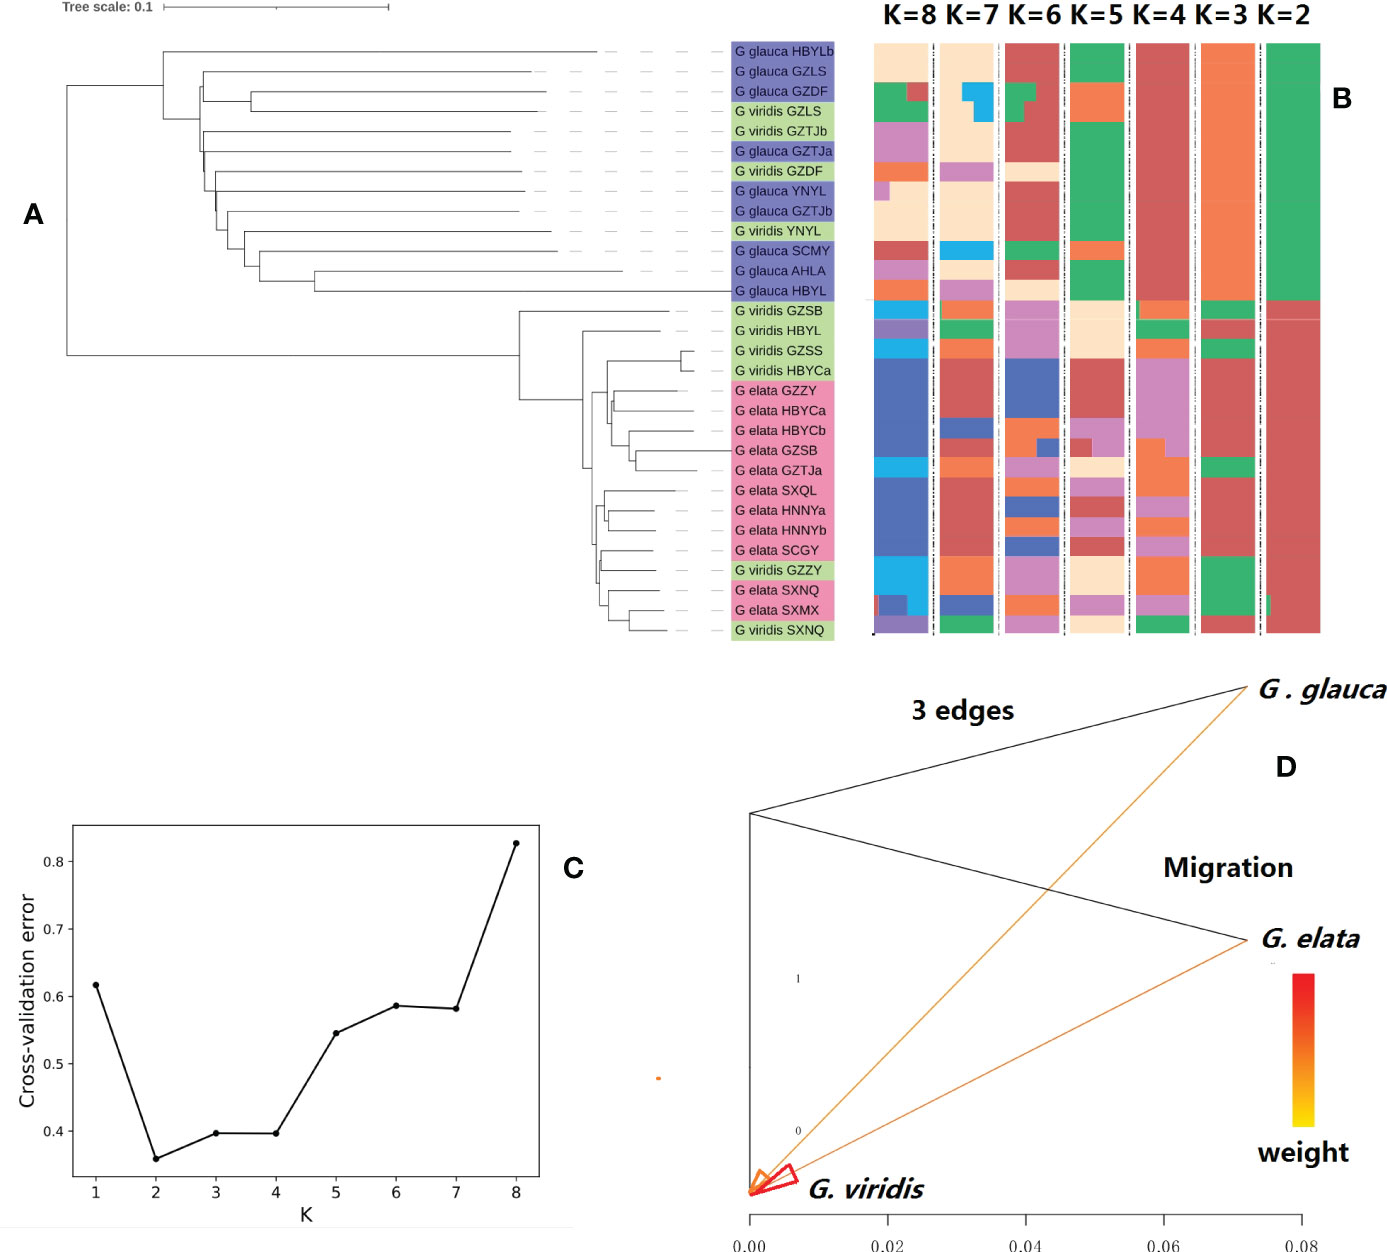
Figure 3 Population structure and gene flow analysis of 30 accessions of Gastrodia elata (GE) samples: (A) neighbor-joining phylogenetic tree; (B) admixture structure; (C): the genetic population number (K) and its corresponding value of cross-validation error generated by admixture analysis (note: K = 2 denotes the lowest cross-validation error, suggesting that the samples should be clustered into two different genetic populations); (D): gene flow among (G) elata.f.glauca, (G) elata.f.elata, and (G) elata.f.viridis populations. Note: Abscissa shows the value of gene flow and arrow indicates the direction of gene flow.
A total of 1,232,605, and 409,780 highly reliable single nucleotide polymorphisms (SNPs) were identified in the genomes of the GEG_pedigree and GEE_pedigree, and genetic diversities, as indicated by π values estimated by the nucleotide polymorphisms of pair differences, were 4.1919×10⁻⁴ and 0.8823×10⁻⁴, respectively (Table 3). However, if we classify all these samples into two populations, GEV and non-GEV, 2.915×10⁻⁴ and 3.175×10⁻⁴ genetic diversities were obtained, which is almost the same level of genetic diversity, respectively (Table S19). The π values of GEG_pedigree and GEE_pedigree were much lower than that of Populus deltoides (1.7×10⁻³) (Fahrenkrog et al., 2017), Eriobotrya japonica (1.0×10⁻³) (Wang and Paterson, 2021), Malus domestica (2.2×10⁻³) (Duan et al., 2017), Manihot esculenta (2.6×10⁻³) (Kawuki et al., 2009), Vitis Vinifera (5.1×10⁻³) (This et al., 2011), suggesting that GEE_pedigree and GEE_pedigree, especially GEE_pedigree, have a very low genetic diversity. This implies that there is a very limited scope for the genetic improvement of GE. The Tajima’s D values of GEG_pedigree, and GEE_pedigree populations at whole genome level were 1.3757, and −0.2211, respectively (Table 3). These findings tentatively indicated that divergent selection effects driven GEG_pedigree and GEE_pedigree to separate from each other.
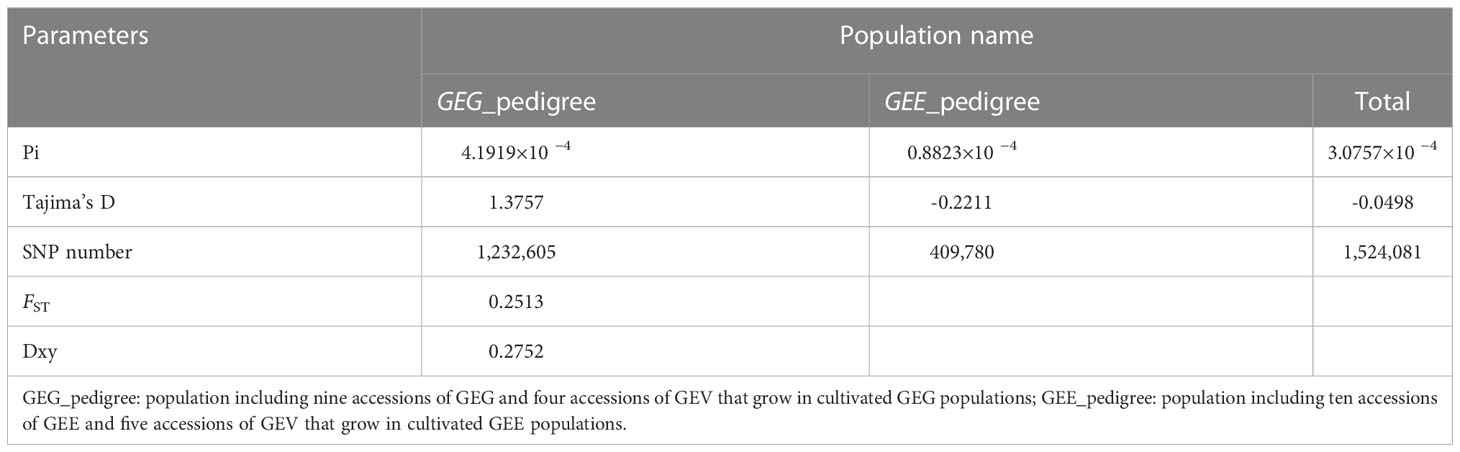
Table 3 Genetic diversity and genetic differentiation of different populations.
The average genetic differentiation index (Wright’s fixation index; FST) and absolute genetic differentiation index (dXY) between the genetic populations of GEE_pedigree and GEG_pedigree were 0.2513 and 0.2752, respectively (Table 3). These values were higher than those of cultivated maize and its wild progenitor species (FST = 0.11) (Hufford et al., 2012), allotetraploid Brassica napus (AACC) and its one progenitor diploid species B. rapa (AA) (FST = 0.136), B. napus and another progenitor diploid species B. oleracea (CC) (FST = 0.246) (Lu et al., 2019). However, the FST between the genetic populations of GEV and non-GEV was only 0.0033 (Table S19). This analysis indicated a strong genetic differentiation between GEG_pedigree and GEE_pedigree populations, but almost no genetic differentiation between GEV_pedigree and non-GEV_pedigree. These results further prove the reliability of the abovementioned conclusions regarding the taxonomic statuses of GEG, GEE, and GEV.
Genomic regions with selective sweeps can be considered to be population-specific signatures of selection (Hoban et al., 2016). The ratio of the π values of GEE_pedigree and GEG_pedigree was used to identify the genomic regions that underwent selective sweeps, resulting in 256 (p ≤ 0.01 or top1) and 432 (p ≤ 0.05 or top5) genomic bins, holding 430 and 740 genes, respectively (Figure 4; Table S19; Dataset 5). However, for GEG_pedigree, there were 98 (p ≤0.01 or top1) and 173 (p ≤ 0.05 or top5) selective sweeping genomic bins, holding 240 and 442 genes, respectively (Figure 4; Table S20; Dataset 5). When these bins were further filtered by FST outliers, there were 79 (p ≤ 0.01 or top1) and 219 (p ≤ 0.05 or top5) selective sweeping genomic bins remaining in the whole genome of GEE_pedigree. In comparison, there were only 5 (p ≤ 0.01 or top1) and 17 (p ≤ 0.05 or top5) bins in the whole genome of GEG_pedigree (Table S20; Figure 4; Dataset 5). In total, 588 genes were identified to locate on selection sweeping region by the combined FST and dXY (p ≤ 0.01 or top1). These genes were involved in 125 specific metabolic pathways related to “cellular processes,” “environmental information processing,” “genetic information processing,” “metabolism,” and “organismal systems” (Dataset 6). These results imply that multi-gene interactions responded to natural selection from local environments and drove the divergence of GEE_pedigree and GEG_pedigree lineages. From the above mentioned genes and based on their functional annotation, we identified tia000401, tia000402, tia000403, and tia016287 as key players. The genes tia000401, tia000402, and tia000403 are located on superscaffold1 (44860831th–44985639th nucleotides), and they encode chalcone synthase [EC:2.3.1.74] (K00660; Dataset 2, 6). Chalcone synthase plays crucial role in the first step of the flavonoid biosynthesis pathway (Figure S7A), and flavonoids are the major photoprotectants in plants (Schroder, 1999). These genes (tia000401, tia000402, and tia000403) were also involved in the “circadian rhythm-plant” process (Figure S7B), which play key roles in photoperiod adaptation in a given environment (Webb, 2003). Based on the above mentioned results, natural selection was found to have acted on the tia000401, tia000402, and tia000403 genes. As a result, GEG_pedigree and GEE_pedigree developed improved adaptions to their respective different light and temperature environments, which promoted their divergence. Meanwhile, we found that tia000402 displayed the highest expression, and expression levels were higher in flower than that in tuber tissues (Dataset 7). The gene tia016287 was located on extremely selective sweeps (Superscaffold8; 36507213th–36507782nd nucleotides), where the ratio of pop1/pop2 was > 40 and FST was > 0.45. The gene tia016287 encodes a Phox/Bem1p (PB1) domain of Auxin (AUX)/Indoleacetic acid (IAA), which is an auxin-responsive protein (K14484) and involved in the auxin-activated signaling pathway (Dataset 2, 6). Previous study showed that Auxin regulates growth and development of plants (Leyser, 2001). This implies that the strong selection effect on gene tia016287 probably promoted divergent adaption regarding the growth and development of GEG_pedigree and GEE_pedigree. So, tia000401, tia000402, tia000403 and tia016287 genes can be regarded as the key candidates of ‘speciation genes’ in G. elata.
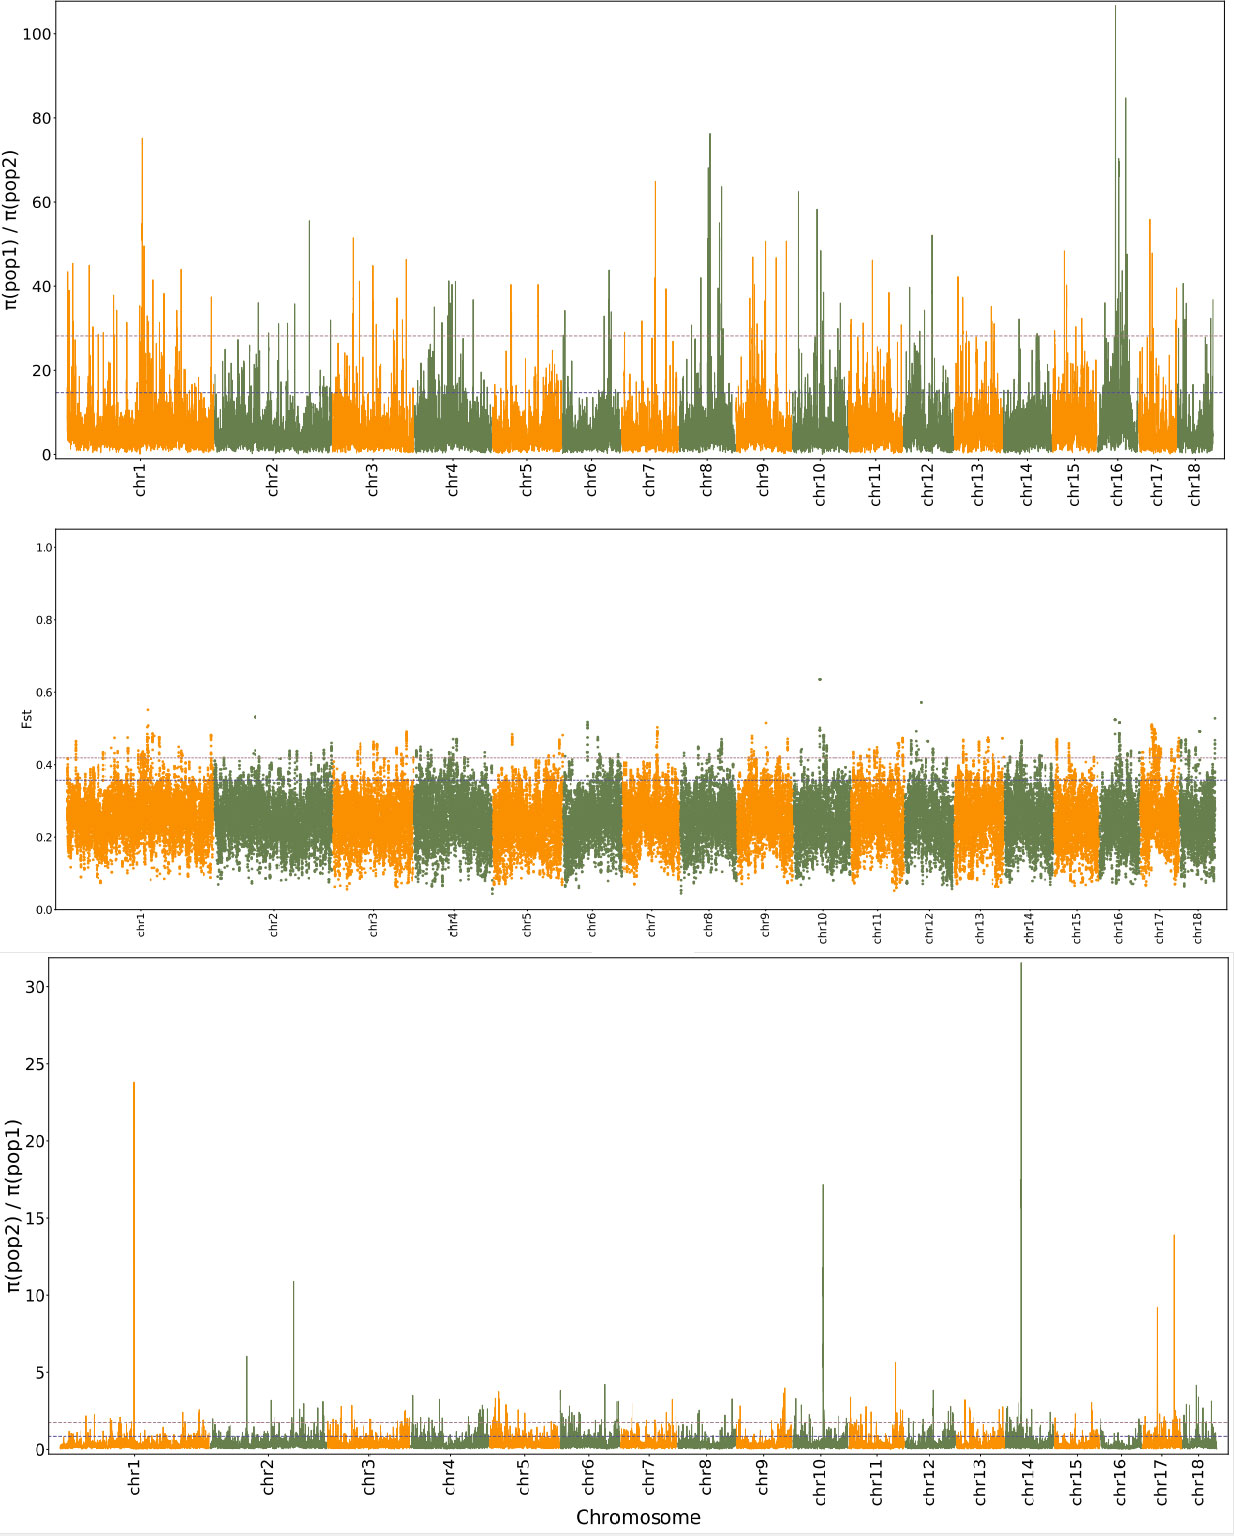
Figure 4 Distribution pattern of FST and π ratio along the chromosome between GEE_pedigree and GEG_pedigree. pop1 indicates GEG_pedigree (G. elata Bl. f. glauca [GEG] individuals and G. elata Bl. f. viridis [GEV] individuals collected from GEG populations) and pop2 indicates GEE_pedigree (G. elata. Blume forma elata [GEE] individuals and GEV individuals collected from GEE populations).
Note: pop1 indicates GEG_pedigree (G. elata Bl. f. glauca [GEG] individuals and G. elata Bl. f. viridis [GEV] individuals collected from GEG populations) and pop2 indicates GEE_pedigree (G. elata. Blume forma elata [GEE] individuals and GEV individuals collected from GEE populations).
In recent years, with the emergence of advanced sequencing technologies, HGT has re-attracted wide attention for its unique roles in phylogeny and adaptive evolution of species (Yoshida et al., 2010; Yang et al., 2019). Meanwhile, different and even opposite views on the HGT have also been proposed, including its frequency and evolutionary significance in higher plants (Baltrus, 2013; Huang, 2013). Some researchers argue that HGTs in eukaryotes are overestimated due to the contamination of bacteria or other microorganisms in the process from DNA/RNA extraction to sequencing, especially genomic data used for HGT detection are based on short reads generated by the next-generation sequencing platforms (Koutsovoulos et al., 2016; Richards and Monier, 2016; Wickell and Li, 2020). In this study, three HGT genes were identified from the reference genome of G. elata BI.f.elata, which was assembled based on long-read sequencing data, and were located on specific chromosomes. Meanwhile, mRNA sequences of all three HGT genes could be identified in at least one transcriptomic dataset generated from flower or tuber tissues of four different accessions of GE (Dataset 4). Moreover, we identified the highly homologous sequences of each HTGs from other three published draft genomes of GE (Dataset 4). Therefore, these observations eliminated the possibility that HGT genes detected in this study were the results of contamination. BLAST searches and gene tree–species tree reconciliation are two effective and common methods to detect HGTs (Wickell and Li, 2020), and both of them were conducted in this study, which confirmed that horizontal transfers of these three genes were true. However, the proportion of HGT genes (3 out of 17,895 protein-coding genes) in the G. elata genome is low. Considering the results of previous studies of HGTs in other higher plants (Richards et al., 2009; Koutsovoulos et al., 2016; Yang et al., 2019), it is possible to conclude that the HGT in higher plants is a rare genetic event. Previous studies suggested that HGTs are frequently detected in parasitic and heterotrophic higher plant species, because two different taxa contact their tissues directly (Davis and Wurdack, 2004; Zhang et al., 2014; Yang et al., 2019). However, we did not detect the footprint of HGTs from fungi to GE in this study by comparing with the annotation results of chloroplast and mitochondrial genes of GE by Yuan et al. (2018), who also detected no HGTs from fungi to cytoplasmic genome, which revealed that the direct contact may not be only requirement for HTG event. The three HTGs that we identified in the present study were all from viruses, which may happen when plant viruses rely on plant cells for reproduction, and they will turn on the reverse transcription mechanism and convert their genetic material into double stranded DNA, thus having the opportunity to insert their genetic material into the plant nuclear genome. This is in accordance with the laws of classical genetics.
Subspecies represent a lower unit of species (Haig et al., 2006). From an evolutionary point of view, they lie in a place of continuous variation between a population and a known species (John, 2010). This variation may represent adaptation to the heterogeneous local ecological environment (Winker, 2010), which will eventually lead to the emergence of new species. Thus, subspecies have long been regarded as “incipient species” (Rothschild and Jordan, 1895). In recent years, increasing attention has been focused on using subspecies as a tool to study the initial stage of speciation (Kopac et al., 2014; Schmidt et al., 2019; Marin et al., 2020). Traditionally, subspecies were defined as groups of individuals that could be discriminated according to their morphology and geographical distribution (Amadon, 1949). However, in some cases these definitions have since been found to be mismatched with phylogenetic clusters identified using modern molecular methods (Phillimore and Owens, 2006). Thus, the new concept of subspecies is defined as “genetically differentiated populations within a species that have unique morphology or demonstrated a difference in adaptation to the local environment” (Haig et al., 2006), or as “subset of populations with consistent genetic differences from other subsets of populations at multiple independent loci, with genetic differences consisting of significant variation in microsatellite alleles and mtDNA haplotype frequencies, the presence of unique alleles or haplotypes, and significant net sequence divergence” (Funk et al., 2007). This emphasizes the diagnosability of genealogy and ecological adaptation. GEG and GEE have differentiated to the point where they have different diagnosable botanical characteristics and different geographical distributions. Here, GEG_pedigree and GEE_pedigree were found to contain two independent genetic and evolutionary lineages. Therefore, based on either the old or new concepts of subspecies, GEG and GEE should be redefined as G. elata Bl. ssp. glauca and G. elata Bl. ssp. elata, respectively. Of course, GEG and GEE have high cross compatibility and hybrid fertility (Wang and Yu, 1999), determining that they are not separated species. Based on the above, we uncover the variation pattern of GEE, GEG, together with GEV at genome wide in this study, and corresponding results refined GEE and GEG as subspeices, which can deepen the understanding not only on the ecological adaption, but also on incipient speciation of GE.
Uncovering the molecular mechanisms of ecological adaption is a central target in evolutionary biology (Berlocher and Feder, 2002). Two ideologies, “forward-ecology” and “reverse-ecology,” were used for the above-mentioned target. The former involves identifying those traits that are significantly related to ecological adaption or reproductive isolation, and then investigating the genes underlie said traits. The latter involves identifying the gene loci or genomic regions that have undergone a selection effect, and then screening those genes whose molecular functions are related to ecological adaption and reproductive isolation (Li et al., 2008). In recent years, “reverse-ecology” has become more popular because of ease in high-throughput sequencing and resequencing technology (Ungerer et al., 2008; Levy. and Borenstein, 2012). Meanwhile, methods including FST outliers and comparing the nucleotide polymorphism ratios of a pair of lineages to identify the selection sweep genomic region or genes/alleles that was regarded as the most effective candidate of molecular basement responsible for the ecological adaption differentiation or speciation between two populations have been developed and widely applied (Axelsson et al., 2013; Ravinet et al., 2017; Jiao et al., 2020; Yang et al., 2022). Here, lots of selection sweeps located at different genome positions of GEE_pedigree and GEG_pedigree were found. Within these genome region, hundreds of genes were identified and executed a wide range of biological functions, suggesting that multi-gene interactions responded to the natural selection from native environments for local adaptation of GEE_pedigree and GEG_pedigree. However, some genes may have been more critical, playing leading roles, while others may have been in more passive, subordinate positions. Among selection sweeping genes, we ranked tia000401, tia000402, tia000403, and tia016287 as key genes according to their biological function, and can be the major candidates of ‘speciation gene’ of G. elata. ssp. elata and G. elata. ssp. Glauca, but this need further experiments to be verified.
Here, we assembled and annotated a high-quality chromosome-level reference genome of GE (1.05 Gb), containing 77.94% repetitive sequences and 17,895 putative protein-coding genes including three HTGs. Moreover, ten GEE accessions, nine GEG accessions, and ten GEV accessions were resequenced and analyzed. The population genomic analysis conducted here strongly suggests that GEE_pedigree and GEG_pedigree should be regarded as subspecies, instead of as different forms (i.e., the current viewpoint). Meanwhile, three chalcone synthase encoding genes and one PB1 domain of the AUX/IAA encoding gene were found to have strong selection effects. Therefore, these genes were ranked as the most important candidates for GEG_pedigree and GEE_pedigree, which influence the adaptation of the divergent photoperiod and temperature and the regulation of inconsistent growth and development characteristics. In short, this study provides an abundance of genomic information for further research and utilization of G. elata, and proposed a new view on the classification status of G. elata.f.elata and G.elata.f.glauca, and deepen the understanding of adaptive evolution of GE.
The tuber tissue of a two-year-old G. elata Bl.f.elata strain (G03) plant taken from Yiling county, Yichang city, Hubei province of China was used as sequencing material for draft genome assembly. The flower and tuber transcriptomes of same individual were used to assist in the predicting and annotating of protein-coding genes of the draft genome. We sampled the flower of nine accessions of GEGs from wild populations, 10 accessions of GEE from wild populations, and 10 accessions of GEV from cultivated populations to use for resequencing. The flower of GEV were offered by owner named as Rui Wang, Guangwen Zhang, Youmin Li, Xiaojun Chen, Xiaohong Liu, Heng Wang, Dali Huang, Jingwu Liu, Guisheng Tao and Juan Zhao. More detailed information on these samples is listed in Table S1. The specimens of the above materials were kept in the laboratory of Kaili University.
Total DNA of 30 GE accessions were extracted using the CTAB protocols proposed by (Doyle and Doyle, 1987). For each sample, the qualified DNAs were sheared into 300-500 bp fragments using Covaris ultrasonic breaker (Covaris, Woburn, MA, USA). Then the fragments were repaired by adding a tail and an adaptor sequence, and purified for sequencing library construction. The constructed library was sequenced on a MGISEQ 2000 platform (BGI, Shenzhen, China) to produce raw reads. The raw reads were then filtered by using the following criteria: filter out the adaptor sequences; remove duplicate reads produced by PCR amplification; remove the corresponding paired-end reads, if the N content exceeds 10% of the length of a single read; and remove the corresponding paired-end reads, if the low-quality base (≤ 5) number exceeds 50% of the length of a single read. The remaining clean reads with Q > 20 were used for further analyses.
Long-read library was constructed with the following steps. The qualified DNA extracted from G03 was sheared into ~ 30 kb fragments by Covaris g-TUBE (Covaris, Woburn, MA, USA). DNA fragments were enriched and purified by AMPure XP magnetic beads (Beckman Coulter Inc, Brea, California, America), and then were damage- and end-repaired. The SMRT dumbbell-type adapters were ligated at both ends of DNA fragments. DNA fragments without adapters were removed by exonuclease to obtain the initial sequencing library. The Bluepippin system (Sage Science, Beverly, MA, USA) was used to screen the initial sequencing library to obtain the final sequencing library. The quality of the final sequencing library was determined by a Qubit 2.0 fluorometer (Thermo Fisher Scientific, Waltham, MA, USA) and the library size was estimated using an Agilent 2100 bioanalyzer (Agilent Technologies, Palo Alto, CA, USA). The qualified library (OD260/280 = 1.8-2.0; concentration > 50 ng/μL) was sequenced on a PacBio RS II platform (Pacific Biosciences, Menlo Park, CA, USA). The SMRTlink software (https://www.pacb.com/support/software-downloads/ ) was used to filter and process the resulting data with ‘minLength = 500’; other parameters were used as default settings.
Total RNA was extracted from the flower and tuber tissues of strain G01, G02, G03, and G04 (Please see Table S1 for samples detail) by strictly following the guidelines of the RNA extraction kit (Thermo Fisher Scientific Inc, Waltham, MA, USA). The concentration and purity of the extracted RNA were measured by a Nanodrop 2000 (Thermo Fisher Scientific, Waltham, MA, USA) spectrophotometer, while RNA integrity and RNA integrity number (RIN) were measured by agarose gel electrophoresis and an Agilent 2100 bioanalyzer (Agilent Technologies, Palo Alto, CA, USA), respectively. Approximately 2 μg of high-quality RNA showing a clear band in the agarose gel, a concentration ≥ 300 ng/μL, and OD260/OD280 = 1.8-2.2 was used to construct the sequencing library according to the recommended protocols by the manufacturer. mRNA was enriched from total RNA by using magnetic oligo(dT) beads. mRNA was sheared into fragments by Covaris g-TUBE (Covaris, Woburn, MA, USA). The first-strand cDNA was synthesized by the M-MuLV reverse transcriptase system using mRNA fragments as template and random oligonucleotides as primers. Then mRNA was degraded by RNaseH, and the second-strand cDNA was synthesized with dNTPs in the DNA polymerase I system. The purified double-stranded cDNA was end-repaired by adding an A-tail and ligated with the sequencing adaptor. The 250-300 bp cDNA fragments were screened out by AMPure XP beads and amplified by PCR. The PCR products were again purified by AMPure XP beads to obtain the final sequencing library. Finally, RNA sequencing was performed on an Illumina HiSeq 4000 platform (Illumina, San Diego, CA, USA) to generate more than 6 Gb raw data per sample.
The clean data were obtained by filtering out the reads containing the adaptor sequence, and paired-end reads containing N content exceeds 10% of the length proportion, or low-quality (< = 5) base number exceeds 50% of the length proportion in a single read. Only high-quality clean data were used for further analyses. The data outputs including the number of sequencing reads, sequencing error rate, Q20 content, Q30 content, and GC content were counted.
The reference transcripts were generated from qualified clean RNA reads (> Q20) of the flower G01, G02, G03 and G04 through mapping onto the assembled reference genome of G03. Then clean reads were mapped onto the transcripts using Bowtie2 v2.3.4.1 (https://wiki.rc.usf.edu/index.php/Bowtie2#Version ). If a transcript sequence mapped onto the predicted protein-coding region of the reference genome, then it was considered as an existing gene, otherwise the corresponding sequence was considered as a new gene. The number of reads mapped on each transcript in each sample were counted based on the mapping results produced by Bowtie2. Subsequently, the FPKM (fragments per kilobase per million bases)-transformed results were generated using RSEM software (http://deweylab.github.io/RSEM/) and the expression patterns of protein-coding genes or their transcripts were obtained.
The estimation of the G03 genome size (C-value) was performed based on short-read sequencing data using the KAT program (Mapleson et al., 2017) according to the following formula: genome size = (total nucleotide number)/(average sequencing depth) = (total number of K-mer)/(average K-mer coverage). The K value was used based on the maximum number of odd numbers that fit the following formula: 4^K/genome > 200.
The MECAT software (Xiao et al., 2017) was used to assemble an initial draft genome assembly of G03 based on long-read sequencing data, then the ARROW software built in the Smrtlink package (https://www.pacb.com/support/software-downloads/ ) was used to correct any errors in the draft genome assembly with a minimum coverage of 15, and the other parameters were kept at default settings. The corrected draft genome assembly was polished using Illumina short reads to obtain a final draft genome assembly by Pilon software (Walker et al., 2014).
Tuber tissues of G03 were pretreated according to the following steps. The DNA conformation of the cells was first fixed with paraformaldehyde. The cells were lysed, and the cross-linked DNA was digested by restriction endonucleases, BalI, EcoRI, and BamHI, to produce sticky ends, which were then repaired and introduced to be labeled with oligonucleotide ends containing biotin. DNA fragments were ligated using DNA ligase, and the cross-linked DNA was removed by protease digestion and purification. DNA fragments were randomly divided into 300-500 bp groups, and the labeled DNA was captured by avidin magnetic beads for Hi-C sequencing library construction as follow. The biotin-containing DNA was captured through the adsorption of avidin magnetic beads. Then the DNA fragments were end-repaired by adding poly-A tailed and ligated adapter. The PCR amplification was performed, and the Hi-C library was purified by gel electrophoresis. A Qubit 2.0 fluorometer was then used for preliminary quantification of the library, and the library was diluted to a concentration of 1 ng/μL. Then, an Agilent 2100 bioanalyzer was used to determine the insert size of the library, and the effective concentration of the library was accurately quantified by qPCR. Finally, the qualified library was sequenced on an Illumina HiSeq platform (paired-end sequencing, 2 × 150 bp) according to the effective concentration and the demand of the target data.
Raw reads generated by the Illumina HiSeq platform (paired-end sequencing, 2 × 150 bp) were filtered out those containing the adaptor, continuous bases with a quality value < 20 at both ends, and those with a final length of < 50 bp in any single read. The BWA v0.7.17 software (https://sourceforge.net/projects/bio-bwa/files/ ) was used to map the clean reads of G03 draft genome assembly. The reads with a distance from the restriction site > 500 bp were removed, and the remaining data were used to construct a chromosome-level genome assembly by Lachesis (Burton et al., 2013). The interaction map was constructed for the assembled chromosome-level genome by Juicer, and the visual error correction was carried out by Juicebox (Durand et al., 2016).
The Benchmarking Universal Single-Copy Ortholog (BUSCO) analysis was used to estimate the completeness of the G. elata Bl.f.elata genome assembly by searching for plant-specific orthologs against the embryophyta_odb9 dataset (https://busco.ezlab.org/ ). The possible loss rate was calculated based on the single-copy orthologous gene set in OrthoDB (http://cegg.unige.ch/orthodb6). The short reads were mapped to the G. elata Bl.f.elata genome assembly by BWA, and SNP calling and filtering were performed by GATK (https://www.broadinstitute.org/gatk/). Homozygous and heterozygous SNPs and InDels were calculated to assess the accuracy of the genome assembly.
First of all, repetitive sequences in the G. elata Bl.f.elata genome assembly were annotated based on the Repbase database (https://www.girinst.org/repbase/ ). Three methods were used, including (1) homology-based prediction using RepeatMasker v4.09 and RepeatProteinMask) (Smit et al, 2019); (2) self-sequence alignment-based prediction using RepeatModeler v1.0.11 (Smit and Hubley, 2017), RepeatScout v1.0.5 (Price et al., 2005), and the tandem repeats database (TRDB) (http://tandem.bu.edu/trf/trf.html); and (3) de novo prediction using LTR-FINDER (Xu and Wang, 2007).
Secondly, protein-coding genes were initially predicted by integrating multiple prediction methods, including homology-based prediction (based on at least two to three related species) (Keilwagen et al., 2016); de novo prediction using Augustus v3.3 (Stanke and Morgenstern, 2005), GENSCAN (Burge and Karlin, 1997), and GlimmerHMM software v3.0.4 (Majoros et al., 2004); and transcriptome-based prediction (Trapnell et al., 2010) assisted by clean RNA sequencing data from the flower and tuber tissues of G03. Then, the various gene sets obtained from different methods were integrated into a non-redundant and more complete gene set using MAKER v2.00 (Cantarel et al., 2008). Meanwhile, through the integration of BUSCO results, the final reliable gene set was obtained by using the HiCESAP pipeline developed by Maiwei Int. Finally, functional annotation of the protein-coding genes was carried out by searching against the frequently used protein databases including Swiss-Prot (https://www.expasy.org/resources/uniprotkb-swiss-prot), TrEMBL (http://www.bioinfo.pte.hu/more/TrEMBL.htm), KEGG (https://www.genome.jp/kegg/), InterPro (https://www.ebi.ac.uk/interpro/), GO (http://geneontology.org/), and NR (https://www.ncbi.nlm.nih.gov/refseq/about/nonredundantproteins/).
Thirdly, tRNAscan-SE software (Lowe and Eddy, 1997) was used to identify tRNA sequences in the G03 genome assembly according to the structural characteristics of tRNAs. BLASTN searches (https://blast.ncbi.nlm.nih.gov/Blast.cgi ) were conducted to identify rRNA sequences in the G03 genome using rRNA sequences in the related species as reference. miRNAs and snRNAs in the G03 genome were predicted using the covariance model and INFERNAL v1.1 (Nawrocki and Eddy, 2013) based on Rfam v14.1 (Griffiths-Jones et al., 2005).
Finally, software Circos (Krzywinski et al., 2009) was used to visualize component compositions on the chromosomes based on the above annotation results of repetitive sequences, protein-coding genes, and rRNA genes.
We identified HTGs according to the methods explained by Li et al. (Li et al., 2018). In brief, all protein sequences of annotated genes of G03 were blastp against the Refseq (https://www.ncbi.nlm.nih.gov/refseq/) and Nr databases (https://www.ncbi.nlm.nih.gov/refseq/about/nonredundantproteins/) with p-values lower than 0.05, and classified hits of each query to define taxonomic group (including plant, archaea, bacteria, fungi, virus, other). Then extract best bit-score with e-values in top 20 and calculated the HGT index (h) (Boschetti et al., 2012) and alien index (AI) (Gladyshev. et al., 2008) for each remaining query, and deduce the viable HGT when a query by both h index and AI index led to similar conclusion to be possible HGT. Finally, HTGs were determined by the phylogenetic tree of candidate HTG homologs that were constructed by measuring the maximum likelihood using software TBtool v.1.1043 (https://github.com/CJ-Chen/TBtools/releases) under the GTR + g model with 5000 bootstrap (https://github.com/stephaneguindon/phyml), and taxonomic distribution of HTG homologs.
The draft genome sequence at the chromosome level of GEE (G03) was used as a reference genome for mapping the clean resequencing data using the BWA software (https://github.com/lh3/bwa). The Picard software (https://sourceforge.net/projects/picard/) was used to perform duplicate mapping. The SAMtools software (https://github.com/samtools/samtools) was used to determine the mapping rate, coverage, and sequencing depth.
The GATK software (https://gatk.broadinstitute.org/hc/en-us ) with default parameters was used to call the SNPs. Those SNPs with supporting read numbers < 4, minimum allele frequency < 0.05, and sample coverage proportion >10% (sample coverage) are considered as highly reliable, and the remaining high-reliability SNP dataset with more than 50% sample coverage was used for further analysis. The genome coverage of resequencing data was more than 90% for all samples used for SNP identification in the present study (Table S18). The ANNOVAR software (https://www.openbioinformatics.org/annovar/annovar_download.html ) was used to annotate the SNPs detected in each sample, including location information and type of variation.
Three analyses, including phylogenetic tree construction, principal component analysis (PCA), and genetic structure analysis, were performed based on the population SNP dataset. The phylogenetic tree was constructed using the neighbor-joining method (Saitou and Nei, 1987), based on a distance matrix calculated using the Treebest software (Vilella et al., 2009). Similar approach was used to construct phylogenetic tree based on chloroplasts and mitochondria sequences of all samples with kiwifruit (Actinidia chinensis) and citrus (Citrus reticulata) as outgroups. The PCA of samples was performed using the GCTA software (Yang et al., 2011). The population structure was analyzed using the Admixture software, based on a Bayesian mathematical model (Alexander et al., 2009). The purpose of this study was to classify each material into a specific group and determine the population structure of the total population. The best K value was determined by calculating the cross-validation error, and the minimum cross-validation error was used to determine the best K value. The gene flows among GEE, GEG and GEV was calculated by program treemix (version:1.1.3) (https://bitbucket.org/nygcresearch/treemix/downloads/ ).
Genomic differentiation between populations was measured by FST (Weir and Cockerham, 1984) and dXY (equation 10.20) (Nei, 1987). Genomic bins with the highest FST (p ≤ 0.01 or top1) and/or dXY (p ≤ 0.05 or top5) values were considered outliers, and GIS. The selection effect on populations was analyzed using Tajima’s D values (Tajima, 1989). The effect of selection sweep was estimated by calculating the ratio of π (θ) values (Schlötterer et al., 2004) and by a combined FST-π approach (Akey et al., 2002). The former was used to define genomic regions where the nucleotide diversity of πpop1/πpop2 (or πpop2/πpop1) reduced sharply (p ≤ 0.01 or ≤ top1) as selective sweeps, whereas the latter was used to define genomic regions where the nucleotide diversity of πpop1/πpop2 (or πpop2/πpop1) decreased sharply (p ≤ 0.01 or ≤ top1) accompanied by a relatively high FST (p ≤ 0.01 or ≤ top1). The Tajima’s D values, FST, dXY, and π (θ) were all computed using the VCFtools software (http://vcftools.sourceforge.net/)].
The genes located in genomic blocks that underwent section sweeps were further annotated for molecular or biological functions using the BLASTX algorithm (E value < 1.0 E− 5) by querying them against the following databases: Nr, TrEMBL, GO, COGs, and KEGG. The GOseq software (Young et al., 2010) was used for GO enrichment analysis and the KOBAS software (Mao et al., 2005) was used for KEGG enrichment analysis. According to aforementioned annotation, we focused on several genes in the sweeping region, which response to biological rhythm or development that adaptive for light and temperature environment.
The draft genome and predicted protein-coding gene of G03 with gff format, re-sequencing raw data of 29 GE accessions, and flower and leaf transcriptome raw data of G01, G02, G03 and G04 have been deposited in China National Center for Bioinformation (https://bigd.big.ac.cn/?lang=zh) (Accessible ID: GWHAOSR00000000; CRA005104; OMIX677, and OMIX002622).
Plant samples used in the study were not collected from national park or natural reserve. According to national and local legislation, no specific permission was required for collecting these plants. We confirm that this complies with national guidelines and no formal ethics approval was required in this particular case.
YW designed the experiments, collected samples, analyzed data, YW and MS wrote and revised the paper. All authors contributed to the article and approved the submitted version.
This work was funded by Science and technology plan project of Guizhou Province [2019]2415, Innovative Talent Team Program from Education Department of Guizhou Province (201326) and National Natural Science Foundation of China (31560091).
We sincerely thank the experimental personnel and bioinformatics analysts in frasergen company (http://www.frasergen.com/ ), who participated in this project. We also sincerely thank Dr Chengjie Chen in School of Horticulture Science, Southern China Agriculture University who help to construct HGT trees.
The authors declare that the research was conducted in the absence of any commercial or financial relationships that could be construed as a potential conflict of interest.
All claims expressed in this article are solely those of the authors and do not necessarily represent those of their affiliated organizations, or those of the publisher, the editors and the reviewers. Any product that may be evaluated in this article, or claim that may be made by its manufacturer, is not guaranteed or endorsed by the publisher.
The Supplementary Material for this article can be found online at: https://www.frontiersin.org/articles/10.3389/fpls.2022.1035157/full#supplementary-material
Supplementary File 8 | This file contains Supplementary Figures 1-7, Supplementary Tables 1-20.
Akey, J. M., Zhang, G., Zhang, K., Jin, L., Shriver, M. D. (2002). Interrogating a high density SNP map for signatures of natural selection. Genome Res. 12, 1805–1814. doi: 10.1101/gr.631202
Alexander, D. H., Novembre, J., Lange, K. (2009). Fast model-based estimation of ancestry in unrelated individuals. Genome Res. 19, 1655–1664. doi: 10.1101/gr.094052.109
Amadon, D. (1949). The seventy-five per cent rule for subspecies. Condor 51, 250–258. doi: 10.2307/1364805
Axelsson, E., Ratnakumar, A., Arendt, M. L., Maqbool, K., Webster, M. T., Perloski, M., et al. (2013). The genomic signature of dog domestication reveals adaptation to a starch-rich diet. Nature 495, 360–364. doi: 10.1038/nature11837
Baltrus, D. A. (2013). Exploring the costs of horizontal gene transfer. Trends Ecol. Evol. 28, 489–495. doi: 10.1016/j.tree.2013.04.002
Berlocher, S. H., Feder, J. L. (2002). Sympatric speciation in phytophagous insects: moving beyond controversy? Annu.Rev.Entomol. 47, 773–815. doi: 10.1146/annurev.ento.47.091201.145312
Boschetti, C., Carr, A., Crisp, A., Eyres, I., Wang-Koh, Y., Lubzens, E., et al. (2012). Biochemical diversification through foreign gene expression in bdelloid rotifers. PloS Genet. 8, e1003035. doi: 10.1371/journal.pgen.1003035
Burge, C., Karlin, S. (1997). Prediction of complete gene structures in human genomic DNA. J. Mol. Biol. 268, 78–94. doi: 10.1006/jmbi.1997.0951
Burki, F., Roger, A. J., Brown, M. W., Simpson, A. G. B. (2020). The new tree of eukaryotes. Trends Ecol. Evol. 35, 43–55. doi: 10.1016/j.tree.2019.08.008
Burton, J. N., Adey, A., Patwardhan, R. P., Qiu, R., Kitzman, J. O., Shendure, J. (2013). Chromosome-scale scaffolding of de novo genome assemblies based on chromatin interactions. Nat. Biotechnol. 31, 1119–1125. doi: 10.1038/nbt.2727
Cantarel, B. L., Korf, I., Robb, S. M. C., Parra, G., Ross, E., Moore, B., et al. (2008). MAKER: An easy-to-use annotation pipeline designed for emerging model organism genomes. Genome Res. 18, 188–196. doi: 10.1101/gr.6743907
Chen, R., Huangfu, L., Lu, Y., Fang, H., Xu, Y., Li, P., et al. (2021). Adaptive innovation of green plants by horizontal gene transfer. Biotechnol. Adv. 46, 107671. doi: 10.1016/j.biotechadv.2020.107671
Davis, C. C., Wurdack, K. J. (2004). Host-to-parasite gene transfer in flowering plants: phylogenetic evidence from Malpighiales. Science 305, 676–678. doi: 10.1126/science.1100671
Day, D. S., Luquette, L. J., Park, P. J., Kharchenko, P. V. (2010). Estimating enrichment of repetitive elements from high-throughput sequence data. Genome Biol. 11, R69. doi: 10.1186/gb-2010-11-6-r69
Doyle, J. J., Doyle, J. L. (1987). A rapid DNA isolation procedure for small quantities of fresh leaf tissue. Phytl Bull. 19, 11–15.
Duan, N., Bai, Y., Sun, H., Wang, N., Ma, Y., Li, M., et al. (2017). Genome re-sequencing reveals the history of apple and supports a two-stage model for fruit enlargement. Nat. Commun. 8, 249. doi: 10.1038/s41467-017-00336-7
Dunning, L. T., Olofsson, J. K., Parisod, C., Choudhury, R. R., Moreno-Villena, J. J., Yang, Y., et al. (2019). Lateral transfers of large DNA fragments spread functional genes among grasses. Proc. Natl. Acad. Sci. U.S.A 116, 4416–4425. doi: 10.1073/pnas.1810031116
Durand, N. C., Durand, N. C., Shamim, M. S., Machol, I., Rao, S. S., Huntley, M. H., et al. (2016). Juicer provides a one-click system for analyzing loop-resolution Hi-c experiments. Cell Syst. 3, 95–98. doi: 10.1038/nbt.2727
Fahrenkrog, A. M., Neves, L. G., Resende, M. F. R., Jr., Vazquez, A. I., Campos, G., Dervinis, C., et al. (2017). Genome-wide association study reveals putative regulators of bioenergy traits in Populus deltoides. New. Phytol. 213, 799–811. doi: 10.1111/nph.14154
Funk, W. C., Mullins, T. D., Haig, S. M. (2007). Conservation genetics of snowy plovers (Charadrius alexandrinus) in the western hemisphere: population genetic structure and delineation of subspecies. Conserv. Genet. 8, 1287–1309. doi: 10.1007/s10592-006-9278-7
Gladyshev., E. A., Meselson, M., Arkhipova, I. R. (2008). Massive horizontal gene transfer in bdelloid rotifers. Science 320, 1210–1213. doi: 10.1126/science.1156407
Griffith, F. (1928). The significance of pneumo-coccal types. J. Hygiene 27, 113–159. doi: 10.1017/S0022172400031879
Griffiths-Jones, S., Moxon, S., Marshall, M., Khanna, A., Eddy, S. R., Bateman, A. (2005). Rfam: annotating non-coding RNAs in complete genomes. Nucleic Acids Res. 33, D121–D124. doi: 10.1093/nar/gki081
Haig, S. M., Beever, E. A., Chambers, S. M., Draheim, H. M., Dugger, B. D., Dunham, S., et al. (2006). Taxonomic considerations in listing subspecies under the US endangered species act. Conserv. Biol. 20, 1584–1594. doi: 10.1111/j.1523-1739.2006.00530.x
Hoban, S., Kelley, J. L., Lotterhos, K. E., Antolin, M. F., Bradburd, G., Lowry., D. B., et al. (2016). Finding the genomic basis of local adaptation: pitfalls, practical solutions, and future directions. Am. Nat. 188, 379–397. doi: 10.1086/688018
Huang, J. (2013). Horizontal gene transfer in eukaryotes: The weak-link model. BioEssays 35, 868–875. doi: 10.1002/bies.201300007
Hufford, M. B., Xu, X., van Heerwaarden, V., Pyhäjärvi., T., Chia, J. M., Cartwright, R. A., et al. (2012). Comparative population genomics of maize domestication and improvement. Nat. Genet. 44, 808–811. doi: 10.1038/ng.2309
Husnik, F., McCutcheon, J. P. (2018). Functional horizontal gene transfer from bacteria to eukaryotes. Nat. Rev. Microbiol. 16, 67–79. doi: 10.1038/nrmicro.2017.137
Jiao, F., Luo, R., Dai, X., Liu, H., Yu, G., Han, S., et al. (2020). Chromosome-level reference genome and population genomic analysis provide insights into the evolution and improvement of domesticated mulberry (Morus alba). Mol. Plant 13, 1001–1012. doi: 10.1016/j.molp.2020.05.005
John, K. (2010). Chapter 5: Subspecies are for convenience (Las subespecies son por conveniencia). Ornithol. Monogr. 67, 54–61. doi: 10.1525/om.2010.67.1.54
Kawuki, R. S., Ferguson, M., Labuschagne, M., Herselman, L., Kim, D. J. (2009). Identification, characterisation and application of single nucleotide polymorphisms for diversity assessment in cassava (Manihot esculenta crantz). Mol. Breed. 23, 669–684. doi: 10.1007/s11032-009-9264-0
Keilwagen, J., Wenk, M., Erickson, J. L., Schattat, M. H., Grau, J., Hartung, F. (2016). Using intron position conservation for homology-based gene prediction. Nucleic Acids Res. 44, e89. doi: 10.1093/nar/gkw092
Kopac, S., Wang, Z., Wiedenbeck, J., Sherry, J., Wu, M., Cohan, F. M. (2014). Genomic heterogeneity and ecological speciation within one subspecies of Bacillus subtilis. Appl. Environ. Microbiol. 80, 4842–4853. doi: 10.1128/AEM.00576-14
Koutsovoulos, G., Kumar, S., Laetsch, D. R., Jennifer, D., Conlon, C., Maroon, H., et al. (2016). No evidence for extensive horizontal gene transfer in the genome of the tardigrade Hypsibius dujardini. Proc. Natl. Acad. Sci. U.S.A. 113, 5053–5058. doi: 10.1073/pnas.1600338113
Krzywinski, M., Schein, J., Birol, I., Connors, J., Gascoyne, R., Horsman, D., et al. (2009). Circos: an information aesthetic for comparative genomics. Genome Res. 19, 1639–1645. doi: 10.1101/gr.092759.109
Levy., R., Borenstein, E. (2012). Reverse ecology: from systems to environments and back. Adv. Exp. Med. Biol. 751, 329–345. doi: 10.1007/978-1-4614-3567-9_15
Leyser, O. (2001). Auxin signalling: the beginning, the middle and the end. Curr. Opin. Plant Biol. 4, 382–386. doi: 10.1016/S1369-5266(00)00189-8
Li, Y. F., Costello, J. C., Holloway, A. K., d anHahn, M. W. (2008). “Reverse ecology” and the power of population genomics. Evolution 62, 2984–2994. doi: 10.1111/j.1558-5646.2008.00486.x
Li, M., Zhao, J., Tang, N., Sun, H., Huang, J. (2018). Horizontal gene transfer from bacteria and plants to the arbuscular mycorrhizal fungus Rhizophagus irregularis. Front. Plant Sci. 9. doi: 10.3389/fpls.2018.00701
Lowe, T. M., Eddy, S. R. (1997). tRNAscan-SE. a program for improved detection of transfer RNA genes in genomic sequence. Nucleic Acids Res. 25, 955–964. doi: 10.1093/nar/25.5.955
Lu, K., Wei, L., Li, X., Wang, Y., Wu, J., Liu, M., et al. (2019). Whole-genome resequencing reveals brassica napus origin and genetic loci involved in its improvement. Nat. Commun. 10, 1154. doi: 10.1038/s41467-019-09134-9
Majoros, W. H., Pertea, M., Salzberg, S. L. (2004). TigrScan and GlimmerHMM: two open source ab initio eukaryotic gene-finders. Bioinformatics 20, 2878–2879. doi: 10.1093/bioinformatics/bth315
Mao, X., Cai, T., Olyarchuk, J. G., Wei, L. J. B. (2005). Automated genome annotation and pathway identifification using the KEGG orthology (KO) as a controlled vocabulary. Bioinformatics 21, 3787–3793. doi: 10.1093/bioinformatics/bti430
Mapleson, D., Accinelli, G. G., Kettleborough, G., Wright, J., Clavijo, B. J. (2017). KAT: a K-mer analysis toolkit to quality control NGS datasets and genome assemblies. Bioinformatics 33, 574–576. doi: 10.1093/bioinformatics/btw663
Marin, S., Gibert, A., Archambeau, J., Bonhomme, V., Lascoste, M., Pujol, B. (2020). Potential adaptive divergence between subspecies and populations of snapdragon plants inferred from qst–fst comparisons. Mol. Ecol. 29, 3010–3021. doi: 10.1111/mec.15546
Molina, J., Hazzouri, K. M., Nickrent, D. L., Geisler, M., Meyer, R. S., Pentony, M. M., et al. (2014). Possible loss of the chloroplast genome in the parasitic flowering plant Rafflesia lagascae (Rafflesiaceae). Mol. Biol. Evol. 31, 793–803. doi: 10.1093/molbev/msu051
Nawrocki, E. P., Eddy, S. R. (2013). Infernal 1.1: 100-fold faster RNA homology searches. Bioinformatics 29, 2933–2935. doi: 10.1093/bioinformatics/btt509
Ochman, H., Lawrence, J. G., Groisman, E. A. (2000). Lateral gene transfer and the nature of bacterial innovation. Nature 405, 299–304. doi: 10.1038/35012500
Park, E., Lee, W. (2013). In vitro symbiotic germination of myco-heterotrophic Gastrodia elata by Mycena species. Plant Biotech. Rep. 7, 185–191. doi: 10.1007/s11816-012-0248-x
Pascal, L., Lasek-Nesselquist, E., Gogarten, J. P. (2012). The impact of HGT on phylogenomic reconstruction methods. Brief. Bioinf. 15, 79–90. doi: 10.1093/bib/bbs050
Phillimore, A. B., Owens, I. P. F. (2006). Are subspecies useful in evolutionary and conservation biology? Proc. R. Soc B. 273, 1049–1053. doi: 10.1098/rspb.2005.3425
Price, A. L., Jones, N. C., Pevzner, P. A. (2005). De novo identification of repeat families in large genomes. Bioinformatics 21, i351–i358. doi: 10.1093/bioinformatics/bti1018
Quispe-Huamanquispe, D. G., Gheysen, G., Kreuze, J. F. (2017). Horizontal gene transfer contributes to plant evolution: the case of agrobacterium T-DNAs. Front. Plant Sci. 8. doi: 10.3389/fpls.2017.02015
Ravinet, M., Faria, R., Butlin, R. K., Galindo, J., Bierne, N., Rafajlovic, M., et al. (2017). Interpreting the genomic landscape of speciation: A road map for finding barriers to gene flow. J. Evol. Biol. 30, 1450–1477. doi: 10.1111/jeb.1304
Richards, T. A., Monier, A. (2016). A tale of two tardigrades. Proc. Natl. Acad. Sci. U.S.A. 113, 4892–4894. doi: 10.1073/pnas.1603862113
Richardson, A. O., Palmer, J. D. (2007). Horizontal gene transfer in plants. J. Exp. Bot. 58, 1–9. doi: 10.1093/jxb/erl148
Richards, T. A., Soanes, D. M., Foster, P. G., Leonard, G., Thornton, C. R., Talbot, N. J. (2009). Phylogenomics analysis demonstrates a pattern of rare and ancient horizontal gene transfer between planta and fungi. Plant Cell 21, 1897–1911. doi: 10.1038/s42003-018-0014-x
Rothschild, W., Jordan, K. A. (1895). Revision of the papilios of the eastern hemisphere, exclusive of Africa. Novitat. Zool. 2, 167–463.
Saitou, N., Nei, M. (1987). The neighbor-joining method: a new method for reconstructing phylogenetic trees. Mol. Biol. Evol. 4, 406–425. doi: 10.1093/oxfordjournals.molbev.a040454
Schlötterer, C., Kauer, M., Dieringer, D. (2004). Allele excess at neutrally evolving microsatellites and the implications for tests of neutrality. Proc. R. Soc B. 271, 869–874. doi: 10.1098/rspb.2003.2662
Schmidt, J. M., de Manuel, M., Marques-Bonet, T., Castellano, S., Andrés, A. (2019). The impact of genetic adaptation on chimpanzee subspecies differentiation. PloS Genet. 15, e1008485. doi: 10.1371/journal.pgen.1008485
Schroder, J. (1999). “The chalcone/stilbene synthase-type family of condensing enzymes,” in Comprehensive natural products chemistry, vol. 1 . Ed. Sankawa, U. (Amsterdam: Elsevier), 749–771.
Shinozuka, H., Shinozuka, M., de Vries, E. M., Sawbridge, T. I., Spangenberg, G. C., Cocks, B. G. (2020). Fungus-originated genes in the genomes of cereal and pasture grasses acquired through ancient lateral transfer. Sci. Rep. 10, 19883. doi: 10.1038/s41598-020-76478-4
Sieber, K. B., Bromley, R. E., Hotopp, J. C. D. (2017). Lateral gene transfer between prokaryotes and eukaryotes. Exp. Cell Res. 358, 421–426. doi: 10.1016/j.yexcr.2017.02.009
Slot, J. C., Rokas, A. (2011). Horizontal transfer of a large and highly toxic secondary metabolic gene cluster between fungi. Curr. Biol. 21, 134–139. doi: 10.1016/j.cub.2010.12.020
Smit, A. F. A., Hubley, R. (2017). RepeatModeler open-1.0. Available at: http://www.repeatmasker.org.
Smit, A. F. A., Hubley, R., Green, P. (2019). RepeatMasker open-4.0. Available at: http://www.repeatmasker.org.
Soucy, S. M., Huang, J., Gogarten, J. P. (2015). Horizontal gene transfer: building the web of life. Nat. Genet. 16, 472–481. doi: 10.1038/nrg3962
Stanke, M., Morgenstern, B. (2005). AUGUSTUS: a web server for gene prediction in eukaryotes that allows user-defined constraints. Nucleic Acids Res. 33 (Web Server issue), W465–W467. doi: 10.1093/nar/gki458
Tajima, F. (1989). Statistical method for testing the neutral mutation hypothesis by DNA polymorphism. Genetics 123, 585–595. doi: 10.1093/genetics/123.3.585
Tatum, E. L., Lederberg, J. (1947). Gene recombination in the bacterium Escherichia coli. J. Bacteriol. 53, 673–684. doi: 10.1128/jb.53.6.673-684.1947
This, P., Martinez-Zapater, J., Peros, J. P., Lacombe, T. (2011). “Natural variation in vitis,” in Genetics, genomics, and breeding of grapes. Eds. Francoise, A., Blondon, A., Martinez-Zapater, J. (CRC Press).
Trapnell, C., Williams, B. A., Pertea, G., Mortazavi, A., Kwan, G., van Baren, M. J., et al. (2010). Transcript assembly and quantification by RNA-seq reveals unannotated transcripts and isoform switching during cell differentiation. Nat. Biotechnol. 28, 511–515. doi: 10.1038/nbt.1621
Ungerer, M. C., Johnson, L. C., Herman, M. A. (2008). Ecological genomics: understanding gene and genome function in the natural environment. Heredity (Edinb). 100, 178–183. doi: 10.1038/sj.hdy.6800992
Vilella, A. J., Severin, J., Uretavidal, A., Heng, L., Durbin, R., Birney, E. (2009). Ensembl compara GeneTrees: Complete, duplication-aware phylogenetic trees in vertebrates. Genome Res. 19, 327–335. doi: 10.1101/gr.073585.107
Walker, B. J., Abeel, T., Shea, T., Priest, M., Earl, A. M. (2014). Pilon: an integrated tool for comprehensive microbial variant detection and genome assembly improvement. PloS One 9, e112963. doi: 10.1371/journal.pone.0112963
Wang, Y., Paterson, A. H. (2021). Loquat (Eriobotrya japonica (Thunb.) lindl) population genomics suggests a two-staged domestication and identifies genes showing convergence/parallel selective sweeps with apple or peach. Plant J. 106, 942–952. doi: 10.1111/tpj.15209
Wang, H., Sun, S., Ge, W., Zhao, L., Hou, B., Wang, K., et al. (2020). Horizontal gene transfer of Fhb7 from fungus underlies fusarium head blight resistance in wheat. Science 368, eaba5435. doi: 10.1126/science.aba5435
Wang, S. B., Yu, C. J. (1999). The determination and significance of accumulated temperature of Gastrodia elata BL. period biology. J. Wuhan Bot. Res. 17, 285–288.
Webb, A. A. R. (2003). The physiology of circadian rhythms in plants. New Phytol. 160, 281–303. doi: 10.1046/j.1469-8137.2003.00895.x
Weir, B. S., Cockerham, C. C. (1984). Estimating f-statistics for the analysis of population structure. Evolution 38, 1358–1370. doi: 10.1111/j.1558-5646.1984.tb05657.x
Wickell, D. A., Li, F. W. (2020). On the evolutionary significance of horizontal gene transfers in plants. New Phytol. 225, 113–117. doi: 10.1111/nph.16022
Winker, K. (2010). Subspecies represent geographically partitioned variation, a gold mine of evolutionary biology, and a challenge for conservation. Ornithol. Monogr. 67, 6–23. doi: 10.1525/om.2010.67.1.6
Xiao, C. L., Chen, Y., Xie, S. Q., Chen, K. N., Wang., Y., Han, Y., et al. (2017). MECAT: Fast mapping, error correction, and de novo assembly for single-molecule sequencing reads. Nat. Meth. 14, 1072–1074. doi: 10.1038/nmeth.4432
Xi, Z., Wang, Y., Bradley, R. K., Sugumaran, M., Marx, C. J., Rest, J. S., et al. (2013). Massive mitochondrial gene transfer in a parasitic flowering plant clade. PloS Genet. 9, e1003265. doi: 10.1371/journal.pgen.1003265
Xu, X. (1992). “Practical Chinese material medica for health care,” in The English-Chinese encyclopedia of practical traditional Chinese medicine. Ed. Xu, X. (Beijing: Beijing Higher Education Press).
Xu, Y., Lei, Y., Su, Z., Zhao, M., Zhang, J., Shen, G., et al. (2021). A chromosome-scale Gastrodia elata genome and large-scale comparative genomic analysis indicate convergent evolution by gene loss in mycoheterotrophic and parasitic plants. Plant J. 108, 1609–1623. doi: 10.1111/tpj.15528
Xu, Z., Wang, H. (2007). Ltr_finder: an efficient tool for the prediction of full-length ltr retrotransposons. Nucleic Acids Res. 35, W265–W268. doi: 10.1093/nar/gkm286
Yang, J., Lee, S. H., Goddard, M. E., Visscher, P. M. (2011). GCTA: A tool for genome-wide complex trait analysis. Am. J. Hum. Genet. 88, 76–82. doi: 10.1016/j.ajhg.2010.11.011
Yang, Z., Wafula, E. K., Kim, G., Shahid, S., McNeal, J. R., Ralph, P. E., et al. (2019). Convergent horizontal gene transfer and cross-talk of mobile nucleic acids in parasitic plants. Nat. Plants 5, 991–1001. doi: 10.1038/s41477-019-0458-0
Yang, Z., Zhang, Y., Wafula, E. K., Honaas, L. A., Ralph, P. E., Jones, S., et al. (2016). Horizontal gene transfer is more frequent with increased heterotrophy and contributes to parasite adaptation. Proc. Natl. Acad. Sci. U.S.A. 113 (45), E7010–E7019. doi: 10.1073/pnas.1608765113
Yang, Y., Zhang, K., Xiao, Y., Zhang, L., Huang, Y., Li, X., et al. (2022). Genome assembly and population resequencing reveal the geographical divergence of shanmei (Rubus corchorifolius). Genom. Proteom. Bioinf. 25. doi: 10.1016/j.gpb.2022.05.003. S1672-0229(22)00067-5.
Yoshida, S., Maruyama, S., Nozaki, H., Shirasu, K. (2010). Horizontal gene transfer by the parasitic plant Striga hermonthica. Science 328, 1128. doi: 10.1126/science.1187145
Young, M. D., Wakefifield, M. J., Smyth, G. K., Oshlack, A. J. G. B. (2010). Gene ontology analysis for RNA-seq: accounting for selection bias. Genome Biol. 11, R14–R14. doi: 10.1186/gb-2010-11-2-r14
Yuan, Y., Jin, X., Liu, J., Zhao, X., Zhou, J., Wang, X., et al. (2018). The Gastrodia elata genome provides insights into plant adaptation to heterotrophy. Nat. Commun. 9, 1615. doi: 10.1038/s41467-018-03423-5
Zhang, D., Qi, J., Yue, J., Huang, J., Sun, T., Li, S., et al. (2014). Root parasitic plant orobanche aegyptiaca and shoot parasitic plant Cuscuta australis obtained brassicaceae-specific strictosidine synthase-like genes by horizontal gene transfer. BMC Plant Biol. 14, 19. doi: 10.1186/1471-2229-14-19
Zhan, H. D., Zhou, H. Y., Sui, Y. P., Du, X. L., Wang, W., Dai, L., et al. (2016). The rhizome of Gastrodia elata blume – an ethnopharmacological review. J. Ethnopharmacol. 189, 361–385. doi: 10.1016/j.jep.2016.06.057
Keywords: adaptation, Gastrodia elata, horizontal gene transfers, population genomics, selection effect
Citation: Wang Y and Shahid MQ (2023) Genome sequencing and resequencing identified three horizontal gene transfers and uncovered the genetic mechanism on the intraspecies adaptive evolution of Gastrodia elata Blume. Front. Plant Sci. 13:1035157. doi: 10.3389/fpls.2022.1035157
Received: 02 September 2022; Accepted: 13 December 2022;
Published: 04 January 2023.
Edited by:
Mi-Jeong Yoo, Clarkson University, United StatesReviewed by:
Allah Bakhsh, University of the Punjab, PakistanCopyright © 2023 Wang and Shahid. This is an open-access article distributed under the terms of the Creative Commons Attribution License (CC BY). The use, distribution or reproduction in other forums is permitted, provided the original author(s) and the copyright owner(s) are credited and that the original publication in this journal is cited, in accordance with accepted academic practice. No use, distribution or reproduction is permitted which does not comply with these terms.
*Correspondence: Yunsheng Wang, d3lzMzI2OUAxMjYuY29t; Muhammad Qasim Shahid, c2hhaGlkbXFAZ21haWwuY29t
Disclaimer: All claims expressed in this article are solely those of the authors and do not necessarily represent those of their affiliated organizations, or those of the publisher, the editors and the reviewers. Any product that may be evaluated in this article or claim that may be made by its manufacturer is not guaranteed or endorsed by the publisher.
Research integrity at Frontiers
Learn more about the work of our research integrity team to safeguard the quality of each article we publish.