 Tianli Wu
 Kaidong Liu
 Min Chen2
 Yun Zhong
- 1Life Science and Technology School, Lingnan Normal University, Zhanjiang, China
- 2Institute of Fruit Tree Research, Guangdong Academy of Agricultural Sciences, Guangzhou, China
- 3Key Laboratory of South Subtropical Fruit Biology and Genetic Resource Utilization (MOA), Guangzhou, China
- 4Key Laboratory of Tropical and Subtropical of Fruit Tree Research, Science and Technology Department of Guangdong Province, Guangzhou, China
The gibberellic acid (GA)-stimulated Arabidopsis (GASA) gene family is highly specific to plants and plays crucial roles in plant growth and development. CcGASA4 is a member of the GASA gene family in citrus plants; however, the current understanding of its function in citrus is limited. We used CcGASA4-overexpression transgenic citrus (OEGA) and control (CON) plants to study the role of CcGASA4 in Shatian pomelo. The RNA sequencing (RNA-seq) analysis showed that 3,522 genes, including 1,578 upregulated and 1,944 downregulated genes, were significantly differentially expressed in the CON versus OEGA groups. The Gene Ontology enrichment analysis showed that 178 of the differentially-expressed genes (DEGs) were associated with flowers. A Kyoto Encyclopedia of Genes and Genomes (KEGG) enrichment analysis showed that the DEGs were enriched in 134 pathways, including “plant–pathogen interaction”, “MAPK signaling pathway-plant”, “phenylpropane biosynthesis”, “plant hormone signal transduction”, “phenylalanine, tyrosine and tryptophan biosynthesis”, and “flavonoid and flavonol biosynthesis”. The most significantly-enriched pathway was “plant–pathogen interaction”, in which 203 DEGs were enriched (126 DEGs were upregulated and 78 were downregulated). The metabolome analysis showed that 644 metabolites were detected in the OEGA and CON samples, including 294 differentially-accumulated metabolites (DAMs; 83 upregulated versus 211 downregulated in OEGA compared to CON). The metabolic pathway analysis showed that these DAMs were mainly involved in the metabolic pathways of secondary metabolites, such as phenylpropanoids, phenylalanine, flavone, and flavonol biosynthesis. Thirteen flavonoids and isoflavones were identified as DAMs in OEGA and CON. We also discovered 25 OEGA-specific accumulated metabolites and found 10 that were associated with disease resistance. CcGASA4 may therefore play a functional role in activating the expression of MAPK signaling transduction pathway and disease resistance genes, inhibiting the expression of auxin- and ethylene-related genes, and activating or inhibiting the expression of brassinosteroid biosynthesis- and abscisic acid-related genes. CcGASA4 may also play a role in regulating the composition and abundance of flavonoids, isoflavones, amino acids, purines, and phenolic compounds. This study provides new insights into the molecular mechanisms of action of CcGASA4 in citrus plants.
Introduction
Gibberellic acid-stimulated Arabidopsis (GASA) proteins comprise a class of cysteine-rich small molecule polypeptides that are widely distributed and contain a large number of coding genes, most of which are regulated by gibberellins (Wigoda et al., 2006; Zhang and Wang, 2008). GASA family members were first identified in tomato (Shi et al., 1992), and numerous GASA homologs have been identified in various plant species, such as Arabidopsis (Chen et al., 2007), rice (Muhammad et al., 2019), and Fragaria ananassa (de la Fuente et al., 2006). Typical GASA proteins have low molecular weights and are composed of 80–270 amino acids. GASA usually has three different domains: a putative N-terminal signaling peptide of 18–29 amino acids, highly-variable region (7–31 amino acids) with a large difference in both amino acid composition and sequence length, and conserved C-terminal GASA domain of approximately 60 amino acids (including 12 cysteine residues) (Aubert et al., 1998). A few GASA proteins contain a proline-rich protein (PRP) domain in addition to a GASA domain, such as PRGL of Gerbera hybrida (Peng et al., 2010) and AtGASA14 of Arabidopsis (Sun et al., 2013). The GASA domain is the core domain of GASA proteins and is present in all members of the protein family. Deletions of the GASA domain or mutations in the conserved cysteine residues in the domain can cause the loss of protein function. These conserved cysteine residues are therefore necessary for maintaining the structure and function of GASA proteins (Rubinovich and Weiss, 2010; Sun et al., 2013). Cysteine pairs are separated by several amino acids to form catalytic disulfide bonds (redox-active cysteines) (Buchanan and Balmer, 2005). Therefore, the 12 cysteine residues in the GASA domain may contribute to the biochemical stability of the protein structure. Studies have shown that disulfide bonds are also key to the interactions between GASA proteins and other proteins. For example, the Snakin-2 protein of French bean and PRPs form a protein complex (approximately 42 kDa; FBCBP) via disulfide bond oxidation, which is further involved in plant defense processes (Bindschedler et al., 2006).
The GASA family of proteins is involved in a diverse range of functions, including plant development, hormonal crosstalk, and defense. GASA genes are thought to be involved in various developmental processes in plants, such as lateral root initiation and development, leaf expansion, flower induction, corolla and carpel cell expansion, the cessation of petal cell elongation, the reduction of silique elongation, fruit cell size regulation, cell division, seed development, and germination (Aubert et al., 1998; Kotilainen et al., 1999; Rubinovich and Weiss, 2010; Trapalis et al., 2017). Most GASA genes are also involved in hormone signaling pathways, such as the gibberellin, abscisic acid (ABA), and auxin pathways (Furukawa et al., 2006; Li et al., 2011). For example, rice GSR1, a GA-induced and brassinosteroid (BR)-repressed gene, mediates the interaction between the BR and GA pathways by directly interacting with the BR biosynthetic enzyme DIM/DWF1 (Wang et al., 2009). In Arabidopsis, GASA6 is upregulated by growth hormones (auxin, BR, cytokinin, and GA) and downregulated by stress hormones (ABA, JA, and salicylic acid [SA]), thus playing a role in hormonal crosstalk (Qu et al., 2016). The Beechnut gene FsGASA4 modulates SA responses by activating the genes involved in SA biosynthesis and action (Alonso-Ramírez et al., 2009). AtGASA5 was induced by ABA and repressed by GA (Zhang and Wang, 2008). The SA signaling pathway appeared to be blocked in AtGASA5 gain-of-function plants, the phenotype of which can be partially rescued by applying SA externally (Zhang and Wang, 2011).
The biochemical activity and defense functions of GASA proteins have also been partially studied. For example, an expression analysis of GIP2, GIP4, and GIP5 indicated that these genes are induced by H2O2 and may be involved in redox regulation (Wigoda et al., 2006). The expression of the potato homologs Snakin‐1 and Snakin‐2 responded to wounding and pathogenic infections (Segura et al., 1999; Berrocal-Lobo et al., 2002). The Arabidopsis gene GASA14 is involved in abiotic stress (ABA and salt) tolerance by regulating the accumulation of reactive oxygen species (ROS) (Sun et al., 2013). The overexpression of AtGASA4 in Arabidopsis has been found to inhibit the accumulation of ROS, and transgenic seeds are partially resistant to treatment with the NO donor sodium nitroprusside (Rubinovich and Weiss, 2010). The overexpression of AtGASA4, which is also involved in light signaling, improves the heat tolerance of transgenic Arabidopsis (Chen et al., 2007; Ko et al., 2007). In contrast, AtGASA5 negatively regulates heat tolerance and the GA response (Zhang et al., 2009; Rubinovich et al., 2014).
Our previous studies found that the citrus gene CcGASA4 is induced by the Citrus tristeza virus (CTV) (Wu et al., 2020). Similar to all of the other GASA proteins identified thus far, the CcGASA4 protein contains a well-conserved domain carrying putative redox-active cysteine residues. Therefore, we speculate that the CcGASA4 protein may play an essential role in the regulation of growth, development, and disease resistance in citrus plants. In this study, we obtained CcGASA4-overexpressing transgenic plants through genetic transformation and investigated the function of CcGASA4 in citrus plants. To the best of our knowledge, this is the first study to analyze the function of CcGASA4 in Shatian pomelo through metabolomic and transcriptomic analyses. Our findings provide insights into CcGASA4-mediated metabolic regulation and may contribute to accelerating the breeding of Citrus species.
Materials and methods
Creation of the CcGASA4-overexpression vector
The Citrus clementina cultivar was provided by the Institute of Fruit Tree Research from the Guangdong Academy of Agricultural Sciences and was used for RNA isolation and CcGASA4 gene amplification. The CcGASA4 coding sequence was cloned as described in a previous study (Wu et al., 2020). To construct the overexpression vector, entry clone fragments were inserted into the destination pFGC5941 vector using the AscI and SmaI restriction sites (Figure S1) under the control of a 35S promoter through a homologous recombination reaction using the Trelief™ SoSoo cloning kit (Tsingken, China). The recombination reaction solution was transformed into DH5α cells, and resistant monoclonal colonies were detected by PCR using the primers 5941F2624 and 5941R4286. The CcGASA4-pFGC5941 plasmid was extracted from the selected positive incubation solution using the HiPure Plasmid EF Mini Kit (Magen, China) and confirmed by sequencing. The constructs were transformed into Agrobacterium EHA105 cells using heat shock. Transformation was confirmed by PCR with primers 35SF/GASA4R, and the successful transformant was named CcGASA4-pFGC5941-105. All the primers used in this study are listed in Supplementary Table S1.
Generation of transgenic citrus lines
The CcGASA4-overexpression vector was transformed into Shatian pomelo using the Agrobacterium-mediated hypocotyl genetic transformation method (Wu et al., 2015). The expression level of the CcGASA4 gene in CcGASA4-overexpression transgenic citrus (OEGA) was detected using qRT-PCR. Total RNA was extracted from mature 3-year-old leaves of healthy OEGA plants using a polysaccharide and polyphenol plant total RNA rapid extraction kit (Bioteke, China), following the manufacturer’s instructions. The quality and quantity of the total RNA were analyzed using a NanoDrop 2000C (Thermo Fisher Scientific, MA, USA). qRT-PCR experiments were performed according to the method described by Wu et al. (2021). The data were statistically analyzed using an analysis of variance(ANOVA). Duncan’s LSD multiple range test (P ≤ 0.05) was used to determine significant changes. The relative expression levels of the genes were determined using Origin 2019b.
Transcriptome analysis and qRT-PCR validation of differentially-expressed genes in RNA-seq
For the transcriptome profiling and analysis, RNA isolation and purification, cDNA library construction, and sequencing were performed by the commercial biotech company Metware Biotechnology Co., Ltd. (https://www.metware.cn/; Wuhan, China). In brief, total RNA was isolated from the OEGA leaves and used to prepare RNA-seq libraries. The libraries were sequenced using the Illumina HiSeq platform. Clean reads were obtained by passing the raw sequencing data through quality control (QC) procedures. The reads were then mapped to the pomelo (Citrus grandis) genome sequence (http://citrus.hzau.edu.cn/orange/) (Xu et al., 2013) using the HISAT2 software (Kim et al., 2015). To obtain a comprehensive view of the gene expression profile associated with CcGASA4, we used DESeq2 to identify the DEGs). Reads per kilobase per million mapped reads (FPKM) values were used as indicators for gene and transcript level quantification (Wang et al., 2015). The DEGs were determined using the following filtering parameters: false discovery rate (FDR) < 0.05 and |log2foldchange| ≥ 1. All of the DEGs were analyzed using Gene Ontology (GO) (Ashburner et al., 2000) and Kyoto Encyclopedia of Genes and Genomes (KEGG) enrichment analyses with the KOBAS software (Kanehisa et al., 2007). To confirm the reliability of the RNA-seq data, the important genes of the “phenylalanine, tyrosine and tryptophan biosynthesis”, “plant–pathogen interaction”, and “flavone and flavonol biosynthesis” pathways were screened from the RNA-seq annotation library. Seventeen genes were selected for a qRT-PCR analysis. qRT-PCR was performed as previously described by Wu et al. (2021).
Widely-targeted metabolic analysis of the metabolites in the citrus samples
Metabolome profiling was performed by Metware Biotechnology Co., Ltd. The extraction and separation of the metabolites from the OEGA and control (CON) leaves were performed as previously reported (Wang et al., 2020). In brief, 100 mg of powder per sample were extracted overnight at 4°C with 1.2 mL of 70% aqueous methanol. The samples were then centrifuged at 12,000 g for 10 min and filtered through a 0.22-μm micropore filter membrane to obtain leaf extracts. The extracts were analyzed using a UPLC-ESI-MS/MS system (UPLC, SHIMADZU Nexera X2, www.shimadzu.com.cn/; MS, Applied Biosystems 4500 QTRAP, www.appliedbiosystems.com.cn/). Qualitative and quantitative analyses of the metabolites were performed using electrospray ionization (ESI)-quadrupole ion trap (QTRAP)-tandem mass spectrometry (MS/MS) based on the self-built database Metware in-house MS2 spectral tag library (Metware database, MWDB).
The analytical conditions were as follows. A UPLC column (Agilent SB-C18 [1.8 µm, 2.1 mm*100 mm]) was used. The mobile phase consisted of solvent A, which comprised pure water with 0.1% formic acid, and solvent B, which comprised acetonitrile with 0.1% formic acid. Sample measurements were performed using a gradient program that employed the starting conditions of 95% A and 5% B. Within 9 min, a linear gradient of 5% A and 95% B was programmed, and compositions of 5% A and 95% B were maintained for 1 min. Compositions of 95% A and 5% B were then adjusted within 1.1 min and maintained for 2.9 min. The column oven temperature was set to 40°C. The injection volume was 4 μL. The effluent was alternatively connected to an ESI-QTRAP-MS system for scanning detection.
LIT and triple quadrupole (QQQ) scans were acquired on a triple QTRAP mass spectrometer (AB4500 QTRAP UPLC/MS/MS System) equipped with an ESI Turbo Ion-Spray interface, which operated in both positive and negative ion modes and was controlled by Analyst 1.6.3 software (AB Sciex). The ESI source operation parameters were as follows: ion source, turbo spray; source temperature, 550°C; ion spray voltage (IS), 5500 V (positive ion mode)/–4500 V (negative ion mode); ion source gas I, gas II, and curtain gas were set to 50, 60, and 25.0 psi, respectively; and collision gas, high. Instrument tuning and mass calibration were performed using 10 and 100 μmol/L polypropylene glycol solutions in the QQQ and LIT modes, respectively. QQQ scans were acquired as multiple reaction monitoring (MRM) experiments with a collision gas (nitrogen) set to the medium. Declustering potential (DP) and collision energy (CE) for the individual MRM transitions were performed with further DP and CE optimizations. A specific set of MRM transitions was monitored for each period according to the metabolites eluted within the period.
Statistical analysis
A principal component analysis (PCA) of the metabolites was performed using the statistical function prcomp in the software R (www.r-project.org). The metabolite content data were normalized using unit variance scaling. The accumulation mode of the metabolites among the different samples was subjected to a hierarchical cluster analysis (HCA), and heatmaps were drawn using the pheatmap package in R. The HCA results of the samples and metabolites were presented as heatmaps with dendrograms, whereas Pearson’s correlation coefficients (PCC) between the samples were calculated by the cor function in R and presented as heatmaps. An orthogonal partial least squares discriminant analysis (OPLS-DA), which combines orthogonal signal correction and a partial least squares discriminant analysis (PLS-DA), was used to screen the different variables. To identify the differentially-accumulating metabolites (DAMs), we first selected the metabolites with a foldchange (FC) ≥ 2 (upregulated) or FC ≤ 0.5 (downregulated) in the OEGA sample compared to the CON. We then screened the DAMs using a threshold variable importance in projection (VIP) value of ≥ 1 from the OPLS-DA model. The VIP values were extracted from the OPLS-DA results, which also contained score and permutation plots, and were generated using the R package MetaboAnalyst R. The data were log-transformed (log2) and mean-centered before the OPLS-DA. To assess the significance of the differences in the abundance of metabolites, a two-tailed Student’s t-test was used to compare individual lines with their relevant controls. The identified metabolites were annotated and mapped to metabolic pathways using the KEGG database (http://www.kegg.jp) (Kanehisa and Goto, 2000) to determine their associated pathways. A pathway enrichment analysis was performed on the web-based server Metabolite Sets Enrichment Analysis (MSEA; http://www.msea.ca), and their significance was determined using hypergeometric test P values. Pathways with Bonferroni-corrected P values < 0.05 were considered significantly enriched.
Results
CcGASA4 genetic transformation and generation of the CcGASA4-overexpression transgenic citrus lines
The CcGASA4 sequence was successfully cloned from Citrus clementina and placed under the control of a 35S promoter to obtain a CcGASA4-pFGC5941 overexpression vector (Figure S1B, C). Transformants were produced through the Agrobacterium-mediated genetic transformation of citrus (Figures 1A–E). The detection of the genetically-transformed plants by PCR showed that there were three transgenic-positive plants (Figure S1D). The expression analysis showed that the expression level of CcGASA4 in the OEGAs was higher than that in the CONs. Its relative expression level in OEGA3 was the highest, being approximately eight times higher than that in the CON plants (Figure 1F). Therefore, we selected three grafted OEGA3 lines as experimental materials for the transcriptome and metabolome analyses.
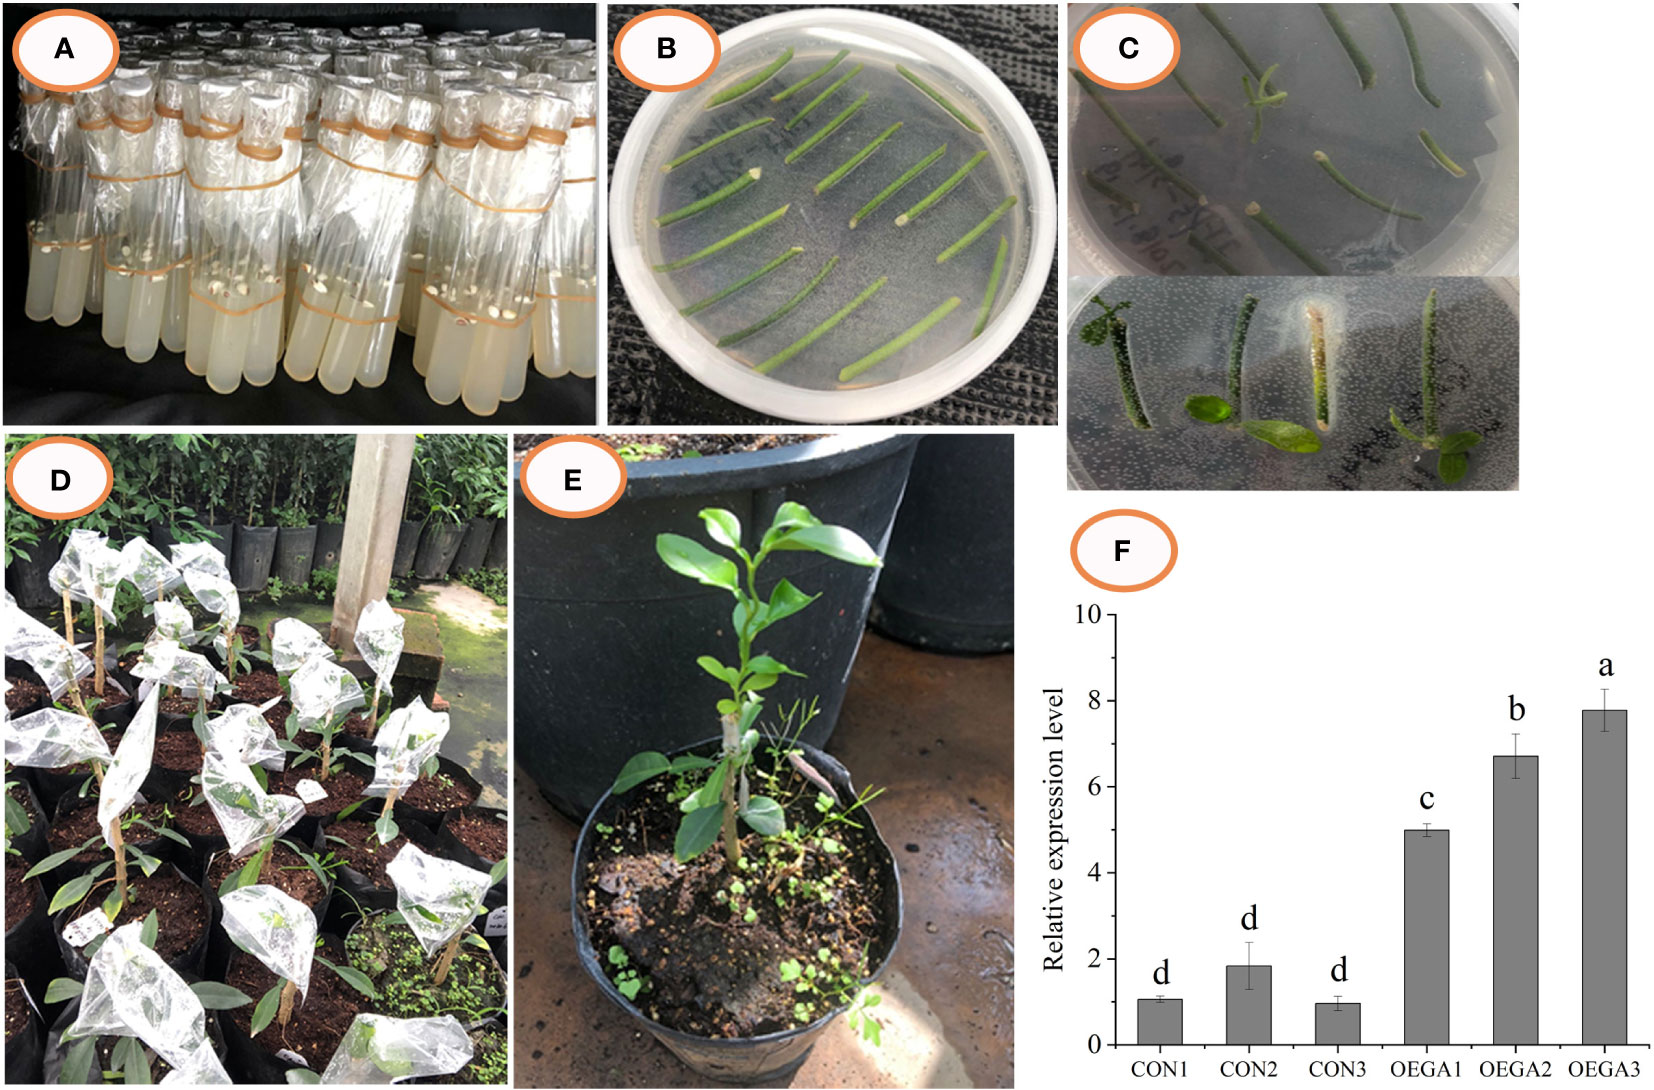
Figure 1 Transgenic citrus plants overexpressing CcGASA4 were obtained through genetic transformation. (A–E) Process of Agrobacterium-mediated CcGASA4 genetic transformation. (A) citrus seeds were sown on MS medium; (B) dark culture; (C) light culture; (D) grafted resistant buds on rootstocks; (E) surviving resistant buds. (F) qRT-PCR analysis of CcGASA4 expression in the OEGA lines. Data are presented as the mean ± standard error (SE) of three qRT-PCR experiments. Different lowercase letters (a–d) on the bars indicate statistically-significant differences (P < 0.05) based on Duncan’s LSD multiple range test.
Overview of the transcriptome analysis
To further understand the role of CcGASA4 in citrus Shatian pomelo, an RNA-seq analysis was performed. A total of 38.74 Gb of clean reads and approximately 6 Gb of clean data per sample were generated from six biological samples, including three OEGA and three CON samples. The average Q30 value of the raw reads was 94.52%, and 94.44% of the reads were mapped to the Citrus grandis genome sequences (Table S2). The RNA-seq results showed that 3,522 genes, including 1,578 upregulated and 1,944 downregulated genes, were significantly differentially expressed in the CON versus OEGA groups (Table S3). Based on the GO annotations, all of the DEGs were grouped into three major categories: molecular functions, cellular components, and biological processes. The enrichment analysis indicated that the DEGs were mainly enriched in the “response to drug”, “carbohydrate binding”, “oxidoreductase activity, acting on paired donors, with incorporation or reduction of molecular oxygen”, “defense response to bacterium”, “immune system process”, “response to abscisic acid”, “cell wall organization”, “regulation of response to stress”, “hormone metabolic process”, “response to wounding”, and “pollen tube” GO terms (Figure 2A, Table S4). The GO enrichment analysis further showed 178 DEGs that were related to flower development, and there were 104 genes related to pollen development, of which 61 genes were upregulated and 43 genes were downregulated (Table S5).
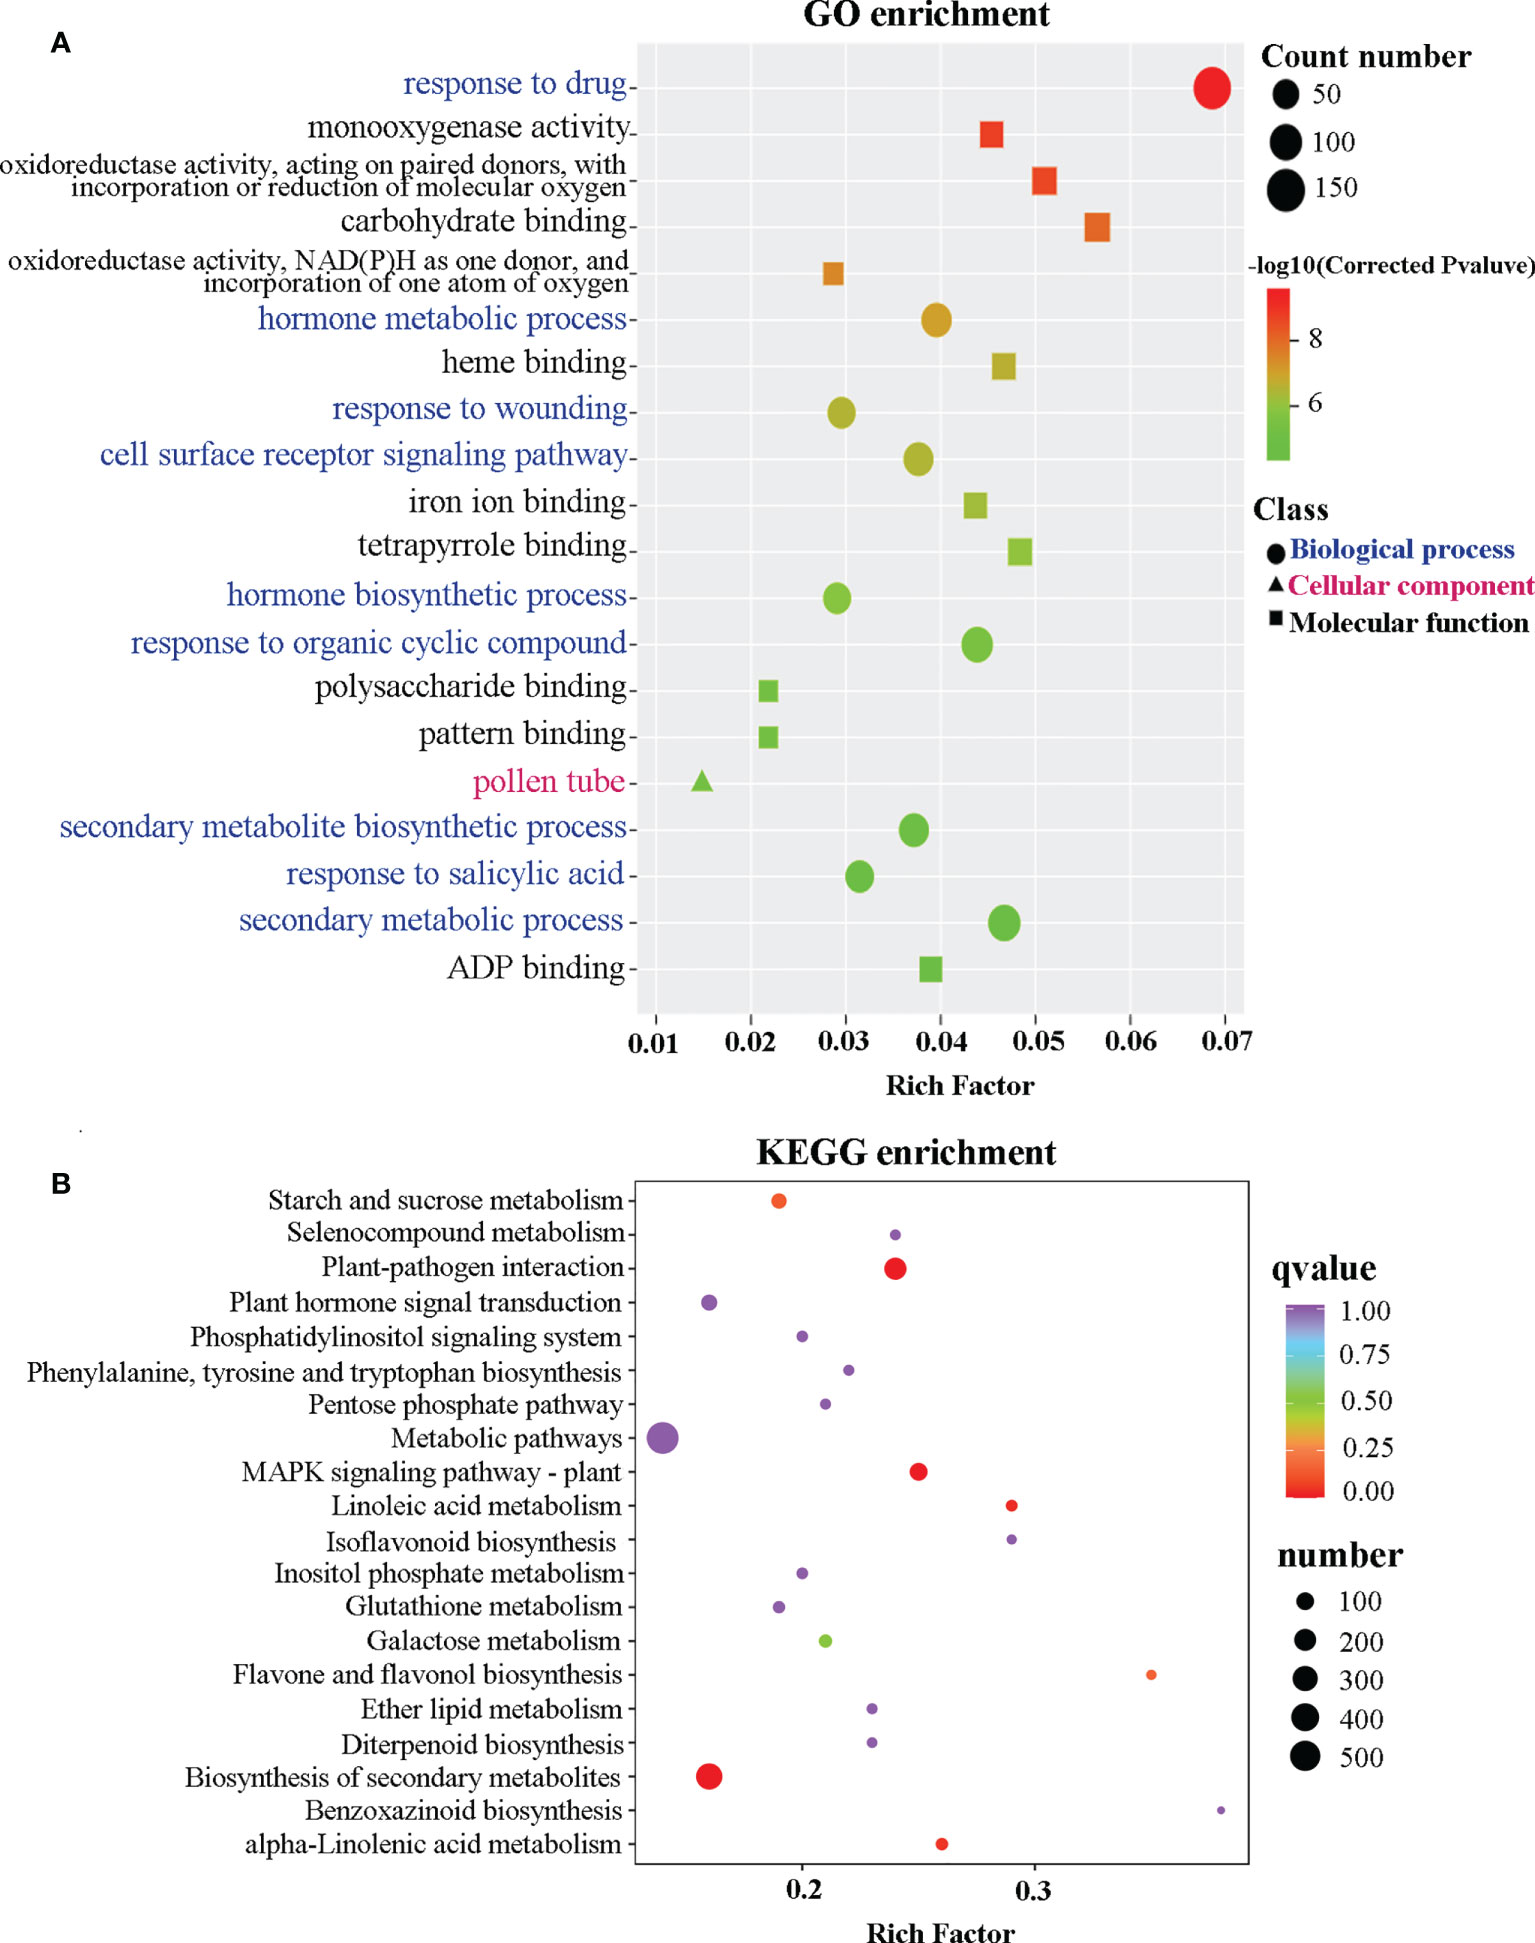
Figure 2 Scatter plot of the GO and KEGG enrichment analyses based on the DEGs. (A) Scatter plot of the GO enrichment analysis based on the DEGs. The ordinate represents a GO term. The abscissa indicates a rich factor. The greater the rich factor, the greater the degree of enrichment. The larger the point, the greater the number of DEGs enriched in the GO pathway. The redder the color of the dot, the more significant the enrichment. (B) Scatter plot of the DEGs enriched in the KEGG pathways. The ordinate indicates the KEGG pathway. The abscissa indicates a rich factor. The greater the rich factor, the greater the degree of enrichment. The larger the point, the greater the number of DEGs enriched in the KEGG pathway. The redder the color of the dot, the more significant the enrichment.
To better understand the pathways activated by the overexpression of CcGASA4, a KEGG enrichment analysis was performed, which assigned 1,241 DEGs to 134 KEGG pathways (Table S6, Figure S2). Among these pathways, “metabolic pathways”, “biosynthesis of secondary metabolites”, “plant–pathogen interaction”, “MAPK signaling pathway-plant”, “phenylpropanoid biosynthesis”, “protein processing in endoplasmic reticulum”, “plant hormone signal transduction”, “phenylalanine, tyrosine and tryptophan biosynthesis”, “flavone and flavonol biosynthesis”, and “starch and sucrose metabolism” were significantly enriched (Figure 2B). In addition to the “metabolic pathways” and “biosynthesis of secondary metabolites” pathways, the DEGs enriched in the “plant–pathogen interaction” pathway was the most significant. They comprised 203 DEGs, of which 126 were upregulated and 78 were downregulated.
Heatmaps of the DEG subclusters were developed to better understand the key DEGs associated with the role of CcGASA4. Based on their functional annotations, the DEGs, including 29 plant hormone signal transduction pathway genes, 12 plant–pathogen interaction pathway genes, and six MAPK pathway genes, were shown in the heatmap (Figure 3; Table S7). These findings indicate that CcGASA4 may play a functional role in activating the expression of MAPK signaling transduction pathway and disease resistance genes, inhibiting the expression of auxin- and ethylene-related genes, and activating or inhibiting the expression of BR biosynthesis- and ABA-related genes.
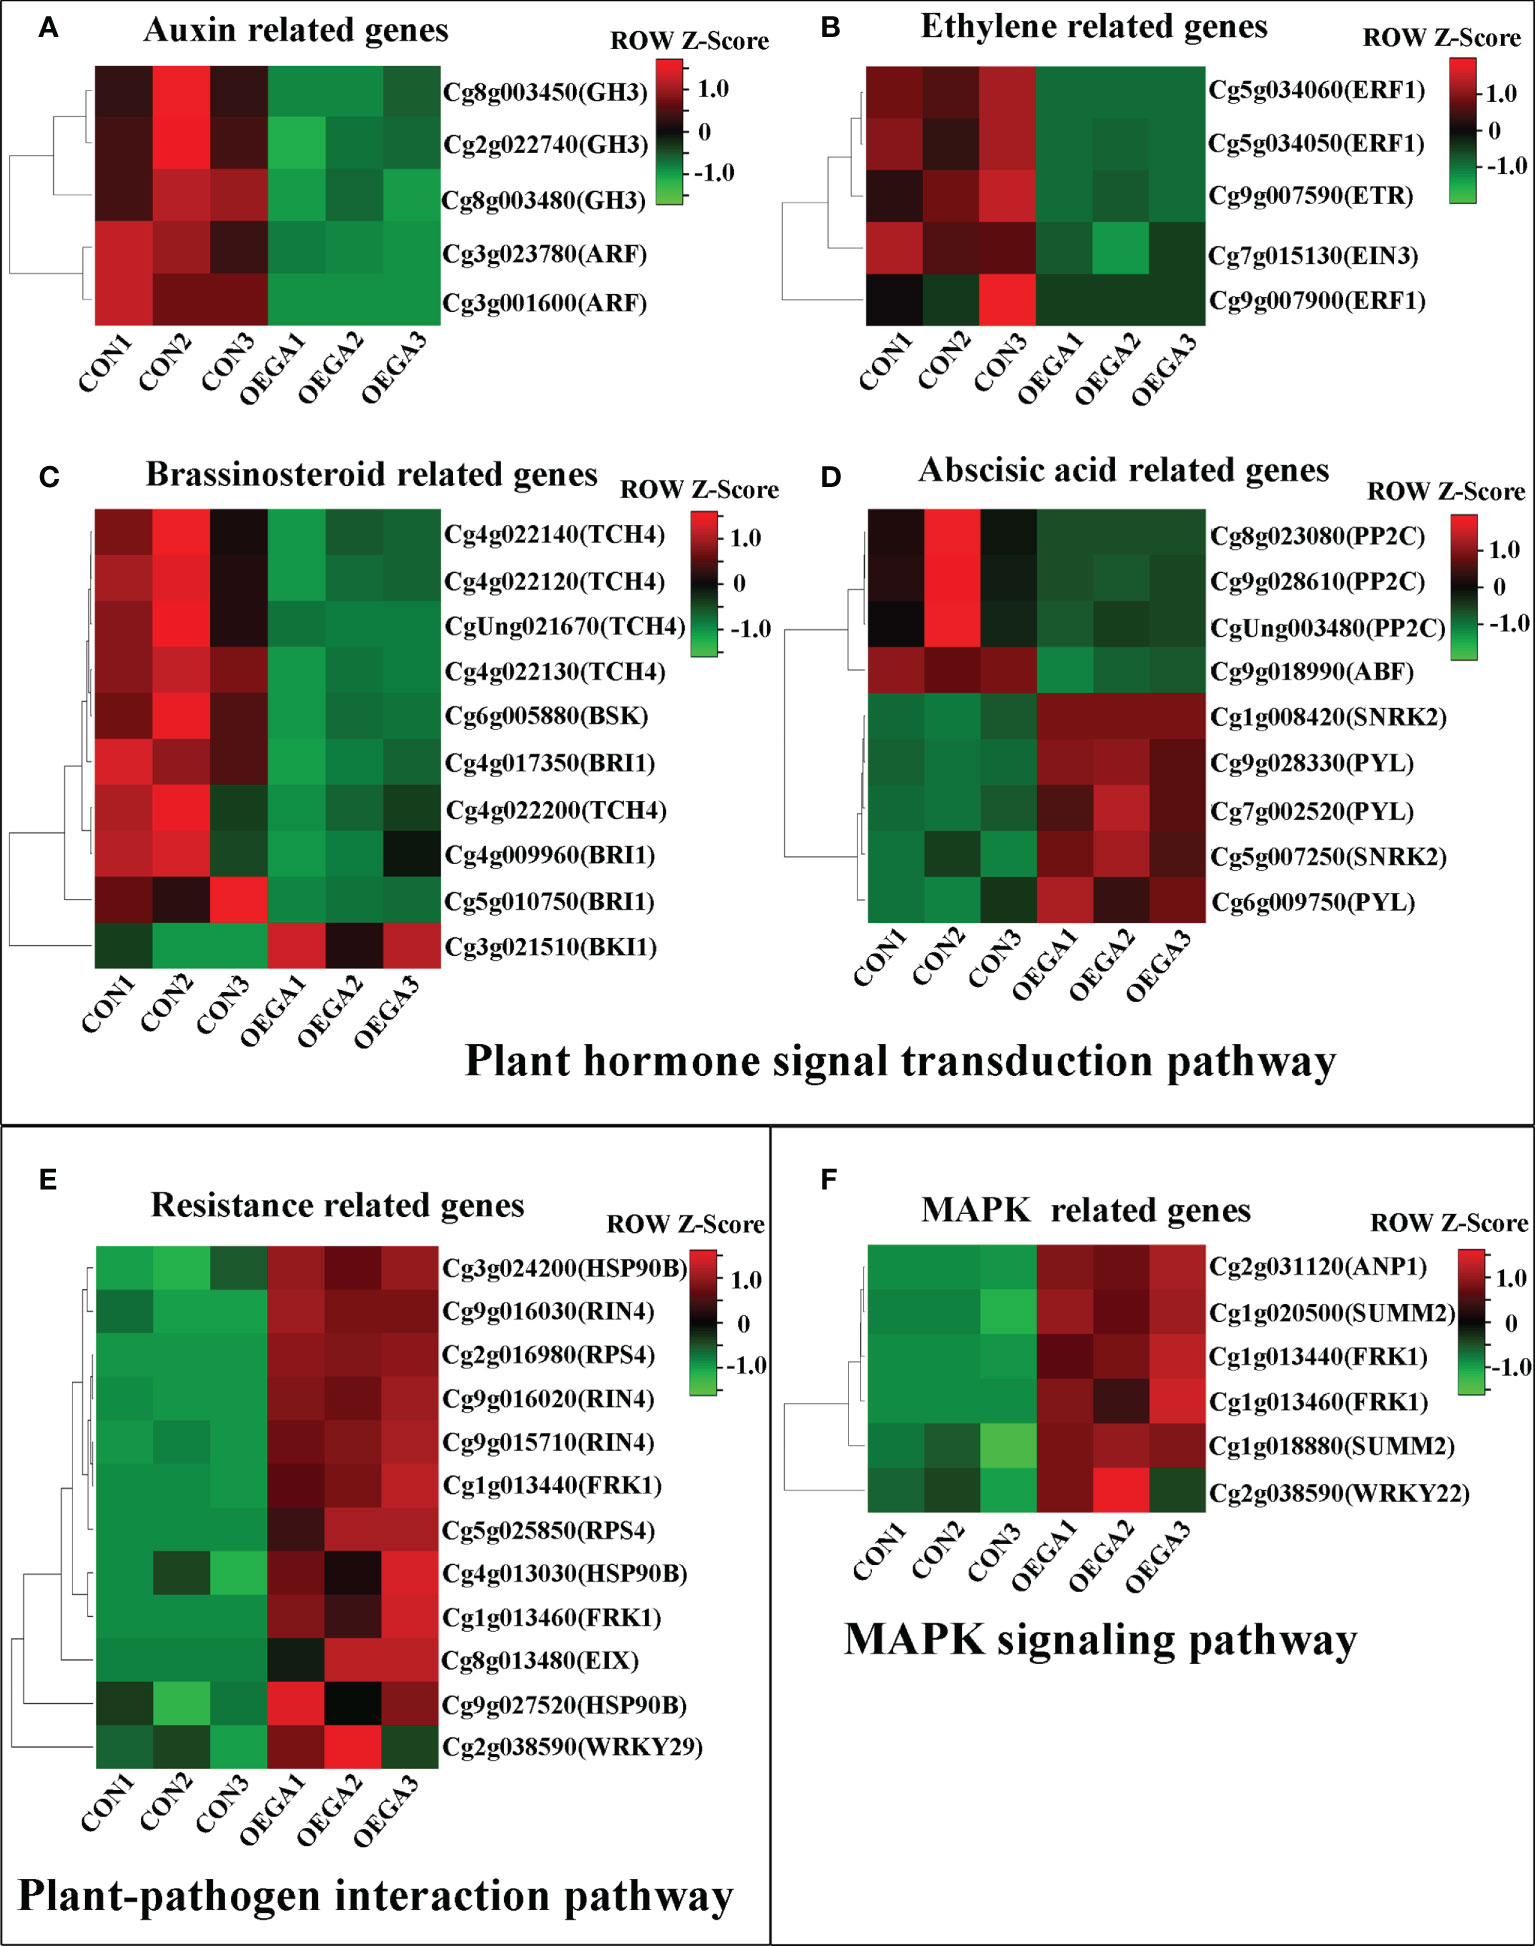
Figure 3 Heatmap of the DEGs in the OEGA and CON plants. (A–D) Heatmap of the plant hormone signal transduction pathway genes. (E) Heatmap of the plant–pathogen interaction pathway genes. (F) Heatmap of the MAPK pathway genes. The bar represents the scale of the expression levels of each gene (reads per kilobase per million mapped reads; FPKM) in the different samples, as indicated by the red and green rectangles. The metabolite production levels in the heatmaps were normalized by Z-scores. Genes in red indicate upregulation, whereas those in green indicate downregulation.
Validation of candidate DEGs based on the qRT-PCR analysis
To confirm the DEGs obtained from the RNA-seq analysis, the expression levels of 17 candidate genes were randomly analyzed using qRT-PCR. These genes included six plant–pathogen interaction genes (RPS4, RIN4, PTI6, RBOH, FRK1, and WRKY1), six flavone and flavonol biosynthesis genes (two IF7MaT genes, two C12RT1 genes, CYP75B1, and FG2), and five phenylalanine, tyrosine, and tryptophan biosynthesis genes (two tyrAa genes, two pheA2 genes, and trpB) (Figure S3). The qRT-PCR results confirmed that the changes in the expression levels of all 17 genes were basically consistent with the RNA-seq data.
Widely-targeted metabolome analysis of the OEGA transgenic citrus plants
To better understand the regulatory function of CcGASA4 in the metabolite levels in citrus plants, we performed a widely-targeted metabolome analysis to reveal the metabolic changes between the OEGA and CON groups. The repeatability of metabolite extraction and detection was assessed using an overlapping analysis of the total ion current (TIC) in the different QC samples (Figures 4A, B). Three key parameters, including retention time, peak intensity, and the TIC curve, were evaluated and indicated that the detection signals of the samples were stable at different times. We further conducted a correlation analysis of the expression levels of metabolites based on PCC to determine the relationships between the biological replicates within the groups. The results indicated that all of the biological replicates exhibited similar expression patterns, thereby illustrating the high reliability of the sequencing data (Figure 4C). Thus, the sequencing quality was sufficient for further analysis.
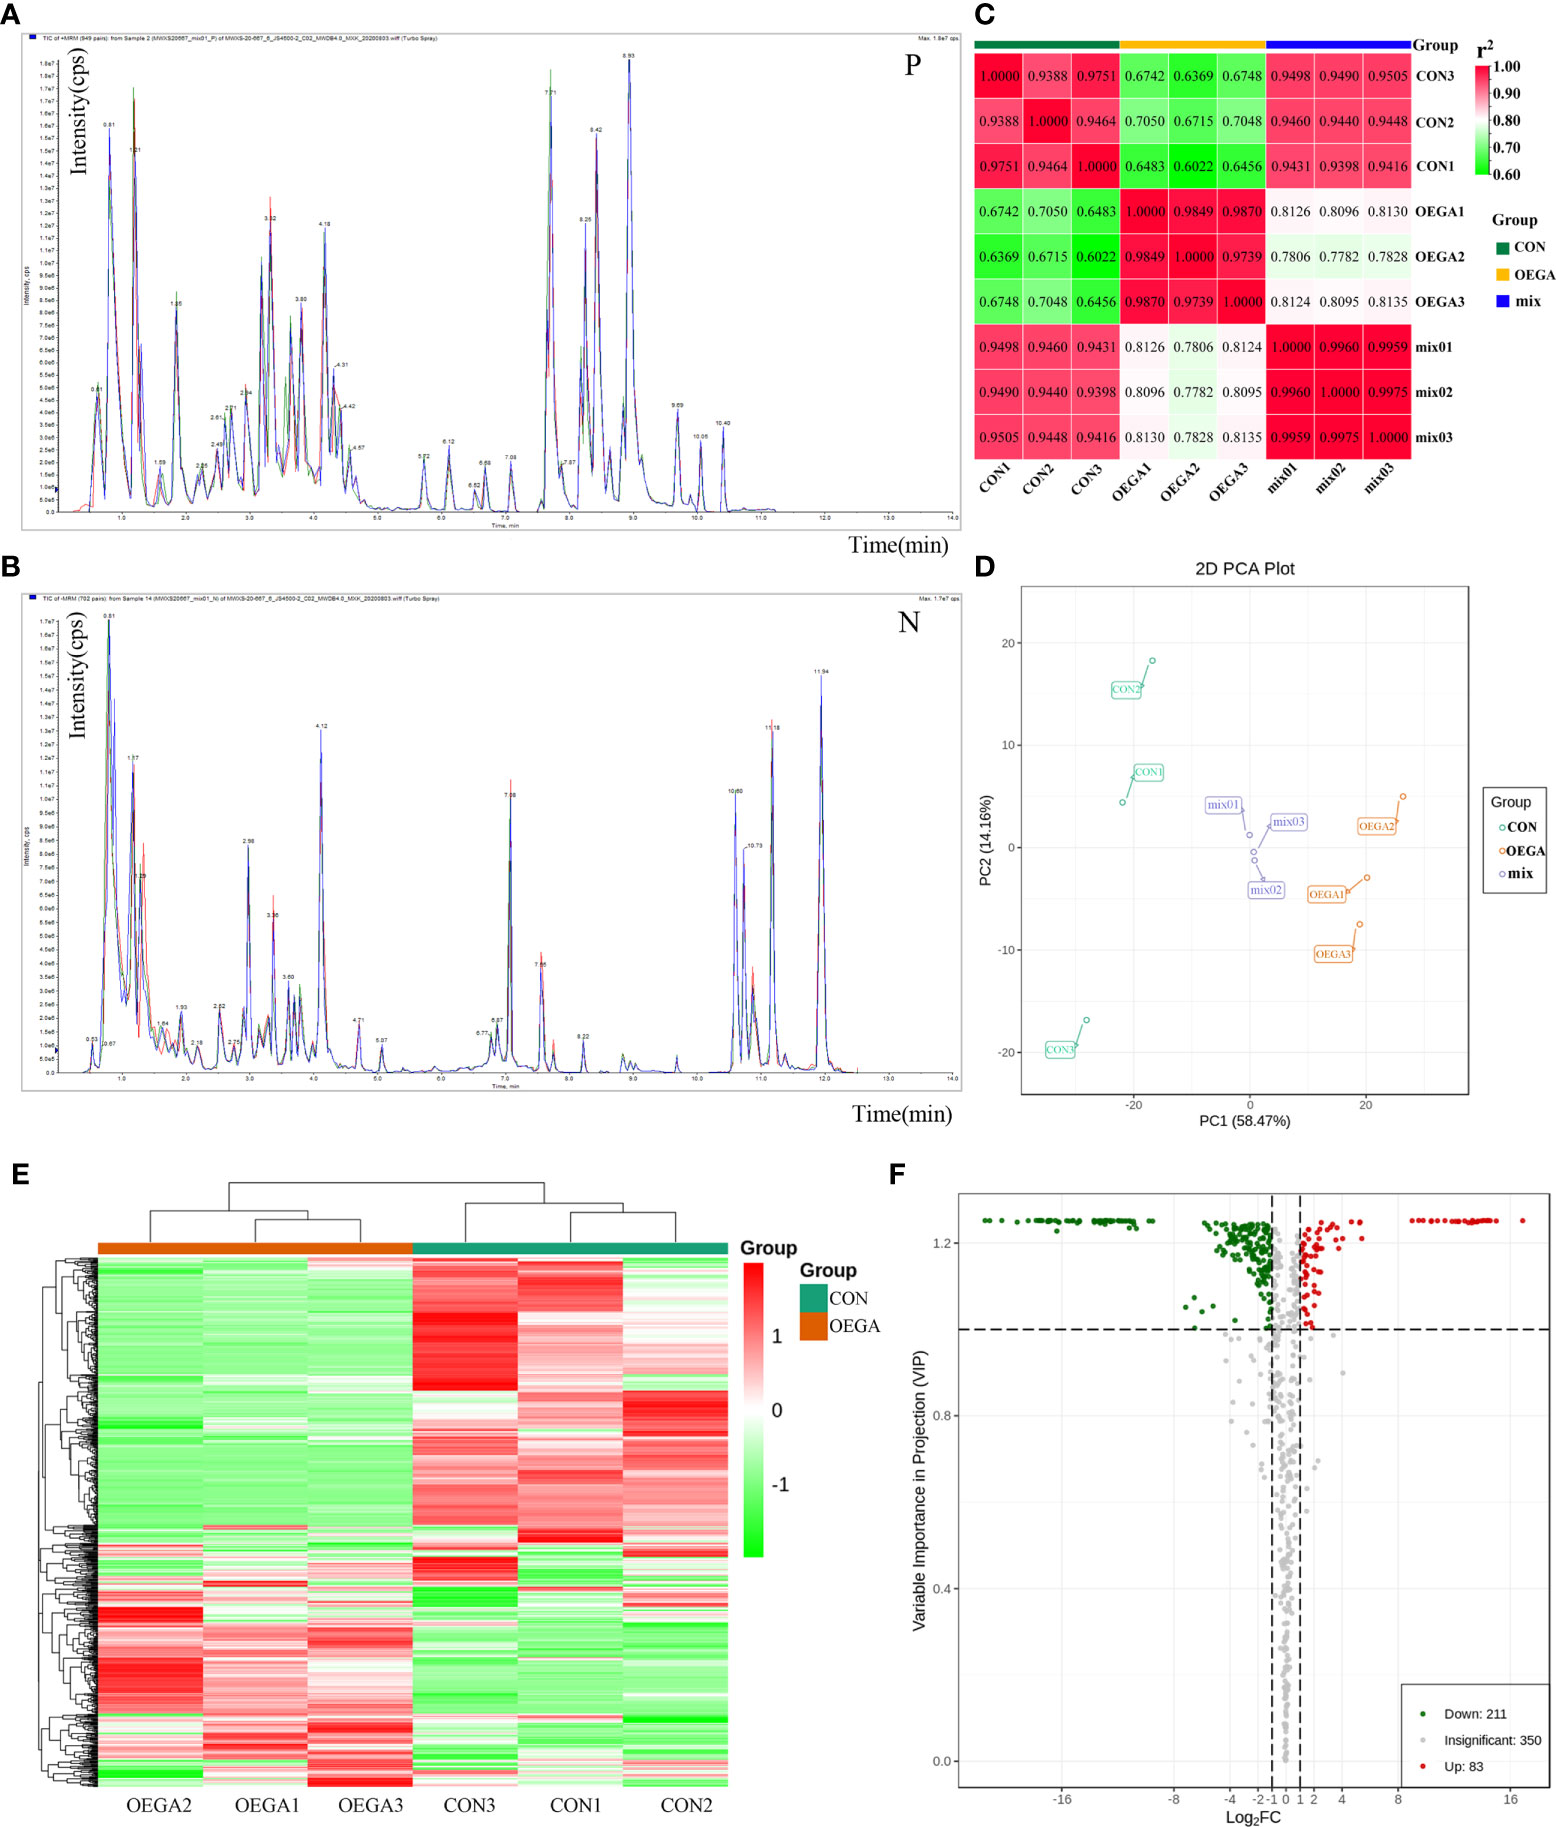
Figure 4 Metabolomics profiles of the citrus leaves from the OEGA and CON samples. (A) and (B) Overlapping analysis of the total ion current in the different quality control (QC) samples. The abscissa indicates the retention time (RT) of the metabolites, and the ordinate indicates the ion current intensity in counts per second (cps). The three different colors represent the three QC samples. N represents the negative ion mode, and P represents the positive ion mode. (C) Pearson’s correlation coefficients among the citrus samples CON, OEGA, and mix (QC). The abscissa and ordinate indicate corresponding sample names. The color represents the correlation coefficient (r2). (D) Principal component analysis of all the metabolites. OEGA: yellow; CON: green; mixed: purple. The abscissa represents the first principal component (PC1), and the ordinate represents the second principal component (PC2). The percentage indicates the interpretation rate of the principal components in the dataset. (E) Cluster heatmap of the differences in the metabolite content between the OEGA and CON groups. The sample name is indicated on the abscissa, and the metabolite information is shown on the ordinate. The cluster line on the left of the Figure is the metabolite cluster line, and that on the top of the Figure represents the sample cluster line. The different colors represent the values obtained after the relative content standardization process (red represents high content, and green represents low content). (F) Volcano plot of the differential metabolites. Green dots represent downregulated metabolites, red spots represent upregulated metabolites, and gray dots represent metabolites with insignificant differences.
In order to attain a preliminary understanding of the overall differences in the metabolites among the different groups, as well as the intra-group variations in the metabolites, we conducted a PCA on the samples, including the QC samples. The PCA was used to determine the contribution rates of the first two main components (PC1 and PC2), which scored 58.47% and 14.16%, respectively (Figure 4D). The PCA plot demonstrated that the three groups (OEGA, CON, and mixed) were clearly separated, but the three mixed samples were grouped together, indicating that they had similar metabolic profiles (Figure 4D). These data suggested that the samples were sufficiently reproducible to be suitable for a qualitative analysis.
To identify the DAMs and their various trends, we performed an HCA of all the detected metabolites and created cluster heatmaps. The metabolite profiles of the samples were divided into two main clusters, suggesting a clear variation in the abundance of the metabolites in the OEGA and CON samples (Figure 4E). The OPLS-DA model (foldchange score ≥ 2 or ≤ 0.5, VIP value > 1) further revealed 644 metabolites in all the samples, of which 294 metabolites displayed significantly-different levels between the two sample groups (Table S8). Volcano plots of the 294 DAMs showed that 83 and 211 metabolites were significantly accumulated in the OEGA and CON groups, respectively (Figure 4F). To visualize the class-specific patterns of the candidate metabolites, Z-score plots of the metabolites in the OEGA relative to the CON samples were generated (Figure S4).
To further analyze the functional annotations of the DAMs and the enriched pathways that they are involved in, we mapped them to the KEGG database. A wide variety of metabolites, including 19 amino acids and their derivatives, 19 phenolic acids, six nucleotides and their derivatives, 134 flavonoids, 18 lignin coumarins, two tannins, 22 alkaloids, three terpenes, 13 organic acids, and 40 lipids, displayed considerable differences between the CON and OEGA groups (Figure 5A; Table S9). In the OEGA, 25 metabolites, including 16 flavonoids, two alkaloids, one organic acid, one terpenoid, one lignan and coumarin, one phenolic acid, and three other compounds, were at relatively-higher levels and did not accumulate considerably in the CON group (Figure 5B; Table 1). The significant OEGA-specific accumulated metabolites were the flavonoids dihydrokaempferol-7-O-glucoside (log2FC = 16.88) and luteolin-4’-O-glucoside (log2FC = 15) (Figure 5B). In addition, we detected six nucleic acid-related DAMs, five of which had accumulated with increased abundance. These included cytosine, thymine, guanine, xanthine, and succinyladenosine (Figure 5B). However, most of the differentially-accumulated lignans, coumarins, and lipids, such as isooxypeucedanine and lysoPC (20:1), were less abundant in the OEGA group (Figure 5B). The KEGG enrichment analysis showed that the DAMs were involved in 54 pathways (Table S10), including “flavonoids and flavonol biosynthesis” (16.666%), “phenylpropanoid biosynthesis” (11.538%), “flavonoid biosynthesis” (7.692%), “arginine and proline metabolism” (8.97%), “glucosinolate biosynthesis” (7.69%), and “biosynthesis of amino acids” (8.97%) (Figure 5C).
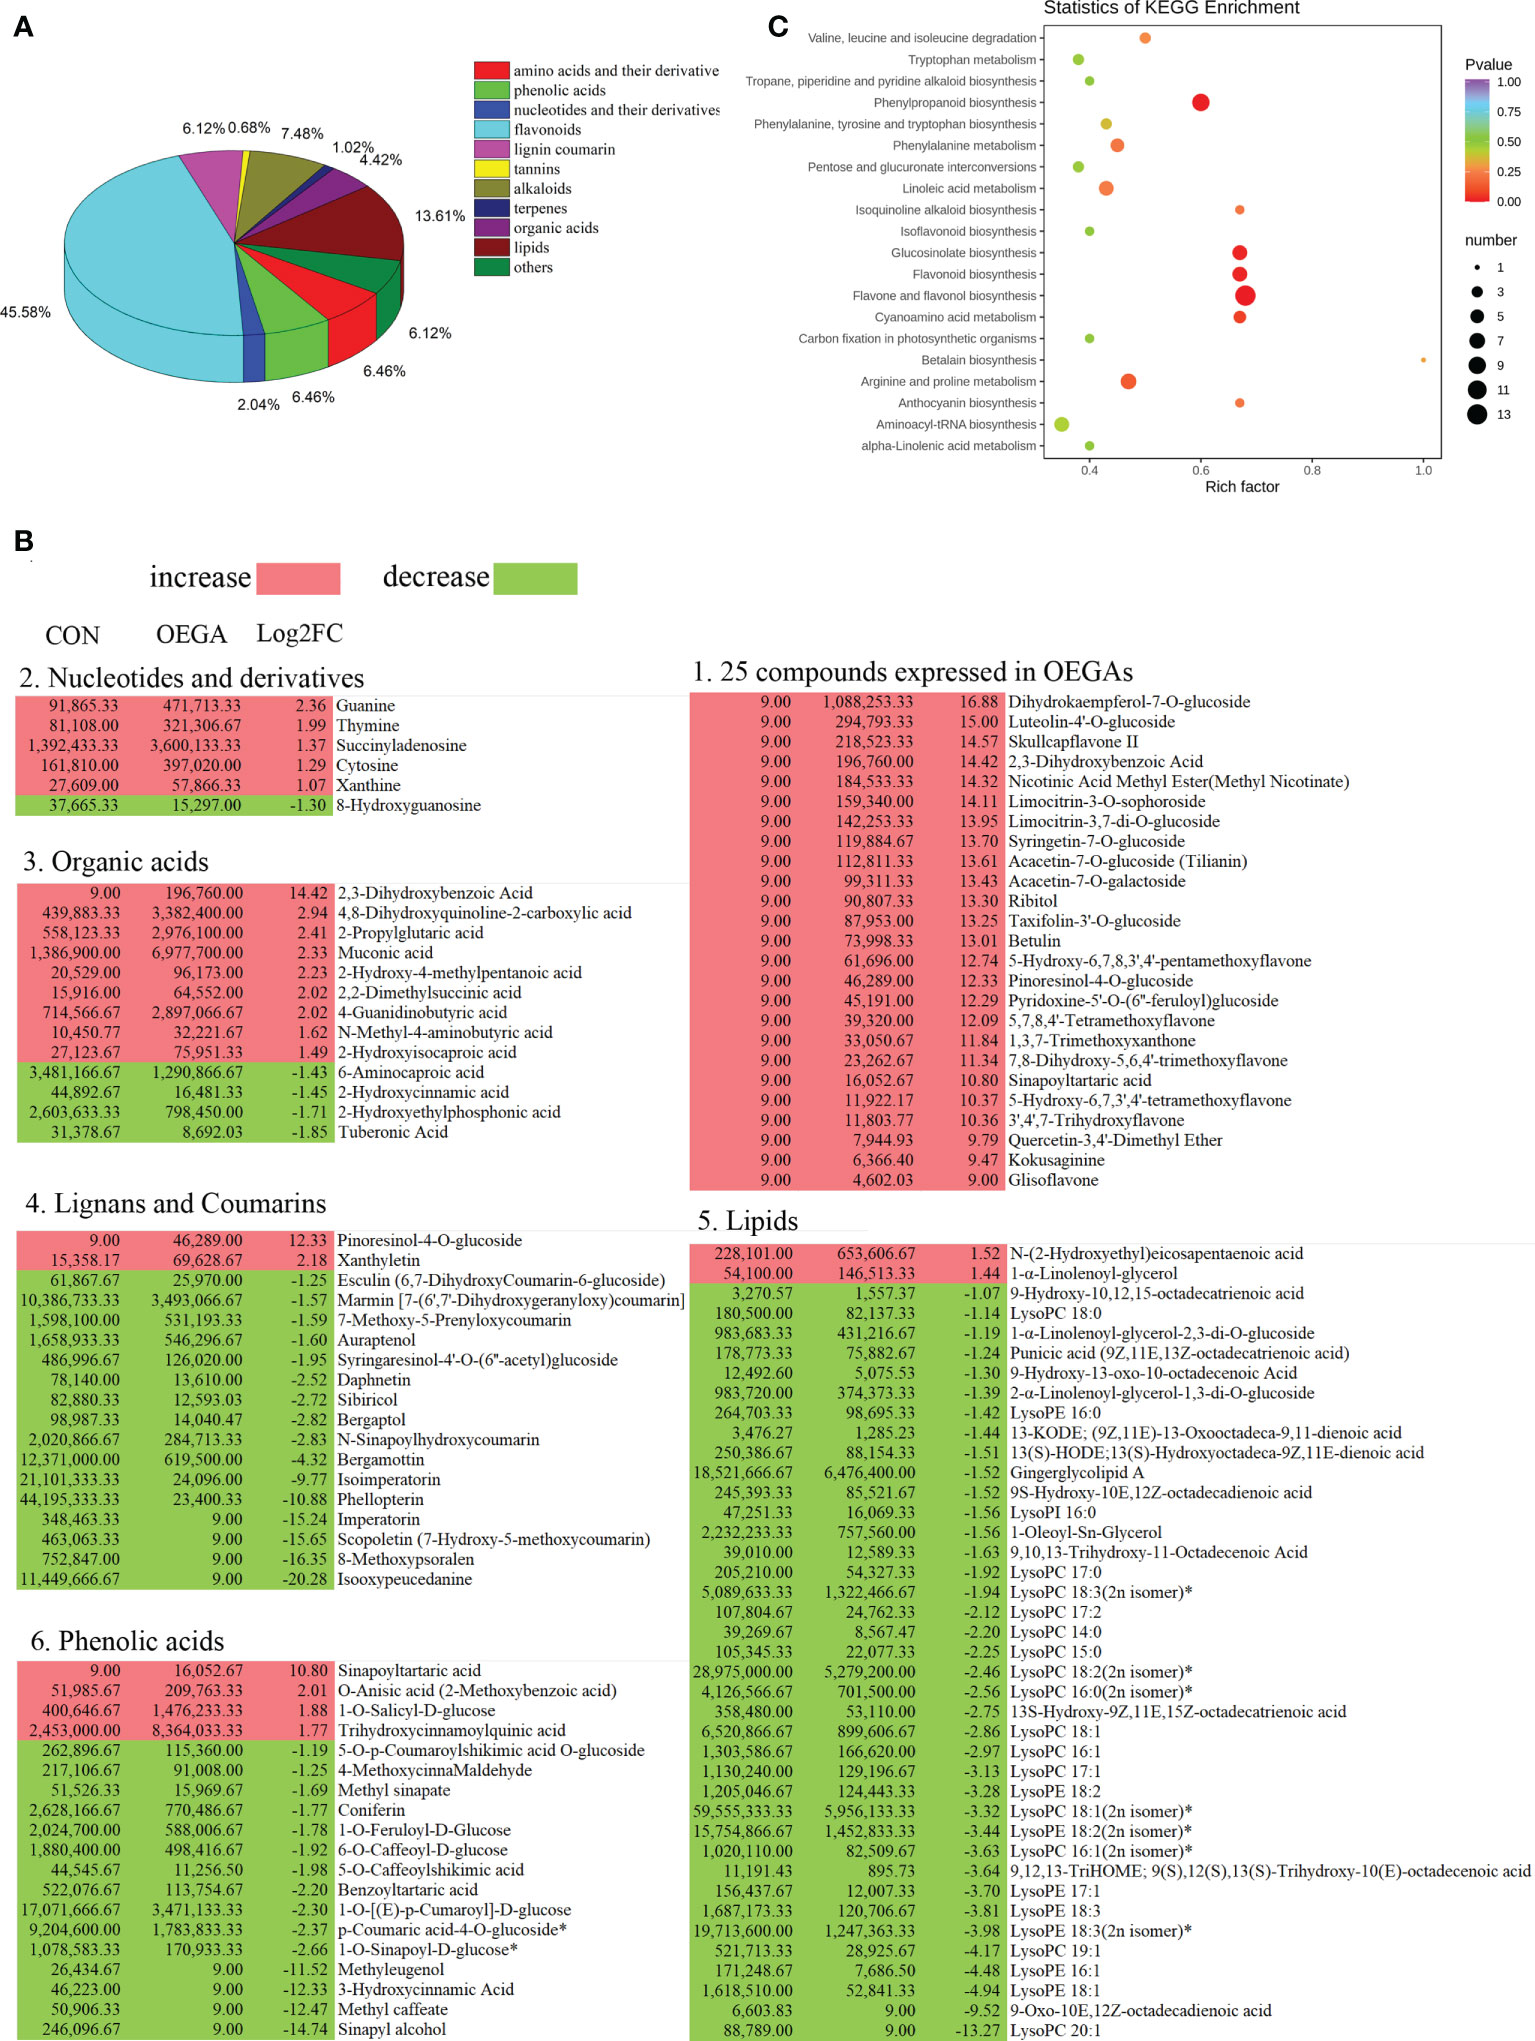
Figure 5 Pathway enrichment analysis of the differential metabolites in the OEGA transgenic citrus. (A) Classification and proportion of the differentially-accumulated metabolites. The numbers next to the pie chart represent the percentage of different types of DAMs among the total differential metabolites. (B) Abundance of the significant DAMs among the different metabolite classes. Red and green indicate increased and decreased levels of metabolites, respectively, as indicated by the colored squares. Lysophosphatidylcholine, LysoPC; lysophosphatidylethanolamine, LysoPE. (C) Significantly-enriched KEGG metabolic pathways. The abscissa indicates the enrichment factor, and the ordinate indicates the enrichment pathway. The dot sizes represent the number of differentially-enriched metabolites. The greater the rich factor, the greater the degree of enrichment. The larger the point, the greater the number of differentially-enriched metabolites in the pathway. The significance of the enrichment level is indicated by the color of the dot according to the color scheme shown on the right.
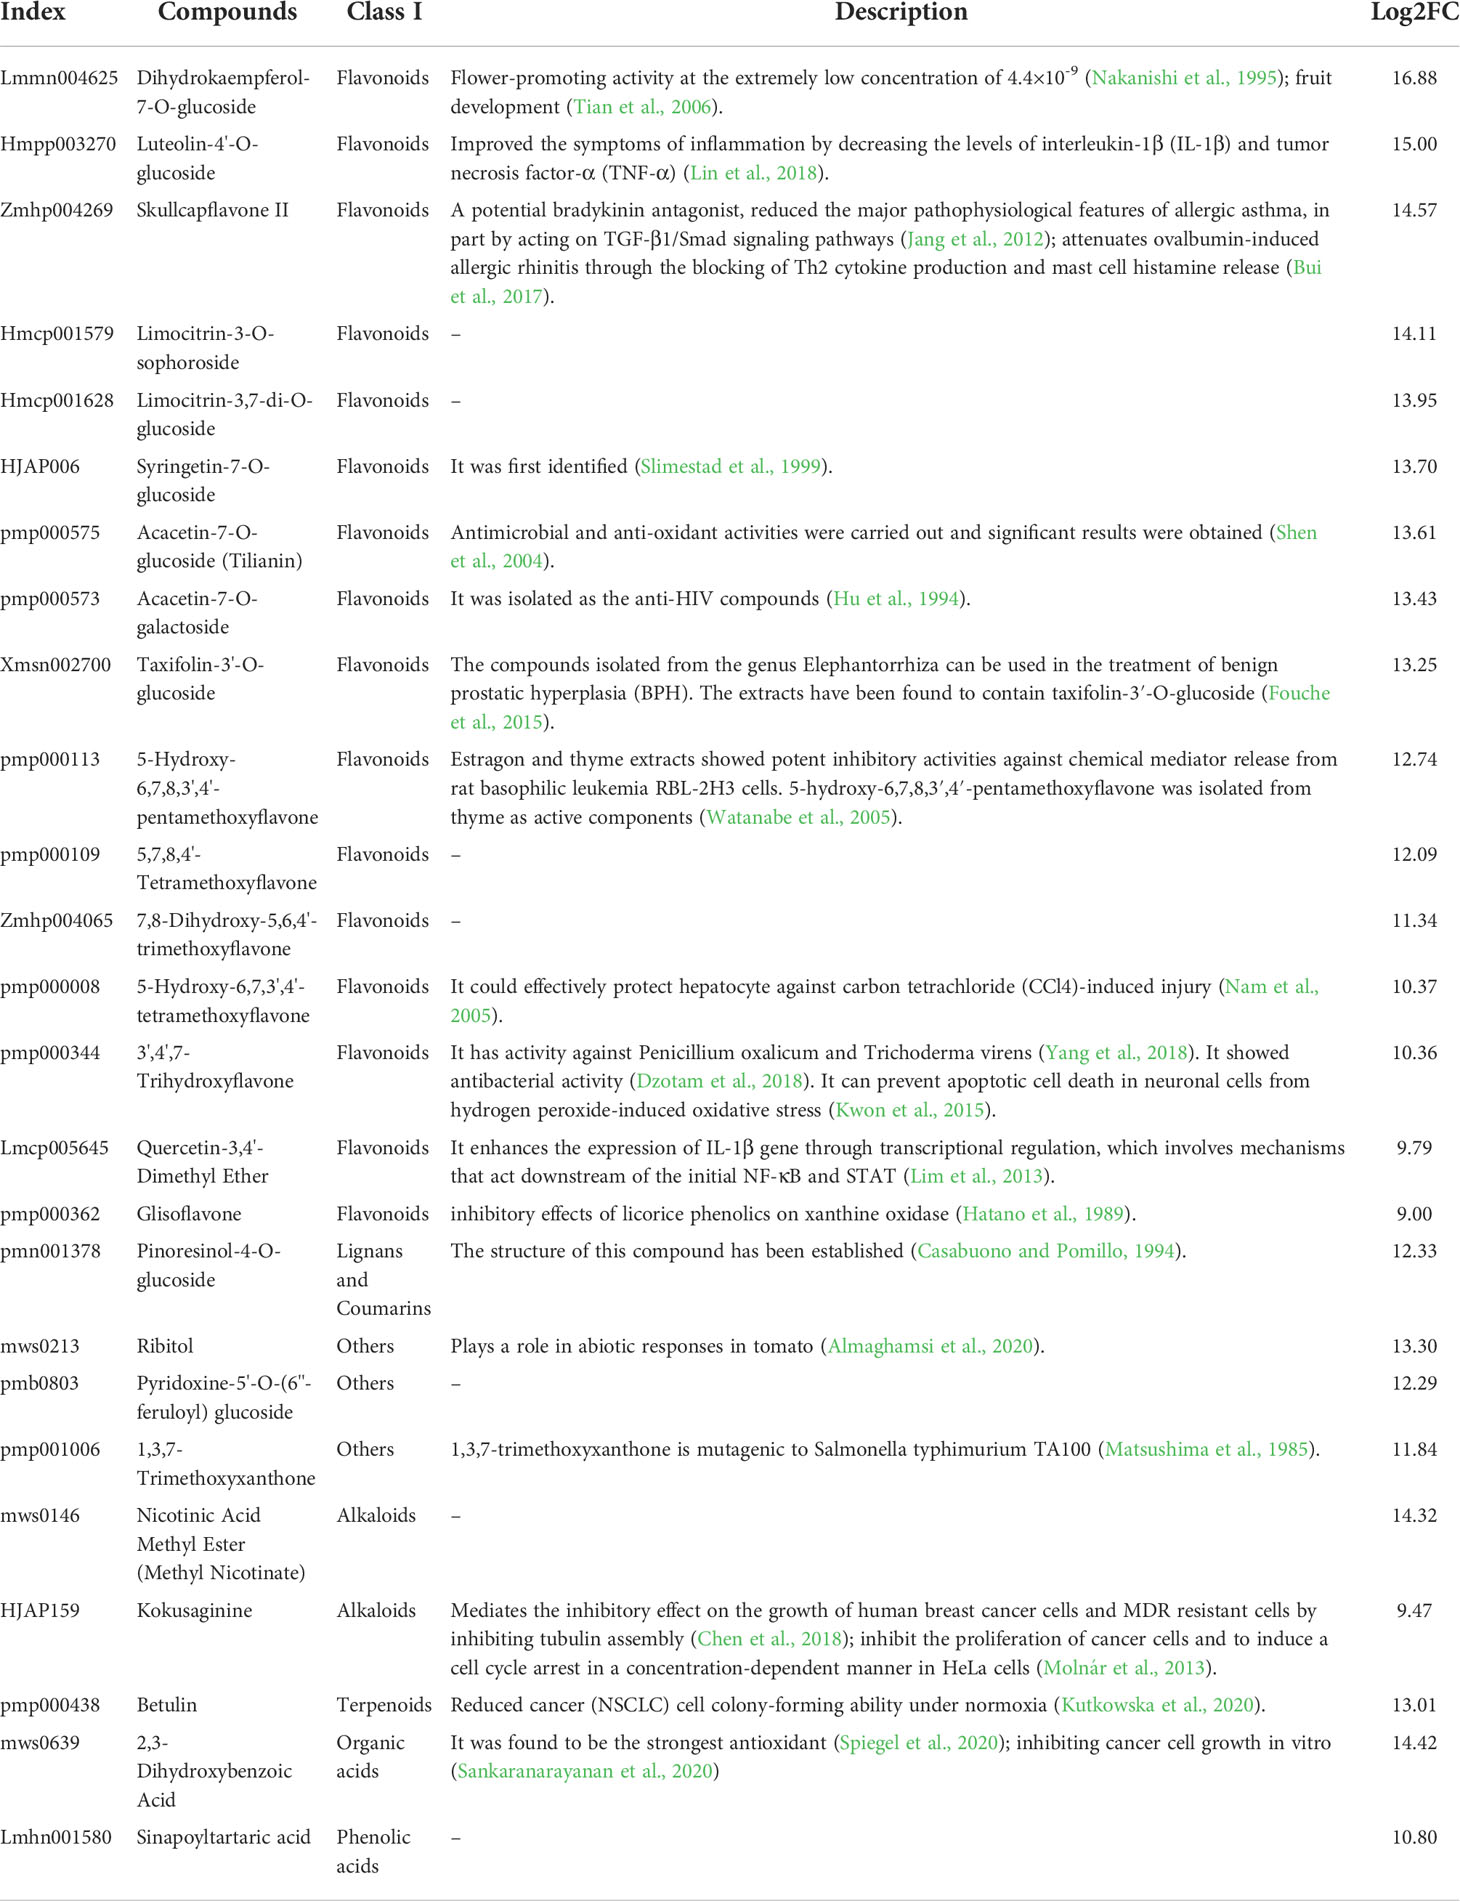
Table 1 25 DAMs that were expressed in OEGA plants.
Association analysis of the metabolome and transcriptome datasets
A histogram was generated based on the results of the DAMs and DEGs conjoint KEGG enrichment analysis, showing the degree of enrichment of the pathways with differential metabolites and genes (Figure 6C). Results showed 49 co-mapped pathways involving the DEGs and DAMs (Figure 6C). Among these pathways, “flavone and flavonol biosynthesis” was significantly enriched, and “flavonoid biosynthesis”, “phenylpropanoid biosynthesis”, “isoquinoline alkaloid biosynthesis”, “glucosinolate biosynthesis”, “linoleic acid metabolism”, “valine, leucine and isoleucine degradation”, and “phenylalanine, tyrosine and tryptophan biosynthesis” were also enriched in the CON compared to the OEGA group (Figure 6C). This suggested that these metabolic pathways are activated by the overexpression of CcGASA4. The DEGs and DAMs involved in “flavone and flavonol biosynthesis”, “flavonoid biosynthesis”, and “phenylpropanoid biosynthesis” are shown in Figure 7. The accumulation of phenylpropane compounds was significantly reduced in the OEGA (Figure 7). When a set of genes associated with the flavonoid pathway was transcriptionally profiled, it was found that tyrosine aminotransferase (TAT), 4-coumarate-CoA ligase (4CL), chalcone synthesis (CHS), chalcone isomerase (CHI), flavanone 5-hydroxylase (F5H), and flavonoid 3’-monooxygenase (CYP75B1) were downregulated following the overexpression of CcGASA4. These findings were consistent with the reduced capacity of the transgenics for flavonoid synthesis.
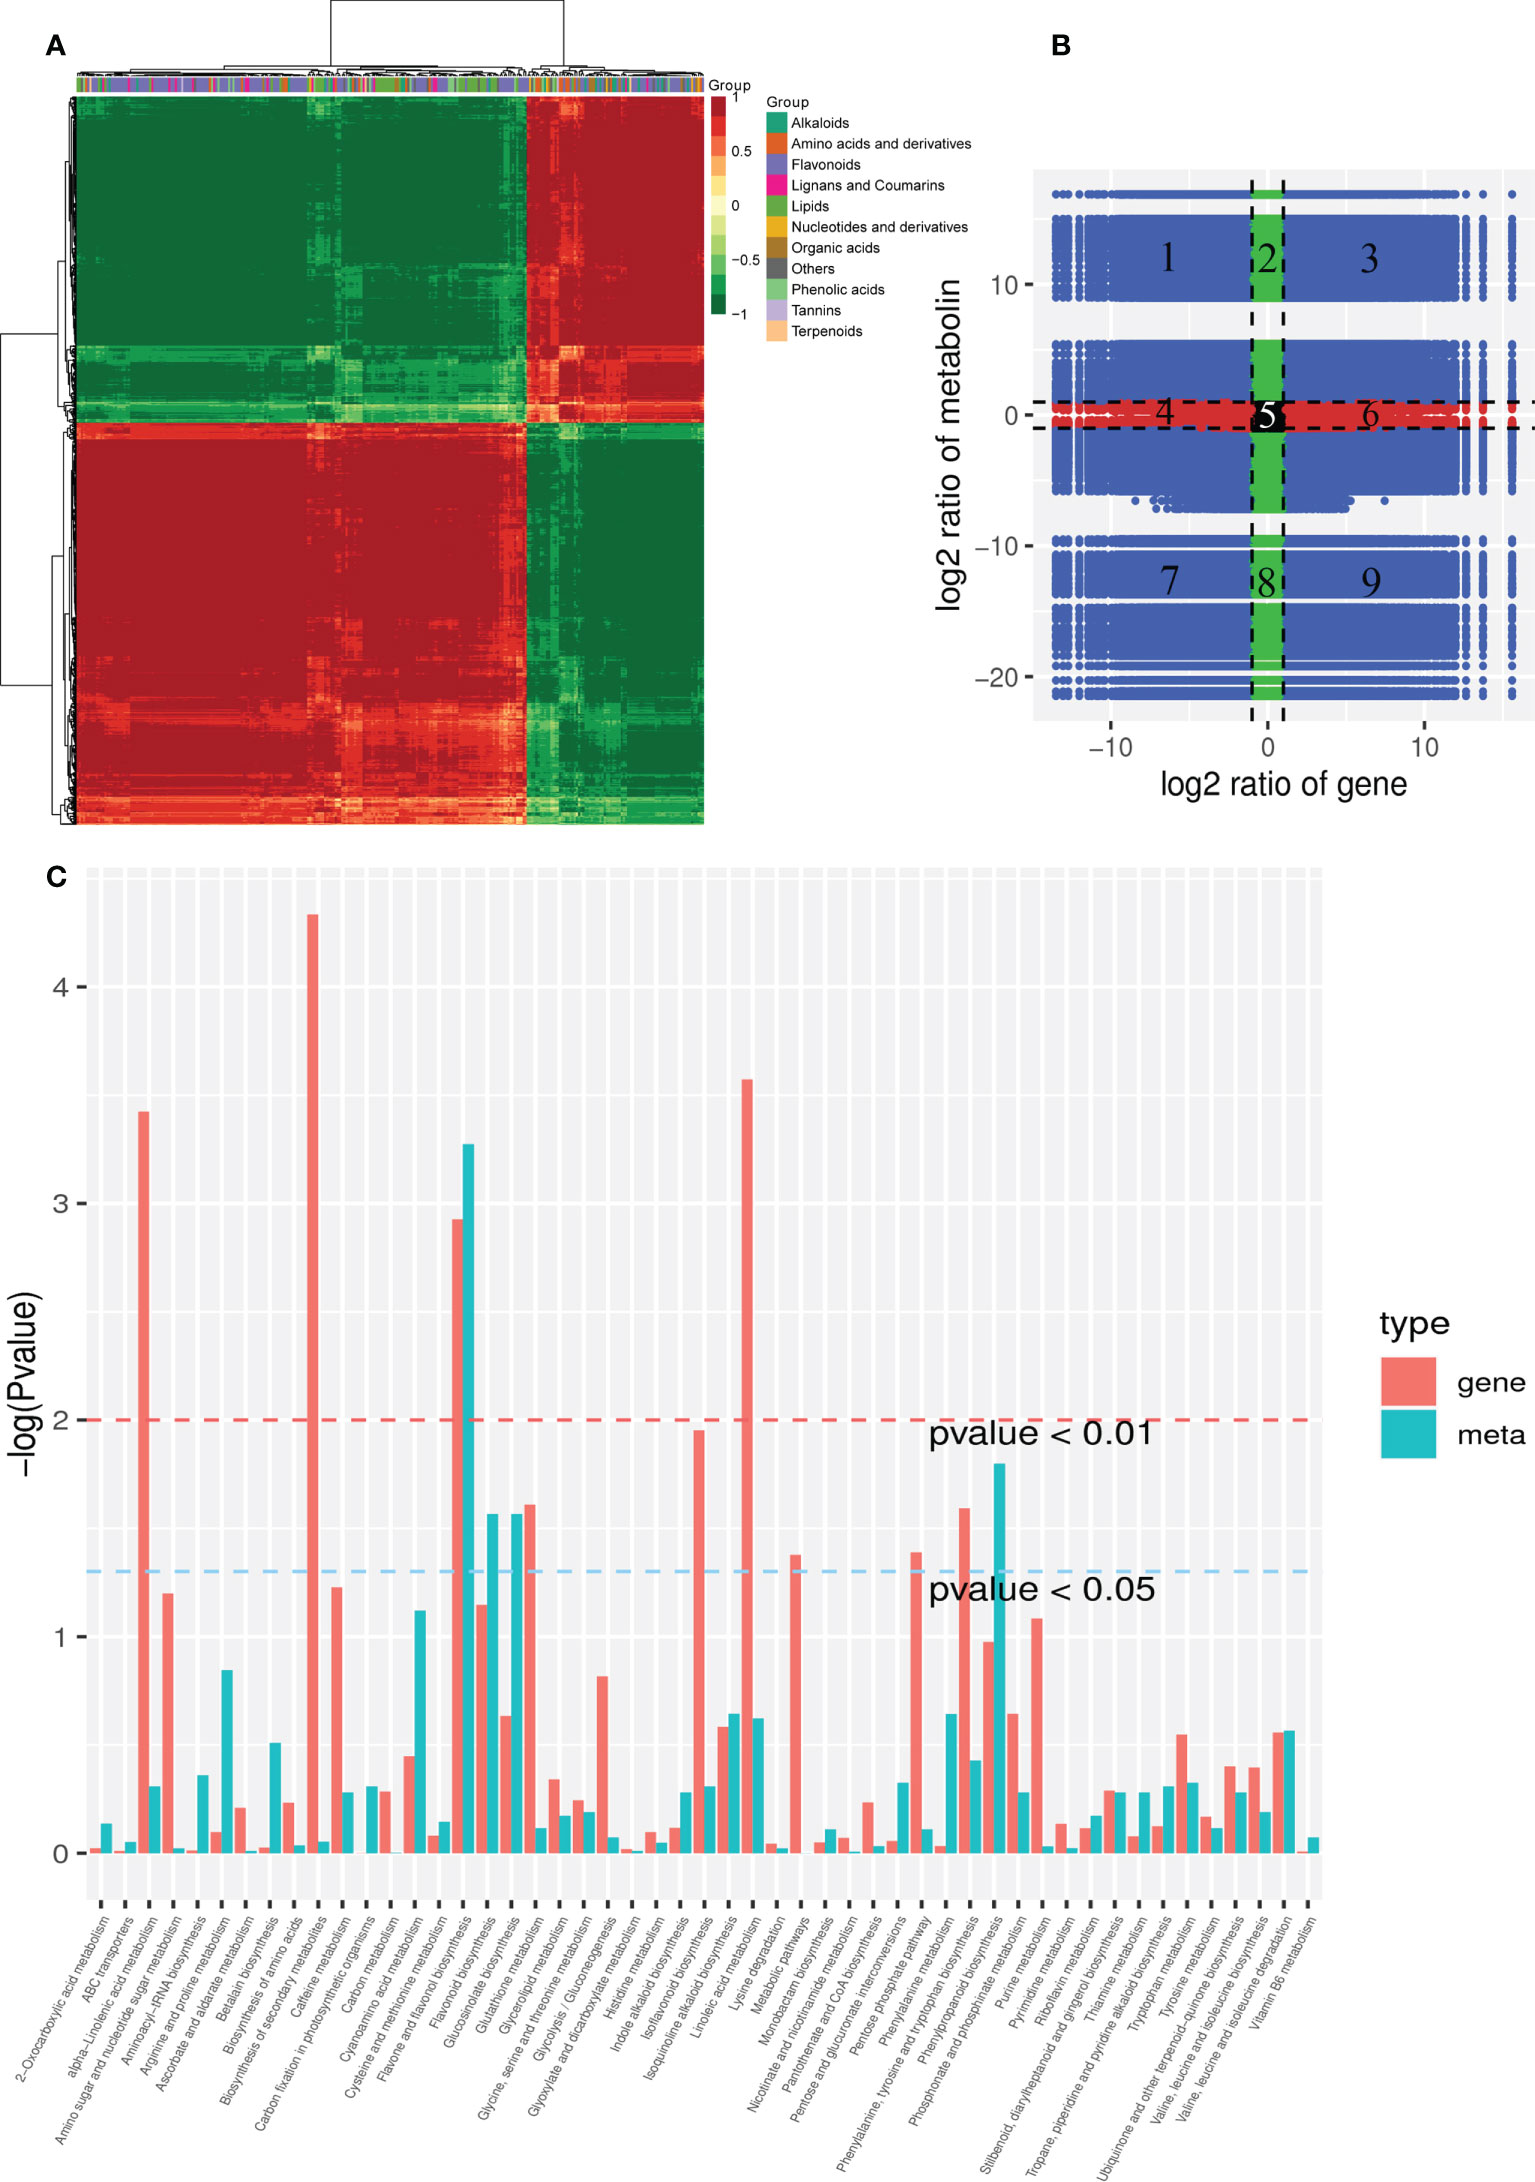
Figure 6 Combined analysis of the transcriptome and metabolome. (A) Cluster analysis of the correlation coefficients between the DEGs and DAMs. (B) DEG and DAM foldchanges in a nine-quadrant plot. The x-axis represents the log2FC of the DEGs, where FC is the foldchange in gene expression; that is, the ratio of the FPKM of OEGA/FPKM of CON. The y-axis represents the log2FC of DAMs, where FC is the foldchange in the metabolite content between the OEGA and CON groups. Black dots represent unchanged genes or metabolites, green dots represent DAMs vs. unchanged gene expression, red dots represent DEGs vs. unchanged metabolites, and blue dots represent changes in gene expression and metabolites. The black dashed lines represent the thresholds for log2FC = 1 and divide the graph into nine quadrants. The metabolites and genes in the third and seventh quadrants showed consistent changes. (C) Joint KEGG enrichment P value histogram of the DEGs and DAMs in the CON and OEGA. The smaller the P value, the higher the degree of enrichment.
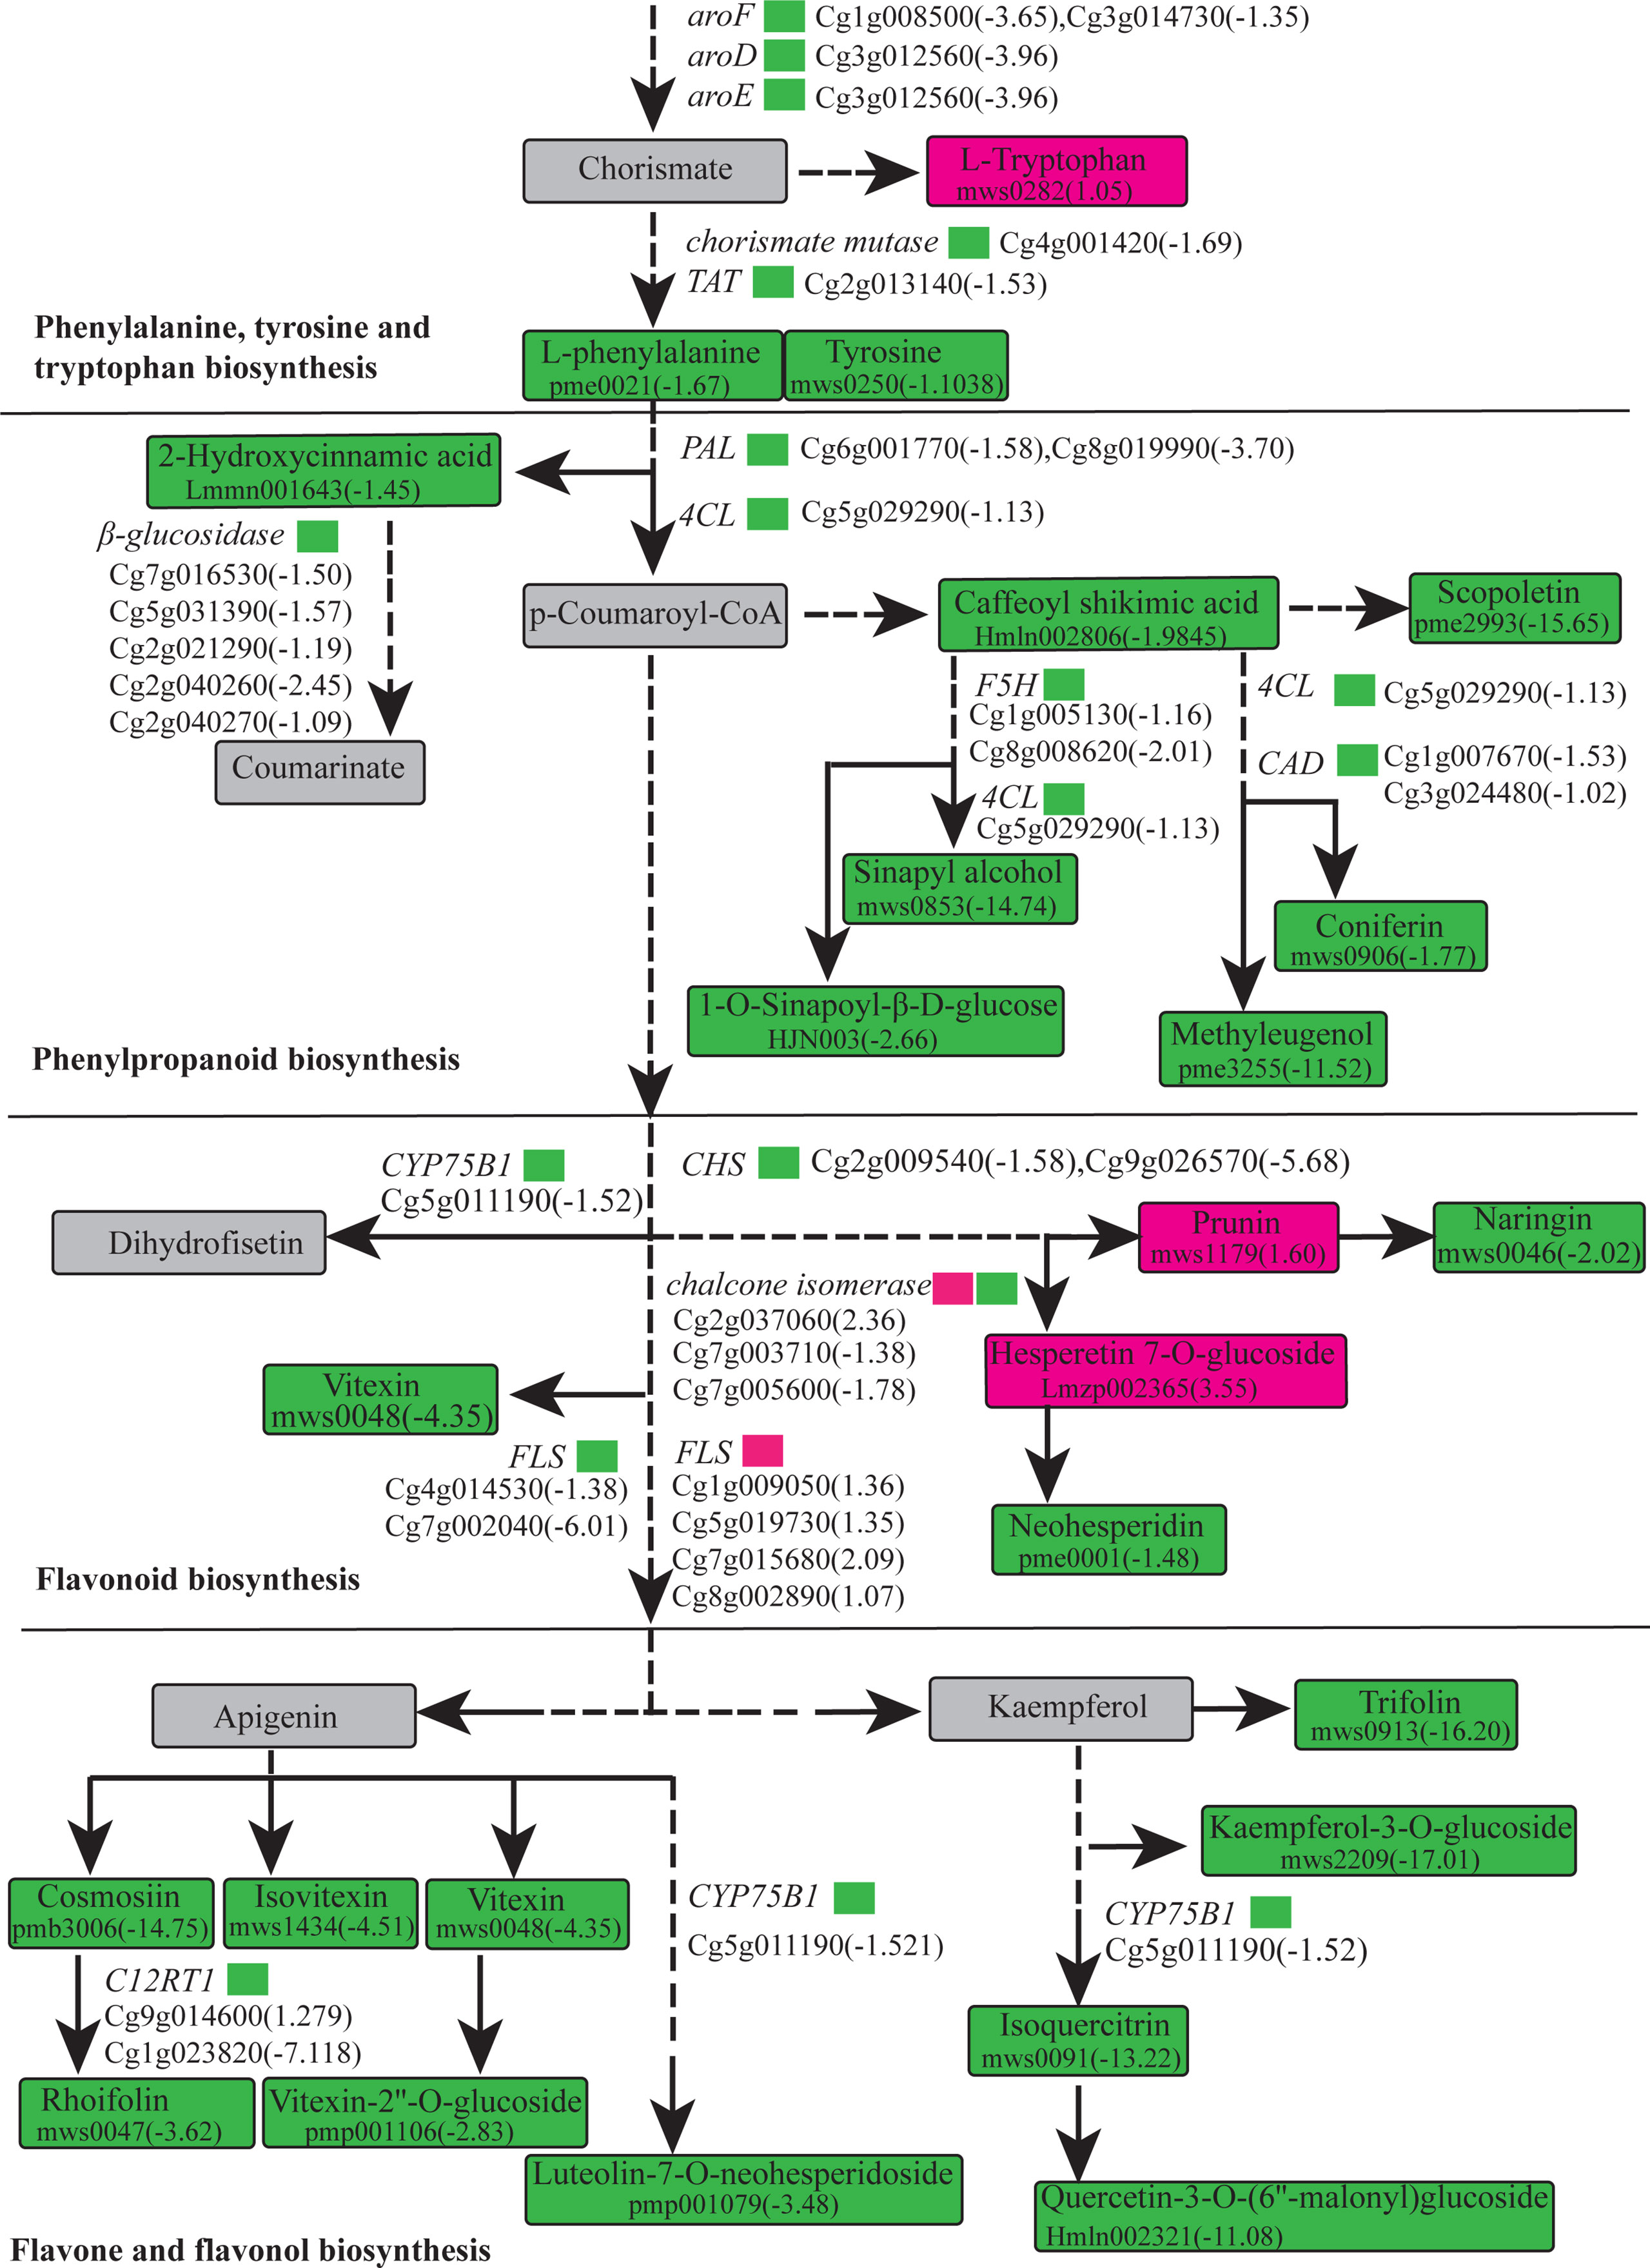
Figure 7 Biosynthetic pathway of the phenylpropane compounds.
The correlation analysis showed that there were 1,201,479 correlation pairs with |PCC| ≥ 0.8 and P < 0.05, including 3,515 DEGs and 294 DAMs. The correlation calculation results of the DAMs and DEGs were plotted in clustered heatmaps (Figure 6A). The nine-quadrant plot results showed 3,437 genes with |PCC| ≥ 0.8, and 99 metabolites were identified in the third and seventh quadrants (Figure 6B). Among these genes, 87 flower-related DEGs were identified with 14 metabolites in the third quadrant (Table S11). The correlation analysis results further showed that 125 plant–pathogen interaction-related genes had strong positive correlation coefficients (P < 0.05) with 14 metabolites (Table S12). The relative abundance levels of nine highly-accumulated OEGA metabolites were highly correlated with 23 plant hormone signal transduction-related genes (Table S13).
Interaction networks between the DEGs and DAMs were organized based on the PCC results. Only the correlation pairs with a correlation coefficient > 0.8 were included in the analysis. The networks revealed three separated structures containing two major networks and one small network (Figure 8), where the cluster I network included three nucleotides and their derivatives (cytosine, guanine, and xanthine), three amino acids and their derivatives (histamine, N-acetyl-L-threonine, and L-alanyl-L-phenylalanine), five alkaloids (betaine, N-acetylputrescine, nicotinic acid methyl ester (methyl nicotinate), 5-hydroxyindole-3-acetic acid, and citpressine I), and three organic acids (N-methyl-4-aminobutyric acid, 2-hydroxyisocaproic acid, and muconic acid) (Figure 8A). A large number of flower development-related genes in the DEGs were positively correlated with the 14 above-mentioned metabolites, such as the upregulated genes FOREVER YOUNG FLOWER (FYF; Cg9g026060), EARLY FLOWERING BY OVEREXPRESSION 2 (EFO2; Cg9g026670), ANTHESIS POMOTING FACTOR 1 (APRF1; Cg3g000600 and Cg3g000520), and ANTHESIS POMOTING FACTOR 1 (COL4; Cg4g000940) and downregulated genes EARLY FLOWERING 3-like (ELF3; Cg1g009190), ANTHESIS POMOTING FACTOR 1 (APRF1; Cg3g000660 and Cg3g000700), and EARLY FLOWERING 1 (ELF1; Cg9g019180) (Table S11). The cluster II network included three organic acids (N-methyl-4-aminobutyric acid, muconic acid, and 6-aminocaproic acid), three nucleotides and their derivatives (cytosine, guanine, and 8-hydroxyguanosine), two amino acids and their derivatives (L-valine and L-isoleucine), two lipids (punicic acid [9Z,11E,13Z-octadecatrienoic acid] and 9-hydroxy-10,12,15-octadecatrienoic acid), one lignan and coumarin (daphnetin), and one alkaloid (p-coumaroylputrescine) (Figure 8B). The upregulated genes serine/threonine-protein kinase SRK2 (SNRK2; Cg5g007250 and Cg1g008420), abscisic acid receptor PYR/PYL (PYL; Cg6g009750, Cg7g002520, and Cg9g028330), transcription factor TGA (TGA; Cg7g014690), and BRI1 kinase inhibitor 1 (BKI1; Cg3g021510) in the plant hormone signal transduction pathway were positively correlated with the accumulation of cytosine (mws0255), N-methyl-4-aminobutyric acid (mws2628), muconic acid (pme3207), and guanine (pme1109). The downregulated genes auxin response factor (ARF; Cg3g001600 and Cg3g023780), protein brassinosteroid insensitive 1 (BRI1; Cg4g017350, Cg5g010750, and Cg4g009960), ethylene-responsive transcription factor 1 (ERF1; Cg5g034050, Cg5g034060, and Cg9g007900), BR-signaling kinase (BSK; Cg6g005880), auxin responsive GH3 gene family (GH3; Cg8g003480, Cg8g003450, and Cg2g022740), ethylene receptor (ETR; Cg9g007590), ABA responsive element binding factor (ABF; Cg9g018990), ethylene-insensitive protein 3 (EIN3; Cg7g015130), protein phosphatase 2C (PP2C; Cg8g023080, Cg9g028610, and CgUng003480), and xyloglucosyl transferase TCH4 (TCH4; Cg4g022140 and CgUng021670) in the plant hormone signal transduction pathway were positively correlated with the accumulation levels of L-valine (mws0256), 6-aminocaproic acid (pme0274), L-isoleucine (mws0258), daphnetin (mws1074), p-coumaroylputrescine (pmb0490), punicic acid (9Z,11E,13Z-octadecatrienoic acid) (pmb0889), 9-hydroxy-10,12,15-octadecatrienoic acid (pmb2786), and 8-hydroxyguanosine (mws0724) (Figure 8B). The cluster III network included two organic acids (N-methyl-4-aminobutyric acid and muconic acid) and two nucleotides and derivatives (thymine and guanine). These four metabolites were highly accumulated in the OEGA group (Table S9). The plant pathogen resistance-related genes senescence-induced receptor-like serine/threonine-protein kinase (FRK1; Cg1g013440 and Cg1g013460), disease resistance protein RPS4 (RPS4; Cg2g016980 and Cg5g025850), heat shock protein 90kDa beta (HSP90B; Cg3g024200, Cg4g013030, and Cg9g027520), ethylene-1,4-beta-xylanase (EIX; Cg8g013480), RPM1-interacting protein 4 (RIN4; Cg9g015710, Cg9g016020, and Cg9g016030), and WRKY transcription factor 29 (WRKY29; Cg2g038590) were positively correlated with the content of N-methyl-4-aminobutyric acid, thymine (mws0251), muconic acid, and guanine (Figure 8C). The resulting network map indicated that CcGASA4 could regulate the co-expression of DEGs and DAMs associated with plant–pathogen interactions and plant hormone signal transduction.
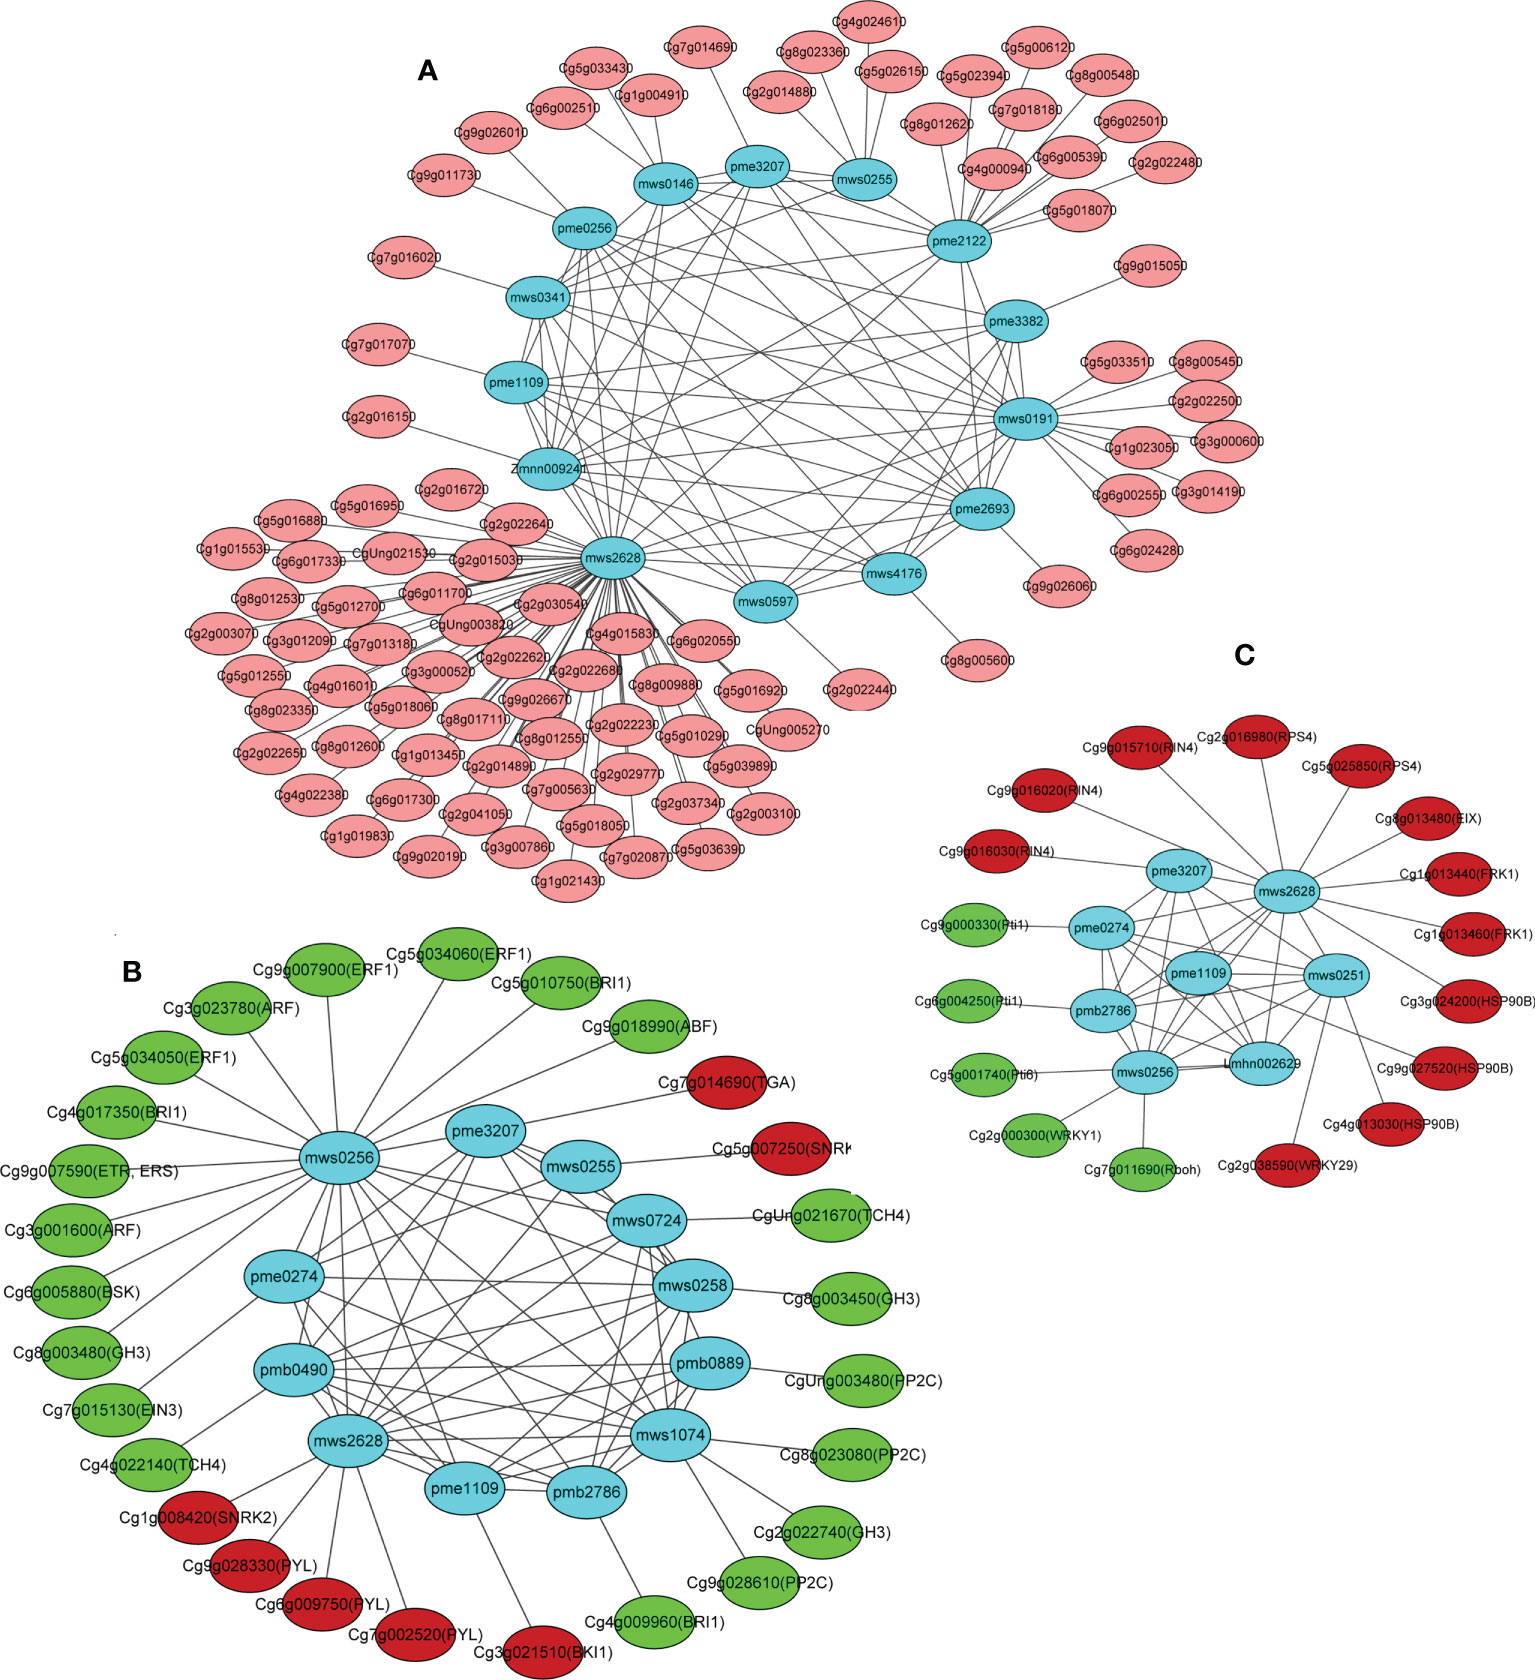
Figure 8 Pearson’s correlation network model diagram of the DEGs and DAMs.(A) Cluster I network represents differentially expressed genes and metabolites associated with flowers. (B) Cluster II network represents plant hormone signal transduction pathway related DEGs and DAMs. (C) Cluster III network represents plant pathogen resistance-related DEGs and DAMs. Each blue node (circle) represents a metabolite. Significant metabolite–metabolite and gene–metabolite connections are represented by the edges (lines). A network graph was constructed using the correlation data for the CON and OEGA metabolites. Nodes without connections to other nodes were deleted. Red (or pink) and green colors represent up- or downregulation in the CON vs. OEGA groups, respectively.
Discussion
The accumulation of secondary metabolites in plants is not only affected by external environmental factors, such as temperature, light, and metal ions (Ramakrishna and Ravishankar, 2011), but also by plant genetic factors. In terms of the functions of GASA genes, recent studies on various monocotyledonous and dicotyledonous plant species have assessed the model plants rice and Arabidopsis, respectively (Nahirñak et al., 2012). To date, few functional studies on the GASA family have been conducted in fruit trees to explore the function of GASA genes using integrated transcriptomic and metabolomic analyses. We therefore used the previously-cloned CcGASA4 gene to develop OEGA lines and study the effects of CcGASA4 on the intrinsic metabolism and transcription of pomelo trees.
Flavonoids comprise a large class of ubiquitous and versatile secondary metabolites that are synthesized through a branch of the phenylpropanoid metabolic pathway in plants (Lewis et al., 2011). Flavonoids have diverse functions, including defense against phytopathogens, protection against UV light damage and oxidative stress, and the regulation of auxin transport and allelopathy (Lewis et al., 2011). Our metabolomic data suggest that the total flavonoid content in the CON group was higher than that in the OEGA, which may have been due to the decreased synthesis of phenylalanine in OEGA. Chorismate is a common precursor for the downstream synthesis of L-tryptophan, phenylalanine, and tyrosine. We found an increased accumulation of L-tryptophan and decreased accumulation of L-tyrosine and L-phenylalanine, which suggested a stronger metabolic flow to the L-tryptophan biosynthesis branch. The expression levels of the chorismate mutase-encoding gene Cg4g001420, which is a key enzyme that controls the biosynthesis of the phenylalanine and tyrosine branches, were significantly downregulated in OEGA. Therefore, the overexpression of CcGASA4 decreased the precursor supply for flavonoid biosynthesis by varying the substrate distribution in the aromatic amino acid biosynthetic pathway.
Previous studies have mainly focused on the transcriptional regulation of flavonoid metabolism. Flavonoids are regulated by various transcription factors from the R2R3-MYB family, such as VvMYB4 in grapevines (Pérez-Díaz et al., 2015), AtMYB7 in Arabidopsis thaliana (Fornalé et al., 2014), FaMYB1 in strawberries (Aharoni et al., 2010), and CmMYB8 in chrysanthemums (Zhu et al., 2020). The overexpression of CcGASA4 was accompanied by a reduced abundance of transcripts generated from the phenylpropanoid pathway genes aroF, aroD, aroE, PAL, TAT, and 4CL, suggesting that CcGASA4 is an inhibiting factor in flavonoid synthesis. Decreased phenylpropanoid pathway genes were a major cause of the decreased tissue content of several flavonoid compounds, including rutin, quercetin, trifolin, vitexin, and rhoifolin, in the CcGASA4-overexpressing plants. Similar results have been reported in other species. For example, the overexpression of CmMYB8 has been found to result in significantly-reduced flavonoid and lignin contents in transgenic chrysanthemums (Zhu et al., 2020). DETF (TRINITY_DN130563_c0_g3) has high homology with CmMYB8 in chrysanthemums, and its expression levels have been found to be the opposite of its accumulation in flavonoids (Zou et al., 2021). Therefore, we speculate that the functional role of CcGASA4 is similar to that of these transcription factors and potentially inhibits the biosynthesis of flavonoids in Shatian pomelo.
Glycosylation, which is a typical modification of flavonoids, usually alters the stability, solubility, and activity of flavonoids and facilitates their transport to the vacuole for long-term storage (Bowles et al., 2006). There were 16 significantly-enriched flavonoids in the OEGA plants, eight of which existed in the form of glucosides. The attachment of sugar groups to flavonoid or isoflavonoid compounds is catalyzed by members of large families of enzymes, such as uridine diphosphate glycosyltransferases (UGTs) (Bowles et al., 2006). Our data showed that the UGT72Es Cg1g003710 and Cg1g003720 were upregulated by 7.305- and 2.878-fold, respectively, compared to those in the CON plants. This indicates that the high accumulation of these glycosylated flavonoids may be caused by the upregulation of UGT72E in CcGASA4-overexpressing plants. However, the regulatory mechanisms of action of CcGASA4 in flavonoid biosynthesis require further investigation.
Among the DAMs in the OEGA plants, the flavonoid metabolite dihydrokaempferol-7-O-glucoside was the most significantly altered. Dihydrokaempferol-7-O-glucoside exhibits flower-promoting activity (Nakanishi et al., 1995) and may participate in fruit development in Osage orange fruits (Tian et al., 2006). The co-enrichment network showed that many flower-related genes were induced by CcGASA4 (Figure 8A). Our previous study found that CcGASA4 is mainly expressed in citrus flowers (Wu et al., 2020) and that the CcGASA4 promoter regulates the expression of the GUS gene in Arabidopsis flowers (data not published). CcGASA4 may therefore promote flower development by regulating the expression of various flower-related genes and accumulation of dihydrokaempferol-7-O-glucoside.
The overexpression of CcGASA4 further reduced the tissue content of free fatty acids, lyso-phosphatidylethanolamine, lysophosphatidylcholine, and glycerol ester. It also led to the downregulation of many genes encoding components of lipid synthesis. CcGASA4 may therefore regulate lipid synthesis. Lipids are the core components of plant cell membranes and provide structural integrity and energy for various metabolic processes (Fischer et al., 2004). Sub-cellular experiments have demonstrated that CcGASA4 is restricted to the nucleus and plasma membrane (Wu et al., 2020), which suggests that CcGASA4 may utilize lipids in large quantities and result in lower lipid levels in cells.
The transcriptome data also showed that a large number of DEGs were enriched in the plasma membrane-bound cell projections. GO enrichment analysis showed that the DEGs were also significantly enriched in hormone metabolic processes, responses to SA, and responses to ABA (Figure 2A). This indicates that CcGASA4 may have various biological functions on the cell membrane and is likely to be involved in multiple hormone signaling pathways. This is consistent with our previous findings, which showed that CcGASA4 localizesd to the nucleus and plasma membrane, and respondsed to exogenous hormones (Wu et al., 2020). Additionally, several auxin signaling pathway genes, such as ARF and GH3, were significantly downregulated in the OEGA group (Figure 8C). The auxin signaling pathway regulates cell enlargement (Cleland, 1971). BRI1, BSK, and TCH4 were also significantly downregulated and are downstream of the BR signaling pathway, which can promote plant cell elongation. In contrast, BKI1, which exerts antagonistic effects with BRI1, was significantly upregulated (Figure 8C). We further observed that the cytokinin metabolic pathway regulated cell division and shoot initiation. The CRE1 gene, which is located downstream of this pathway, was significantly upregulated. Additionally, we found that the expression of GID2 was upregulated (Figure 8C) and that this gene is an inhibitor of the downstream DELLA gene in the gibberellin signaling pathway that promotes stem elongation. This evidence suggests that CcGASA4 promotes cell division and inhibits cell enlargement, elongation, and stem elongation. We also observed the downregulated expression of ETR, EIN3, and ERF1/2 in the downstream regulatory pathway of ethylene, which promotes fruit ripening and senescence (Figure 8C). ABA can promote stomatal closure and seed dormancy through signaling, whereas the expression of ABF, which is located downstream of this signaling pathway, was significantly inhibited (Figure 8C). This indicates that GASA4 may also inhibit fruit senescence and ripening. It has further reported that FaGAST, which is a member of the GASA family in strawberries, can arrest cell elongation during fruit ripening. Ectopic expression of FaGAST from Fragaria vesca in Arabidopsis thaliana has been found to delay the growth rate and reduce the sizes of the fruits (de la Fuente et al., 2006).
In the current study, we found that the OEGA plants had higher expression levels of disease resistance-related genes than the CON plants did. Several resistance-related genes, including FRK1 (Cg1g013440 and Cg1g013460), RIN4 (Cg9g015710 and Cg9g016020), HSP90 (Cg3g024200), and RPS4 (Cg2g016980 and Cg5g025850), were identified as DEGs. Of the 25 OEGA-specific accumulated metabolites, 10 (six flavonoids, one alkaloid, one terpenoid, one organic acid, and one other) were involved in disease resistance (Table 1). The functions of these metabolites are as follows: luteolin-4’-O-glucoside and skullcapflavone II have anti-inflammatory properties; acacetin-7-O-galactoside, kokusaginine, and betulin have anti-cancer properties; 2,3-dihydroxybenzoic acid can inhibit cancer cell growth in vitro and has antioxidant properties; taxifolin-3’-O-glucoside participates in the treatment of BPH; 5-hydroxy-6,7,8,3’,4’-pentamethoxyflavone is involved in anti-basophilic leukemia in rats; 5-hydroxy-6,7,3’,4’-tetramethoxyflavone protects hepatocytes; and ribitol participates in abiotic reactions. In addition, the flavonoid 3’,4’,7-trihydroxyflavone can not only prevent apoptotic cell death in neuronal cells from hydrogen peroxide-induced oxidative stress, but also has antibacterial properties (Kwon et al., 2015; Dzotam et al., 2018). The flavonoids acacetin-7-O-glucoside and 1,3,7-trimethoxyxanthone also have antibacterial properties (Matsushima et al., 1985; Shen et al., 2004). Through the association analysis (Figure S5), seven genes related to disease resistance were found to be significantly associated with these disease-resistant metabolites. Therefore, the high expression of disease resistance-related genes in the OEGA plants and the higher content of flavonoids and other metabolites may improve the disease resistance of transgenic plants.
Conclusions
In this study, we investigated the positive role of CcGASA4 in citrus plants. Novel regulatory and functional candidates in plant–pathogen interactions, plant hormone signal transduction, and flavonoid and flavonol metabolism were successfully identified through comparative transcriptional and metabolic analyses. Our findings confirm that CcGASA4, which is a GASA family gene in Citrus, inhibits the synthesis of lignin and flavonoids and may play a role in plant–pathogen interactions, inhibiting growth, and affecting flowering development. Future studies should test the effects of CcGASA4 on resistance to bacterial and fungal infections and on the growth and development of citrus plants, all of which comprise traits that are important for increasing the yield of Citrus.
Data availability statement
The datasets presented in this study can be found in online repositories. The name of the repository and accession number can be found below: BioProject, accession number PRJNA884542.
Author contributions
TW conducted the experiments and wrote the manuscript. KL revised the manuscript. MC helped perform qRT-PCR. QG helped to adjust the picture format. BJ completed the logical revision of some contents. YZ provided guidance throughout the study. All authors contributed to the article and approved the submitted version.
Funding
This research was financially supported by the Key-Area Research and Development Program of Guangdong Province (2022B0202070002), Guangdong Provincial Science and Technology Special Project in 2021 (210907114532092), National Natural Sciences Foundation of China (32002016), and Guangdong Provincial Special Fund for Modern Agriculture Industry Technology Innovation Special Teams (2022KJ108).
Acknowledgments
The authors thank Dr. Yanyan Ma and Dr. Chunzhen Cheng for their support with the experiments.
Conflict of interest
The authors declare that the research was conducted in the absence of any commercial or financial relationships that could be construed as a potential conflict of interest.
Publisher’s note
All claims expressed in this article are solely those of the authors and do not necessarily represent those of their affiliated organizations, or those of the publisher, the editors and the reviewers. Any product that may be evaluated in this article, or claim that may be made by its manufacturer, is not guaranteed or endorsed by the publisher.
Supplementary material
The Supplementary Material for this article can be found online at: https://www.frontiersin.org/articles/10.3389/fpls.2022.1022961/full#supplementary-material
References
Aharoni, A., De Vos, C. H., Wein, M., Sun, Z. K., Greco, R., Kroon, A., et al. (2010). The strawberry FaMYB1 transcription factor suppresses anthocyanin and flavonol accumulation in transgenic tobacco. Plant J. 28, 319–332. doi: 10.1046/j.1365-313X.2001.01154.x
Almaghamsi, A., Nosarzewski, M., Kanayama, Y., Archbold, D. D. (2020). Effects of abiotic stresses on sorbitol biosynthesis and metabolism in tomato (Solanum lycopersicum). Funct. Plant Biol. 48 (3), 286–297. doi: 10.1071/FP20065
Alonso-Ramírez, A., Rodríguez, D., Reyes, D., Jiménez, J. A., Nicolás, G., López-Climent, M., et al. (2009). Evidence for a role of gibberellins in salicylic acid-modulated early plant responses to abiotic stress in arabidopsis seeds. Plant Physiol. 150 (3), 1335–1344. doi: 10.1104/pp.109.139352
Ashburner, M., Ball, C. A., Blake, J. A., Botstein, D., Michael Cherry, J. (2000). Gene ontology: tool for the unification of biology. the gene ontology consortium. Nat. Genet. 25 (1), 25–29. doi: 10.1038/75556
Aubert, D., Chevillard, M., Dorne, A. M., Arlaud, G., Herzog, M. (1998). Expression patterns of GASA genes in Arabidopsis thaliana: the GASA4 gene is up-regulated by gibberellins in meristematic regions. Plant Mol. Biol. 36 (6), 871–883. doi: 10.1023/A:1005938624418
Berrocal-Lobo, M., Segura, A., Moreno, M., López, G., García-Olmedo, F., Molina, A. (2002). Snakin-2, an antimicrobial peptide from potato whose gene is locally induced by wounding and responds to pathogen infection. Plant Physiol. 128 (3), 951–961. doi: 10.1104/pp.010685
Bindschedler, L. V., Whitelegge, J. P., Millar, D. J., Bolwell, G. P. (2006). A two component chitin-binding protein from French bean – association of a proline-rich protein with a cysteine-rich polypeptide. FEBS Letters. 580 (6), 1541–1546. doi: 10.1016/j.febslet.2006.01.079
Bowles, D., Lim, E. K., Poppenberger, B., Vaistij, F. E. (2006). Glycosyltransferases of lipophilic small molecules. Annu. Rev. Plant Biol. 57 (1), 567–597. doi: 10.1146/annurev.arplant.57.032905.105429
Buchanan, B. B., Balmer, Y. (2005). Redox regulation: a broadening horizon. Annu. Rev. Plant Biol. 56 (1), 187–220. doi: 10.1146/annurev.arplant.56.032604.144246
Bui, T. T., Piao, C. H., Song, C. H., Chai, O. H. (2017). Skullcapflavone ii attenuates ovalbumin-induced allergic rhinitis through the blocking of th2 cytokine production and mast cell histamine release. Int. Immunopharmacol. 52, 77–84. doi: 10.1016/j.intimp.2017.08.029
Casabuono, A. C., Pomillo, A. B. (1994). Lignans and a stilbene from Festuca argentina. Phytochemistry 35 (2), 479–483. doi: 10.1016/S0031-9422(00)94786-1
Chen, I. C., Lee, S. C., Pan, S. M., Hsieh, H. L. (2007). GASA4, a GA-stimulated gene, participates in light signaling in arabidopsis. Plant Sci. 172 (6), 1062–1071. doi: 10.1016/j.plantsci.2007.03.012
Chen, H., Li, S. G., Wang, S. B., Li, W. P., Bao, N., Ai, W. B. (2018). The inhibitory effect of kokusaginine on the growth of human breast cancer cells and MDR-resistant cells is mediated by the inhibition of tubulin assembly. Bioorg. Med. Chem. Lett. 28 (14), 2490–2492. doi: 10.1016/j.bmcl.2018.05.059
Cleland, R. (1971). Cell wall extension. Annu. Rev. Plant Physiol. 22 (1), 197–222. doi: 10.1146/annurev.pp.22.060171.001213
de la Fuente, J. I., Amaya, I., Castillejo, C., Sánchez-Sevilla, J. F., Quesada, M. A., Botella, M. A., et al. (2006). The strawberry gene FaGAST affects plant growth through inhibition of cell elongation. J. Exp. Bot. 57 (10), 2401–2411. doi: 10.1093/jxb/erj213
Dzotam, J. K., Simo, I. K., Bitchagno, G., Celik, I., Sandjo, L. P., Tane, P., et al. (2018). In vitro antibacterial and antibiotic modifying activity of crude extract, fractions and 3',4',7-trihydroxyflavone from myristica fragrans houtt against MDR gram-negative enteric bacteria. BMC Complem. Altern. M. 18 (1), 15. doi: 10.1186/s12906-018-2084-1
Fischer, U., Men, S., Grebe, M. (2004). Lipid function in plant cell polarity. Curr. Opin. Plant Biol. 7 (6), 670–676. doi: 10.1016/j.pbi.2004.09.007
Fornalé, S., Lopez, E., Salazarhenao, J. E., Fernándeznohales, P., Rigau, J., Caparrosruiz, D. (2014). AtMYB7, a new player in the regulation of UV-sunscreens in Arabidopsis thaliana. Plant Cell Physiol. 55, 507–516. doi: 10.1093/pcp/pct187
Fouche, G., Maharaj, V. J., Mthembu, X., Ackerman, L., Van Der, M. M. (2015). Management and treatment of benign prostatic hyperplasia (US).
Furukawa, T., Sakaguchi, N., Shimada, H. (2006). Two OsGASR genes, rice GAST homologue genes that are abundant in proliferating tissues, show different expression patterns in developing panicles. Genes Genet. Syst. 81 (3), 171–180. doi: 10.1266/ggs.81.171
Hatano, T., Yasuhara, T., Fukuda, T., Noro, T., Okuda, T. (1989). Phenolic constituents of licorice. II. structures of licopyranocoumarin, licoarylcoumarin and glisoflavone, and inhibitory effects of licorice phenolics on xanthine oxidase. Chem. Pharm. Bull. 37 (11), 3005–3009. doi: 10.1248/cpb.37.3005
Hu, C. Q., Chen, K., Shi, Q., Kilkuskie, R. E., Cheng, Y. C., Lee, K. H. (1994). Anti-AIDS agents, 10. acacetin-7-O-β-D-galactopyranoside, an anti-HIV principle from chrysanthemum morifolium and a structure-activity correlation with some related flavonoids. J. Nat. Prod. 57 (1), 42–51. doi: 10.1021/np50103a006
Jang, H. Y., Ahn, K. S., Park, M. J., Kwon, O. K., Lee, H. K., Oh, S. R. (2012). Skullcapflavone ii inhibits ovalbumin-induced airway inflammation in a mouse model of asthma. Int. Immunopharmacol. 12 (4), 666–674. doi: 10.1016/j.intimp.2012.01.010
Kanehisa, M., Araki, M., Goto, S., Hattori, M., Hirakawa, M., Itoh, M., et al. (2007). KEGG for linking genomes to life and the environment. Nucleic Acids Res. 36, 480–484. doi: 10.1093/nar/gkm882
Kanehisa, M., Goto, S. (2000). KEGG: kyoto encyclopedia of genes and genomes. Nucleic Acids Res. 28 (1), 27–30. doi: 10.1093/nar/28.1.27
Kim, D., Langmead, B., Salzberg, S. L. (2015). HISAT: a fast spliced aligner with low memory requirements. Nat. Methods 12 (4), 357–360. doi: 10.1038/nmeth.3317
Kotilainen, M., Helariutta, Y., Mehto, M., Pöllänen, E., Albert, V. A., Elomaa, P., et al. (1999). GEG participates in the regulation of cell and organ shape during corolla and carpel development in Gerbera hybrida. Plant Cell. 11 (6), 1093–1104. doi: 10.1105/tpc.11.6.1093
Ko, C. B., Woo, Y. M., Lee, D. J., Lee, M. C., Kim, C. S. (2007). Enhanced tolerance to heat stress in transgenic plants expressing the GASA4 gene. Plant Physiol. Bioch. 45 (9), 722–728. doi: 10.1016/j.plaphy.2007.07.010
Kutkowska, J., Strzadala, L., Rapak, A. (2020). Hypoxia increases the apoptotic response to betulinic acid and betulin in human non-small cell lung cancer cells. Chem.-Biol. Interact. 333, 109320. doi: 10.1016/j.cbi.2020.109320
Kwon, S. H., Hong, S. I., Ma, S. X., Lee, S. Y., Jang, C. G. (2015). 3′,4′,7-trihydroxyflavone prevents apoptotic cell death in neuronal cells from hydrogen peroxide-induced oxidative stress. Food Chem. Toxicol. 80, 41–51. doi: 10.1016/j.fct.2015.02.014
Lewis, D. R., Ramirez, M. V., Miller, N. D., Prashanthi, V. W., Keith, R., Helm, R. F., et al. (2011). Auxin and ethylene induce flavonol accumulation through distinct transcriptional networks. Plant Physiol. 156, 144–164. doi: 10.1104/pp.111.172502
Li, K. L., Bai, X., Li, Y., Cai, H., Ji, W., Tang, L. L., et al. (2011). GsGASA1 mediated root growth inhibition in response to chronic cold stress is marked by the accumulation of DELLAs. J. Plant Physiol. 168 (18), 2153–2160. doi: 10.1016/j.jplph.2011.07.006
Lim, E. K., Mitchell, P. J., Brown, N., Drummond, R. A., Brown, G. D., Kaye, P. M., et al. (2013). Regiospecific methylation of a dietary flavonoid scaffold selectively enhances IL-1β production following toll-like receptor 2 stimulation in THP-1 monocytes. J. Biol. Chem. 288 (29), 21126–21135. doi: 10.1074/jbc.M113.453514
Lin, Y., Liu, P. G., Liang, W. Q., Hu, Y. J., Xu, P., Zhou, J., et al. (2018). Luteolin-4′- o -glucoside and its aglycone, two major flavones of Gnaphalium affine d. don, resist hyperuricemia and acute gouty arthritis activity in animal models. Phytomedicine 41, 54–61. doi: 10.1016/j.phymed.2018.02.002
Matsushima, T., Araki, A., Yagame, O., Muramatsu, M., Koyama, K., Ohsawa, K., et al. (1985). Mutagenicities of xanthone derivatives in Salmonella typhimurium TA100, TA98, TA97, and TA2637. Mutat. Res.-Fund. Mol. M. 150 (1-2), 141–146. doi: 10.1016/0027-5107(85)90111-3
Molnár, J., Ocsovszki, I., Puskás, L., Ghane, T., Hohmann, J., Zupkó, I. (2013). Investigation of the antiproliferative action of the quinoline alkaloids kokusaginine and skimmianine on human cell lines. Curr. Signal Transd. T. 8 (2), 148–155. doi: 10.2174/15743624113086660006
Muhammad, I., Li, W. Q., Jing, X. Q., Zhou, M. R., Shalmani, A., Ali, M., et al. (2019). A systematic in silico prediction of gibberellic acid stimulated GASA family members: A novel small peptide contributes to floral architecture and transcriptomic changes induced by external stimuli in rice. J. Plant Physiol. 234–235, 117–132. doi: 10.1016/j.jplph.2019.02.005
Nahirñak, V., Almasia, N. I., Hopp, H. E., Vazquez-Rovere, C. (2012). Snakin/GASA proteins: involvement in hormone crosstalk and redox homeostasis. Plant Signal. Behav. 7 (8), 1004–1008. doi: 10.4161/psb.20813
Nakanishi, F., Kusumi, T., Inoue, Y., Fujii, T. (1995). Dihydrokaempferol glucoside from cotyledons promotes flowering in pharbitis nil. Plant Cell Physiol. 36 (7), 1303–1309. doi: 10.1093/oxfordjournals.pcp.a078890
Nam, J. Y., Lee, H. S., Lee, S. W., Chung, M. Y., Kim, Y. K. (2005). Effect of kikkanol f monoacetate and 5-hydroxy-6,7,3′,4′-tetramethoxyflavone isolated from chrysanthemum indicum l. @ on IL-6 production. Korean J. Pharmacognosy 36 (3), 186–190.
Peng, J., Lai, L., Wang, X. (2010). Temporal and spatial expression analysis of PRGL in Gerbera hybrida. Mol. Biol. Rep. 37 (7), 3311–3317. doi: 10.1007/s11033-009-9917-4
Pérez-Díaz, J. R., Pérez-Díaz, J., Madrid-Espinoza, J., González-Villanueva, E., Moreno, Y., Ruiz-Lara, S. (2015). New member of the R2R3-MYB transcription factors family in grapevine suppresses the anthocyanin accumulation in the flowers of transgenic tobacco. Plant Mol. Biol. 90, 63–76. doi: 10.1007/s11103-015-0394-y
Qu, J., Kang, S. G., Hah, C., Jang, J. C. (2016). Molecular and cellular characterization of GA-stimulated transcripts GASA4 and GASA6 in Arabidopsis thaliana. Plant Sci. 246, 1–10. doi: 10.1016/j.plantsci.2016.01.009
Ramakrishna, A., Ravishankar, G. A. (2011). Influence of abiotic stress signals on secondary metabolites in plants. Plant Signal. Behav. 6, 1720–1731. doi: 10.4161/psb.6.11.17613
Rubinovich, L., Ruthstein, S., Weiss, D. (2014). The Arabidopsis cysteine-rich GASA5 is a redox-active metalloprotein that suppresses gibberellin responses. Mol. Plant 7 (1), 244–247. doi: 10.1093/mp/sst141
Rubinovich, L., Weiss, D. (2010). The Arabidopsis cysteine-rich protein GASA4 promotes GA responses and exhibits redox activity in bacteria and in planta. Plant J. 64 (6), 1018–1027. doi: 10.1111/j.1365-313X.2010.04390.x
Sankaranarayanan, R., Kumar, D. R., Patel, J., Bhat, G. J. (2020). Do aspirin and flavonoids prevent cancer through a common mechanism involving hydroxybenzoic acids? - the metabolite hypothesis. Molecules 25 (9), 2243. doi: 10.3390/molecules25092243
Segura, A., Moreno, M., Madueňo, F., Molina, A., García-Olmedo, F. (1999). Snakin-1, a peptide from potato that is active against plant pathogens. Mol. Plant Microbe In. 12 (1), 16–23. doi: 10.1094/MPMI.1999.12.1.16
Shen, J., Liang, J., Peng, S. L., Ding, L. S. (2004). Chemical constituents from saussurea stella. Natural Product Res. Dev. 16 (5), 391–394. doi: 10.16333/j.1001-6880.2004.05.004
Shi, L., Gast, R. T., Gopalraj, M., Olszewski, N. E. (1992). Characterization of a shoot-specific, GA3- and ABA-regulated gene from tomato. Plant J. 2 (2), 153–159. doi: 10.1111/j.1365-313X.1992.00153.x
Slimestad, R., Francis, G. W., Andersen, Ø.M. (1999). Directed search for plant constituents: a case study concerning flavonoids in Norway spruce. Euphytica 105, 119–123. doi: 10.1023/A:1003473612531
Spiegel, M., Kapusta, K., Koodziejczyk, W., Saloni, J., Bikowska, B., Hill, G. A., et al. (2020). Antioxidant activity of selected phenolic acids-ferric reducing antioxidant power assay and QSAR analysis of the structural features. Molecules 25 (13), 3088. doi: 10.3390/molecules25133088
Sun, S. L., Wang, H. X., Yu, H. M., Zhong, C. M., Zhang, X. X., Peng, J. Z., et al. (2013). GASA14 regulates leaf expansion and abiotic stress resistance by modulating reactive oxygen species accumulation. J. Exp. Bot. 64 (6), 1637–1647. doi: 10.1093/jxb/ert021
Tian, L., Blount, J. W., Dixon, R. A. (2006). Phenylpropanoid glycosyltransferases from osage orange (Maclura pomifera) fruit. FEBS Lett. 580 (30), 6915–6920. doi: 10.1016/j.febslet.2006.11.056
Trapalis, M., Li, S. F., Parish, R. W. (2017). The arabidopsis GASA10 gene encodes a cell wall protein strongly expressed in developing anthers and seeds. Plant Sci. 260, 71–79. doi: 10.1016/j.plantsci.2017.04.003
Wang, F. Y., Huang, Y. J., Wu, W., Zhu, C. Y., Zhang, R. M., Chen, J. Z., et al. (2020). Metabolomics analysis of the peels of different colored citrus fruits (Citrus reticulata cv. ‘Shatangju’) during the maturation period based on UHPLC-QQQ-MS. Mol 25 (2), 396. doi: 10.3390/molecules25020396
Wang, L., Wang, S., Li, W. (2015). RSeQC: quality control of RNA-seq experiments. Bioinformatics 28 (16), 2184–2185. doi: 10.1093/bioinformatics/bts356
Wang, L., Wang, Z., Xu, Y. Y., Joo, S. H., Kim, S. K., Xue, Z., et al. (2009). OsGSR1 is involved in crosstalk between gibberellins and brassinosteroids in rice. Plant J. 57 (3), 498–510. doi: 10.1111/j.1365-313X.2008.03707.x
Watanabe, J., Shinmoto, H., Tsushida, T. (2005). Coumarin and flavone derivatives from estragon and thyme as inhibitors of chemical mediator release from RBL-2H3 cells. Biosci. Biotech. Bioch. 69 (1), 1–6. doi: 10.1271/bbb.69.1
Wigoda, N., Ben-Nissan, G., Granot, D., Schwartz, A., Weiss, D. (2006). The gibberellin-induced, cysteine-rich protein GIP2 from Petunia hybrida exhibits in planta antioxidant activity. Plant J. 48 (5), 796–805. doi: 10.1111/j.1365-313X.2006.02917.x
Wu, T. L., Cheng, C. Z., Zhong, Y., Lv, Y. D., Ma, Y. Y., Zhong, G. Y. (2020). Molecular characterization of the gibberellin-stimulated transcript of GASA4 in citrus. Plant Growth Regul. 91 (1), 89–99. doi: 10.1007/s10725-020-00589-1
Wu, T. L., Li, J., Zhang, Y. Y., Hu, M. L., Yan, H. X., Jiang, B., et al. (2015). Cloning and genetic transformation of Citrus subtilisin-like protease gene CcSubtilisin. J. Southwest Univ. (Natural Sci. Edition). 37 (7), 1–8. doi: 10.13718/j.cnki.xdzk.2015.07.009
Wu, T. L., Zhong, Y., Chen, M., Wu, B., Wang, T., Jiang, B., et al. (2021). Analysis of CcGASA family members in Citrus clementina (Hort. ex tan.) by a genome-wide approach. BMC Plant Biol. 21 (1), 565. doi: 10.1186/s12870-021-03326-6
Xu, Q., Chen, L. L., Ruan, X., Chen, D., Zhu, A., Chen, C., et al. (2013). The draft genome of sweet orange (citrus sinensis). Nat. Genet. 45 (1), 59–66. doi: 10.1038/ng.2472
Yang, J. F., Kwon, Y. S., Kim, M. J. (2018). Antimicrobial activity and active compounds of a Rhus verniciflua stokes extract. Z. Naturforsch. C. 73, 457–463. doi: 10.1515/znc-2018-0054
Ying, S. Y., Su, M., Wu, Y., Zhou, L., Fu, R., Li, Y., et al. (2020). Trichome regulator SlMIXTA-like directly manipulates primary metabolism in tomato fruit. Plant Biotechnol. J. 18 (2), 354–363. doi: 10.1111/pbi.13202
Zhang, S., Wang, X. (2008). Expression pattern of GASA, downstream genes of DELLA, in Arabidopsis. Chin. Sci. Bull. 53 (24), 3839–3846. doi: 10.1007/s11434-008-0525-9
Zhang, S., Wang, X. (2011). Overexpression of GASA5 increases the sensitivity of Arabidopsis to heat stress. J. Plant Physiol. 168 (17), 2093–2101. doi: 10.1016/j.jplph.2011.06.010
Zhang, S., Yang, C., Peng, J., Sun, S., Wang, X. (2009). GASA5, a regulator of flowering time and stem growth in Arabidopsis thaliana. Plant Mol. Biol. 69 (6), 745–759. doi: 10.1007/s11103-009-9452-7
Zhu, L., Guan, Y., Zhang, Z., Song, A., Chen, S., Jiang, J., et al. (2020). CmMYB8 encodes an R2R3 MYB transcription factor which represses lignin and flavonoid synthesis in chrysanthemum. Plant Physiol. Bioch. 149, 217–224. doi: 10.1016/j.plaphy.2020.02.010
Keywords: Citrus, gibberellin, CcGASA4, transcriptome, metabolome, hormone, plant–pathogen interaction
Citation: Wu T, Liu K, Chen M, Jiang B, Gong Q and Zhong Y (2022) Transcriptome and metabolome analyses of Shatian pomelo (Citrus grandis var. Shatinyu Hort) leaves provide insights into the overexpression of the gibberellin-induced gene CcGASA4. Front. Plant Sci. 13:1022961. doi: 10.3389/fpls.2022.1022961
Received: 19 August 2022; Accepted: 30 September 2022;
Published: 31 October 2022.
Edited by:
Pramod Prasad, Indian Institute of Wheat and Barley Research (ICAR), IndiaReviewed by:
Zhongxiong Lai, Fujian Agriculture and Forestry University, ChinaMuhammad Irfan, University of Sargodha, Pakistan
Rezwan Tariq, King Abdullah University of Science and Technology, Saudi Arabia
Copyright © 2022 Wu, Liu, Chen, Jiang, Gong and Zhong. This is an open-access article distributed under the terms of the Creative Commons Attribution License (CC BY). The use, distribution or reproduction in other forums is permitted, provided the original author(s) and the copyright owner(s) are credited and that the original publication in this journal is cited, in accordance with accepted academic practice. No use, distribution or reproduction is permitted which does not comply with these terms.
*Correspondence: Yun Zhong, emhvbmd5dW45OWNuQDE2My5jb20=