
94% of researchers rate our articles as excellent or good
Learn more about the work of our research integrity team to safeguard the quality of each article we publish.
Find out more
ORIGINAL RESEARCH article
Front. Plant Sci. , 07 October 2022
Sec. Crop and Product Physiology
Volume 13 - 2022 | https://doi.org/10.3389/fpls.2022.1021617
This article is part of the Research Topic Characterization of major traits and identification of functional genes for potato View all 13 articles
After anthocyanin synthesis, a variety of anthocyanin compounds are produced through further methylation, glycosylation, and acylation. However, the effect of the potato methylase gene on anthocyanin biosynthesis has not been reported. Red and purple mutation types appear in tubers of the potato cultivar ‘Purple Viking’ with chimeric skin phenotypes. In this study, transcriptome and anthocyanin metabolome analyses were performed on skin of Purple Viking tubers and associated mutants. According to the metabolome analysis, the transformation of delphinidin into malvidin-3-O-glucoside and petunidin 3-O-glucoside and that of cyanidin into rosinidin O-hexoside and peonidin-3-O-glucoside were hindered in red tubers. Expression of methyltransferase gene OMT30376 was significantly lower in red tubers than in purple ones, whereas the methylation level of OMT30376 was significantly higher in red tubers. In addition, red skin appeared in tubers from purple tuber plants treated with S-adenosylmethionine (SAM), indicating the difference between purple and red was caused by the methylation degree of the gene OMT30376. Thus, the results of the study suggest that the OMT30376 gene is involved in the transformation of anthocyanins in potato tubers. The results also provide an important reference to reveal the regulatory mechanisms of anthocyanin biosynthesis and transformation.
Potato (Solanum tuberosum L.) is the fourth largest crop after wheat, rice, and corn and is used as a grain, vegetable, feed, and industrial raw material. Pigmented potato is rich in anthocyanins, which give tuber skin and flesh color, including purple, blue, and red (Fossen and Andersen, 2000). Biosynthesis and accumulation of anthocyanins can increase plant resistance to different biological and abiotic stresses, such as low temperature, ultraviolet radiation, drought stress, and diseases (Liu et al., 2019). Anthocyanins also benefit human health because of strong antioxidant capacity (Heim et al., 2002; Khoo et al., 2017). The antioxidant capacity of pigmented potato tubers is three to five times that of yellow and white tubers (Brown, 2005). Consuming pigmented potatoes can also significantly reduce the incidence rate of prostate cancer and colon cancer (Reddivari et al., 2007).
Anthocyanins are synthesized through the flavonoid pathway, which includes both structural and regulatory genes. Structural genes encode enzymes that primarily catalyze the formation of anthocyanin through three main synthetic pathways, namely cyanidin, pelargonidin and delphinidin pathways (Liu et al., 2018). Further modification of anthocyanins, including methylation, glycosylation, and acylation of the three aglycones, can produce a variety of anthocyanin compounds and enhance color phenotypes. Those processes are catalyzed by anthocyanin O-methyltransferase (OMT), flavonoid 3-glucosyl transferase (3GT), and acyltransferase (AT), respectively (Rausher, 2008; Wessinger and Rausher, 2012). The tissue-specific expression of structural genes is mainly regulated by the transcription factors R2R3-MYB, basic helix-loop-helix (bHLH), WD-repeats (WDR), and the MYB-bHLH-WDR (MBW) complex (Hichri et al., 2011).
Gene methylation is the process of transferring an activated methyl from S-adenosylmethionine (SAM) to N-, C-, O- or s-nucleophiles of receptor molecules, which occur widely in plants and animals (Klimasauskas and Weinhold, 2007). Methylation is an epigenetic modification that can affect many biological processes, including growth and development of fruits (Ma et al., 2018; Guo et al., 2019) and anthocyanin biosynthesis (Jiang et al., 2020). The anthocyanin content of a yellow-skinned apple mutant was lower than that of its parent because of the higher methylation level of the MdMYB10 promoter (El-Sharkawy et al., 2015). Similar results are also observed in a red-bud apple (Xu et al., 2012). When the key regulatory gene in anthocyanin biosynthesis in red-fleshed radish, RsMYB1, is mutated because of a hypermethylated transposon sequence in the promoter, white-fleshed radish is produced. Methylation of the RsMYB1 promoter leads to a decrease in gene expression and affects the biosynthesis and accumulation of anthocyanin (Wang et al., 2020).
Most methyltransferases act on hydroxyl and carboxyl groups and are called O- methyltransferases (OMTs). The OMTs can catalyze specific substrates to produce a wide variety of anthocyanin compounds that enrich color phenotypes (Wessinger and Rausher, 2012). Several OMT genes involved in the formation of O-methylated anthocyanins have been previously reported (Sakata et al., 1995; Hugueney et al., 2009). Genetic analysis of anthocyanin biosynthesis in petunia shows that MT1/MT2 and MF1/MF2, two pairs of repetitive genes, are responsible for the methylation of anthocyanin molecules (Wiering and Devlaming, 1977). Owing to the action of OMTs, the content of anthocyanin components containing methoxyl and hydroxyl groups changes. In studies on tree peony petals, as the number of methoxyl groups increases, the transformation from red to purple also increases (Sakata et al., 1995). The red–purple-flowered cyclamen mutant appeared in purple-flowered cyclamen following ion-beam irradiation (Kondo et al., 2009), and the major anthocyanins in the petals of red–purple-flowers and purple-flowers were delphinidin 3, 5-diglucoside and malvidin 3, 5-diglucoside, respectively. In further research, CkmOMT2 catalysis of the 3′ or 3′5′ O-methylation of the B-ring of anthocyanin substrates was only detected in purple-flowered cyclamen, and not in the red–purple-flowered mutant. Therefore, defective CkmOMT2 gene expression was responsible for the change in anthocyanin composition and flower coloration in mutants (Kondo et al., 2009). Genes of O-methyltransferases are also found in purple-flowered (PsAOMT) and red-flowered (PtAMOT) paeonia plants. Owing to the difference of a single amino acid between PsAOMT and PtAMOT, there are significant differences in gene expression and enzyme activity, which ultimately affect the formation of purple (Du et al., 2015). Thus, previous results show that OMT genes have important roles in the transformation from red anthocyanin to purple anthocyanin. However, whether potato OMTs regulate tuber anthocyanin transformation remains unclear.
In the present study, the transcriptome and anthocyanin metabolic components of the potato cultivar Purple Viking and its red and purple mutant tubers were analyzed. The results showed that methylation level of the OMT30376 gene might affect anthocyanin transformation in tubers. The study will provide a theoretical basis to reveal the molecular mechanism regulating anthocyanin biosynthesis in potato tubers.
The potato (Solanum tuberosum L.) ‘Purple Viking’ and its mutants were grown in 24-cm-diameter plastic pots in a greenhouse with 16 h of light per day supplied by lamps. Three biological replicates were made for each material for subsequent anthocyanin content and transcriptome analysis. At 80 d after planting, tubers were harvested according to skin color. Skin (1 mm thick) of Purple Viking tubers (PurS), flesh of Purple Viking tubers (PurF), Skin (1 mm thick) of red mutant (M-R) and purple mutant (M-P) of Purple Viking were sampled respectively, and frozen immediately in liquid nitrogen and stored at -80°C until use.
Powder, 100mg, was extracted with 1.0 mL 70% aqueous methanol overnight at 4°C. Extracts were centrifuged at 10,000 ×g for 10 min and then filtrated (0.22-μm pore size). Samples were analyzed using an LC-ESI-MS/MS system (HPLC, Shim-pack UFLC SHIMADZU CBM30A system). The LC-ESI-MS/MS analysis was performed by Wuhan MetWare Biotechnology Co., Ltd., (www.mettware.cn). Metabolite content data were normalized by the range method, and accumulation patterns of metabolites among different samples were analyzed by the R package. Fold Change ≥ 2 and ≤ 0.5 were set as the threshold for significantly differential metabolites.
Total RNA was isolated using a PLANTpure Universal RNA Kit (Aidlab, Beijing, China) according to the manufacturer’s instructions, and then, post-treatment with a DNase Digestion Kit (Aidlab, Beijing, China) was used to remove genomic DNA contaminants. The mRNA was purified from total RNA with poly-T oligo-attached magnetic beads. First-strand cDNA was synthesized under elevated temperature in NEBNext first strand synthesis reaction buffer (5×) using random hexamer primers and M-MuLV Reverse Transcriptase. Second-strand cDNA synthesis was subsequently performed using RNase H and DNA Polymerase I. Library fragments were purified with an AMPure XP system (Beckman Coulter, Beverly, USA). Then, PCR was performed with Phusion High-Fidelity DNA polymerase, Universal PCR primers, and Index (X) Primer. The PCR products were purified (AMPure XP system), and library quality was assessed on an Agilent Bioanalyzer 2100 system. Library products were then sequenced via an Illumina HiSeqTM 2000 (San Diego, CA, USA).
Clean reads were obtained by removing adapters, and reads containing ploy-N and those of low-quality from raw reads. Simultaneously, Q20, Q30, GC content, and sequence duplication level of clean reads were calculated. Clean reads were then mapped to the potato DM reference genome (v4.03, http://spuddb.uga.edu/pgsc_download.shtml) with HISAT2 (v2.1.0, Kim et al., 2015). Gene function was annotated based on public databases, including the National Center for Biotechnology Information (NCBI) non-redundant protein sequences (NR) and Swiss-Prot (Apweiler et al., 2004), Protein family (Pfam) (Finn et al., 2014), Clusters of Orthologous Groups of proteins (COG) (Tatusov et al., 2000), eukaryotic Orthologous Groups of proteins (KOG) (Koonin et al., 2004), and Kyoto Encyclopedia of Genes and Genomes (KEGG) (Kanehisa et al., 2004) databases.
Fragments Per Kilobase of transcript per Million fragments mapped (FPKM) were used to estimate gene expression level. Differential gene expression among different samples was estimated by Cuffdiff (v2.0.0). Thresholds for significantly differential expression were false discovery rate (FDR) ≤ 0.05 and fold change ≥2. The KEGG pathways enrichment analysis of differentially expressed genes (DEGs) was performed by KOBAS software (Mao et al., 2005).
Isolation of RNA, reverse transcription, and reverse-transcription quantitative PCR (RT-qPCR) were conducted according to a previously method (Zhang et al., 2020). Primers were designed using the NCBI Primer-BLAST (https://www.ncbi.nlm.nih.gov/tools/primer-blast/) and are listed in Table 1. The RT-qPCR was performed on a CFX96™ real-time PCR system (Bio-Rad, USA) using a TransStart Top Green qPCR SuperMix kit (Transgen, Beijing, China). The potato gene Ef1α (GenBank: AB061263) was selected as the control. The relative expression of individual gene was calculated with the 2−ΔΔCT method (Livak and Schmittgen, 2001).
Methylation and demethylation treatments were applied. Potato M-P and M-R genotypes were induced to form tubers in MS medium containing 8% sucrose under a short-day photoperiod (8 h day/16 h night). In the methylation treatment, 30-µM S-adenosylmethionine (SAM) was added to sterilized MS medium, whereas in the demethylation treatment, 40-µM azacitidine (5-azaC) was added according to previous study (Ai et al., 2021). Water was used as the control. Thirty plantlets were used for each treatment. After 6 to 8 weeks, chimeric color of red and purple tubers (MPS) appeared in M-P plantlets cultured in the medium containing SAM. Three MPS tubers were planted separately to form three independent lines, named MPS-1, MPS-2, and MPS-3, respectively.
To detect methylation level, genomic DNA was isolated from leaves of M-P and M-R, red skin of Purple Viking tuber (Pur-R), purple skin of Purple Viking tuber (Pur-P), red skin of MPS-1 (MPS-1-R) and MPS-2 (MPS-2-R) tuber, and purple skin of MPS-1 (MPS-1-P) and MPS-2 (MPS-2-P) tuber using a Plant Genomic DNA Extraction Kit (DP305; TIangen, Beijing, China) following the manufacturer’s instructions. The gDNA was digested by the restriction enzyme HpaII which is sensitive to the methylation of gene sequences. Then, PCR amplification was conducted with primers (MT30376M-F/R) spanning GC island sequences using gDNA before and after enzyme digestion as a template. The methylation level of target genes was determined according to the presence or absence of the target band in PCR products.
The tuber skin of Purple Viking was a chimeric color of red and purple (Figure 1A). A special tuber of Purple Viking with skin that was red on one side and purple on the other was obtained (Figure 1B), and the bud eyes of red and purple parts were planted separately. The tuber obtained by propagating buds from the purple part had pure purple skin (M-P) (Figure 1C), and the tuber obtained by propagating buds from the red part had pure red skin (M-R) (Figure 1D).
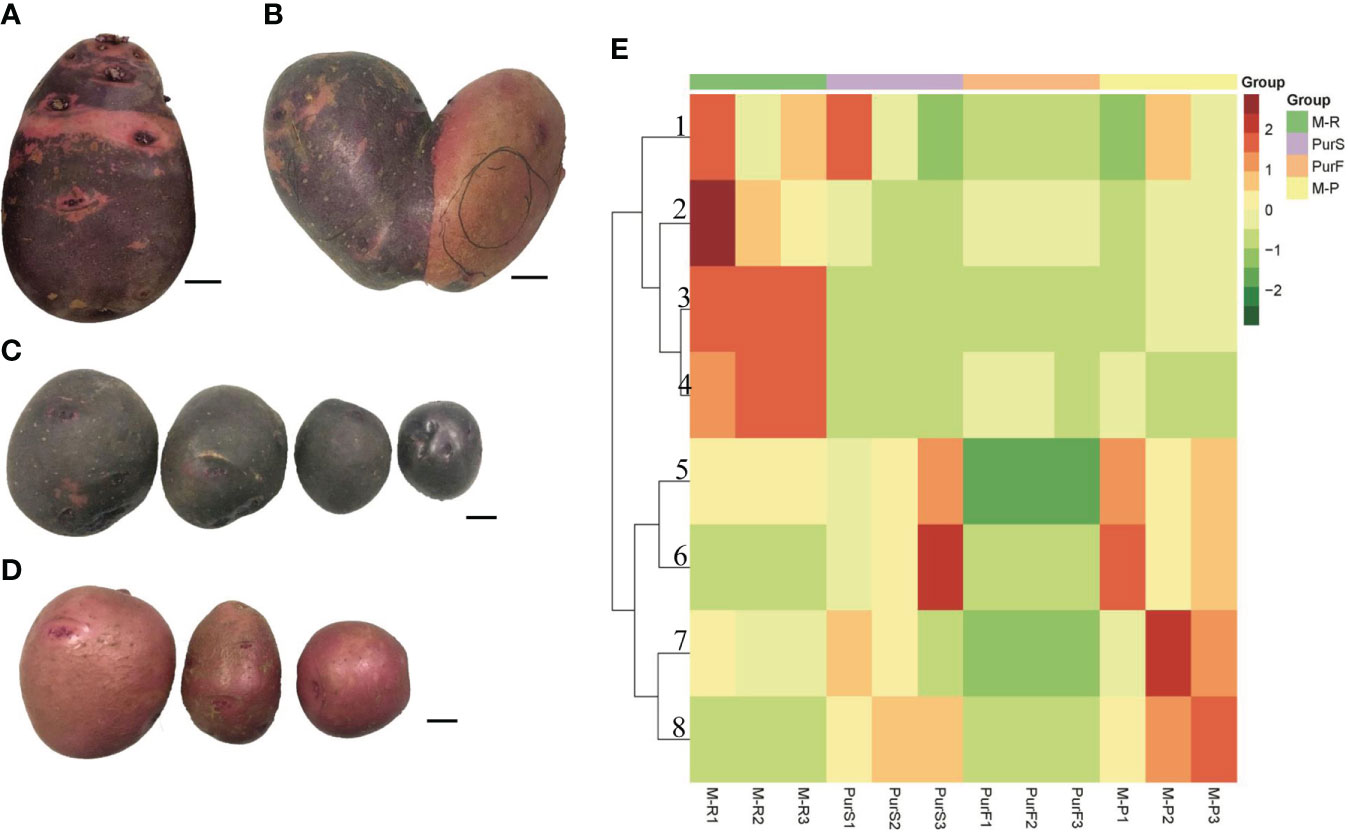
Figure 1 Tuber phenotype and anthocyanin content of potato cultivar Purple Viking and its mutants. (A) Phenotype of Purple Viking wild-type tuber. (B) Phenotype of Purple Viking chimeric tuber. (C) Tuber phenotype of Purple Viking red mutant (M-R). (D) Tuber phenotype of Purple Viking purple mutant (M-P). Bars=1cm. (E) Heat map of eight anthocyanins in tubers of Purple Viking and its mutants. 1: cyaniding; 2: delphinidin; 3: pelargonidin; 4: pelargonidin 3-O-beta-D-glucoside; 5: rosinidin-O-hexoside; 6: malvidin-3-O-glucoside; 7: rosinidin-O-hexoside; 8: petunidin 3-O-glucoside.
To determine differences in anthocyanin composition and content between purple and red tubers, anthocyanin metabolites of M-R and M-P were analyzed by HPLC. The skin and flesh of Purple Viking tubers (abbreviated as PurS and PurF, respectively) were used controls. Eight types of anthocyanins were detected, including rosinidin-O-hexoside, peonidin-3-O-glucoside, delphinidin, pelargonidin, malvidin-3-O-glucoside, petunidin 3-O-glucoside, pelargonidin 3-O-beta-D-glucoside, and cyaniding. Relative contents in each sample are shown in Table S1. According to cluster analysis of anthocyanin contents in each sample, contents of cyanidin, delphinidin, pelargonidin, and pelargonidin 3-O-beta-D-glucoside were higher in M-R than in M-P, whereas contents of the other four anthocyanins were higher in M-P (Figure 1E). According to the anthocyanin biosynthesis pathway, in M-R, the transformation of cyanidin into rosinidin O-hexoside and peonidin-3-O-glucoside and that of delphinidin into malvidin-3-O-glucoside and petunidin 3-O-glucoside were hindered (Figure 2).
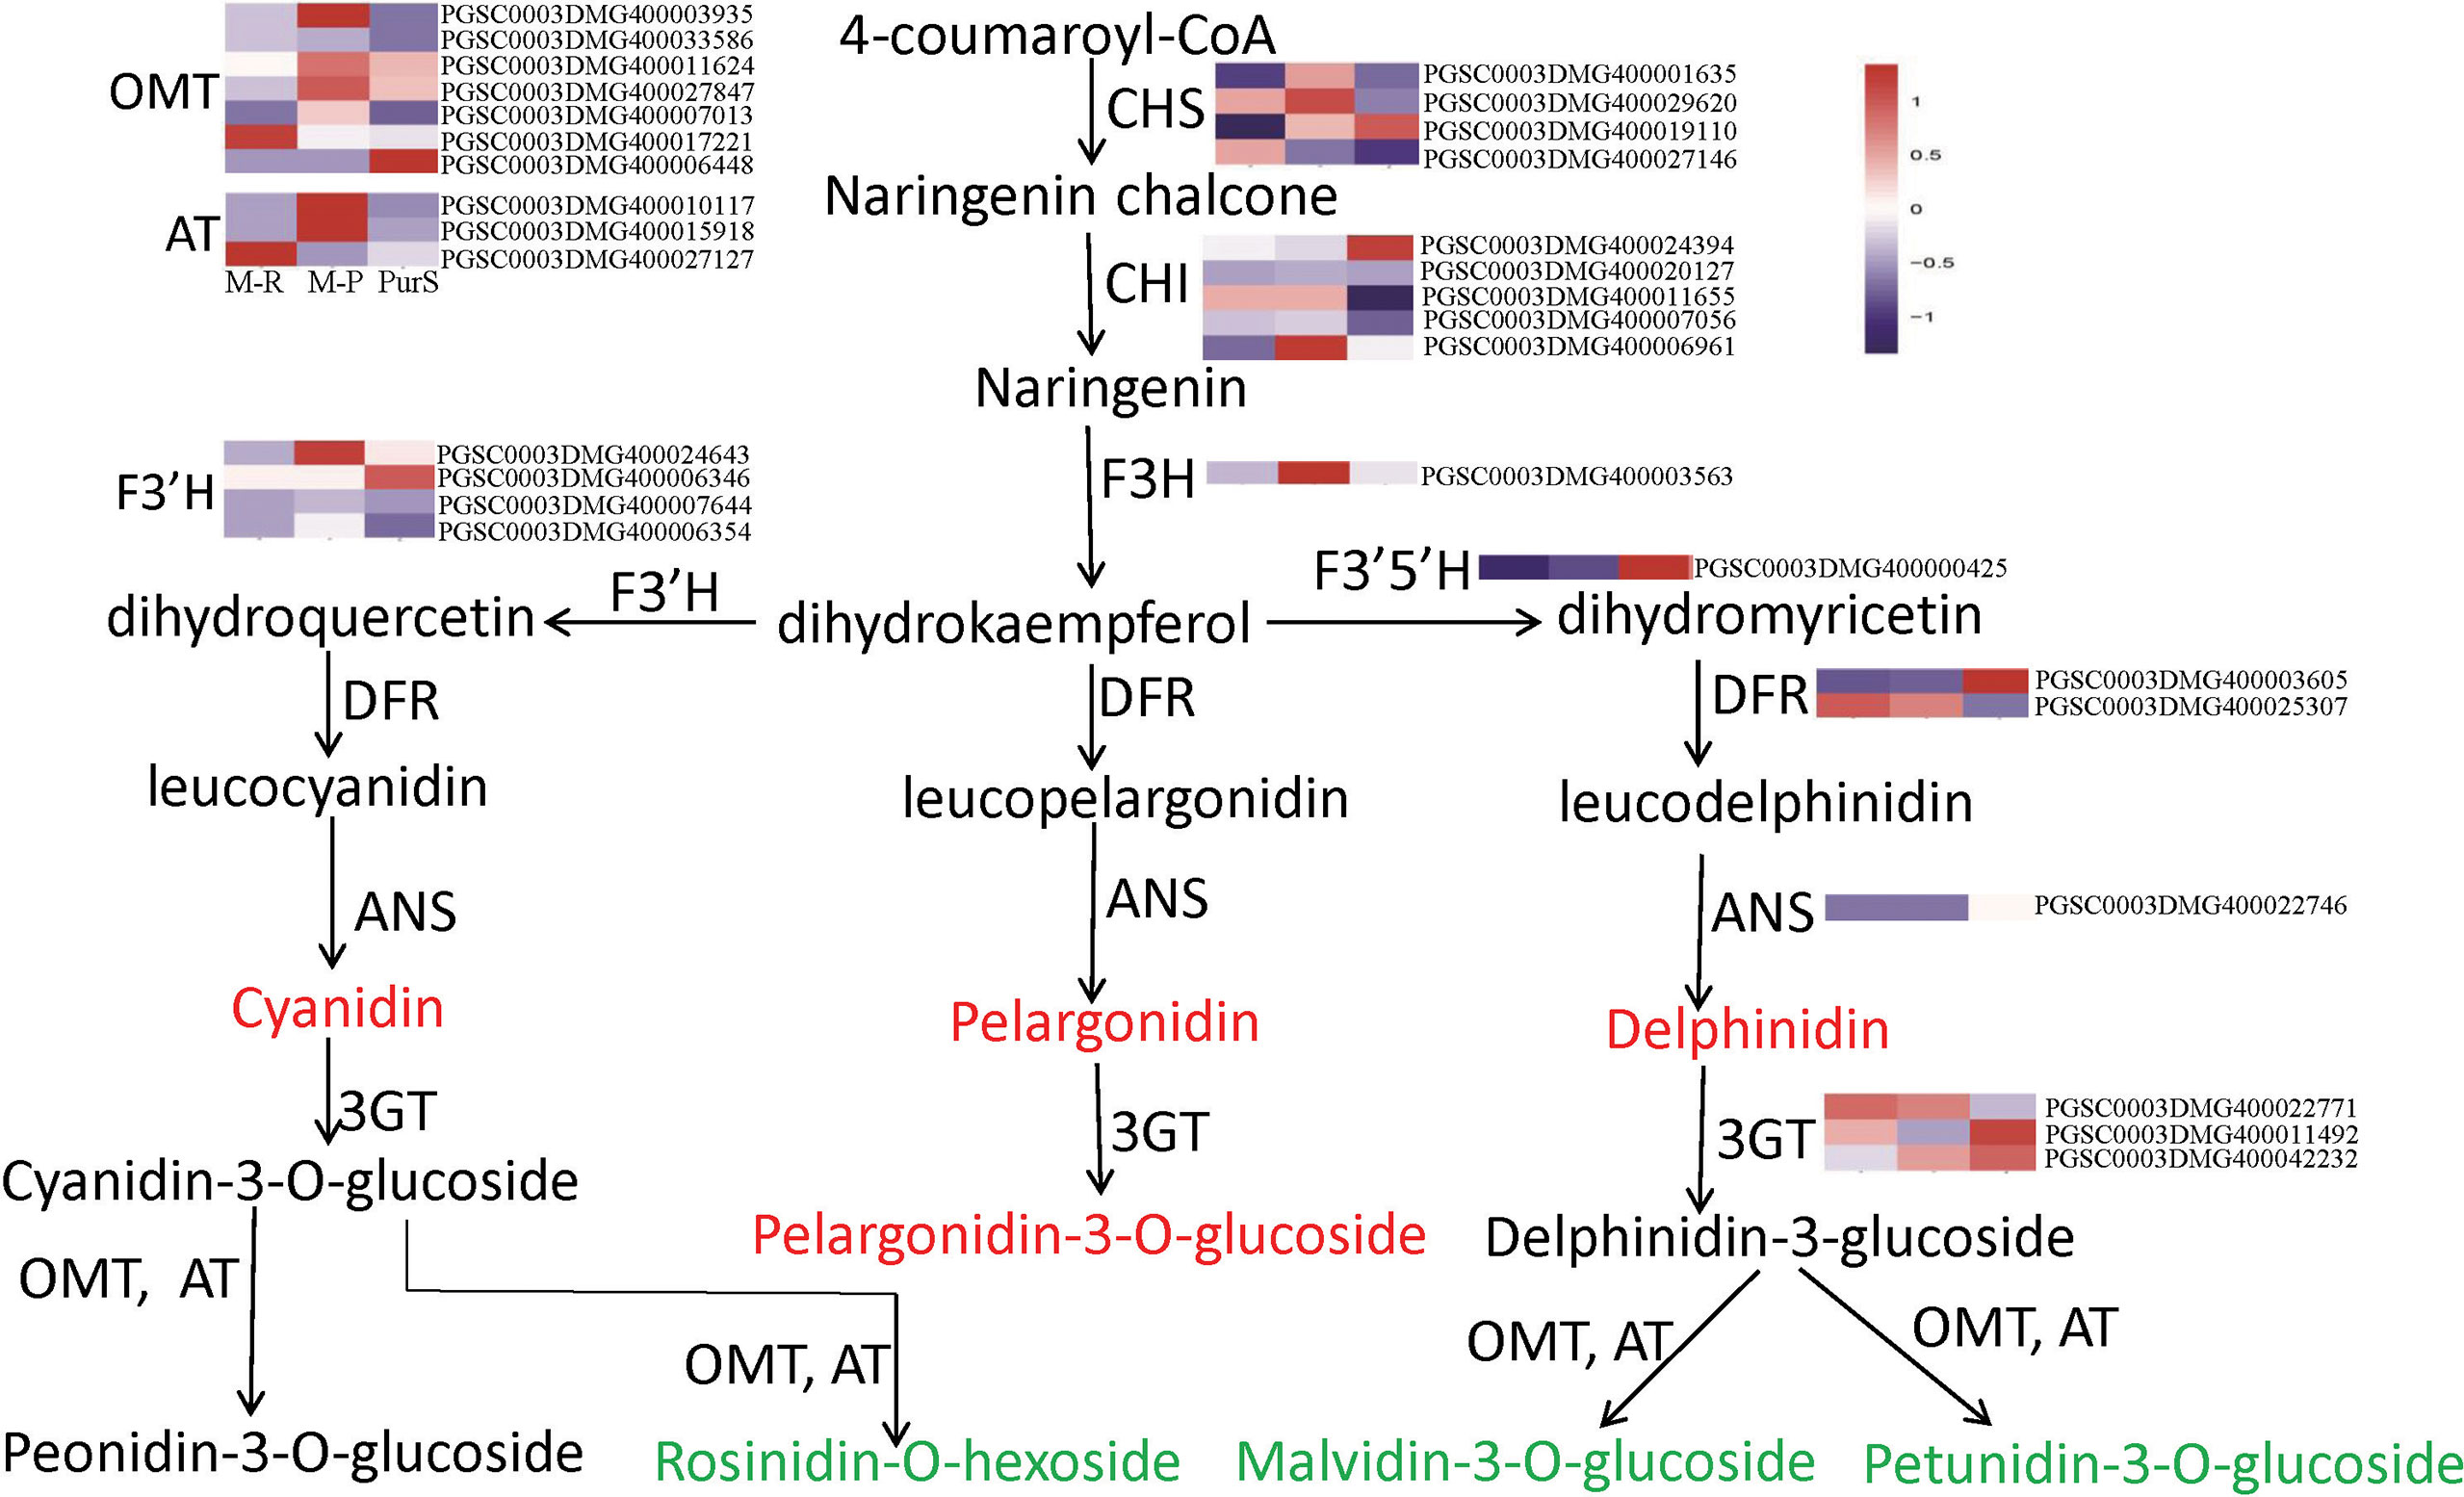
Figure 2 Metabolites and heat map of anthocyanin biosynthetic genes. Red font indicates that the content of anthocyanins in red tubers is higher than that in purple tubers, and green font indicates that the content of anthocyanins in red tubers is lower than that in purple tubers.
To further explore the molecular mechanisms that formed red and purple anthocyanins in tubers, the cDNA libraries of M-R, M-P, PurS, and PurF were constructed for transcriptomic analysis, with PurS and PurF used as controls. There was a strong correlation among biological repeats in the transcriptome, with Pearson’s correlation coefficient (r2) greater than 0.954 (Figure 3A). Number of clean reads per library ranged from 19,776,183 to 27,106,135, and 80.43% to 89.66% of reads mapped to the potato reference genome. At least 94.38% of reads in each library scored Q30 (0.02% error rate) or above, and the average GC content across all libraries was 43.00% (Table S2). The data demonstrated that reads were of high quality and were suitable for further differential gene expression analysis.
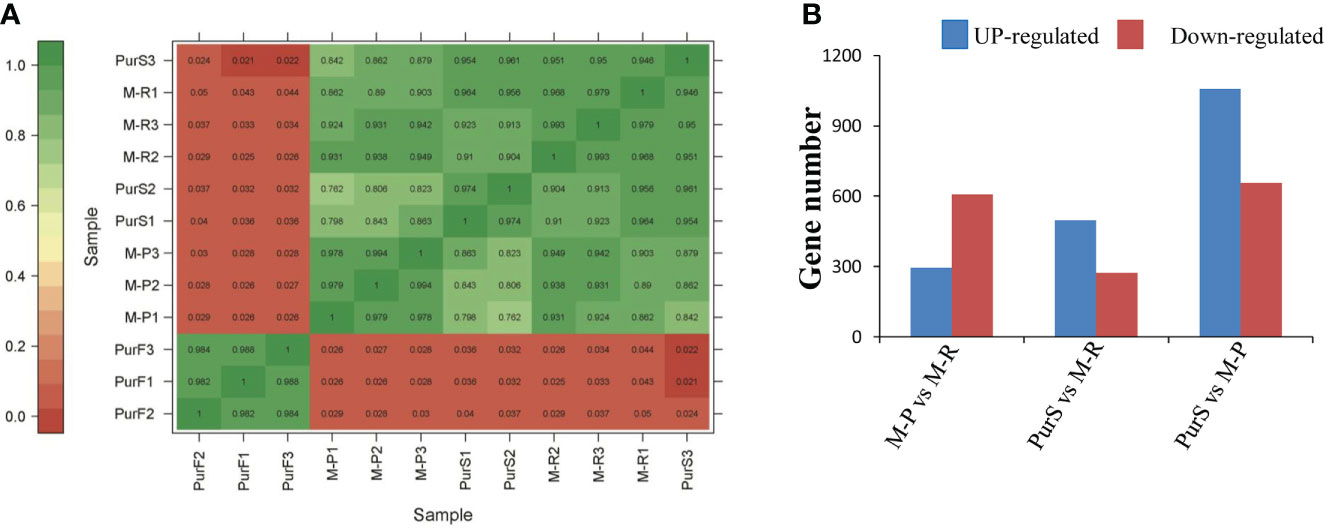
Figure 3 Overview of transcriptome analysis. (A) Correlation analysis of RNA-seq data of different tuber samples. (B) Number of differentially expressed genes (DEGs) in each comparison.
Differentially expressed genes in different libraries were analyzed to identify genes likely involved in the accumulation of different anthocyanins. Based on thresholds fold change ≥ 2 and FDR < 0.01, 296, 497, and 1,058 genes were up-regulated in the comparisons M-P vs M-R, PurS vs M-R, and PurS vs M-P, respectively, and 607, 273, and 657 genes were respectively significantly down-regulated (Figure 3B). The DEGs were identified in order to analyze the differential pathways and genes controlling the formation of red and purple anthocyanins in tubers. Thus, KEGG pathways enrichment analysis was performed to analyze up-regulated and down-regulated genes in the M-P vs M-R comparison. Thirty-nine enriched pathways were associated with the 296 up-regulated genes. The first 20 pathways of the enrichment analysis are shown in Figure 4A. The most significantly enriched pathways were those associated with plant hormone signal transduction, sulfur metabolism, phenylpropanoid biosynthesis, and linoleic acid metabolism. Forty-seven enriched pathways were associated with the 607 down-regulated genes. The first 20 pathways of the enrichment analysis are shown in Figure 4B. The most significantly enriched pathways were those associated with protein processing in endoplasmic reticulum; cutin, suberine, and wax biosynthesis; arginine and proline metabolism; and arginine biosynthesis.
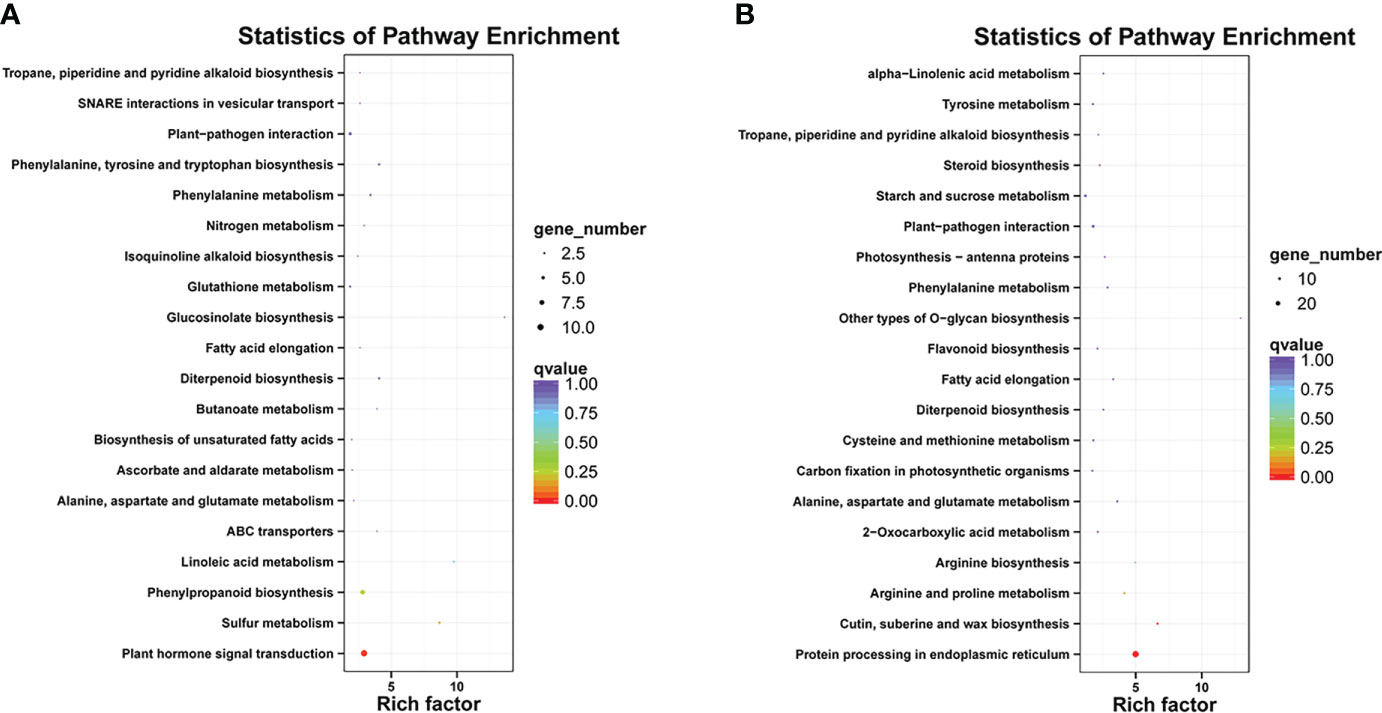
Figure 4 Kyoto Encyclopedia of Genes and Genomes (KEGG) enrichment analysis of (A) up-regulated and (B) down-regulated differentially expressed genes (DEGs) between red mutant (M-R) and purple mutant (M-P) tubers.
According to expression patterns of anthocyanin synthesis structural genes in the transcriptomes, there was no significant difference in expression of most structural genes in M-R and M-P, including CHI, F3’H, F3’5’H, DFR, ANS and 3GT (Figure 2). In further analysis, 236 genes had more than a 5-fold change in expression between M-R and M-P (Table S3), including the flavonol synthase gene (PGSC0003DMG400014093), glutathione s-transferase gene (PGSC0003DMG400015726), acyltransferase gene (PGSC0003DMG400010117), bHLH (PGSC0003DMG400028578), and WRKY (PGSC0003DMG400015104) transcription factors.
According to differences in anthocyanin components between M-R and M-P, in the M-R tuber, the formation of rosinidin O-hexoside, malvidin-3-O-glucoside, and petunidin 3-O-glucoside was hindered. With consideration of the anthocyanin biosynthesis pathway (Figure 2), it was speculated that the limited formation of those compounds might be caused by functional differences in methyltransferase or acyltransferase. Of the DEGs in the transcriptome, seven genes encoded O-methyltransferase and three genes encoded acyltransferase. To verify the reliability of transcriptome data, expression patterns of the OMT and AT genes in different samples were detected by RT-qPCR. Four of the 236 genes with more than a 5-fold difference in expression between M-R and M-P were randomly selected for verification. The RT-qPCR results were consistent with the transcriptome results (Figure 5). Expression of two OMT genes (OMT10040 (PGSC0003DMG400003935) and OMT30376 (PGSC0003DMG400011624)) and one AT gene (AT26230 (PGSC0003DMG400010117)) was significantly higher in M-P than in M-R (Figures 5A–C). It was speculated that their higher expression in M-P tubers might promote the rapid accumulation of rosinidin O-hexoside, malvidin-3-O-glucoside, and petunidin 3-O-glucoside.
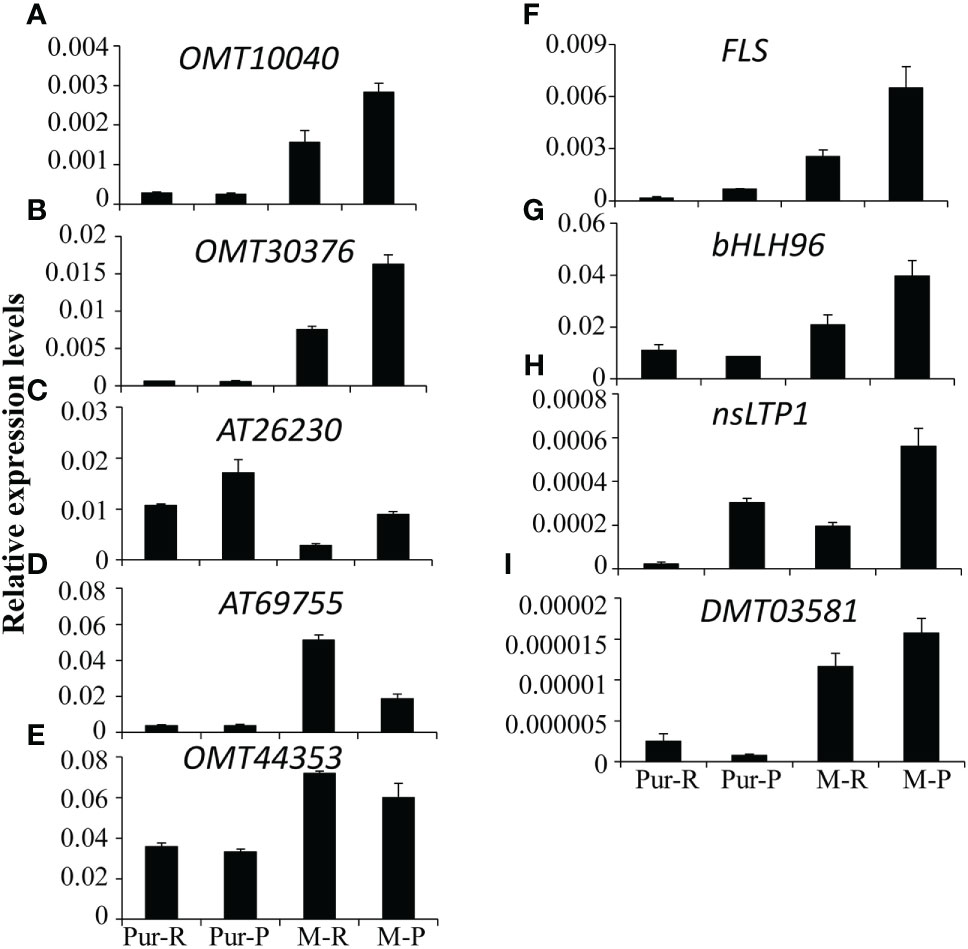
Figure 5 Quantitative analysis of transcript levels of differentially expressed genes (DEGs) in tubers skin of Purple Viking and its mutants. Each column represents the mean value ± standard error (n = 3).
Sequences of OMT10040, OMT30376, and AT26230 genes and promoters were cloned from M-R and M-P. There were no significant differences in sequences of the three genes between M-R and M-P. Therefore, methylation levels of the three genes and associate 3,000-bp upstream promoter sequences were predicted. All three genes contained CpG island sequences, and the positions of the CpG island in sequences of AT26230, OMT10040, and OMT30376 genes were 1,605–2,245, –134–363, and 76–301, respectively (Figure 6A), which indicated that the three genes might be methylated.
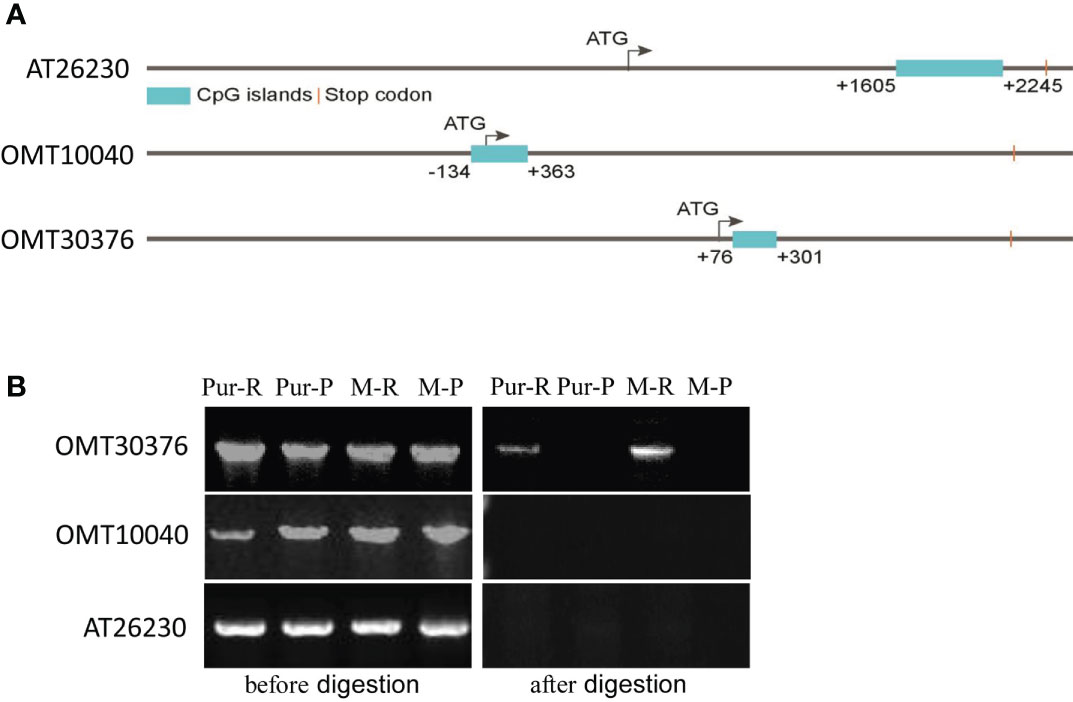
Figure 6 Detection of the methylation level of O-methyltransferase (OMT) and acyltransferase (AT) genes. (A) Distribution of CpG islands in gene sequences of AT26230, OMT10040, and OMT30376. (B) Specific primers amplified target genes in gDNA of red skin of Purple Viking tuber (Pur-R), purple skin of Purple Viking tuber (Pur-P), skin of red mutant (M-R), and skin of purple mutant (M-P) before (left) and after (right) HpaII digestion.
The gDNA was extracted from the red part (Pur-R) and purple part (Pur-P) of Purple Viking tuber skin and tuber skins of M-R and M-P. The gDNA of Pur-R, Pur-P, M-R, and M-P was digested by HpaII, which is a restriction enzyme sensitive to methylation. Primers spanning CpG island sequences were designed, and gDNA before and after enzyme digestion was used as a template for PCR amplification to determine whether a gene sequence was methylated. Target gene fragments were amplified when gDNA before HpaII digestion was used as the template. However, when digested gDNA was used as the template, the primer of the OMT30376 gene amplified the target band in gDNA of Pur-R and M-R, but there was no target band in Pur-P and M-P (Figure 6B). However, target bands in OMT10040 and AT26230 genes were not amplified in any template after enzymatic digestion (Figure 6B). The results indicated that the methylation degree of the OMT30376 gene in Pur-R and M-R was higher than that in Pur-P and M-P. Thus, the difference in degree of methylation might cause lower expression of the OMT30376 gene in M-R than in M-P (Figure 6B).
The M-P tissue culture seedlings were expanded with MS medium supplemented with S-adenosylmethionine (SAM) or 5-azacytidine (5-azaC) to induce tuber formation. The phenotype of the chimeric color of red and purple (MPS) appeared in M-P potato tubers cultured in the medium containing SAM (Figure 7A). The three micro potatoes of MPS were planted in separately in plastic pots, and the tubers harvested also had the color skin phenotype (Figure 7A). However, the phenotype of the tuber cultured in the medium containing 5-azaC was purple, which was the same as that of M-P (Figure 7A). The gDNA of red skin (MPS-1-R and MPS-2-R) and purple skin (MPS-1-P and MPS-2-P) of MPS-1 and MPS-2 tubers was extracted, and digested with restriction enzyme HpaII. The target gene was amplified with digested and undigested gDNA with OMT30376 primers (MT30376M-F/R). The results of MPS-1 and MPS-2 were consistent and showed that the target fragment was amplified from gDNA without HpaII treatment. After HpaII treatment, the target fragment was amplified in MPS-1-R and MPS-2-R, but not in MPS-1-P and MPS-2-P (Figure 7B). Therefore, the methylation level of the OMT30376 gene was higher in red skin of MPS than in purple skin of MPS. The expression level of OMT30376 in MPS-1-R and MPS-2-R was similar to that in the M-R tuber, which was much lower than that in MPS-1-P, MPS-2-P and M-P (Figure 7C). Thus, an increase in the methylation level of the OMT30376 gene led to a decrease in its expression, which then led to an increase in red anthocyanin accumulation.
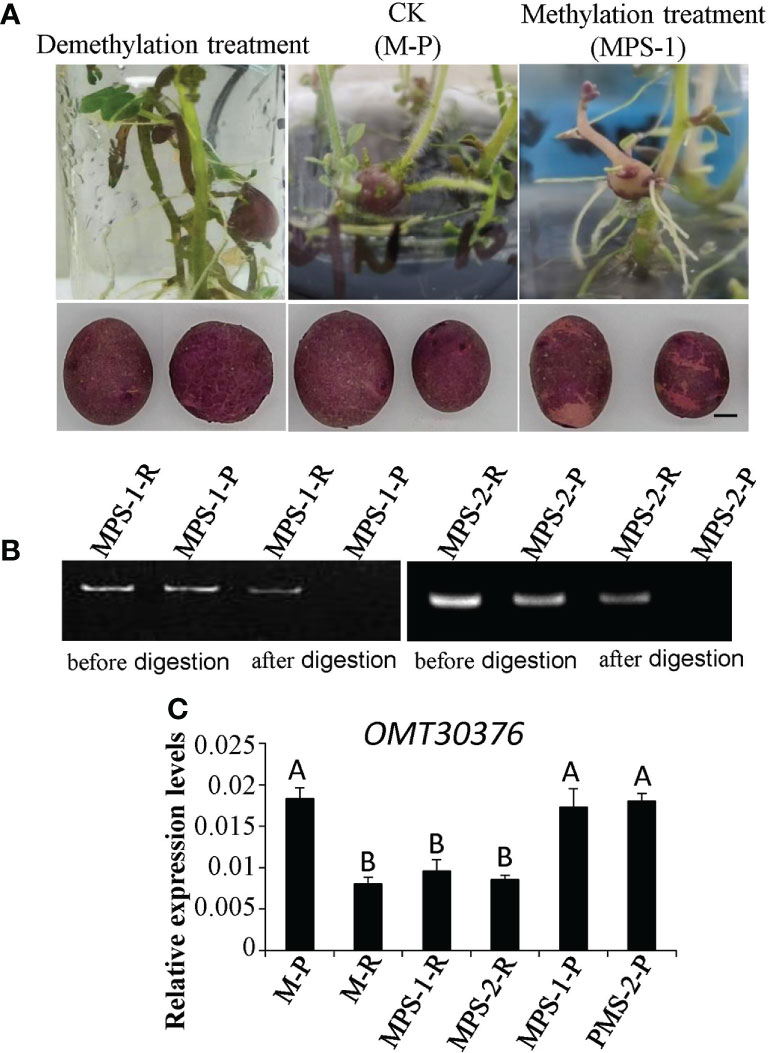
Figure 7 Effects of methylation treatment on transformation of anthocyanin. (A) Phenotypes of tubers from purple mutant (M-P) plantlets cultured on the medium containing 5-azaC (demethylation treatment), SAM (methylation treatment) (MPS), and water (CK), respectively. Bars = 1 cm. (B) OMT30376M-F/R primers amplified the target gene in gDNA of red skin of MPS (MPS-1-R and MPS-2-R) and purple skin of MPS (MPS-1-P and MPS-2-P) before and after HpaII digestion. (C) Transcript levels of OMT30376 in red and purple skin of MPS tubers. Each column represents the mean value ± standard error (n = 3). Different letters above bars indicate a significant difference between means (P<0.01).
Plant anthocyanin biosynthesis is regulated by many factors, such as temperature, hormonse, microRNAs, and epigenetics (Zhang et al., 2012; Yamazaki et al., 2021). To understand the regulation of potato anthocyanin biosynthesis, research has primarily focused on analysis of key gene functions and regulation mechanisms, particularly of structural genes, including F3’5’H, DFR, ANS, and 3GT (Jung et al., 2005; Wei et al., 2012; Zhang et al., 2020), and MBW transcription factors (Li et al., 2014; Liu et al., 2016). However, regulation of methylation modification in potato anthocyanin biosynthesis has not been reported. In this study, transcriptome and anthocyanin metabolome analyses were performed on Purple Viking tubers with a chimeric skin phenotype and its associated red and purple-skin mutants. The metabolome analysis showed that the transformation of cyanidin and delphinidin was hindered in red tubers (Figure 2). Analysis of DEGs showed that expression of the OMT30376 gene, which catalyzes the conversion of cyanidin and delphinidin, was significantly different between M-R and M-P (Figure 5). Further analysis showed a difference in the methylation degree of the OMT30376 gene between M-R and M-P. In addition, M-P treated with SAM had the phenotype of the restored mutation (Figure 7). The results indicated that the anthocyanin difference between purple and red was caused by the methylation degree of the OMT30376 gene. Therefore, the OMT30376 gene is involved in the transformation of anthocyanins in potato tubers, which is consistent with the function of the grape AOMT gene. Transient expression of the grapevine AOMT gene in tobacco leaves expressing anthocyanin pigment 1 (PAP1) transcription factor from Arabidopsis, indicates that AOMT transforms the nonmethylated anthocyanin delphinidin 3-rutinoside induced by PAP1 into malvidin 3-rutinoside (Hugueney et al., 2009).
Epigenetic modification of anthocyanin biosynthesis regulators, especially methylation modification, is closely associated with color changes in some crops (Xu et al., 2012; Wang et al., 2013; El-Sharkawy et al., 2015). The OMT genes have key roles in methylation modification, and the multiple genes in the OMT gene family also have different effects. For example, four different OMTs isolated from petunia exhibit different kinetic properties (Jonsson et al., 1984), and of 57 candidate OMT genes identified in tomatoes, only one gene is strongly correlated with methylated anthocyanin accumulation (Roldan et al., 2014). Similar results are found in grapes. High expression of the FAOMT gene is detected in colored grape skin, but other OMT genes are not detected (Lucker et al., 2010). In this study, seven OMT genes were detected in the transcriptomes, and RT-qPCR results showed that only two (OMT10040 and OMT30376) had lower in expression in M-R than in M-P (Figure 5). According to further analysis, only the difference in methylation level of the OMT30376 gene (Figure 6) affected anthocyanin transformation.
The focus of most previous studies is on the effect of OMT genes on anthocyanin methylation in order to change the color performance of plants (Ageorges et al., 2006; Castellarin and Di Gaspero, 2007; Du et al., 2015). Methylation of anthocyanins was first reported in petunia at the 3′ and 5′ positions of aglycones (Jonsson et al., 1983). Subsequently, effects of OMT genes on anthocyanin methylation were determine in many species, including peony and grape (Sakata et al., 1995; Kondo et al., 2009). However, differences in regulation of different OMT genes in different phenotypes are rarely reported. In this study, the difference in methylation level of the OMT30376 gene between M-R and M-P affected anthocyanin transformation, which is a new discovery in potato.
Methylation regulates anthocyanin synthesis primarily because of changes in methylation level of key transcription factors, which lead to changes in expression of structural genes and thus activity of those genes (El-Sharkawy et al., 2015). A decrease in the promoter methylation level of MdMYB1, the key transcription factor in anthocyanin biosynthesis in apples, increases the accumulation of red anthocyanin and produces a red bud sport (Xu et al., 2012). Similar results are also found in red-fleshed radish, in which methylation of the RsMYB1 promoter leads to a decrease in gene expression and affects the synthesis and accumulation of anthocyanin (Wang et al., 2020). However, in this study, there were no significant differences in expression of key transcription factors and most key structural genes (Figure 2) between red and purple tubers. When methylation level and expression of the OMT30576 gene in red and purple tubers (Figures 5B, 6) and effect of methylation level on anthocyanin transformation were both considered (Figure 7), the difference in anthocyanin between purple and red tubers was primarily due to difference in methylation levels of the OMT30376 gene, which affected its expression. This is the first report on how methylation of an OMT gene affects anthocyanin biosynthesis and transformation in potato tubers. In addition, the CpG of OMT30376, OMT10040, and AT26230 are all in the coding region (Figure 6A), and the expression level of them in the M-R and M-P is significantly different (Figure 5), indicating that the difference in methylation of gene coding regions can regulate gene expression, which is consistent with the results in rice and maize (Lu et al., 2015; Tan et al., 2016). In this study, the regulation of OMT30376 on other new structural genes and transcription factors could not be excluded, because expression of the structural gene FLS and the transcription factor gene bHLH96 was significantly different between M-R and M-P (Figure 5). Therefore, whether OMT30376 can regulate expression of FLS and bHLH96 needs to be investigated further.
In this study, part of the MPS tuber skin was red (Figure 7A), and expression of the OMT30376 gene in the red part was lower than that in the purple part (Figure 7C), which indicated that expression of the OMT30376 gene was site-specific. A similar phenomenon is observed in red–purple-flowered cyclamen (Akita et al., 2011). However, there was no purple on the tuber skin of M-R plants grown on medium containing 5-azaC, indicating that there might be other regulatory mechanisms in red tubers. In addition, differences in methylation levels of OMT10040 and AT26230 in M-R and M-P were not detected using the current method (Figure 6B). The reasons for differences expression of OMT10040 and AT26230 in M-R and M-P need to be studied further. The function of transcription factor bHLH96 was not clear, although its expression in M-P and M-R was significantly different (Figure 5). Thus, whether bHLH96 regulates anthocyanin biosynthesis and whether it regulates OMT10040 and AT26230 also need to be investigated further.
The data presented in the study are deposited in the Harvard Dataverse repository, and the original fpkm value of RNA-seq can be obtained through the website https://dataverse.harvard.edu/dataset.xhtml?persistentId=doi:10.7910/DVN/K24WV6.
BS and HZ designed the research. YZ and XZ analyzed the data. ZZ analyzed gene expression. YZ and JL performed the methylation treatment of samples. MS found the mutant tuber. HZ and BS wrote the article. All authors contributed to the article and approved the submitted version.
This work was supported by grants from the China Agriculture Research System of MOF and MARA (CARS-09-P07), the Natural Science Foundation of Henan (202300410152), the Training Plan for Young Backbone Teachers in the Colleges and Universities of Henan Province (2021GGJS049), and Research Funding for Young Backbone Teachers of Henan University of Science and Technology (4026-13450008).
The authors declare that the research was conducted in the absence of any commercial or financial relationships that could be construed as a potential conflict of interest.
All claims expressed in this article are solely those of the authors and do not necessarily represent those of their affiliated organizations, or those of the publisher, the editors and the reviewers. Any product that may be evaluated in this article, or claim that may be made by its manufacturer, is not guaranteed or endorsed by the publisher.
The Supplementary Material for this article can be found online at: https://www.frontiersin.org/articles/10.3389/fpls.2022.1021617/full#supplementary-material
Ageorges, A., Fernandez, L., Vialet, S., Merdinoglu, D., Terrier, N., Romieu, C. (2006). Four specific isogenes of the anthocyanin metabolic pathway are systematically co-expressed with the red colour of grape berries. Plant Sci. 170, 372–383. doi: 10.1016/j.plantsci.2005.09.007
Ai, Y., Jing, S., Cheng, Z., Song, B., Xie, C., Liu, J., et al. (2021). DNA Methylation affects photoperiodic tuberization in potato (Solanum tuberosum l.) by mediating the expression of genes related to the photoperiod and GA pathways. Hortic. Res. 8, 181. doi: 10.1038/s41438-021-00619-7
Akita, Y., Kitamura, S., Hase, Y., Narumi, I., Ishizaka, H., Kondo, E. (2011). ). isolation and characterization of the fragrant cyclamen O-methyltransferase involved in flower coloration. Planta 234, 1127–1136. doi: 10.1007/s00425-011-1466-0
Apweiler, R., Bairoch, A., Wu, C. H., Barker, W. C., Boeckmann, B., Ferro, S. (2004). UniProt: the universal protein knowledgebase. Nucleic Acids Res. 32, 115–119. doi: 10.1093/nar/gkh131
Brown, C. R. (2005). Antioxidants in potato. Am. J. Potato Res. 82, 163–172. doi: 10.1007/BF02853654
Castellarin, S. D., Di Gaspero, G. (2007). Transcriptional control of anthocyanin biosynthetic genes in extreme phenotypes for berry pigmentation of naturally occurring grapevines. BMC Plant Biol. 7 (46). doi: 10.1186/1471-2229-7-46
Du, H., Wu, J., Ji, K. X., Zeng, Q. Y., Bhuiya, M. W., Su, S. (2015). Methylation mediated by an anthocyanin, O-methyltransferase, is involved in purple flower coloration in paeonia. J. Exp. Bot. 66, 6563–6577. doi: 10.1093/jxb/erv365
El-Sharkawy, I., Liang, D., Xu, K. (2015). Transcriptome analysis of an apple (Malus×domestica) yellow fruit somatic mutation identifies a gene network module highly associated with anthocyanin and epigenetic regulation. J. Exp. Bot. 66, 7359–7376. doi: 10.1093/jxb/erv433
Finn, R. D., Bateman, A., Clements, J., Coggill, P., Eberhardt, R. Y., Eddy, S. R. (2014). Pfam: The protein families database. Nucleic Acids Res. 42, 222–230. doi: 10.1093/nar/gkt1223
Fossen, T., Andersen, M. (2000). Anthocyanins from tubers and shoots of the purple potato, Solanum tuberosum. J. Hortic. Sci. Biotech. 75, 360–363. doi: 10.1080/14620316.2000.11511251
Guo, D. L., Li, Q., Zhao, H. L., Wang, Z. G., Zhang, G. H., Yu, Y. H. (2019). The variation of berry development and DNA methylation after treatment with 5-azaC on 'Kyoho' grape. Sci. Hortic. 246, 265–271. doi: 10.1016/j.scienta.2018.11.006
Heim, K. E., Tagliaferro, A. R., Bobilya, D. J. (2002). Flavonoid antioxidants: Chemistry, metabolism and structure-activity relationships. J. Nutr. Biochem. 13, 572–584. doi: 10.1016/S0955-2863(02)00208-5
Hichri, I., Barrieu, F., Bogs, J., Kappel, C., Delrot, S., Lauvergeat, V. (2011). Recent advances in the transcriptional regulation of the flavonoid biosynthetic pathway. J. Exp. Bot. 62, 2465–2483. doi: 10.1093/jxb/erq442
Hugueney, P., Provenzano, S., Verries, C., Ferrandino, A., Meudec, E., Batelli, G. (2009). A novel cation-dependent O-methyltransferase involved in anthocyanin methylation in grapevine. Plant Physiol. 150, 2057–2070. doi: 10.1104/pp.109.140376
Jiang, S. H., Wang, N., Chen, M., Zhang, R., Sun, Q. G., Xu, H. F. (2020). Methylation of MdMYB1 locus mediated by RdDM pathway regulates anthocyanin biosynthesis in apple. Plant Biotechnol. J. 18, 1736–1748. doi: 10.1111/pbi.13337
Jonsson, L. M. V., Aarsman, M. E. G., Poulton, J. E., Schram, A. W. (1984). Properties and genetic control of four methyltransferases involved in methylation of anthocyanins in flower of petunia hybrid. Planta 160, 174–179. doi: 10.1007/BF00392867
Jonsson, L. M. V., de Vlaming, P., Wiering, H., Aarsman, M. E. G., Schram, A. W. (1983). Genetic control of anthocyanin O-methyltransferase activity in flowers of petunia hybrid. Theor. Appl. Genet. 66, 349–355. doi: 10.1007/BF00251170
Jung, C. S., Griffiths, H. M., De Jong, D. M., Cheng, S., Bodis, M., De Jong, W. S. (2005). The potato p locus codes for flavonoid 3′5′-hydroxylase. Theor. Appl. Genet. 110, 269–275. doi: 10.1007/s00122-004-1829-z
Kanehisa, M., Goto, S., Kawashima, S., Okuno, Y., Hattori, M. (2004). The KEGG resource for deciphering the genome. Nucleic Acids Res. 32, 277–280. doi: 10.1093/nar/gkh063
Khoo, H. E., Azlan, A., Tang, S. T., Lim, S. M. (2017). Anthocyanidins and anthocyanins: colored pigments as food, pharmaceutical ingredients, and the potential health benefits. Food Nutr. Res. 61, 1–21. doi: 10.1080/16546628.2017.1361779
Kim, D., Langmead, B., Salzberg, S. L. (2015). HISAT: a fast spliced aligner with low memory requirements. Nat. Methods 12, 357–360. doi: 10.1038/nmeth.3317
Klimasauskas, S., Weinhold, E. (2007). A new tool for biotechnology: AdoMet-dependent methyltransferases. Trends Biotechnol. 25, 99–104. doi: 10.1016/j.tibtech.2007.01.006
Kondo, E., Nakayama, M., Kameari, N., Tanikawa, N., Morita, Y., Akita, Y., et al. (2009). Red-purple flower due to delphinidin 3,5-diglucoside, a novel pigment for Cyclamen spp., generated by ion-beam irradiation. Plant Bio. 26, 565–569. doi: 10.5511/plantbiotechnology.26.565
Koonin, E. V., Fedorova, N. D., Jackson, J. D., Jacobs, A. R., Krylov, D. M., Makarova, K. S. (2004). A comprehensive evolutionary classification of proteins encoded in complete eukaryotic genomes. Genome Biol. 5, 7. doi: 10.1186/gb-2004-5-2-r7
Liu, Y., Lin-Wang, K., Espley, R. V., Wang, L., Li, Y., Liu, Z. (2019). StMYB44 negatively regulates anthocyanin biosynthesis at high temperatures in tuber flesh of potato. J. Exp. Bot. 70, 3809–3824. doi: 10.1093/jxb/erz194
Liu, Y., Lin-Wang, K., Espley, R. V., Wang, L., Yang, H., Yu, B. (2016). Functional diversification of the potato R2R3 MYB anthocyanin activators AN1, MYBA1, and MYB113 and their interaction with basic helix-loop-helix cofactors. J. Exp. Bot. 67, 2159–2176. doi: 10.1093/jxb/erw014
Liu, Y., Tikunov, Y., Schouten, R. E., Marcelis, L. F. M., Visser, R. G. F., Bovy, A. (2018). Anthocyanin biosynthesis and degradation mechanisms in solanaceous vegetables: a review. Front. Chem. 6. doi: 10.3389/fchem.2018.00052
Livak, K. J., Schmittgen, T. D. (2001). Analysis of relative gene expression data using real-time quantitative PCR and the 2– ΔΔCT method. Methods 25, 402–408. doi: 10.1006/meth.2001.1262
Li, W., Wang, B., Wang, M., Chen, M., Yin, J., Kaleri, G. M. (2014). Cloning and characterization of a potato StAN11 gene involved in anthocyanin biosynthesis regulation. J. Integr. Plant Bio. 56, 364–372. doi: 10.1111/jipb.12136
Lucker, J., Martens, S., Lund, S. T. (2010). Characterization of a vitis vinifera cv. Cabernet sauvignon 3′,5′-o-methyltransferase showing strong preference for anthocyanins and glycosylated flavonols. Phytochemistry 71, 1474–1484. doi: 10.1016/j.phytochem.2010.05.027
Lu, X., Wang, W., Ren, W., Chai, Z., Guo, W., Chen, R., et al. (2015). Genome-wide epigenetic regulation of gene transcription in maize seeds. PloS One 10, e0139582. doi: 10.137/journal.pone.0139582
Ma, C. Q., Liang, B. W., Chang, B., Liu, L., Yan, J. Y., Yang, Y. (2018). Transcriptome profiling reveals transcriptional regulation by DNA methyltransferase inhibitor 5-Aza-2'-deoxycytidine enhancing red pigmentation in bagged “Granny smith” apples (Malus domestica). Int. J. Mol. Sci. 19, 3133. doi: 10.3390/ijms19103133
Mao, X., Cai, T., Olyarchuk, J. G., Wei, L. (2005). Automated genome annotation and pathway identification using the KEGG orthology (KO) as a controlled vocabulary. Bioinformatics 21, 3787–3793. doi: 10.1093/bioinformatics/bti430
Rausher, M. D. (2008). Evolutionary transitions in floral color. Int. J. Plant Sci. 169, 7–21. doi: 10.1086/523358
Reddivari, L., Vanamala, J., Chintharlapalli, S., Safe, S. H., Miller, J. C. (2007). Anthocyanin fraction from potato extracts is cytotoxic to prostate cancer cells through activation of caspase-dependent and caspase-independent pathways. Carcinogenesis 28, 2227–2235. doi: 10.1093/carcin/bgm117
Roldan, M. V. G., Outchkourov, N., Van Houwelingen, A., Lammers, M., de la Fuente, I. R., Ziklo, N. (2014). An O-methyltransferase modifies accumulation of methylated anthocyanins in seedlings of tomato. Plant J. 80, 695–708. doi: 10.1111/tpj.12664
Sakata, Y., Aoki, N., Tsunematsu, S., Nishikouri, H., Johjima, T. (1995). Petal coloration and pigmentation of tree peony bred and selected in daikon island (Shimane prefecture). J. Jpn. Soc Hortic. Sci. 64, 351–357. doi: 10.2503/jjshs.64.351
Tan, F., Zhou, C., Zhou, Q., Zhou, S., Yang, W., Zhao, Y., et al. (2016). Analysis of chromatin regulators reveals specific features of rice DNA methylation pathway. Plant Physiol. 171, 2041–2054. doi: 10.1104/pp.16.00393
Tatusov, R. L., Galperin, M. Y., Natale, D. A., Koonin, E. V. (2000). The COG database: a tool for genome scale analysis of protein functions and evolution. Nucleic Acids Res. 28, 33–36. doi: 10.1093/nar/28.1.33
Wang, Z., Meng, D., Wang, A., Li, T., Jiang, S., Cong, P. (2013). The methylation of the PcMYB10 promoter is associated with green-skinned sport in max red bartlett pear. Plant Physiol. 162, 885–896. doi: 10.1104/pp.113.214700
Wang, Q. B., Wang, Y. P., Sun, H. H., Sun, L., Zhang, L. (2020). Transposon-induced methylation of the RsMYB1 promoter disturbs anthocyanin accumulation in red-fleshed radish. J. Exp. Bot. 2020, 71, 2537–2550. doi: 10.1093/jxb/eraa010
Wei, Q., Wang, Q., Feng, Z., Wang, B., Zhang, Y., Yang, Q. (2012). Increased accumulation of anthocyanins in transgenic potato tubers by overexpressing the 3GT gene. Plant Biotechnol. Rep. 6, 69–75. doi: 10.1007/s11816-011-0201-4
Wessinger, C. A., Rausher, M. D. (2012). Lessons from flower colour evolution on targets of selection. J. Exp. Bot. 63, 5741–5749. doi: 10.1093/jxb/ers267
Wiering, H., Devlaming, P. (1977). Glycosylation and methylation patterns of anthocyanins in petunia hybrida. II. genes Mf1 and Mf2. Plant Breed. 78, 113–123.
Xu, Y., Feng, S., Jiao, Q., Liu, C., Zhang, W., Chen, W. (2012). Comparison of MdMYB1 sequences and expression of anthocyanin biosynthetic and regulatory genes between malus domestica borkh. cultivar’Ralls’ and its blushed sport. Euphytica 185, 157–170. doi: 10.1007/s10681-011-0494-y
Yamazaki, M., Ishida, A., Suzuki, Y., Aoki, Y., Suzuki, S., Enoki, S. (2021). Ethylene induced by sound stimulation enhances anthocyanin accumulation in grape berry skin through direct upregulation of UDP-glucose: flavonoid 3-o-glucosyltransferase. Cells 10, 2799. doi: 10.3390/cells10102799
Zhang, B., Hu, Z. L., Zhang, Y. J., Li, Y. L., Zhou, S., Chen, G. P. (2012). A putative functional MYB transcription factor induced by low temperature regulates anthocyanin biosynthesis in purple kale (Brassica oleracea var. acephala f. tricolor). Plant Cell Rep. 31, 281–289. doi: 10.1007/s00299-011-1162-3
Keywords: OMT30376 gene, methylation level, gene expression, anthocyanin transformation, potato
Citation: Zhang H, Zhao Y, Zhao X, Zhang Z, Liu J, Shi M and Song B (2022) Methylation level of potato gene OMT30376 regulates tuber anthocyanin transformations. Front. Plant Sci. 13:1021617. doi: 10.3389/fpls.2022.1021617
Received: 17 August 2022; Accepted: 14 September 2022;
Published: 07 October 2022.
Edited by:
Leo Sabatino, University of Palermo, ItalyReviewed by:
Yuling Lin, Fujian Agriculture and Forestry University, ChinaCopyright © 2022 Zhang, Zhao, Zhao, Zhang, Liu, Shi and Song. This is an open-access article distributed under the terms of the Creative Commons Attribution License (CC BY). The use, distribution or reproduction in other forums is permitted, provided the original author(s) and the copyright owner(s) are credited and that the original publication in this journal is cited, in accordance with accepted academic practice. No use, distribution or reproduction is permitted which does not comply with these terms.
*Correspondence: Botao Song, c29uZ2JvdGFvQG1haWwuaHphdS5lZHUuY24=
Disclaimer: All claims expressed in this article are solely those of the authors and do not necessarily represent those of their affiliated organizations, or those of the publisher, the editors and the reviewers. Any product that may be evaluated in this article or claim that may be made by its manufacturer is not guaranteed or endorsed by the publisher.
Research integrity at Frontiers

Learn more about the work of our research integrity team to safeguard the quality of each article we publish.