
95% of researchers rate our articles as excellent or good
Learn more about the work of our research integrity team to safeguard the quality of each article we publish.
Find out more
ORIGINAL RESEARCH article
Front. Plant Sci. , 31 October 2022
Sec. Plant Physiology
Volume 13 - 2022 | https://doi.org/10.3389/fpls.2022.1020551
This article is part of the Research Topic Redox Biology and Crop Health View all 5 articles
 Wenqiang Wang1,2,3†Jifa Zhang2,4†Fenxia Guo1Yindi Di1Yuhui Wang1Wankun Li1Yali Sun5Yuhai Wang1Fei Ni2Daolin Fu2,4
 Wei Wang6*Qunqun Hao1,2*
This study investigated the barley lesion mimic mutant (LMM) 5386, evidenced by a leaf brown spot phenotype localized on the chromosome 3H, and its conferred basal resistance to Fusarium graminearum. RNA-seq analysis identified 1453 genes that were differentially expressed in LMM 5386 compared to those in the wild type. GO and KEGG functional annotations suggested that lesion mimic formation was mediated by pathways involving oxidation reduction and glutathione metabolism. Additionally, reactive oxygen species (ROS) accumulation in brown spots was substantially higher in LMM 5386 than in the wild-type plant; therefore, antioxidant competence, which is indicated by ROS accumulation, was significantly lower in LMM 5386. Furthermore, the reduction of glycine in LMM 5386 inhibited glutathione biosynthesis. These results suggest that the decrease in antioxidant competence and glutathione biosynthesis caused considerable ROS accumulation, leading to programmed cell death, which eventually reduced the yield components in LMM 5386.
Lesion mimics (LMs), also known as hypersensitive reaction-like traits, arise spontaneously in leaf tissues without being attacked by plant pathogens (McGrann et al., 2015). LM mutants (LMMs) spontaneously form necrotic plaques under normal growth conditions; thus, LMMs are valuable genetic resources for studying programmed cell death (PCD) signaling pathways and disease resistance in plants (Moeder and Yoshioka, 2008).
Recently, many LMMs have been identified and studied in a variety of plants including Arabidopsis (Serrano et al., 2010), barley (Hao et al., 2019), maize (Hurni et al., 2015), and rice (Shang et al., 2009). These previous LMM formation studies have drawn the several conclusions, including that (1) mutations and abnormal expressions of disease-resistance genes lead to hypersensitivity and subsequent PCD in plants, causing necrotic plaques similar to those caused by pathogen infection (Shirano et al., 2002); (2) the abnormal expression of PCD-controlling genes leads to the loss of control of PCD, which can lead to necrotic plaque formation (Dietrich et al., 1994); (3) plant metabolism disorders can also induce necrotic plaques in plants (Hu et al., 1998); and (4) external environmental changes can also induce plaque appearance (Wang et al., 2015a; Wang et al., 2016a).
LMMs are crucial for studying hypersensitive responses (HRs) in plants (Bruggeman et al., 2015), and the level of reactive oxygen species (ROS) has been identified as capable of producing LMMs (Sindhu et al., 2018). Hao et al. (2019) reported that autonomic lesions associated with LMM194 were often accompanied by excessive ROS, occasionally leading to cell death. Rice containing LMM6 were more resistant to blast fungus and had higher ROS accumulations (Xiao et al., 2015). Oxidative stress genes are also expressed in LMM lines (Devadas et al., 2002; Torres et al., 2002), as are enzymes involved in antioxidant systems such as glutathione S-transferase (GST), peroxidase (POD), and superoxide dismutase (SOD) (Klibenstein et al., 1999; Hao et al., 2019), suggesting that oxidative stress signals are activated by LM genes.
Some LMMs have been isolated in plants, most of which displaying enhanced pathogen resistance; for example, lls1 mutations exhibit enhanced resistance to fungal pathogens in maize (Simmons et al., 1998), spl mutations exhibit resistance to the blast fungus in rice (Yin et al., 2000), M66 mutations show increased resistance to yellow rust and powdery mildew (Kinane and Jones, 2001), and lm1 and lm2 mutations enhance leaf rust resistance in wheat (Yao et al., 2009). Furthermore, a novel light-dependent LM gene (lm3) shows resistance to powdery mildew in wheat (Wang et al., 2016a).
Currently, very few Triticeae-tribe LM genes have been cloned, with two LM genes cloned from barley, including TIGRINA-D.12 (Khandal et al., 2009) and NEC1 (Rostoks et al., 2006). TIGRINA-D.12 and NEC1 in barley are homologous to FLU (At3g14110) and HLM1 (At5g54250) in Arabidopsis thaliana, respectively. The FLU protein regulates chlorophyll synthesis in Arabidopsis, with the LMM FLU protein forming LMs in mature leaves (Meskauskiene et al., 2011). Additionally, three LM genes (lm1, lm2, and lm3) have been mapped on 3BS, 4BL, and 3BL, respectively, in wheat (Yao et al., 2009; Wang et al., 2016a).
Barley is an ideal model of the Triticeae tribe and an economically important cereal. In this study, we identified a novel LMM 5386 in barley and investigated LM formation and the resistance to F. graminearum. The results are expected to improve our understanding of the role of LMMs in barley.
A barley LMM 5386 line was generated through the application of 29 mmol L−1 ethyl methanesulfonate (EMS) to the “Tamalpais” wild type (WT) cultivar in 2009. After more than six generations of selfing, LMM 5386 line was genetically stable and showed no separation phenomenon.
The experiments were performed at Zaozhuang University, Zaozhuang, Shandong, China. Grains were sown at a density of 300 seeds m−2. The plot size was 2 × 2 m with six rows (0.25 m between rows). Each plot was used for sample collection. The experiments were conducted at least in triplicates.
Leaves of 50 lesion mimic F2 lines were pooled to construct a bulk RNA sample. Morex was additionally processed as a parental check. Total RNA was extracted from each sample using TRIzol reagent following the manufacturer’s specifications (Invitrogen). The quality and quantity of each RNA sample were measured using an Agilent 2100 Bioanalyzer (Agilent Technologies, CA, USA).
The mRNAs were isolated from the total RNA using Dynabeads mRNA DIRECT Kit (Invitrogen) and were separated into short fragments using a fragmentation buffer. Using these short fragments as templates, random primers, and a SuperScript double-stranded cDNA synthesis kit (Invitrogen), double-stranded cDNA was synthesized. Ligated fragments were then generated through a series of reactions that included the purification of the PCR products, end repair, dA-tailing, and ligation of the Illumina adapters. After agarose gel electrophoresis, suitable fragments were selected for PCR amplification. The final library was evaluated using quantitative RT-PCR with a StepOne Plus Real-Time PCR system (Applied Biosystems, Foster City, CA, USA). Sequencing reactions were performed on an Illumina HiSeq 2000 (Biomarker Technologies Corporation, Beijing, China). Single nucleotide polymorphisms (SNPs) and insertion deletion polymorphisms (InDels) were called using the HaplotypeCaller module in GATK v3.2.
Flag leaves of WT and LMM 5386 lines were collected, and three biological replicates were used for RNA-seq. GO and KEGG analyses were performed to identify DEGs enriched in GO terms and metabolic pathways, respectively. A corrected p-value (≤ 0.05) was set as the threshold for significantly enriched GO terms and KEGG pathways.
H2O2 content and production rates were measured according to previously reported methods (Hao et al., 2018). Accumulation of and H2O2 in flag leaves was visually evaluated by staining with NBT (0.5 mg mL−1, pH 7.6) for and DAB (1 mg mL−1, pH 3.8) for H2O2.
The GSH and Gly content was measured according to previously reported methods (Noctor et al., 1997).
The activities of superoxide dismutase (SOD), catalase (CAT), ascorbate peroxidase (APX), peroxidase (POD), glutathione reductase (GR), and glutathione-S-transferases (GST) were detected based on previously described methods: SOD (Wang et al., 2020), CAT (Yang et al., 2020), APX (Wang et al., 2017), POD (Wang et al., 2016b), GR (Yin et al., 2017), and GST (Li et al., 2018). All samples were analyzed using a Shimadzu UV-1900i spectrophotometer.
Total RNA was isolated from leaves using TRIzol Reagent (Invitrogen, Carlsbad, CA, USA). The RNA was used to produce cDNA using a reverse transcription kit (Vazyme, Nanjing, China). Quantitative reverse transcription PCR was performed using the ChamQ Universal SYBR qPCR Master Mix Kit (Vazyme, China). The expression of a specific gene versus a control was determined using the formula 2−△△CT. Actin was evaluated as the control gene (Hao et al., 2018). Information on the genes analyzed is presented in Supplementary Table 3.
F. graminearum is an engineered strain expressing the AmCyan fluorescent protein. The resistance to F. graminearum was tested according to previously reported methods (Hao et al., 2018). The lesion length was measured at 3DAI and 7 DAI using the ImageJ program.
Leaf tissues were infiltrated with a solution of spores of B. graminis f. sp. hordei (Lumbroso et al., 1982). Leaf tissues were then boiled for 10 min in a solution containing glycerol, lactic acid, phenol, and distilled water (1: 1: 1: 1, v/v/v/v) with 0.5 mg/mL trypan blue, and maintained at room temperature for 6–8 h. Leaf tissues were then clarified overnight in 2.5 mg/mL chloral hydrate. Leaf samples were examined using an Olympus BX50 light microscope (Olympus, Tokyo, Japan).
All analyses were performed at least in triplicate. The IBM SPSS Statistics program was used to perform the statistical analyses. All comparisons were analyzed using factorial ANOVA. Differences between the means among the lines were compared using Duncan’s multiple range tests at 0.05 probability levels.
We found that several brown spots were spontaneously produced in the leaves of LMM 5386 lines under field conditions (Figure 1A). Three independent lines (5386-1, 5386-2, and 5386-3) of LMM 5386 mutants were selected for phenotype identification. The brown spot area per leaf was observed and quantified in WT and LMM 5386 lines, with that of the LMM 5386 line plants being significantly higher than of the WT plants (Figures 1B, C).
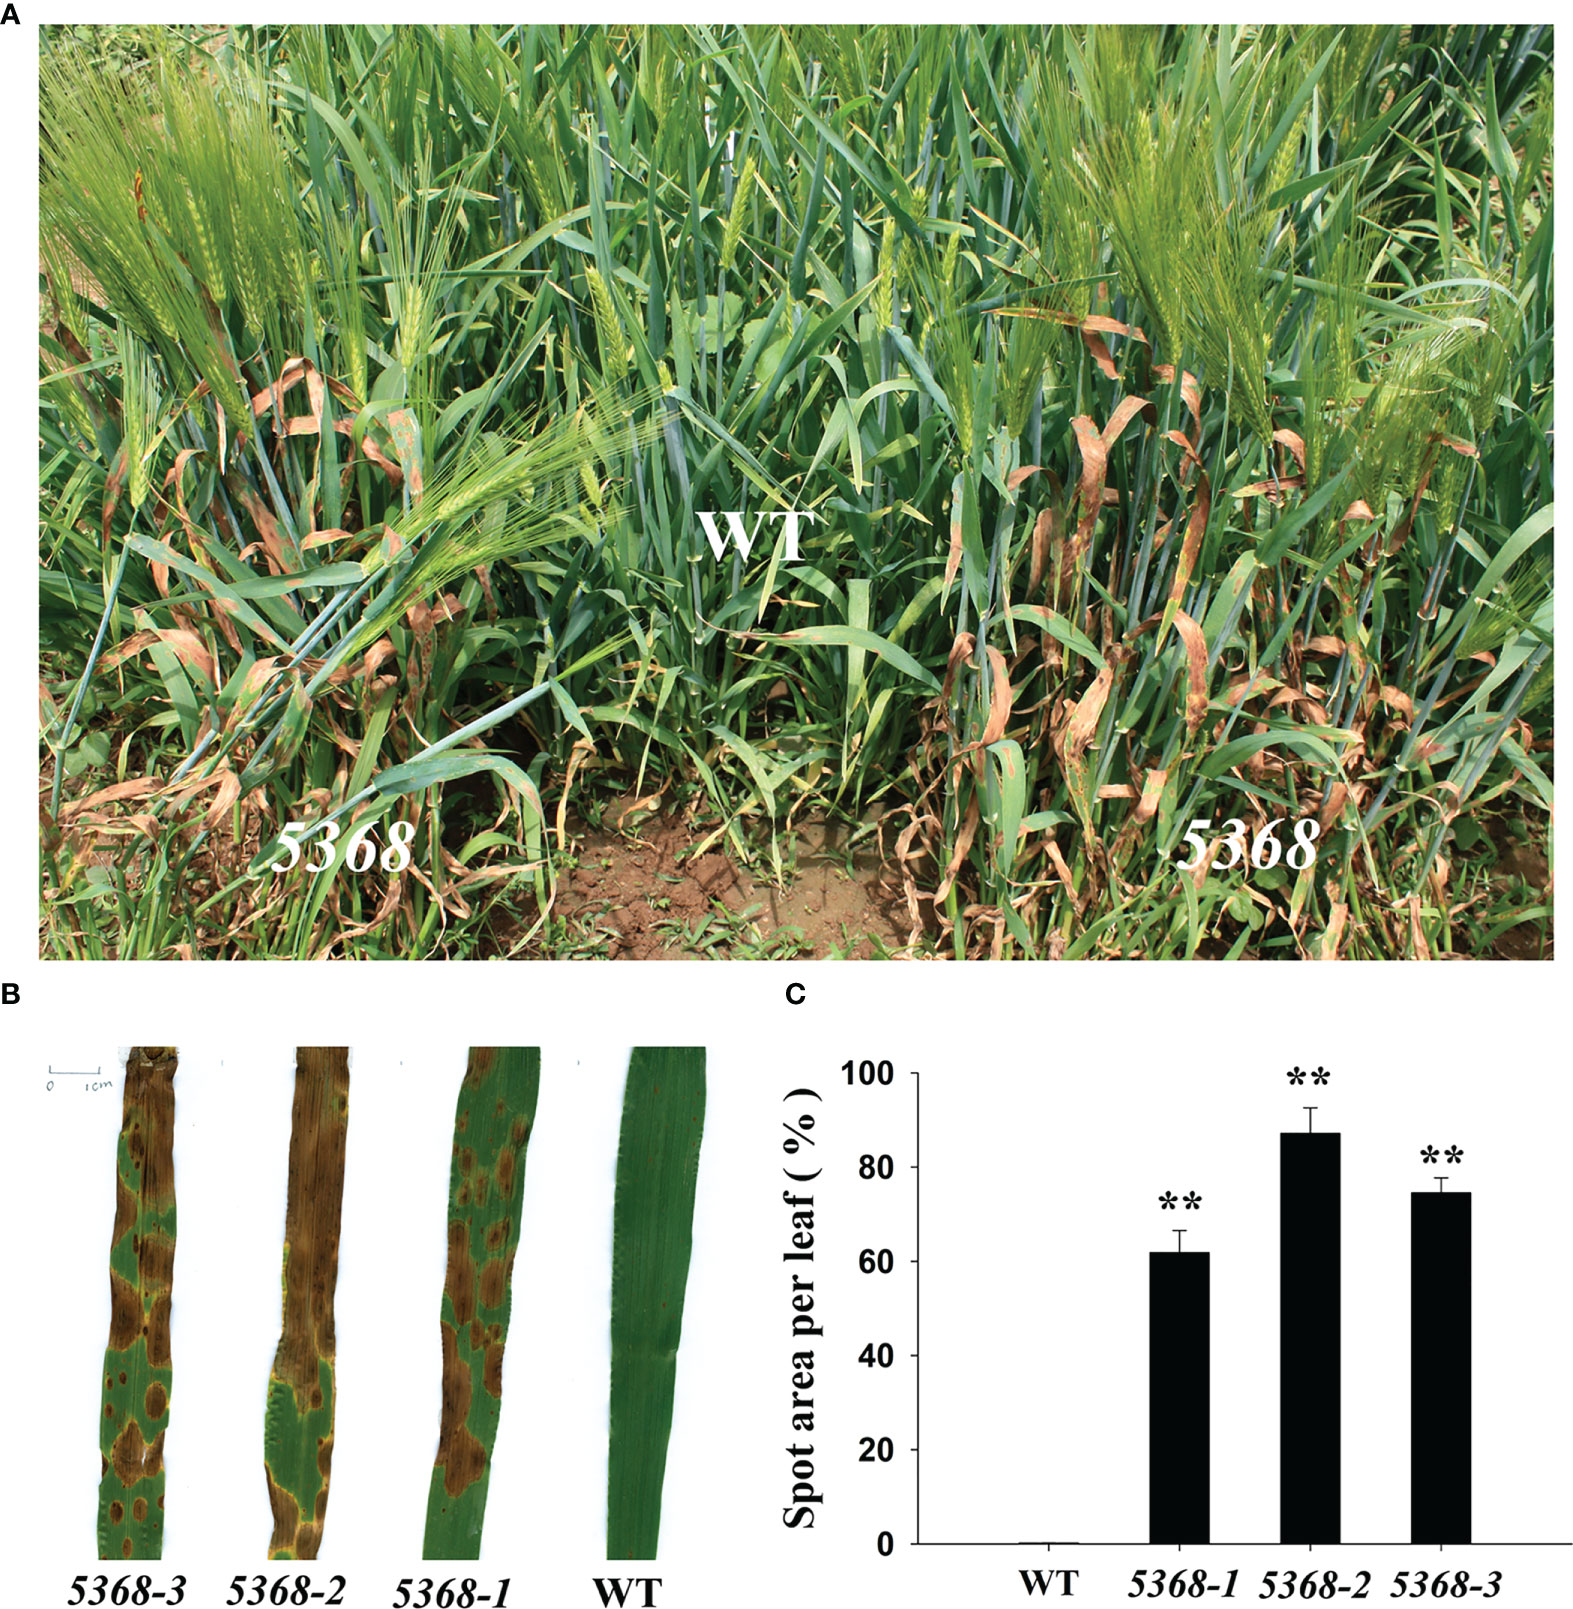
Figure 1 Phenotype differences between WT and LMM 5386 lines in the field. (A) Phenotype in the field; (B) leaf brown spots; (C) spot area per leaf. Values are means ± SD based on 30 replicates. Error bars indicate standard deviations. **P < 0.01.
For genetic analysis of LM genes in the LMM 5386 lines, we formed the F2 population with Morex (whole genome sequencing, WGS), including 343 individual lines, and we randomly analyzed the phenotype data of this F2 population. There were 89 LM lines and 254 non-LM lines, meeting the 1:3 separation ratio by Chi-square test (χ2 = 0.25, P = 0.62 > 0.05) (Table 1). Overall, LM 5386 behaved as a single recessive gene.
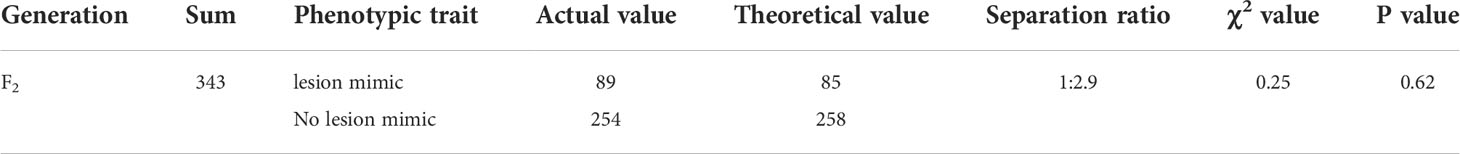
Table 1 The genetic analysis of lesion mimic 5386/Morex F2 population.
Using the BSR-Seq data, 865 high-confidence SNPs and 72 InDels were revealed between the F2 recessive homozygous RNA pool and Morex RNA. Among the 937 co-segregating polymorphisms, 589 (62.8%) were localized on the chromosome 3H (Supplementary Figure 1).
To better understand the mechanism behind LM formation in the LMM lines, we performed RNA-seq analyses using flagged leaves of the WT and LMM 5386 lines. These analyses provided 65.80 Gb of clean bases, and the percentage of Q30 in each sample was not less than 93.89%, with 91.62–92.09% of the reads being accurately mapped to the reference genome and 2.38–3.69% of the reads being mapped to multiple genome sequences (Supplementary Table 1). The Pearson correlation coefficients among biological replicates were higher than 0.95 (Supplementary Figure 2).
Compared with that in the WT lines, 1453 differentially expressed genes (DEGs) were found in the LMM 5386 lines, of which 1260 were upregulated and 193 were downregulated (Figure 2, Supplementary Table 2). DEGs with the same or similar expression patterns were placed into groups based on hierarchical clustering analysis. The nine largest DEGs (Group 1) were enriched in the GSH metabolic process, GSH transferase activity, anchored component of the plasma membrane, aleurone grain membrane, and cytokinin biosynthetic process (Supplementary Figure 3).
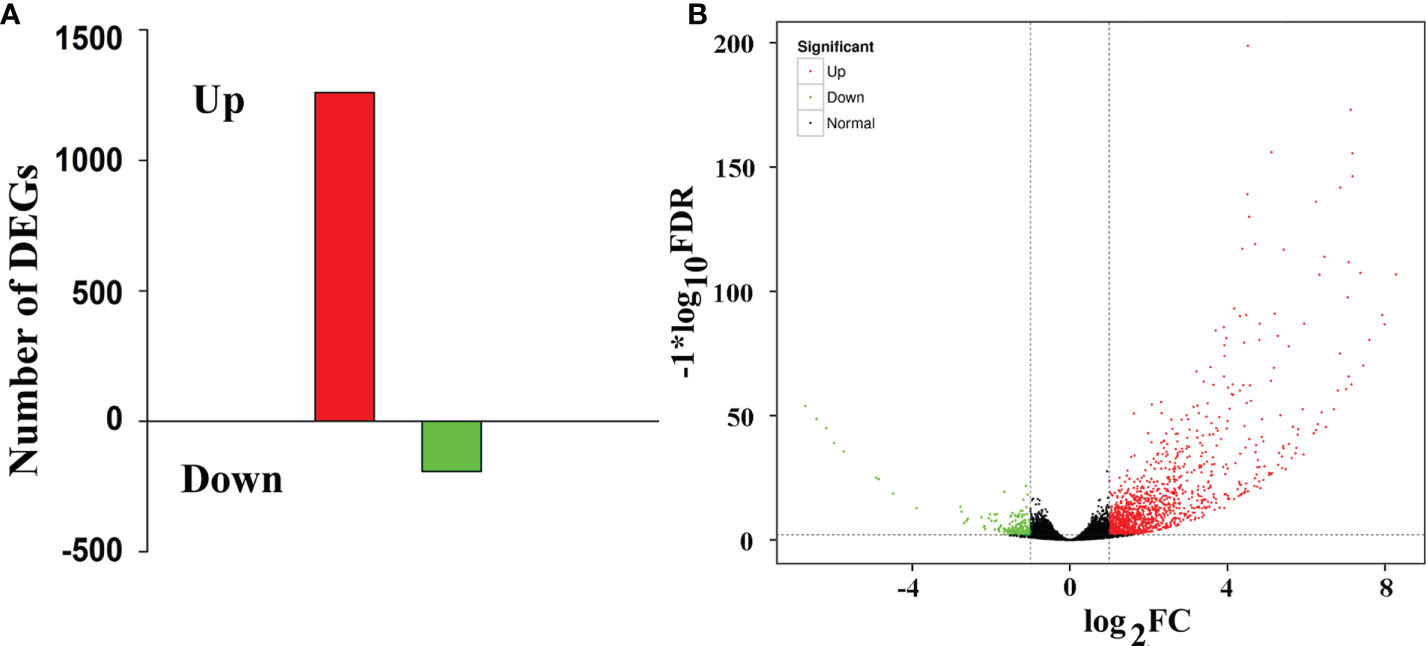
Figure 2 RNA-Seq analyses of WT and LMM 5386. (A) Changes in the gene expression profiles in WT- and LMM 5386-line flag leaves; (B) differentially expressed genes (DEGs). Values are means ± SD based on three replicates.
The functions of the 1453 DEGs were verified using the gene ontology (GO) database (http://www.geneontology.org), providing annotations of the biological processes, molecular functions, and cellular components. Specifically, we compared the biological process between the WT and LMM 5386 lines. Among the upregulated DEGs, those encoding the protein phosphorylation, oxidation-reduction, defense response, transmembrane transport, flavonoid biosynthetic, GSH metabolic, and flavonoid glucuronidation were notably over-represented (Figure 3A, Supplementary Table 2). Among the downregulated DEGs, many were significantly enriched in oxidation-reduction, cell redox homeostasis, light stimulus, light harvesting in photosystem I, lipid transport, and protein−chromophore linkage (Figure 3B, Supplementary Table 2). In both upregulated and downregulated DEGs, a substantial number of genes were enriched in oxidation-reduction (Figure 3).
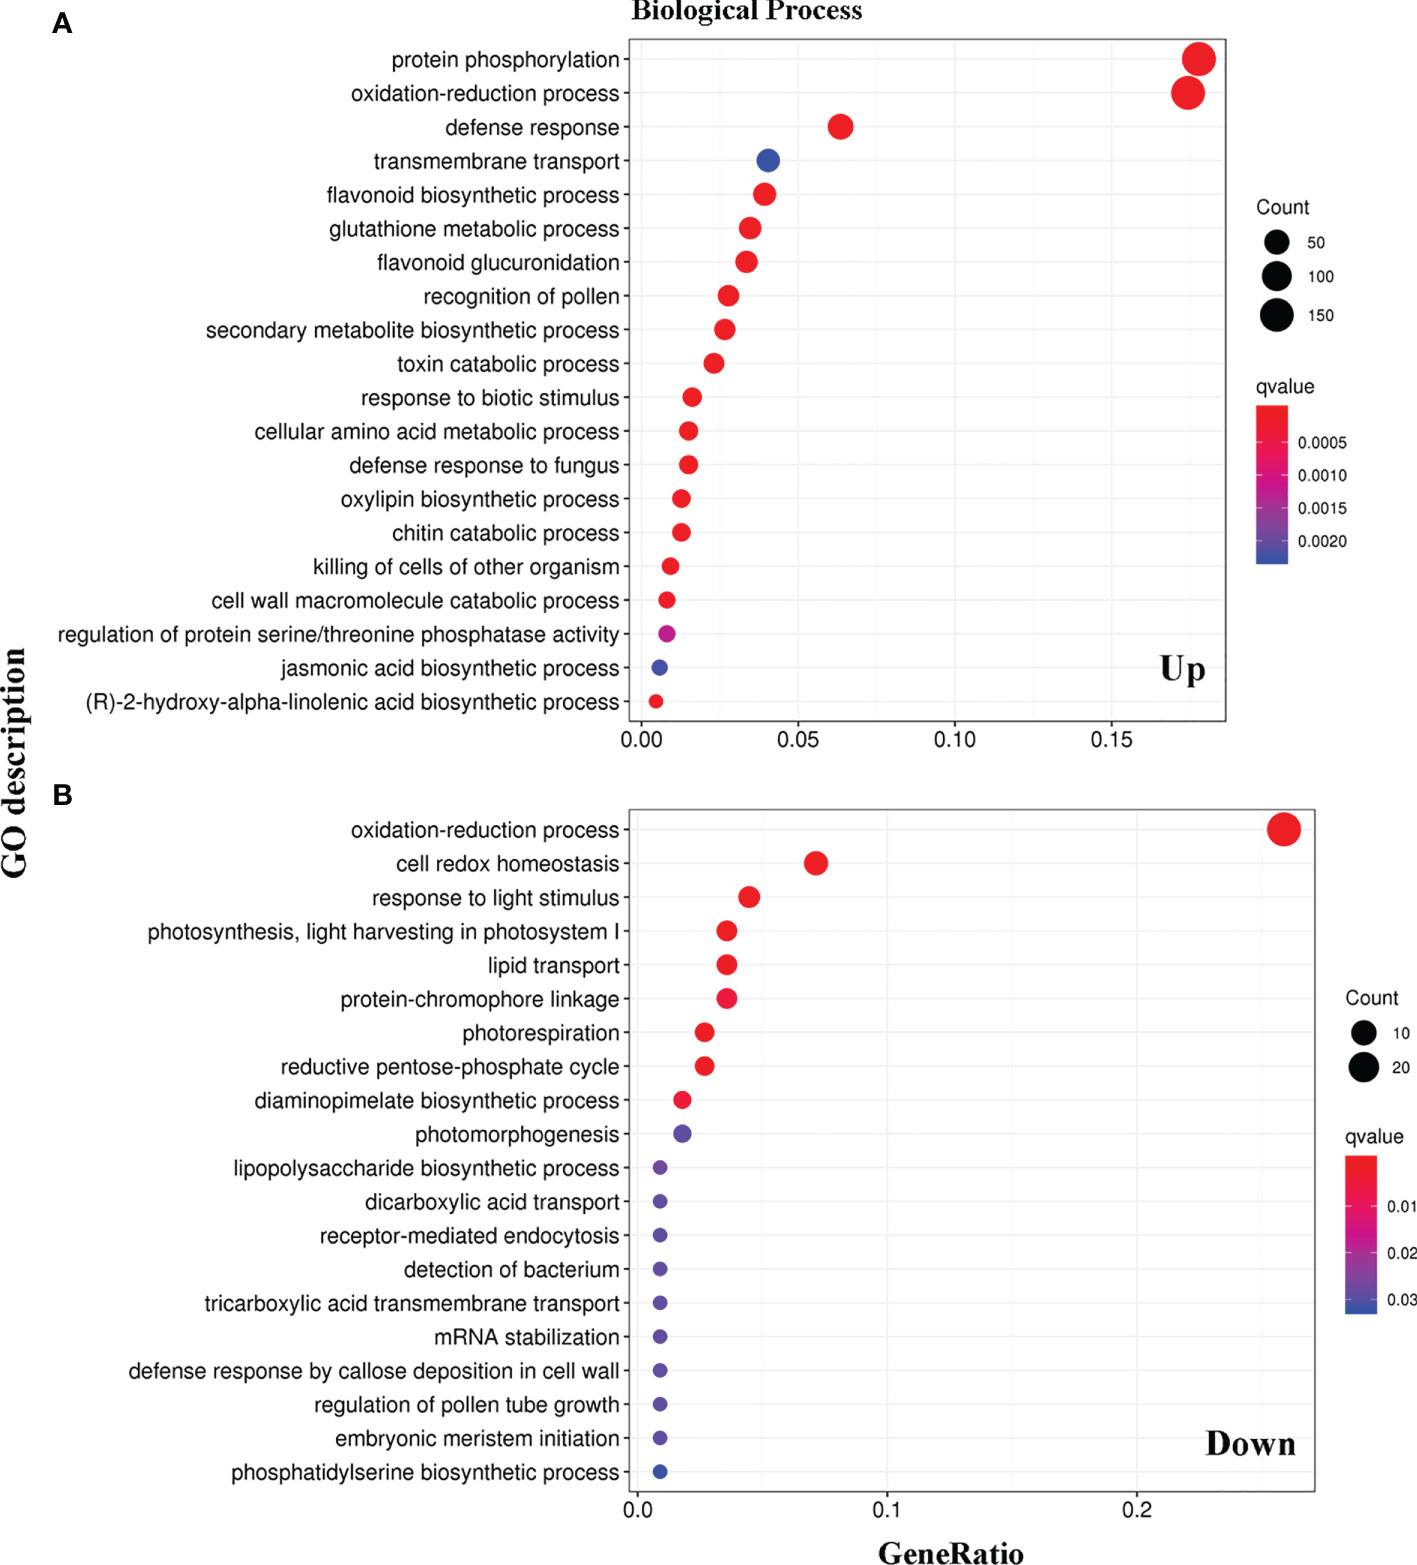
Figure 3 Categories and distribution of Gene Ontology (GO) terms in WT and LMM 5386 lines. (A) upregulated differentially expressed genes (DEGs); (B) downregulated differentially expressed genes (DEGs).
To compare the DEG metabolic pathways in the WT and LMM 5386 lines, we used the Kyoto Encyclopedia of Genes and Genomes (KEGG) database (https://www.genome.jp/kegg/pathway.html). Among the upregulated DEGs, many genes were significantly enriched in GSH metabolism, isoquinoline alkaloid biosynthesis, phenylalanine, tyrosine biosynthesis, tryptophan biosynthesis, tyrosine metabolism, alpha−linolenic acid metabolism, amino acid biosynthesis, and plant−pathogen interactions (Figure 4A, Supplementary Table 2). Among the downregulated DEGs, many genes were significantly enriched in photosynthesis antenna proteins, glyoxylate metabolism, dicarboxylate metabolism, carbon fixation in photosynthetic organisms, and nitrogen metabolism (Figure 4B, Supplementary Table 2). Lastly, in both upregulated and downregulated DEGs, a considerable number of genes were enriched in GSH and nitrogen metabolism (Figure 4).
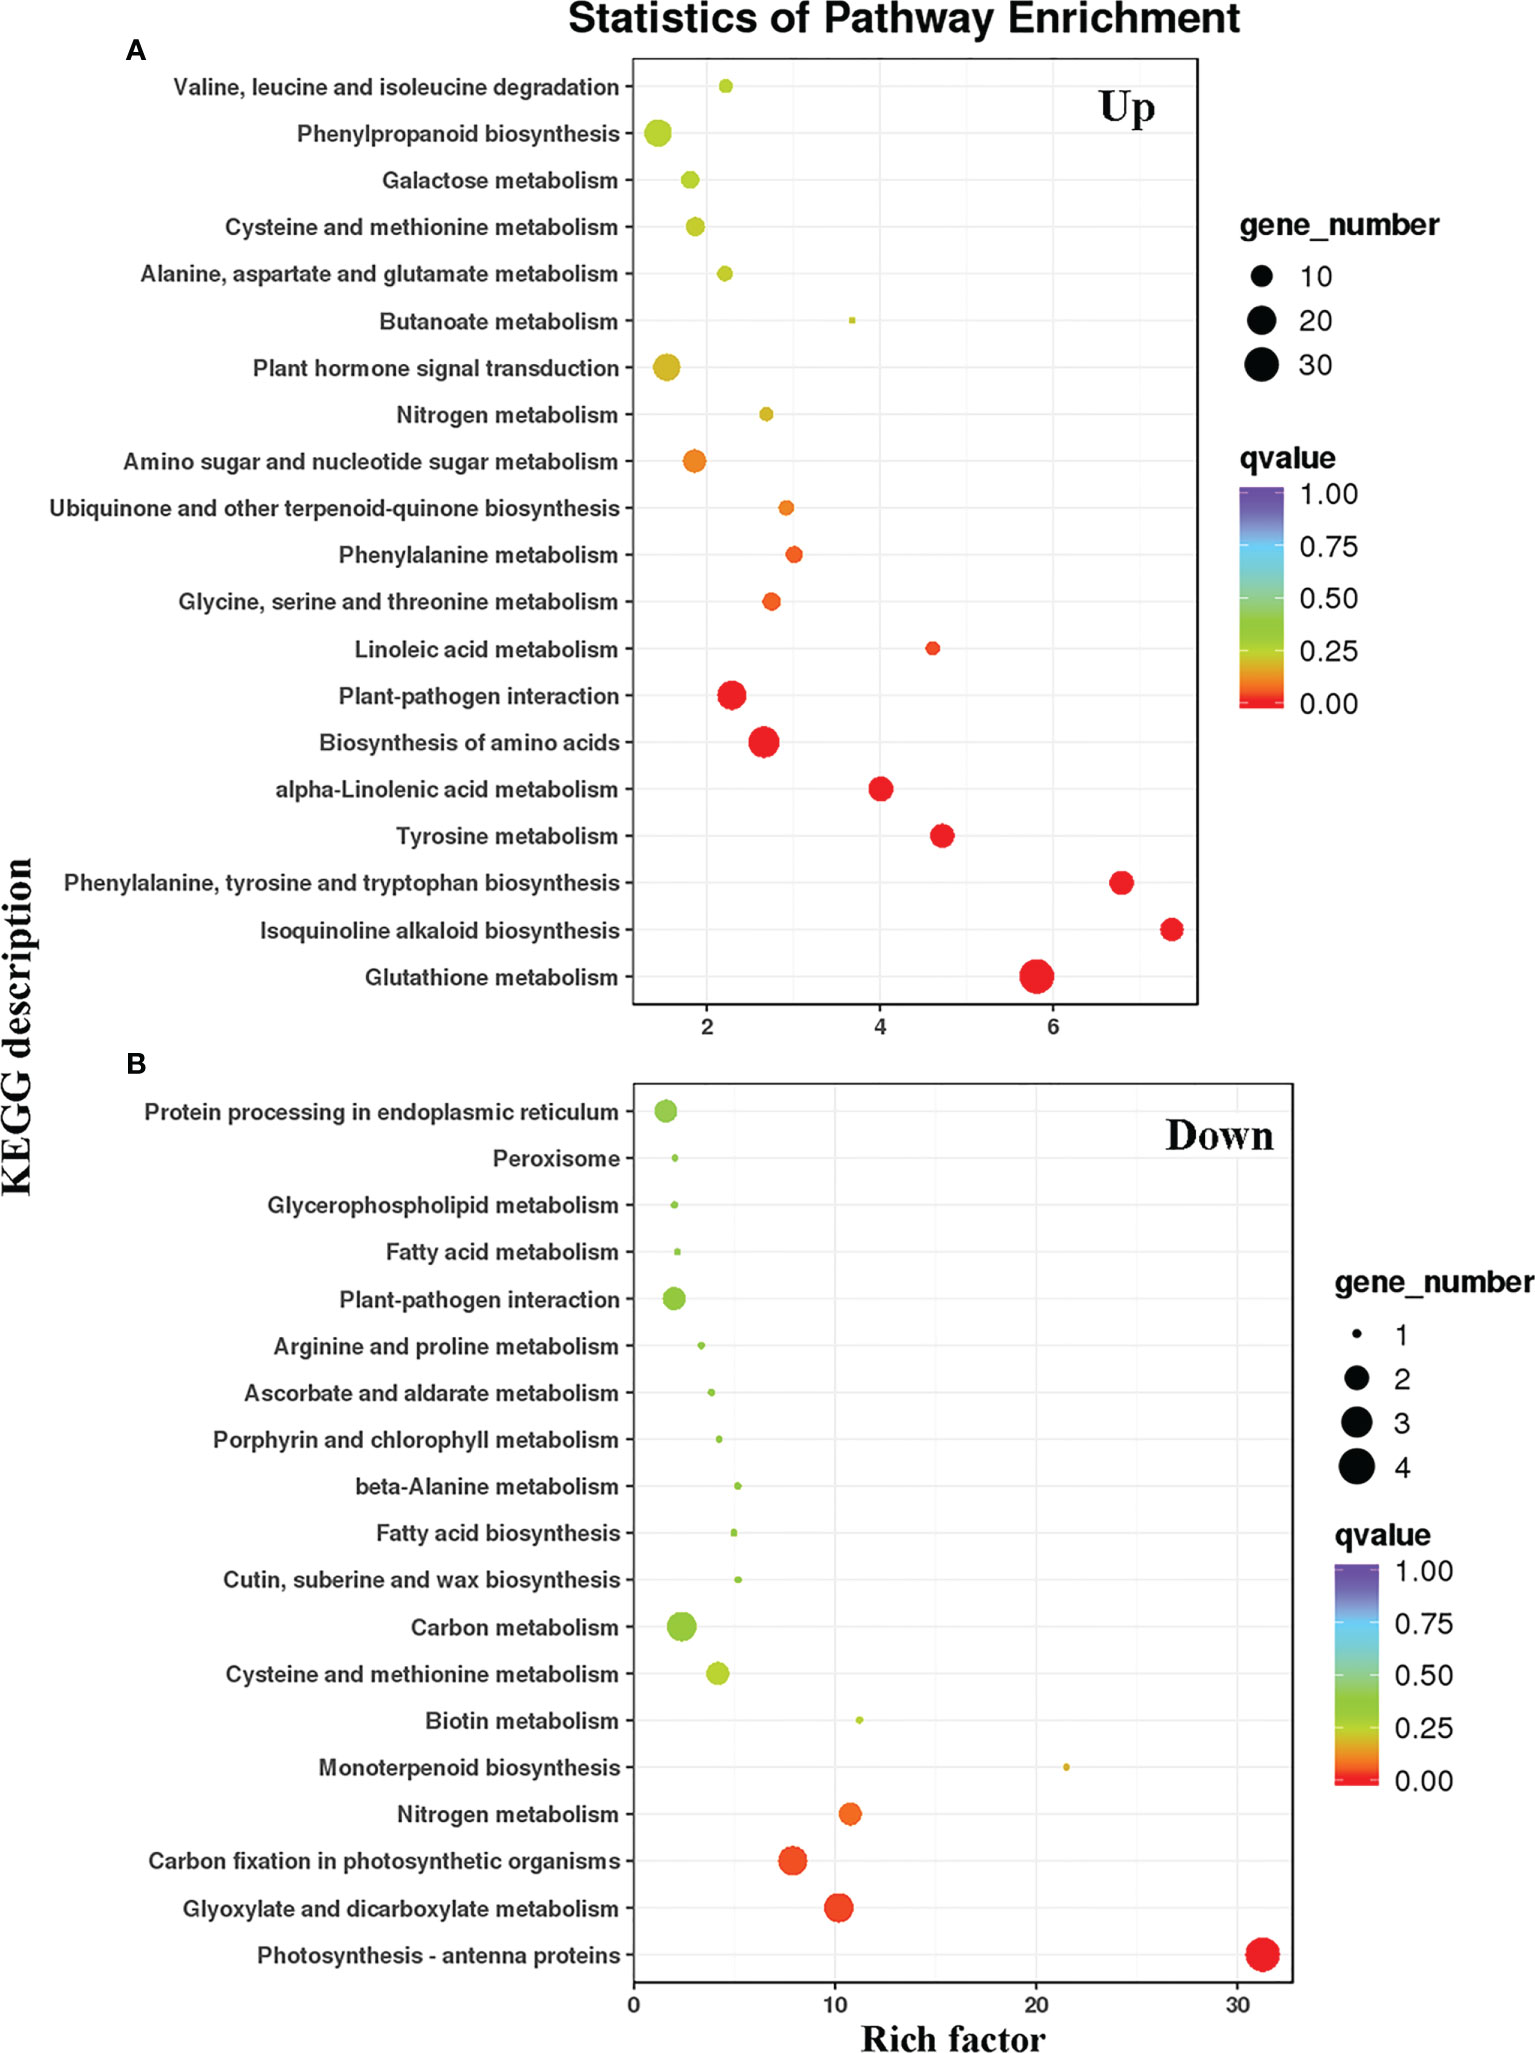
Figure 4 KEGG pathways of prominently enriched differentially expressed genes (DEGs) in WT and LMM 5386 lines. (A) upregulated differentially expressed genes (DEGs); (B) downregulated differentially expressed genes (DEGs).
GO analysis showed that many DEGs were enriched in the oxidation-reduction process (Figure 3). Therefore, we compared the H2O2 contents and production rates between the WT and LMM 5386 lines, which were determined by diaminobenzidine (DAB) and nitroblue tetrazolium (NBT) staining, respectively. The LMM 5386 line plants was heavier in color when stained with NBT (Figure 5A) and DAB (Figure 5C) than the WT plants. This indicated that there were higher concentrations of and H2O2 in LMM 5386 lines. We further confirmed this pattern by quantifying the production rates and H2O2 contents. Similarly, LMM 5386 line plants showed a relatively higher production rate and H2O2 content than the WT plants (Figures 5B, D).
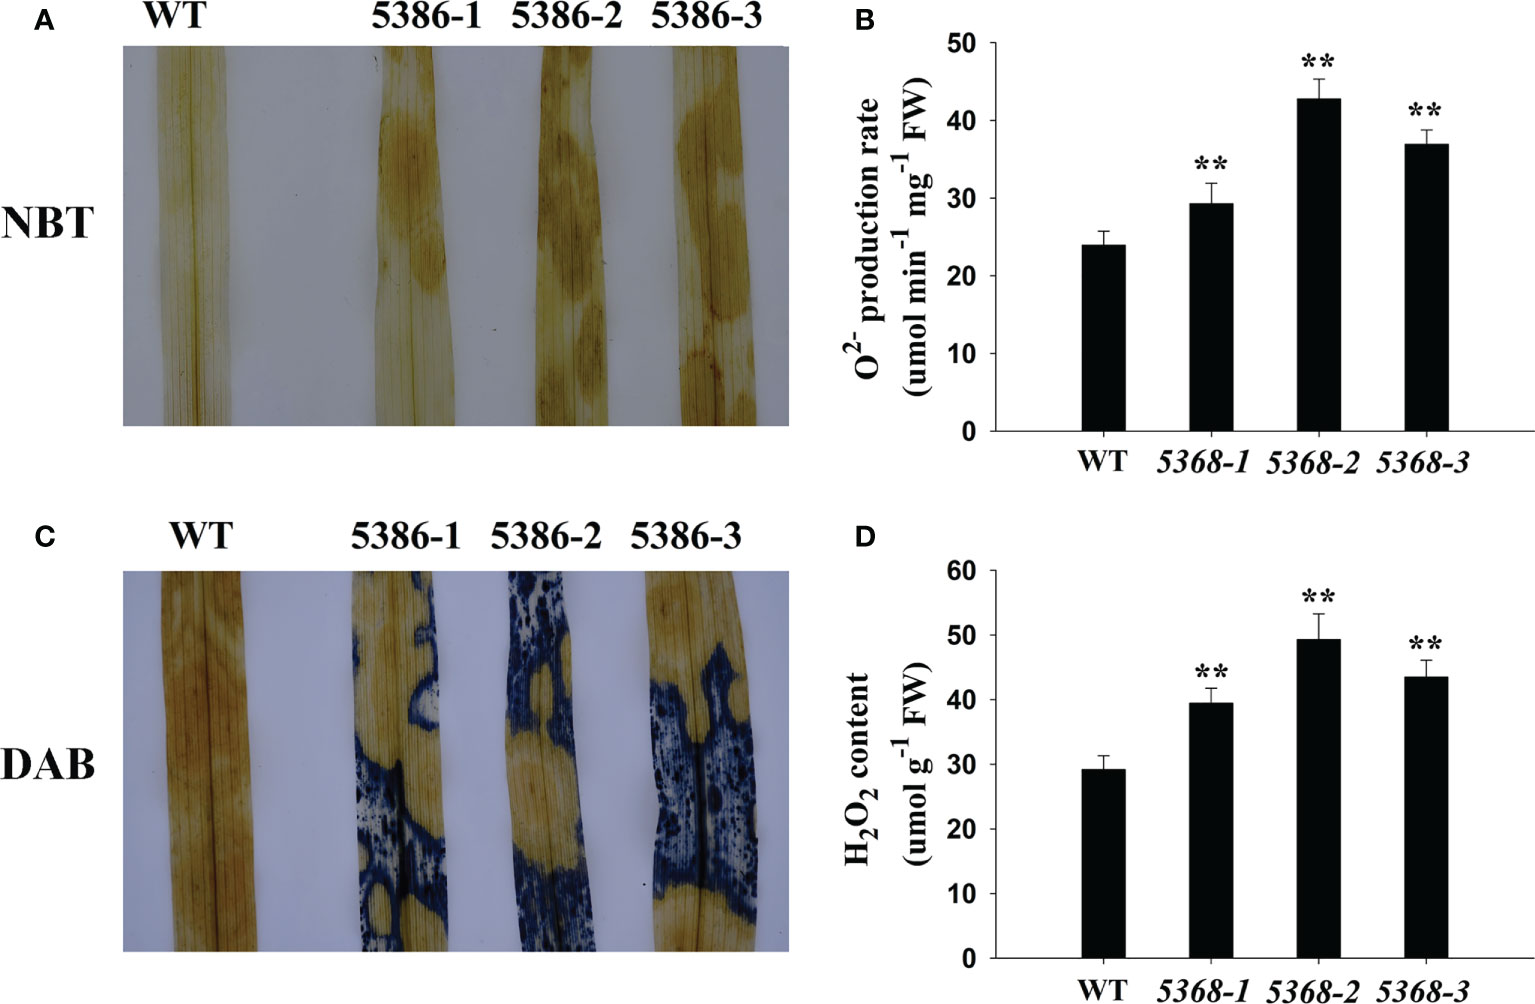
Figure 5 Changes in reactive oxygen species (ROS) accumulation in flag leaves in WT and LMM 5386 lines. (A) NBT staining results for ; (B) production rate; (C) DAB staining for H2O2; (D) H2O2 content. Values are means ± SD of three replicates. Error bars indicate standard deviations. **P < 0.01.
KEGG analyses showed that many DEGs were significantly enriched in GSH and nitrogen metabolism (Figure 4); therefore, we compared the GSH and Gly contents between the WT and LMM 5386 line plants. Both GSH and Gly contents were significantly lower in LMM 5386 line plants than in the WT plants (Figure 6).
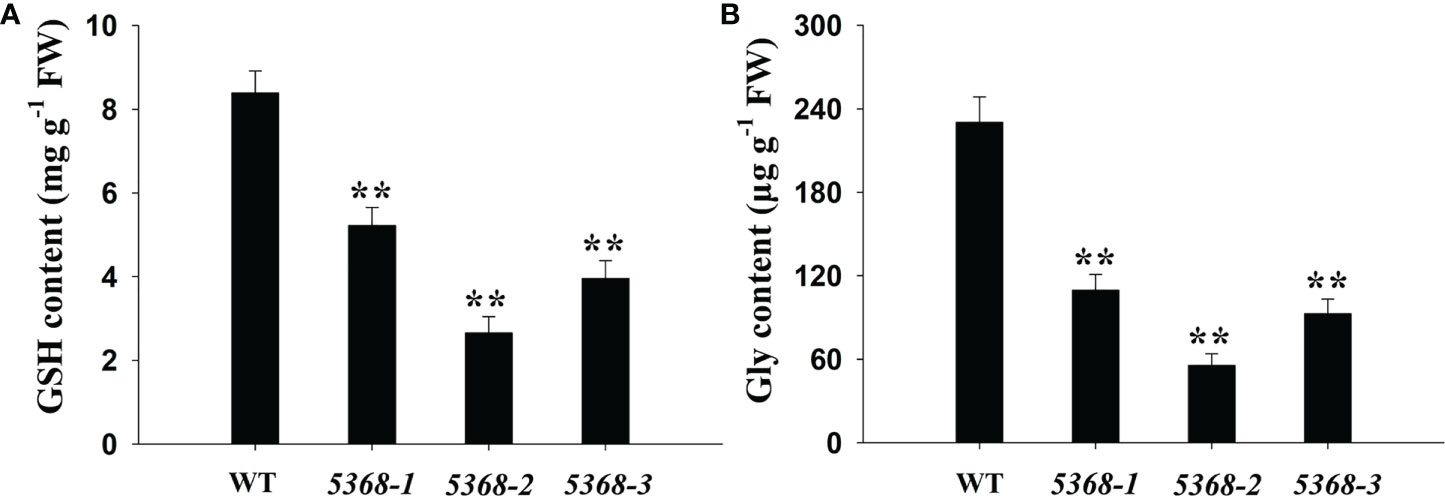
Figure 6 Changes in (A) GSH content and (B) Gly content in flag leaves between WT and LMM 5386 lines. Values are mean ± SD based on three replicates. Error bars indicate standard deviations. **P < 0.01.
Antioxidant enzyme activities were also compared between WT and LMM 5386 lines. We measured SOD (Figure 7A), CAT (Figure 7B), APX (Figure 7C), POD) (Figure 7D, GR (Figure 7E), and GST (Figure 7F) activity levels, which were significantly lower in the LMM 5386 line plants than in the WT plants. Nevertheless, the downregulation of GR and GST was significantly greater than that of SOD, CAT, APX, and POD in LMM 5386 lines.
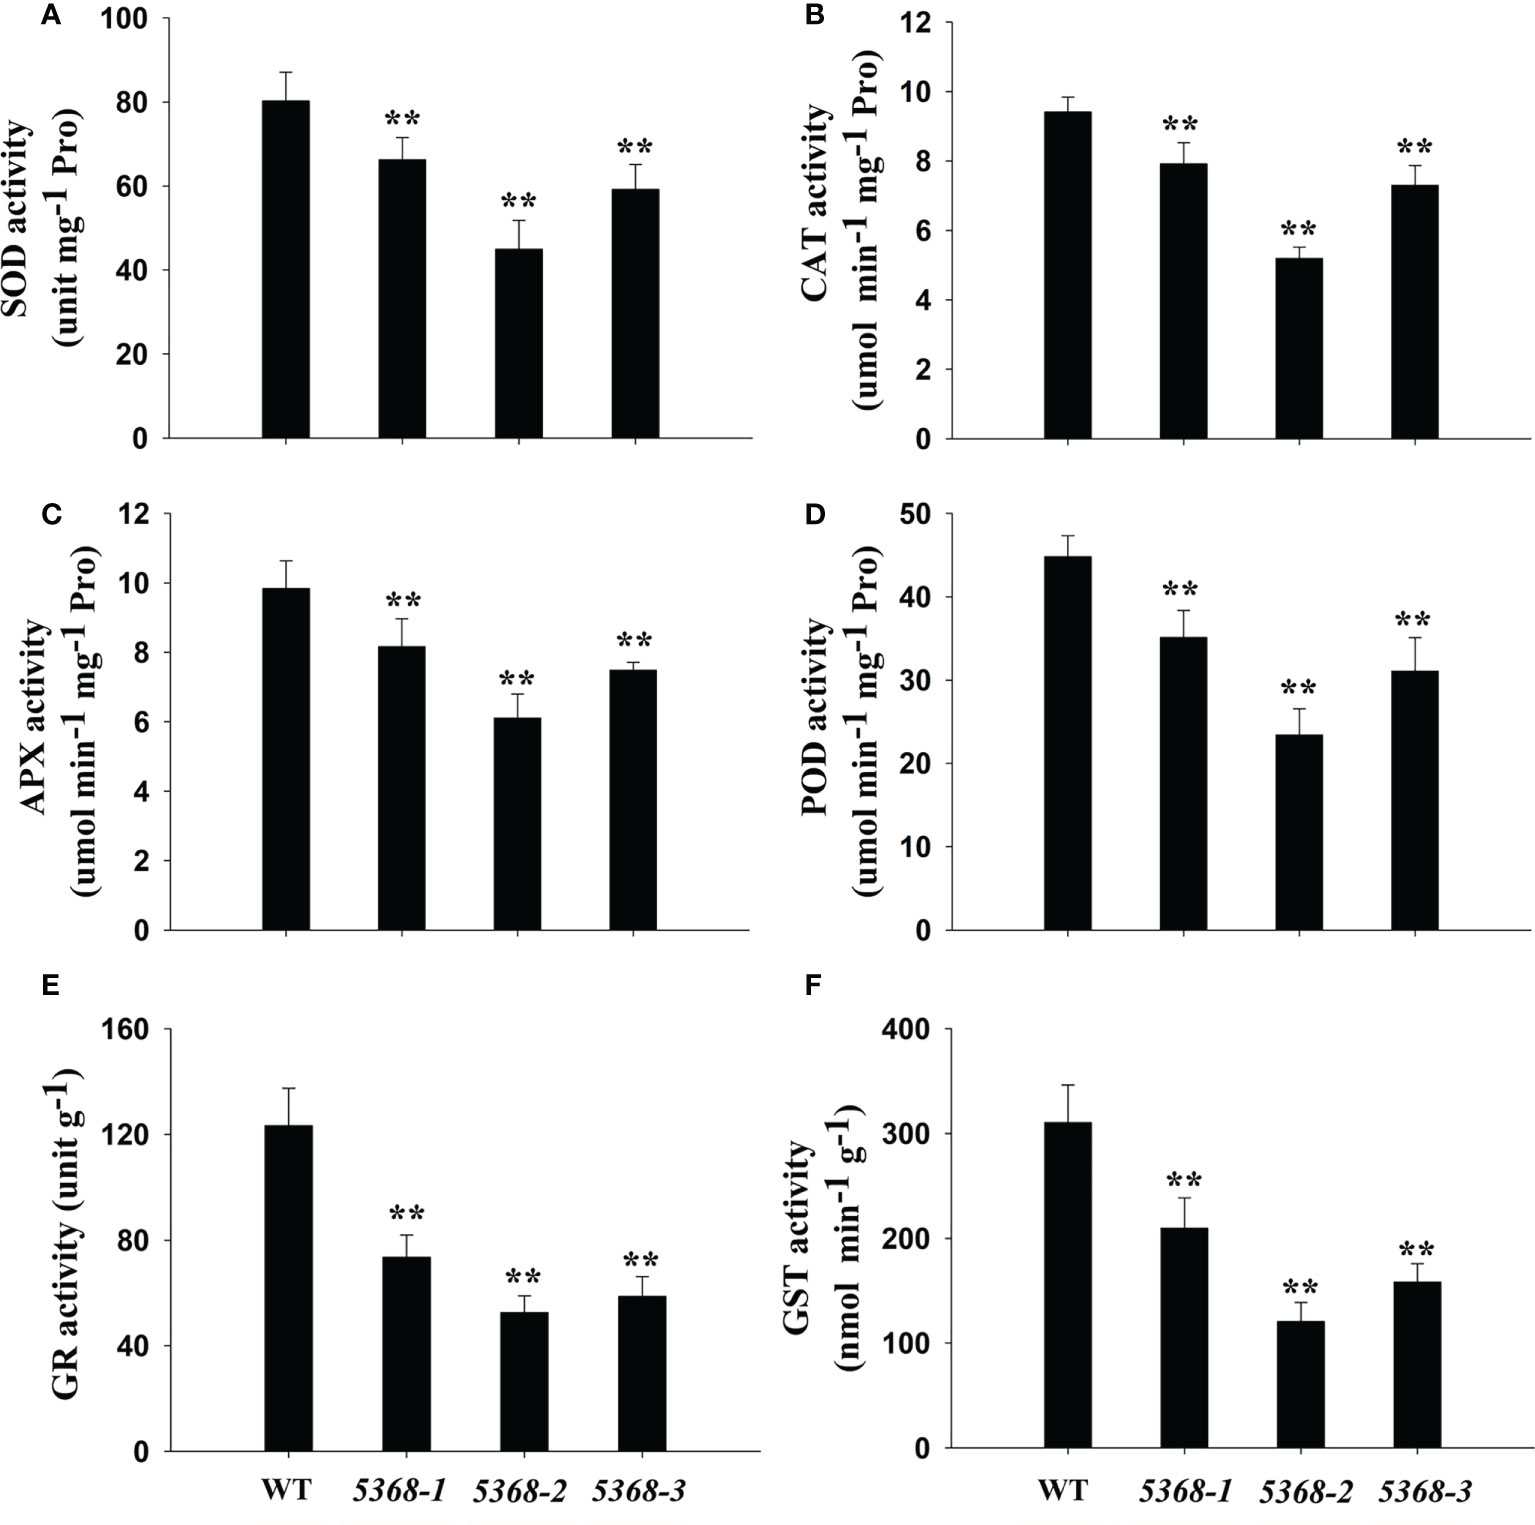
Figure 7 Changes in antioxidant enzyme activity in flag leaves between WT and LMM 5386 lines. (A) Superoxide dismutase (SOD), (B) catalase (CAT), (C) ascorbate peroxidase (APX), (D) peroxidase (POD), (E) glutathione reductase (GR), and (F) glutathione-S-transferases (GST) activity. Values are means ± SD of three replicates. Error bars indicate standard deviations. **P < 0.01.
ROS-scavenging related genes were detected between the WT and LMM 5386 lines. Cu/Zn-SOD encodes a chloroplastic copper/zinc superoxide dismutase and CAT encodes a catalase (Wang et al., 2016b). Those genes included Cu/Zn-SOD (Figure 8A), HvCAT1 (Figure 8B), HvAPX1 (Figure 8C), and HvGST6 (Figure 8D). As shown in Figure 8, transcription levels of the ROS-scavenging genes were significantly lower in the LMM 5386 lines than those in the WT lines.
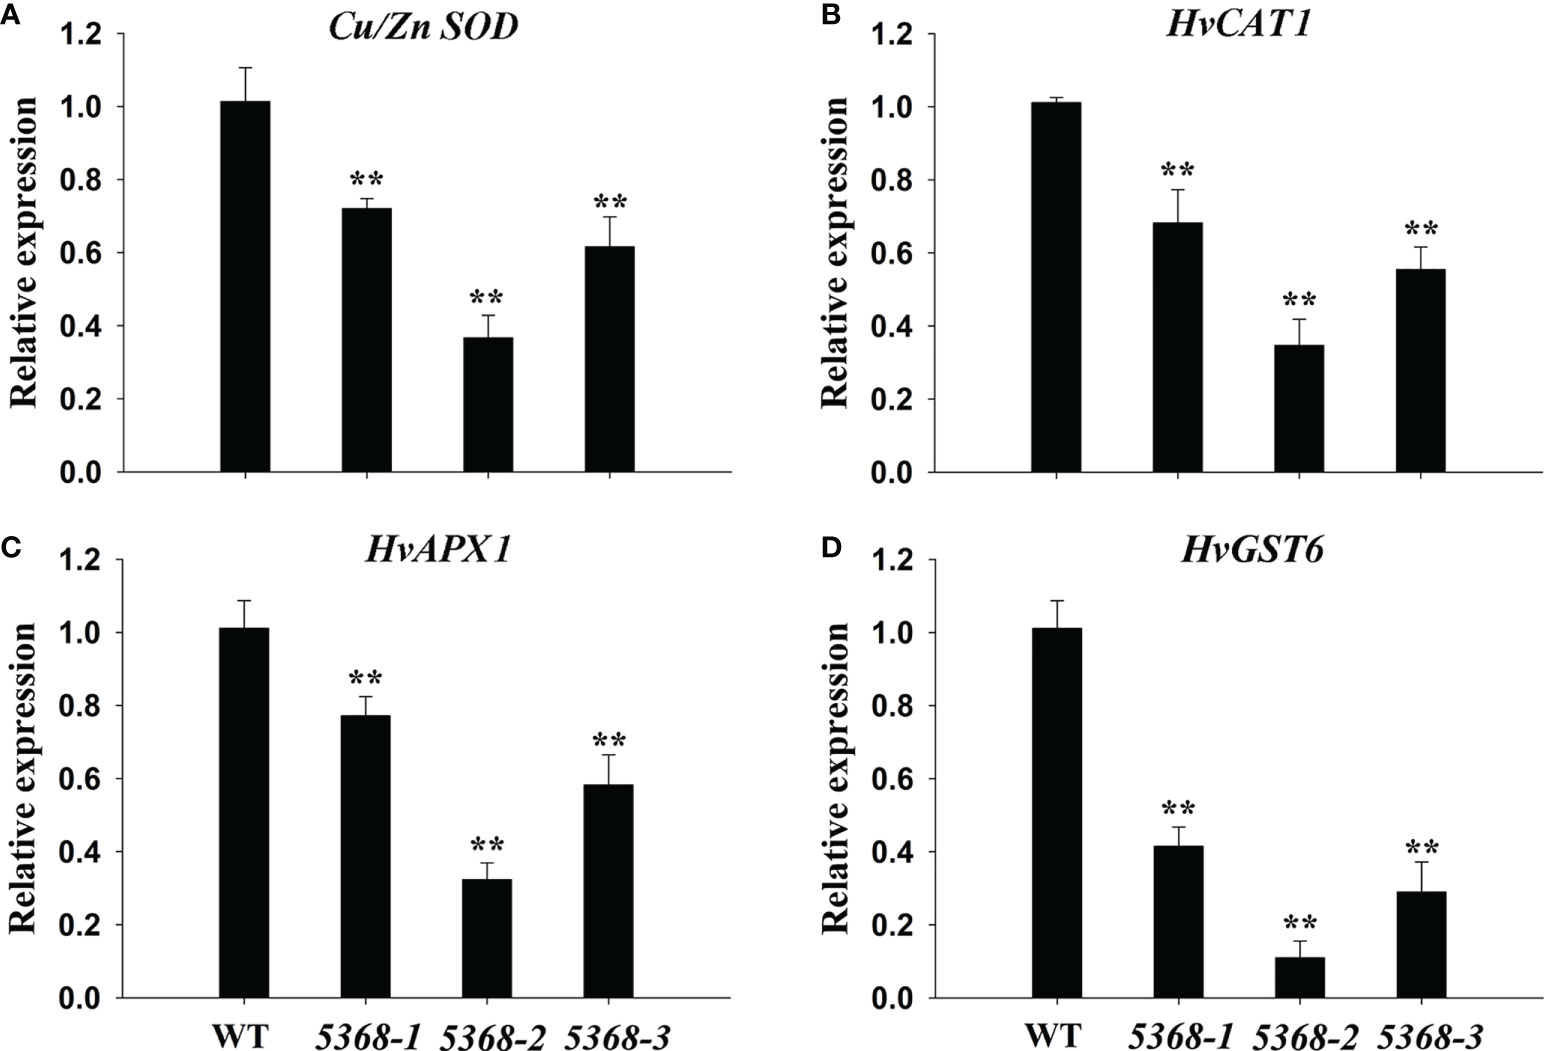
Figure 8 Relative expression of antioxidant enzyme genes in flag leaves of WT and LMM 5386 lines. (A) CU/ZN SOD, (B) HVCAT1, (C) HVAPX1, and (D) HVGST6. Values are means ± SD based on six replicates. Error bars indicate standard deviations. **P < 0.01.
RNA-seq analyses indicated that a considerable number of disease-resistance-associated genes were altered between the WT and LMM 5386 lines. Therefore, we determined the expression of six disease-resistance-related genes, that is, isochorismate synthase (HvICS) (Figure 9A), ethylene response factor 1 (HvERF1) (Figure 9B), HvWRKY38 (Figure 9C), pathogenesis related protein-1a (HvPR1a) (Figure 9D), ethylene-responsive transcription factor 3 (HvERFC3) (Figure 9E), and flavonoid O-methyltransferase protein (HvFme) (Figure 9F). The expression levels of these disease-resistance-related genes in the LMM 5386 lines were significantly higher than those in the WT plants (Figure 9). We estimated F. graminearum growth by observation and quantification of the integrated fluorescence intensity (IFI) of the infected florets; LMM 5386 lines were associated with the lower IFI reading at 1 and 3 days after inoculation (DAI) (Figure 10). We further estimated the F. graminearum resistance by statistical IFI analyses of the infected leaves. Again, the IFI readings of the LMM 5386 line plants were significantly lower than those of the WT plants (Supplementary Figure 4). We also tested the LMM 5386 lines for their disease resistance responses to Blumeria graminis f. sp. hordei, which is a biotrophic pathogen. At 5 DAI, the LMM 5386 lines showed shorter mycelia relative to those of the WT (Supplementary Figure 5).
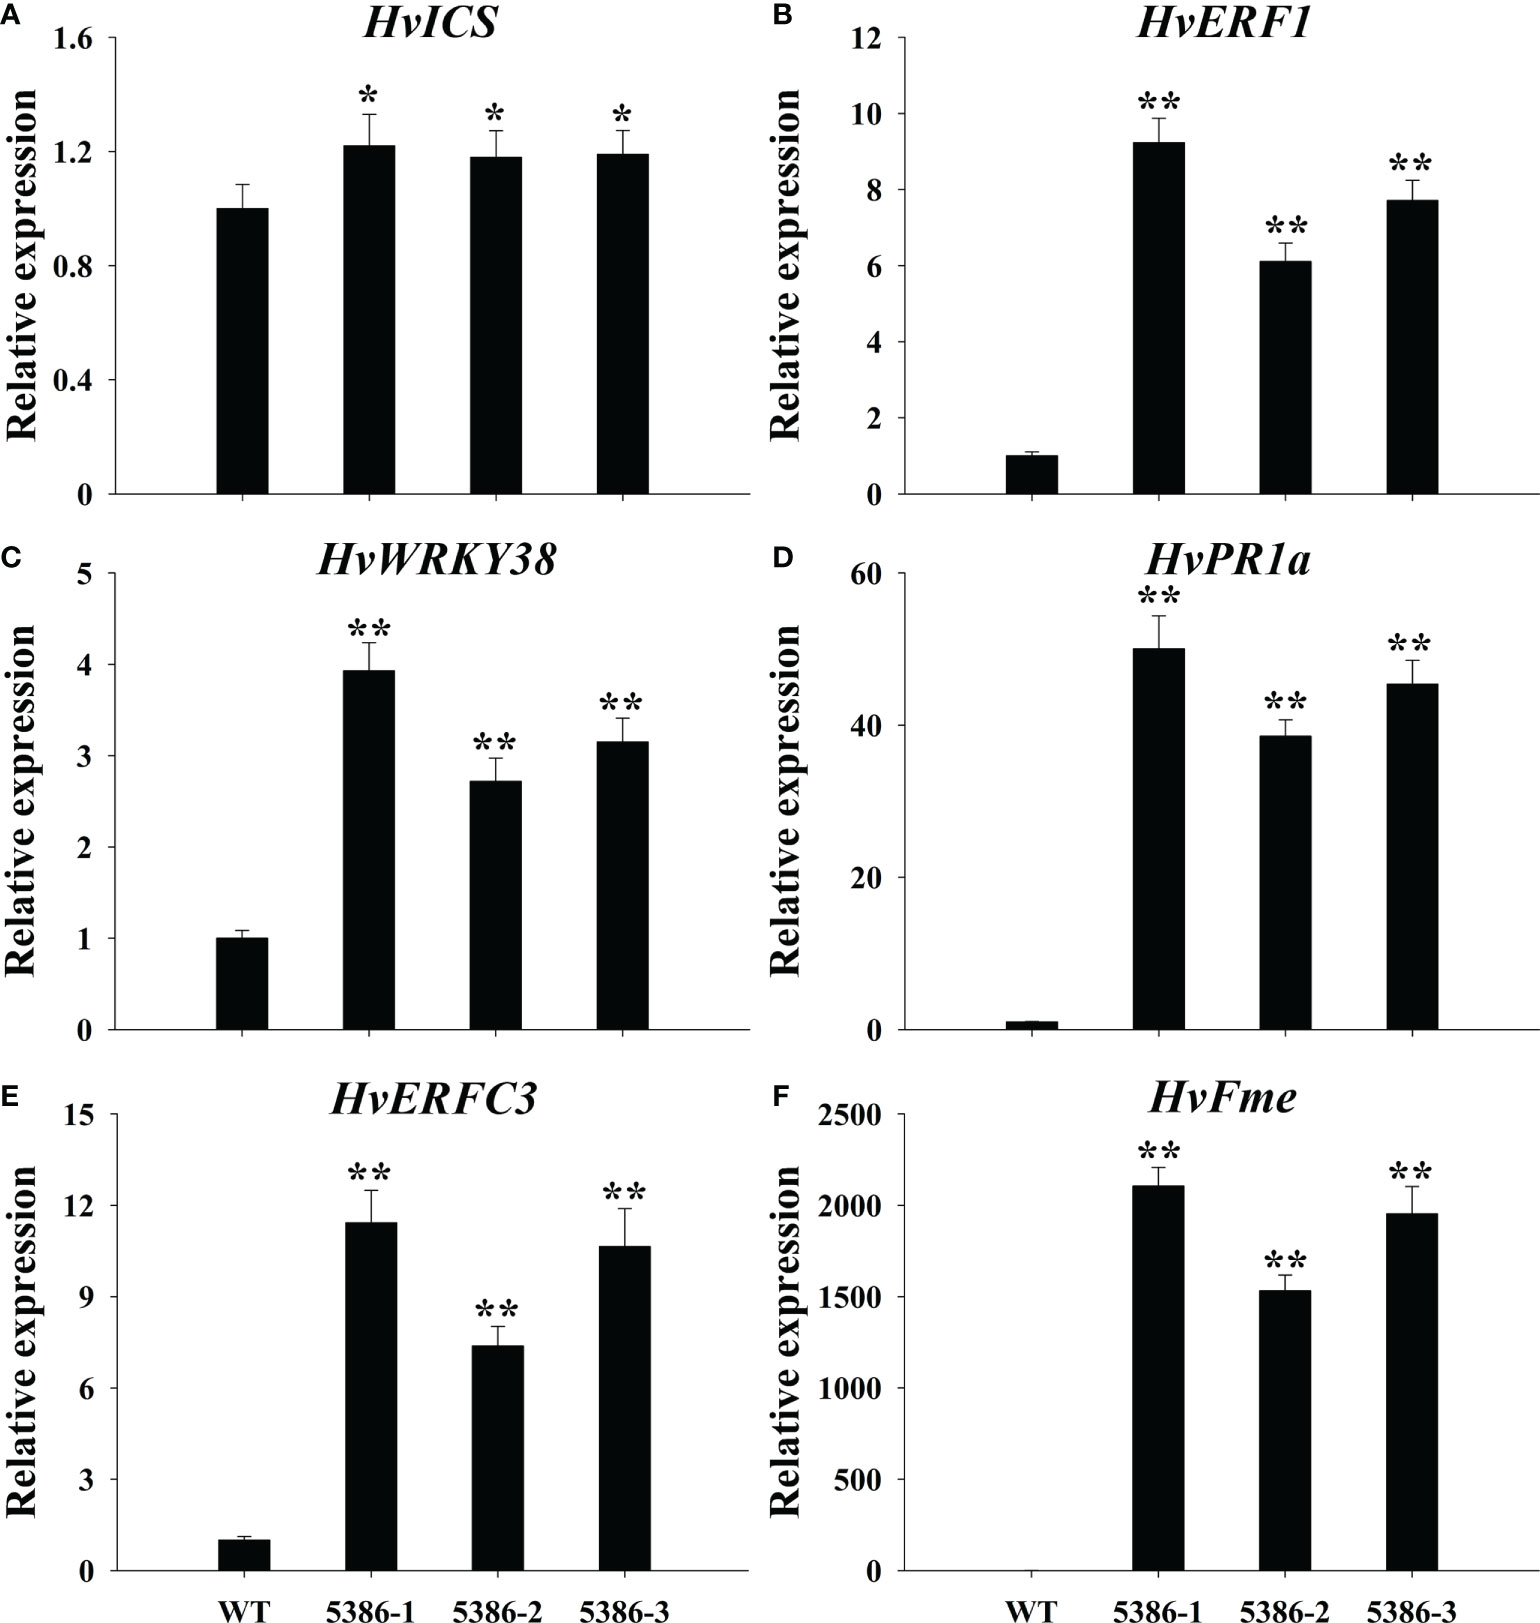
Figure 9 Relative expression of disease resistance-related genes in flag leaves of WT and LMM 5386 lines. (A) HvICS, (B) HvERF1, (C) HvWRKY38, (D) HvPR1a, (E) HvERFC3, (F) HvFme. Values are means ± SD based on six replicates. Error bars indicate standard deviations. *P < 0.05; **P < 0.01.
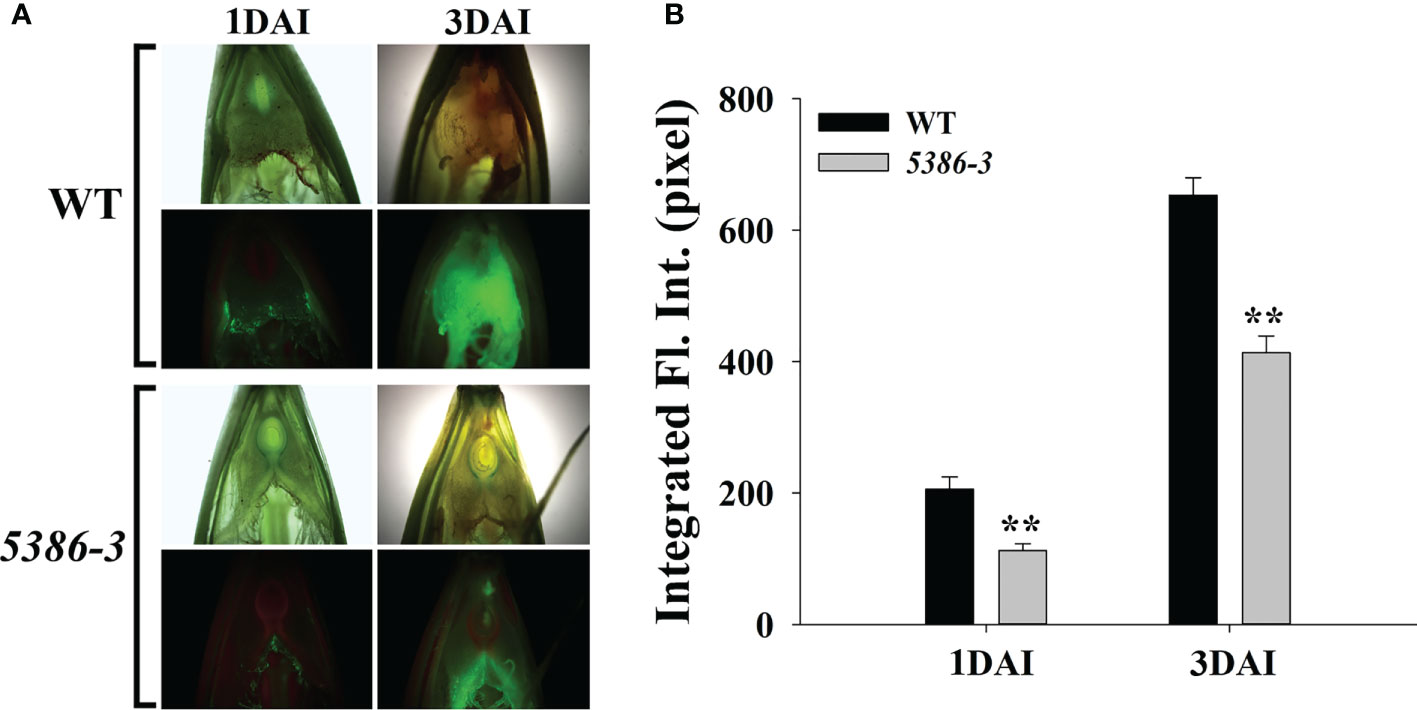
Figure 10 Phenotype differences between inoculated (F) graminearum in spikes between WT and LMM 5386 lines. (A) Green fluorescence phenotype 1 day after inoculation (DAI) and 3 DAI. (B) Integrated fluorescence intensity (IFI) at 1 DAI and 3 DAI. Values are means ± SD based on thirty replicates. Error bars indicate standard deviations. **P < 0.01.
Barley (Hordeum vulgare, 2n = 14), the fourth largest cereal crop in the world, offers high yields and good stress tolerance (Hao et al., 2019) and presents diverse morphological and genetic features, making it a model species for the Triticeae tribe. LMs are common in plant mutation populations, and LMMs with abundant phenotype have been reported in rice and Arabidopsis thaliana (Meskauskiene et al., 2011; Harkenrider et al., 2016), such as small red, reddish-brown, tiny black, and yellow leaf spots (Hao et al., 2019). We identified the novel LMM 5386 in barley, which spontaneously produced many large and severe brown spots at the four-leaf stage and then spread throughout the plant in the whole growth stage (Figure 1). LMMs have been classified as “initiation” and “propagation” types (Landoni et al., 2013), and we categorized LMM 5386 as a “propagation” type.
For the highly repetitive sequences in wheat and barley, BSR-Seq provides an effective approach for monogenic mapping (Liu et al., 2012; Chayut et al., 2015). In this study, we demonstrated that the BSR-Seq identified the LM 5386 gene at the chromosome 3H in barley (Supplementary Figure 1).
RNA-seq is a useful approach for analyzing DEGs at the transcriptome level and clarifying their regulatory network, thus providing insight into the mechanism of LM formation. Transcriptomic analysis showed that DEG responses were mediated through various pathways (Li et al., 2017). RNA-seq was used to analyze the 1453 DEGs involved in the formation of LM in LMM 5386 lines (Figure 2, Supplementary Table 2). GO analysis revealed that many DEGs were enriched in the oxidation-reduction process (Figure 3), suggesting that this process is crucial to LM formation.
PCD can be classified as either autolytic or non-autolytic (van Doorn, 2011). Autolytic PCD primarily occurs during plant growth and includes LM formation, whereas non-autolytic PCD primarily occurs when plants are subjected to external stress (van Doorn, 2011). ROSs, such as H2O2 and , are the primary participants in the formation and regulation of the HR, which is the most definitive characteristic of PCD (Coll et al., 2011). Wang et al. (2016b) demonstrated that antioxidant enzymes can remove excess ROS to maintain better plant growth. In this study, LMM 5386 line plants were associated with lower antioxidant enzyme-encoding genes expression levels, lower antioxidant enzyme activity, and higher levels of ROS than the WT plants (Figures 5, 7, and 8). These results suggested that decreased antioxidant competence leads to ROS accumulation and subsequent PCD in LMM 5386 lines.
In rice, many signaling pathways and biological processes are involved in LM formation, including protein phosphorylation (Harkenrider et al., 2016), abscisic acid signaling (Wang et al., 2015b), and protein ubiquitination (Liu et al., 2015). KEGG analyses showed that many upregulated DEGs were significantly enriched in GSH metabolism (Figure 4A). H2O2 removal is predominantly achieved by ascorbate/GSH cycles in higher plants, and GSH is an intermediate recirculation product (Noctor and Foyer, 1998). GSH is a special class of amino acid derivative consisting of glutamate, cysteine, and Gly (Kaya, 2020). Gly produced by photorespiration is crucial to GSH synthesis (Noctor et al., 1997). LMM 5386 lines were associated with lower Gly content, resulting in the inhibition of GSH biosynthesis (Figure 6). These results suggested that decreased GSH biosynthesis is also important to this burst in ROS and subsequent LM formation.
Currently, more than 30 LMMs have been identified exhibiting blast disease resistance (Zhu et al., 2016). Salicylic acid (SA), jasmonic (JA), and ethylene (ET) are important to the disease resistance of LMMs (Lorenzo et al., 2003; Vlot et al., 2009; Hao et al., 2019). SA protects plants from biotrophic pathogens, whereas JA and ET protect plants from necrotrophic pathogens (Glazebrook, 2005). F. graminearum is hemibiotrophic, that is, it is initially biotrophic but becomes necrotrophic during pathogenesis when cell death is induced (Kazan et al., 2012). The expression of disease-resistance-related genes in SA, JA, and ET pathways were significantly increased in the LMM 5386 line plants compared to that in the WT plants (Figure 9). These results suggested that the LMM 5386 lines had some disease resistance. Using floret- and leave-based inoculated F. graminearum tests, the IFI was lower in the LMM 5386 line plants than that in the WT plants (Figure 10, Supplementary Figure 4). This further confirmed that the LMM 5386 lines inhibited the growth of Blumeria graminis f. sp. hordei (Supplementary Figure 5). Therefore, LMM 5386 lines conferred basal resistance to some biotrophic pathogens or to some pathogens at the biotrophic stages of their life cycle.
The barley LMM 5386 plants conferred basal resistance to F. graminearum; however, its decreased antioxidant competence and GSH contents caused ROS accumulation and subsequent PCD, eventually reducing its yield components (Table 2).
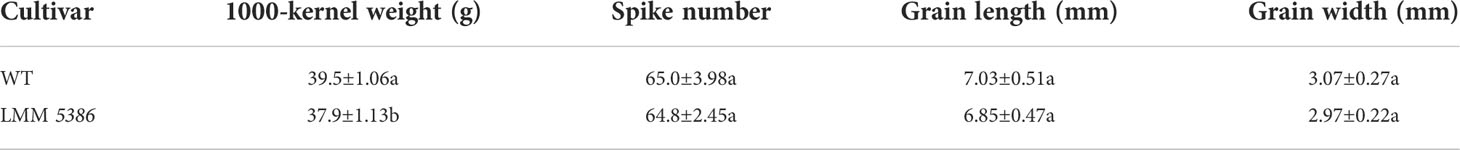
Table 2 Yield components of WT and LMM 5386 lines.
The datasets presented in this study can be found in online repositories. The names of the repository/repositories and accession number(s) can be found below: SRA database, accession numbers SRR21511341-SRR21511346.
The work presented here was carried out in collaboration among all authors. WeiW and WenW defined the research theme. QH and JZ designed most of the methods and experiments. QH and JZ carried out the laboratory experiments. QH and WenW wrote the paper. All authors contributed to the article and approved the submitted version.
This work was supported by the Natural Science Foundation of Shandong (ZR2020QC113), China Postdoctoral Science Foundation (2022M711980), the National Natural Science Foundation of China (32001536), the Science and Technology Plan Projects of Zaozhuang (2019NS01), the Doctoral Research Initiation Funds of Zaozhuang University (2018BS043, 2020BS001), the Opening Foundation of State Key Laboratory of Crop Biology (2020KF06).
Authors JZ and DF were employed by Spring Valley Agriscience Co., Ltd. Author WenW was employed by Shandong Shofine Seed Technology Co., Ltd.
The remaining authors declare that the research was conducted in the absence of any commercial or financial relationships that could be construed as a potential conflict of interest.
All claims expressed in this article are solely those of the authors and do not necessarily represent those of their affiliated organizations, or those of the publisher, the editors and the reviewers. Any product that may be evaluated in this article, or claim that may be made by its manufacturer, is not guaranteed or endorsed by the publisher.
The Supplementary Material for this article can be found online at: https://www.frontiersin.org/articles/10.3389/fpls.2022.1020551/full#supplementary-material
Supplementary Figure 1 | BSR-Seq analysis SNPs and InDels of lesion mimic 5386/Morex F2 population.
Supplementary Figure 2 | Pearson correlation coefficients among three biological replicates of WT and LMM 5386 lines.
Supplementary Figure 3 | Hierarchical clustering analysis of nine differentially expressed genes (DEGs) based on the log (FC) of gene expression in Group 1. The color gradient from red to green represents relative levels of gene expression (from low to high, respectively). The numbers in the scale bar indicate the gene expression scores.
Supplementary Figure 4 | Phenotype differences on inoculated F. graminearum in leaves between WT and LMM 5386 lines. (A) Green fluorescence phenotype at 3 days after inoculation (DAI) and 7 DAI. (B) Integrated fluorescence intensity (IFI) at 3 DAI and 7 DAI. Values are means ± SD based on thirty replicates. Error bars indicate standard deviations. *P < 0.05; **P < 0.01
Supplementary Figure 5 | Phenotype differences on inoculated powdery mildew in leaves between WT and LMM 5386 lines. (A) Trypan blue staining of developing hyphae of Blumeria graminis f. sp. Hordei. (B) Length of fungal hyphae in infected plants. Values are means ± SD based on thirty replicates. Error bars indicate standard deviations. *P < 0.05; **P < 0.01
Bruggeman, Q., Raynaud, C., Benhamed, M., Delarue, M. (2015). To die or not to die? lessons from lesion mimic mutants. Front. Plant Sci. 6, 24. doi: 10.3389/fpls.2015.00024
Chayut, N., Yuan, H., Ohali, S., Meir, A., Yeselson, Y., Portnoy, V., et al. (2015). A bulk segregant transcriptome analysis reveals metabolic and cellular processes associated with orange allelic variation and fruit-carotene accumulation in melon fruit. BMC Plant Biol. 15, 274. doi: 10.1186/s12870-015-0661-8
Coll, N. S., Epple, P., Dangl, J. L. (2011). Programmed cell death in the plant immune system. Cell Death Differ. 18, 1247–1256. doi: 10.1038/cdd.2011.37
Devadas, S. K., Enyedi, A., Raina, R. (2002). The arabidopsis hrl1 mutation reveals novel overlapping roles for salicylic acid, jasmonic acid and ethylene signalling in cell death and defence against pathogens. Plant J. 30, 467–480. doi: 10.1046/j.1365-313X.2002.01300.x
Dietrich, R. A., Delaney, T. P., Uknes, S. J., Ward, E. R., Ryals, J. A., Dangl, J. L. (1994). Arabidopsis mutants simulating disease resistance response. Cell 77, 565. doi: 10.1016/0092-8674(94)90218-6
Glazebrook, J. (2005). Contrasting mechanisms of defense against biotrophic and necrotrophic pathogens. Annu. Rev. Phytopathol. 43, 205–227. doi: 10.1146/annurev.phyto.43.040204.135923
Hao, Q. Q., Lyu, B., Tang, Y. H., Wang, D. Y., Li, Y. Y., Li, Q. L., et al. (2019). Deterioration of antioxidant competence in barley lesion mimic mutant 194. Phyton-Int J. Exp. Bot. 88, 109–117. doi: 10.32604/phyton.2019.06734
Hao, Q. Q., Wang, W. Q., Han, X. L., Wu, J. Z., Lyu, B., Chen, F. J., et al. (2018). Isochorismate-based salicylic acid biosynthesis confers basal resistance to fusarium graminearum in barley. Mol. Plant Pathol. 19, 1995–2010. doi: 10.1111/mpp.12675
Harkenrider, M., Sharma, R., Tsao, L., Zhang, X., Chern, M., Canlas, P., et al. (2016). Overexpression of rice wall-associated kinase 25 (OsWAK25) alters resistance to bacterial and fungal pathogens. PloS One 11, e0147310. doi: 10.1371/journal.pone.0147310
Hurni, S. D., Scheuermann, S. G., Krattinger, B., Kessel, T., Wicker, G., Keller, B. (2015). The maize disease resistance gene Htn1 against northern corn leaf blight encodes a wall-associated receptor-like kinase. PNAS 112, 8780–8785. doi: 10.1073/pnas.1502522112
Hu, G., Yalpani, N., Briggs, S. P., Johal, G. S. (1998). A porphyrin pathway impairment is responsible for the phenotype of a dominant disease lesion mimic mutant of maize. Plant Cell. 10, 1095–1105. doi: 10.1105/tpc.10.7.1095
Kaya, C. (2020). Nitrate reductase is required for salicylic acid-induced water stress tolerance of pepper by upraising the AsA-GSH pathway and glyoxalase system. Physiol. Plantarum. 172, 351–370. doi: 10.1111/ppl.13153
Kazan, K., Gardiner, D. M., Manners, J. M. (2012). On the trail of a cereal killer: recent advances in Fusarium graminearum pathogenomics and host resistance. Mol. Plant Pathol. 13, 399–413. doi: 10.1111/j.1364-3703.2011.00762.x
Khandal, D., Iga, S., Frank, B., Stephan, P., Holger, S. (2009). Singlet oxygen-dependent translational control in the tigrina-d.12 mutant of barley. PNAS 106, 13112–13117. doi: 10.1073/pnas.0903522106
Kinane, J. T., Jones, P. W. (2001). Isolation of wheat mutants with increased resistance to powdery mildew from small induced variant populations. Euphytica 117, 251–260. doi: 10.1023/A:1026527010901
Klibenstein, D. J., Dietrich, R. A., Martin, A. C., Last, R. L., Dangl, J. L. (1999). LSD1 regulates salicylic acid induction of copper zinc superoxide dismutase in Arabidopsis thaliana. Mol. Plant Microbe In. 12, 1022–1026. doi: 10.1094/MPMI.1999.12.11.1022
Landoni, M., Francesco, A. D., Bellatti, S., Delledonne, M., Ferrarini, A. (2013). A mutation in the FZL gene of arabidopsis causing alteration in chloroplast morphology results in a lesion mimic phenotype. J. Exp. Bot. 64, 4313–4328. doi: 10.1093/jxb/ert237
Li, P., Cao, W., Fang, H., Xu, S., Yin, S., Zhang, Y., et al. (2017). Transcriptomic profiling of the maize (Zea mays l.) leaf response to abiotic stresses at the seedling stage. Front. Plant Sci. 8, 290. doi: 10.3389/fpls.2017.00290
Li, L., Hou, M. J., Cao, L., Xia, Y., Shen, Z. G., Hu, Z. B. (2018). Glutathione s-transferases modulate Cu tolerance in Oryza sativa. Environ. Exp. Bot. 155, 313–320. doi: 10.1016/j.envexpbot.2018.07.007
Liu, J., Park, C. H., He, F., Nagano, M., Wang, M., Bellizzi, M., et al. (2015). The RhoGAP SPIN6 associates with SPL11 and OsRac1 and negatively regulates programmed cell death and innate immunity in rice. PloS Pathog. 11, e1004629. doi: 10.1371/journal.ppat.1004629
Liu, S., Yeh, C. T., Tang, H. M., Nettleton, D., Schnable, P. S. (2012). Gene mapping via bulked segregant RNA-seq (BSR-seq). PloS One 7, e36406. doi: 10.1371/journal.pone.0036406
Lorenzo, O., Piqueras, R., Sanchez-Serrano, J. J., Solano, R. (2003). ETHYLENE RESPONSE FACTOR1 integrates signals from ethylene and jasmonate pathways in plant defense. Plant Cell. 15, 165–178. doi: 10.1105/tpc.007468
Lumbroso, E., Fischbeck, G., Wahl, I. (1982). Infection of barley with conidia suspensions of Erysiphe graminis f. sp. hordei. J. Phytopathol. 104, 222–233. doi: 10.1111/j.1439-0434.1982.tb00529.x
McGrann, G. R., Burt, C., Nicholson, P., Brown, J. K. (2015). Differential effects of lesion mimic mutants in barley on disease development by facultative pathogens. J. Exp. Bot. 66, 3417–3428. doi: 10.1093/jxb/erv154
Meskauskiene, R., Nater, M., Goslings, D., Kessler, F., Camp, R. (2011). FLU: A negative regulator of chlorophyll biosynthesis in Arabidopsis thaliana. PNAS 98, 12826–12831. doi: 10.1073/pnas.221252798
Moeder, W., Yoshioka, K. (2008). Lesion mimic mutants: a classical, yet still fundamental approach to study programmed cell death. Plant Signal Behav. 3, 764–767. doi: 10.4161/psb.3.10.6545
Noctor, G., Arisi, A. C. M., Jouanin, L., Valadier, M. H., Roux, Y., Foyer, C. H. (1997). The role of glycine in determining the rate of glutathione synthesis in poplar. possible implications for glutathione production during stress. Physiol. Plantarum. 100, 255–263. doi: 10.1111/j.1399-3054.1997.tb04781.x
Noctor, G., Foyer, C. H. (1998). Ascorbate and glutathione: Keeping active oxygen under control. Annu. Rev. Plant Physiol. Plant Mol. Biol. 49, 249–279. doi: 10.1146/annurev.arplant.49.1.249
Rostoks, N., Deric, S., Sharon, M., Thomas, D., Robert, B. (2006). Barley necrotic locus nec1 encodes the cyclic nucleotide-gated ion channel 4 homologous to the Arabidopsis HLM1. Mol. Genet. Genomics 275, 159–168. doi: 10.1007/s00438-005-0073-9
Serrano, M., Hubert, D. A., Dangl, J. L., Schulze-Lefert, P., Kom-Brink, E. (2010). A chemical screen for suppressors of the avrRpm1-RPM1-dependent hypersensitive cell death response in Arabidopsis thaliana. Planta. 231, 1013. doi: 10.1007/s00425-010-1105-1
Shang, J., Tao, Y., Chen, X., Zou, Y., Lei, C., Wang, J., et al. (2009). Identification of a new rice blast resistance gene, Pid3, by genome-wide comparison of paired nucleotide-binding site–leucine-rich repeat genes and their pseudogene alleles between the two sequenced rice genomes. Genetics 182, 1303–1311. doi: 10.1534/genetics.109.102871
Shirano, Y., Kachroo, P., Shah, J., Klessig, D. F. (2002). A gain-of-function mutation in an Arabidopsis toll interleukin1 receptor-nucleotide binding site-leucine-rich repeat type r gene triggers defense responses and results in enhanced disease resistance. Plant Cell. 14, 3149–3162. doi: 10.1105/tpc.005348
Simmons, C., Hantke, S., Grant, S., Johal, G. S., Briggs, S. P. (1998). The maize lethal leaf spot 1 mutant has elevated resistance to fungal infection at the leaf epidermis. Mol. Plant Microbe Interact. 11, 1110–1118. doi: 10.1094/MPMI.1998.11.11.1110
Sindhu, A., Janick-Buckner, D., Buckner, B., Gray, J., Zehr, U., Dilkes, B. P. (2018). Propagation of cell death in dropdead1, a sorghum ortholog of the maize lls1 mutant. PloS One 13, e0201359. doi: 10.1371/journal.pone.0201359
Torres, M. A., Dangl, J. L., Jones, J. D. G. (2002). Arabidopsis gp91phox homologues AtrbohD and AtrbohF are required for accumulation of reactive oxygen intermediates in the plant defense response. PNAS 99, 517–522. doi: 10.1073/pnas.012452499
Van Doorn, W. G. (2011). Classes of programmed cell death in plants, compared to those in animals. J. Exp. Bot. 62, 4749–4761. doi: 10.1093/jxb/err196
Vlot, A. C., Dempsey, D. M. A., Klessig, D. F. (2009). Salicylic acid, a multifaceted hormone to combat disease. Annu. Rev. Phytopathol. 47, 177–206. doi: 10.1146/annurev.phyto.050908.135202
Wang, W. Q., Hao, Q. Q., Tian, F. X., Li, Q. X., Wang, W. (2016b). The stay green phenotype of wheat mutant tasg1 is associated with altered cytokinin metabolism. Plant Cell Rep. 35, 585–599. doi: 10.1007/s00299-015-1905-7
Wang, W. Q., Hao, Q. Q., Wang, W. L., Li, Q. X., Wang, W. (2017). The genetic characteristics in cytology and plant physiology of two wheat (Triticum aestivum) near isogenic lines with different freezing tolerances. Plant Cell Rep. 36, 1801–1814. doi: 10.1007/s00299-017-2195-z
Wang, S. H., Lim, J. H., Kim, S. S., Cho, S. H., Yoo, S. C., Koh, H. J., et al. (2015b). Mutation of SPOTTED LEAF3 (SPL3) impairs abscisic acid responsive signalling and delays leaf senescence in rice. J. Exp. Bot. 66, 7045–7059. doi: 10.1093/jxb/erv401
Wang, W. L., Wang, W. Q., Wu, Y. Z., Li, Q. X., Zhang, G. Q., Shi, Y. Y., et al. (2020). The involvement of wheat U-box E3 ubiquitin ligase TaPUB1 in salt stress tolerance. J. Integr. Plant Biol. 62, 631–651. doi: 10.1111/jipb.12842
Wang, F., Wu, W., Wang, D., Yang, W., Sun, J., Liu, D. (2016a). Characterization and genetic analysis of a novel light-dependent lesion mimic mutant, lm3, showing adult-plant resistance to powdery mildew in common wheat. PloS One 11, e0155358. doi: 10.1371/journal.pone.0155358
Wang, J., Ye, B., Yin, J., Yuan, C., Zhou, X., Li, W. (2015a). Characterization and fine mapping of a light-dependent leaf lesion mimic mutant 1 in rice. Plant Physiol. Bioch. 97, 44–51. doi: 10.1016/j.plaphy.2015.09.001
Xiao, G., Zhang, H., Lu, X., Huang, R. (2015). Characterization and mapping of a novel light-dependent lesion mimic mutant lmm6 in rice (Oryza sativa l.). J. Integr. Agr. 14, 1687–1696. doi: 10.1016/S2095-3119(14)60975-8
Yang, J. J., Zhang, G. Q., An, J., Li, Q. X., Chen, Y. H., Zhao, X. Y., et al. (2020). Expansin gene TaEXPA2 positively regulates drought tolerance in transgenic wheat (Triticum aestivum l.). Plant Sci. 298, 110596. doi: 10.1016/j.plantsci.2020.110596
Yao, Q., Zhou, R., Fu, T., Wu, W., Zhu, Z., Li, A., et al. (2009). Characterization and mapping of complementary lesion-mimic genes lm1 and lm2 in common wheat. Theor. Appl. Genet. 119, 1005–1012. doi: 10.1007/s00122-009-1104-4
Yin, Z., Chen, J., Zeng, L., Goh, M., Leung, H., Khush, G. S., et al. (2000). Characterizing rice lesion mimic mutants and identifying a mutant with broad-spectrum resistance to rice blast and bacterial blight. Mol. Plant Microbe Interact. 13, 869–876. doi: 10.1094/MPMI.2000.13.8.869
Yin, L. N., Mano, J., Tanaka, K. S., Wang, S. W., Zhang, M. J., Deng, X. P., et al. (2017). High level of reduced glutathione contributes to detoxification of lipid peroxide-derived reactive carbonyl species in transgenic Arabidopsis overexpressing glutathione reductase under aluminum stress. Physiol. Plantarum. 161, 211–223. doi: 10.1111/ppl.12583
Keywords: lesion mimic, RNA-Seq, ROS accumulation, antioxidant competence, glutathione, barley
Citation: Wang W, Zhang J, Guo F, Di Y, Wang Y, Li W, Sun Y, Wang Y, Ni F, Fu D, Wang W and Hao Q (2022) Role of reactive oxygen species in lesion mimic formation and conferred basal resistance to Fusarium graminearum in barley lesion mimic mutant 5386. Front. Plant Sci. 13:1020551. doi: 10.3389/fpls.2022.1020551
Received: 16 August 2022; Accepted: 26 September 2022;
Published: 31 October 2022.
Edited by:
Soumen Bhattacharjee, University of Burdwan, IndiaReviewed by:
Yuanhu Xuan, Shenyang Agricultural University, ChinaCopyright © 2022 Wang, Zhang, Guo, Di, Wang, Li, Sun, Wang, Ni, Fu, Wang and Hao. This is an open-access article distributed under the terms of the Creative Commons Attribution License (CC BY). The use, distribution or reproduction in other forums is permitted, provided the original author(s) and the copyright owner(s) are credited and that the original publication in this journal is cited, in accordance with accepted academic practice. No use, distribution or reproduction is permitted which does not comply with these terms.
*Correspondence: Qunqun Hao, aGFvLnF1bnF1bkAxNjMuY29t; Wei Wang, d2FuZ3dAc2RhdS5lZHUuY24=
†These authors have contributed equally to this work
Disclaimer: All claims expressed in this article are solely those of the authors and do not necessarily represent those of their affiliated organizations, or those of the publisher, the editors and the reviewers. Any product that may be evaluated in this article or claim that may be made by its manufacturer is not guaranteed or endorsed by the publisher.
Research integrity at Frontiers
Learn more about the work of our research integrity team to safeguard the quality of each article we publish.