
94% of researchers rate our articles as excellent or good
Learn more about the work of our research integrity team to safeguard the quality of each article we publish.
Find out more
ORIGINAL RESEARCH article
Front. Plant Sci., 03 November 2022
Sec. Sustainable and Intelligent Phytoprotection
Volume 13 - 2022 | https://doi.org/10.3389/fpls.2022.1019017
This article is part of the Research TopicAdvanced Application Technology for Plant Protection: Sensing, Modelling, Spraying System and EquipmentView all 21 articles
 Liu Wanru1,2
 Zhang Guozhong1,2*
 Zhou Yong1,2Liu Haopeng1,2Tang Nanrui1,2Kang Qixin1,2Zhao Zhuangzhuang1,2
The taro harvesting process is affected by a complex system composed of particle mechanics system and multi-body dynamics system. The discrete element method(DEM) can effectively solve the nonlinear problem of the interaction between harvesting components and working materials. Therefore, the discrete element model of taro tiller plants is of great importance for taro harvesting. This paper proposes a simulation method to establish a discrete element flexible plant model and dynamic clamping and pulling process of taro tiller plant. Discrete Element models of taro corm and flexible tiller petiole and leaf were established using DEM method, and the discrete element flexible model of the taro plant was established. Taro clamping and pulling force testing platform was designed and built. The single factor and Plackett-Burman experiments were used to determine the simulation parameters and optimize the taro plant model by taking the correlation coefficient of clamping force and correlation coefficient of pulling force collected from the simulation and the bench experiment as the experiment index. The parameter calibration results of discrete element model of taro plant are as follows: petiole-petiole method/tangential contact stiffness was 8.15×10⁹ N·m-3, and normal/tangential critical stress was 6.65×10⁶ Pa. The contact stiffness of pseudostem- corm method was 1.22×10⁹ N·m-3, the critical stress of normal/tangential was 1.18×10⁵ Pa, and the energy of soil surface was 4.15×10⁶J·m-3. When the pulling speed is 0.1, 0.2, 0.3, 0.4 and 0.5 m·s-1, the correlation coefficients between the simulation experiment and the bench experiment are 0.812, 0.850, 0.770, 0.697 and 0.652, respectively. The average value of correlation coefficient is 0.756, indicating that the simulated discrete element plant model is close to the real plant model. The discrete element model of taro plant established in this paper has high reliability. The final purpose of this paper is to provide a model reference for the design and optimization of taro harvester by discrete element method.
Taro is the most important food crop and cash crop of Araceae, and is the staple food of nearly 70 million people in the world (Andreas and Waqainabete, 2018; Aditika et al., 2022). It has a higher starch content than potatoes, sweet potatoes, cassava, etc. (Singla et al., 2020). Taro is native to India (Wang et al., 2012). By 2020, the harvested area of African taro was about 1.6088 million hectares, accounting for 88.91 percent of the world’s planted area. Chinese taro is mainly distributed in the Yangtze River basin, Pearl River Basin and Yellow River basin (Li et al., 2022). Harvesting is an important stage in the process of taro production presently done by digging and clamping. Excavating harvest is a segment-type harvest. First, the thick petiole of the plant is cut off, and then the root and petiole harvester are used to excavate taro corm. This process requires two operations, which is inefficient. Gripper harvesting is combined harvesting, where the belt of the harvester grabs the leaf petiole and pulls the taro out by the roots, then the petiole is cut off by a rotating blade. This way of harvesting can be completed at one time, this way of operation efficiency is high, so the clamping taro harvest is the future harvest taro important way of harvesting (Zhou et al., 2015; Zhu et al., 2022). the research and development cycle of equipment is long, and the cost of processing and trial production is high. Traditional test methods cannot accurately analyze taro plants’ force and movement during harvesting. Therefore. It is of great significance for the optimal design of key components of the taro harvester to study the stress and movement of taro plants under the plant-machine-soil interaction in the process of pulling taro by digital simulation method.
The clamping and pulling mechanical system together with taro plants, soil and other microscopic granular materials constitute a complex physical field system with multi-spatial scale coupling. Evaluating the accuracy of clamping resistance and pulling resistance in taro harvesting has an important impact on the design of the taro harvester, optimization of key components and power system of taro harvesting equipment, and evaluation of operation quality and efficiency. The discrete element method can effectively simulate the nonlinear relationship between the interaction between harvesting components and working materials (Ma et al., 2015; Guo et al., 2021). The key to taro clamping and pulling simulation’s success is using accurate material parameters and particle contact model (Liu et al., 2022). Compared with rice, wheat and maize, corm crops such as taro and potato are also very important food sources for humans. However, the recent research on corm crops using the discrete element method focuses on corm modeling in potato (Liu et al., 2018) and Cyperus edulis root- corm and soil (He et al., 2022). Yang et al. (2022) established a discrete meta-model of cassava petiole and applied it to the simulation of pre-cut cassava planter seeding; Chen et al. (2022) established the discrete element model of cassava seed stem and carried out the simulation test of vibration seed dispersing mechanism. Yu Qingxu et al. established the discrete element model of Panax notoginseng seeds and carried out the planting test, which proved that Panax notoginseng seeds could be used in the discrete element simulation experiment (Yu, 2019; Yu et al., 2020; Yu et al., 2022). Liu (2021) established the discrete element model of sweet potato corm and carried out the simulation of sweet potato transport device.
Due to the lack of discrete element model of corm crops, the development of contact mechanics model between corm crops and agricultural machinery and various agricultural materials is limited, and the in-depth multidimensional research on the internal mechanism of corm crop-soil-machine and tool interaction has been affected. Therefore, this study’s key is to construct a discrete element flexible model for the taro plant and explore the dynamic mechanical behavior of taro clamping and pulling under plant-machine-soil interaction. Taro plant has anisotropic, inhomogeneous, and petiole tillering characteristics. When using discrete element method to estabish taro plant model, the simple rules of spherical particles cannot be simulated with the complex shape outline rules such as taro particle collision and friction between features, so the discrete element model of the local petioles and corms cannot meet the needs of taro pulling performance simulation. Currently, there is no literature report on the establishing a discrete element model of the taro plant, and its interaction with soil and machine has also not been solved.
This paper proposed a simulation method to establish a discrete element flexible plant model and dynamic clamping and pulling process of taro tiller plant. which can reduce the testing cost and shorten the design process in the structural design of the taro harvester. The remainder of the article is organized as follows. Section 2 introduces the discrete element flexible model of taro tiller plant established by EDEM, and the parameters were calibrated by single factor experiment and Plackett-Burman experiment. The practicability of the taro plant model was verified, and the pulling force of the taro plant were explored in Section 3. Finally, conclusion and the future research directions that can be studied in depth is presented in Section 4.
The corms of taro planted by Yanglinggou Taro Cooperative in Hanchuan City, Hubei Province were studied. The geographical location of the area was 113.660221 east longitude and 30.521991 north latitude. Taro corms can be divided into mother corm, sister corms, as shown in Figure 1A. Sixty taro samples without damage and disease were collected, and the vernier caliper with an accuracy of 0.01mm was used to measure the physical dimensions of taro corms, and the average values were calculated. The mean length, width, height of the mother corm was 64.26, 64.46 and 83.01mm, respectively. The mean length, width, height of sister corm was 32.06, 29.01 and 40.85mm, respectively, and the mean length, width, height of sister corm was 27.44, 25.62 and 31.74mm, respectively, the statistical results are shown in Figure 1B.
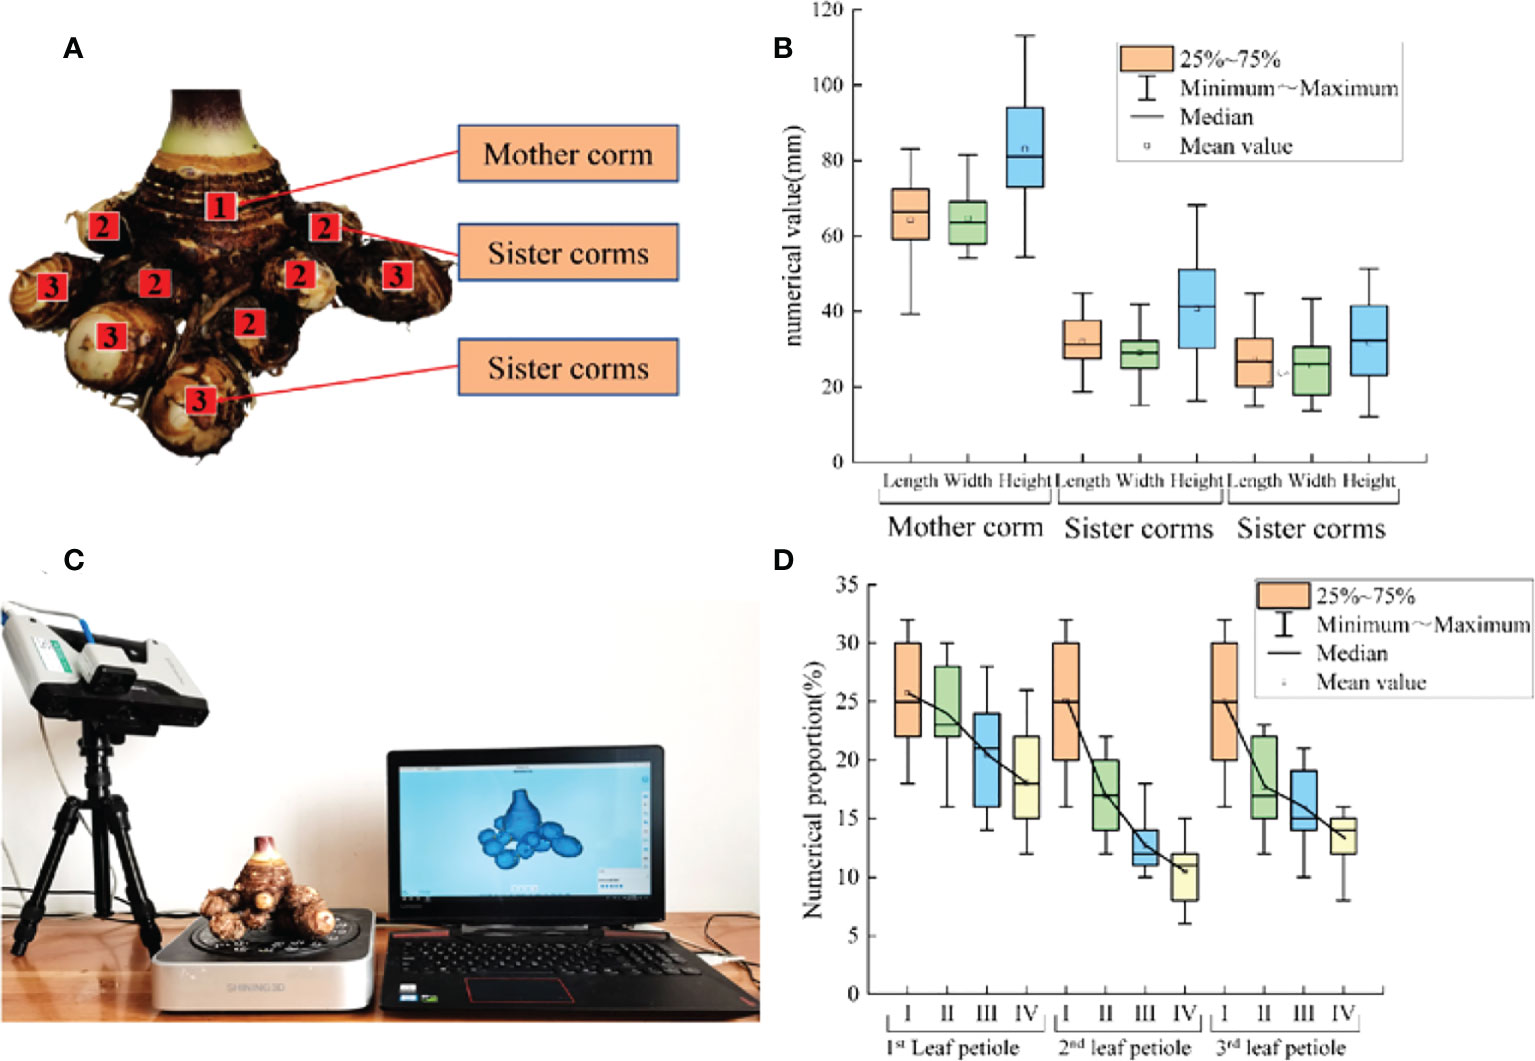
Figure 1 Schematic diagram and size statistics of taro corm. (A) The growing position of mother corm, and sister corms; (B) The length, width and height of mother corm, and sister corms statistics; (C) 3D laser scanning experiment of taro corm; (D) The length, width and height of 1st leaf petiole, 2nd leaf petiole and 3rd leaf petiole statistics.
3D laser scanning technology can accurately obtain the 3D contour of complex plants. As taro corm is irregular particles with complex shapes. A SHINING 3D Einscan-Pro multi-functional handheld scanner was used to conduct 3D scanning and collect the position coordinates of taro corm in 3D space, 3D laser scanning is shown in Figure 1C. Dominik et al. (2021) established an image database of 7 different trees through 3D scanning. Cucinotta et al. (2019) obtained the wear morphology of the plowshare through three-dimensional scanning technology.
Geomagic Warp software is used for reverse engineering processing to obtain the point cloud data of taro corms, as shown in the Figure 2A. The point cloud data is converted into a polygon model to restore the shape contour of taro corms. After trimming the excess surface, deleting the nail, merging, relaxing, smoothing and other operations (Hao et al., 2021), A more accurate polygon model of the taro corm was obtained, as shown in the Figure 2B. The discrete element model of the taro corm was established by the fast-filling method of EDEM software, and the number of sphere elements was 58. The discrete element model of taro plant is shown in Figure 2C.
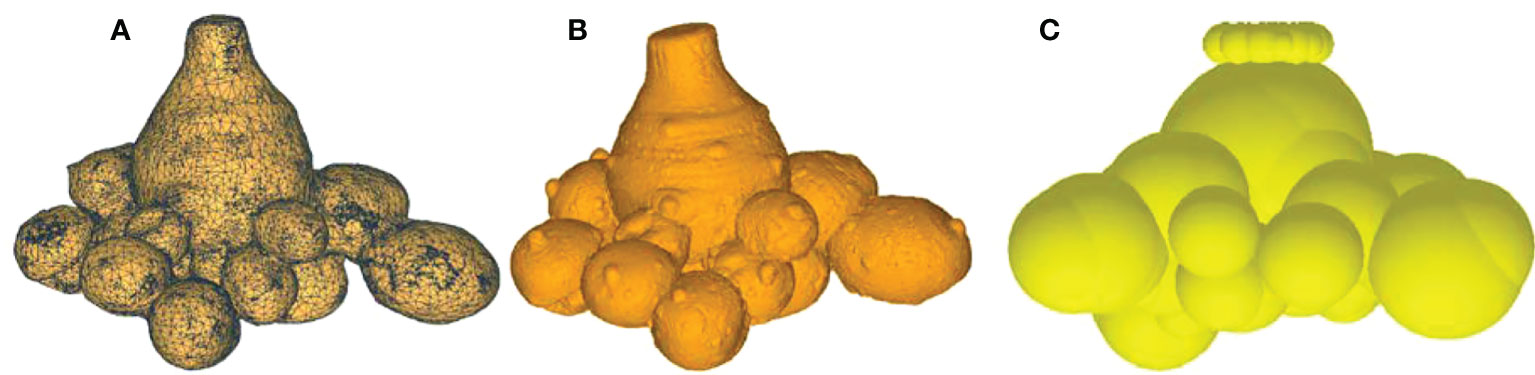
Figure 2 Discrete element model of taro corm. (A) Taro corm 3D scanning point cloud model; (B) Taro corm contour model; (C) Discrete element model of taro corm.
The Hertz-Mindlin (no slip) model with high computational accuracy and simulation speed was used among corm particles, and the contact radius between spherical particles:
Where δi is the contact center distance between two spherical particles, mm; r1i is the radius of the first sphere particle, mm; r2i is the radius of the second sphere particle, mm; di is the overlap distance in the direction of the connecting line between the center of two spheres, mm.
The taro petiole is in the shape of a tiller, and the inner part of the petiole is mainly composed of axial vascular bundle fibers. The diameters of the 1st side petiole, the 2nd side petiole and the 3rd side petiole at different positions from the ground were measured for 60 plants. I stand for 0-5cm from the ground, II for 5-10cm from the ground, III for 10-15cm from the ground, and IV for 15-20cm from the ground, as shown in the Figure 1D. The average diameter of the petiole gradually increases from the bottom to the top.
Twenty main petioles were cut at a distance of 5-10 cm from the ground, and the TMS-PRO texture analyzer produced by TFC Company in the United States was used to measure the petiole load-deflection curve at an experiment speed of 60 mm·min-1 (Shen et al., 2015), the instrument accuracy is ±1%, the range is 0~1000 N, and the data acquisition frequency is 50 Hz. The petiole was placed on two horizontal metal supports at the testing machine’s lower end and aligned the sample’s center with the center of the upper clamp; the experiment was started until the petiole was significantly bent, as shown in the Figure 3A. where midpoint A is the elastic limit point, and point B is the biological yield point. as shown in the Figure 3B. The elastic modulus of the petiole is about 16.69MPa after 20 measurements and the average value is obtained by formula (9). The Poisson’s ratio ψ of the petiole is 0.4 according to the relevant literature (Shi et al., 2018), and the shear modulus of the petiole is 5.96 MPa obtained by formula (10).
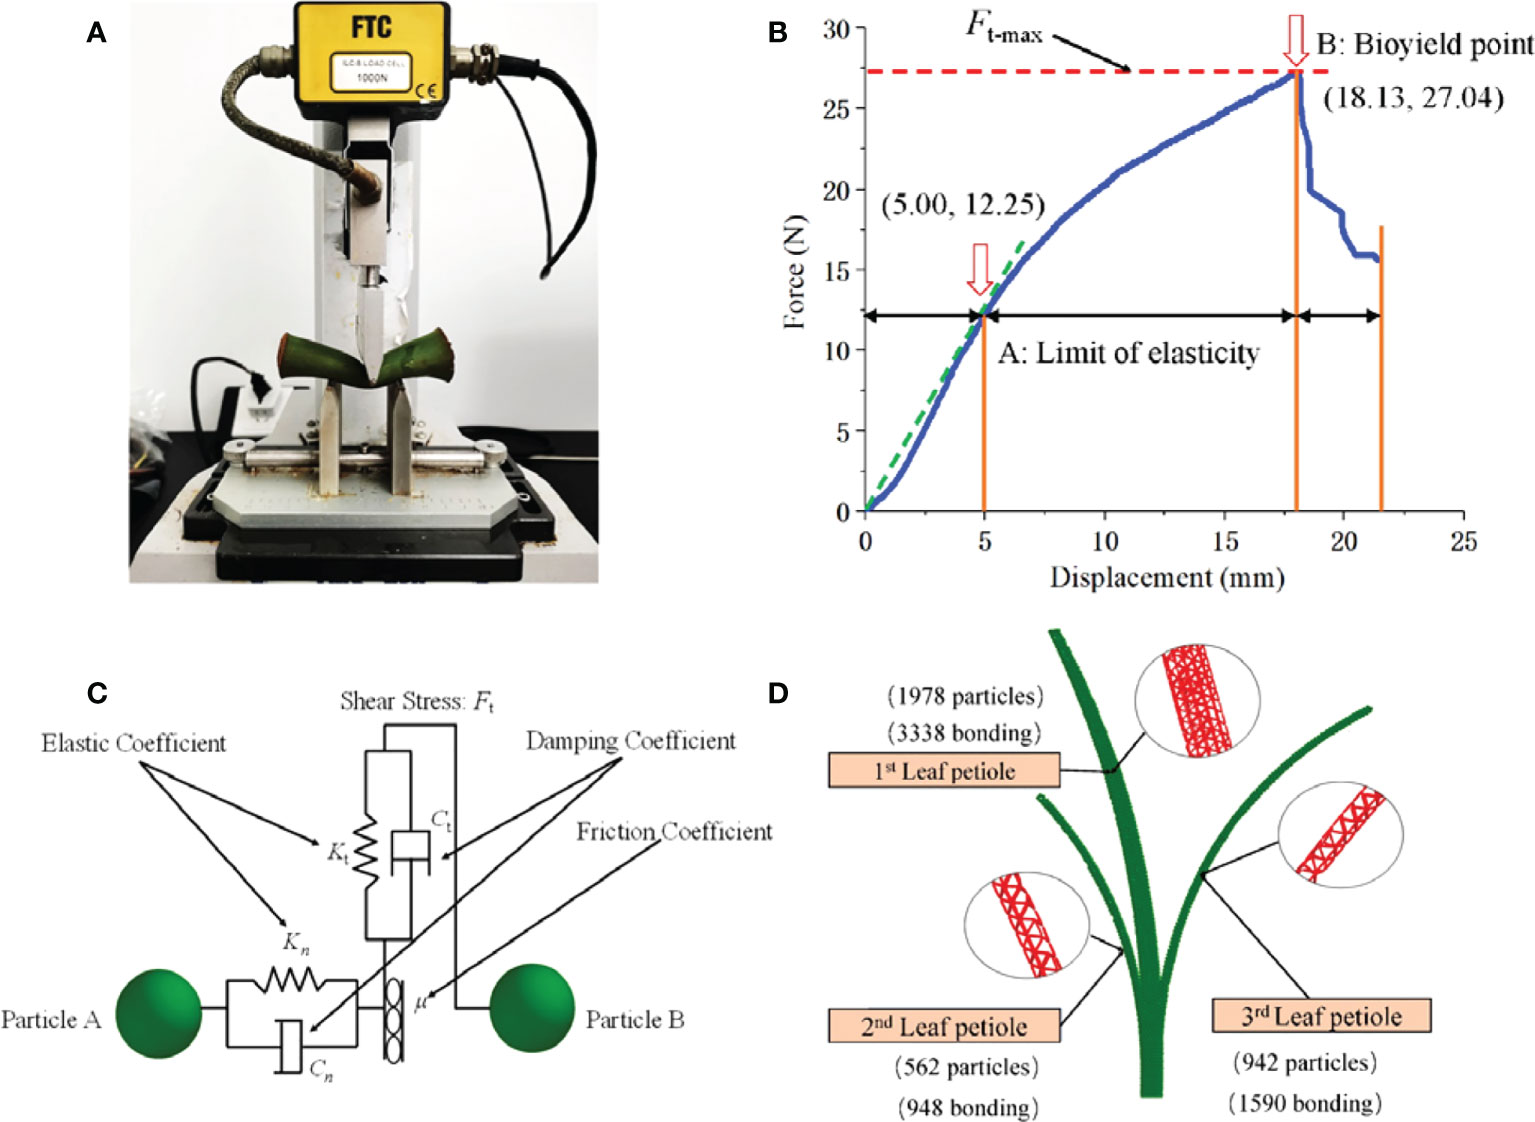
Figure 3 Discrete element model of petiole. (A) Three point bending experiment of petiole; (B) Displacement-Force of petiole obtained by three-point bending test; (C) Discrete element model and particle number of petiole; (D) Inter-particle force of taro.
The section of the taro petiole can be approximated as a circle, and the moment of inertia I of the section relative to the neutral axis is:
Where d1 is the petiole outer diameter, mm; h is the petiole wall thickness, mm.
petiole elastic modulus Ew:
Where F is the loading force, N; L1 is the distance between two supports, mm; S is the Bending deflection at the midpoint of the petiole, mm.
Shear modulus G1 of the petiole:
The petiole is subjected to clamping load when the taro plant is pulled from the soil. Combined with the deformation and damage characteristics of the petiole after loading, the Hertz-Mindlin with bonding contact model was selected to reflect the anisotropy and agglomeration characteristics of the petiole, as shown in the Figure 3C. the fiber state inside the petiole is characterized by the elastic coefficients Kt, Kn, damping coefficients Ct, Cn and friction coefficient μ between the petiole particles. The model has a total of 5 parameters, the normal bond stiffness Sn and the tangential bond stiffness St are iterated continuously at unit step intervals and update the load on the bond. The normal critical stress σmax and the tangential critical stress τmax are the critical threshold for judging whether the cohesive force is broken or not. The cohesive radius is the maximum distance required for the formation of cohesion between particles. A total of 5876 parallel bonding structures were generated between particles, as shown in the Figure 3D.
The process model of taro petiole particles from cohesion to failure:
Where Fδ is the normal adhesion force, N; Fαis the tangential adhesion force, N; Tn is the normal adhesion moment, N·m; Tt is the tangential adhesion moment, N·m; vn is the particle method Vertical velocity, m·s-1; vt is the particle tangential velocity, m·s-1; wn is the normal angular velocity, rad·s-1; wt is the tangential angular velocity, rad·s-1. Sn is the normal bond stiffness, N·mm-1; St is the tangential bond stiffness, N·mm-1; As is the contact area, m2.
The moment of inertia J of the parallel bond and the area of the contact area As:
Where RB is the bond radius, mm.
Fracture conditions for bond bonds:
Where σmax is the normal critical stress, Pa; τmax is the tangential critical stress, Pa.
The taro leaf does not affect the effect of clamping and pulling. Only its gravity affects the clamping posture. To improve the simulation efficiency, the material parameters of the blade part were equivalent to the petiole, and the Hertz-Mindlin (no slip) contact model was used between the particles.
Taking the corm, petiole and leaf as the aggregation unit, according to the actual shape of the taro plant and the coordinate position of each particle cluster unit, the X, Y and Z axis coordinates of the aggregation unit were located, and the Hertz-Mindlin with bonding particle contact model was used to connect the corm to the petiole and the petiole to the leaf. Micro-unit spherical particles characterize the complex stress-strain characteristics of plants under macroscopic load, then global variables were set, the Fixed Time Step was set to 4.60%, the Cell Size set to 3Rmin, the total number of grids was 3.5×10⁶, and the time was set to 10s. The discrete element model of taro plant established is shown in Figure 4.
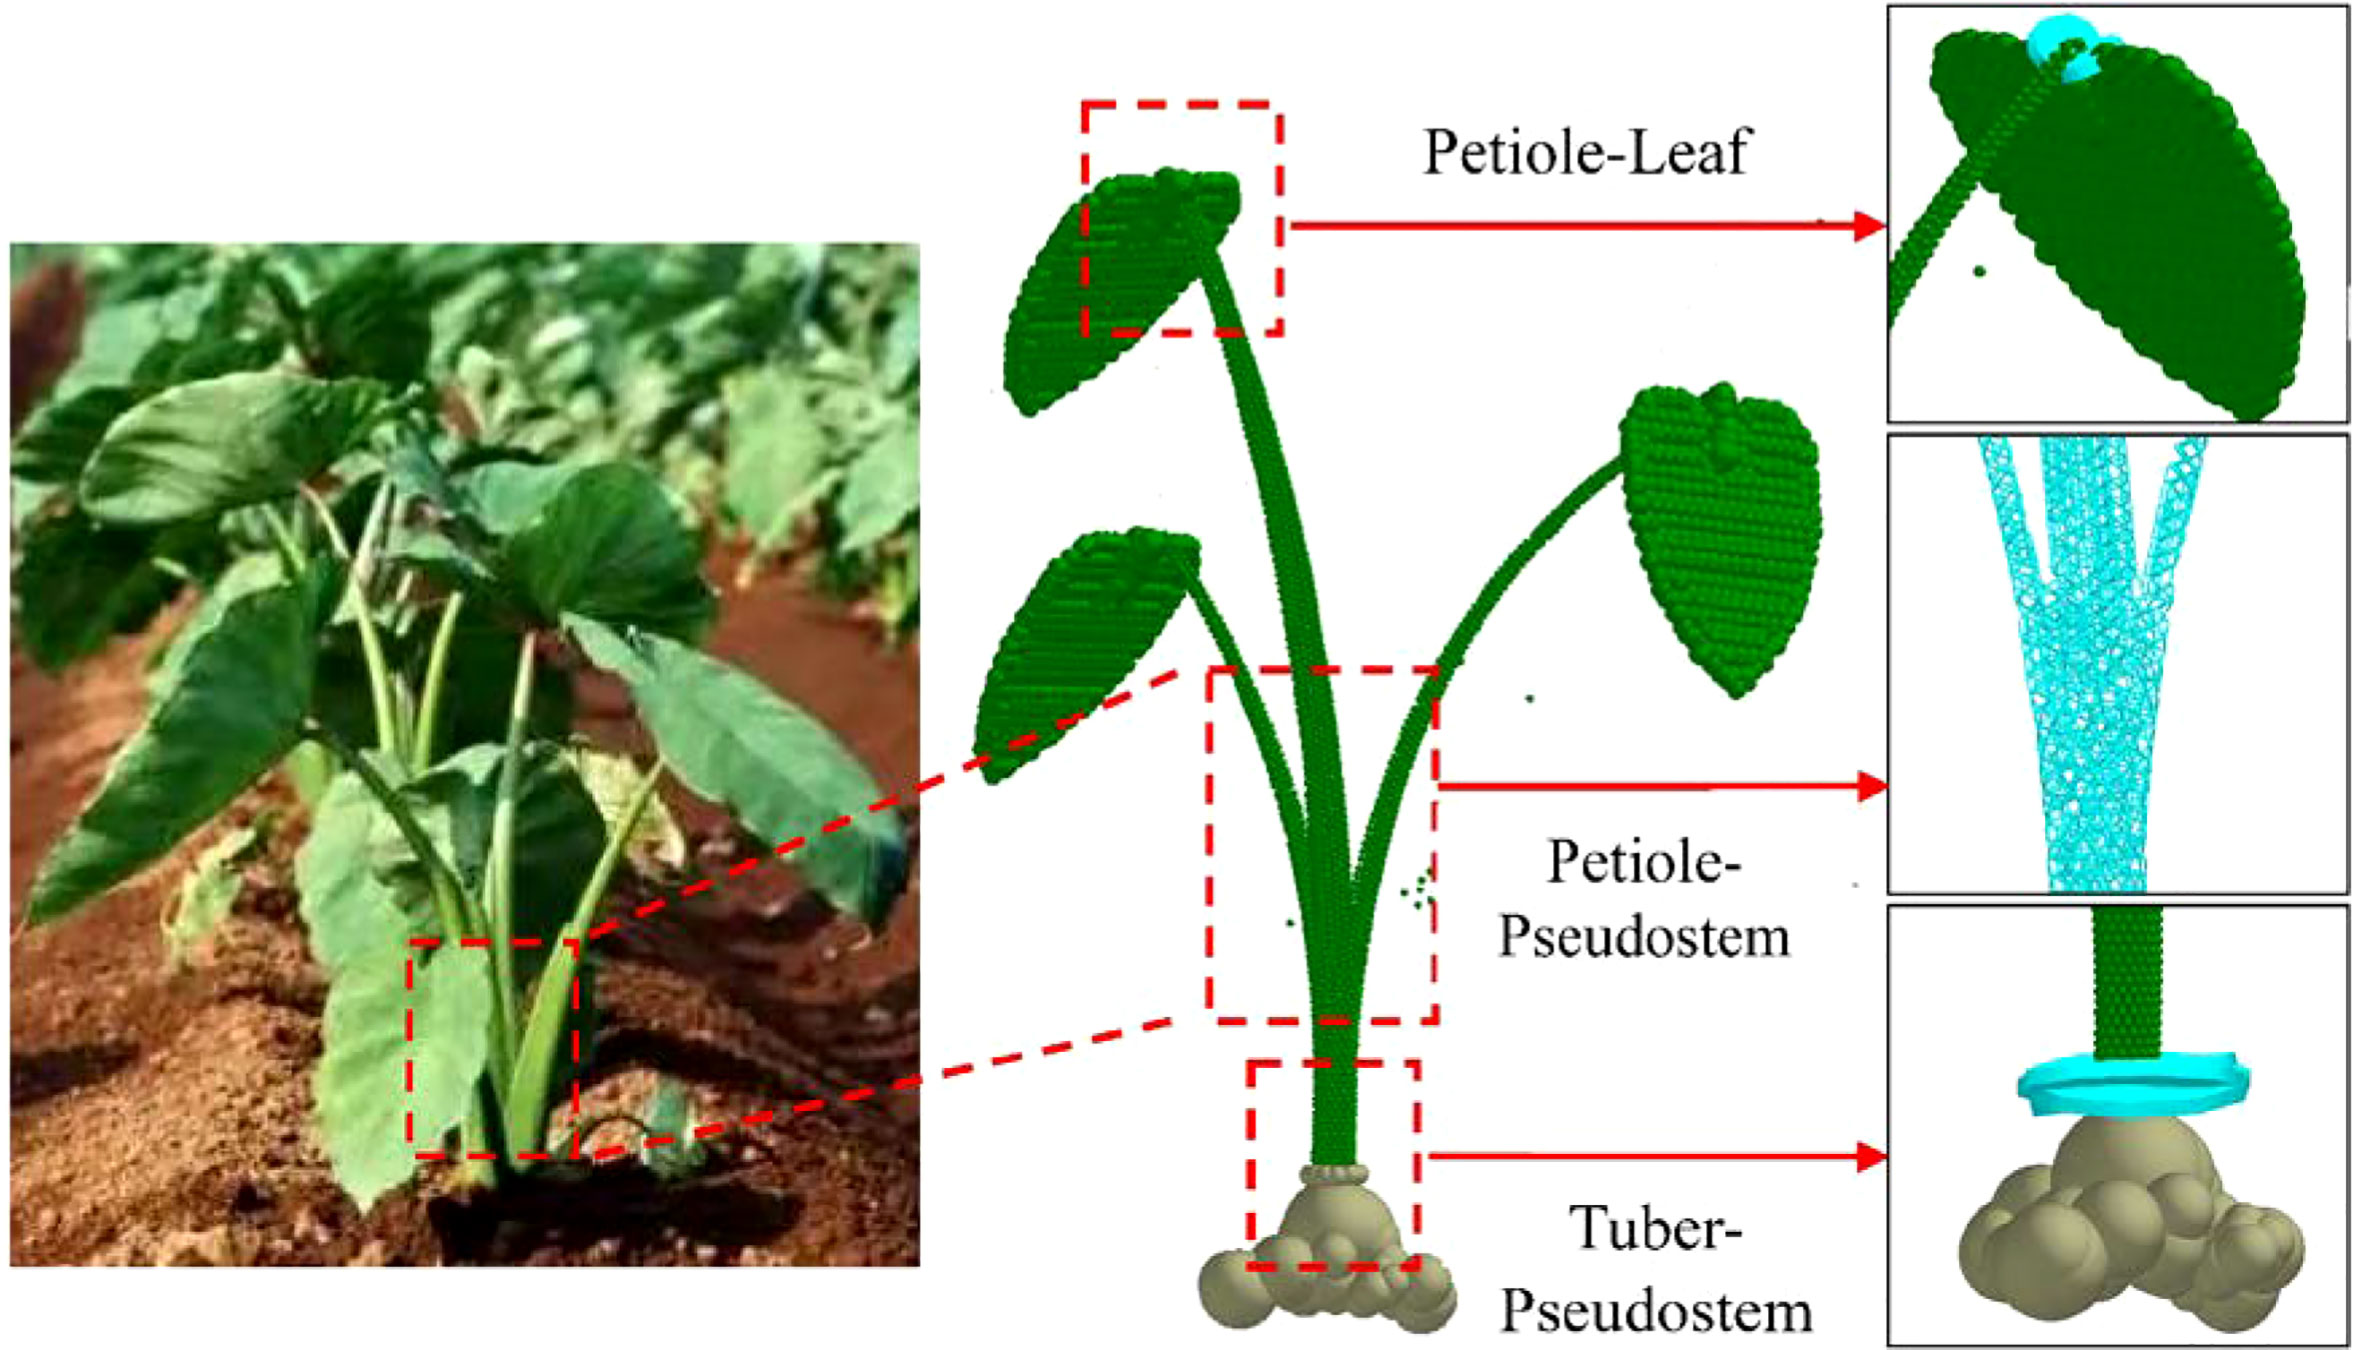
Figure 4 Discrete element flexible model of taro plant.
In order to explore the actual interaction and dynamic mechanical behavior of taro pulling from the soil, a force measuring device for taro clamping and pulling was designed and fabricated, Figure 5A is the 3D model, and Figure 5C is the platform. Working principle: Place the taro plant shown in Figure 5B in the middle of the left and right clamping boards, Under the action of the electric push rod, the taro petioles are clamped at a constant speed. When the clamping plate is in contact with the taro petiole, the pulling platform was driven by the 86 stepper motor to lift at a constant speed until the petiole does contact with the clamping plate, as shown in Figure 5D. Sliding and pulling up the taro plant from the soil, at this time, record the minimum clamping force collected by the clamping platform sensor and the instantaneous pulling resistance collected by the two sensors of the pulling platform.
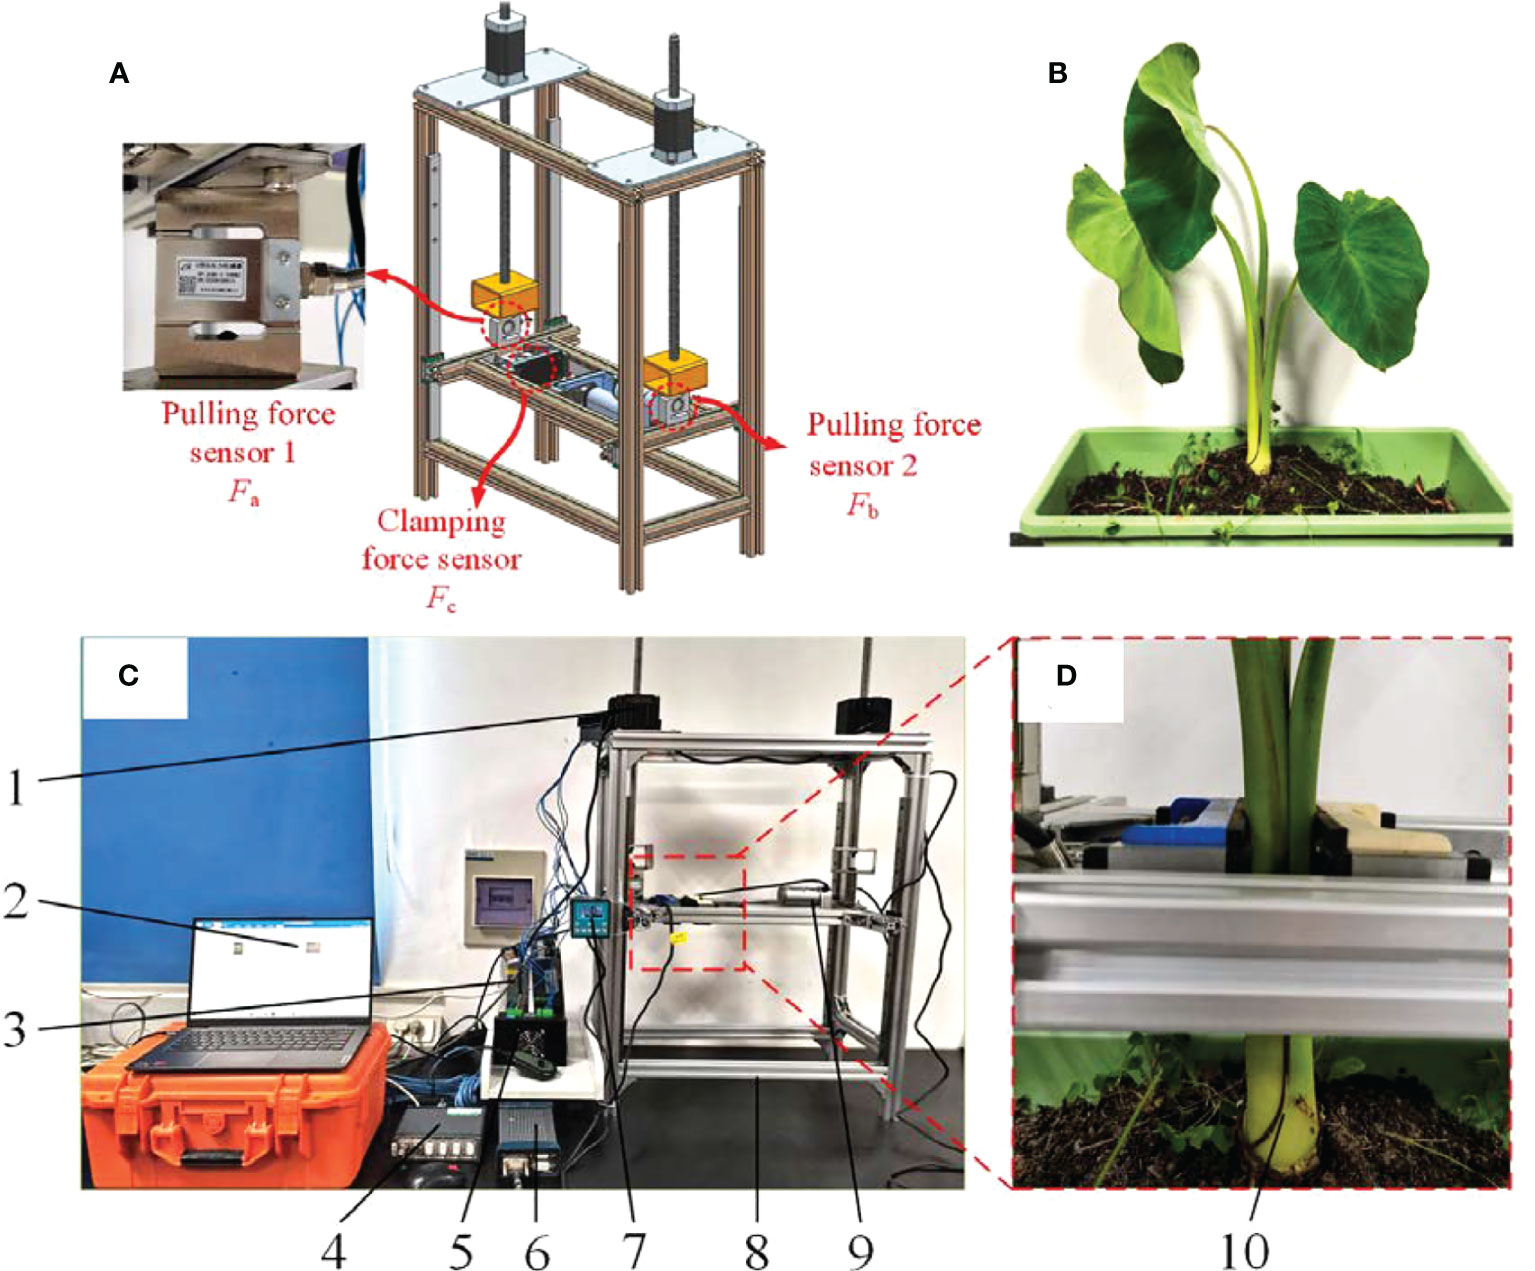
Figure 5 Mechanical force measuring platform of clamping and pulling device. (A) Sensor installation location; (B) Taro plant; (C) Mechanical force measuring platform of clamping and pulling device; 1. 86 stepper motor 2. PC test software 3. 48V power supply 4. DH380 controller 5. Motor driver 6. DH3820 collector 7. 86-stepper motor controller 8. Clamping force measuring platform 9. Electric pusher petiole 10. Taro Plant. (D) Clamping position of taro petiole.
When the sensor’s sensitivity is 0.0105mv·V-1, the dynamic calibration of the sensor is carried out by using weights to eliminate the influence of the vibration of the force measuring platform and the gravity of the bench itself. Finally, complete the process of taro clamping and pulling force measurement
Use the SDH-1202 fast halogen moisture meter to measure the moisture content of taro corms, petioles and growing soil environment, respectively. Set the drying temperature to 105°C, until the quality no longer changes, and repeat 5 times. The average measured moisture content was 75.42% for corms, 88.34% for petioles, and 21.05% for soil. Take the petiole 5 to 10 cm from the ground as the clamping position, the clamping speed is 12mm·s-1, and the pulling speed is 0.3m·s-1 as the working conditions, and the petiole does not form with the clamping plate during pulling. The minimum clamping force FC is collected at the moment of slippage, and the instantaneous pulling resistance FL1 and FL2 collected by the two pull-out sensors are recorded. The sum of FL1 and FL2 is recorded as FL. The mean value of FC and FL was 300.89N and 201.245N, respectively.
When the discrete element method is used to carry out the simulation research of taro clamping and pulling, the accuracy of the model parameters directly affects the data accuracy of the minimum clamping force and the instantaneous pulling resistance. The intrinsic parameters (density, Poisson’s ratio and elastic modulus) are the material’s inherent properties. The necessary parameters for the simulation are obtained through physical experiments and literature results, as shown in Table 1. The contact parameters (coefficient of restitution, coefficient of static friction and coefficient of rolling friction) of taro corm and petiole were obtained through tribometer experiment and high-speed photographic experiment in the early stage. The results are shown in Table 2. The soil in which taro grows is sandy loam, which has the characteristics of granular material. Hertz-Mindlin with JKR is a contact model based on Hertz theory that can characterize the viscoelasticity between particles (Horabik and Molenda, 2016). Therefore, the Hertz-Mindlin with JKR model was used for the soil, and the Hertz-Mindlin with bonding was used to reflect the adhesion between the petiole and the soil.
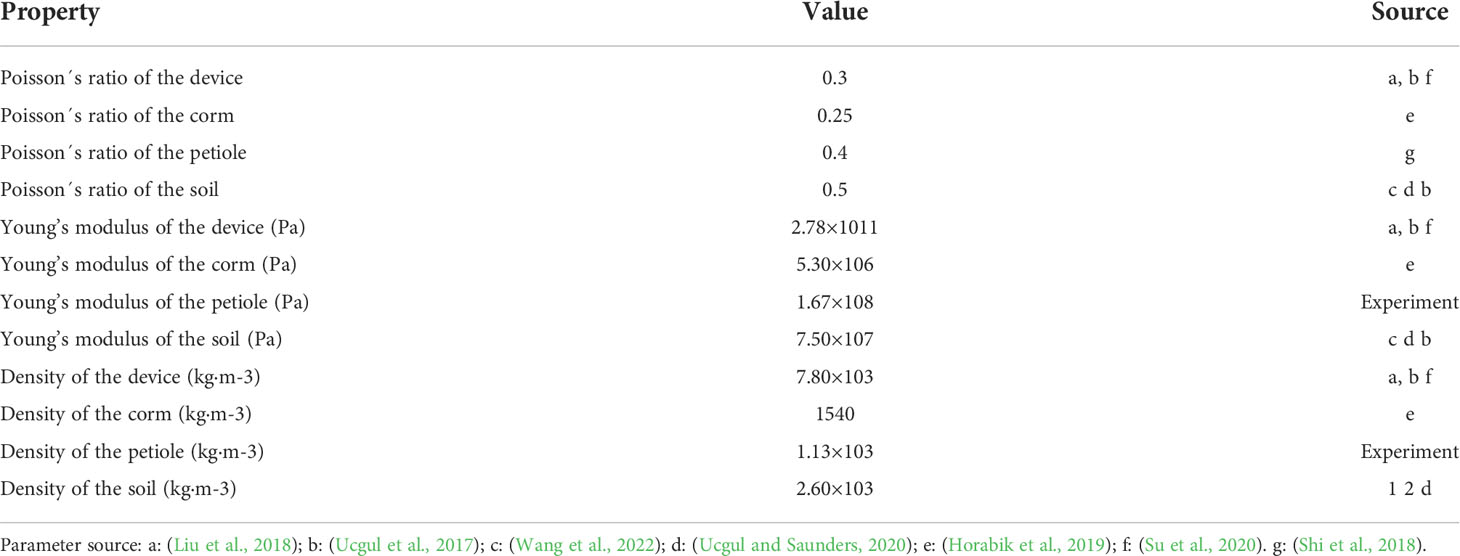
Table 1 Intrinsic parameters.
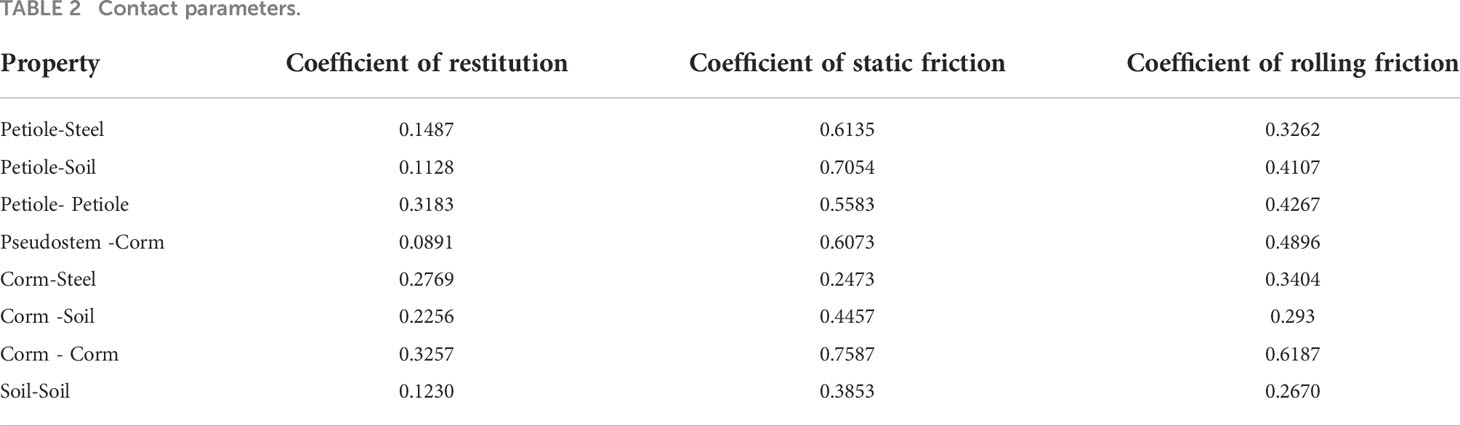
Table 2 Contact parameters.
Sn=St, σmax=τmax can simplify the parameter calibration, the inter-particle bonding behavior originates from the liquid bridge between particles (Zhu et al., 2020), and the material moisture content is measured by the inter-particle bonding radius.
Assuming that the material moisture is uniformly distributed, and wrapped around the particle to form a uniform water film, the sum of the thickness of the water film and the particle radius represents the bonding radius. Refer to the existing rhizome agricultural material simulation parameters to set its range, as shown in Table 3.
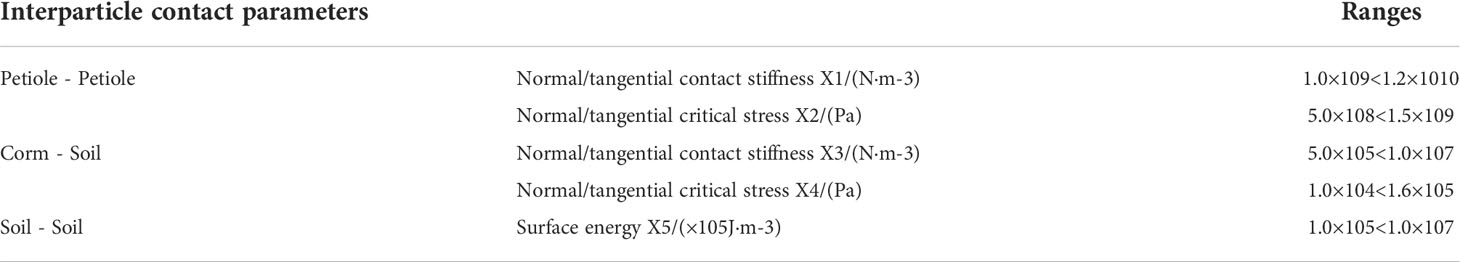
Table 3 Parameter range of particle contact model.
Through the particle filling experiment, the density ρ of the filling particles is obtained by correcting the bulk density of the material, and the formula is:
Where ρ is the density of filling particles, kg·m-3; V is the volume of the container, m3; K is the number of filling particles, each; Ri is the radius of the filling particles, mm; ρi is the bulk density of the material, kg·m-3.
Volume Vs of filled spherical particles:
Combining (9) and (10) yields:
The total volume Vi occupied by the material particles is:
Therefore, the bulk density ρi of the material:
Then the total weight mi of material particles is:
The total volume of water in the material Vw:
According to the material moisture content w:
Derivation of formula (13) yields the bonding radius RB:
Where, w is the moisture content of the material, %; RB is the bonding radius between particles, mm; ρi is the bulk density of the material, kg·m-3; ρ2 is the density of water, kg·m-3; Ri is the filling material particles Radius, mm; Vs is the filling ball particle volume, m3; Vi is the total volume occupied by material particles, m3; mi is the total weight of material particles, kg; mw is the total moisture weight, kg; Vw is the total volume of water in material, m3.
The virtual prototype model of the pulling device established by NX.12.0 is saved as stl format and imported into EDEM. In order to facilitate simulation and calculation, the parts that are not related to contact are removed, and the discrete element model of the taro clamping and pulling device is established. The size of the clamping plate is 100×50mm. The target save interval is set to 0.005s, the total simulation time is 3s, the gravitational acceleration is in the negative direction of the Z axis, and the value is -9.8kg·m-3. The main operation process Includes the following 4 steps:
The actual growth depth of taro in the soil is about 15cm underground, and the surface is exposed to about 1cm of soil. Therefore, according to the actual growth situation, the taro plants are grown in a soil trough with a size of 300 × 300 × 200 mm, and a total of 37875 particles are generated in the soil trough. The position of the clamping experiment platform was adjusted, and the two clamping plates were fixed at the petiole 5<10 cm from the ground, as shown in Figure 6A.
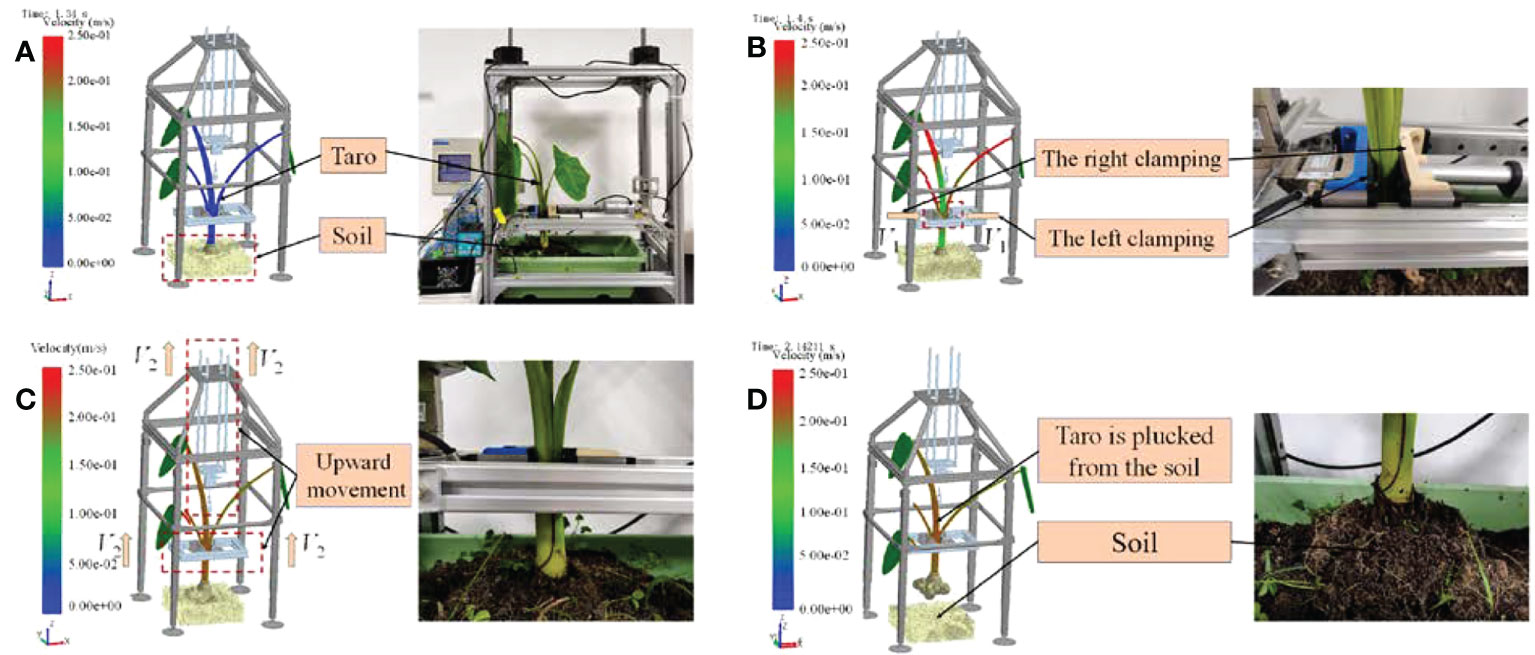
Figure 6 DEM simulation process. (A) The taro petiole is placed in the middle of the gripper; (B) The left and right clamping boards clamp the taro petiole; (C) The ascending mechanism lifts the taro plant; (D) Taro is completely pulled from the soil.
The left and right clamping plates speed were set to 12 mm·s-1 in the X-axis to clamp the petiole until the clamping plates on both sides are in contact with the petiole, as shown in Figure 6B.
The clamping plates continue to clamp the petiole, and the left and right clamping plates and the pulling platform are set at a speed of 0.3m·s-1 in the Z-axis direction to pull up the plants until the clamping plates do not slip with the petioles. Stop the speed of the clamping plate in the X-axis direction at this time, record the force change of the clamping plate in the X-axis direction, and the clamping force collected at the moment of slip is recorded as the clamping force FC for pulling out the taro, as shown in Figure 6C.
Continue to pull up the plants in the Z-axis direction until the plants are completely pulled up from the soil and record the pulling platform at the force change in the Z-axis direction, which is recorded as FL. as shown in Figure 6D.
Bench experiment to measure the holding force of the Fa, pulling force for Fb, simulation experiment of clamping force for the FC, pulling force for FL, respectively using Origin data processing software simulation experiment bench experiment and measurement of two curves for data analysis, the correlation coefficient of the two clamping force curve for RC, the correlation coefficient of the pulling force of two curve for RL, The larger the correlation coefficient is, the higher the similarity of the two curves is, indicating that the tension measured in the simulation experiment is closer to the tension obtained in the actual experiment. RC and RL are calculated according to equations (18) and (19) respectively:
Where, Fa =300.89N; Fb =201.245N.
In order to ensure the reliability of the discrete element flexible model of the whole taro plant, the Hertz-Mindlin with bonding model parameters between petiole, corm and soil, and Hertz-Mindlin with JKR model parameters between soils were calibrated. Taking the normal/tangential contact stiffness X1 between petiole, the normal/tangential critical stress X2, the normal/tangential contact stiffness X3 between corm and soil, the normal/tangential critical stress X4, and the inter-soil surface energy X5 as for the experimental factors, single-factor simulation experiments were carried out with RC and RL as the experimental indicators. The experimental parameter levels are shown in Table 4.
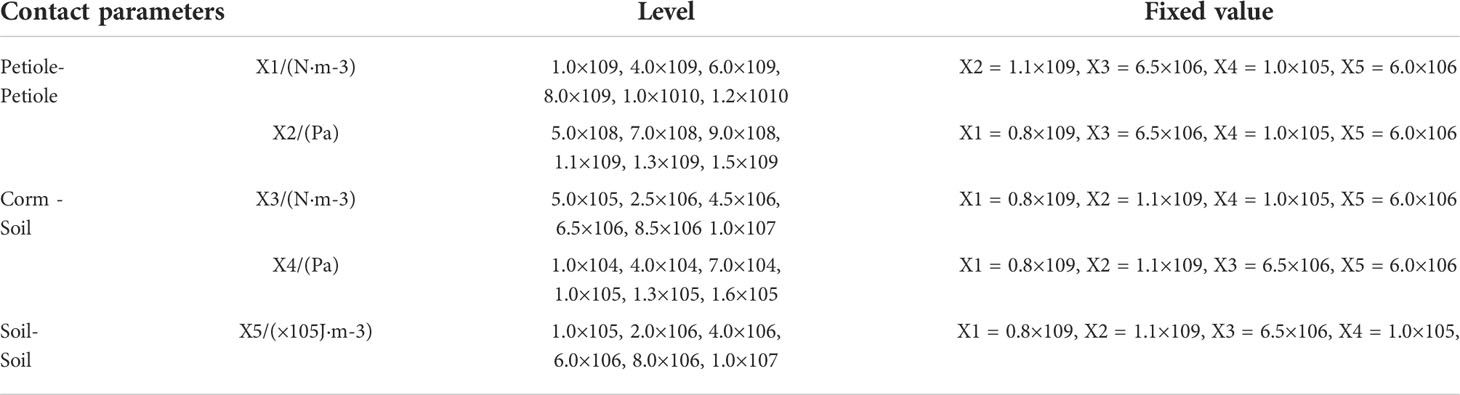
Table 4 Value range of single factor exposure parameters.
The Plackett-Burman calibration method is accurate and efficient and has been widely used in discrete element parameter calibration (Xia et al., 2019; Fang et al., 2022). First, based on the single factor experiment results, each factor is increased in equal steps to create each step parameter level and carry out a simulation experiment. Then, the parameters are further reduced through the changing trend of the Correlation coefficient of clamping force RC and the Correlation coefficient of pulling force RL, Finally, a multi-factor regression model was established, the maximum optimal solution of RC and RL was calculated, and parameter calibration was completed. Single factor simulation experiment parameters with correlation coefficient more than 50% were used as the range of Plackett-Burman experiment parameters, X1 (6.0×10⁹<1.0×10¹⁰ N·m-3), X2 (9×10⁸<1.5×10⁹ Pa), X3 (4.5×10⁶<8.5×10⁶ N·m-3), X4 (7.0×10⁴<1.6×10⁵ N·m-3), X5 (2.0×10⁶<6.0×10⁶ N·m-3).
With the increase of X1 and X2, both RC and RL show a trend of first increasing and then decreasing, as shown in Figures 7A, B, mainly because the cross-section of the petiole is composed of many fiber tubes, and there are a large number of fiber tubes around them. For parenchyma cells, the fibrous tube bundles shrink when they are clamped, and the culm is deformed. When pulling up, friction occurs between the clamping plates on both sides and the epidermis of the culm. Therefore, X1 and X2 will affect both RC and RL. With the increase of X3 and X4, both RC and RL showed a trend of first increasing and then decreasing, as shown in Figures 7C, D, With the increase of X5, both RC and RL showed a trend of first increasing and then decreasing, as shown in Figure 7E. The Plackett-Burman experiment was carried out in the range of experimental factor data with correlation coefficient more than 50% in the single factor experiment.
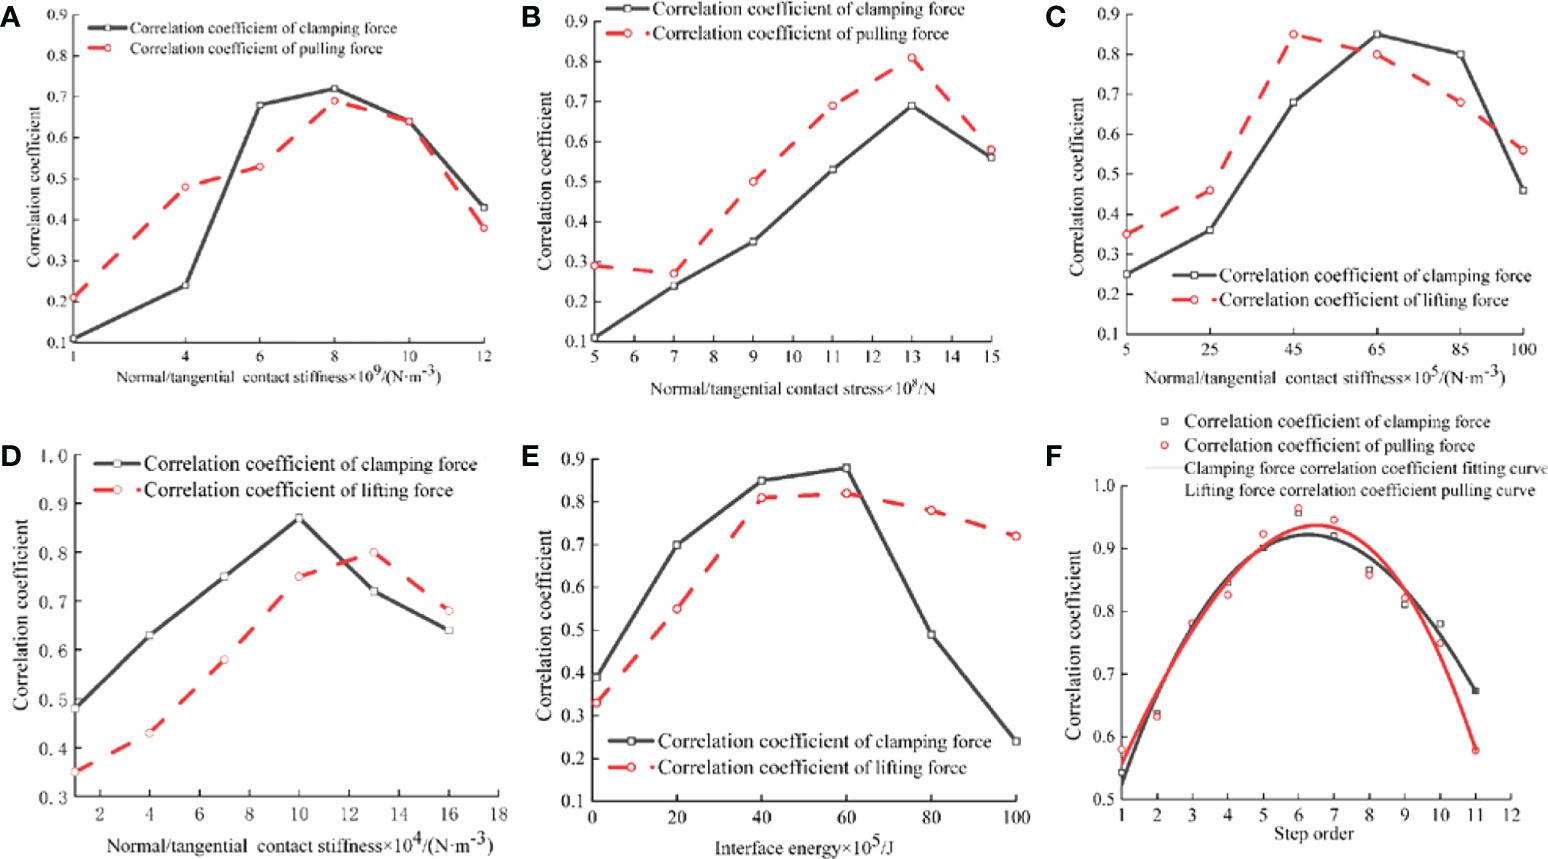
Figure 7 Results of Single factor and Plackett-Burman simulation experiments. (A) Changes of RC and RL at different X1 levels; (B) Changes of RC and RL at different X2 levels; (C) Changes of RC and RL at different X3 levels; (D) Changes of RC and RL at different X4 levels; (E) Changes of RC and RL at different X5 levels; (F) Fitting plot of step order and correlation coefficient.
The starting point parameter group of Plackett-Burman experiment climbing was A1 (the lower limit of the contact parameter to be calibrated), and the end parameter group was Am (the higher limit of the contact parameter to be calibrated), then each step parameter group can be expressed as:
Where, m is the total number of steps for climbing (that is, the number of calibration experiments), n is the total number of parameters to be calibrated (n=5), and the step size A is:
The value range of step order x is 1≤x≤m, and the value corresponding to each contact parameter group:
The larger m is, the closer the contact parameters of each group of calibration experiments are, and the clamping force FC and the pulling resistance FL will be more accurate with the change of the parameter group, but the number of simulations will increase. Based on the calibration accuracy and workload, this research uses Design Expert software to design 11 groups of experiments including 5 influencing factors and divides the high and low levels of each influencing factor into 10 equally for the steepest climbing experiment. The experimental design is shown in Table 5.

Table 5 Calibration experiment results.
With the increase of step order, both RC and RL show a trend of first increasing and then decreasing. The step order and correlation coefficient are fitted, as shown in Figure 7F. The fitting equations:
Among them, the coefficient of determination , , the fitting degree of the fitting equation to the simulation experiment value is good.
According to the minimum value of the quadratic fitting parabola, when the step order x1 = 6.48, x2 = 6.27, the RC and RL values are the maximum. x1 and x2 mean x=6.375, at this time RC=0.865, RL =0.937. According to formula (22), the final result of the contact parameter group corresponding to the interaction of the taro plant: X1 (8.15×10⁹ N·m-3), X2 (1.22×10⁹ Pa), X3 (6.65×10⁶ N·m-3), X4 (1.18×10⁵ N·m-3), X5 (4.15×10⁶ N·m-3).
To verify the application of the taro tiller plant model, Substitute X1, X2, X3, X4, X5 into the simulation experiment, The clamping speed was set to 12mm·s-1, and the pulling speed was set to 0.3 m·s-1, the clamping plate was set at 5<10 cm from the soil surface at the petiole, and the minimum clamping force FC and the instantaneous pulling resistance FL at the critical moment of slippage during the pulling process of the taro are recorded.
The relative velocity of the petiole and the clamping plate in the pulling direction is an important factor to judge whether the two have slipped. Therefore, combined with the post-processing function of EDEM, two local relative velocity monitoring sensors are established at the petiole clamping position. To monitor the movement speed of the holding plate and the taro plant in the pulling direction, as shown in Figure 8, output the speed changes of the petiole and the holding plate in the two monitors at each time step, calculated by formula (27) Obtain the relative motion speed between the petiole and the clamping plate:
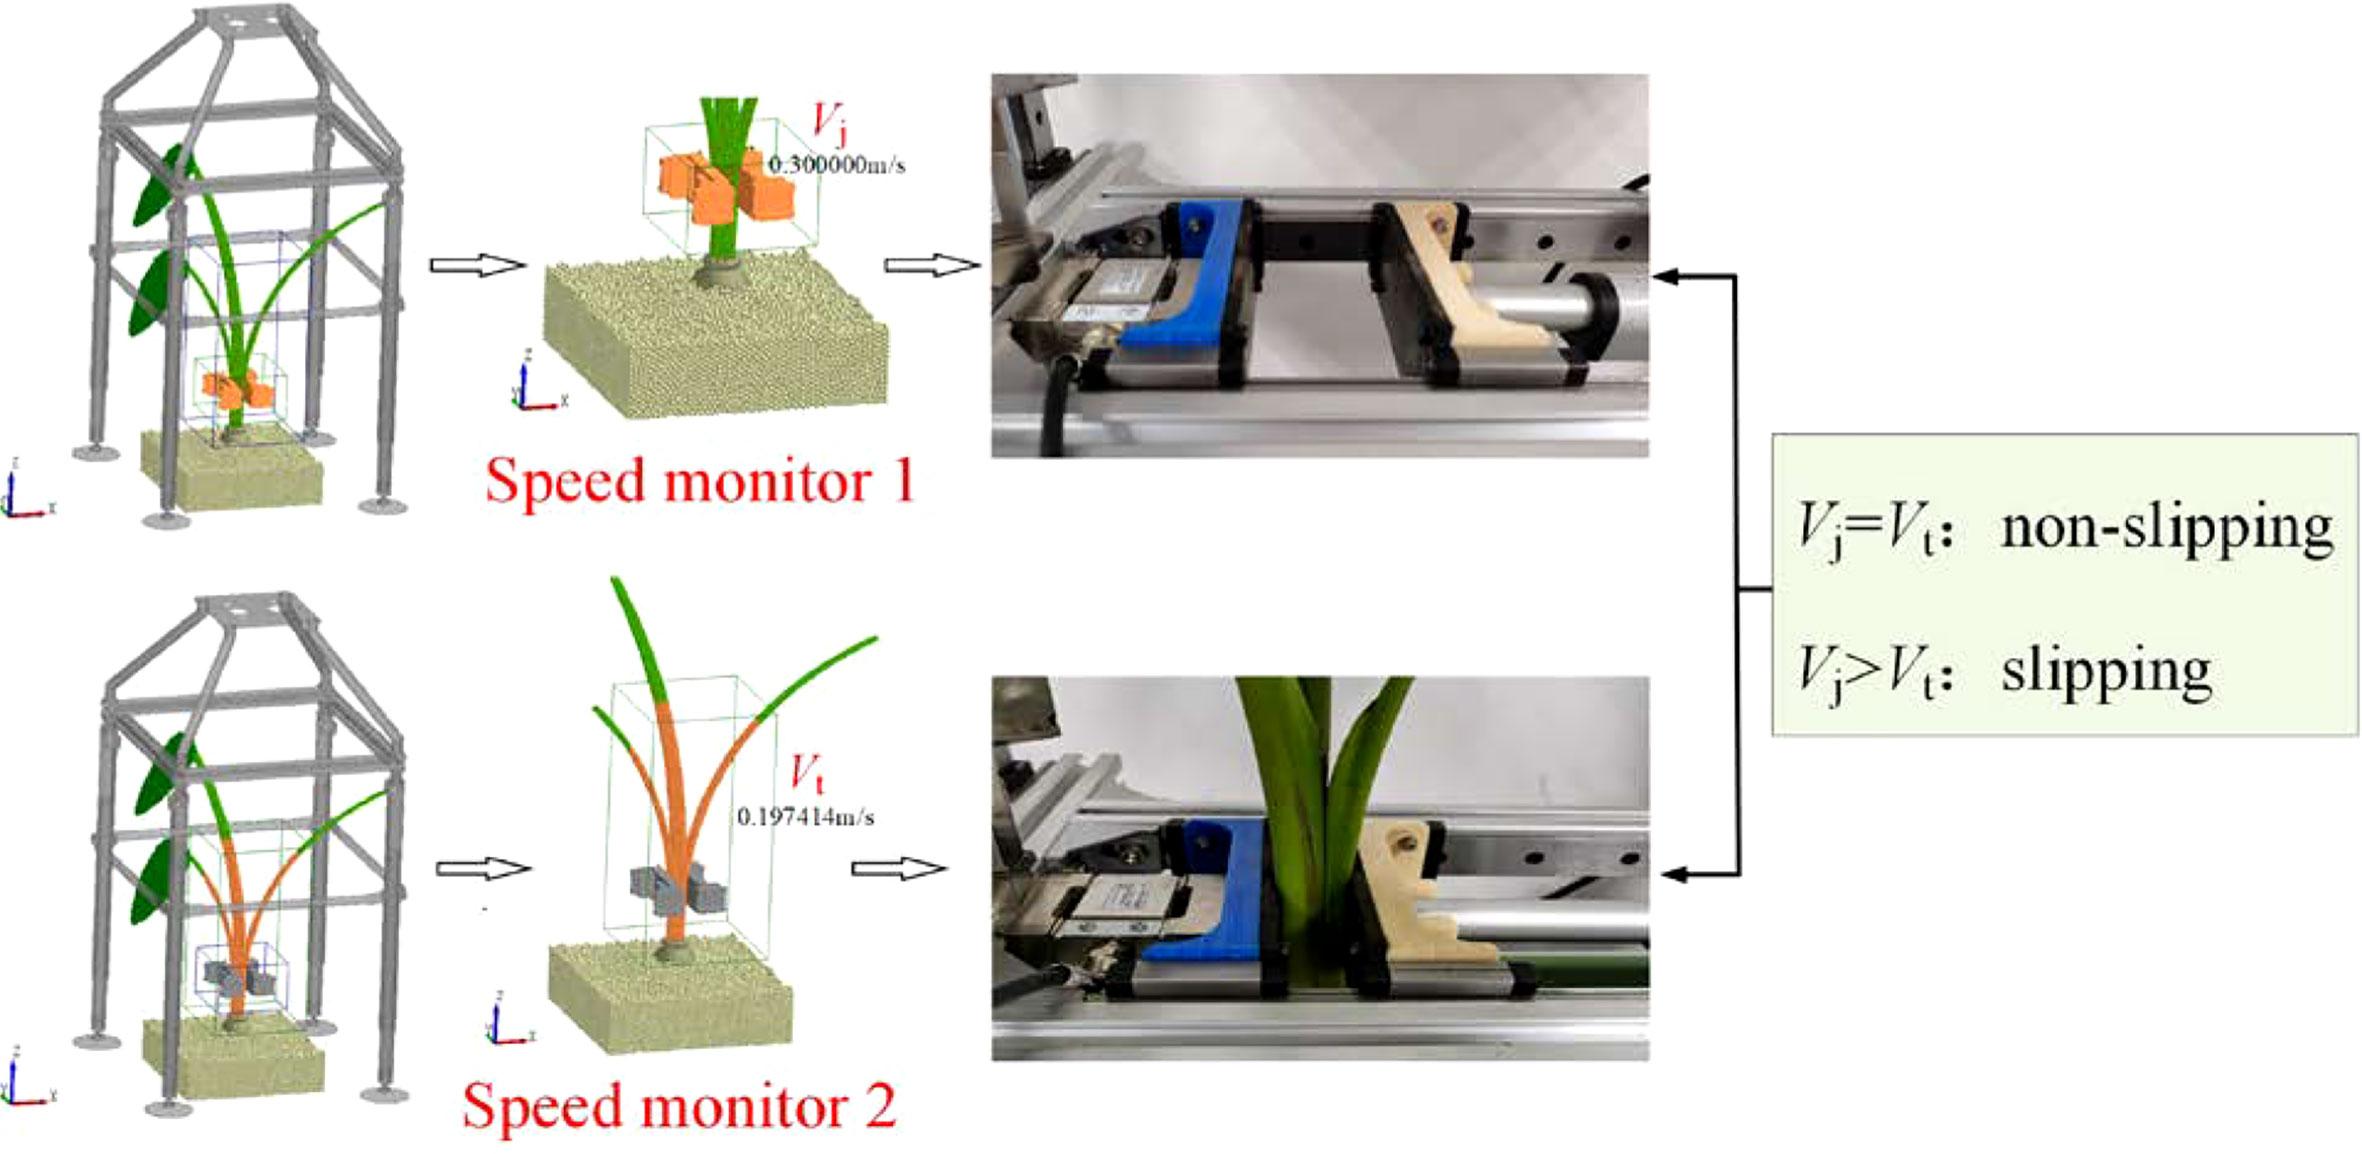
Figure 8 The speed monitor established by the simulation experiment.
where ηi is the relative velocity of the petiole and the clamping plate in the pulling direction at the i moment, m·s-1; Vj is the speed of the clamping plate in the pulling direction, m·s-1; Ve is the taro plant in the pulling direction. The speed in the pulling direction, m·s-1.
When ηi>1, it means that the petiole and the clamping plate have slipped, and the clamping force will continue to be applied at this time; until ηi=1, it means that the petiole and the clamping plate are not affected by the sliding force and record this time. It is the FC for taro to pull out, and under this clamping force, the FL of taro is measured synchronously.
When the clamping force of the simulation experiment and bench experiment set into a fixed value 300 N, respectively, in the speed of 0.1, 0.2, 0.3, 0.4, 0.5 m·s-1 under the condition of experiment, we got the data from 10 groups of pulling, the same speed of simulation experiment data and bench data on the same picture, as shown in Figure 9. We know from the experiment data that the pulling variation trend of the simulation experiment and the bench experiment is basically the same, but the pulling value of the bench experiment is larger than that of the simulation experiment, because the environment of the simulation experiment is more ideal than that of the bench experiment. By comparing the result of the same experiment method under the condition of different speed, it is found that with increasing speed, pulling fluctuation frequency is reduced, but the volatility increases, this is because the impact of the speed, the greater the taro plants are bigger, and it also can be faster from the soil, but the petioles is at risk of being destroyed. We successively conducted correlation analysis on different experiments at the same speed and obtained that the correlation coefficients of pulling variation between simulation experiment and bench experiment were 0.812, 0.850, 0.770, 0.697 and 0.652, respectively. The average value of correlation coefficients was 0.756, which indicated that the discrete element plant model established by simulation was close to the real plant. The discrete element model of taro plant established in this paper has high reliability.
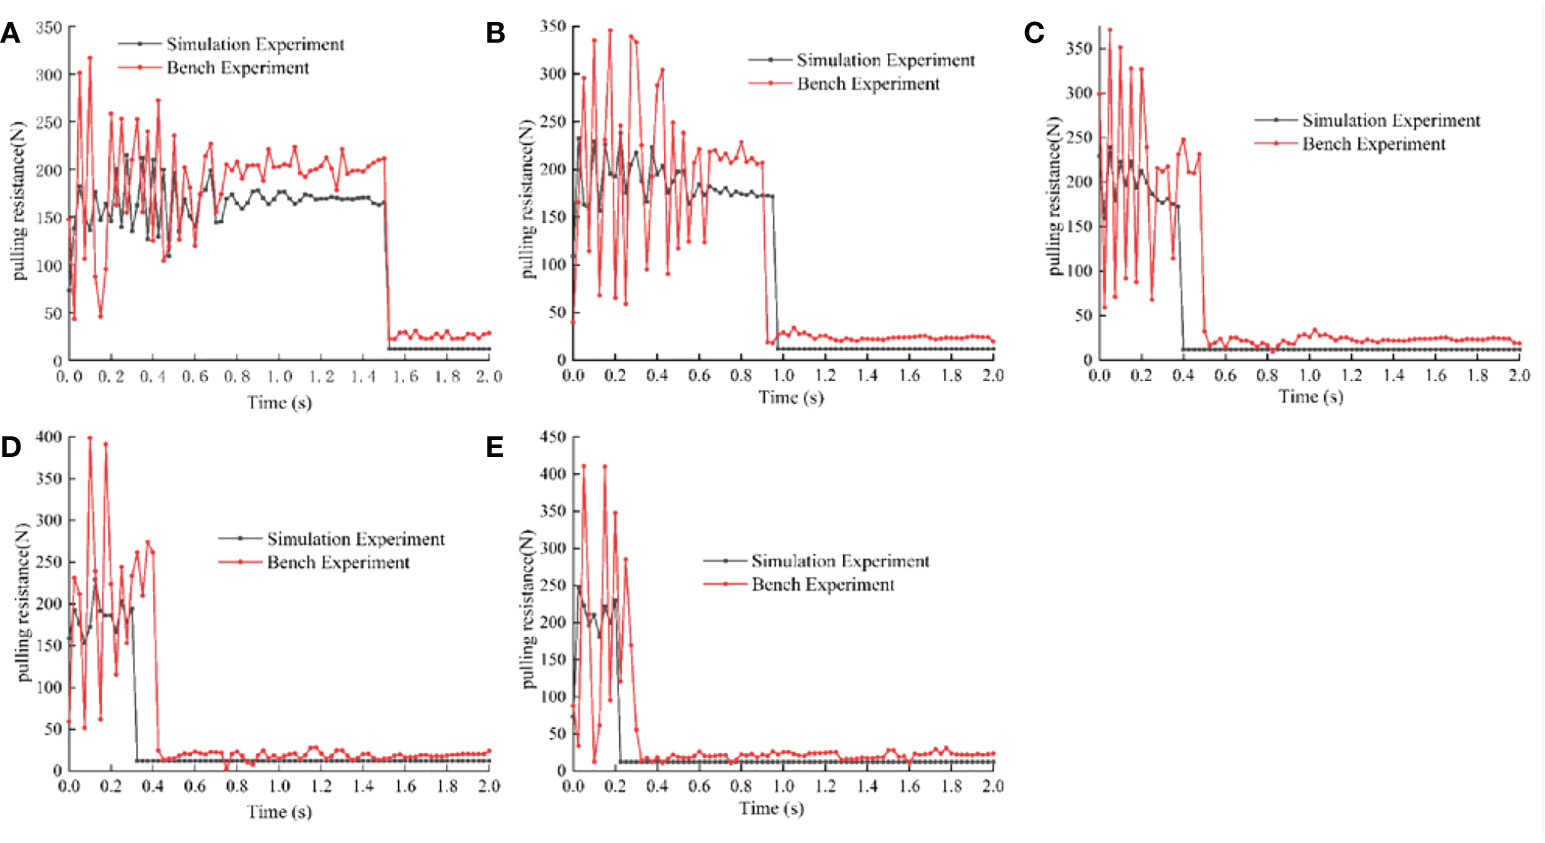
Figure 9 Comparison of bench experiment and simulation experiment. (A) Comparison between the bench and simulation when the pulling speed is 0.1m·s-1; (B) Comparison between the bench and simulation when the pulling speed is 0.2m·s-1; (C) Comparison between the bench and simulation when the pulling speed is 0.3m·s-1; (D) Comparison between the bench and simulation when the pulling speed is 0.4m·s-1; (E) Comparison between the bench and simulation when the pulling speed is 0.5m·s-1.
The discrete element flexible model of taro plant was established by using EDEM software, and a method to test the clamping and pulling resistance of taro in the harvesting process was proposed, which provided a theoretical basis and model reference for the research and development of taro harvesting machinery. The parameter calibration results of discrete element model of taro plant are as follows: petiole-petiole method/tangential contact stiffness was 8.15×10⁹ N·m-3, and normal/tangential critical stress was 6.65×10⁶ Pa. The contact stiffness of pseudostem- corm method was 1.22×10⁹ N·m-3, the critical stress of normal/tangential was 1.18×10⁵ Pa, and the energy of soil surface was 4.15×10⁶J·m-3.
When the pulling speed is 0.1, 0.2, 0.3, 0.4 and 0.5 m·s-1, the correlation coefficients between the simulation experiment and the bench experiment are 0.812, 0.850, 0.770, 0.697 and 0.652, respectively. The average value of correlation coefficient is 0.756, indicating that the simulated discrete element plant model is close to the real plant model. The discrete element model of taro plant established in this paper has high reliability.
In the future, the discrete element flexible model of taro plants can be applied to many aspects - studying the reaction force of taro corms and soil slip process when the tractor walking tire compacts the soil; carrying out the simulation experiment of the cutting process of petiole, which is used for the structural design of the cutting blade and the determination of important parameters such as the cutting angle. It can also provide a basis for the structural design of the excavating shovel based on discrete element and multi-body dynamics methods, and at the same time provide an important theoretical model for the in-depth study of corm excavation damage.
The original contributions presented in the study are included in the article/supplementary material. Further inquiries can be directed to the corresponding author.
LW, ZG and ZY designed and performed the experiments and analyzed the data. LW, LH and TN wrote the manuscript. KQ and ZZ made the pictures. All authors contributed to the article and approved the submitted version.
This study was supported by the National Characteristic Vegetable Industry Technology System Special Project, Project, No. CARS-24-D-02.
We thank the Engineering Training Center of Huazhong Agricultural University for providing the test site.
The authors declare that the research was conducted in the absence of any commercial or financial relationships that could be construed as a potential conflict of interest.
All claims expressed in this article are solely those of the authors and do not necessarily represent those of their affiliated organizations, or those of the publisher, the editors and the reviewers. Any product that may be evaluated in this article, or claim that may be made by its manufacturer, is not guaranteed or endorsed by the publisher.
Aditika, S., Kapoor, B., Singh, S., Kumar, P. (2022). Taro (Colocasia esculenta): Zero wastage orphan food crop for food and nutritional security. South Afr. J. Bot. 145, 157–169. doi: 10.1016/j.sajb.2021.08.014
Andreas, E., Waqainabete, L. M. (2018). Conserving and sharing taro genetic resources for the benefit of global taro cultivation: A core contribution of the centre for pacific crops and trees. Biopreserv Biobank 16, 361–367. doi: 10.1089/bio.2018.0017
Chen, L. T., Mou, X. W., Xue, J. X., Peng, Z. J., Liu, W. J. (2022). Research status and prospect of cassava mechanized planting and harvesting equipment at home and abroad. Agric. Eng. 12 (02), 10–16. doi: 10.19998/j.cnki.2095-1795.2022.02.002
Chen, L. T., Xue, J. X., Mou, X. W., Xiang, J. S. (2022). Design and experiments of the stepped vibration seed dispersal mechanism for pre-cut cassava planters. Trans. Chin. Soc. Agric. Eng. 38, 27–37. doi: 10.11975/j.issn.1002-6819.2022.08.004
Cucinotta, F., Scappaticci, L., Sfravara, F., Morelli, F., Mariani, F., Varani, M., et al. (2019). On the morphology of the abrasive wear on ploughshares by means of 3D scanning. Biosyst. Eng. 179, 117–125. doi: 10.1016/j.biosystemseng.2019.01.006
Dominik, D., Peter, A., Anton, T., Edward, S. Q., Jan-Henrik, T., Jonas, G., et al. (2021). Predicting tree species from 3D laser scanning point clouds using deep learning. Front. Plant Sci. 12. doi: 10.3389/fpls.2021.635440
Fang, M., Yu, Z. H., Zhang, W. J., Cao, J., Liu, W. H. (2022). Friction coefficient calibration of corn petiole particle mixtures using plackett-burman design and response surface methodology. Powder Technol. 396, 731–742. doi: 10.1016/j.powtec.2021.10.040
Guo, J., Karkee, M., Yang, Z., Fu, H., Li, J., Jiang, T. T., et al. (2021). Discrete element modeling and physical experiment research on the biomechanical properties of banana bunch petiole for postharvest machine development. Comput. Electron. Agric. 188, 106308. doi: 10.1016/j.compag.2021.106308
Hao, J. J., Wei, W. B., Huang, P. C., Qin, J. H., Zhao, J. G. (2021). Calibration and experimental verification of discrete element parameters of oil sunflower seeds. Trans. Chin. Soc. Agric. Eng. (Transactions CSAE) 37, 36–44. doi: 10.11975/j.issn.1002-6819.2021.12.005
He, X. N., Zhang, X. J., Zhao, Z., Shang, S. Q., Wang, D. W., Yang, S. (2022). Design and optimization tests of reverse spin-throwing cyperus edulis starting device. Trans. Chin. Soc. Agric. Machinery 53, 34–43. doi: 10.6041/j.issn.1000-1298.2022.05.004
Horabik, J., Molenda, M. (2016). Parameters and contact models for DEM simulations of agricultural granular materials: A review. Biosyst. Eng. 147, 206–225. doi: 10.1016/j.biosystemseng.2016.02.017
Horabik, J., Wiącek, J., Parafiniuk, P., Stasiak, M., Bańda, M., Molenda, M. (2019). Tensile strength of pressure-agglomerated potato starch determined via diametral compression test: Discrete element method simulations and experiments. Biosyst. Eng. 183, 95–109. doi: 10.1016/j.biosystemseng.2019.04.019
Liu, C. L. (2021). Study on the design and damage rule of sweet potato combined harvesting, conveying and separating device. Shandong Agric. Univ. doi: 10.27277/d.cnki.gsdnu.2021.001044
Liu, W. Z., He, J., Li, H. W., Li, X. Q., Zheng, K., Wei, Z. C. (2018). Calibration of simulation parameters for potato mini petiole based on EDEM. Trans. Chin. Soc. Agric. Machinery 49, 125–135. doi: 10.6041/j.issn.1000-1298.2018.05.014
Liu, F. Y., Zhang, J., Chen, J. (2018). Modeling of flexible wheat straw by discrete element method and its parameter calibration. Int. J. Agr. Biol. Eng. 11, 42–46. doi: 10.25165/j.ijabe.20181103.3381
Liu, Y. G., Zhao, J. G., Yin, B. Z., Ma, Z. K., Hao, J. J., Yang, X., et al. (2022). Discrete element modelling of the yam root–soil complex and its verification. Biosyst. Eng. 220, 55–72. doi: 10.1016/j.biosystemseng.2022.05.002
Li, B. W., Zong, Y. X., Wu, M. (2022). World taro production and trade situation analysis. China Vegetables 6, 1–6. doi: 10.19928/j.cnki.1000-6346.2022.5020
Ma, Z., Li, Y., Xu, L. (2015). Discrete-element method simulation of agricultural particles’ motion in variable-amplitude screen box. Comput. Electron. Agric. 118, 92–99. doi: 10.1016/j.compag.2015.08.030
Sharma, S., Jan, R., Kaur, R., Riar, C. S. (2020). “Taro (Colocasia esculenta),” in Antioxidants in vegetables and nuts - properties and health benefits. Eds. Nayik, G. A., Gull, A. (Singapore: Springer). doi: 10.1007/978-981-15-7470-2_18
Shen, C., Li, X. W., Tian, K. P., Zhang, B., Huang, J. C., Chen, Q. M. (2015). Experimental analysis on mechanical model of ramie petiole. Trans. Chin. Soc. Agric. Eng. (Transactions CSAE) 31, 26–33. doi: 10.11975/j.issn.1002-6819.2015.20.004
Shi, L. R., Sun, W., Zhao, W. Y., Yang, X. P., Feng, B. (2018). Parameter determination and validation of discrete element model of seed potato mechanical seeding. Trans. Chin. Soc. Agric. Eng. (Transactions CSAE) 34, 35–42. doi: 10.11975/j.issn.1002-6819.2018.06.004
Singla, D., Singh, A., Dhull, S. B., Kumar, P., Malik, T., Kumar, P. (2020). Taro starch: Isolation, morphology, modification and novel applications concern - a review. Int. J. Biol. Macromol. 163, 1283–1290. doi: 10.1016/j.ijbiomac.2020.07.093
Su, Z., Li, Y. M., Dong, Y. H., Tang, Z., Liang, Z. W. (2020). Simulation of rice threshing performance with concentric and non-concentric threshing gaps. Biosyst. Eng. 197, 270–284. doi: 10.1016/j.biosystemseng.2020.05.020
Ucgul, M., Saunders, C. (2020). Simulation of tillage forces and furrow profile during soil-mouldboard plough interaction using discrete element modelling. Biosyst. Eng. 190, 58–70. doi: 10.1016/j.biosystemseng.2019.11.022
Ucgul, M., Saunders, C., Fielke, J. M. (2017). Discrete element modelling of top soil burial using a full scale mouldboard plough under field conditions. Biosyst. Eng. 160, 140–153. doi: 10.1016/j.biosystemseng.2017.06.008
Wang, B., Zhai, G. H., Jiang, L., Shao, Y. C. (2012). Characteristic export vegetable – high quality and high yield cultivation technology of taro. J. Changjiang Vegetables 10, 51–52. doi: 10.3865/j.issn.1001-3547.2012.10.020
Wang, X. Z., Zhang, Q. K., Huang, Y. X., Ji, J. G. (2022). An efficient method for determining DEM parameters of a loose cohesive soil modelled using hysteretic spring and linear cohesion contact models. Biosyst. Eng. 215, 283–294. doi: 10.1016/j.biosystemseng.2022.01.015
Xia, R., Li, B., Wang, X. W., Li, T. J., Yang, Z. J. (2019). Measurement and calibration of the discrete element parameters of wet bulk coal. Measurement 142, 84–95. doi: 10.1016/j.measurement.2019.04.069
Yang, J. M., Yang, W., Yang, J. (2022). Measurement of cassava seed stem parameters and calibration of EDEM simulation parameters. J. Agric. Mechanization Res. 44 (01), 197–202+207. doi: 10.13427/j.cnki.njyi.2022.01.033
Yu, Q. X. (2019). Design and test of air suction hole wheel type notoginseng precision seed arrangement device. Kunming Univ. Sci. Technol. doi: 10.27200/d.cnki.gkmlu.2019.000162
Yu, Q. X., Cao, G. Q., Chen, B., Yan., L., Gong, Y., Chen, X. B. (2022). Application and research status of harvesting mechanization of rhizome Chinese medicinal materials. Chin. J. Agric. Mechanization 43 (08), 15–21. doi: 10.13733/j.jcam.issn.2095-5553.2022.08.003
Yu, Q. X., Liu, Y., Chen, X. B., Sun, K., Lai, Q. H. (2020). Calibration and experiment of simulation parameters for panax notoginseng seeds based on DEM. Trans. Soc. Agric. Machinery 51 (02), 123–132. doi: 10.6041/j.issn.1000-1298.2020.02.014
Zhou, K., Jensen, A. L., Bochtis, D. D., Sørensen, C. G. (2015). Simulation model for the sequential in-field machinery operations in a potato production system. Comput. Electron. Agric. 116, 173–186. doi: 10.1016/j.compag.2015.06.018
Zhu, Q. L., Li, B. C., Liu, X. Y., Shan, N., Sun, J. Y., Zhang, H. Y., et al. (2022). Uncovering the mechanism preliminarily of formation and development of taro corm in vitro by morphological physiology and transcriptomic analysis. Scientia Horticulturae 291, 291. doi: 10.1016/j.scienta.2021.110575
Keywords: taro, discrete element flexible model, parameter variation, clamping and pulling force, bench experiment, simulation experiment
Citation: Wanru L, Guozhong Z, Yong Z, Haopeng L, Nanrui T, Qixin K and Zhuangzhuang Z (2022) Establishment of discrete element flexible model of the tiller taro plant and clamping and pulling experiment. Front. Plant Sci. 13:1019017. doi: 10.3389/fpls.2022.1019017
Received: 14 August 2022; Accepted: 11 October 2022;
Published: 03 November 2022.
Edited by:
Wei Qiu, Nanjing Agricultural University, ChinaReviewed by:
Xavier Frank, Institut National de recherche pour l’agriculture, l’alimentation et l’environnement (INRAE), FranceCopyright © 2022 Wanru, Guozhong, Yong, Haopeng, Nanrui, Qixin and Zhuangzhuang. This is an open-access article distributed under the terms of the Creative Commons Attribution License (CC BY). The use, distribution or reproduction in other forums is permitted, provided the original author(s) and the copyright owner(s) are credited and that the original publication in this journal is cited, in accordance with accepted academic practice. No use, distribution or reproduction is permitted which does not comply with these terms.
*Correspondence: Zhang Guozhong, emhhbmdnekBtYWlsLmh6YXUuZWR1LmNu
Disclaimer: All claims expressed in this article are solely those of the authors and do not necessarily represent those of their affiliated organizations, or those of the publisher, the editors and the reviewers. Any product that may be evaluated in this article or claim that may be made by its manufacturer is not guaranteed or endorsed by the publisher.
Research integrity at Frontiers
Learn more about the work of our research integrity team to safeguard the quality of each article we publish.