
95% of researchers rate our articles as excellent or good
Learn more about the work of our research integrity team to safeguard the quality of each article we publish.
Find out more
ORIGINAL RESEARCH article
Front. Plant Sci. , 08 December 2022
Sec. Plant Physiology
Volume 13 - 2022 | https://doi.org/10.3389/fpls.2022.1018991
This article is part of the Research Topic Abiotic Stress Signaling in Plants: Functional Genomic Intervention, Volume II View all 18 articles
 Bingqian Tang1,2,3†
 Guangbin Yang2†Juan Du2Lingling Xie3Jin Wang1Luzhao Pan1
 Yin Luo2Qingyun Shan1
 Xuexiao Zou1,2,3,4Cheng Xiong1,3*
 Feng Liu1,2,3,4*
Hydrogen peroxide (H2O2) is a regulatory component related to plant signal transduction. To better understand the genome-wide gene expression response to H2O2 stress in pepper plants, a regulatory network of H2O2 stress-gene expression in pepper leaves and roots was constructed in the present study. We collected the normal tissues of leaves and roots of pepper plants after 40 days of H2O2 treatment and obtained the RNA-seq data of leaves and roots exposed to H2O2 for 0.5–24 h. By comparing the gene responses of pepper leaves and roots exposed to H2O2 stress for different time periods, we found that the response in roots reached the peak at 3 h, whereas the response in leaves reached the peak at 24 h after treatment, and the response degree in the roots was higher than that in the leaves. We used all datasets for K-means analysis and network analysis identified the clusters related to stress response and related genes. In addition, CaEBS1, CaRAP2, and CabHLH029 were identified through a co-expression analysis and were found to be strongly related to several reactive oxygen species-scavenging enzyme genes; their homologous genes in Arabidopsis showed important functions in response to hypoxia or iron uptake. This study provides a theoretical basis for determining the dynamic response process of pepper plants to H2O2 stress in leaves and roots, as well as for determining the critical time and the molecular mechanism of H2O2 stress response in leaves and roots. The candidate transcription factors identified in this study can be used as a reference for further experimental verification.
Biotic and abiotic stresses are the main environmental factors that restrict normal growth and development of plants by decreasing the yield, thereby posing a threat to food safety (Fedoroff et al., 2010; Zhu, 2016).
Hydrogen peroxide (H2O2), an important regulatory component of plant signal transduction, affects plant growth in a concentration-dependent manner (Xiong et al., 2015). In a root dipping treatment of Solanum lycopersicum, low doses of H2O2 (0.1 or 0.5 mM) were reported to be potentially advantageous for the development of plants (Nazir et al., 2019). In a study, the dose of 0.1 mM H2O2 was found to be optimum as it caused a maximum increase in the length, fresh mass, and dry mass of Solanum lycopersicum roots and shoots (Nazir et al., 2019). In cucumbers, a low concentration of H2O2 improved the germination capability, germination rate, tap root length, and hypocotyledonary axis, whereas high H2O2 concentration inhibited these processes (Sun et al., 2009). On the one hand, the production of reactive oxygen species (ROS) is a byproduct of aerobic metabolism (Sandalio and Romero-Puertas, 2015; Dietz et al., 2016; Huang et al., 2016). On the other hand, anaerobic metabolism can be induced in plants under biotic or abiotic stress including pathogens, strong light, drought, low temperature, high temperature, and salinization (He et al., 2018b). Different ROS such as H2O2, singlet oxygen, and superoxide can trigger specific changes in a transcriptome (Gadjev et al., 2006; Willems et al., 2016).
The biological effects of ROS on cell cytotoxicity or signaling mainly depend on the balance between generating and scavenging systems. The normal concentration of ROS plays a crucial role in maintaining normal plant growth and improving plant stress resistance (Karuppanapandian et al., 2011; Huang et al., 2019).
High ROS concentrations hinder the growth and development of plants and even lead to plant death, thereby causing an irreversible damage to plants (Sachdev et al., 2021). To cope with the ever-changing external environment, plants have evolved a complex mechanism for excessive ROS scavenging (Huang et al., 2019). The scavenging mechanism of ROS in plants can be divided into two types. First, the enzymatic scavenging mechanism, which mainly includes superoxide dismutase (SOD), ascorbate peroxidase (APX), glutathione peroxidase (GPX), catalase (CAT), and glutathione S-transferase. Second, the non-enzymatic scavenging mechanism, which mainly depends on ascorbic acid, reduced glutathione, α-tocopherol, proline, alkaloids (carotenoids), and flavonoids (Gill and Tuteja, 2010; Miller et al., 2010; Sarvajeet Singh Gill et al., 2011; Das and Roychoudhury, 2014).
ROS also affect some transcription factors such as HSF, NPR1, WRKY, and MYB. The upregulation of the expression of these transcription factor genes eventually leads to changes in the expression of downstream genes. Gene expression changes triggered by ROS are mediated by stress-responsive cis-regulated promoter elements, redox regulation of transcription regulators, and upstream signal cascades such as the mitogen-activated kinase module (Dietz, 2014; He et al., 2018a).
The present study investigated changes in whole-genome expression in hot peppers under H2O2 stress and determined the ROS-scavenging gene response mechanism at the gene level. Data were obtained from the transcriptome data of leaves and roots of peppers cultured in water for 40 days with 30 mM H2O2 at six time points and compared with those of the control group. A regulatory network of pepper genes that respond to H2O2 stress was constructed. In addition, the genes related to key ROS-scavenging enzymes in peppers, important time nodes of the response, and the key transcription factors co-expressing with the key enzymes were identified.
Total RNA-seq data from H2O2-treated pepper leaves and roots was isolated according to the method described in a previous study (Liu et al., 2017). Line 6421, an elite-breeding pepper (Capsicum annuum) line, was selected from a long-red pepper landrace that is widely grown on the west side of Xiangjiang River, Hunan Province, China.
The seeds were disinfected with sodium hypochlorite and grown in vermiculite at 25/18°C under short-day growth conditions (8 h light/16 h dark, light intensity of 6000 Lux, pH 6.0) and 60%–70% humidity. The stress treatments were applied on 40-day-old seedlings, and samples for RNA extraction were collected from the leaves and roots of the seedlings. The leaves and roots were treated with 30 mM H2O2 for 0.5, 1, 3, 6, 12, and 24 h to induce oxidative stress. Control plants were mock treated with the nutrient solution only. Leaf and root tissues were collected from both treated and control plants at 0.5, 1, 3, 6, 12, and 24 h after treatment.
We quality-tested gene sequences by using (Chen et al., 2018) FastQC v. 0.11.7 (Andrews, 2017) with default mapping parameters (10 mismatches/read; nine multimapping locations/read) and aligned using HISAT (Kim et al., 2015). Differential gene expression analysis was performed using DESeq2 v1.20.0, an R-based package available from Bioconductor (Love et al., 2014). The reference genome of C. annuum L. (Zunla_1) was used in this analysis (Qin et al., 2014).
Transcripts expressing differentially under two conditions were identified by examining the difference in their abundance under these conditions. The abundance of a transcript was measured as the mean-normalized count of reads mapping onto the transcript (Love et al., 2014). The difference in the expression was quantified using the logarithm (the logarithmic multiple change) of the mean-normalized count ratio between the two conditions. The differentially expressed transcripts in our experiments were defined as those with adjusted P values < 0.05 fold changes (FC) (negative binomial Wald test and Benjamini-Hochberg correction; both are part of the DESeq2 package). Differentially expressed genes (DEGs) were classified as upregulated or downregulated according to the significant positive or negative logarithmic change value. upregulated and downregulated DEGs were represented using the Venn diagram (Lin et al., 2016). Heat maps were generated using the seaborn heatmap available in python. Summary statistics for the sequencing performed are presented in Table S1 and all expression genes in Table S2.
Co-expression/coregulation analysis was performed on the samples from 12 control tissues and 12 H2O2-treated tissues by using the K-means (Gasch and Eisen, 2002) method (Gasch and Eisen, 2002) in python. The normalized expression values of genes were calculated by dividing their expression values in all samples with their maximum observed TPM (Transcripts Per Kilobase Million) Hierarchical clustering (HCL) and principal component analysis (PCA) were performed using the Kernel Principal Component Analysis in python with default settings to facilitate the graphical interpretation of the relatedness among the 24 samples. The transformed- and normalized-gene and -metabolite expression values with Z-scores were used for HCL and PCA. The clusters that were identified to respond to H2O2 stress were followed up for gene enrichment analysis with GOATOOLS (Klopfenstein et al., 2018), which is a python package for Gene Ontology (GO) enrichment analysis; false discovery rate (FDR) values of <0.01 was considered to denote statistically significant GO terms. The Kyoto Encyclopedia of Genes and Genomes (KEGG) pathway analysis was performed by KofamKOALA (Aramaki et al., 2020) to protein sequences by homology search, and the enrichment analysis use P-value Cutoff = 0.05 was carried by package clusterProfiler (Yu et al., 2012).
The Arabidopsis thaliana (TAIR10) and C. annuum L. (Zunla_1) proteomes were downloaded from The Arabidopsis Information Resource and National Center for Biotechnology Information, respectively. Protein sequences from the primary transcripts were used for the construction of orthogroups between the two species by using OrthoMCL (https://orthomcl.org/orthomcl/). The information on transcription factors (TFs) was retrieved from PlantTFDB (http://planttfdb.gao-lab.org/).
The multiple sequence alignment of capsicum and Arabidopsis genes was performed using MUSCLE (Multiple Protein Sequence Alignment) in Linux. A contiguous algorithm was used to build phylogenetic tree files by using treebest software (Edgar, 2004), and a phylogenetic tree was constructed using the online tool iTOL (Interactive Tree Of Life; https://itol.embl.de/) (Letunic and Bork, 2016).
The Python NetworkX package (https://networkx.org/) was used to visualize the co-expression network relationship between the candidate target transcription factors and ROS-scavenging enzyme-related genes.
To comprehensively and accurately record the gene response network in leaves and roots of pepper plants treated with H2O2, we used the transcriptome data set (Figure 1A). To determine the gene expression in the 24 samples, a Z-score normalized expression heat map (Figure 1C) was obtained. The Pearson’s correlation matrix among the transcriptome samples showed that the gene expression pattern was tissue-specific. The same tissues clustered together (Figure 1C). PCA (Figure 1B) also showed that the samples from the same tissues gathered at different time points during stress treatment (Figure 1B). These results showed that the difference in gene expression because of H2O2 stress is much smaller than the tissue-specific expression of the whole gene of the pepper roots and leaves, which is consistent with our general cognition.
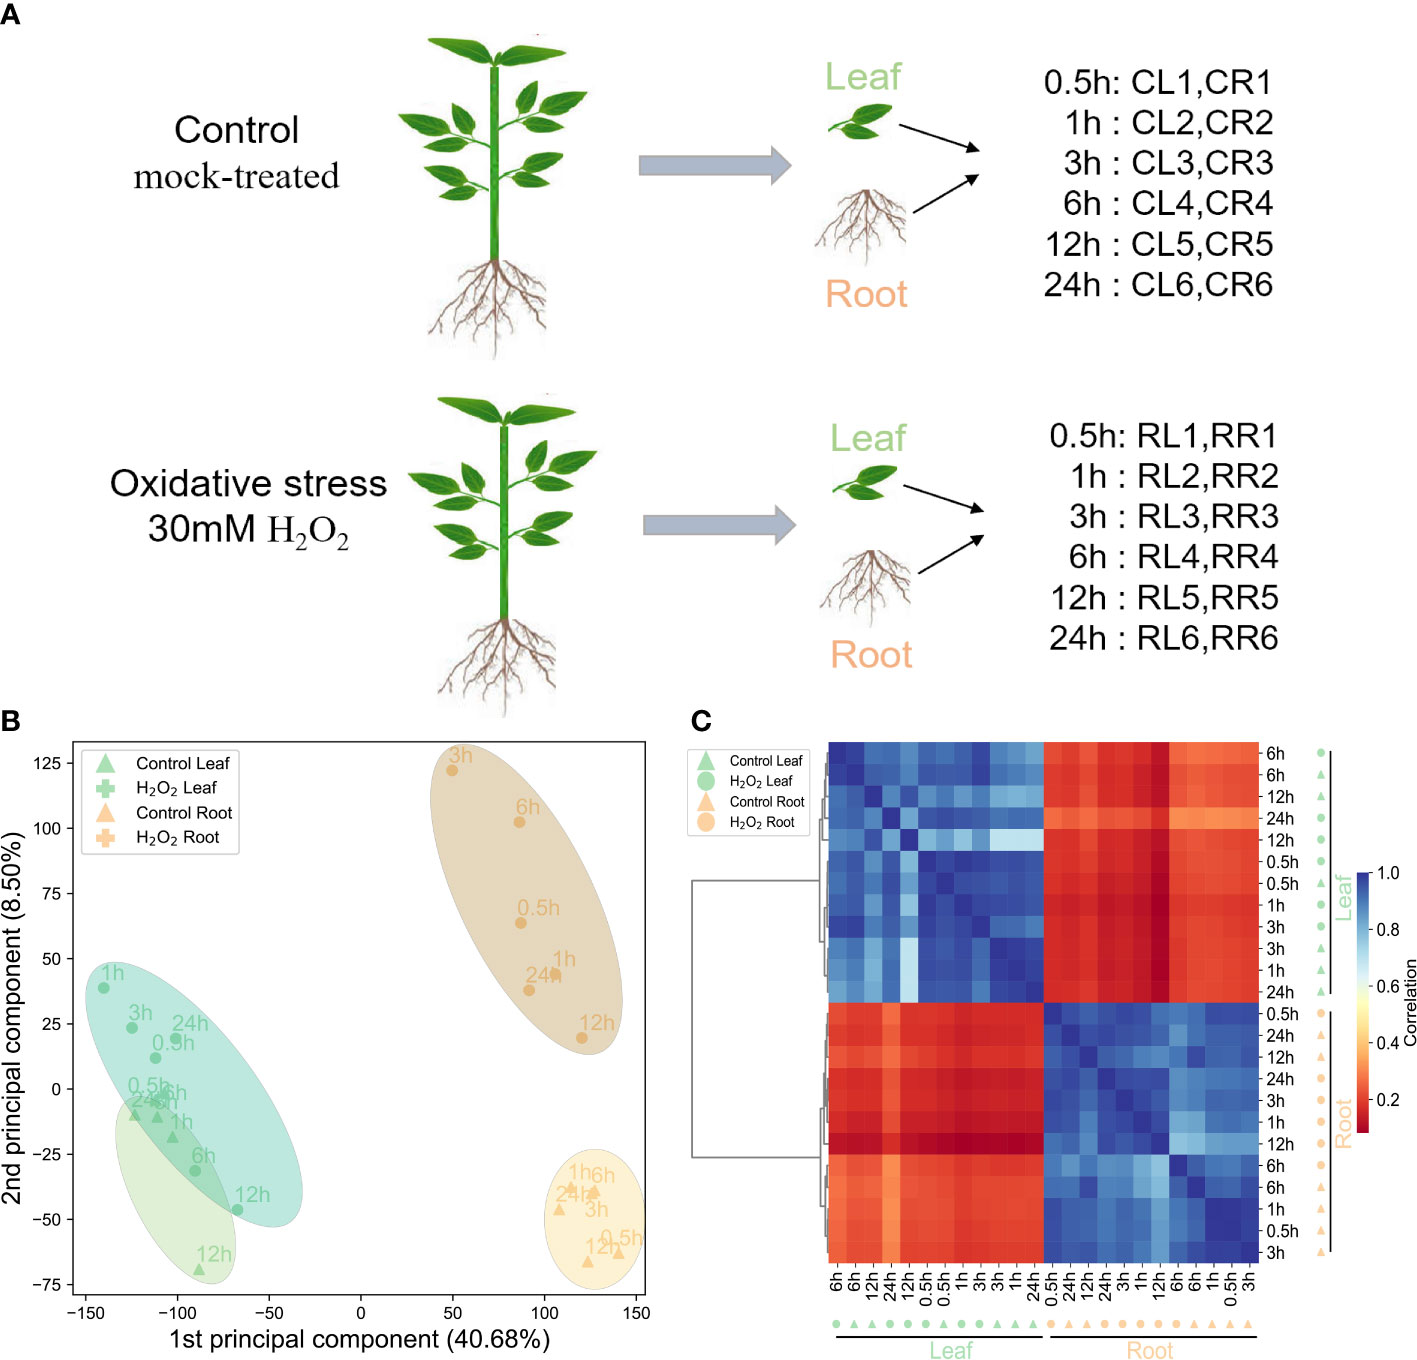
Figure 1 Summary of the transcriptome data of the H2O2 datasets. (A): Schematic representation of the design for the datasets. Leaf (L) and root (R) of these samples at six time points in the control and H2O2-treatment groups, respectively. (B): Principal component analysis of the transcriptome data from the control and H2O2-treatment samples (leaf and root). (C): The hierarchical clustering analysis of the expression profiles of 35,336 genes from the 24 samples; the color scale 0–1 represents the Pearson’s correlation coefficient.
To further understand the trend in the classification of gene expression in pepper roots and leaves after H2O2 stress, we used the K-means clustering algorithm to divide the genes into 12 clusters according to the expression patterns of all 29,065 genes expressed in at least one sample (Figure 2). The expressions of genes in Cluster 1, Cluster 5, and Cluster 12 were significantly increased in the roots at 3 h, 6 h, and 12 h after the stress, respectively, whereas the expressions of genes in Cluster 3 and Cluster 11 were significantly increased in the leaves at 6 h and 24 h, respectively, after the stress. In the early stage of the stress treatment, we observed that the genes in Cluster 10 were the first to respond within 0.5 h–1 h. Despite the increase or decrease in gene expression observed after the stress treatment at a certain time point, genes in Cluster 2, Cluster 4, Cluster 7, and Cluster 9 showed no significant changes in expression in the leaves and roots at the six time points before and after the stress treatment. The reason for dividing the genes into 12 clusters was to classify these genes according to dynamic changes in them to facilitate their follow-up and better targeted analysis.
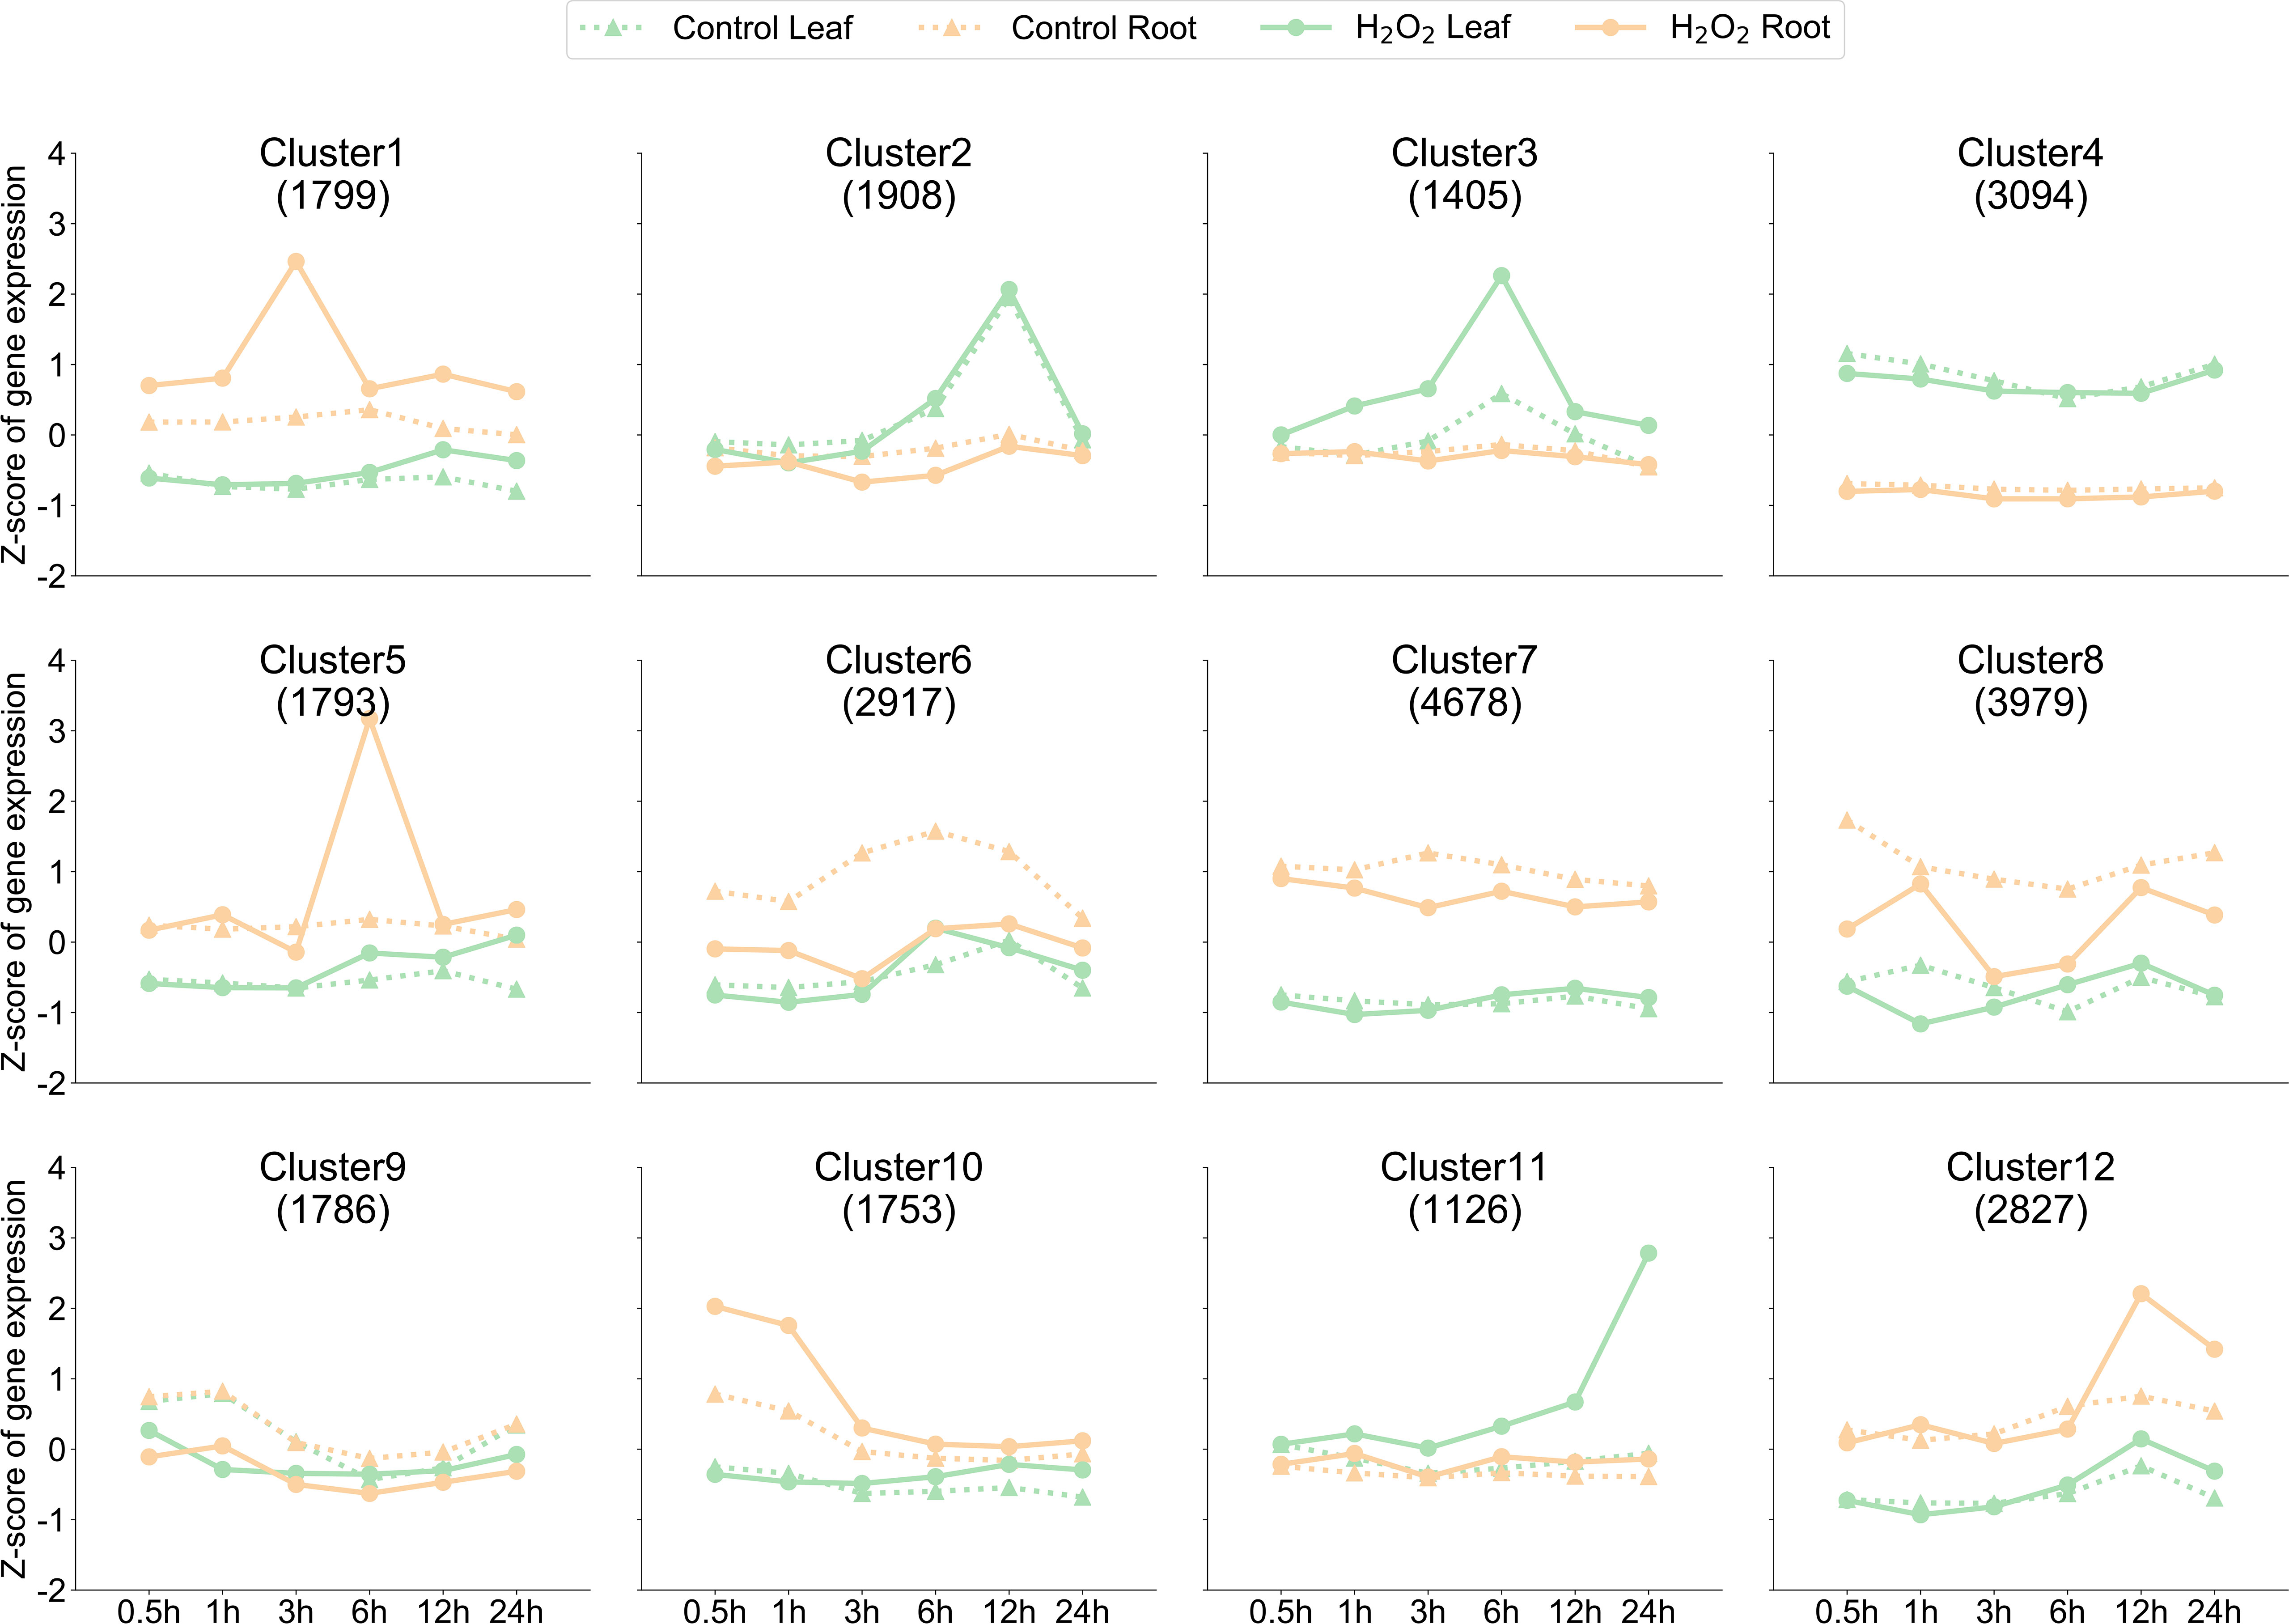
Figure 2 Dynamics of gene expression in the samples. K-means clustering grouped the expression profiles of the transcriptome into 12 clusters. The x-axis depicts the 24 samples, and the y-axis depicts the Z-score standardized cluster gene expression trend. The numbers shown in each box (for example, 1,799 genes for Cluster 1) were derived from the number of genes.
To capture a comprehensive overview of the response, H2O2-responsive genes in the peppers were identified by analyzing the temporal changes in the transcriptome after up to 24 h of treatment with 30 mM H2O2 (Figure 1A). Overall, 1,116 upregulated and 309 downregulated genes were identified in the leaves, whereas 1,144 upregulated and 394 downregulated genes were identified in the roots at different time points. The analyses collectively yielded 2,382 DEGs, constituting approximately 8.20% of the expressed genes in the datasets.
The difference in differential expression between the leaves and roots was that the highest amount of DEGs in the leaves was observed at 12 and 24 h (Figures 3A, C) and that in the roots was observed at 3 and 6 h (Figures 3B, D); in leaves, 349 DEGs were upregulated and 17 DEGs were downregulated at 12 and 24 h. Consequently, the gene response speed in the roots was faster than that in the leaves of peppers under H2O2 stress. The distribution of upregulated and downregulated DEGs identified in the leaves and roots in each cluster is shown in Table 1, and the results of the distribution corresponding to the trend map are shown in Figure 2.
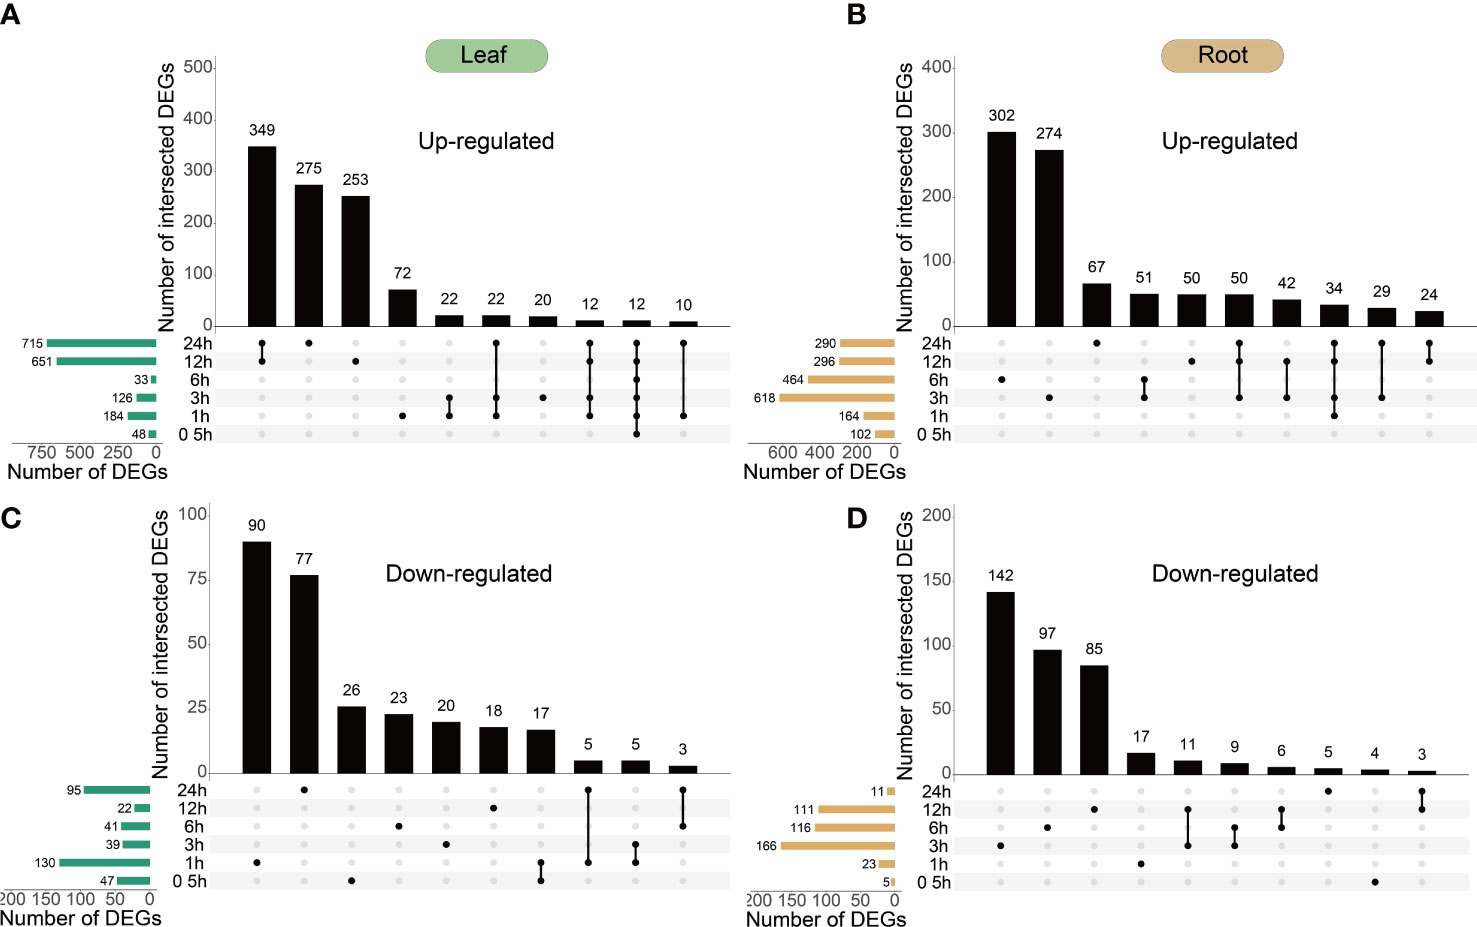
Figure 3 Temporal dynamics of Capsicum annuum L. transcriptome during H2O2 treatment. (A–D), the 40-day-old C. annuum L. plants were treated with 30 mM H2O2 in liquid media and harvested at the given time points for transcriptome analysis. UpSet plots of the number of upregulated and downregulated genes (cut-off threshold, |log2(FC)| ≥2; FDR <0.01) demonstrating different temporal expression patterns (top bar graphs). The total number of upregulated and downregulated genes at each time point is shown on the left. All leaf and root DEGs show in Supplementary Table S3.

Table 1 Distribution of the leaf and root DEGs identified in this study across different cluster.
The main functions of DEGs (shown in Figure 3) identified in the leaf (Figure 4A) and root (Figure 4B) were analyzed by GO, and the aggregation of upregulated DEGs and downregulated DEGs in the leaf and root is shown by the Wayne diagram (Figure 4C). Most identified DEGs encode the enzymes involved in basic biological metabolism and nucleotide binding (Figures 4A, B), and the amount of GO terms enriched by DEGs in leaves was more than that in roots.
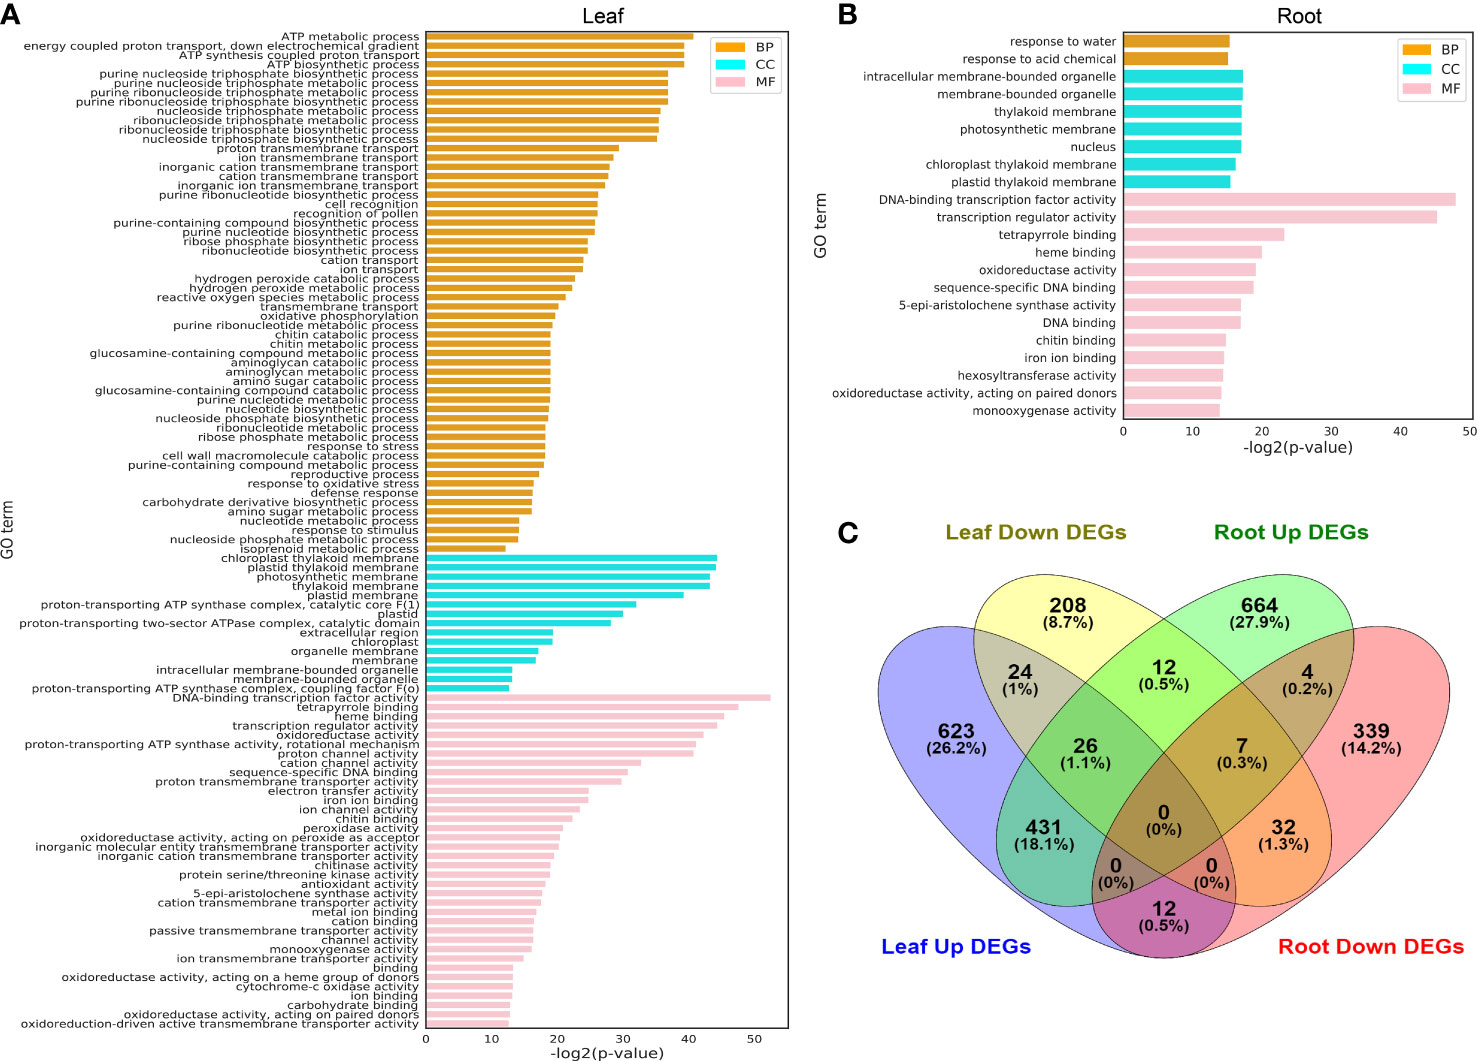
Figure 4 GO terms of leaf and root DEGs under hydrogen peroxide stress. (A) GO terms identified from the different treatment time points of leaf DEGs (FDR < 0.01). (B): GO terms identified from the different treatment time points of root DEGs (FDR < 0.01). (C): Venn diagrams of upregulated and downregulated DEGs identified in the leaf and root tissues. The full lists of DEGs and GO terms from the enrichment analysis are shown in Supplementary Tables S4, S5.
Several key points identified in GO term enrichment in the leaf and root DEGs were related to the oxidoreductase activity, which implied that the H2O2 treatment of pepper plants affected key physiological metabolic pathways in vivo. In the leaves, GO terms such as “ATP metabolic process”, “chloroplast thylakoid membrane”, “proton-transporting ATP synthase activity, rotational mechanism” and “oxidoreductase activity, acting on peroxide as acceptor”, leaf photosynthesis, and energy transformation were closely related; in roots, GO terms such as “response to water”, “intracellular membrane-bounded organelle,” “DNA-binding transcription factor activity,” and “oxidoreductase activity” were also related to cell redox and important organelle membranes.
Through the KEGG pathway analysis of the DEGs identified in leaf and root at 6 time points, it was found that the common enrichment in “MAPK signaling pathway”, “Phenylpropanoid biosynthesis”, “Photosynthesis”, “Glutathione metabolism”, “Cytochrome P450” and “Sesquiterpenoid and triterpenoid biosynthesis” (Figure 5). However, “Plant hormone signal transduction”, “Oxidative phosphorylation”, “alpha−Linolenic acid metabolism”, “Zeatin biosynthesis” and “Diterpenoid biosynthesis” were unique in leaf (Figure 5A).
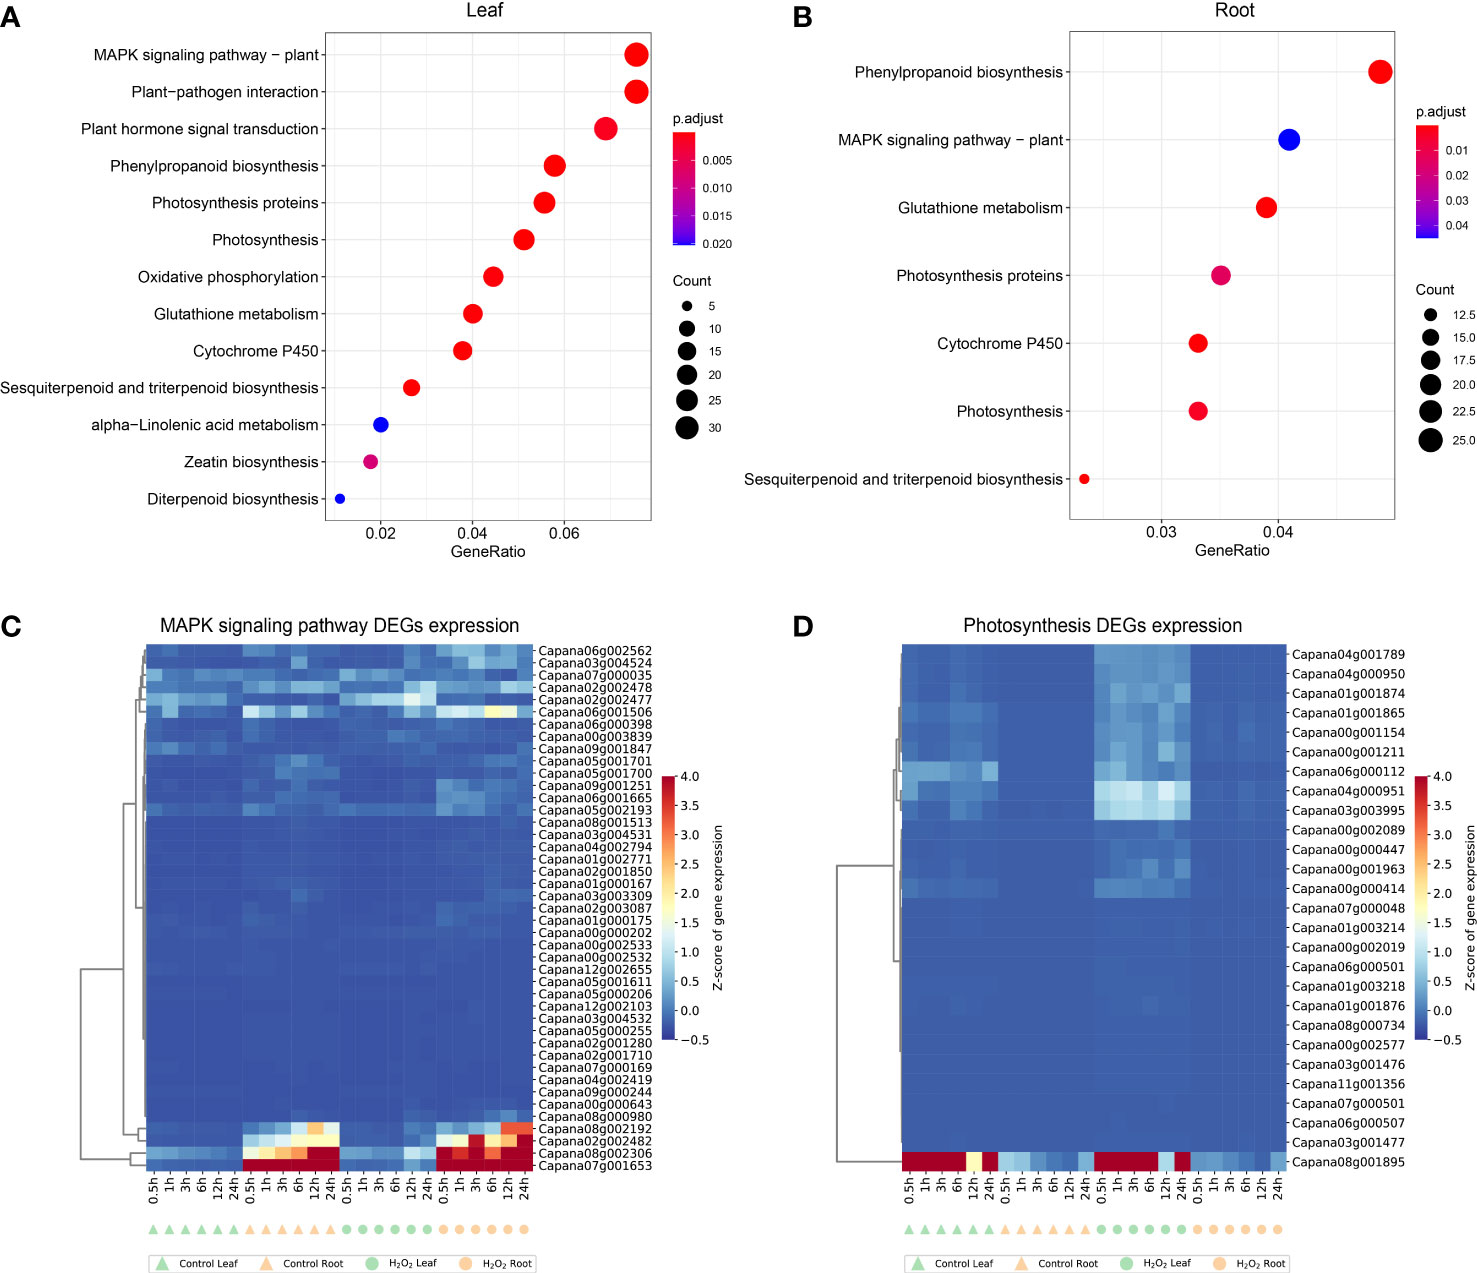
Figure 5 Kyoto encyclopedia of genes and genomes (KEGG) pathway enrichment analysis results for the DEGs in leaf (A) and root (B). Expression profiles of DEGs enriched in MAPK-signaling pathway (C) and photosynthesis pathway (D) in leaves and roots. The complete list of DEGs and KEGG pathways for enrichment analysis is shown in Supplementary Tables S6, S7.
We selected 43 and 27 genes in the MAPK-signaling pathway (ko04016) and photosynthesis pathway (ko00195), respectively, those genes were enriched in both the DEGs identified in leaves and roots (Figures 5C, D). In plants, several MAPK-signaling pathways are triggered by different biotic and abiotic stress stimuli, such as pathogen infection, injury, low temperature, drought, osmotic shock, high salinity, and reactive oxygen species (Asai et al., 2002; Colcombet and Hirt, 2008; Rodriguez et al., 2010). The Photosynthesis pathway is an important route for energy conversion in plants (Jones and Fyfe, 2001; Ferreira et al., 2004). DEGs identified in leaves and roots are enriched in these two pathways, indicating that the fluctuation of gene expression in response to external stimuli is conserved to a certain extent in different tissues, and the genes shown in Figures 5C, D are important candidate genes.
Because of the increase in the ROS content in plants observed under H2O2 stress, we evaluated the response of the genes associated with ROS scavenging. The experiment was designed to evaluate changes in the expression patterns of ROS-scavenging genes such as SOD, APX, GPX, and CAT that are involved in the enzymatic scavenging mechanism (Gill and Tuteja, 2010; Miller et al., 2010; Sarvajeet Singh Gill et al., 2011). Additionally, we determined whether these genes have different response nodes and levels in the leaves and roots, according to the sequence of these genes in A. thaliana. The respective lineal homologous genes were identified in the pepper genome; 28 genes synthesizing these key enzymes in A. thaliana and 28 lineal homologous genes in pepper were identified. The evolutionary relationship of these 58 genes is shown in Figure 5A, which were mainly divided into three subfamilies, and a close sequence alignment relationship between A. thaliana genes and the corresponding pepper lineal homologous genes was obvious. The results reflected the significance of identifying direct homologous genes. Subfamily I was mainly from A. thaliana and capsicum and included DHAR3, MDHAR1, GR, SOD1/2, and CAT2. Subfamily II mainly included MDHAR2 and PrxR1. All APXs, DHAR1, SOD3, and all GPXs were included in subfamily III (Figure 6A). Figure 3B shows the expression patterns of the genes encoding for these ROS-scavenging enzymes in untreated leaves and roots, as well as in the treated leaves and roots. CAT3 expression in root tissues under H2O2 stress was significantly decreased compared with that in untreated roots; PrxR1 gene expression in root tissues after12 h and 24 h was also decreased after root treatment (Figure 6B).
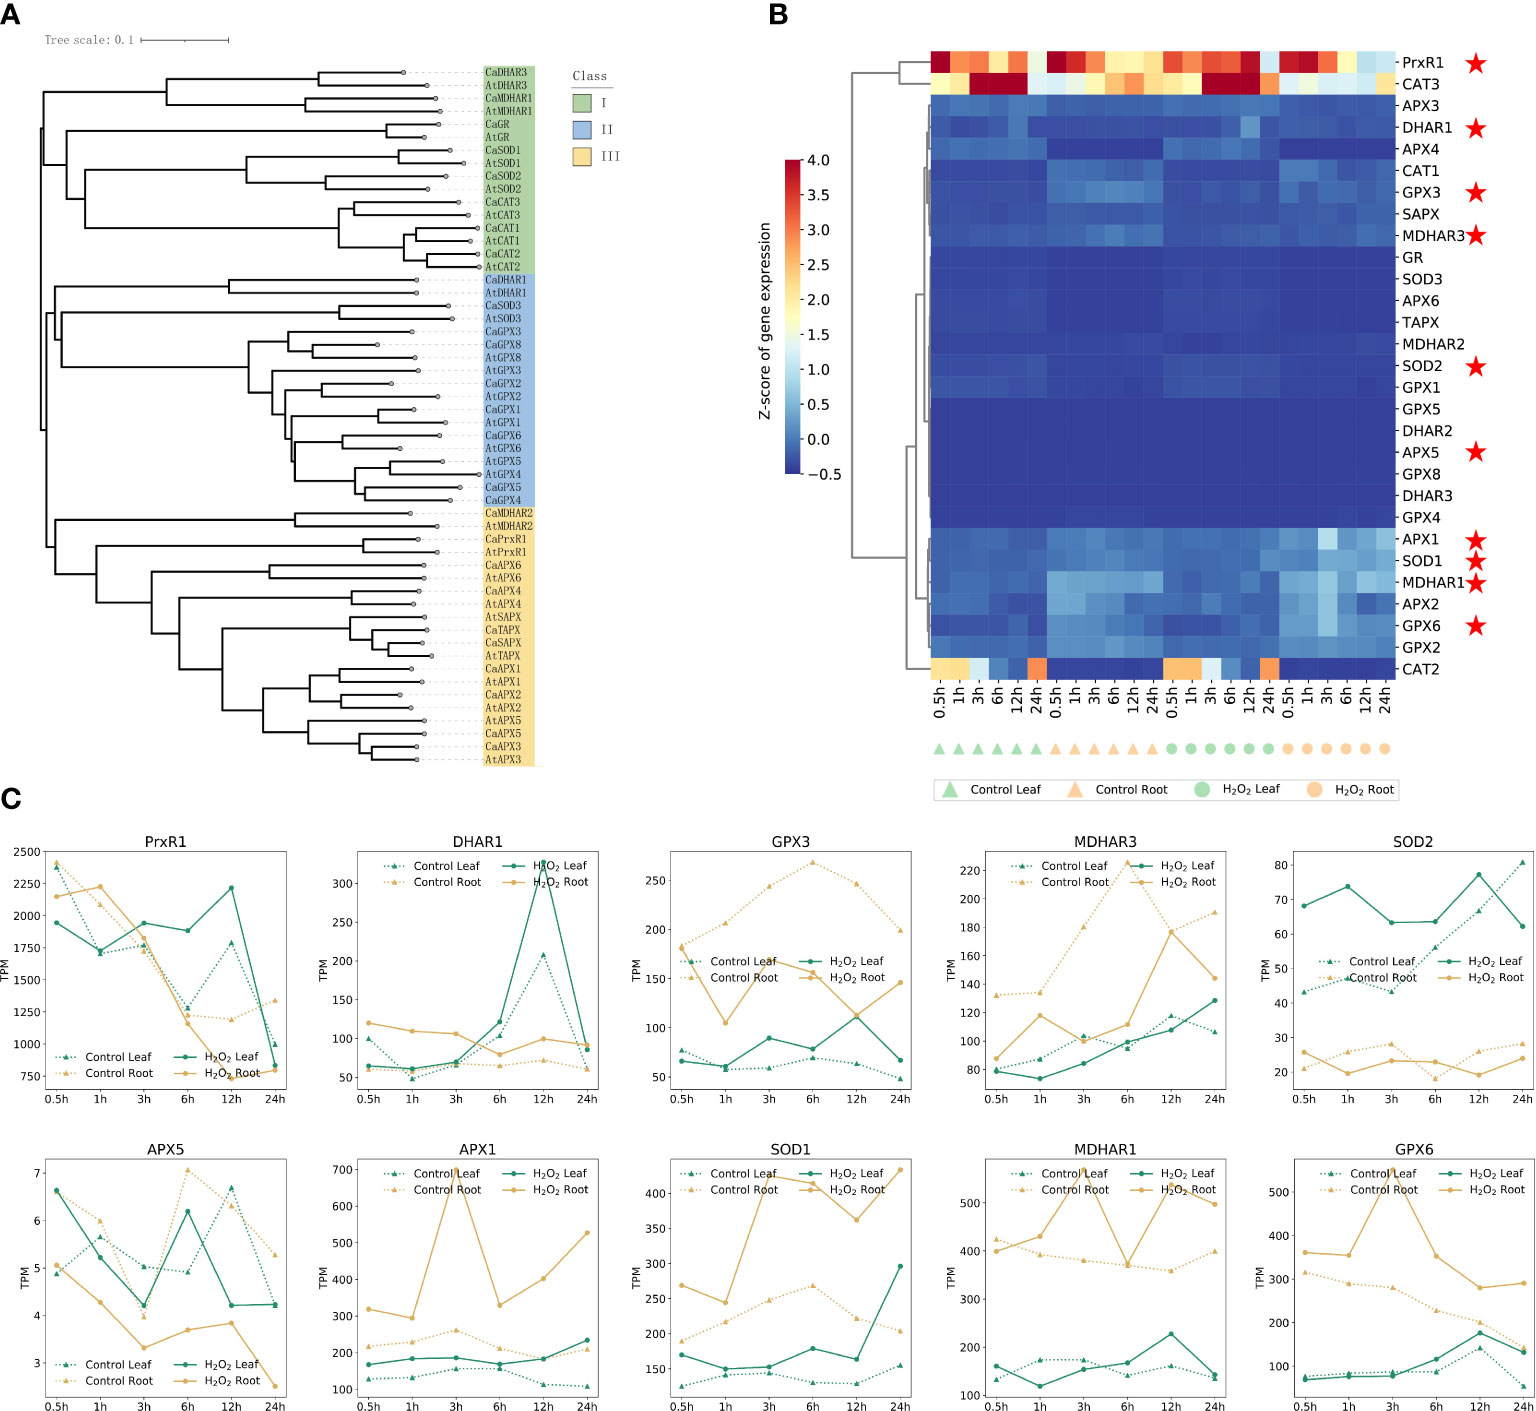
Figure 6 The genetic relationship of enzymes related to ROS scavenging in Arabidopsis thaliana and capsicum (A), and the gene expression patterns in Pepper (B). All those pepper genes expression in Supplementary Table S8. (C) Expression profiles of 10 typical ROS-scavenging enzyme synthesis genes in different clustering modules at different time points in leaves and roots of control and H2O2 stress.
However, the expression of six genes, namely APX1, SOD1, MDHAR1, APX2, GPX6, and GPX2, was higher at 3 h after root treatment than that in the untreated root tissues; however, no significant difference was observed in the gene expression across other time periods and tissues. These six genes may be important in response to ROS clearance in the roots treated for 3 h. Follow-up studies on H2O2 stress must focus on the expression of genes in roots at 3 h, which can also be seen from Figures 3B, D. The number of DEGs in the roots treated with H2O2 for 3 h was the highest, and among these genes, 618 genes were upregulated genes and 196 genes were downregulated. The effect of H2O2 stress on plant roots reached a peak at 3 h compared with that in the control, and most of the DEGs were expressed in the roots.
According to the expression profiles of 29 genes related to ROS-scavenging enzyme synthesis at different time points in the control and H2O2 stress of leaves and roots shown in Figure 6B, 10 obvious genes are marked on the basis of different expression patterns after H2O2 stress. The genes whose expression levels changed and the expression profiles of these 10 genes are shown separately to avoid the influence of data normalization in Figure 6C. PrxR1, DHAR1, GPX3, SOD2, and SOD1 were significantly up-regulated at different time points in leaves under hydrogen peroxide stress; APX1, SOD1, MDHAR1, and GPX6 were up-regulated in roots after H2O2 stress, which may be related to the fact that the roles of these enzymes in pepper were tissue related.
Several key clusters identified through the K-means cluster analysis may have a certain role in response to ROS clearance. Most genes showed a rapid increase in the expression in leaves or roots at a certain time point, which may be because of plant response to irreversible damage caused by an increase in the ROS level, and the study of genes in these key clusters can be helpful in determining the response mechanism of plants to H2O2 stress. Moreover, these clusters have an increase in expression in different tissues at different time points, indicating an important area of research for determining time nodes and patterns of gene response to ROS. For instance, the genes in Cluster 10 (1,753 genes) were the first to respond to H2O2 stress in root tissues. Within 0.5 and 1 h, the expression of genes in Cluster 10 in roots under H2O2 stress was much higher than that in untreated roots; however, the difference in the expression of these genes was not significant in the leaves during the same period. The expression of genes in Cluster 1 (1,799 genes) increased significantly in roots under 3-h stress, and at this time point, the largest number of DEGs was observed in the roots (Figures 3B, D), indicating that the 3-h time point is the most favorable time point for gene response to stress in pepper roots.
To further study the function of genes in Cluster 1 and Cluster 10, we performed GO enrichment analysis of all genes in these clusters. A total of 1,799 genes in Cluster 1 were mainly enriched in the GO terms such as “L-phenylalanine metabolic process”, “DNA-binding transcription factor activity,” and “acyltransferase activity”. GO terms enriched by 1,753 genes in Cluster 10 were “oligosaccharide metabolic process”, “protein serine/threonine kinase activity”, “kinase activity,” and “ubiquitin-protein transferase activity”.
By analyzing the constructed gene co-expression relationship network, we found that the correlation coefficient of key transcription factors in Cluster 1 and Cluster 10 was closely related to those of ROS-scavenging genes. The relationship between these three typical transcription factors and ROS-scavenging enzyme-related genes (Figure 7B) is shown in the form of a network map (Figures 7D, E). The genes in the middle red circle represent the key transcription factors that were identified. The genes in the blue circle on the edge are the genes related to ROS-scavenging enzymes in capsicum. The blue lines between the two genes indicate negative regulatory relationships, whereas the red lines indicate positive regulatory relationships. These three key transcription factors were verified as the key factors in subsequent experiments, providing a new conjecture for studying the molecular mechanism of ROS scavenging in plants.
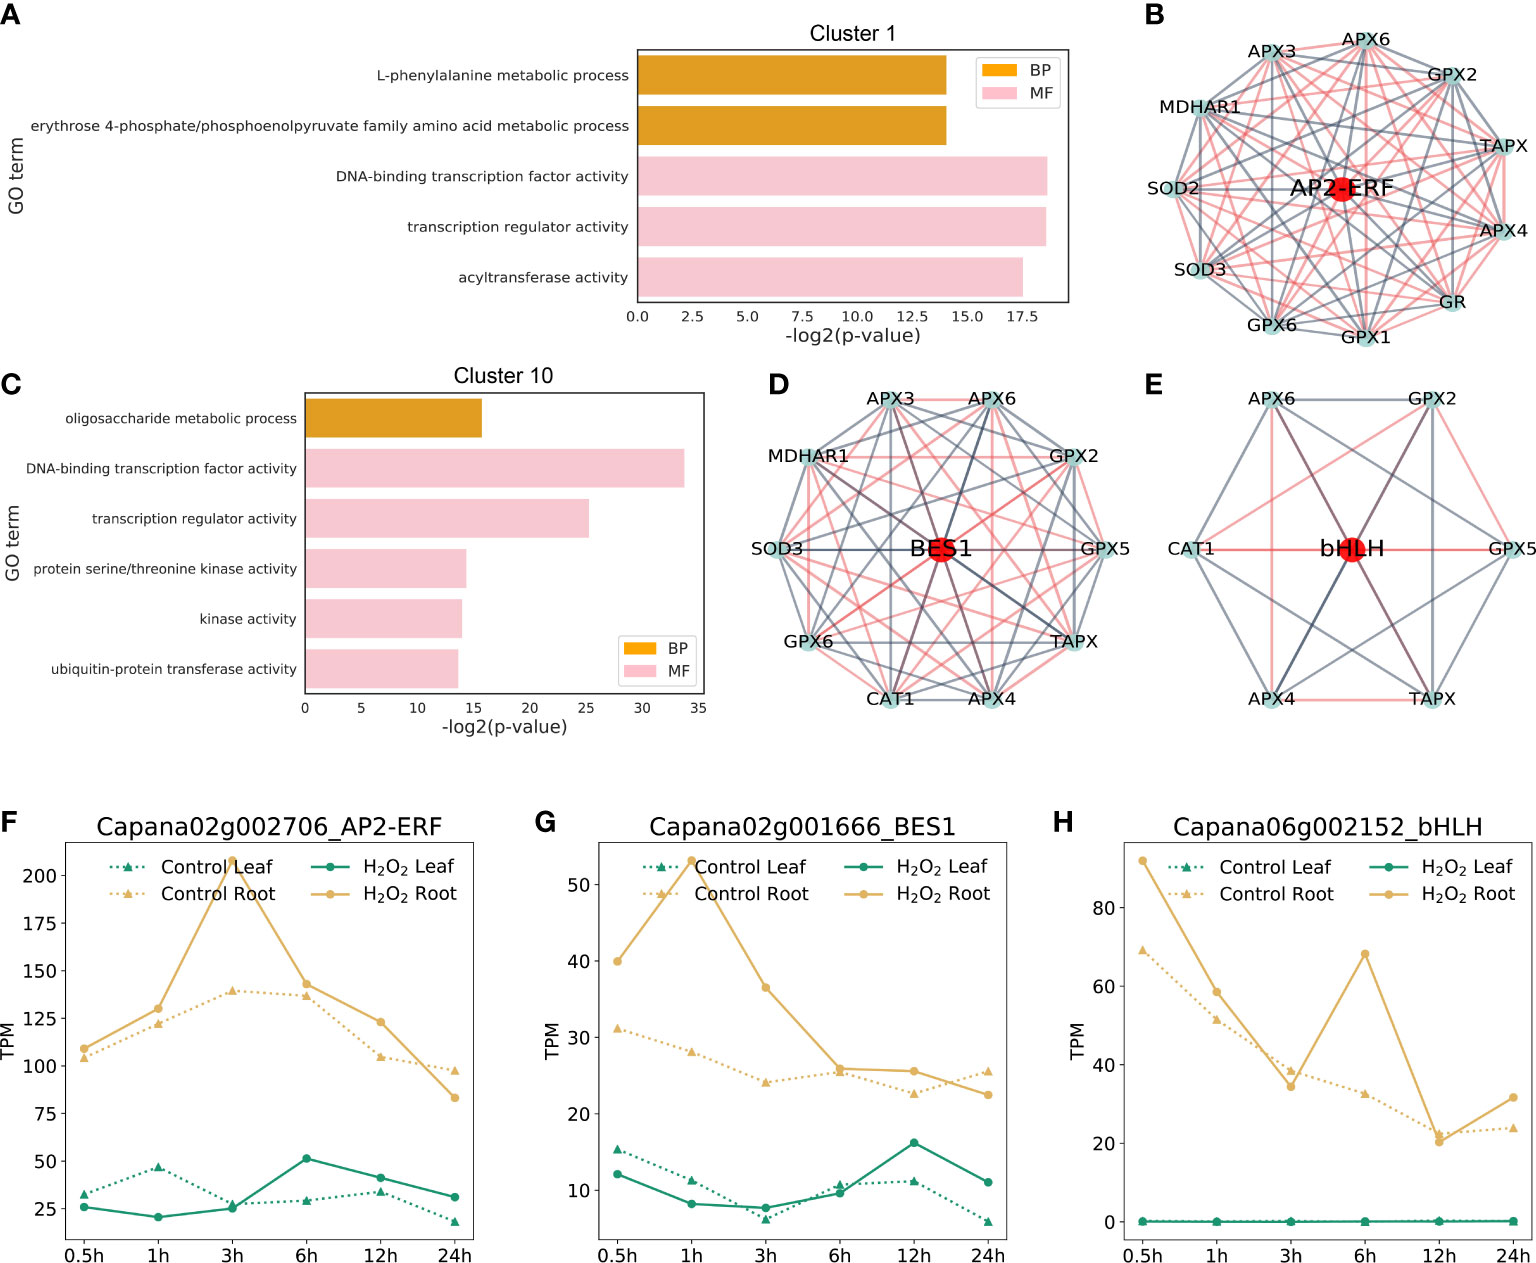
Figure 7 Important clusters in GO enrichment and TF networks. (A, C): GO terms of the identified DEGs from Cluster 1 and Cluster 10 (FDR < 0.01)). The complete lists of cluster genes and GO terms from the enrichment analysis are shown in Supplementary Tables S9, S10. (B, D, E): The transcriptional factors that co-expressed with ROS-scavenging genes were identified using the constructed network. (F–H): Expression profiles of the three candidate transcription factors at different time points in control and H2O2 stress in leaves and roots.
Through sequence alignment, the corresponding orthologous genes of three transcription factors, namely BES1, RAP2 and bHLH029, in Arabidopsis were identified, and the sequence similarity was more than 70%. Therefore, we named the corresponding pepper genes as CaBES1 (Figures 7B, F), CaRAP2 (Figures 7D, G), and CabHLH029 (Figures 7E, H) according to the gene names of Arabidopsis thaliana. The gene expression profile data of these were extracted. These data are displayed as line graphs in Figures 7F–H. The expression levels of CaBES1 and CabHLH029 were significantly up-regulated at H2O2 stress 3 and 6 h, respectively, but there was no significant difference at other time points. CaRAP2 was significantly up-regulated in the early stage of H2O2 stress (0.5–3 h), and its expression returned to normal in the later stage of H2O2 stress. They may be involved in regulation at different stages.
Pepper is an important vegetable belonging to the Solanaceae family that is widely cultivated worldwide. According to FAO statistics (www.fao.org), peppers were grown in 118 countries and regions of the world in 2018. Pepper is the third largest vegetable crop in the world; in 2014, Mexico and China successively completed the whole-genome sequencing of two pepper varieties, namely CM334 and Zunla-1 (Kim et al., 2014; Qin et al., 2014). The pepper genome sequence is ∼3.3 Gb, which is approximately three times that of the tomato genome (∼900 Mb) (Tomato Genome, 2012). Because of the presence of many tandem repeats in the pepper genome, the research on pepper gene annotation is relatively lagging. The present study analyzed the RNA-seq data of the leaves and roots of 40-day-old pepper plants under H2O2 stress at six time points and compared the obtained data with those of the control plant, we used data from this database (Liu et al., 2017). Moreover, the study analyzed the dynamic expression network of genes in leaves and roots in response to H2O2 stress from 0.5 h to 24 h at the genomic level. Based on the gene expression trend, the K-means value was used to divide genes into 12 expression clusters (Figure 2) from Cluster 1 to Cluster 10. The GO enrichment of genes in the clusters was analyzed (Figures 7A, C), and the genes in the chili peppers were identified through the orthologous alignment of the determined gene sequences in Arabidopsis. A total of 28 synthesis genes related to ROS-scavenging enzymes were identified, which showed their dynamic expression at six time points under H2O2 stress. We constructed a co-expression network matrix based on the Pearson correlation coefficient and found three transcription factors that exhibited a strong correlation with the synthesis genes of multiple ROS-scavenging enzymes (Figures 4C–F). Subsequent experiments are required to study in detail the mechanism through which these transcription factors regulate the associated enzymes when plants are under H2O2 stress, as well as the mechanism through which plants balance the ROS concentration.
The pepper plants in the present study are based on hydroponic culture and 30 mM H2O2 treatment in the aqueous solution. The roots most directly sense the changes in ROS concentrations, whereas the leaves after the stress. The response to H2O2 stress was higher and the response time was earlier in pepper roots than in leaves (Figure 3). After H2O2 stress, it reached to genes in pepper roots within 3 h, denoting the peak of the response (Figures 3B, D) and indicating that the number of DEGs was the largest at 3 h. Unlike the response speed in the roots, the peak of gene response in the leaves appeared 24 h after H2O2 stress (Figures 3A, C). Relative to roots, the leaves responded gradually, and previous studies have shown that ROS play a crucial role in controlling root hair growth (Carol and Dolan, 2006). Some studies have used large quantities of transcriptome data processed by Arabidopsis oxidative stress and found that the time of oxidative stress is the determinant of the footprint of different transcriptomes (Gadjev et al., 2006; Willems et al., 2016). Thus, exploring the differences in gene expression in plants at different time points after oxidative stress treatment can be valuable.
Through the cluster analysis of identified genes related to ROS clearance and key responses in peppers, the key transcription factors, including CaARP2 (Figure 7B) in Cluster 10 and CaBES1 and CabHLH029 in Cluster 1, were identified (Figures 7D, E). These transcription factors were co-expressed with the genes encoding for multiple ROS-scavenging enzymes, and their K-means analysis results showed their distribution in Cluster 1 and Cluster 10. The genes in Cluster 10 showed the earliest response in pepper root tissues. The genes in Cluster 1 had the largest number of DEGs at the 3-h time point in the root tissues of pepper under H2O2 stress compared with the unstressed root tissues. Therefore, these Clusters 1 and 10 were used to analyze the response of genes in pepper roots to peroxidation. The co-expression of the three transcription factors and multiple genes encoding for ROS-scavenging enzymes provides an important reference for the subsequent verification of their functional mechanisms. Studies on Arabidopsis have confirmed that BES1 encodes for brassinosteroid-signaling (BRs) protein that accumulates in the nucleus in the dephosphorylated form in response to BRs and coordination of chloroplast development (Wang et al., 2002; Yin et al., 2005; Zubo et al., 2018; Clark et al., 2021; Van Nguyen et al., 2021) in A. thaliana, which is in line with our results that CaBES1 also affected the expression of genes in response to H2O2 stress in pepper, thus indicating that the aforementioned mechanism may also be involved in pepper. For Arabidopsis, many studies have shown that RAP2 is involved in oxygen sensing, which plays a key role in controlling root bending in response to hypoxia (Hartman et al., 2019; Smit et al., 2020; Tang et al., 2021; Seok et al., 2022); bHLH029, as a putative transcription factor encoding the regulation of iron uptake responses, mRNA was detected in the outer cell layer of roots and accumulated in iron deficiency, similar to FER in tomato, as a regulator of iron uptake (Cai et al., 2021; Kanwar et al., 2021; Song et al., 2022). The functions of these three important transcription factors of pepper identified in the gene expression network of pepper seedlings under hydrogen peroxide stress may show some functional conservation with their homologous genes in Arabidopsis, but to obtain exact evidence further experiments are required.
In this study, based on the control and processed RNA-seq data of the leaves and roots of 40-day-old pepper plants subjected to H2O2 stress at six time points, the genome-wide regulatory network was analyzed, and three possible key transcription factors were identified. A balanced candidate transcription factor can provide reliable evidence for in-depth verification and analysis.
In this study, the gene dynamic expression network of pepper leaves and roots at six time points in response to H2O2 stress was analyzed at the whole-genome level. A total of 29,065 genes were found to be expressed in at least one sample. These genes were divided into 12 clusters based on their dynamic expression in different tissues and time points. In addition, based on the research on ROS-scavenging enzymes in Arabidopsis, we identified 28 orthologous genes in peppers that were associated with Cluster 1 and 10 and identified three transcription factors. Multiple ROS-scavenging enzyme synthesis-related genes in pepper were highly co-expressed. We also performed GO and KEGG analysis for the DEGs identified in leaves and roots to identify key cluster genes and analyzed the GO terms and KEGG pathways that are mainly enriched in these important genes. This study provides insights into the effects of H2O2 stress on pepper at the whole-genome level and may serve as a reference for research on other crops.
This work was supported by Laboratory of Lingnan Modern Agriculture Project (NT2021004), Special Funds for Construction of Innovative Provinces in Hunan Province (2021NK1006), the National Key Research and Development Program of China (Grant No. 2019YFD1000300) and A Project Supported by Scientific Research Fund of Hunan Provincial Education Department (19B271).
We thank the high-performance computing platform of Bioinformatics Center, Nanjing Agricultural University.
The authors declare that the research was conducted in the absence of any commercial or financial relationships that could be construed as a potential conflict of interest.
All claims expressed in this article are solely those of the authors and do not necessarily represent those of their affiliated organizations, or those of the publisher, the editors and the reviewers. Any product that may be evaluated in this article, or claim that may be made by its manufacturer, is not guaranteed or endorsed by the publisher.
The Supplementary Material for this article can be found online at: https://www.frontiersin.org/articles/10.3389/fpls.2022.1018991/full#supplementary-material
Andrews, S. (2017). FastQC: a quality control tool for high throughput sequence data. 2010. doi: 10.12688/f1000research.21142.2
Aramaki, T., Blanc-Mathieu, R., Endo, H., Ohkubo, K., Kanehisa, M., Goto, S., et al. (2020). KofamKOALA: KEGG ortholog assignment based on profile HMM and adaptive score threshold. Bioinformatics 36, 2251–2252. doi: 10.1093/bioinformatics/btz859
Asai, T., Tena, G., Plotnikova, J., Willmann, M. R., Chiu, W.-L., Gomez-Gomez, L., et al. (2002). MAP kinase signalling cascade in arabidopsis innate immunity. Nature 415 (6875), 977–983. doi: 10.1038/415977a
Cai, Y., Li, Y., Liang, G. (2021). FIT and bHLH ib transcription factors modulate iron and copper crosstalk in arabidopsis. Plant Cell Environ. 44, 1679–1691. doi: 10.1111/pce.14000
Carol, R. J., Dolan, L. (2006). The role of reactive oxygen species in cell growth: Lessons from root hairs. J. Exp. Bot. 57, 1829–1834. doi: 10.1093/jxb/erj201
Chen, S., Zhou, Y., Chen, Y., Gu, J. (2018). Fastp: an ultra-fast all-in-one FASTQ preprocessor. Bioinformatics 34, i884–i890. doi: 10.1093/bioinformatics/bty560
Clark, N. M., Nolan, T. M., Wang, P., Song, G., Montes, C., Valentine, C. T., et al. (2021). Integrated omics networks reveal the temporal signaling events of brassinosteroid response in arabidopsis. Nat. Commun. 12, 5858. doi: 10.1038/s41467-021-26165-3
Colcombet, J., Hirt, H. (2008). Arabidopsis MAPKs: A complex signalling network involved in multiple biological processes. Biochem. J. 413, 217–226. doi: 10.1042/BJ20080625
Das, K., Roychoudhury, A. (2014). Reactive oxygen species (ROS) and response of antioxidants as ROS-scavengers during environmental stress in plants. Front. Environ. Sci. 2. doi: 10.3389/fenvs.2014.00053
Dietz, K. J. (2014). Redox regulation of transcription factors in plant stress acclimation and development. Antioxid Redox Signal 21, 1356–1372. doi: 10.1089/ars.2013.5672
Dietz, K. J., Turkan, I., Krieger-Liszkay, A. (2016). Redox- and reactive oxygen species-dependent signaling into and out of the photosynthesizing chloroplast. Plant Physiol. 171, 1541–1550. doi: 10.1104/pp.16.00375
Edgar, R. C. (2004). MUSCLE: multiple sequence alignment with high accuracy and high throughput. Nucleic Acids Res. 32, 1792–1797. doi: 10.1093/nar/gkh340
Fedoroff, N. V., Battisti, D. S., Beachy, R. N., Cooper, P. J., Fischhoff, D. A., Hodges, C. N., et al. (2010). Radically rethinking agriculture for the 21st century. Science 327, 833–834. doi: 10.1126/science.1186834
Ferreira, K. N., Iverson, T. M., Maghlaoui, K., Barber, J., Iwata, S. (2004). Architecture of the photosynthetic oxygen-evolving center. Science 303, 1831–1838. doi: 10.1126/science.1093087
Gadjev, I., Vanderauwera, S., Gechev, T. S., Laloi, C., Minkov, I. N., Shulaev, V., et al. (2006). Transcriptomic footprints disclose specificity of reactive oxygen species signaling in arabidopsis. Plant Physiol. 141, 436–445. doi: 10.1104/pp.106.078717
Gasch, A. P., Eisen, M. B. (2002). Exploring the conditional coregulation of yeast gene expression through fuzzy k-means clustering. Genome Biol. 3, 1–22. doi: 10.1186/gb-2002-3-11-research0059
Gill, S. S., Tuteja, N. (2010). Reactive oxygen species and antioxidant machinery in abiotic stress tolerance in crop plants. Plant Physiol. Biochem. 48, 909–930. doi: 10.1016/j.plaphy.2010.08.016
Hartman, S., Liu, Z., Van Veen, H., Vicente, J., Reinen, E., Martopawiro, S., et al. (2019). Ethylene-mediated nitric oxide depletion pre-adapts plants to hypoxia stress. Nat. Commun. 10, 4020. doi: 10.1038/s41467-019-12045-4
He, M., He, C. Q., Ding, N. Z. (2018b). Abiotic stresses: General defenses of land plants and chances for engineering multistress tolerance. Front. Plant Sci. 9, 1771. doi: 10.3389/fpls.2018.01771
He, H., Van Breusegem, F., Mhamdi, A. (2018a). Redox-dependent control of nuclear transcription in plants. J. Exp. Bot. 69, 3359–3372. doi: 10.1093/jxb/ery130
Huang, H., Ullah, F., Zhou, D. X., Yi, M., Zhao, Y. (2019). Mechanisms of ROS regulation of plant development and stress responses. Front. Plant Sci. 10, 800. doi: 10.3389/fpls.2019.00800
Huang, S., Van Aken, O., Schwarzlander, M., Belt, K., Millar, A. H. (2016). The roles of mitochondrial reactive oxygen species in cellular signaling and stress response in plants. Plant Physiol. 171, 1551–1559. doi: 10.1104/pp.16.00166
Jones, M. R., Fyfe, P. K. (2001). Photosynthesis new light on biological oxygen production. Curr. Biol. 11(8):R318–R321. doi: 10.1016/s0960-9822(01)00174-9
Kanwar, P., Baby, D., Bauer, P. (2021). Interconnection of iron and osmotic stress signalling in plants: is FIT a regulatory hub to cross-connect abscisic acid responses? Plant Biol. (Stuttg) 23 Suppl 1, 31–38. doi: 10.1111/plb.13261
Karuppanapandian, T., Moon, J.-C., Kim, C., Kim, W. (2011). Reactive oxygen species in plants their generation, signal transduction, and scavenging mechanisms. Aust. J. Crop Sci. 5 (6), 709–725. doi: 10.1111/j.1365-3040.2009.02041.x
Kim, D., Langmead, B., Salzberg, S. L. (2015). HISAT: a fast spliced aligner with low memory requirements. Nat. Methods 12, 357–360. doi: 10.1038/nmeth.3317
Kim, S., Park, M., Yeom, S. I., Kim, Y. M., Lee, J. M., Lee, H. A., et al. (2014). Genome sequence of the hot pepper provides insights into the evolution of pungency in capsicum species. Nat. Genet. 46, 270–278. doi: 10.1038/ng.2877
Klopfenstein, D. V., Zhang, L., Pedersen, B. S., Ramirez, F., Warwick Vesztrocy, A., Naldi, A., et al. (2018). GOATOOLS: A Python library for gene ontology analyses. Sci. Rep. 8, 10872. doi: 10.1038/s41598-018-28948-z
Letunic, I., Bork, P. (2016). Interactive tree of life (iTOL) v3: an online tool for the display and annotation of phylogenetic and other trees. Nucleic Acids Res. 44, W242–W245. doi: 10.1093/nar/gkw290
Lin, G., Chai, J., Yuan, S., Mai, C., Cai, L., Murphy, R. W., et al. (2016). VennPainter: A tool for the comparison and identification of candidate genes based on Venn diagrams. PloS One 11, e0154315. doi: 10.1371/journal.pone.0154315
Liu, F., Yu, H., Deng, Y., Zheng, J., Liu, M., Ou, L., et al. (2017). PepperHub, an informatics hub for the chili pepper research community. Mol. Plant 10, 1129–1132. doi: 10.1016/j.molp.2017.03.005
Love, M. I., Huber, W., Anders, S. (2014). Moderated estimation of fold change and dispersion for RNA-seq data with DESeq2. Genome Biol. 15, 550. doi: 10.1186/s13059-014-0550-8
Miller, G., Suzuki, N., Ciftci-Yilmaz, S., Mittler, R. (2010). Reactive oxygen species homeostasis and signalling during drought and salinity stresses. Plant Cell Environ. 33 (4), 453–467. doi: 10.1111/j.1365-3040.2009.02041.x
Nazir, F., Hussain, A., Fariduddin, Q. (2019). Hydrogen peroxide modulate photosynthesis and antioxidant systems in tomato (Solanum lycopersicum l.) plants under copper stress. Chemosphere 230, 544–558. doi: 10.1016/j.chemosphere.2019.05.001
Qin, C., Yu, C., Shen, Y., Fang, X., Chen, L., Min, J., et al. (2014). Whole-genome sequencing of cultivated and wild peppers provides insights into capsicum domestication and specialization. Proc. Natl. Acad. Sci. U.S.A. 111, 5135–5140. doi: 10.1073/pnas.1400975111
Rodriguez, M. C., Petersen, M., Mundy, J. (2010). Mitogen-activated protein kinase signaling in plants. Annu. Rev. Plant Biol. 61, 621–649. doi: 10.1146/annurev-arplant-042809-112252
Sachdev, S., Ansari, S. A., Ansari, M. I., Fujita, M., Hasanuzzaman, M. (2021). Abiotic stress and reactive oxygen species: Generation, signaling, and defense mechanisms. Antioxidants (Basel) 10 (2), 277. doi: 10.3390/antiox10020277
Sandalio, L. M., Romero-Puertas, M. C. (2015). Peroxisomes sense and respond to environmental cues by regulating ROS and RNS signalling networks. Ann. Bot. 116, 475–485. doi: 10.1093/aob/mcv074
Sarvajeet Singh Gill, Khan, N. A., Anjum, N. A., Tuteja, N. (2011). Amelioration of cadmium stress in crop plants by nutrient management: Morphological, physiological and biochemical aspects. Plant Stress 5 (1), 1–23. doi: 10.4161/psb.6.2.14880
Seok, H. Y., Tran, H. T., Lee, S. Y., Moon, Y. H. (2022). AtERF71/HRE2, an arabidopsis AP2/ERF transcription factor gene, contains both positive and negative cis-regulatory elements in its promoter region involved in hypoxia and salt stress responses. Int. J. Mol. Sci. 23 (10), 5310. doi: 10.3390/ijms23105310
Smit, M. E., Mcgregor, S. R., Sun, H., Gough, C., Bagman, A. M., Soyars, C. L., et al. (2020). A PXY-mediated transcriptional network integrates signaling mechanisms to control vascular development in arabidopsis. Plant Cell 32, 319–335. doi: 10.1105/tpc.19.00562
Song, H., Chen, F., Wu, X., Hu, M., Geng, Q., Ye, M., et al. (2022). MNB1 gene is involved in regulating the iron-deficiency stress response in arabidopsis thaliana. BMC Plant Biol. 22, 151. doi: 10.1186/s12870-022-03553-5
Sun, Y., Zhang, C., Qi, A., Luo, W. (2009). “Effects of hydrogen peroxide on the germination characteristics of cucumber seeds”. in International Conference on Environmental Science and Information Application Technology. (IEEE), 272–275.
Tang, H., Bi, H., Liu, B., Lou, S., Song, Y., Tong, S., et al. (2021). WRKY33 interacts with WRKY12 protein to up-regulate RAP2.2 during submergence induced hypoxia response in arabidopsis thaliana. New Phytol. 229, 106–125. doi: 10.1111/nph.17020
Tomato Genome, C. (2012). The tomato genome sequence provides insights into fleshy fruit evolution. Nature 485, 635–641. doi: 10.1038/nature11119
Van Nguyen, T., Park, C. R., Lee, K. H., Lee, S., Kim, C. S. (2021). BES1/BZR1 homolog 3 cooperates with E3 ligase AtRZF1 to regulate osmotic stress and brassinosteroid responses in arabidopsis. J. Exp. Bot. 72, 636–653. doi: 10.1093/jxb/eraa458
Wang, Z.-Y., Gendron, J., Nakano, T., He, J., Chen, M., Vafeados, D., et al. (2002). Nuclear-localized BZR1 mediates brassinosteroid-induced growth and feedback suppression of brassinosteroid biosynthesis. Developmental Cell 2 (4), 505–513. doi: 10.1016/S1534-5807(02)00153-3
Willems, P., Mhamdi, A., Stael, S., Storme, V., Kerchev, P., Noctor, G., et al. (2016). The ROS wheel: Refining ROS transcriptional footprints. Plant Physiol. 171, 1720–1733. doi: 10.1104/pp.16.00420
Xiong, J., Yang, Y., Fu, G., Tao, L. (2015). Novel roles of hydrogen peroxide (H(2)O(2)) in regulating pectin synthesis and demethylesterification in the cell wall of rice (Oryza sativa) root tips. New Phytol. 206, 118–126. doi: 10.1111/nph.13285
Yin, Y., Vafeados, D., Tao, Y., Yoshida, S., Asami, T., Chory, J. (2005). A new class of transcription factors mediates brassinosteroid-regulated gene expression in arabidopsis. Cell 120, 249–259. doi: 10.1016/j.cell.2004.11.044
Yu, G., Wang, L. G., Han, Y., He, Q. Y. (2012). clusterProfiler: An r package for comparing biological themes among gene clusters. OMICS 16, 284–287. doi: 10.1089/omi.2011.0118
Zhu, J. K. (2016). Abiotic stress signaling and responses in plants. Cell 167, 313–324. doi: 10.1016/j.cell.2016.08.029
Keywords: hydrogen peroxide stress, reactive oxygen species, pepper, gene regulatory network, tissue specificity
Citation: Tang B, Yang G, Du J, Xie L, Wang J, Pan L, Luo Y, Shan Q, Zou X, Xiong C and Liu F (2022) Analysis of the response regulatory network of pepper genes under hydrogen peroxide stress. Front. Plant Sci. 13:1018991. doi: 10.3389/fpls.2022.1018991
Received: 14 August 2022; Accepted: 15 November 2022;
Published: 08 December 2022.
Edited by:
Girdhar Kumar Pandey, University of Delhi, IndiaReviewed by:
Chenliang Yu, Zhejiang Agriculture and Forestry University, ChinaCopyright © 2022 Tang, Yang, Du, Xie, Wang, Pan, Luo, Shan, Zou, Xiong and Liu. This is an open-access article distributed under the terms of the Creative Commons Attribution License (CC BY). The use, distribution or reproduction in other forums is permitted, provided the original author(s) and the copyright owner(s) are credited and that the original publication in this journal is cited, in accordance with accepted academic practice. No use, distribution or reproduction is permitted which does not comply with these terms.
*Correspondence: Cheng Xiong, eGlvbmdjaGVuZ2h6YXVAMTYzLmNvbQ==; Feng Liu, bGl1ZmVuZ3JpY2hAMTI2LmNvbQ==
†These authors have contributed equally to this work
Disclaimer: All claims expressed in this article are solely those of the authors and do not necessarily represent those of their affiliated organizations, or those of the publisher, the editors and the reviewers. Any product that may be evaluated in this article or claim that may be made by its manufacturer is not guaranteed or endorsed by the publisher.
Research integrity at Frontiers
Learn more about the work of our research integrity team to safeguard the quality of each article we publish.