 Kai Li1
 Alberto Tassinari1
 Silvia Giuliani1Serena Rosignoli1Claude Urbany2
 Roberto Tuberosa1
 Silvio Salvi1*
- 1Department of Agricultural and Food Sciences (DISTAL), University of Bologna, Bologna, Italy
- 2KWS SAAT SE & Co. KGaA, Einbeck, Germany
Maize ear fasciation originates from excessive or abnormal proliferation of the ear meristem and usually manifests as flattened multiple-tipped ear and/or disordered kernel arrangement. Ear prolificacy expresses as multiple ears per plant or per node. Both ear fasciation and prolificacy can affect grain yield. The genetic control of the two traits was studied using two recombinant inbred line populations (B73 × Lo1016 and Lo964 × Lo1016) with Lo1016 and Lo964 as donors of ear fasciation and prolificacy, respectively. Ear fasciation-related traits, number of kernel rows (KRN), ear prolificacy and number of tillers were phenotyped in multi-year field experiments. Ear fasciation traits and KRN showed relatively high heritability (h2 > 0.5) except ratio of ear diameters. For all ear fasciation-related traits, fasciation level positively correlated with KRN (0.30 ≤ r ≤ 0.68). Prolificacy and tillering were not correlated and their h2 ranged from 0.41 to 0.78. QTL mapping identified four QTLs for ear fasciation, on chromosomes 1 (two QTLs), 5 and 7, the latter two overlapping with QTLs for number of kernel rows. Notably, at these QTLs, the Lo1016 alleles increased both ear fasciation and KRN across populations, thus showing potential breeding applicability. Four and five non-overlapping QTLs were mapped for ear prolificacy and tillering, respectively. Two ear fasciation QTLs, qFas1.2 and qFas7, overlapped with fasciation QTLs mapped in other studies and spanned compact plant2 and ramosa1 candidate genes. Our study identified novel ear fasciation loci and alleles positively affecting grain yield components, and ear prolificacy and tillering loci which are unexpectedly still segregating in elite maize materials, contributing useful information for genomics-assisted breeding programs.
1. Introduction
Fasciation is a deviational proliferation of cells and tissues eventually manifesting as widened and flattened organs (most commonly stems or inflorescences) that has been reported in more than a hundred plant families, including trees, shrubs and grasses (White, 1948; Iliev and Kitin, 2011). Ontogenetically, fasciation has been interpreted as (i) an excrescence or fusion of organs due to deviations from normal meristematic processes or crowding of buds, or (ii) a transformation of a single growing meristematic point into a line, this sometime called ‘true fasciation’ (Clark et al., 1993; Iliev and Kitin, 2011). Either way, mutations at genes involved in the maintenance and functions of the shoot apical meristem (SAM) and the early generative inflorescence meristem play a major role in fasciation, along with environmental factors (Somssich et al., 2016; Wu et al., 2018; Ortez et al., 2022).
Based on studies first carried out in Arabidopsis, SAM homeostasis was shown to be controlled by the CLAVATA3 (CLV3) - WUSCHEL (WUS) feedback signaling pathway (Brand et al., 2000; Schoof et al., 2000; Somssich et al., 2016). WUS is a stem cell-promoting homeodomain transcription factor, whereas CLV3 is a differentiation-promoting peptide that belongs to the CLAVATA3/EMBRYOSURROUNDING REGION (ESR) CLE peptide family (Opsahl-Ferstad et al., 1997; Trotochaud et al., 1999). While WUS activates the expression of CLV3, WUS expression is repressed by CLV3 through its binding to a number of leucine-rich repeat receptor-like proteins (including CLV1 and CLV2), causing the decline of stem cell proliferation, and a corresponding decrease of CLV3 production (Brand et al., 2000; Schoof et al., 2000). This feedback mechanism keeps meristem size under control and appears to be largely conserved in maize. For instance, maize CLV3/EMBRYO-SURROUNDING REGION7 (ZmCLE7) is a CLV3 ortholog; THICK TASSEL DWARF1 (TD1) and FASCIATED EAR2 (FEA2) encode receptor-like proteins related with CLV1 and CLV2, and regulates the size of the ear IM and SAM growth; ZmWUS1 seems to be a direct WUS ortholog and is expressed in the late vegetative SAM (Wu et al., 2018; Kitagawa and Jackson, 2019; Kim et al., 2022). Genes affecting meristem size and involved in ear fasciation and acting outside the CLV3-WUS loop have also been described. For instance, ZmFEA4 encodes a basic leucine zipper domain (bZIP) transcription factor that is expressed in the shoot meristem peripheral zone and is likely involved in cell transiting from SAM to organ primordium (Kitagawa and Jackson, 2019); the SQUAMOSA PROMOTER BINDING (SBP)-box transcription factors unbranched2 (UB2) and unbranched3 (UB3) are expressed in the initiating leaf primordia and the base of the SAM and control lateral organs initiation (Chuck et al., 2014). Finally, ear shape is also under the control of genes expressed later in development, at the inflorescence or even floret meristem levels, including ramosa1 (ra1), ra2 and ra3 (Vollbrecht et al., 2005; Kellogg, 2022), or growth regulating factor-interacting factor1 (gif1. Zhang et al., 2018), which were shown to control inflorescence (tassel and ear) branching and, when mutated, to produce multiple-tip or branched ears.
Fasciated mutants can be of interest in plant breeding programs for their ornamental characteristics or because their abnormal development may favorably affect yield components such as fruit and/or seed size and number. Indeed, fasciated tomato mutants showed increased number of flowers, fruits, fruit locules and fruit size (Tanksley, 2004; Iliev and Kitin, 2011; Xu et al., 2015). Similarly, mutations in CLV genes in Brassica resulted in higher number of locules in fruits, leading to higher yield (Fan et al., 2014; Xiao et al., 2018). In maize, ear fasciation has been suggested as a potential target for increasing ear size and/or number of kernels per ear under the expectation that a larger SAM should lead to a wider ear meristem eventually harboring more spikelet pair meristems and thus kernel rows (Otegui and Bonhomme, 1998; Somssich et al., 2016; Kim et al., 2022; Li et al., 2022). However, accumulating evidences indicate that strong ear fasciation alleles do not improve productivity because they usually induce a shorter, stunted ear; instead, weaker fasciation alleles show more potential (Bommert et al., 2013b; Je et al., 2016; Kim et al., 2022; Ortez et al., 2022). In line with this evidence, quantitative genetic variation for ear fasciation was analyzed using QTL mapping (Mendes-Moreira et al., 2015) and, in a different study, a QTL for kernel row number (KRN) was shown to correspond to ZmFEA2 (Bommert et al., 2013b). A different QTL on the same chromosome explained 12% of KRN variance, was cloned and shown to correspond to a cis-regulatory element of UB3 (Chuck et al., 2014; Du et al., 2020).
In maize, prolificacy is a general term indicating the presence of multiple ears in a plant (Ortez et al., 2022). Prolificacy can be classified as three types: multi-node prolificacy (i.e., multiple ears growing at different nodes), multi-tiller prolificacy (i.e., multiple stems growing from basal nodes) and single-node prolificacy [i.e., multiple ears growing at the same nodes, also known as ‘multi-ears’, ‘bouquet ears’ or ‘shank ears’ (Ortez et al., 2022)]. In single-node prolificacy, the presence of multiple ears is the result of multiple axillary meristems located on the same ear shank, giving rise to additional ear inflorescences alongside the central one. The presence of a single major ear per plant vs. multiple ears is one the major contrasting difference between currently cultivated maize and its progenitor teosinte (Stitzer and Ross-Ibarra, 2018). Because of this, domesticated maize was referred as ‘not prolific’, while its progenitor teosinte as ‘prolific’ (Doebley et al., 1995; Prakash et al., 2019; Yang et al., 2019). Although most of the modern maize hybrid cultivars cultivated in the high-dense stands in temperate environment develop only one ear, the potential presence of multiple ears per plant has physiological and breeding implications. For instance, maize hybrid cultivars with some level of plasticity to develop tillers and multiple ears per plant may turn out advantageous in semi-arid regions with high inter-annual variation of summer rainfall, where they are cultivated at low plant population densities (i.e., less than 4 plants m-2. Rotili et al., 2022). Additionally, ear prolificacy is considered a positive feature in ‘baby corn’ specialty maize cultivars whose unfertilized ears are consumed in salads, soups, fried snacks and other ways (Prakash et al., 2019). The genetic control of multiple ears per plant is complex and received little attention so far. A major QTL for single-node prolificacy, prol1.1, was mapped on chr. 1 in a maize-teosinte BC2S3 population, at a chromosomal location that had previously been shown to influence domestication traits and shown to correspond to the expression regulatory region of grassy tillers1 (gt1), encoding a homeodomain leucine zipper transcription factor (Wills et al., 2013). More recently, major multi-node prolificacy QTLs were mapped in different crosses (Prakash et al., 2021; Wang et al., 2021).
Ears and tillers both originate from axillary buds developing into shorter or longer shoots, therefore they are expected to share developmental mechanisms. This was indeed confirmed by the identification and cloning of genes such as barren stalk1 (ba1), encoding a bHLH transcription factor orthologous to rice LAX PANICLE1 (LAX1. Gallavotti et al., 2004) . Additionally, ba1 mutants fail to initiate all vegetative and reproductive axillary meristems. BA1 levels are under the control of BARREN STALK FASTIGIATE1 (BAF1), a transcriptional regulator with an AT-hook DNA binding motif (Gallavotti et al., 2011). Mutant baf1 plants fail to initiate axillary buds that are fated to become lateral ear shoots; as a result, baf1 mutants are earless (Gallavotti et al., 2011).
This study investigated the genetic control of ear fasciation and ear prolificacy and their links with KRN and tillering, respectively, using QTL mapping. Mapping was carried out in two connected (ie. sharing one parental line) RIL populations, B73 × Lo1016 and Lo964 × Lo1016 analyzed as a joint population. Line Lo1016 was the genetic source of mild ear fasciation while Lo964 was the source of ear prolificacy.
2. Materials and methods
2.1. Plant materials and marker genotyping
Two recombinant inbred line (RIL) populations were developed as follows. The line Lo1016 was crossed with B73 and with Lo964 to create two F1s. Both Lo964 and Lo1016 are typical dent lines originally bred at the Bergamo breeding station (Italy), shown to be genetically related based on molecular marker analysis and classified as BSSS = Iowa Stiff Stalk Synthetic heterotic group (Losa et al., 2011). B73 is the maize reference inbred line (Schnable et al., 2009). Single seed descent method was utilized to reach F7 generation, after which each line was multiplied following standard procedures. The B73 × Lo1016 (B×L) and Lo964 × Lo1016 (L×L) populations eventually included 97 and 68 RILs, respectively. We will refer to the Joint Population (JP) as the assembly of the whole set of 165 (97 + 68) RILs.
2.2. Field experiment and phenotypic data collection
Field trials were carried out in Cadriano, near Bologna, Italy (44°33’02.5”N, 11°24’43.9”E) in 2017 and in Monselice, near Padova, Italy (45°12’42.4”N, 11°45’14.8”E) in 2018 and 2019. Field experiments were organized as a randomized complete block design with two replicates (one rep = one plot with 10 plants per RIL). Plots for each of the three parental lines were included in the experiment. Plot length was 2.5 m, distance between rows was 0.8 m and between plants was 0.25 m. Plots were overplanted by hand and thinned at the V7 growth stage to one plant per hill equivalent to 11 plants per plot, and with an overall investment of 5.5 plants per square meter. The field was managed following standard agronomic practices of the area.
Phenotyping for ear fasciation was carried out by collecting four traits, namely ‘ear ovality’ (OVA, defined after visual inspection of elliptic/ovality degree of cob cross-section, from 0 to 10, corresponding from perfect circle to extremely elliptic/flat cob cross sections, respectively; higher values indicated strong fasciation); ‘kernel row disorder’ (DIS, defined as a visual score from 0 = perfectly linearly arranged kernels on ears, to 10 = highly disordered arrangement; higher values indicated strong fasciation); ‘ear diameters ratio’ (DIA, defined as ratio of minimum diameter divided by maximum diameter, where the two diameters were measured mutually perpendicularly by a caliper at the middle of the ear; lower values corresponded to strong fasciation); ‘ear fasciation index’ (FAS, a visual score for ear fasciation scaled from 0 to 3, where 3 indicated a strongly fasciated ear). Visual scores per ear were given by three persons independently, and mean values were utilized as entries for subsequent analysis. Number of kernel rows (KRN) was collected by counting the number of kernel rows at mid-ear position, on the same ears subjected to phenotyping for fasciation. Plant architecture traits collected were number of tillers per plants (TIL) and proportion of plants per plot showing prolificacy (PROL), i.e., proportion of plants showing >1 ear at the top ear node. For all traits, three central contiguous plants per plot were considered.
Raw phenotypic data for all traits were modified by using the model Best Linear Unbiased Estimator (BLUES) in the R package “tidyverse” (Wickham et al., 2019). BLUES values were utilized for biometric, correlation and QTL analyses. Correlation analysis was carried out by the Spearman method which is little sensitive to deviation from normal distributions (Wickham et al., 2019). We utilized the common letter ‘r’ instead of the more appropriated ‘rho’ for clarity in text. Trait distributions were normal or reached normality after square root transformation (Sokal and Rohlf, 2012), except for ear diameters rate, prolificacy and tillering (Supplementary Table 1). We used original data for visualization (Figure 1 and Supplementary Figures 1, 2).
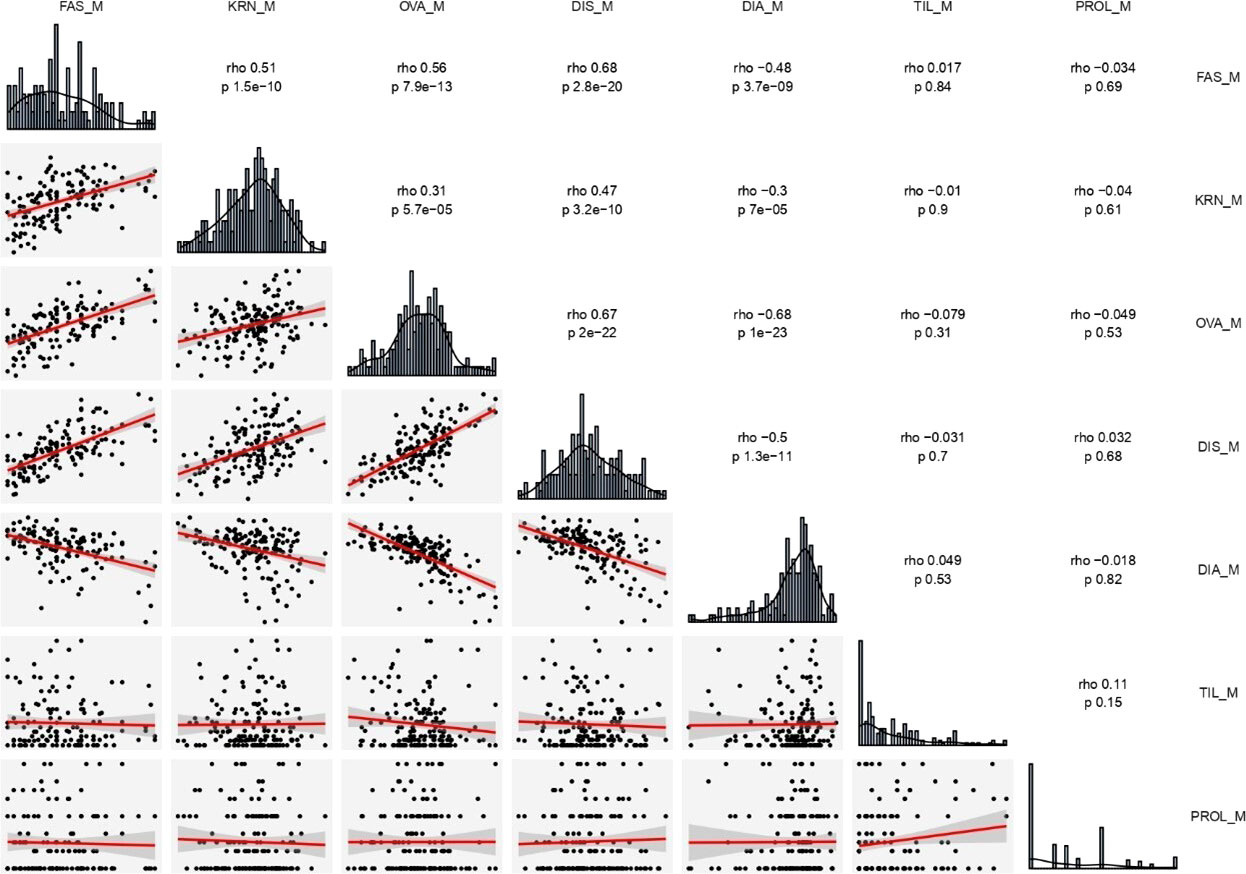
Figure 1 Distribution frequency histograms of, and correlation among all traits estimated on the two RILs (B×L and L×L) combined. The upper right part reports all correlation indexes (rho) and corresponding significant levels (p). The lower left part presents scatter plots and fitter curve (the red line inside) between two traits. The diagonal shows histogram charts of each trait. DIA (ear diameters rate), DIS (kernel row disorder), OVA (ear ovality), FAS (ear fasciation index), KRN (kernel row number), PROL (prolificacy), TIL (number of tillers), M, mean value.
Analysis of variance (ANOVA) was run for six out of seven traits and for two (2018 and 2019, corresponding to experiments in Monselice, near Padua) out of three years. Specifically, ANOVA was not run for ear fasciation index since this phenotypic dataset was only available as mean value of two repetitions. Similarly, phenotypic data for year 2017 were not included in ANOVA because mean values (as mean of two repetitions) were available only. ANOVA output tables for six traits are provided in Supplementary Table 2. For each trait, ANOVA had three sources of variation, namely Year (2018 and 2019), Population (B×L, and L×L) and RIL (97 RILs for B×L and 68 RILs for L×L). RILs were treated as ‘Nested’ in Population. The final linear model utilized (in R) was Trait ~ Year * Population/RIL. Year was considered as random while Population and RIL factors were considered as fixed effect.
2.3. SNP genotyping, construction of linkage map and QTL mapping
B×L and L×L were genotyped using a high density 15-K SNP array (Rousselle et al., 2015) using a commercial service. Genomic DNA was prepared following standard protocols by a DNA extraction kit (NucleoSpin Plant II, Macherey Nagel, Duren, Germany) based on the manufacturer’s protocol. Marker alleles from Lo1016 were coded as 0 while alleles from Lo964 and B73 were coded as 2 and missing values as -1. Linkage map construction was obtained using QTL Icimapping (Meng et al., 2015) by first removing redundant markers using the procedure “BIN”, and then building linkage maps using “MAP”. Three linkage maps were constructed, one for each biparental cross RIL population, and one as joint population. For “BIN” function, markers whose missing rate was higher than 50% and distortion rate higher than 0.01 were deleted. For “MAP” function, the algorithm nnTwoOpt and SARF (sum of adjacent recombination fractions) for rippling were applied, and the window size was specified as 9. QTL mapping was carried out by QTL Icimapping using the Nested Association Mapping (NAM) functionality, treating the two subpopulations (B×L and L×L) as a single population (ie. Joint Population, JP). This was possible because the two subpopulations share on common parent (Lo1016), making it equivalent to a NAM design (Li et al., 2011). Under NAM functionality, QTL Icimapping applies ‘joint inclusive composite interval mapping’ (JICIM. Li et al., 2011). The JICM-based QTL analysis was proved to provide higher QTL detection power and mapping precision as compared to the analysis of the single biparental populations (Li et al., 2011). In parallel, we carried out QTL analysis on single subpopulations (using the options BIP and composite interval mapping in QTL Icimapping) for checking purposes. The scanning step was set as 0.1 cM in NAM and 1 cM in biparental populations, respectively. Probability of stepwise regression was set to 0.0001. The LOD threshold for declaring QTL significance was set as 3.3, 3.6 and 4.6, for B×L, L×L and JP, respectively, after permutation test (P ≤ 0.05 with 1,000 permutation). QTL additive effects were always computed by the formula 2a = (mean homozygous B73 – mean homozygous Lo1016) or 2a = (mean homozygous Lo964 – mean homozygous Lo1016), for the two RIL populations, respectively.
Additionally, QTL mapping for ear diameters rate, ear prolificacy and tillering (ie. traits showing deviation from normal distribution) was also carried out by Kruskal-Wallis (KW) test, known to be robust to deviation from distribution normality, as implemented in MapQTL6 (Van Ooijen, 2009). For these traits, QTL results obtained both with JICIM and KW tests are provided and compared in Supplementary Table 3. Since the two methods basically provided the same results, results from KW test will be no further discussed, with the exception of QTLs qProl1 and qProl4, for which we provided footnotes in Table 2.
2.4. Screening candidate genes and variant calling
QTL confidence intervals from this study were projected on B73 reference genome (B73v5. Hufford et al., 2021) and included gene models that were considered for further investigations. Whole genome sequencing of the two lines Lo964 and Lo1016 was carried out with Illumina HiSeq PE150 at 20× of coverage. Reads were aligned to the B73v5 using BWA v.7.17 (Li and Durbin, 2009). Variants were called with BCFtools v. 1.10.2 (Li, 2011) and were filtered for a minimum reads depth of 10×, PHRED quality > 40 and a minimum DV/AD ratio of 0.8, where DP is the coverage depth at the variant position and AD is the allelic depth of the alternate allele. Variant effects were predicted with SNPEff v.3.0.7 (Cingolani et al., 2012) and among variants in the gene space, only high or moderate effects were considered. Additionally, alleles sequences of candidate genes were extracted for Lo964 and Lo1016 from their whole variant call format (vcf) files and the FASTA sequences were obtained with the command bcftools consensus. The 25 NAM founder sequences were downloaded from MaizeGDB (Portwood et al., 2019). The FASTA sequences were aligned using MUSCLE (Edgar, 2004) from MEGAX (Kumar et al., 2018). The coding sequences were obtained starting from the genomic sequence and the B73v5_Zm00001eb.1.gff3 annotation file downloaded from MaizeGDB, using GFFRead (Pertea and Pertea, 2020). The alignment images were elaborated with Jalview (Waterhouse et al., 2009). Finally, a review of published QTLs and genes in maize was carried out by searching major bibliographic databases using ‘ear fasciation’, ‘prolificacy’ or ‘tillering’ terms as keywords, and information on QTL and genes physical position, bin and type of mapping population was collected. Gene name formats and symbols followed the indications given at www.maizegdb.org/nomenclature.
3. Results
3.1. Trait biometrics, heritability and phenotypic correlations
This study confirmed that Lo1016 and Lo964 are characterized by ear fasciation and ear prolificacy, respectively (Figure 2, Supplementary Figure 1, Table 1). Specifically, Lo1016 showed the highest fasciation values when compared to Lo964 and B73 except kernel row disorder (Tab. 1. P < 0.01 for all comparisons for ear diameters rate, ear fasciation index and ear ovality/flatness, Tukey’s test). Alongside, Lo1016 also showed the highest KRN (19.75 vs 16.33 or 14.54, for B73 or Lo964, respectively, P < 0.01). Lo964 showed the highest ear prolificacy among the three parental lines (2.75 vs 0.0 or 0.25, for B73 or Lo1016, respectively, P < 0.01). In addition, Lo1016 was the only parental line developing tillers (ca. 1.5 tillers per plant). Values for additional plant architecture traits recorded in this study are reported in Table 1. ANOVA showed that ear diameters rate, kernel row disorder, KRN and prolificacy were strongly affected by ‘Year’ (P < 0.01) while ear ovality and number of tillers were only mildly affected (0.01 < P < 0.05) (Supplementary Table 2). ‘Population’ significantly affected all traits (P < 0.01) except number of tillers. No ‘Population-Year’ interactions were observed for any traits with the exception of prolificacy. For any trait, RIL (ie. lines) was a major source of variation, in line with the presence of segregating QTLs. Broad sense heritability (h2) for ear-fasciation traits ranged from 0.13 for ear diameters rate in L×L to 0.95 for ear fasciation index in B×L. Ear prolificacy and TIL h2 were relatively high (ranged between 0.41 and 0.78, Table 1).
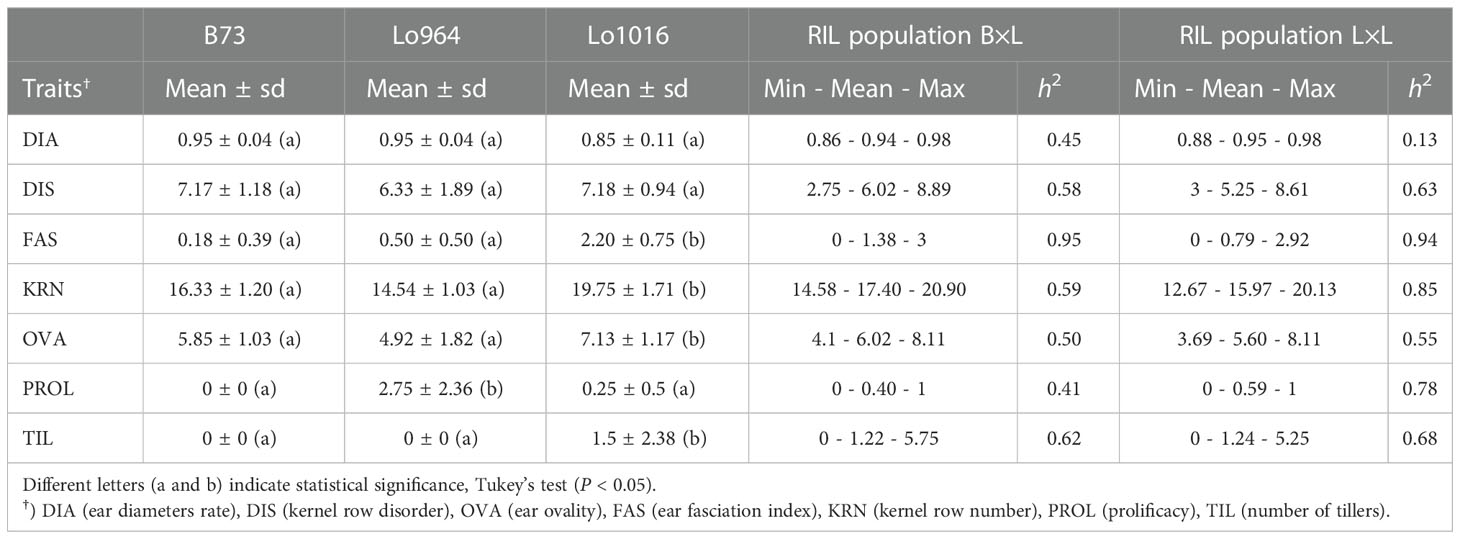
Table 1 Descriptive statistics for ear and plant architecture traits in the two RIL populations B73 × Lo1016 (B×L) and Lo964 × Lo1016 (L×L).
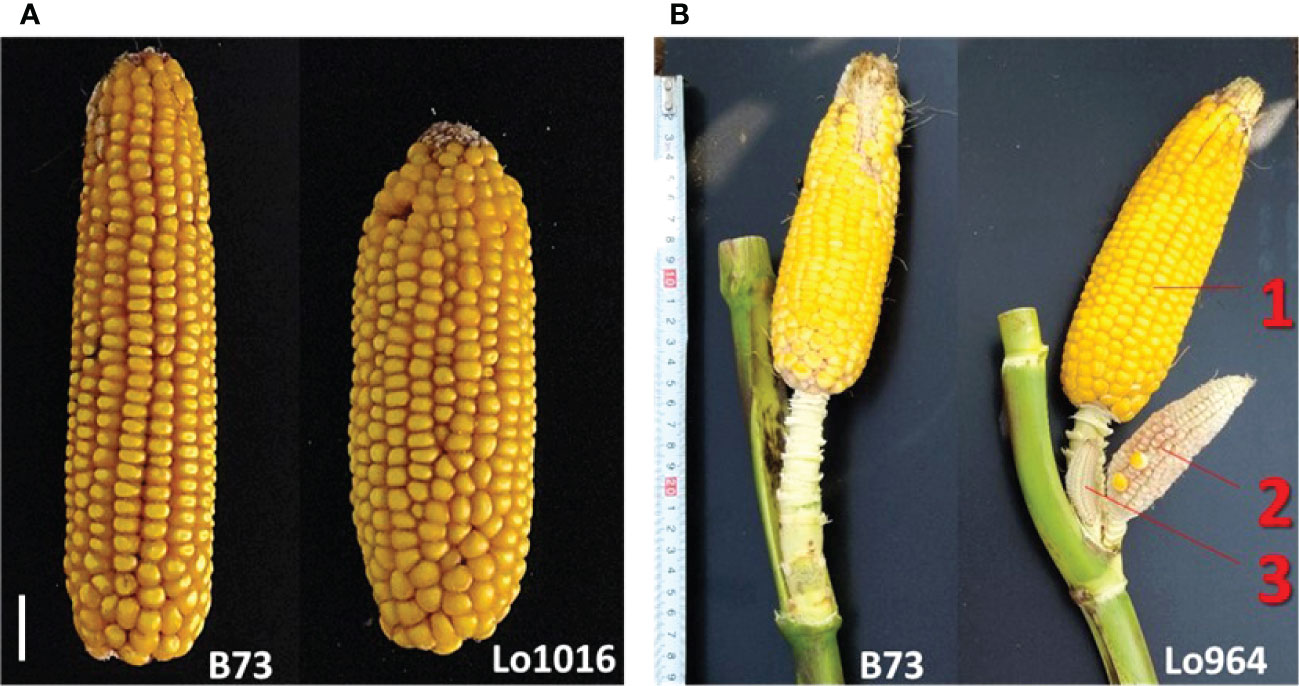
Figure 2 Target ear traits analyzed in this study. (A) Representative images of the ear-fasciation phenotype observed in Lo1016 (B73 is shown as comparison). White line, 1 cm. (B) Representative images of the ear prolificacy phenotype at top ear-bearing node as observed in Lo964 (B73 is shown as comparison). Numbers (1-3) indicate different ears at the same node.
Positive transgressive segregation was observed for TIL only, with some RIL lines belonging to both populations that showed > 5 tillers per plant as compared to 1.5 tillers per plant on average in the high-tillering parent Lo1016. Negative transgressive segregation was observed for KRN, with RIL lines from L×L showing as few as 12.7 kernel rows as compared to 14.5 or 19.7 kernel rows recorded for Lo964 or Lo1016. Negative transgressive segregation was also observed for DIS in both RIL populations.
The four ear-fasciation-related traits (ear diameters rate, ear fasciation index, ear ovality, kernel disorder) resulted significantly correlated, with r ranging from |0.48| to |0.68| (P < 0.001, Figure 1, Supplementary Figures 2, 3), with ear diameters rate negatively correlated as expected (i.e., the smaller the rate, the stronger ear fasciation). Additionally, the same traits correlated with KRN. Among ear fasciation-related traits, ear fasciation index showed the highest correlation (r = 0.51) with KRN and ear diameters rate the lowest (r = −0.30, P < 0.001. Figure 1), again with ear diameters rate as the only trait negatively correlated with KRN. Overall, the correlation results suggested that variation for KRN and ear fasciation could partially be due to the same loci. Ear fasciation traits did not show correlation with ear prolificacy or tillering (Figure 1).
3.2. Linkage maps
The three linkage maps, namely B×L, L×L and JP included 1,186, 984 and 1,303 markers, and covered 1,819.52 cM, 2,504.5 cM and 1,661.0 cM, respectively (Table 2 and Supplementary Figure 4). The different linkage maps covered well the maize genome with the unavoidable exception of those regions characterized by lack of markers polymorphism due to identity-by-descent between lines. In B×L, those regions were identified as the middle part of chr. 1 between PZE-101130395 (168,493,734) and PZE-101137700 (180,295,042), accounting for 3.8% of the chromosome, and the upper and lower parts of chr. 3, for a total of 88.7 Mb (37.6% of chr. 3). In L×L, almost the whole chr. 3 resulted monomorphic and thus uninformative for QTL mapping. Additionally, deficits of polymorphic markers resulted in long intervals between markers on the upper parts of chr. 4 and 7, accounting for 4.9 and 7.0% for each corresponding chromosome, respectively. Overall, 87.7 and 75.7% of the maize map was sufficiently covered by molecular markers in B×L and L×L, respectively.
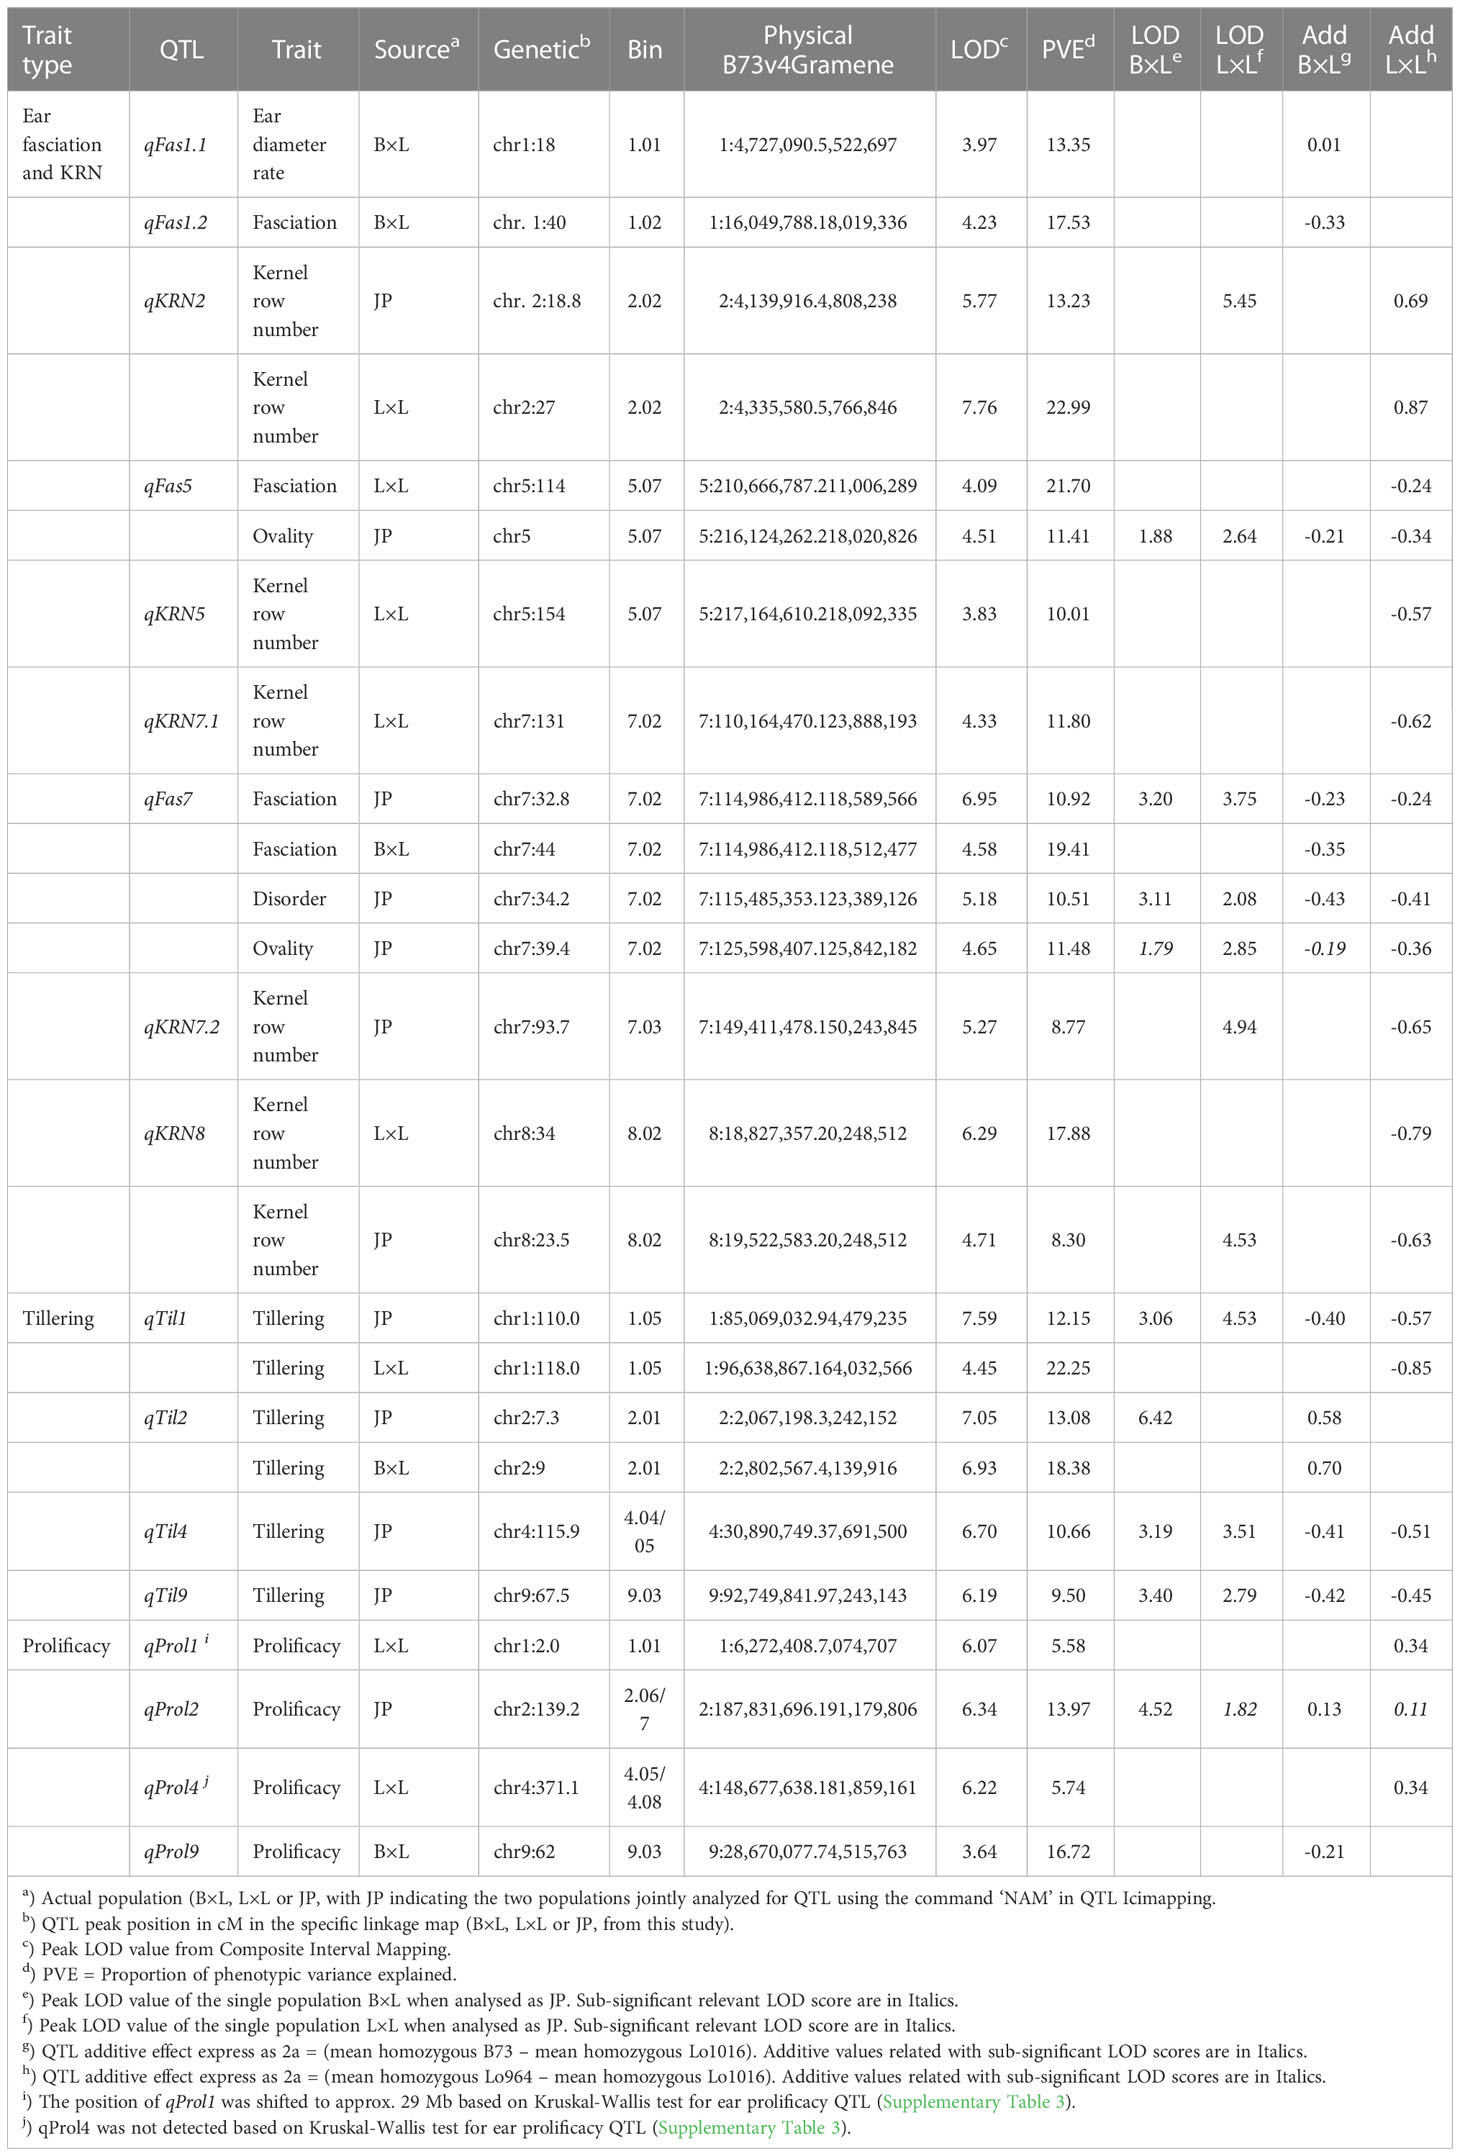
Table 2 QTL results for ear-fasciation (and related traits), kernel row number, ear prolificacy and tillering as obtained by composite interval mapping using BLUES-modified phenotypic values, on single RIL populations (B×L and L×L) and by analysis of joint population (JP).
3.3. QTL results
3.3.1. Four ear-fasciation QTLs were identified and ear fasciation alleles were always contributed by Lo1016
In the following, QTLs for different ear fasciation-related traits (ear diameters rate, ear fasciation index, ear ovality, kernel disorder) will be considered as the same QTL whenever their supporting intervals overlap, considering QTL results from B×L, L×L and JP (Figure 3 and Supplementary Figures 5, 6). Four QTL for ear fasciation traits were mapped (qFas1.1 and qFas1.2 on chr. 1; qFas5 and qFas7 on chr. 5 and 7, respectively. Table 2). qFas1.1 and qFas1.2 were detected for ear diameters rate and fasciation index, respectively, and mapped nearby on chr. 1 (bins 1.01/1.02) within two narrow supporting intervals of < 2 Mb, and both segregated within B×L only. qFas5 was mapped on bin 5.07 for fasciation index and ear ovality and appeared to segregate mainly in L×L. qFas7 was mapped on bin 7.02 and shown to affect ear fasciation index, ear ovality and kernel disorder in both B×L and L×L. Notably, for all qFas QTLs, the fasciation-increasing allele was provided by Lo1016, the parental line showing ear fasciation (Figure 2), as indicated by the direction of QTL effects (Table 2).
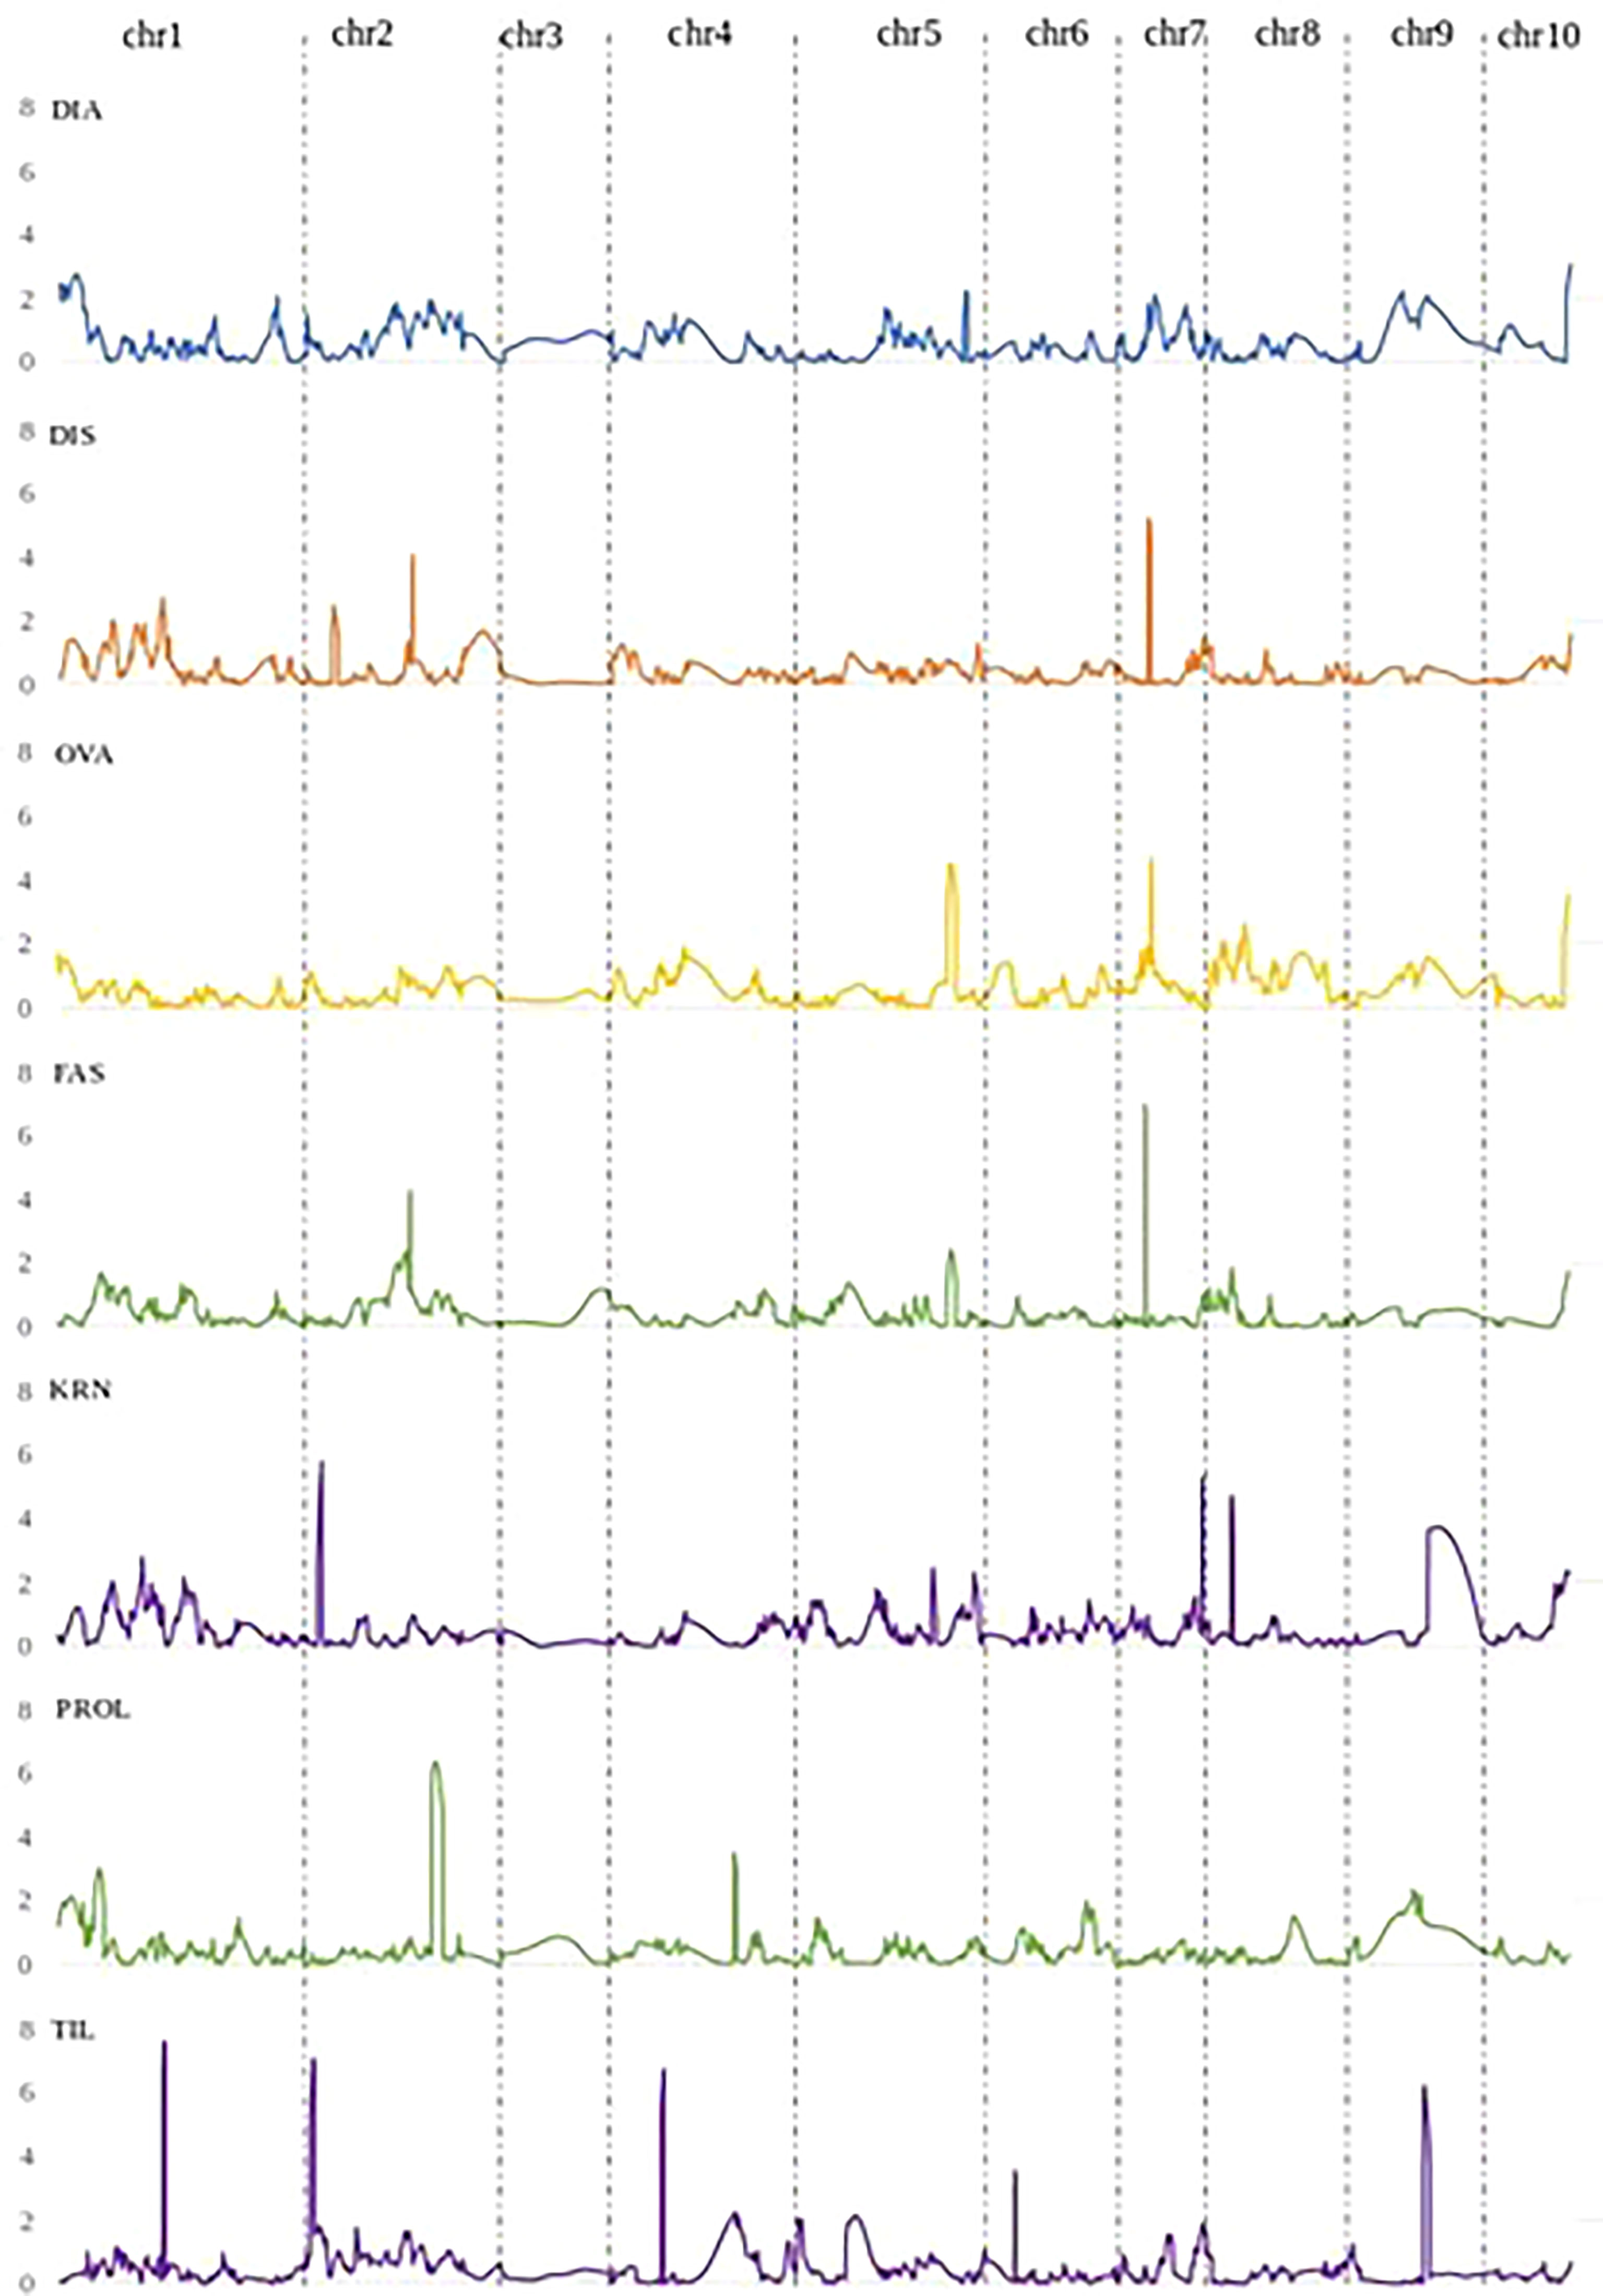
Figure 3 QTL LOD profiles obtained by the joint analysis of the two RIL populations B×L and L×L, for DIA (ear diameters rate), DIS (kernel row disorder), OVA (ear ovality), FAS (ear fasciation index), KRN (kernel row number), PROL (prolificacy), TIL (number of tillers).
3.3.2. KRN QTLs partially overlapped to ear fasciation QTLs
Five KRN QTLs were mapped. The QTL with the strongest effect, qKRN2, was mapped on bin 2.02 in a < 2 Mb-supporting interval and explained 13 or 23% (JP or L×L, respectively) of phenotypic variation with a genetic effect 2a = 0.69 or 0.87 kernel rows, in JP or L×L, respectively (‘+’ allele from Lo964). The QTL qKRN5 on bin 5.07 controlled 10% of phenotypic variance and showed an effect of 2a = − 0.57 kernel rows (‘+’ allele contributed by Lo1016). Two KRN QTLs, qKRN7.1 and qKRN7.2, mapped on bin 7.02 and 7.03, respectively, and had similar genetic effect (2a = −0.62 and −0.65 kernel rows, ‘+’ allele by Lo1016). The QTL qKRN8 mapped on bin 8.02, with a genetic effect of 2a = −0.79 in L×L (‘+’ allele by Lo1016). Notably, all KRN QTLs segregated in L×L while none in B×L. Overall, qKRN2 was the only KRN QTL with the ‘+’ allele contributed by Lo964, while Lo1016 contributed the ‘+’ allele at the other four KRN QTLs (Table 2). Notably, two out of five KRN QTLs overlapped with ear fasciation QTLs. Specifically, qKRN5 overlapped with qFas5 on bin 5.05 and qKRN7.1 with qFas7 on bin 7.02. At both chromosome regions, the ear fasciation-increasing allele (provided by Lo1016) also increased kernel row number, supporting the hypothesis of a functional association due to the presence of causative gene(s) affecting both ear fasciation and number of kernel rows, and in line with the observed positive correlation between the two traits (Figure 2).
3.3.3. Ear prolificacy is under polygenic control in B×L and L×L populations independently from tillering
Four QTLs were mapped for ear prolificacy (qProl1, qProl2, qProl4 and qProl9. Table 2). qProl1 and qProl4 were detected in L×L only, qProl2 was mapped in JP and qProl9 in B×L only. The highest PVE values were recorded for qProl2 (14.0%) and qProl9 (16.7%). At qProl1, qProl2 and qProl4, the high ear prolificacy parent Lo964 contributed the ‘+’ QTL allele. Both qProl1 and qProl2 showed narrow physical supporting intervals (0.8 Mb and 3.3 Mb, respectively). Tillering variation was also shown to be under polygenic control with four QTLs. The two strongest QTLs in terms of genetic effect, qTil1 and qTil2, mapped on bin 1.05 and 2.01, controlled 12-13% of phenotypic variance in JP with a genetic effect of 2a = 0.6 tillers per plant. Although the ‘+’ allele was contributed by Lo1016 for qTil1, qTil4 and qTil9, in both B×L and L×L B73 contributed a positive tillering allele at qTil2. No overlap was found between prolificacy and tillering QTLs.
3.3.4. Meristem genes compact plant2 (ct2) and ramosa1 (ra1) co-map with QTLs for ear fasciation qFas1.2 and qFas7, and barren inflorescence1 (bif1) co-maps with qKRN8
In order to search for candidate genes of ear fasciation QTLs identified in this study, we extracted all gene models included in the QTL supporting intervals present in B73 v4 (www.maizegdb.org) along with gene expression information in meristem and ear primordium. Alongside, a list of 42 genes involved in development and/or proliferation of ear meristem was collected by screening the scientific literature (Supplementary Table 5); a sublist of genes comapping with QTLs in our study is provided in Supplementary Table 6. For instance, at qFas1.2 (chr. 1, 16.0-18.0 Mb), compact plant2 (ct2. Bommert et al., 2013a), and big grain1 homolog1 (bgh1. Simmons et al., 2020) at chr. 1, 16.7 Mb, were identified as candidate genes. The well-known ra1 (Vollbrecht et al., 2005; Dempewolf, 2010) on chr. 7, 113.6 Mb, is included in the supporting interval of qFas7/qKRN7.1 (chr. 7, 110.2-123.9 Mb). Additionally, at qKRN8 (chr. 8, 18.8–20.2 Mb), barren inflorescence1 (bif1. Barazesh and McSteen, 2008), chr. 8, 18.9 Mb was identified as candidate gene for KRN. As far as tillering is concerned, two candidate genes, namely crr1 (cytokinin response regulator1, gene model Zm00001d001865) and arftf3 (ARF-transcription factor 3, gene model Zm00001d001879) were identified within the supporting interval of qTil2, on chr. 2.
3.3.4. Investigation of nucleotide and amino acid sequence variation at candidate genes for ear fasciation, number of kernel rows QTLs and tillering
The nucleotide sequences of candidate genes listed in Supplementary Table 6 were recovered for the three parental lines based on the reference genome sequence (B73 v4 from www.maizegdb.org) or based on the de novo whole genome shotgun sequences obtained in this work (Lo964 and Lo1016), and compared in order to identify functional variants. Specifically, variants were searched for ra1 (candidate at qKRN7.1/qFas7), ct2 and bgh1 (candidates at qFas1.2) and crr1 (candidate for qTil2. Supplementary Figures 7-11). However, in all these cases, no nucleotide difference was observed between the parental alleles. This result does not rule out ra1, ct2/bgh1 and crr1 as possible candidate genes for their QTLs, instead, it suggests that the candidate genes could act on ear fasciation by gene expression changes.
4. Discussion
We phenotyped ear fasciation using four approaches, namely collecting the rate between the minor and the major cob diameters, ear ovality or flatness, kernel row disorder index and an ear fasciation index. Thus, our phenotyping approaches covered well the different ways ear fasciation manifests, namely cob flatness and kernel disorder as shown previously (Mendes-Moreira et al., 2015; Kim et al., 2022). Confirming other authors’ observations, cob ovality/flatness and kernel row disorder correlated, and correlated also with ear fasciation index. Additionally, cob ovality, kernel disorder and ear fasciation index QTLs showed a sizeable level of overlap. At the same time, both the imperfect correlation between such traits (e.g., r = 0.67 between ear ovality/flatness and kernel row disorder) and the presence of QTLs affecting only one out of four ear-fasciation-related traits (e.g., qFas1.1, controlling ear diameters rate) confirmed that ear fasciation is a genetically and physiologically complex polygenic trait and that at least some genes can possibly affect kernel disorder without affecting cob ovality/flatness, or vice versa. The presence of QTLs specific for single components of ear fasciation was already reported (Mendes-Moreira et al., 2015).
Confirming earlier observations, phenotypic variation for ear fasciation and KRN were found associated in our study, both in terms of positive correlation and QTLs overlap. Specifically, two out of four ear fasciation QTLs overlapped with two out of five KRN QTLs. Furthermore, at the overlapping loci, namely qFas5-qKRN5 and qFas7-qKRN7.1, the direction of genetic effects agreed (i.e., ‘+’ alleles increased both ear fasciation index and the number of kernel rows), as previously hypothesized or shown. Notably, at both qFas5-qKRN5 and qFas7-qKRN7.1 the fasciation/KRN-increasing allele was provided by Lo1016, and the effect of the Lo1016 alleles at the two QTLs was detected in both B×L and L×L. In other words, at both qFas5-qKRN5 and qFas7-qKRN7.1, Lo1016 carries alleles increasing both ear fasciation index and kernel row number, and their positive effect on ear fasciation were detected across genetic backgrounds. However, the KRN effect was detected in the L×L background only, likely because the KRN mean value in the L×L genetic background was lower than that in B×L (16.0 and 17.4 kernel rows per ear, respectively; Table 1). Indeed, in a high KRN-context such as the B×L genetic background, any KRN-increasing allele such as the ones from Lo1016 would likely contribute marginally to KRN. In L×L, the genetic effect at both qFas5-qKRN5 and qFas7-qKRN7.1 QTLs was estimated to be 2a = approx. 0.6 rows per locus (|0.57| at qKRN5 and |0.62| at qKRN7.1. Table 2), equivalent to approx. 4% (0.6/16.5 rows per ear) of the average trait value in these populations. Homozygous Lo1016 allele substitutions at both loci are therefore expected to add approximately one row per ear, therefore contributing approximately 6% (1/16.5 rows) of grain yield. Although this estimate should be considered with caution, the combined effect of the two QTLs on kernel per ear seems important and worthy to consider in plant breeding programs when based on marker- or genomics-assisted selection.
Our QTL consensus map (Figure 4A, Supplementary Table 7) supported the pleiotropic connection between ear fasciation and KRN. For example, QTLs for cob ovality and KRN (qCF1 and qKRN1a, respectively) by Mei et al. (2021) on chr. 1 overlapped with qFas1.2 mapped in our study. Liu et al. (2015) found a QTL (qKRN5-4) between umc1971 and umc1071 on chr. 5 affecting kernel row number, and mapping nearby our qFAS5. Finally, the chr. 7 region corresponding to our qFas7-qKRN7.1 appears as an ear fasciation/KRN QTL hot spot. QTLs mapped in this region included cob and ear flatness qCF7 and qEF7 by Mei et al. (2021), ear fasciation fa_c1 by Mendes-Moreira et al. (2015), several ear row number QTLs within the B73 NAM population by Brown et al. (2011), qkrn7 by Lu et al. (2011), KRN7.1 by Chen et al. (2019), qKRN7 by Mei et al. (2021).
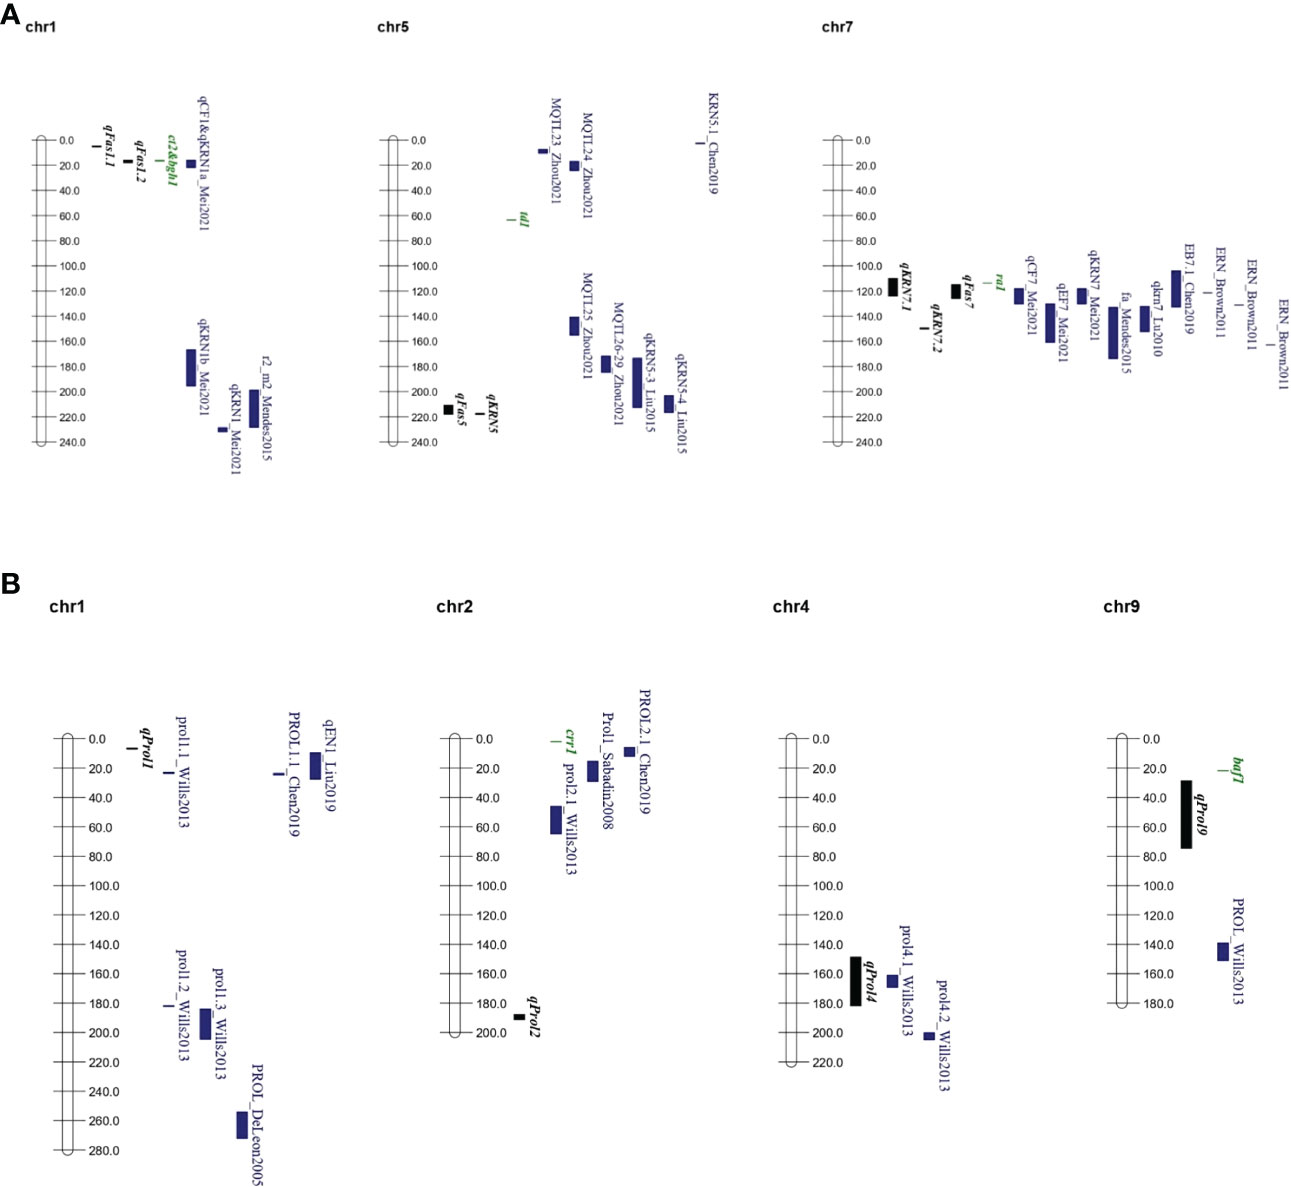
Figure 4 QTL and main candidate genes consensus maps. (A) QTL consensus map for ear fasciation including QTL from literature and this study. (B) QTL consensus map for ear prolificacy, including QTL from literature and from this study. Chromosome bars and numbers represent physical distances in Mb. QTL positions are represented following physical positions reported in Supplementary Tables 7, 8. In black, QTL from this study; in green, tentative candidate genes; in blue, QTL from other studies. Full QTL information from other studies is provided in Supplementary Table 7.
We also detected QTLs affecting the number of kernel rows independently from ear fasciation on chr. 2 and chr. 8 (qKRN2 and qKRN8, respectively. Table 2) with (+) alleles dispersed between parental lines (from Lo964 and Lo1016, respectively). Many independent QTL mapping studies for number of kernel rows have already been carried out and a comprehensive review is beyond the scope of this study. However, it should be noted that a major KRN QTL mapping on chr. 2, just 10 Mb away from qKRN2 was cloned and shown to encode for a member of the highly duplicated WD40 gene and protein family (Chen et al., 2022), which affects diverse cellular functions like signal transduction, cell cycle control, intracellular transport, chromatin remodelling, cytoskeletal organization and others. The authors reported that the WD40 allele increasing the number of kernel rows enhanced the inflorescence meristem size, likely providing additional space for initiation of spikelet pair meristems and hence a higher number of kernel rows (Chen et al., 2022). Given the close proximity (ca. 10 Mb) between WD40 and the QTL qKRN2 reported herein in the subtelomeric region of chr. 2, it will certainly be worth checking the actual identity between the two loci.
By comparing QTL supporting intervals from our and other studies with the genomic positions of inflorescence-related genes we shortlisted candidate genes possibly involved in controlling ear fasciation QTLs (Figure 4A, Supplementary Tables 5, 6). The maize historical tassel and ear mutant ra1, encoding a zinc-finger transcriptional factor and producing ear and tassel with increased branches (Vollbrecht et al., 2005; Kim et al., 2022) maps only 0.5 Mb away from the QTL cluster region including qFas7, and within the QTL supporting interval of qKRN7.1. Comparison of genomic sequences between our three parental lines showed lack of nucleotide sequence variation at ra1 (Supplementary Figure 8), in line with former observations which showed ra1 as very poor of sequence diversity in maize (Sigmon and Vollbrecht, 2010). However, as shown in other studies (Salvi et al., 2007; Li et al., 2012; Salvi and Tuberosa, 2015), QTLs are often due to gene expression level variation rather than variation of coding sequences, therefore quantification of the expression of ra1 in the ear primordium of Lo1016 and Lo964 will enable to test ra1 involvement in ear fasciation driven by qFas7. The genes ct2 and bgh1 were identified as candidate genes for qFas1.2 (Supplementary Table 6) based on former observations that maize lines carrying mutations at ct2 produced fasciated ears (Bommert et al., 2013a), and that the overexpression of bgh1 resulted in increased ear kernel row number (Zhang et al., 2022). Five common native bgh1 alleles exhibited little structural and expression variation compared to the large increased expression conferred by these ectopic alleles (Simmons et al., 2020). In line with this observation, genomic sequence comparison between B73 and Lo1016 (qFas1.2 was detected in B×L only; Table 2) showed no difference in coding sequences.
Our study addressed single-node ear prolificacy (Wang et al., 2021), a trait hardly investigated across maize genetics and we identified four major QTLs. An overlap was observed between our qProl4 and prol4.1 by Wills et al. (2013) in a maize × teosinte cross (Figure 4B, Supplementary Table 8), although no association with known genes inside this interval was established. Additionally, qProl1 mapped in the proximity of three ear prolificacy QTLs reported in other studies (Wills et al., 2013; Chen et al., 2019; Liu et al., 2019; Figure 4B, Supplementary Table 8), The gene grassy tillers1 (gt1) known to be involved in ear prolificacy (Wills et al., 2013) maps just ~16 Mb away from qProl1 (Table 2; Supplementary Table 5). Finally, barren stalk fastigiate1 (baf1), a known gene that when mutated produces barred shoots with no ear (Zhou et al., 2021) maps very close (~7 Mb) to the north border of qProl9 (Figure 4B). Thus, given the vagaries of QTL mapping, both gt1 and baf1 cannot be excluded as possible causative genes for their corresponding QTLs.
Among the four QTLs controlling the number of tillers per plant, three (qTil1, -4 and -9) had the tillers-increasing allele provided by Lo1016, in line with the phenotype of parental lines (Lo1016 is the only parent showing tillering when grown in the field in standard conditions). However, qTil2 had the tiller-increasing allele contributed by B73 that develops hardly no tillers in our field conditions (Table 1), which suggests that at least some level of epistasis occurs between tillering loci in our genetic materials, in line with former observations of epistasis for domestication traits, including tillering (Stitzer and Ross-Ibarra, 2018). Finally, it should be noted that while shoot branching producing ears and tillering share obvious developmental similarities (e.g., both branching types originate from axillary buds at stem nodes), ear prolificacy and tillering did not correlate and did not show QTL overlap. The most likely explanation lies in the genetic architecture of the two traits in the lines tested in this study, i.e., no strong pleiotropic gene segregated. Another factor, partially connected with this, is that the parental line contributing ear prolificacy (Lo964) showed virtually no tillering, and the parental line contributing high tillering (Lo1016) showed no ear prolificacy, suggesting that each parental line possibly contributed relatively strong alleles at genes acting only on one of the two traits.
5. Conclusions
This study identified solid positive correlation between ear fasciation and KRN in an elite genetic background, and provided evidence that the correlation was at least partially due to pleiotropic genes at ear fasciation QTLs on chr. 5 and chr. 7 and affecting KRN. The fasciation effects and the correlated effect on KRN were confirmed across genetic backgrounds, making these QTLs an interesting source of yield-positive alleles. While candidate genes were identified at major QTLs, including the correspondence between qFas7-qKRN7.1 and ra1 on chr. 7, further work is required for candidate genes validation.
Analysis for ear prolificacy at a single node enabled us to identify four QTLs, of which one (on chr. 4) perfectly overlapped with an ear prolificacy QTL formerly identified in a maize × teosinte cross. Quite unexpectedly, we did not find correlation or QTL overlaps between ear prolificacy and tillering, although the two traits share obvious developmental basis.
Overall, our study provides clear entry points for the molecular dissection of important yield component traits, which should help both developing molecular markers for marker-assisted selection to be deployed in breeding programs and starting the procedures leading to cloning the genes underpinning the QTLs described and eventually their manipulation by engineering or editing.
Data availability statement
The raw data supporting the conclusions of this article will be made available by the authors, without undue reservation.
Author contributions
SS and RT conceived the project and acquired funding; KL, AT, SG, SR, CU and SS designed and curated field trials, collected phenotypic and genotypic data and analyzed the data; KL, RT and SS wrote the first manuscript draft. All authors contributed to the article and approved the submitted version.
Funding
This work was supported by KWS SAAT SE & Co. KGaA, Germany. KL has received research support from China Scholarship Council.
Acknowledgments
We gratefully acknowledge the technical contribution of Simona Corneti, Sandra Stefanelli and Stefano Vecchi. This work was supported by KWS SAAT SE & Co. KGaA, Germany.
Conflict of interest
Author CU was employed by the KWS SAAT SE & Co. KGaA.
The remaining authors declare that the research was conducted in the absence of any commercial or financial relationships that could be construed as a potential conflict of interest.
The authors declare that this study received funding from KWS SAAT SE & Co. KGaA. The funders had no role in data collection and analysis.
Publisher’s note
All claims expressed in this article are solely those of the authors and do not necessarily represent those of their affiliated organizations, or those of the publisher, the editors and the reviewers. Any product that may be evaluated in this article, or claim that may be made by its manufacturer, is not guaranteed or endorsed by the publisher.
Supplementary material
The Supplementary Material for this article can be found online at: https://www.frontiersin.org/articles/10.3389/fpls.2022.1017983/full#supplementary-material
References
Barazesh, S., McSteen, P. (2008). Barren inflorescence1 functions in organogenesis during vegetative and inflorescence development in maize. Genetics 179, 389–401. doi: 10.1534/genetics.107.084079
Bommert, P., Je, B. I., Goldshmidt, A., Jackson, D. (2013a). The maize gα gene COMPACT PLANT2 functions in CLAVATA signalling to control shoot meristem size. Nature 502, 555–558. doi: 10.1038/nature12583
Bommert, P., Nagasawa, N. S., Jackson, D. (2013b). Quantitative variation in maize kernel row number is controlled by the FASCIATED EAR2 locus. Nat. Genet. 45, 334–337. doi: 10.1038/ng.2534
Brand, U., Fletcher, J. C., Hobe, M., Meyerowitz, E. M., Simon, R. (2000). Dependence of stem cell fate in arabidopsis on a feedback loop regulated by CLV3 activity. Science 289, 617–619. doi: 10.1126/science.289.5479.617
Brown, P. J., Upadyayula, N., Mahone, G. S., Tian, F., Bradbury, P. J., Myles, S., et al. (2011). Distinct genetic architectures for male and female inflorescence traits of maize. PloS Genet. 7, e1002383. doi: 10.1371/journal.pgen.1002383
Chen, W., Chen, L., Zhang, X., Yang, N., Guo, J., Wang, M., et al. (2022). Convergent selection of a WD40 protein that enhances grain yield in maize and rice. Science 375, eabg7985. doi: 10.1126/science.abg7985
Chen, Q., Yang, C. J., York, A. M., Xue, W., Daskalska, L. L., DeValk, C. A., et al. (2019). TeoNAM: A nested association mapping population for domestication and agronomic trait analysis in maize. Genetics 213, 1065–1078. doi: 10.1534/genetics.119.302594
Chuck, G. S., Brown, P. J., Meeley, R., Hake, S. (2014). Maize SBP-box transcription factors unbranched2 and unbranched3 affect yield traits by regulating the rate of lateral primordia initiation. Proc. Natl. Acad. Sci. U. S. A. 111, 18775–18780. doi: 10.1073/pnas.1407401112
Cingolani, P., Platts, A., Wang, L. L., Coon, M., Nguyen, T., Wang, L., et al. (2012). A program for annotating and predicting the effects of single nucleotide polymorphisms, SnpEff: SNPs in the genome of drosophila melanogaster strain w1118; iso-2; iso-3. Fly (Austin) 6, 80–92. doi: 10.4161/fly.19695
Clark, S. E., Running, M. P., Meyerowitz, E. M. (1993). CLAVATA1, a regulator of meristem and flower development in arabidopsis. Development 119, 397–418. doi: 10.1242/dev.119.2.397
Dempewolf, H. (2010). Getting domestication straight: Ramosa1 in maize. Mol. Ecol. 19, 1267–1269. doi: 10.1111/j.1365-294X.2010.04563.x
Doebley, J., Stec, A., Gustus, C. (1995). Teosinte branched1 and the origin of maize: Evidence for epistasis and the evolution of dominance. Genetics 141, 333–346. doi: 10.1093/genetics/141.1.333
Du, Y., Liu, L., Peng, Y., Li, M., Li, Y., Liu, D., et al. (2020). UNBRANCHED3 expression and inflorescence development is mediated by UNBRANCHED2 and the distal enhancer, KRN4, in maize. PLoS Genet. 16, e1008764. doi: 10.1371/journal.pgen.1008764
Edgar, R. C. (2004). MUSCLE: A multiple sequence alignment method with reduced time and space complexity. BMC Bioinf. 5, 113. doi: 10.1186/1471-2105-5-113
Fan, C., Wu, Y., Yang, Q., Yang, Y., Meng, Q., Zhang, K., et al. (2014). A novel single-nucleotide mutation in a CLAVATA3 gene homolog controls a multilocular silique trait in brassica rapa l. Mol. Plant 7, 1788–1792. doi: 10.1093/mp/ssu090
Gallavotti, A., Malcomber, S., Gaines, C., Stanfield, S., Whipple, C., Kellogg, E., et al. (2011). BARREN STALK FASTIGIATE1 is an AT-hook protein required for the formation of maize ears. Plant Cell 23, 1756–1771. doi: 10.1105/tpc.111.084590
Gallavotti, A., Zhao, Q., Kyozuka, J., Meeley, R. B., Ritter, M. K., Doebley, J. F., et al. (2004). The role of barren stalk1 in the architecture of maize. Nature 432, 630–635. doi: 10.1038/nature03148
Hufford, M. B., Seetharam, A. S., Woodhouse, M. R., Chougule, K. M., Ou, S., Liu, J., et al. (2021). De novo assembly, annotation, and comparative analysis of 26 diverse maize genomes. Science 373, 655–662. doi: 10.1126/science.abg5289
Iliev, I., Kitin, P. (2011). Origin, morphology, and anatomy of fasciation in plants cultured in vivo and in vitro. Plant Growth Regul. 63, 115–129. doi: 10.1007/s10725-010-9540-3
Je, B. I., Gruel, J., Lee, Y. K., Bommert, P., Arevalo, E. D., Eveland, A. L., et al. (2016). Signaling from maize organ primordia via FASCIATED EAR3 regulates stem cell proliferation and yield traits. Nat. Genet. 48, 785–791. doi: 10.1038/ng.3567
Kellogg, E. A. (2022). Genetic control of branching patterns in grass inflorescences. Plant Cell 34, 2518–2533. doi: 10.1093/plcell/koac080
Kim, D. E., Jeong, J.-H., Kang, Y. M., Park, Y.-H., Lee, Y.-J., Kang, J.-S., et al. (2022). The impact of fasciation on maize inflorescence architecture. J. Plant Biol. 65, 87–98. doi: 10.1007/s12374-021-09342-1
Kitagawa, M., Jackson, D. (2019). Control of meristem size. Annu. Rev. Plant Biol. 70, 269–291. doi: 10.1146/annurev-arplant-042817-040549
Kumar, S., Stecher, G., Li, M., Knyaz, C., Tamura, K. (2018). MEGA X: Molecular evolutionary genetics analysis across computing platforms. Mol. Biol. Evol. 35, 1547–1549. doi: 10.1093/molbev/msy096
Li, H. (2011). A statistical framework for SNP calling, mutation discovery, association mapping and population genetical parameter estimation from sequencing data. Bioinformatics 27, 2987–2993. doi: 10.1093/bioinformatics/btr509
Li, H., Bradbury, P., Ersoz, E., Buckler, E. S., Wang, J. (2011). Joint QTL linkage mapping for multiple-cross mating design sharing one common parent. PLoS One 6, e17573. doi: 10.1371/journal.pone.0017573
Li, H., Durbin, R. (2009). Fast and accurate short read alignment with burrows-wheeler transform. Bioinformatics 25, 1754–1760. doi: 10.1093/bioinformatics/btp324
Li, S., Meng, S., Weng, J., Wu, Q. (2022). Fine-tuning shoot meristem size to feed the world. Trends Plant Sci. 27, 355–363. doi: 10.1016/j.tplants.2021.10.004
Liu, L., Du, Y., Huo, D., Wang, M., Shen, X., Yue, B., et al. (2015). Genetic architecture of maize kernel row number and whole genome prediction. Züchter Genet. Breed. Res. 128, 2243–2254. doi: 10.1007/s00122-015-2581-2
Liu, X., Galli, M., Camehl, I., Gallavotti, A. (2019). RAMOSA1 ENHANCER LOCUS2-mediated transcriptional repression regulates vegetative and reproductive architecture. Plant Physiol. 179, 348–363. doi: 10.1104/pp.18.00913
Li, X., Zhu, C., Yeh, C.-T., Wu, W., Takacs, E. M., Petsch, K. A., et al. (2012). Genic and nongenic contributions to natural variation of quantitative traits in maize. Genome Res. 22, 2436–2444. doi: 10.1101/gr.140277.112
Losa, A., Hartings, H., Verderio, A., Motto, M. (2011). Assesment of genetic diversity and relationships among maize inbred lines developed in Italy. Maydica 56, 95–104.
Lu, M., Xie, C.-X., Li, X.-H., Hao, Z.-F., Li, M.-S., Weng, J.-F., et al. (2011). Mapping of quantitative trait loci for kernel row number in maize across seven environments. Mol. Breed. 28, 143–152. doi: 10.1007/s11032-010-9468-3
Mei, X., Dong, E., Liang, Q., Bai, Y., Nan, J., Yang, Y., et al. (2021). Identification of QTL for fasciated ear related traits in maize. Crop Sci. 61, 1184–1193. doi: 10.1002/csc2.20435
Mendes-Moreira, P., Alves, M. L., Satovic, Z., Dos Santos, J. P., Santos, J. N., Souza, J. C., et al. (2015). Genetic architecture of ear fasciation in maize (Zea mays) under QTL scrutiny. PLoS One 10, e0124543. doi: 10.1371/journal.pone.0124543
Meng, L., Li, H., Zhang, L., Wang, J. (2015). QTL IciMapping: Integrated software for genetic linkage map construction and quantitative trait locus mapping in biparental populations. Crop J. 3, 269–283. doi: 10.1016/j.cj.2015.01.001
Opsahl-Ferstad, H. G., Le Deunff, E., Dumas, C., Rogowsky, P. M. (1997). ZmEsr, a novel endosperm-specific gene expressed in a restricted region around the maize embryo. Plant J. 12, 235–246. doi: 10.1046/j.1365-313X.1997.12010235.x
Ortez, O. A., McMechan, A. J., Hoegemeyer, T., Ciampitti, I. A., Nielsen, R., Thomison, P. R., et al. (2022). Abnormal ear development in corn: A review. Agron. J. 114, 1168–1183. doi: 10.1002/agj2.20986
Otegui, M. E., Bonhomme, R. (1998). Grain yield components in maize. Field Crops Res. 56, 247–256. doi: 10.1016/S0378-4290(97)00093-2
Pertea, G., Pertea, M. (2020). GFF utilities: GffRead and GffCompare. F1000Res 9, 304. doi: 10.12688/f1000research.23297.1
Portwood, J. L., 2nd, Woodhouse, M. R., Cannon, E. K., Gardiner, J. M., Harper, L. C., Schaeffer, M. L., et al. (2019). MaizeGDB 2018: The maize multi-genome genetics and genomics database. Nucleic Acids Res. 47, D1146–D1154. doi: 10.1093/nar/gky1046
Prakash, N. R., Zunjare, R. U., Muthusamy, V., Chand, G., Kamboj, M. C., Bhat, J. S., et al. (2019). Genetic analysis of prolificacy in “Sikkim primitive”–a prolific maize (Zea mays) landrace of north-Eastern himalaya. Plant Breed. 138, 781–789. doi: 10.1111/pbr.12736
Prakash, N. R., Zunjare, R. U., Muthusamy, V., Rai, M., Kumar, A., Guleria, S. K., et al. (2021). A novel quantitative trait loci governs prolificacy in ‘Sikkim primitive’ – a unique maize ( zea mays ) landrace of north-Eastern himalaya. Plant Breed. 140, 400–408. doi: 10.1111/pbr.12924
Rotili, D. H., Abeledo, L. G., Martínez Larrea, S., Maddonni, G. Á. (2022). Grain yield and kernel setting of multiple-shoot and/or multiple-ear maize hybrids. Field Crops Res. 279, 108471. doi: 10.1016/j.fcr.2022.108471
Rousselle, Y., Jones, E., Charcosset, A., Moreau, P., Robbins, K., Stich, B., et al. (2015). Study on essential derivation in maize: III. Selection and evaluation of a panel of single nucleotide polymorphism loci for use in European and north American germplasm. Crop Sci. 55, 1170–1180. doi: 10.2135/cropsci2014.09.0627
Salvi, S., Sponza, G., Morgante, M., Tomes, D., Niu, X., Fengler, K. A., et al. (2007). Conserved noncoding genomic sequences associated with a flowering-time quantitative trait locus in maize. Proc. Natl. Acad. Sci. U. S. A. 104, 11376–11381. doi: 10.1073/pnas.0704145104
Salvi, S., Tuberosa, R. (2015). The crop QTLome comes of age. Curr. Opin. Biotechnol. 32, 179–185. doi: 10.1016/j.copbio.2015.01.001
Schnable, P. S., Ware, D., Fulton, R. S., Stein, J. C., Wei, F., Pasternak, S., et al. (2009). The B73 maize genome: Complexity, diversity, and dynamics. Science 326, 1112–1115. doi: 10.1126/science.1178534
Schoof, H., Lenhard, M., Haecker, A., Mayer, K. F. X., Jürgens, G., Laux, T. (2000). The stem cell population of arabidopsis shoot meristems is maintained by a regulatory loop between the CLAVATA and WUSCHEL genes. Cell 100, 635–644. doi: 10.1016/S0092-8674(00)80700-X
Sigmon, B., Vollbrecht, E. (2010). Evidence of selection at the ramosa1 locus during maize domestication. Mol. Ecol. 19, 1296–1311. doi: 10.1111/j.1365-294X.2010.04562.x
Simmons, C. R., Weers, B. P., Reimann, K. S., Abbitt, S. E., Frank, M. J., Wang, W., et al. (2020). Maize BIG GRAIN1 homolog overexpression increases maize grain yield. Plant Biotechnol. J. 18, 2304–2315. doi: 10.1111/pbi.13392
Somssich, M., Je, B. I., Simon, R., Jackson, D. (2016). CLAVATA-WUSCHEL signaling in the shoot meristem. Development 143, 3238–3248. doi: 10.1242/dev.133645
Stitzer, M. C., Ross-Ibarra, J. (2018). Maize domestication and gene interaction. New Phytol. 220, 395–408. doi: 10.1111/nph.15350
Tanksley, S. D. (2004). The genetic, developmental, and molecular bases of fruit size and shape variation in tomato. Plant Cell 16 Suppl, S181–S189. doi: 10.1105/tpc.018119
Trotochaud, A. E., Hao, T., Wu, G., Yang, Z., Clark, S. E. (1999). The CLAVATA1 receptor-like kinase requires CLAVATA3 for its assembly into a signaling complex that includes KAPP and a rho-related protein. Plant Cell 11, 393–406. doi: 10.1105/tpc.11.3.393
Van Ooijen, J. W. (2009). MapQTL 6, software for the mapping of quantitative trait loci in experimental populations of diploid species. Ed. Kyazma, B. V. (Wageningen, Netherlands: Kyazma).
Vollbrecht, E., Springer, P. S., Goh, L., Buckler, E.S., IV, Martienssen, R. (2005). Architecture of floral branch systems in maize and related grasses. Nature 436, 1119–1126. doi: 10.1038/nature03892
Wang, Z., Gao, J., Li, Y., Razia sultana, J., Luan, Y., Mu, C., et al. (2021). Combined linkage analysis and genome-wide association study reveal QTLs and candidate genes conferring genetic control of prolificacy trait in maize. Preprints. doi: 10.20944/preprints202101.0185.v1
Waterhouse, A. M., Procter, J. B., Martin, D. M. A., Clamp, M., Barton, G. J. (2009). Jalview version 2–a multiple sequence alignment editor and analysis workbench. Bioinformatics 25, 1189–1191. doi: 10.1093/bioinformatics/btp033
Wickham, H., Averick, M., Bryan, J., Chang, W., McGowan, L., François, R., et al. (2019). Welcome to the tidyverse. J. Open Source Software 4, 1686. doi: 10.21105/joss.01686
Wills, D. M., Whipple, C. J., Takuno, S., Kursel, L. E., Shannon, L. M., Ross-Ibarra, J., et al. (2013). From many, one: Genetic control of prolificacy during maize domestication. PLoS Genet. 9, e1003604. doi: 10.1371/journal.pgen.1003604
Wu, Q., Xu, F., Jackson, D. (2018). All together now, a magical mystery tour of the maize shoot meristem. Curr. Opin. Plant Biol. 45, 26–35. doi: 10.1016/j.pbi.2018.04.010
Xiao, L., Li, X., Liu, F., Zhao, Z., Xu, L., Chen, C., et al. (2018). Mutations in the CDS and promoter of BjuA07.CLV1 cause a multilocular trait in brassica juncea. Sci. Rep. 8. doi: 10.1038/s41598-018-23636-4
Xu, C., Liberatore, K. L., MacAlister, C. A., Huang, Z., Chu, Y.-H., Jiang, K., et al. (2015). A cascade of arabinosyltransferases controls shoot meristem size in tomato. Nat. Genet. 47, 784–792. doi: 10.1038/ng.3309
Yang, C. J., Samayoa, L. F., Bradbury, P. J., Olukolu, B. A., Xue, W., York, A. M., et al. (2019). The genetic architecture of teosinte catalyzed and constrained maize domestication. Proc. Natl. Acad. Sci. U. S. A. 116, 5643–5652. doi: 10.1073/pnas.1820997116
Zhang, Y., Jiao, F., Li, J., Pei, Y., Zhao, M., Song, X., et al. (2022). Transcriptomic analysis of the maize inbred line Chang7-2 and a large-grain mutant tc19. BMC Genomics 23, 4. doi: 10.1186/s12864-021-08230-9
Zhang, D., Sun, W., Singh, R., Zheng, Y., Cao, Z., Li, M., et al. (2018). GRF-interacting factor1 regulates shoot architecture and meristem determinacy in maize. Plant Cell 30, 360–374. doi: 10.1105/tpc.17.00791
Keywords: ear fasciation, ear prolificacy, maize, QTL mapping, tillering, yield components
Citation: Li K, Tassinari A, Giuliani S, Rosignoli S, Urbany C, Tuberosa R and Salvi S (2023) QTL mapping identifies novel major loci for kernel row number-associated ear fasciation, ear prolificacy and tillering in maize (Zea mays L.). Front. Plant Sci. 13:1017983. doi: 10.3389/fpls.2022.1017983
Received: 12 August 2022; Accepted: 14 December 2022;
Published: 10 January 2023.
Edited by:
Rogelio Santiago Carabelos, Spanish National Research Council (CSIC), SpainReviewed by:
Pedro Revilla, Biological Mission of Galicia, Spanish National Research Council (CSIC), SpainAna Nikolić, Maize research Institute Zemun Polje, Serbia
Copyright © 2023 Li, Tassinari, Giuliani, Rosignoli, Urbany, Tuberosa and Salvi. This is an open-access article distributed under the terms of the Creative Commons Attribution License (CC BY). The use, distribution or reproduction in other forums is permitted, provided the original author(s) and the copyright owner(s) are credited and that the original publication in this journal is cited, in accordance with accepted academic practice. No use, distribution or reproduction is permitted which does not comply with these terms.
*Correspondence: Silvio Salvi, c2lsdmlvLnNhbHZpQHVuaWJvLml0