 Yongjuan Li1†Boyong Liao1†Yi Wang1Huihua Luo1Shimin Wang1
 Caiqin Li1Wenpei Song1
 Kunchang Zhang1Boqun Yang2Shaoqiang Lu2
 Bipei Zhang1*Yongquan Li1*
- 1College of Horticulture and Landscape Architecture, Zhongkai University of Agriculture and Engineering, Guangzhou, China
- 2State-owned Xiaokeng Forest Farm in Qujiang District of Shaoguan City, Shaoguan, China
Camellia fruit is a woody edible oil source with a recalcitrant pericarp, which increases processing costs. However, the relevance of pericarp thickness variations in Camellia species remains unclear. Therefore, this study aimed to identify pericarp differences at the metabolic and transcription levels between thick-pericarp Camellia drupifera BG and thin-pericarp Camellia oleifera SG. Forty differentially accumulated metabolites were screened through non-targeted UHPLC-Q-TOF MS-based metabolite profiling. S-lignin was prominently upregulated in BG compared with SG, contributing to the thick pericarp of BG. KEGG enrichment and coexpression network analysis showed 29 differentially expressed genes associated with the lignin biosynthetic pathway, including 21 genes encoding catalysts and 8 encoding transcription factors. Nine upregulated genes encoding catalysts potentially led to S-lignin accumulation in BG pericarp, and transcription factors NAC and MYB were possibly involved in major transcriptional regulatory mechanisms. Conventional growth-related factors WRKYs and AP2/ERFs were positively associated while pathogenesis-related proteins MLP328 and NCS2 were negatively associated with S-lignin content. Thus, Camellia balances growth and defense possibly by altering lignin biosynthesis. The results of this study may guide the genetic modifications of C. drupifera to optimize its growth–defense balance and improve seed accessibility.
Introduction
Camellia drupifera, a newly identified Camellia species serving as a woody edible oil crop similar to oil palm, olive, and coconut (Long et al., 2008; Wang et al., 2014; Chen et al., 2015), is grown specifically in South China and genetically proximal to Camellia oleifera (Flora of China, 1994; Qin et al., 2018). Oil extracted from Camellia seeds is rich in monounsaturated fatty acids and other bioactive metabolites with anticancer, antioxidant, and immunity-enhancing effects, thereby becoming a healthy high-grade edible oil in the global market these days (Suealek et al., 2021; Liu et al., 2022). Increased attention has been drawn to cost-efficient oil production from seeds that are embedded in dry fruits or capsules. The capsule of Camellia is anatomically composed of seeds, pericarp, and carpel bundles. Dry dehiscent capsules are split via three to five valves, with each section holding one to four seeds when the fruit is ripe (Patrick, 1997; Ming, 2007; Orel and Wilson, 2012).
Oil-rich seeds are under firm protection of pericarps against external abiotic and biotic stresses before maturation; however, the recalcitrance of woody pericarps (a matrix of lignocellulosic materials) increases processing costs for seed accessibility (Li et al., 2016). Therefore, pericarp thickness has been considered an economic structural trait of Camellia species, where thin ones are favored over thick ones.
Tan et al. (2020) identified the constituents of woody pericarps in C. oleifera Abel to be 15.8% cellulose, 23.6% hemicellulose, 8.8% lignin, and others, which include polymers deposited in secondary cell walls. Lignin polymers cross-link with cellulose microfibrils and hemicellulose molecules via side chains, forming a rigid cell skeleton and rendering the pericarp recalcitrant (Reddy et al., 2005; Chen and Dixon, 2007; Henry, 2010).
Different amounts and/or compositions of lignocellulosic constituents produce distinct pericarp thicknesses in Camellia species. However, the relevance of pericarp thickness variations in Camellia species and the underlying regulatory mechanisms remain unclear, complicating the genetic modification of this trait. Genes involved in the biosynthesis of some components, particularly cellulose and lignin, have been characterized in other plants.
The pericarp of C. drupifera capsules is notably thicker than that of C. oleifera. Both species are endemic to South China, providing ideal materials for investigating the relevance of pericarp thickness variations in Camellia species. Apart from pericarp thickness, some coupled properties related to growth and defense have also aroused wide concern. For instance, thick pericarps are usually accompanied by tall trunks and large capsules but weak defense, whereas trees with thin pericarps always exhibit strong defense but dwarf trunks and small capsules (Yang et al., 2015; Hong et al., 2016).
The present study aimed to compare the metabolic and transcriptional profiles of capsules from thick-pericarp C. drupifera BG (hereafter BG) and thin-pericarp C. oleifera SG (hereafter SG) and elucidate the mechanism by which pericarp thickness influences growth–defense tradeoffs in Camellia. In the current study, we found that syringyl lignin (S-lignin) was significantly upregulated in BG compared to SG, resulting in a thicker peel in BG. These results provide insights into the molecular basis of pericarp thickening in Camellia species. This study may guide the genetic modifications of C. drupifera to optimize its growth–defense balance and facilitate seed accessibility.
Materials and methods
Plant materials and sample preparation
Thick-pericarp C. drupifera BG and thin-pericarp C. oleifera SG were planted in the Boluo Forest Farm and the Xiaokeng Forest Farm Guangdong Province, China, under the same growth conditions. Fruit samples from individual trees were collected randomly from different branches in November 2020. Fresh capsules were dissected using a blade on ice bed, and their pericarps were separated manually while wearing sterile gloves, frozen immediately in liquid nitrogen, and then stored at -80°C for RNA extraction and metabolite analysis. Three biological replicates of each sample were used for RNA sequencing, and eight biological replicates were used for metabolic profiling. In the present study, the pericarp samples of the BG and SG capsules were abbreviated as BG_1, BG_2, BG_3… SG_1, SG_2, SG_3…
Capsule phenotypes between BG and SG
The transverse, longitudinal, and horizontal diameters and pericarp thickness of 25 capsules were measured with a vernier caliper, and the fresh weight of seeds, fresh weight of pericarps, and weight of a single capsule were determined. The pulp at the transverse diameter was selected for the determination of pericarp thickness. A comparative analysis of the capsule phenotypic characteristics of BG and SG was performed using Excel software.
Cellulose, hemicellulose, and lignin contents between two species of Camellia L.
The cellulose and hemicellulose contents of 0.5 g samples were prepared and quantified as previously described by Yan et al. (Yan, 2020). Lignin was assayed by derivatization with acetyl-bromide-glacial acetic acid (Barnes and Anderson, 2017). The pericarp was ground and filtered through a 60-mesh screen, and 5 mg of pericarp powder was added to 10 mL of 10% acetyl bromide–glacial acetic acid solution. and then, 500 μL of 70% perchloric acid was added and heated at 50°C for 30 min. After cooling, the reaction was terminated by mixing 10 mL of 2 mol/L NaOH and 10 mL of glacial acetic acid. Subsequently, the samples were centrifuged again at 8000 × r for 5 min. Absorbance was subsequently obtained at 280 nm using glacial acetic acid as a control.
Toluidine blue reagent staining
For lignin characterization, the pericarps were stained with toluidine blue O (TBO) reagent (Soleibo Technology Co., Ltd., Beijing, China) as described previously (Jia et al., 2015). Pericarp specimens were cut from the middle part of the capsules and then soaked overnight in 70% formaldehyde alcohol acetic acid fixative solution. Paraffin sections were immediately stained with 0.05% (w/v) TBO for 10 min. The specimens were washed, dehydrated with an ethanol series of 75%–95%, and then embedded in neutral resin. The samples were sectioned using an ultrathin semiautomatic microtome (Lerca-RM2235, Germany) to prepare paraffin sections in accordance with the manufacturer’s instructions. Micrographs were taken under a Leica microscope (DM2000 LED, Germany).
Untargeted metabolic analysis
Freeze-dried samples were crushed using the liquid-nitrogen grinding method. Powdered tissue (100 mg) was dissolved in 1.0 mL of cold methanol/acetyl cyanide (50:50 v/v) and blended twice by low-temperature ultrasonic treatment for 30 min. Extraction was stable at -20°C for 60 min, and then the homogenate was centrifuged at 14,000 × g for 20 min at 4°C. The supernatant was used for Liquid Chromatography-Mass spectrometry.
Metabolites were analyzed using an ultra-performance liquid chromatography system (UHPLC, Agilent 1290 Infinity LC system, USA) equipped with a HILIC column (1.7 μm, 2.1 mm× 100 mm column). The column temperature was maintained at 25°C, the flow rate was 0.3 mL/min, and the injection volume was 2 μL. Water with 0.04% ammonium acetate (v/v) and 0.04% ammonia and acetonitrile were used as the compositions of mobile phases A and B, respectively. Gradient elution was performed as follows: 0–1 min, 85% B (v:v); 1–12 min, 85%–65% (v:v); and 12–12.1 min, 65%–40% B (v:v), 12.1–15 min, 40%–85%, 15.1–20 min, 85% B, with automatic injection at 4°C during the whole analysis.
Primary and secondary spectra of the samples were collected using an AB Triple TOF 6600 mass spectrometer (AB Sciex, Concord, Canada). The ESI source conditions after HILIC chromatographic separation were as follows: Ion Source Gas1, 60 psi; Ion Source Gas2, 60 psi; curtain gas, 60 psi; source temperature, 600°C; Ion Sapary Voltage Floating ±5500 V (positive and negative modes); TOF MS scan m/z range, 60–1000 Da; product ion scan m/z range, 25–1000 Da, TOF MS scan accumulation time, 0.20 s/spectra; product ion scan accumulation time, 0.05 s/spectra; and declustering potential (DP), ± 60 V (positive and negative modes).
Raw MS data (.wiff scan files) were converted to mzML files using ProteoWizard (Chambers et al., 2012). The peak alignment, retention time alignment, and peak area were processed using XCMS software. The following parameters were used for peak picking: centWave, m/z = 25 ppm; peak width, c (10, 60); and prefilter, c (10, 100). The following parameters were used for peak grouping: bw, 5; mzwid, 0.025; and minfrac, 0.5. Metabolite identification was based on an in-house database at Shanghai Applied Protein Technology Co. Ltd. (Shanghai, China) established with authentic standards. After normalization to total peak intensity, the processed data were uploaded into SIMCA-P14.1 (Umetrics, Umea, Sweden) for mode identification, where they were subjected to multivariate data analyses, including principal component analysis (PCA) and orthogonal partial least squares discriminant analysis (OPLS-DA). The variable importance in projection (VIP) scores of each variable within the OPLS-DA model were calculated to indicate their contribution to their classification.
Transcriptome sequence processing and annotation
Total RNA was extracted from the BG and SG capsules by using TRIzol Reagent (Magen, Guangzhou, China) and purified using the AMPure XP system (Beckman, USA). Paired-end libraries were prepared using an ABclonal mRNA-seq Lib Prep Kit (Abclonal, China) following the manufacturer’s instructions. Sequencing was performed using an Illumina NovaSeq 6000 instrument (Shanghai Applied Protein Technology Co. Ltd., Shanghai, China).
Raw data in fastq format were processed using Perl scripts. Clean reads were obtained by removing adapter sequences, low-quality reads (number of lines with a string quality value less than or equal to 25 accounts for more than 60% of the entire reading), and reads with N ratio (base information cannot be determined) greater than 5%. High-quality reads were assembled into contigs, transcripts, and unigenes by using Trinity software (http://trinityrnaseq.sourceforge.net/).
FeatureCounts (http://subread.sourceforge.net/) was used to count the number of reads mapped to each gene. Then, the FPKM of each gene was calculated based on the length of the gene and the read count mapped to this gene. Differential expression analysis was performed using DESeq2 (http://bioconductor.org/packages/release/bioc/html/DESeq2.html) (Love et al., 2014).
For functional annotation and classification, the assembled transcriptome sequences were compared to obtain annotation information in each of the five following databases: NR (http://ftp.ncbi.nlm.nih.gov/blast/db/) (Deng et al., 2006), Swiss-Prot (http://web.expasy.org/docs/swiss-prot.guideline) (Rolf et al., 2004), Pfam (http://pfam.xfam.org/) (Finn et al., 2014), gene ontology (GO, http://www.geneontology.org) (Ashburner et al., 2000), and Kyoto Encyclopedia of Genes and Genomes (KEGG, http://www.genome.jp/kegg/) (Minoru et al., 2016).
GO and KEGG enrichment analyses were conducted using the clusterProfiler R software package to explain the functional enrichment of DEGs and clarify the differences between samples at the gene function level. The GO or KEGG functions were significantly enriched when P < 0.05.
Coexpression analysis of the lignin biosynthetic pathways
The reads count from RNA-seq reads and the sinapyl alcohol value from metabolome data were calculated correlation and p-value using the R platform (version 4.0.5). Then, lignin-related metabolic compounds and catalytic enzymes in Camellia and other plants were investigated from NR, Pfam, Swissprot, GO and KEGG databases and extracted from the calculated results. Co-expression network patterns were visualized by cytoscape (version 3.9.1, Shannon et al., 2003).
Quantitative real-time polymerase chain reaction analysis of selected genes
Single-stranded cDNAs were synthesized from the RNAs using the PrimeScript™ RT reagent Kit, and quantitative real-time PCR was performed using ViiA7 (Thermo Fisher Scientific, USA) and Hieff™ qPCR SYBR Green Master Mix (Yisheng Biotechnology, Shanghai, China). Primers were designed by Bioruqi (Guangzhou, China) and synthesized by GENEWIZ (Suzhou, China). The glyceraldehyde-3-phosphate dehydrogenase gene (GAPDH) was used as an internal reference, and the relative expression was calculated using the 2ΔCt method. The standard errors of the means among the replicates were calculated. All quantitative real-time polymerase chain reaction (qRT-PCR) analyses were performed in three biological replications, respectively. The expression patterns of eight transcripts were monitored, and detailed information about the unigene IDs, fold change (FC), and primer pairs designed in this study are presented in Supplementary Table S1.
Single-copy orthologous gene calling and phylogenetic analysis
Raw transcriptome data from BG and SG were uploaded to the SRA database (https://www.ncbi.nlm.nih.gov/sra). Other raw transcriptome data of five sibling Camellia species, including C. japonica (SRR17275277), C. chekiangoleosa (SRR15420647), C. petelotii (SRR17460028), C. azalea (SRR7120561), and C. oleifera (SRR17365493), were downloaded from the SRA database. Paired-end sequencing datasets were first trimmed with Trimmomatic (0.39) (http://www.usadellab.org/cms/?page=trimmomatic) using default settings, and then quality checks were performed using fastQC (0.11.9) (https://www.bioinformatics.babraham.ac.uk/projects/fastqc/) to confirm the removal of adapters and low-quality regions. The obtained sequences were then assembled using Trinity (2.9.1). Protein sequences were deduced using ORFfinder (https://ftp.ncbi.nlm.nih.gov/genomes/TOOLS/ORFfinder). All parameters were set to their default values. Single-gene orthologs were identified using OrthoFinder to cluster the protein sequences from the seven species (Emms and Kelly, 2019). Multiple sequence alignments were performed based on the amino acid sequences using the alignment tool MUSCLE with default parameter settings. Maximum-likelihood phylogenetic trees were constructed using MEGA7 software with the JTT model (Sudhir et al., 2016). In the phylogenetic tree, bootstrap supporting values below 50 were generally regarded as unreliable and are not shown. The 334 single-copy nuclear genes were conserved in eggNOG (http://eggnog5.embl.de/#/app/home) (Huerta-Cepas et al., 2019). The pictures of other Camellia species are from the plant plus of China (http://www.iplant.cn).
Results
Comparison of capsule phenotypes between BG and SG
We quantitatively characterized and compared the pericarp thicknesses of BG and SG capsules at mature developmental stages. As shown in Figures 1A, B, the BG capsules had a thicker pericarp than the SG capsules. Further quantification of capsule size in terms of cross and longitudinal diameters, pericarp thickness, and pericarp proportion supported the different capsule phenotypes observed between the BG and SG samples (Figures 1C, D). Moreover, lignin content, which contributes to mechanical support, was approximately 30% higher in the BG capsules than in the SG capsules. Although cellulose and hemicellulose were the main components of secondary cell walls, their contents did not significantly differ between the BG and SG capsules (Figure 1E). These results indicate that the higher lignin deposition in the capsule cell walls of BG than those of SG is solely responsible for the thicker pericarps of BG than SG.
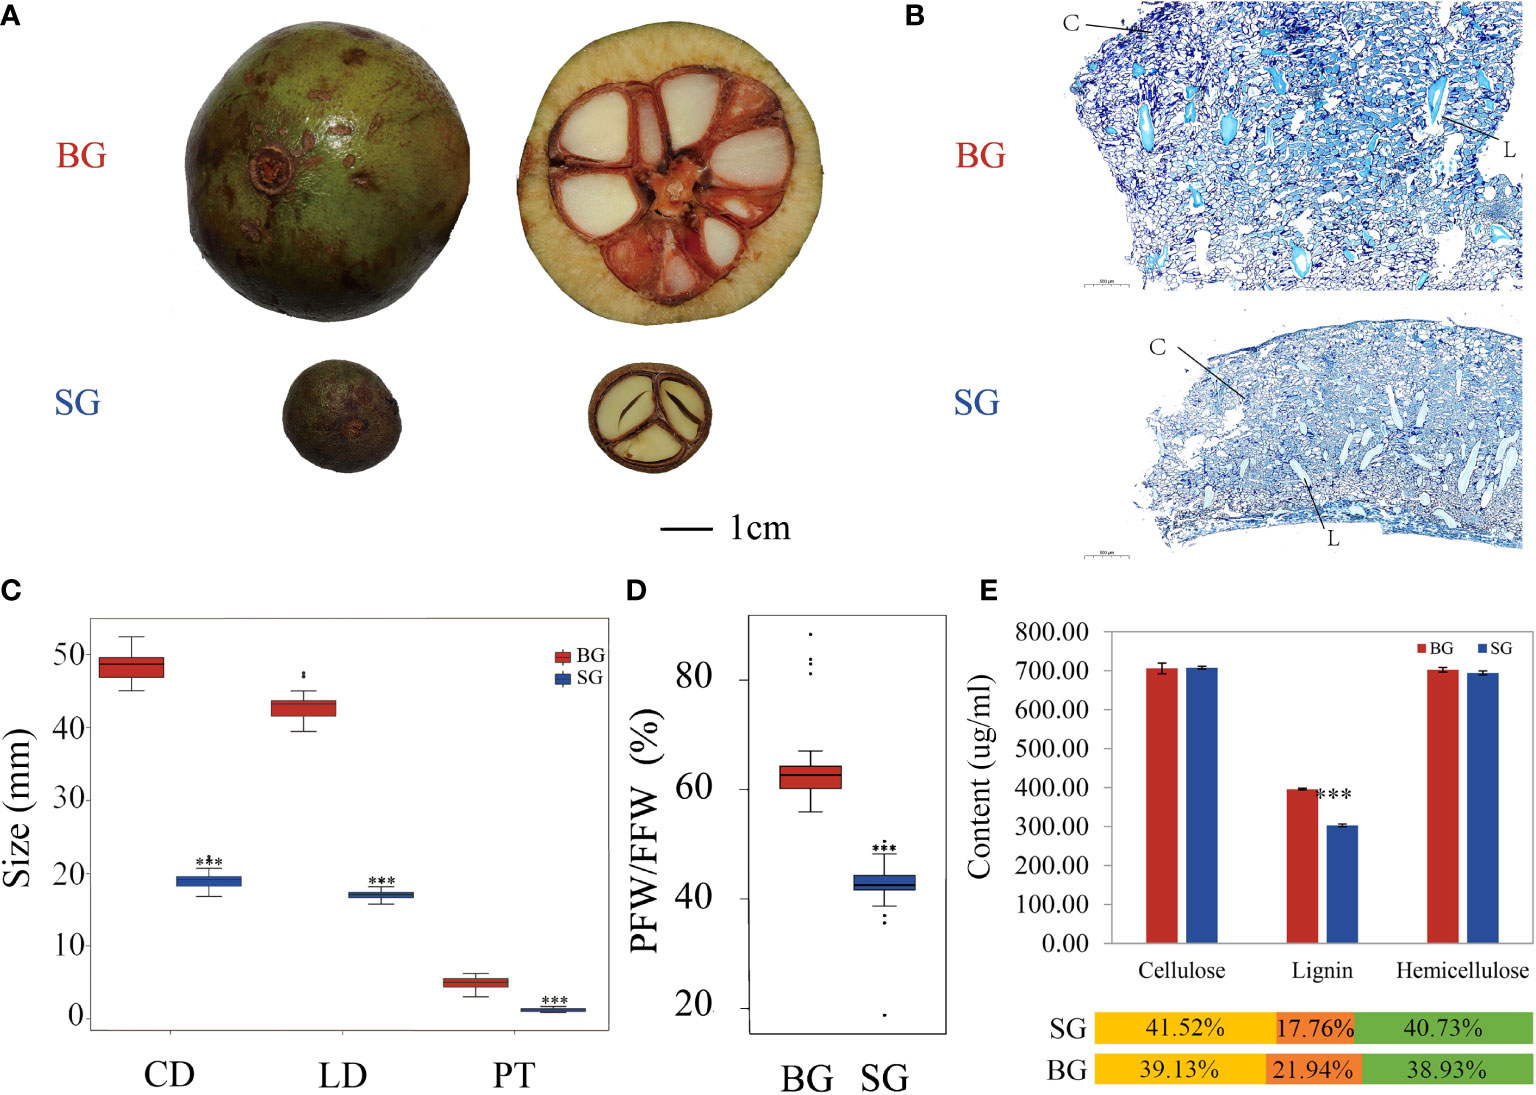
Figure 1 Comparison of fruit phenotypic characteristics between BG and SG. (A) Capsules of C drupifera (BG) and C oleifera Hu (SG); (B) Microscopic analyses of pericarps from BG and SG capsules; L, lignified cell wall; C, cellulose cell wall. (C) Comparison of cross diameter (CD), longitudinal diameter (LD), and pericarp thickness (PT) between BG and SG (D) Rate of pericarp fresh weight (PFW) to fruit fresh weight (FFW) between SG and BG. (E) Cellulose, lignin, and hemicellulose contents of BG and SG. Asterisks indicate a significant difference compared with BG; ***P < 0.001, Student’s t-test; Yellow: cellulose, orange: lignin, and green: hemicellulose.
Identification of pericarp thickness-related metabolites in BG and SG
We analyzed the metabolite profiles of the BG and SG capsules and determined their correlation with pericarp thickness. Nontargeted UHPLC-Q-TOF MS-based metabolite profiling in positive and negative ion modes revealed 318 metabolites. These metabolites were classified into eight groups and included eight major compounds in the monolignol biosynthetic pathway (Figure 2B and Supplementary Table S2).
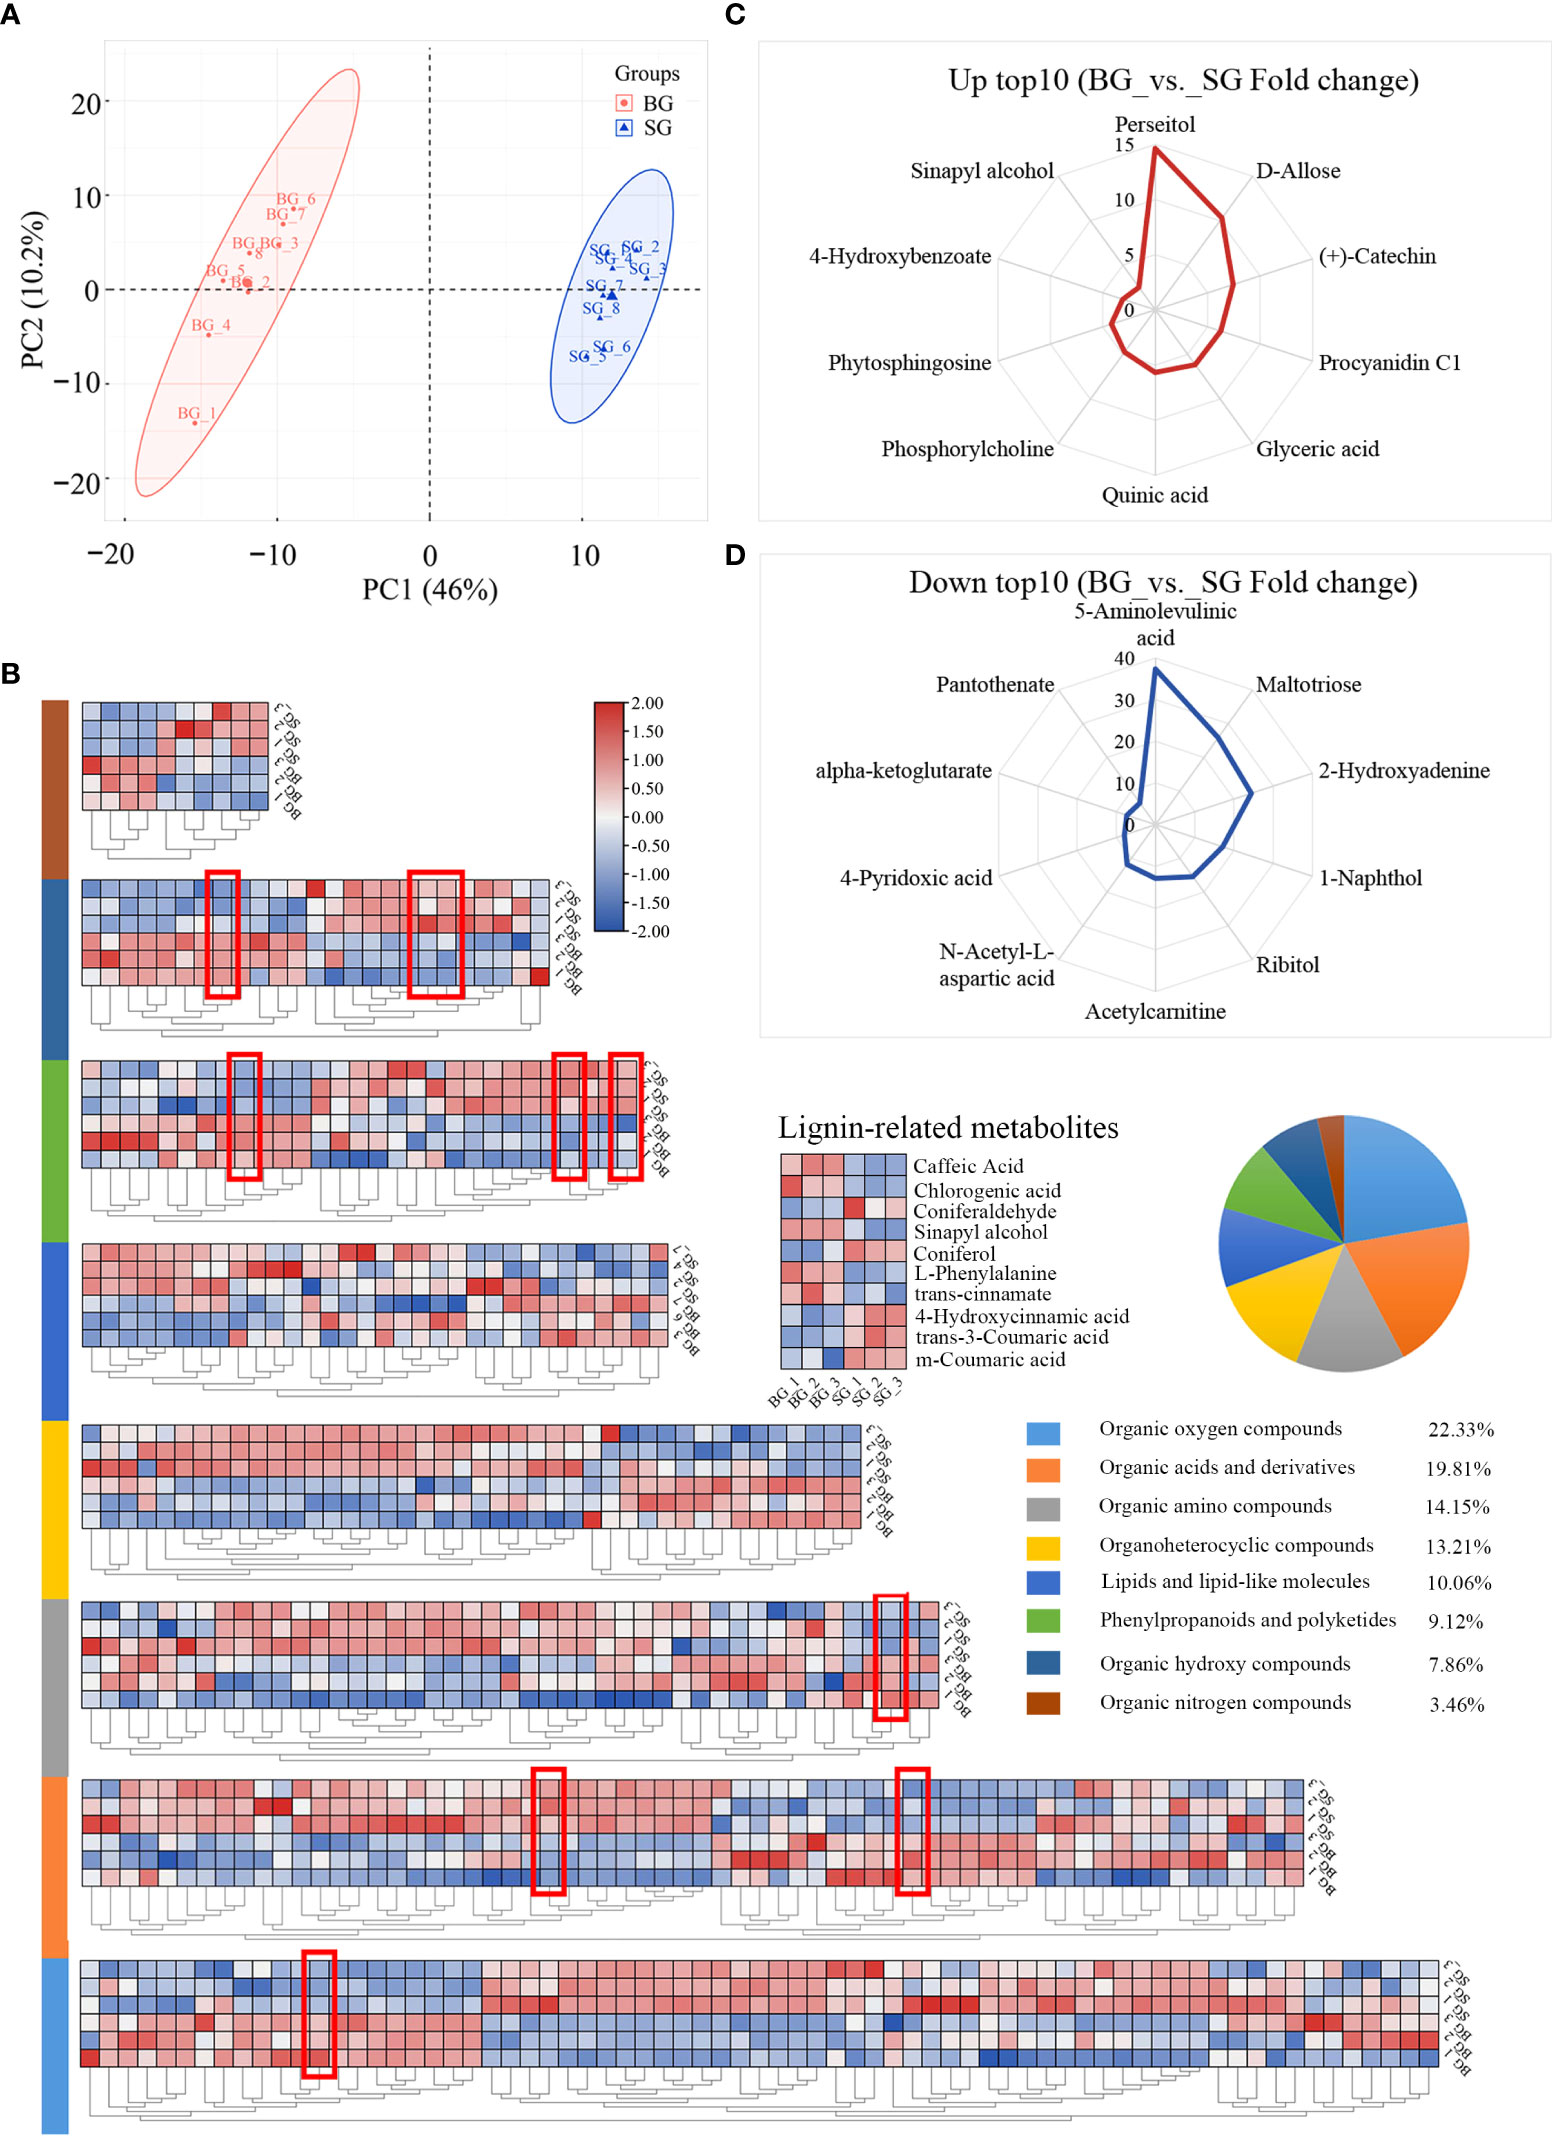
Figure 2 Component analysis of the identified metabolites based on UHPLC-Q-TOF MS. (A) Principal component analysis (PCA) showing all samples. (B) Heat map of the identified metabolite expression levels and pie chart showing the superclass of these metabolites between BG and SG. (C) Top 10 metabolites with upregulated expression in BG vs. SG. (D) Top 10 metabolites with upregulated expression in SG vs. BG.
The first component of the PCA results (46%) predominantly reflected the difference between SG and BG, and the second component (10.2%) primarily indicated within-group differences, which separated the BG and SG samples in terms of metabolite composition and content (Figure 2A). The differentially accumulated metabolites (DAMs) were represented based on variable importance in the projection score (VIP > 1.0), fold change (FC > 2.0 or FC < 0.5), and p-value (p < 0.05. To eliminate the effects of quantity on pattern recognition, we applied Z-score transformation of the peak areas for each metabolite and subsequently performed hierarchical cluster analysis. As shown in Figures 2B–D, sinapyl alcohol (S-unit, one generic primary monolignol) and organic oxygen compounds were the most upregulated metabolites while organic acids and derivatives were the most downregulated metabolites in the BG capsules. Despite the fact that coniferyl alcohol (G-unit) and coumarate conjugate (H-unit) were also viewed as essential monomers of lignin, the former (G-unit) showed no significant difference in amount between the BG and SG capsules, and the latter (H-unit) was undetectable in both species (Supplementary Table S2). Sugar units, as typical monomers of cellulose and hemicellulose, were at similar levels in the two species, suggesting that the accumulation of S-lignin was the key factor contributing to the distinct pericarp thickness of the two species.
Transcriptome profiles of BG and SG and their phylogenetic relationship
The transcriptome profiles of BG and SG were obtained and compared to investigate the transcriptional regulation of DAMs in pericarps from the BG and SG samples. Approximately 245.07 Gb of raw data was generated, and the statistics of the sequencing libraries are summarized in Table 1. Unique-mapped reads were used to calculate the expression levels in transcripts per million (Wagner et al., 2012; Vera Alvarez et al., 2018). The resulting sets yielded 2.5 × 10⁸ clean reads, with over 60% mapped to the assembly transcripts from RNA-seq data in non-model organisms (Table 1). A total of 337,768 protein-coding genes were predicted in NR, Swissprot, PFAM, GO, and KO, of which 8974 DEGs; 4322 upregulated and 4652 downregulated) were identified with the criteria of a false discovery rate (FDR) < 0.05 and a |log2FC | > 1 (Figure 3A and Supplementary Table S3).
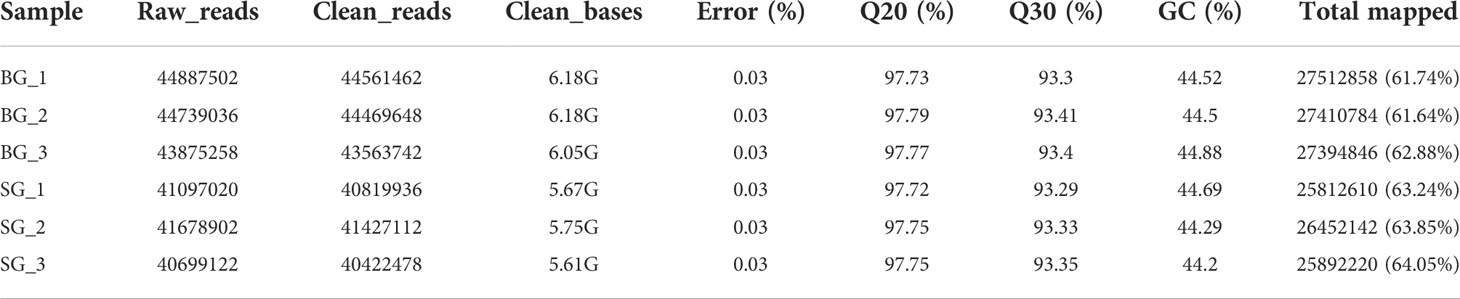
Table 1 Data quality of each sample in BG and SG.
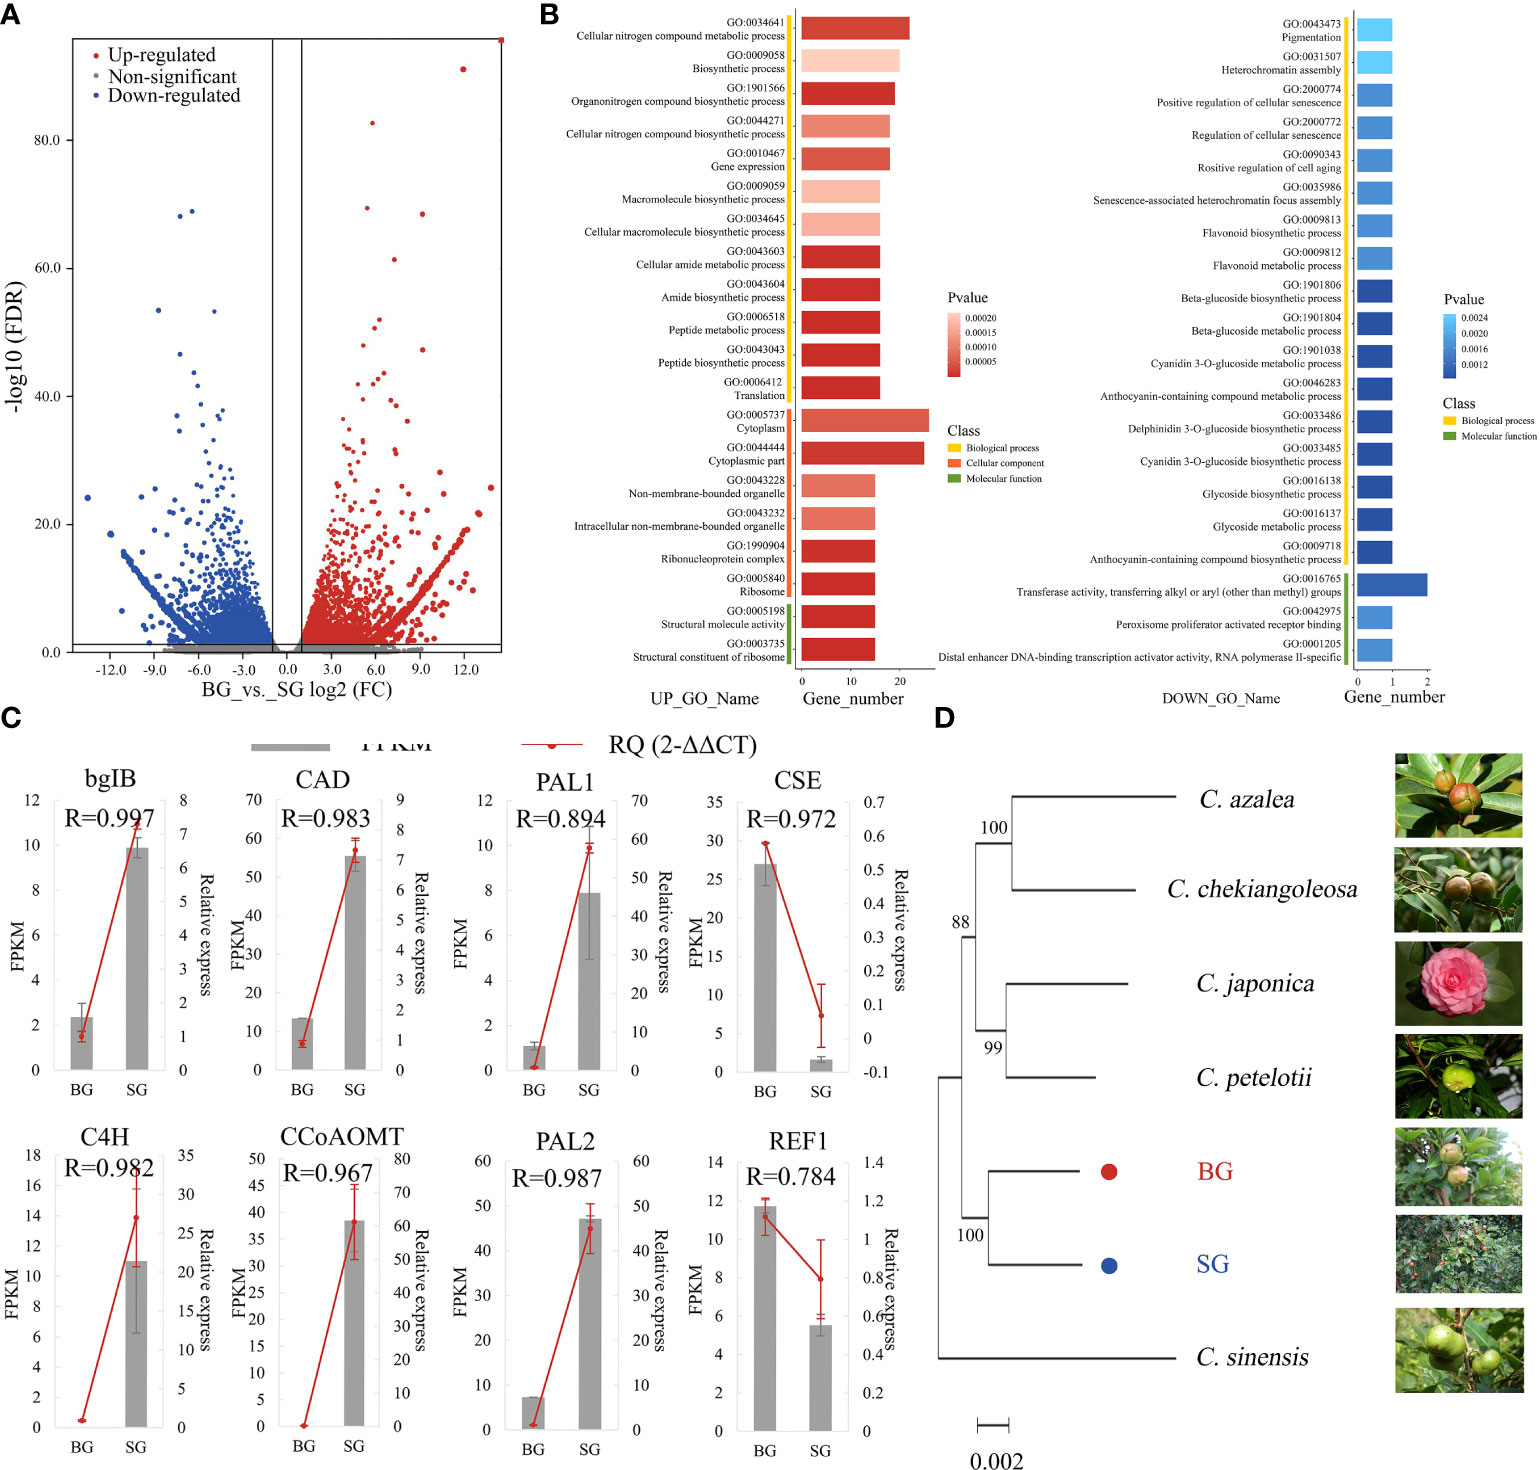
Figure 3 Transcriptome data comparison between BG and SG. (A) Volcano plot analysis of differentially expressed genes (DEGs), |log2(FC)|>1; (B) Gene Ontology (GO) functional annotation terms (UP_TOP 20 and DOWN_TOP 20) (C) Comparison of the expression levels of eight lignin genes in FPKM and RT-PCR. Error bars represent SE. (D) Molecular phylogenetic analysis by the maximum likelihood method of single-gene orthologs in seven Camellia species.
GO functional enrichment analyses of DEGs were assigned to biological processes (72.2%), molecular functions (87.0%), and cellular components (64.8%). Among the biological processes, metabolic and macromolecular biosynthetic processes were highlighted. Meanwhile, most of the DEGs were enriched in “structural molecule activity” and “structural constituent of ribosome” molecular function terms toward structural molecular activity, which is consistent with the DAMs profile (Figure 3B and Supplementary Table S4). qRT-PCR results validated the RNA-seq results obtained using eight monolignol biosynthesis-related DEGs. The expression patterns of these genes obtained using qRT-PCR were consistent with those determined by RNA-seq (Figure 3C). For the nuclear Camellia phylogeny, we used transcriptomic sequences of BG and SG and combined them with public transcriptome datasets from six other Camellia species to identify 334 conserved single-copy nuclear genes (Supplementary Table S5). The smallest gene set was then subjected to phylogenetic analysis using the maximum-likelihood method, which highly supported a divergence of BG and SG after the most recent common ancestor of C. oleifera, suggesting the feasibility of frequent interspecific hybridization and genetic introgression between the two species during the evolution and domestication of Camellia (Figure 3D).
Identification of novel transcription factors that regulate lignin metabolism in Camellia
To provide an overview of the DAMs and DEGs involved in the lignin biosynthetic pathway, we mapped the metabolic compounds and catalytic enzymes onto the pathway based on the KEGG database. A moderate proportion of the genes and compounds involved in the lignin biosynthetic pathway, including precursors, intermediates, end products, and sequential enzymes, were distinct between the SG and BG capsules (Figure 4A). Based on the KEGG database, we identified 11 catalytic enzymes in Camellia that are potentially involved in the biosynthetic pathway to the major monolignol precursors of lignin. The expression levels of genes encoding p-coumarate 3-hydroxylase (C3’H), caffeoyl shikimate esterase (CSE), and caffeic acid O-methyltransferase (COMT) were increased in BG, leading to a predominance of S-units (81.4%), accompanied by low levels of G-units (18.6%) despite reduced expression levels of cinnamyl alcohol dehydrogenase (CAD), cinnamate 4-hydroxylase (C4H), and L-phenylalanine ammonia-lyase (PAL). The oxidative polymerization of monolignols is catalyzed by peroxidases (PODs, using hydrogen peroxide) and laccases (LACs, using molecular oxygen) (Liu et al., 2018; Dixon and Barros, 2019). We also identified four POD genes and one LAC gene in Camellia that were homologous to AtPRX and AtLAC15 in Arabidopsis, which might enhance monolignol bulk polymerization in BG through their upregulated expression (Figure 4A and Supplementary Table S6).
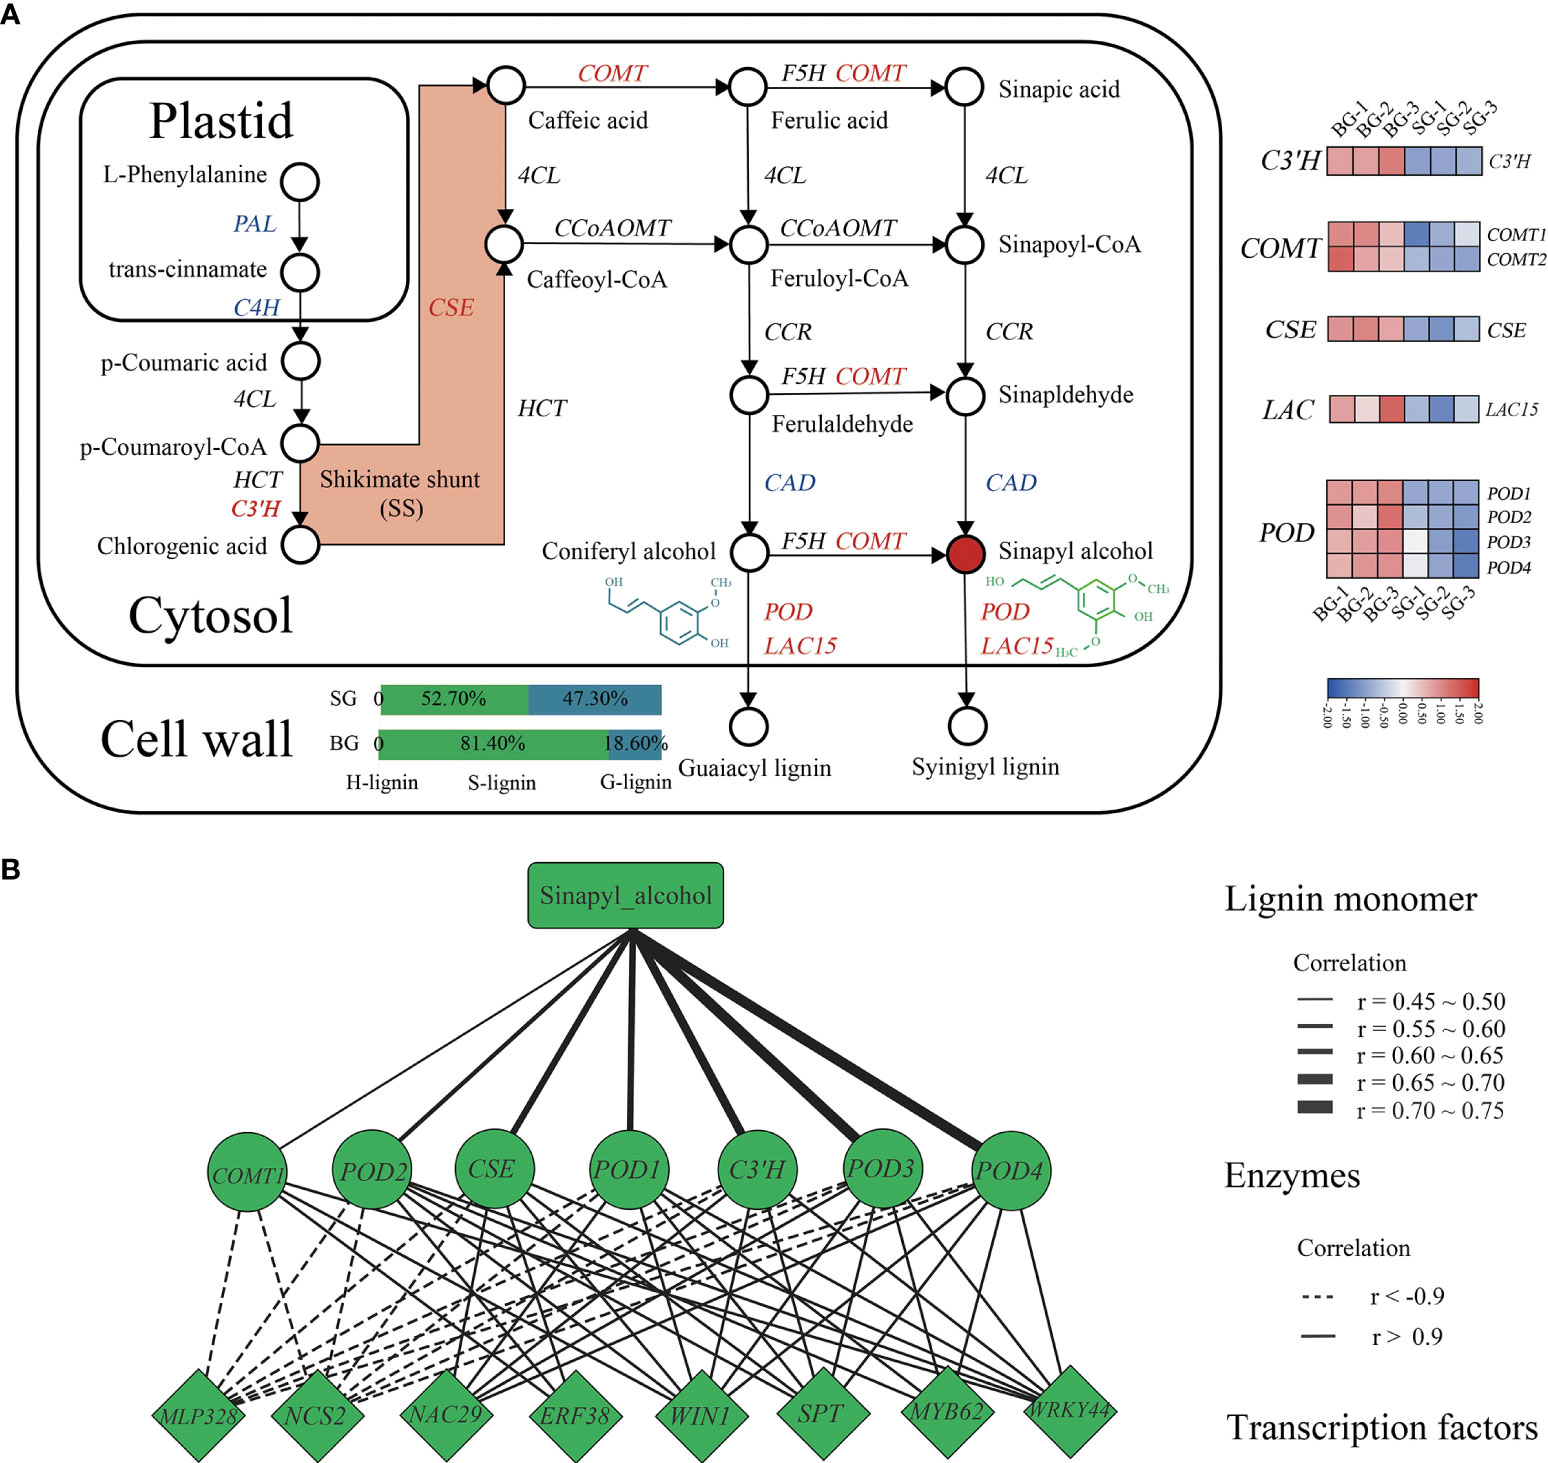
Figure 4 Analysis of the lignin biosynthetic pathways of BG and SG capsules. (A) Map showing the lignin biosynthetic pathway for patterns of DEGs. Expression of lignin-related genes is shown by a heatmap using log10 (FPKM); red represents upregulation, and blue represents downregulation. (B) Coexpression network of lignin biosynthesis end products, upregulated DEGs, and transcription factors.
To further explore the transcription factors (TFs) regulating lignin metabolism in Camellia, we performed a coexpression network analysis to direct differentially expressed TFs toward genes encoding S-lignin closely related enzymes (i.e., COMT1, POD2, CSE, POD1, C3’H, POD3, and POD4), and then narrowed down eight hub TFs into a highly correlated key module (|correlation| > 0.9) (Figure 4B). Among these TFs, wax inducer1/SHINE1 (WIN1/SHN) and ethylene response factor 38 (ERF38), which belong to the AP2/ERF family, were positively correlated with lignin metabolism in Camellia, as did MYB62, NAC29, SPATULA (SPT), and WRKY transcription factor 44 (WRKY44), whereas MLP328 and NCS2, which belong to the pathogenesis-related (PR) protein family, were negatively correlated with all enzymes previously mentioned (Figure 4B and Supplementary Table 6). Taken together, the results indicated that these TFs, based on their annotated orthologs in Arabidopsis, were hypothesized to be the master regulators (activators and/or repressors) of pericarp lignification in Camellia.
Discussion
Camellia L. is a good oil feedstock because of the biomass accumulation ability of its seeds embedded in lignocellulosic pericarps; therefore, pericarps with thin and low-density lignocellulose are favorable because they make seeds accessible (Yan, 2020). The pericarp thickness variations between BG and SG primarily arise from their genetic distinction, providing insights into the growth–defense tradeoffs in Camellia against stresses during evolution and domestication.
High S-lignin is the key factor contributing to the thicker fruit pericarp of BG compared with SG
Mature Camellia seeds are generally protected by a rigid pericarp (approximately 1.2–7.0 mm) against external hazards, and pericarp thickness is mainly determined by secondary cell wall components, such as cellulose, hemicellulose, lignin, and a small proportion of other components (Tan et al., 2020; Figure 1). The cellulose and hemicellulose contents of the BG and SG capsules were nearly the same, but the lignin content of the BG pericarp was higher than that of the SG pericarp, implying that lignin accumulation was responsible for the thick pericarp of Camellia (Figure 1E and Supplementary Table S8).
Lignin is the second most abundant biopolymer that polymerizes on the cell wall surface (Ralph et al., 2004). The three essential monolignols are p-hydroxyphenyl (H, derived from 4-coumaryl alcohol), guaiacyl (G, derived from coniferyl alcohol), and syringyl (S, derived from sinapyl alcohol) units (Boerjan et al., 2003; Bonawitz and Chapple, 2010; Liu et al., 2018). Comparison of metabolic profiles showed that S-unit was the only differentially accumulated monolignol among the three main monolignols. Thus, the S/G ratio was higher in the BG capsules than in the SG capsules. This phenomenon was accompanied by the attenuation of flavonoid biosynthesis via the shikimate pathway and consequently increased synthesis of monolignols from shikimate and phenylalanine (Vogt, 2010; Figures 2B, 4 and Supplementary Table S2).
Regulation of several catalysts and TFs in the lignin biosynthetic pathway contributes to high accumulation of S-lignin in BG capsules
In this study, we demonstrated the biosynthetic pathway to the major monolignol precursors of lignin in Camellia: from phenylalanine via the phenylpropanoid pathway and subsequent monolignol polymerization via PODs and LACs (Figure 4A). The catalytic enzymes, as in most plants, comprise the deaminase PAL, which converts phenylalanine to cinnamic acid, and hydroxylases, methyl/acyl-transferases, reductases, and oxidases for polymerization (Liu et al., 2018; Dixon and Barros, 2019). We speculated that the high level of S-unit in the BG capsules was associated with activated shikimate shunt, which was catalyzed by the increased activities of C3’H and CSE, supplying an abundant shikimate pool despite the decreased activities of CADs (A. Wagner et al., 2007; Figure 4). Finally, oxidative polymerization ultimately determined the output of S-lignin, which was also likely boosted in the BG capsules for the increased activities of PODs and LACs (Figure 4A).
The most widely studied TFs in the regulation of lignin biosynthesis are those belonging to the MYB and NAC families, including MYB58 and MYB63 in Arabidopsis, MYB31 in Musa, SND1 and NST1 in Arabidopsis, and NAC141 in Eucalyptus, which act as activators or repressors (Legay et al., 2007; Zhong et al., 2007; Sun et al., 2021). In the present study, MYB62 and NAC29 were screened through the coexpression analysis of the RNA-seq dataset for their potential role in regulating the lignin biosynthetic pathway in Camellia (Figure 4B and Supplementary Table S7). Additionally, the expression of conventional growth-related factors WRKYs and AP2/ERFs, such as AtWRKY12 (Li et al., 2015), PtrWRKY19 (Yang et al., 2016), and OsSHN/WIN (Ambavaram et al., 2011), has been associated with lignin contents in some plants. Meanwhile, WRKY44 and WIN1 in Camellia, which are positively correlated with catalysts in the lignin biosynthetic pathway, might function as activators. SPT, which encodes a bHLH TF, was originally identified for its role in carpel and fruit development (Groszmann et al., 2008; Makkena and Lamb, 2013). Thus, it was presumed to divert the S-lignin biosynthetic metabolon specifically into Camellia pericarps in the present study. Intriguingly, two defense-induced genes, pathogenesis-related 2, were negatively correlated with these catalysts, which could explain the weak defense in BG.
Alteration in lignin biosynthesis might be a strategy evolved by Camellia to balance growth and defense
Plant growth–defense tradeoffs involve resource reallocation to different biological processes, whereby plants optimize performance and fitness in a dynamic environment (Xie et al., 2018). Lignin biosynthesis is commonly believed to be an indivisible part of the complicated crosstalk between growth and defense because lignin provides mechanical strength, transports water and nutrients, and acts as a physical barrier to pathogen ingress; however, the relationship of lignin content with growth and defense remains largely elusive (Ha et al., 2021). Our previous study showed that S-lignin enrichment in BG pericarp co-occurs with increased growth rate and weak immunity, which differ from those in SG pericarp with low lignin content (our unpublished data). Similar findings have been reported in studies of Arabidopsis MYB46 and quinate/shikimate p-hydroxy cinnamoyl transferase (HCT) mutants, where reduced lignin content triggers stunt growth and enhances defense (Gallego-Giraldo et al., 2011).
During the evolution and domestication of Camellia, frequent interspecific hybridization and genetic introgression between C. drupifera and C. oleifera would be conceivable because of their phylogenetically close relationship (Figure 3D). Thus, lignin content variation became prominent and was associated with the evolutionary adaptation of Camellia species. The large amount of energy invested in lignin accumulation can compensate for the costly expenditure of defense, producing a growth-bias phenotype. However, excessive lignin accumulation also inhibits growth. Thus, within a certain threshold, lignin content possibly acts as a “fulcrum” that balances the flux of resources, such as carbon and energy, into growth and defense, helping Camellia species regulate their response to environmental changes (Figure 5). Whether or not the model we established about the lignin-dependent growth–defense tradeoffs in SG and BG can be extended to other Camellia species requires validation but could serve as a basis for further exploration.
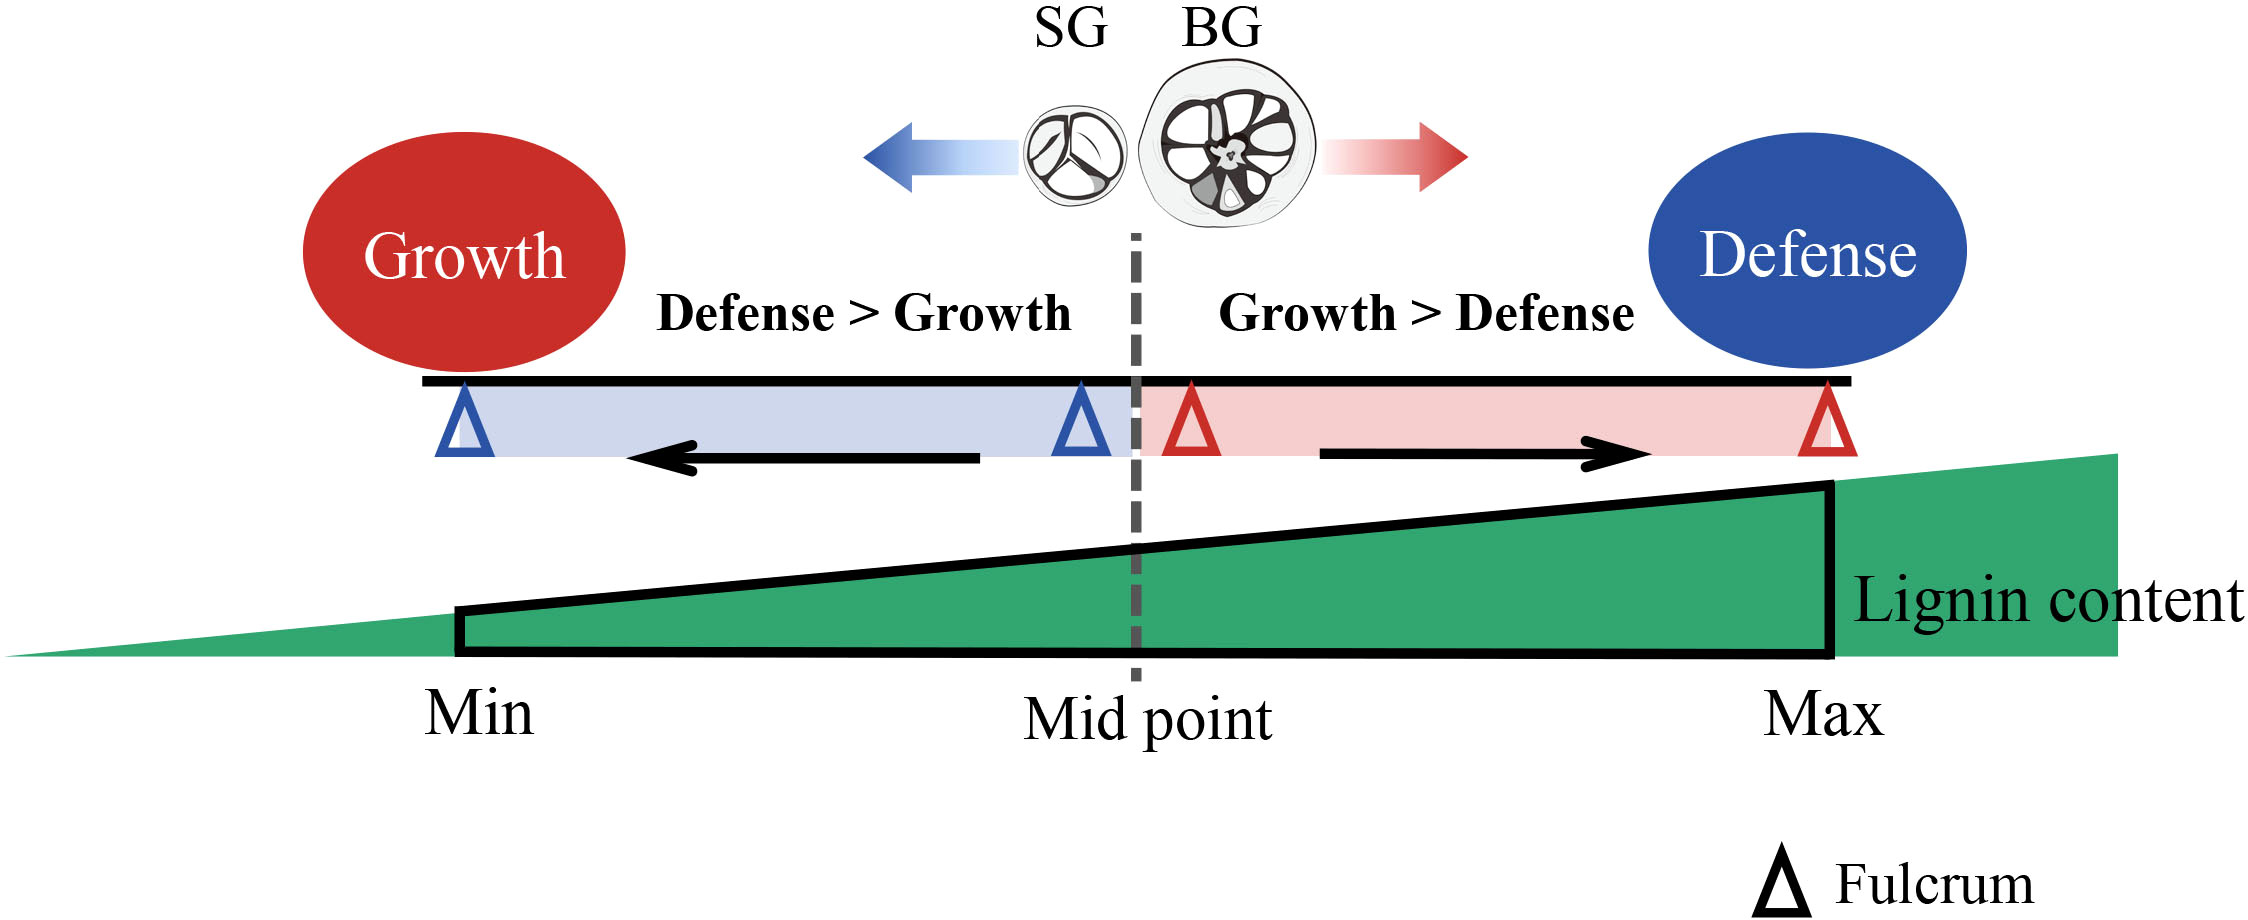
Figure 5 Proposed schematic of lignin-regulated growth–defense tradeoffs in Camellia. Lignin content (red triangle) within a certain threshold (from Min to Max) acts as a fulcrum to balance the resource flux into the plant growth and defense: A tendency of growth bias (BG) or defense bias (SG) is precisely tuned by the lignin level in pericarps. BG, C. drupifera; SG, C. oleifera; S-lignin, syringyl lignin; GO, gene ontology; KEGG, Kyoto Encyclopedia of Genes and Genomes; TBO, toluidine blue O; OPLS-DA, orthogonal partial least-squares discrimination analysis; VIP, variable importance in projection; DAMs, differentially accumulated metabolites; DEGs, differentially expressed genes; FC, fold change; FDR, false discovery rate; qRT-PCR, quantitative real-time polymerase chain reaction; PCA, principal component analysis; S-unit, sinapyl alcohol; G-unit, coniferyl alcohol; H-unit, coumarate conjugate; C3’H, p-coumarate 3-hydroxylase; CSE,S caffeoyl shikimate esterase; COMT, caffeic acid O-methyltransferase; CAD, cinnamyl alcohol dehydrogenase; C4H, cinnamate 4-hydroxylase; PAL, L-phenylalanine ammonia-lyase; POD, peroxidases; LAC, laccases; TF, transcription factor; ERF38, ethylene response factor 38; WIN1/SHN, wax inducer1/SHINE1; SPT, SPATULA; WRKY44, WRKY transcription factor 44; PR, pathogenesis-related; HCT, quinate/shikimate p-hydroxy cinnamoyl transferase.
Data availability statement
The original contributions presented in the study are publicly available. This data can be found here: NCBI, PRJNA870661.
Author contributions
Data curation, investigation, visualization, writing–original and draft, YJL; Conceptualization, funding acquisition, project administration, writing–review and editing, BL; Formal analysis and writing–original draft, YW; Data curation, HL; Investigation, KZ, BY, and SL; Visualization, WS; Methodology, CL and WS; Conceptualization, supervision, writing-review, and editing, BZ; Funding acquisition, formal analysis and project administration, YQL. All authors have read, corrected, and approved the manuscript.
Funding
This research was funded by the Key-Area Research and Development Program of Guangdong Province, grant number 2020B020215003 and the Guangzhou Municipal Science and Technology Project, grant number 202201011754.
Acknowledgments
We thank Xiaokeng Forest Farm (Shaoguan City, Guangdong Province, China) and Boluo Forest Farm (Huizhou City, Guangdong Province, China) for providing plant materials. We thank Shanghai Applied Protein Technology Co. Ltd. For assisting us with the metabolic and transcriptome data analyses. We thank Bioruqi Technology Co., Ltd. (Guangzhou, China) for assisting us with qPCR experiments and Hunan Platte Network Technology Co., Ltd. For assisting us with toluidine blue reagent staining experiments.
Conflict of interest
The authors declare that the research was conducted in the absence of any commercial or financial relationships that could be construed as a potential conflict of interest.
Publisher’s note
All claims expressed in this article are solely those of the authors and do not necessarily represent those of their affiliated organizations, or those of the publisher, the editors and the reviewers. Any product that may be evaluated in this article, or claim that may be made by its manufacturer, is not guaranteed or endorsed by the publisher.
Supplementary material
The Supplementary Material for this article can be found online at: https://www.frontiersin.org/articles/10.3389/fpls.2022.1016475/full#supplementary-material
Supplementary Table 1 | Result of RT-PCR.
Supplementary Table 2 | Analysis of the identified metabolite profiles between BG and SG.
Supplementary Table 3 | DEGs obtained after comparing the transcriptome data of BG and SG.
Supplementary Table 4 | GO functional enrichment analysis performed on DEGs.
Supplementary Table 5 | 334 conserved single-copy nuclear genes.
Supplementary Table 6 | Identified PODs and LACs in Camellia.
Supplementary Table 7 | End product, upregulated DEGs, and 10 hub TFs of the coexpression net-work in lignin biosynthesis.
Supplementary Table 8 | Comparison of fruit phenotypic character-istics between two species of Camellia L.
References
Ambavaram, M. M. R., Krishnan, A., Trijatmiko, K. R., Pereira, A. (2011). Coordinated activation of cellulose and repression of lignin biosynthesis pathways in rice. Plant Physiol. 155, 916–931. doi: 10.1104/pp.110.168641
Ashburner, M., Ball, C. A., Blake, J. A., Botstein, D., Cherry, J. M. (2000). Gene ontology: Tool for the unification of biology. the gene ontology consortium. Nat. Genet. 25, 25–29. doi: 10.1038/75556
Barnes, W., Anderson, C. (2017). Acetyl bromide soluble lignin (ABSL) assay for total lignin quantification from plant biomass. BIO-Protoc. 7 (5), e2149. doi: 10.21769/BioProtoc.2149
Boerjan, W., Ralph, J., Baucher, M. (2003). Lignin biosynthesis. Annu. Rev. Plant Biol. 54, 519–546. doi: 10.1146/annurev.arplant.54.031902.134938
Bonawitz, N. D., Chapple, C. (2010). The genetics of lignin biosynthesis: Connecting genotype to phenotype. Annu. Rev. Genet. 44, 337–363. doi: 10.1146/annurev-genet-102209-163508
Chambers, M. C., Maclean, B., Burke, R., Amodei, D., Ruderman, D. L., Neumann, S., et al. (2012). A cross-platform toolkit for mass spectrometry and proteomics. Nat. Biotechnol. 30, 918–920. doi: 10.1038/nbt.2377
Chen, F., Dixon, R. A. (2007). Lignin modification improves fermentable sugar yields for biofuel production. Nat. Biotechnol. 25, 759–761. doi: 10.1038/nbt1316
Chen, H., Zhai, Y., Xu, B., Xiang, B., Zhu, L., Li, P., et al. (2015). Feasibility and comparative studies of thermochemical liquefaction of Camellia oleifera cake in different supercritical organic solvents for producing bio-oil. Energy Convers. Manage. 89, 955–962. doi: 10.1016/j.enconman.2014.11.003
Deng, Y., Jianqi, L. I., Songfeng, W. U., Zhu, Y., Chen, Y., Fuchu, H. E. (2006). Integrated nr database in protein annotation system and its localization. Comput. Eng. 32, 71–72. doi: 10.1073/PNAS.1117873108
Dixon, R. A., Barros, J. (2019). Lignin biosynthesis: old roads revisited and new roads explored. Open Biol. 9, 190215. doi: 10.1098/rsob.190215
Emms, D. M., Kelly, S. (2019). OrthoFinder: phylogenetic orthology inference for comparative genomics. Genome Biol. 20, 238. doi: 10.1186/s13059-019-1832-y
Finn, R. D., Alex, B., Jody, C., Penelope, C., Eberhardt, R. Y., Eddy, S. R., et al. (2014). Pfam: The protein families database. Nucleic Acids Res. 42, D222–D230. doi: 10.1093/nar/gkt1223
Gallego-Giraldo, L., Escamilla-Trevino, L., Jackson, L. A., Dixon, R. A. (2011). Salicylic acid mediates the reduced growth of lignin down-regulated plants. Proc. Natl. Acad. Sci. U. S. A 108 (51), 20814–20819. doi: 10.1073/PNAS.1117873108
Groszmann, M., Paicu, T., Smyth, D. R. (2008). Functional domains of SPATULA, a bHLH transcription factor involved in carpel and fruit development in arabidopsis. Plant J. Cell Mol. Biol. 55, 40–52. doi: 10.1111/j.1365-313X.2008.03469.x
Ha, C. M., Rao, X., Saxena, G., Dixon, R. A. (2021). Growth–defense trade-offs and yield loss in plants with engineered cell walls. New Phytol 231, 60–74. doi: 10.1111/nph.17383
Henry, R. J. (2010). Evaluation of plant biomass resources available for replacement of fossil oil. Plant Biotechnol. J. 8, 288–293. doi: 10.1111/j.1467-7652.2009.00482.x
Hong, W., Dong, B., Huang, Y., Tan, S. (2016). Comprehensive evaluation of physiological responses to low temperature stress and cold resistance of three species of Camellia seedlings. Subtrop. Plant Sci. 45, 117. doi: 10.3969/j.issn.1009-7791.2016.02.004
Huerta-Cepas, J., Szklarczyk, D., Heller, D., Hernández-Plaza, A., Forslund, S. K., Cook, H., et al. (2019). eggNOG 5.0: a hierarchical, functionally and phylogenetically annotated orthology resource based on 5090 organisms and 2502 viruses. Nucleic Acids Res. 47, D309–D314. doi: 10.1093/nar/gky1085
Jia, X.-L., Wang, G.-L., Xiong, F., Yu, X.-R., Xu, Z.-S., Wang, F., et al. (2015). De novo assembly, transcriptome characterization, lignin accumulation and anatomic characteristics: Novel insights into lignin biosynthesis during celery leaf development. Sci. Rep. 5, 8259. doi: 10.1038/srep08259
Legay, S., Lacombe, E., Goicoechea, M., Brière, C., Séguin, A., Mackay, J., et al. (2007). Molecular characterization of EgMYB1, a putative transcriptional repressor of the lignin biosynthetic pathway. Plant Sci. 173, 542–549. doi: 10.1016/j.plantsci.2007.08.007
Li, M., Pu, Y., Ragauskas, A. J. (2016). Current understanding of the correlation of lignin structure with biomass recalcitrance. Front. Chem. 4. doi: 10.3389/fchem.2016.00045
Li, W., Tian, Z., Yu, D. (2015). WRKY13 acts in stem development in arabidopsis thaliana. Plant Sci. Int. J. Exp. Plant Biol. 236, 205–213. doi: 10.1016/j.plantsci.2015.04.004
Liu, Q., Luo, L., Zheng, L. (2018). Lignins: biosynthesis and biological functions in plants. Int. J. Mol. Sci. 19, 335. doi: 10.3390/ijms19020335
Liu, G., Zhu, W., Li, S., Zhou, W., Zhang, H., Wang, J., et al. (2022). Antioxidant capacity and interaction of endogenous phenolic compounds from tea seed oil. Food Chem. 376, 131940. doi: 10.1016/j.foodchem.2021.131940
Long, Q., Huang, Y., Zhong, H., Danny R., B., Paul D., P., Kevin, R. (2008). The quality and volatile-profile changes of Camellia oil (Camellia oleifera Abel) following bleaching. Eur. J. Lipid Sci. Technol. 110, 768–775. doi: 10.1002/ejlt.200700271
Love, M. I., Huber, W., Anders, S. (2014). Moderated estimation of fold change and dispersion for RNA-seq data with DESeq2. Genome Biol. 15, 550. doi: 10.1186/s13059-014-0550-8
Makkena, S., Lamb, R. S. (2013). The bHLH transcription factor SPATULA regulates root growth by controlling the size of the root meristem. BMC Plant Biol. 13, 1. doi: 10.1186/1471-2229-13-1
Ming, T. L. (2007). Theaceae,Flora of China (Beijing: Science Press & St. Louis: Missouri Botanical Garden Press).
Minoru, K., Yoko, S., Masayuki, K., Miho, F., Mao, T. (2016). KEGG as a reference resource for gene and protein annotation. Nucleic Acids Res. 44 (D1), D457–D462. doi: 10.1093/nar/gkv1070
Orel, G., Wilson, P. G. (2012). Camellia cherryana (Theaceae), a new species from China. Ann. Bot. Fenn. 49, 248–254. doi: 10.5735/085.049.0405
Patrick, J. W. (1997). PHLOEM UNLOADING: Sieve element unloading and post-sieve element transport. Annu. Rev. Plant Physiol. Plant Mol. Biol. 48, 191–222. doi: 10.1146/annurev.arplant.48.1.191
Qin, S., Rong, J., wenju, Z., jiakuan, C. (2018). Cultivation history of camellia oleifera and genetic resources in the Yangtze river basin. Biodivers. Sci. 26, 384. doi: 10.17520/biods.2017254
Ralph, J., Lundquist, K., Brunow, G., Lu, F., Kim, H., Schatz, P. F., et al. (2004). Lignins: Natural polymers from oxidative coupling of 4-hydroxyphenyl- propanoids. Phytochem. Rev. 3, 29–60. doi: 10.1023/B:PHYT.0000047809.65444.a4
Reddy, M. S. S., Chen, F., Shadle, G., Jackson, L., Aljoe, H., Dixon, R. A. (2005). Targeted down-regulation of cytochrome P450 enzymes for forage quality improvement in alfalfa (Medicago sativa l.). Proc. Natl. Acad. Sci. 102, 16573–16578. doi: 10.1073/pnas.0505749102
Rolf, A., Amos, B., Wu, C. H., Barker, W. C., Brigitte, B., Serenella, F., et al. (2004). UniProt: The universal protein knowledgebase. Nucleic Acids Res. 32, D115–D119. doi: 10.1093/nar/gkh131
Shannon, P., Markiel, A., Ozier, O., Baliga, N. S., Wang, J. T., Ramage, D., et al. (2003). Cytoscape: A Software Environment for Integrated Models of Biomolecular Interaction Networks. Genome Res. 13, 2498–2504. doi: 10.1101/gr.1239303
Sudhir, K., Glen, S., Koichiro, T. (2016). MEGA7: molecular evolutionary genetics analysis version 7.0 for bigger datasets. Mol. Biol. Evol. 7, 1870. doi: 10.1093/molbev/msw054
Suealek, N., Tharavanij, T., Hackman, R. M., Keen, C. L., Holt, R. R., Burawat, B., et al. (2021). Thai Tea seed oil and virgin olive oil similarly reduce plasma lipids: a pilot study within a healthy adult male population. Eur. J. Lipid Sci. Technol. 123, 2000126. doi: 10.1002/ejlt.202000126
Sun, Y., Jiang, C., Jiang, R., Wang, F., Zhang, Z., Zeng, J. (2021). A novel NAC transcription factor from eucalyptus, EgNAC141, positively regulates lignin biosynthesis and increases lignin deposition. Front. Plant Sci. 12. doi: 10.3389/fpls.2021.642090
Tan, M., Luo, L., Wu, Z., Huang, Z., Zhang, J., Huang, J., et al. (2020). Pelletization of Camellia oleifera abel. shell after storage: Energy consumption and pellet properties. Fuel Process. Technol. 201, 106337. doi: 10.1016/j.fuproc.2020.106337
Vera Alvarez, R., Pongor, L., Mariño-Ramírez, L., Landsman, D. (2018). TPMCalculator: One-step software to quantify mRNA abundance of genomic features. Bioinforma. Oxf. Engl. 35 (11), 1960–1962. doi: 10.1093/bioinformatics/bty896
Wagner, G. P., Kin, K., Lynch, V. J. (2012). Measurement of mRNA abundance using RNA-seq data: RPKM measure is inconsistent among samples. Theory Biosci. Theor. Den Biowissenschaften 131, 281–285. doi: 10.1007/s12064-012-0162-3
Wagner, A., Ralph, J., Akiyama, T., Flint, H., Phillips, L., Torr, K., et al. (2007). Exploring lignification in conifers by silencing hydroxycinnamoyl-CoA: shikimate hydroxy cinnamoyl transferase in pinus radiata. Proc. Natl. Acad. Sci. U. S. A. 104, 11856–11861. doi: 10.1073/pnas.0701428104
Wang, Z., Jiang, C., Wen, Q., Wang, N., Tao, Y., Xu, L. (2014). Deep sequencing of the Camellia chekiangoleosa transcriptome revealed candidate genes for anthocyanin biosynthesis. Gene 538, 1–7. doi: 10.1016/j.gene.2014.01.035
Xie, M., Zhang, J., Tschaplinski, T. J., Tuskan, G. A., Chen, J. G., Muchero, W. (2018). Regulation of lignin biosynthesis and its role in growth-defense tradeoffs. Front. Plant Ence 09. doi: 10.3389/fpls.2018.01427
Yan, C. (2020). Molecular regulation of lignin synthesis in Camellia oleifera fruit development. Chinese Academy of Forestry Sciences. doi: 10.27625/d.cnki.gzlky.2020.000054
Yang, H., Zhao, D., Qin, C., Xu, J., Liao, F. (2015). Observation on the resistance of different Camellia species and varieties to anthracnose. Plant Prot. 41, 195–199. doi: 10.3969.j.issn. 0529-1542.2015.02.038
Yang, L., Zhao, X., Yang, F., Fan, D., Jiang, Y., Luo, K. (2016). PtrWRKY19, a novel WRKY transcription factor, contributes to the regulation of pith secondary wall formation in populus trichocarpa. Sci. Rep. 6, 18643. doi: 10.1038/srep18643
Keywords: Camellia drupifera, Camellia oleifera, pericarp thickness, lignin, transcriptome, metabolome
Citation: Li Y, Liao B, Wang Y, Luo H, Wang S, Li C, Song W, Zhang K, Yang B, Lu S, Zhang B and Li Y (2022) Transcriptome and metabolome analyses provide insights into the relevance of pericarp thickness variations in Camellia drupifera and Camellia oleifera. Front. Plant Sci. 13:1016475. doi: 10.3389/fpls.2022.1016475
Received: 11 August 2022; Accepted: 03 October 2022;
Published: 27 October 2022.
Edited by:
Robin Joshi, Institute of Himalayan Bioresource Technology (CSIR), IndiaReviewed by:
Romit Seth, North Carolina State University, United StatesGholamreza Khaksar, Chulalongkorn University, Thailand
Copyright © 2022 Li, Liao, Wang, Luo, Wang, Li, Song, Zhang, Yang, Lu, Zhang and Li. This is an open-access article distributed under the terms of the Creative Commons Attribution License (CC BY). The use, distribution or reproduction in other forums is permitted, provided the original author(s) and the copyright owner(s) are credited and that the original publication in this journal is cited, in accordance with accepted academic practice. No use, distribution or reproduction is permitted which does not comply with these terms.
*Correspondence: Bipei Zhang, emhhbmdiaXBlaUB6aGt1LmVkdS5jbg==; Yongquan Li, eW9uZ3F1YW5saUB6aGt1LmVkdS5jbg==
†These authors have contributed equally to this work