 Eric K. Wafula1†
 Huiting Zhang2,3†Gregory Von Kuster4
 James H. Leebens-Mack5
 Loren A. Honaas2
 Claude W. dePamphilis1,4*
- 1Department of Biology, The Pennsylvania State University, University Park, PA, United States
- 2Tree Fruit Research Laboratory, United States Department of Agriculture (USDA), Agricultural Research Service (ARS), Wenatchee, WA, United States
- 3Department of Horticulture, Washington State University, Pullman, WA, United States
- 4Huck Institutes of the Life Sciences, The Pennsylvania State University, University Park, PA, United States
- 5Department of Plant Biology, University of Georgia, Athens, GA, United States
Plant genome-scale resources are being generated at an increasing rate as sequencing technologies continue to improve and raw data costs continue to fall; however, the cost of downstream analyses remains large. This has resulted in a considerable range of genome assembly and annotation qualities across plant genomes due to their varying sizes, complexity, and the technology used for the assembly and annotation. To effectively work across genomes, researchers increasingly rely on comparative genomic approaches that integrate across plant community resources and data types. Such efforts have aided the genome annotation process and yielded novel insights into the evolutionary history of genomes and gene families, including complex non-model organisms. The essential tools to achieve these insights rely on gene family analysis at a genome-scale, but they are not well integrated for rapid analysis of new data, and the learning curve can be steep. Here we present PlantTribes2, a scalable, easily accessible, highly customizable, and broadly applicable gene family analysis framework with multiple entry points including user provided data. It uses objective classifications of annotated protein sequences from existing, high-quality plant genomes for comparative and evolutionary studies. PlantTribes2 can improve transcript models and then sort them, either genome-scale annotations or individual gene coding sequences, into pre-computed orthologous gene family clusters with rich functional annotation information. Then, for gene families of interest, PlantTribes2 performs downstream analyses and customizable visualizations including, (1) multiple sequence alignment, (2) gene family phylogeny, (3) estimation of synonymous and non-synonymous substitution rates among homologous sequences, and (4) inference of large-scale duplication events. We give examples of PlantTribes2 applications in functional genomic studies of economically important plant families, namely transcriptomics in the weedy Orobanchaceae and a core orthogroup analysis (CROG) in Rosaceae. PlantTribes2 is freely available for use within the main public Galaxy instance and can be downloaded from GitHub or Bioconda. Importantly, PlantTribes2 can be readily adapted for use with genomic and transcriptomic data from any kind of organism.
1. Introduction
A rapid and continuing decline in sequencing costs over the last 30 years has contributed to the generation of massive amounts of transcriptome and genome data for non-model plant species (Barrett et al., 2013; Matasci et al., 2014; Sayers et al., 2018; One Thousand Plant Transcriptomes Initiative, 2019; Marks et al., 2021). Integrating new genomic data from diverse plant lineages in phylogenetic studies can provide the evolutionary context necessary for understanding the evolution of gene function (Williams et al., 2014; Pabón-Mora et al., 2014; Yang et al., 2015b; Zhang et al., 2015; Carvalho et al., 2018; One Thousand Plant Transcriptomes Initiative, 2019; Mi et al., 2020; Nagy et al., 2020), resolving species relationships (Timme et al., 2012; Rothfels et al., 2013; Wickett et al., 2014; Zeng et al., 2014; Yang et al., 2015a; Huang et al., 2016; Xiang et al., 2017; One Thousand Plant Transcriptomes Initiative, 2019; Hodel et al., 2022), accurate identification of orthologous and paralogous genes among species (Sonnhammer and Koonin, 2002; Gabaldón, 2008; Schreiber et al., 2014; Emms and Kelly, 2019; Derelle et al., 2020; Fuentes et al., 2021), and unraveling gene and genome duplications (Bowers et al., 2003; Jiao et al., 2011; Jiao et al., 2012; The Amborella Genome Project, 2013; Li et al., 2015; Ren et al., 2018; Zwaenepoelde Peer, 2019; Viruel et al., 2019). However, comparative genomic and phylogenomic analyses typically requires a level of bioinformatic expertise and a scale of computational resources that are inaccessible to many researchers. For instance, a large-scale phylogenomic study may require objective circumscription of representative protein sequences into gene families using a carefully selected set of most appropriate reference genomes. This requires knowledge and skill to assess the quality of available genomic resources as well as an evolutionary perspective to avoid pitfalls that lead to distorted conclusions, such as using a biased selection of reference species or outgroups. In addition, to execute these analytical pipelines, command line skills and the expertise to navigate through and properly set parameters, select appropriate algorithms, and solve potential computation environment conflicts are needed. Although some software (Chen et al., 2020; Tello-Ruiz et al., 2020; Valentin et al., 2020; Bel et al., 2021; Oliveira et al., 2021; Emms and Kelly, 2022) are more user-friendly (i.e., incorporate a graphical user interface, containerized tools, etc.) and have pre-defined parameters suitable for plant research, most others still require custom optimization or are mainly applied to species with small genomes (i.e., prokaryotes), or non-plant systems (Dunn et al., 2013; Blom et al., 2016; Lanza et al., 2016; Altenhoff et al., 2019; Pucker et al., 2020; Ebmeyer et al., 2021; Perrin and Rocha, 2021; Pucker, 2022).
With the goal to improve data accessibility, databases have been created to host curated plant-specific genomic information at different scales, ranging from those including sequenced genomes from diverse plant species (i.e., PLAZA 5.0, Bel et al., 2021 and Gramene, Tello-Ruiz et al., 2020) to ones focusing on specific plant groups, such as the Genome Database for Rosaceae (GDR, Jung et al., 2019). Major plant databases are reviewed and described by various authors (Chen et al., 2006; Lyons and Freeling, 2008; Wall et al., 2008; Goodstein et al., 2012; Schreiber et al., 2014; Martinez, 2016; Huerta-Cepas et al., 2016; Kriventseva et al., 2018; Mi et al., 2020; Tello-Ruiz et al., 2020; Bel et al., 2021). Some databases also provide gene homology information and computational tools for comparative genomic analysis (Martinez, 2016). However, analysis tools implemented in such databases are typically limited, static, and can only be used to analyze existing data (Tomcal et al., 2013; Sundell et al., 2015; Spannagl et al., 2016; Nakaya et al., 2017; Tello-Ruiz et al., 2020). Some more recent databases contain flexible tools (i.e., users can select different algorithms), but these are often not scalable (i.e., many have limitations on data size and number of input sequences). For example, the PLAZA 5.0 database contains 134 carefully selected high-quality plant genomes and provides gene family circumscriptions with rich gene homology and annotation information (Bel et al., 2021). However, users can only upload up to 300 new sequences for the BLAST based gene family search function, and add a maximum of 50 external sequences while running a gene family phylogeny on their webserver (https://bioinformatics.psb.ugent.be/plaza/). Limitation on data input make it infeasible to use these databases to perform genome-scale analyses on new datasets brought by the user.
Other new developments aiming to make complicated bioinformatic analyses accessible to more users are workflow management systems which integrate analytic pipelines and complementary software into readily executable packages, such as SnakeMake (Mölder et al., 2021), Nextflow (Tommaso et al., 2017), Pegasus (Deelman et al., 2015), Galaxy Workbench (The Galaxy Community, 2022), and others. Of those, the Galaxy Workbench is an open-source web-based software framework that aims to make command-line tools accessible to users without informatic expertise (The Galaxy Community, 2022), and is popular among biologists. Galaxy implements several comparative genomic tools developed by the bioinformatics community (Darling et al., 2010; Thanki et al., 2018). Such a web-based framework provides a simplified way to execute standardized analyses and workflows. They can also eliminate the complex administrative and programming tasks inherent in performing big data analyses via batch processing on the command line, and greatly simplify record keeping and re-implementation of complex analytical processes. Often, scientists can perform analyses with either existing or user implemented tools from a web browser. Additionally, individual institutions can link these web-based platforms to their own high-performance computing resources, allowing computationally intensive analysis not always possible on a purely web-based platform.
In an effort to address these accessibility and computational challenges in genome-scale research and to take advantage of the Galaxy environment, we developed PlantTribes2, a gene family analysis framework that uses objective classifications of annotated protein sequences from genomes or transcriptomes for comparative and evolutionary analyses of gene families from any type of organism, including fungi, microbes, animals, and plants. An initial version of PlantTribes was developed by Wall et al. (2008), but has become outdated due to several of the previously mentioned limitations. In PlantTribes2, we have completely revamped PlantTribes from a static relational database to a flexible analytical pipeline with all new code, new features, and extensive testing. We have developed a well-documented analytic framework complete with training materials including tutorials and sample datasets. Finally, we worked with the Galaxy community to develop Galaxy wrappers for all of the PlantTribes2 tools (Blankenberg et al., 2014. Supplemental Table 1), so they are available on the public server at usegalaxy.org, and can be installed into any Galaxy instance. Finally, we demonstrate genome-scale evolutionary analysis of gene families using PlantTribes2, starting with de novo assembled transcriptomes and gene models from whole genome data. Although our examples, sample datasets, and gene family scaffolds are for plants, the pipeline is system agnostic and can be readily used with genome-scale information from any set of related organisms.
2. Pipeline implementation
The PlantTribes2 toolkit is a collection of self-contained modular analysis pipelines that use objective classifications of annotated protein sequences from sequenced genomes for comparative and evolutionary analyses of genome-scale gene families. At the core of PlantTribes2 analyses are the gene family scaffolds, which are clusters of orthologous and paralogous sequences from specified sets of inferred protein sequences. The tools interact with these scaffolds, as described below, to deliver the following outputs: (1) predicted coding sequences and their corresponding translations, (2) a table of pairwise synonymous/non-synonymous substitution rates for either orthologous or paralogous transcript pairs, (3) results of significant duplication components in the distribution of synonymous substitutions rates (Ks), (4) a summary table for transcripts classified into orthologous gene family clusters with their corresponding functional annotations, (5) gene family amino acid and nucleotide fasta sequences, (6) multiple sequence alignments, and (7) inferred maximum likelihood phylogenies (Figure 1)
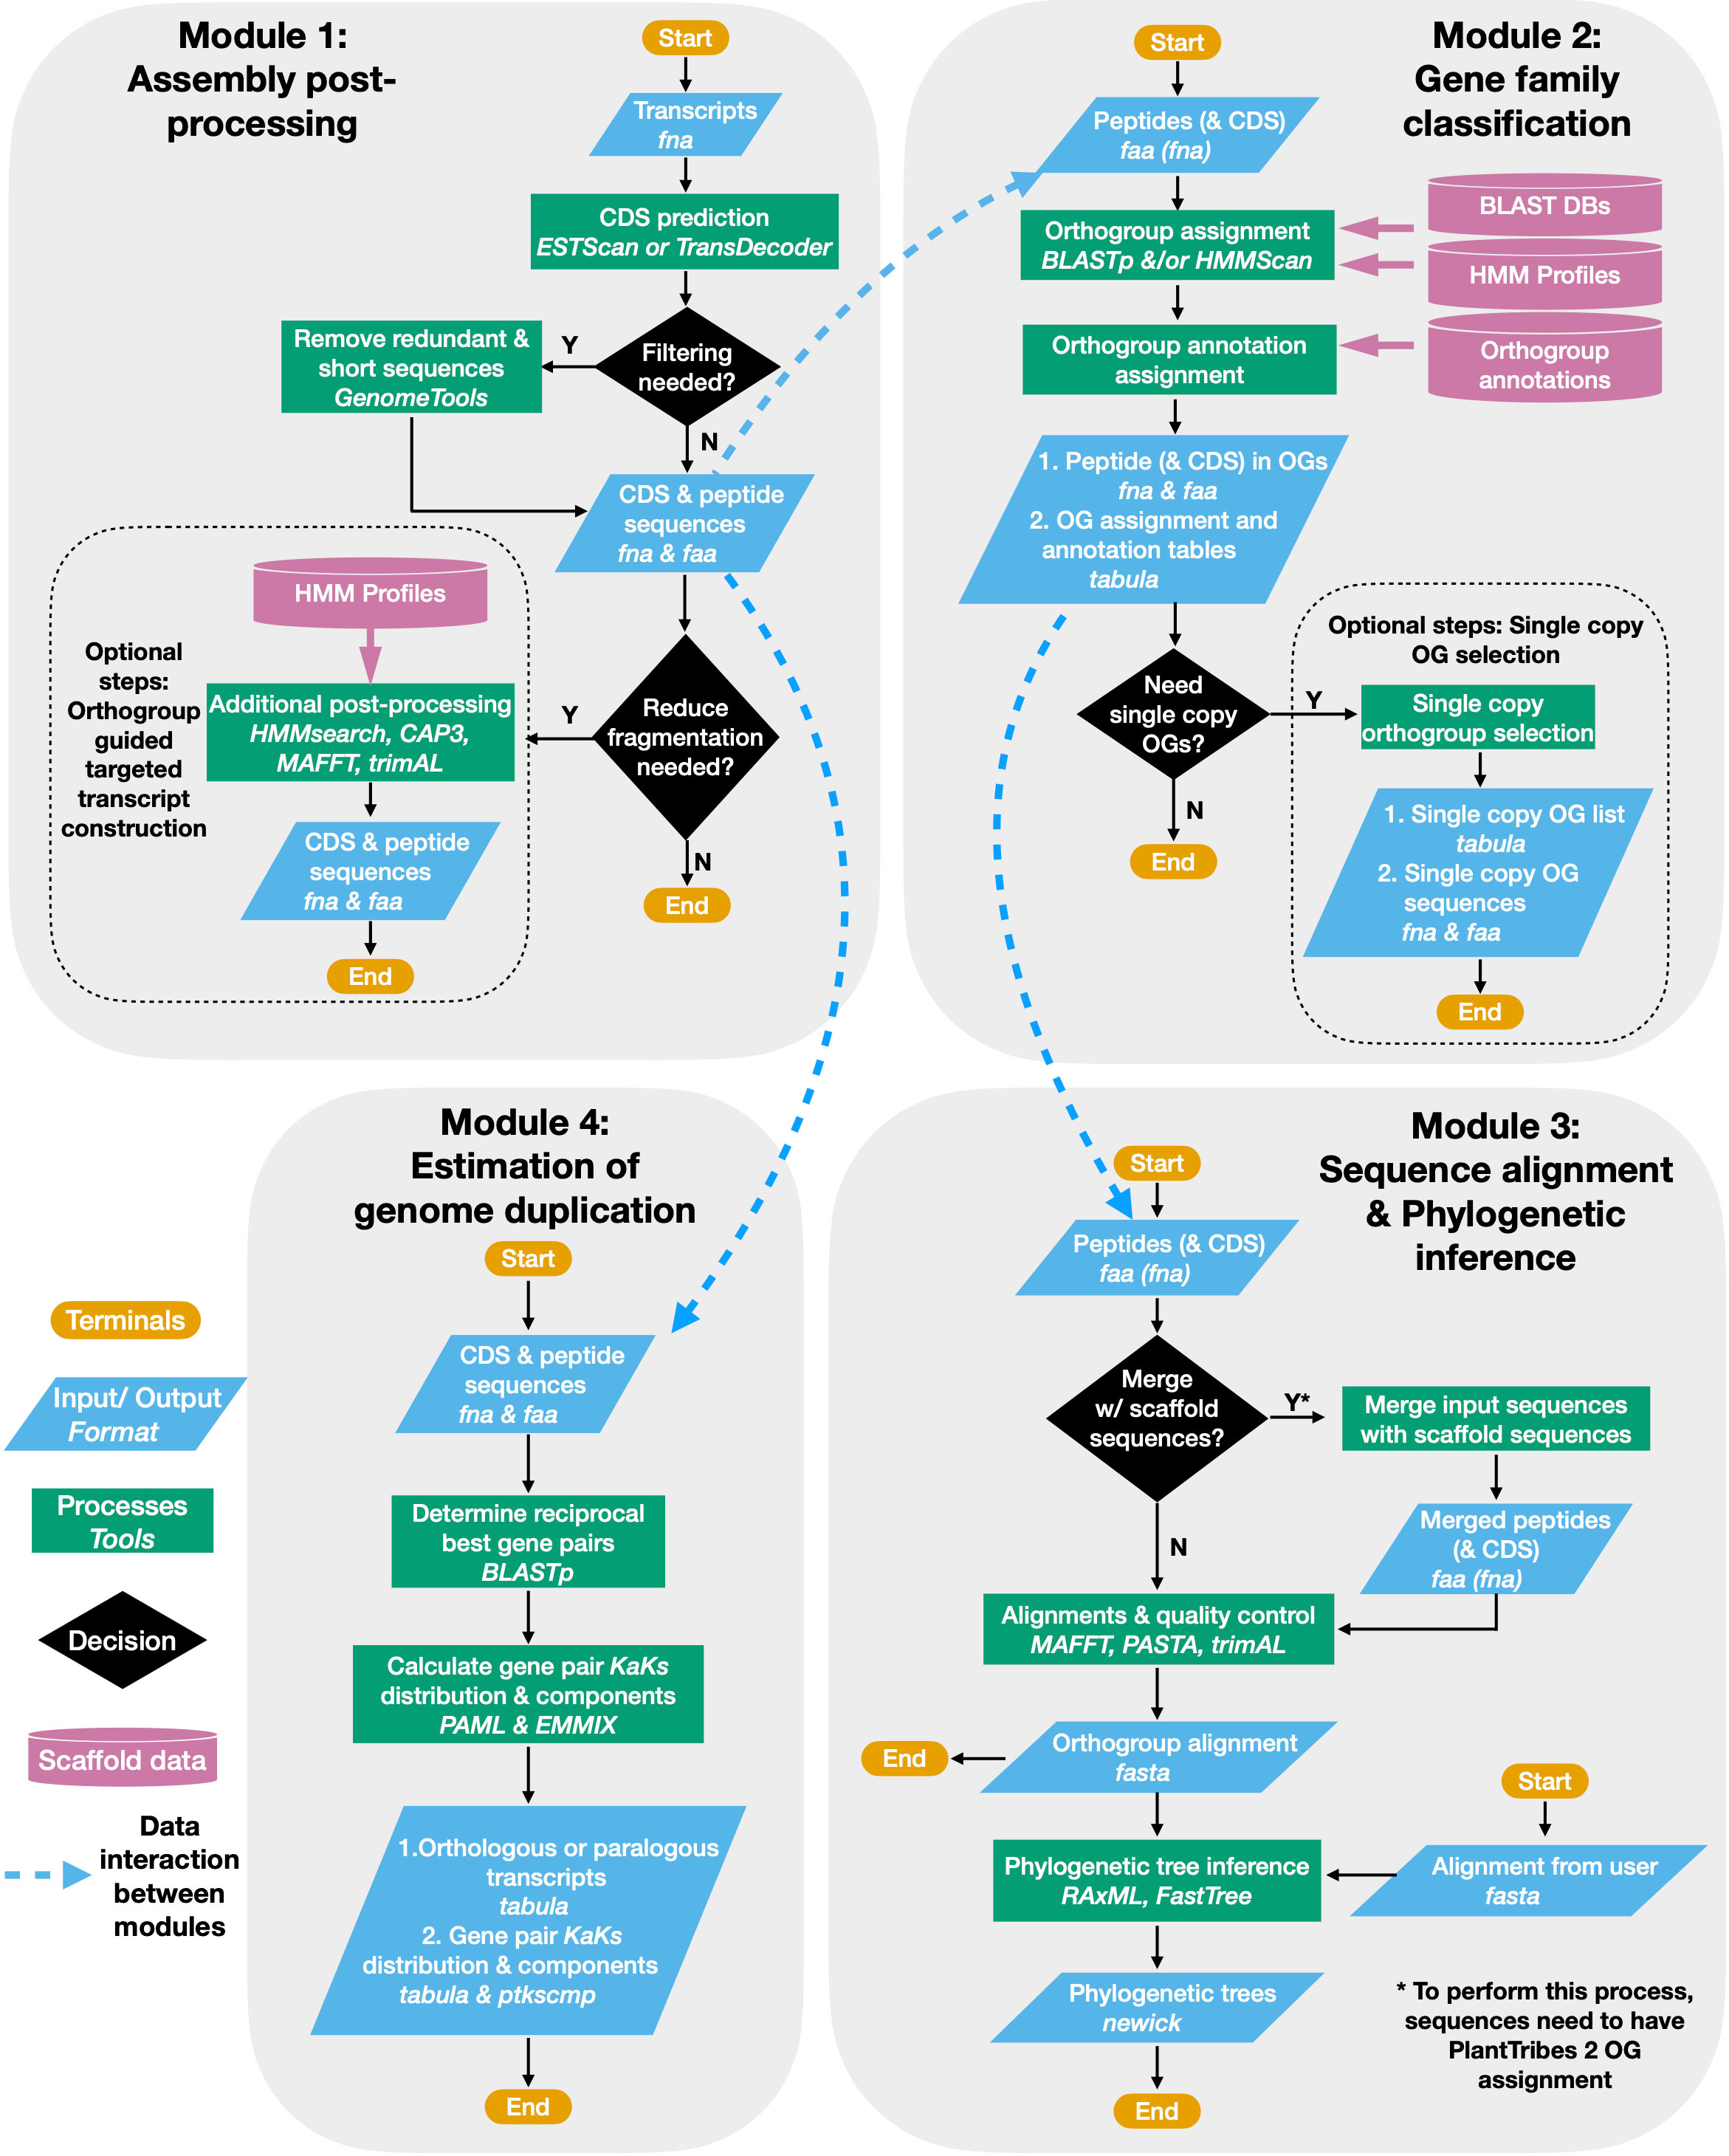
Figure 1 PlantTribes2 analysis workflow. A schematic diagram illustrating the PlantTribes2 modular analysis workflow. (1) A user provides transcripts for post-processing, resulting in a non-redundant set of predicted coding sequences and their corresponding translations (Module 1). (2) The post-processed transcripts (or user provided sequences) are searched against a gene family scaffold blast and/or hmm database(s), and transcripts are assigned into their putative orthogroups with corresponding metadata (Module 2). (3) Classified transcripts are integrated with their corresponding scaffold gene models to estimate orthogroup multiple sequence alignments and corresponding phylogenetic trees (Module 3). Similarly, sequence alignments and phylogeny can be constructed from user provided data. (4) Synonymous substitution rate (Ks) and nonsynonymous substitution rate (Ka) of paralogs from either the post-processed assembly or inferred from the phylogenetic trees are estimated. The Ks results are used to detect large-scale duplication events and many other evolutionary hypotheses (Module 4).
2.1. Gene family scaffolds
The current release of PlantTribes2 (v1.0.4) provides several plant gene family scaffolds (Supplemental Table 2) used in previously published and ongoing phylogenomic studies (The Amborella Genome Project, 2013; Wickett et al., 2014; Yang et al., 2015b; Li et al., 2018; Shahid et al., 2018; Yang et al., 2019; Timilsena et al., 2022; Timilsena et al., in press; Zhang et al., 2022), the companion paper in this issue), including one Monocot focused scaffold (12Gv1.0) and four iterations of generic Angiosperm focused scaffolds (22Gv1.1, 26Gv1.0, 26Gv2.0, and 37Gv1.0). Complete sets of inferred protein-coding genes from plant genomes represented in each of the PlantTribes2 scaffolds were clustered into gene families (i.e., orthogroups) using at least one of the following protein clustering methods: GFam (clusters of consensus domain architecture) (Sasidharan et al., 2012), OrthoMCL (narrowly defined clusters) (Li et al., 2003; Chen et al., 2006), or OrthoFinder (more broadly defined clusters) (Emms and Kelly, 2015; Emms and Kelly, 2019). Additional clustering of primary gene families was performed using the MCL algorithm (Enright et al., 2002) at 10 stringencies with inflation values from 1.2 to 5.0 to connect distantly, but potentially related orthogroups into larger hierarchical gene families (i.e., super-orthogroups), as described in Wall et al. (2008). We then annotated each orthogroup with gene function information from biological databases, including Gene Ontology (GO) (Ashburner et al., 2000; Carbon et al., 2019), InterPro/Pfam protein domains (Jones et al., 2014; Blum et al., 2020; Mistry et al., 2020), The Arabidopsis Information Resource (TAIR) (Berardini et al., 2015), UniProtKB/TrEMBL (The UniProt Consortium, 2021), and UniProtKB/Swiss-Prot (The UniProt Consortium, 2021). The final PlantTribes2 scaffold data sets include (1) orthogroups protein coding sequence fasta, (2) orthogroups protein multiple sequence alignments, (3) orthogroups protein HMM profiles, (4) a scaffold protein BLAST database, (5) a scaffold protein HMM profiles database, and (6) templates for analysis pipelines with scaffold metadata.
For custom applications with any focal group of organisms, a detailed description is available on the GitHub repository (https://github.com/dePamphilis/PlantTribes) for how to build a customized PlantTribes2 gene family scaffold. Building custom gene family scaffolds in PlantTribes2 begins with providing unclassified genome-scale gene sets or converting an existing gene family circumscription and corresponding metadata to a format that is compatible with the PlantTribes2 tools. If running on the command line, such externally circumscribed scaffolds can be directly integrated into PlantTribes2 for user-specific gene family analyses. If running on Galaxy, Galaxy administration tools (Blankenberg et al., 2014, Supplemental Table 1) are available for installing and maintaining these external scaffolds within a Galaxy instance that provides the PlantTribes2 tools.
2.2. Illustrated examples of PlantTribes2 tools
Here we describe the use of each PlantTribes2 tool and provide examples of outputs using a test dataset containing transcripts from two plant species (details can be found in Supplemental Table 3). Detailed step-by-step tutorials using the test data to perform analyses are available for both the Galaxy and the command-line versions of the pipeline.
2.2.1. Assembly post-processing
The AssemblyPostProcessor tool is an entry point of a PlantTribes2 analysis when the input data is de novo transcripts or gene models in some poorly annotated genomes where predicted coding sequences and corresponding peptides do not match. The AssemblyPostProcessor pipeline uses either ESTScan (Iseli et al., 1999) or TransDecoder (Haas et al., 2013) to transform transcripts into putative CDSs and their corresponding amino acid translations. Optionally, the resulting predicted coding regions can be filtered to remove duplicated and exact subsequences using GenomeTools (Gremme et al., 2013). The pipeline is implemented with an additional assembly post-processing method that uses scaffold orthogroups to reduce fragmentation in a de novo assembly. Homology searches of post-processed transcripts against HMM-profiles (Eddy, 2011) of targeted orthogroups are conducted using HMMER hmmsearch (Eddy, 2011). After assignment of transcripts to targeted orthogroups, orthogroup-specific gene assembly of overlapping primary contigs is performed using CAP3 (Huang and Madan, 1999), an overlap-layout-consensus assembler. Finally, protein multiple sequence alignments of orthogroups are estimated and trimmed using MAFFT (Katoh and Standley, 2013) and trimAL (Capella-Gutiérrez et al., 2009) respectively, to aid in identifying targeted assembled transcripts that are orthologous to the scaffold reference gene models based on the global sequence alignment coverage. A list of AssemblyPostProcessor use cases include: (1) processing de novo transcriptome assemblies to improve transcript qualities for downstream analyses (Honaas et al., 2016; Yang et al., 2019; Whittle et al., 2021; and example in section 3.2.1); (2) generating matching coding sequences (CDSs) and peptide sequences in genomes with only mRNA sequences (e.g., the Malus domestica GDDH13 annotation provided only mRNA sequences but not CDSs, Daccord et al., 2017) and gene information gathered from databases lacking a uniformed naming system and processing protocols - for instance, the numbers of CDSs and peptides do not match in the Pyrus pyrifolia ‘Cuiguan’ genome, and the peptides are named differently from the CDSs (Gao et al., 2021). The AssemblyPostProcessor-generated matching CDS and peptide sequences from the aforementioned Malus and Pyrus genomes among others provided a good starting point for the comparative genomic analyses described in section 3.2.2 and 3.2.3.
2.2.2. Gene family classification
The GeneFamilyClassifier tool classifies gene coding sequences either produced by the AssemblyPostProcessor tool or from an external source using BLASTp (Camacho et al., 2009) and HMMER (Eddy, 2011) hmmscan (or both classifiers) into pre-computed orthologous gene family clusters (orthogroups) of a PlantTribes2 scaffold. Classified sequences are then assigned with the corresponding orthogroups’ metadata, which includes gene counts of scaffold taxa, superclusters (super orthogroups) at multiple clustering stringencies, and rich orthogroup annotations from functional genomic databases (as described in section 2.1). Additionally, sequences belonging to single or low-copy gene families that are commonly used in species tree inference can be determined with a built-in command for this tool. Next, the classified input gene coding sequences can be integrated into their corresponding orthogroup’s scaffold gene model files using the GeneFamilyIntegrator tool for downstream analyses.
2.2.3. Gene family alignment estimation
The GeneFamilyAligner tool estimates protein and codon multiple sequence alignments of integrated orthologous gene family fasta files produced by the GeneFamilyIntegrator tool or from an external source. Orthogroup alignments are estimated using either MAFFT’s L-INS-i algorithm (Katoh and Standley, 2013) or the divide and conquer approach implemented in the PASTA (Mirarab et al., 2015) pipeline for large alignments. Optional post-alignment processing includes trimming out sites that are predominantly gaps (Capella-Gutiérrez et al., 2009), removing sequences with very low global orthogroup alignment coverage, and performing realignment of orthogroup sequences following site trimming and sequence removal. In the Galaxy framework, the MSAViewer (Yachdav et al., 2016) plugin allows orthogroup fasta multiple sequence alignments produced by the GeneFamilyAligner to be visualized and edited using the Jalview Java Web Start (Waterhouse et al., 2009) (Figure 2).
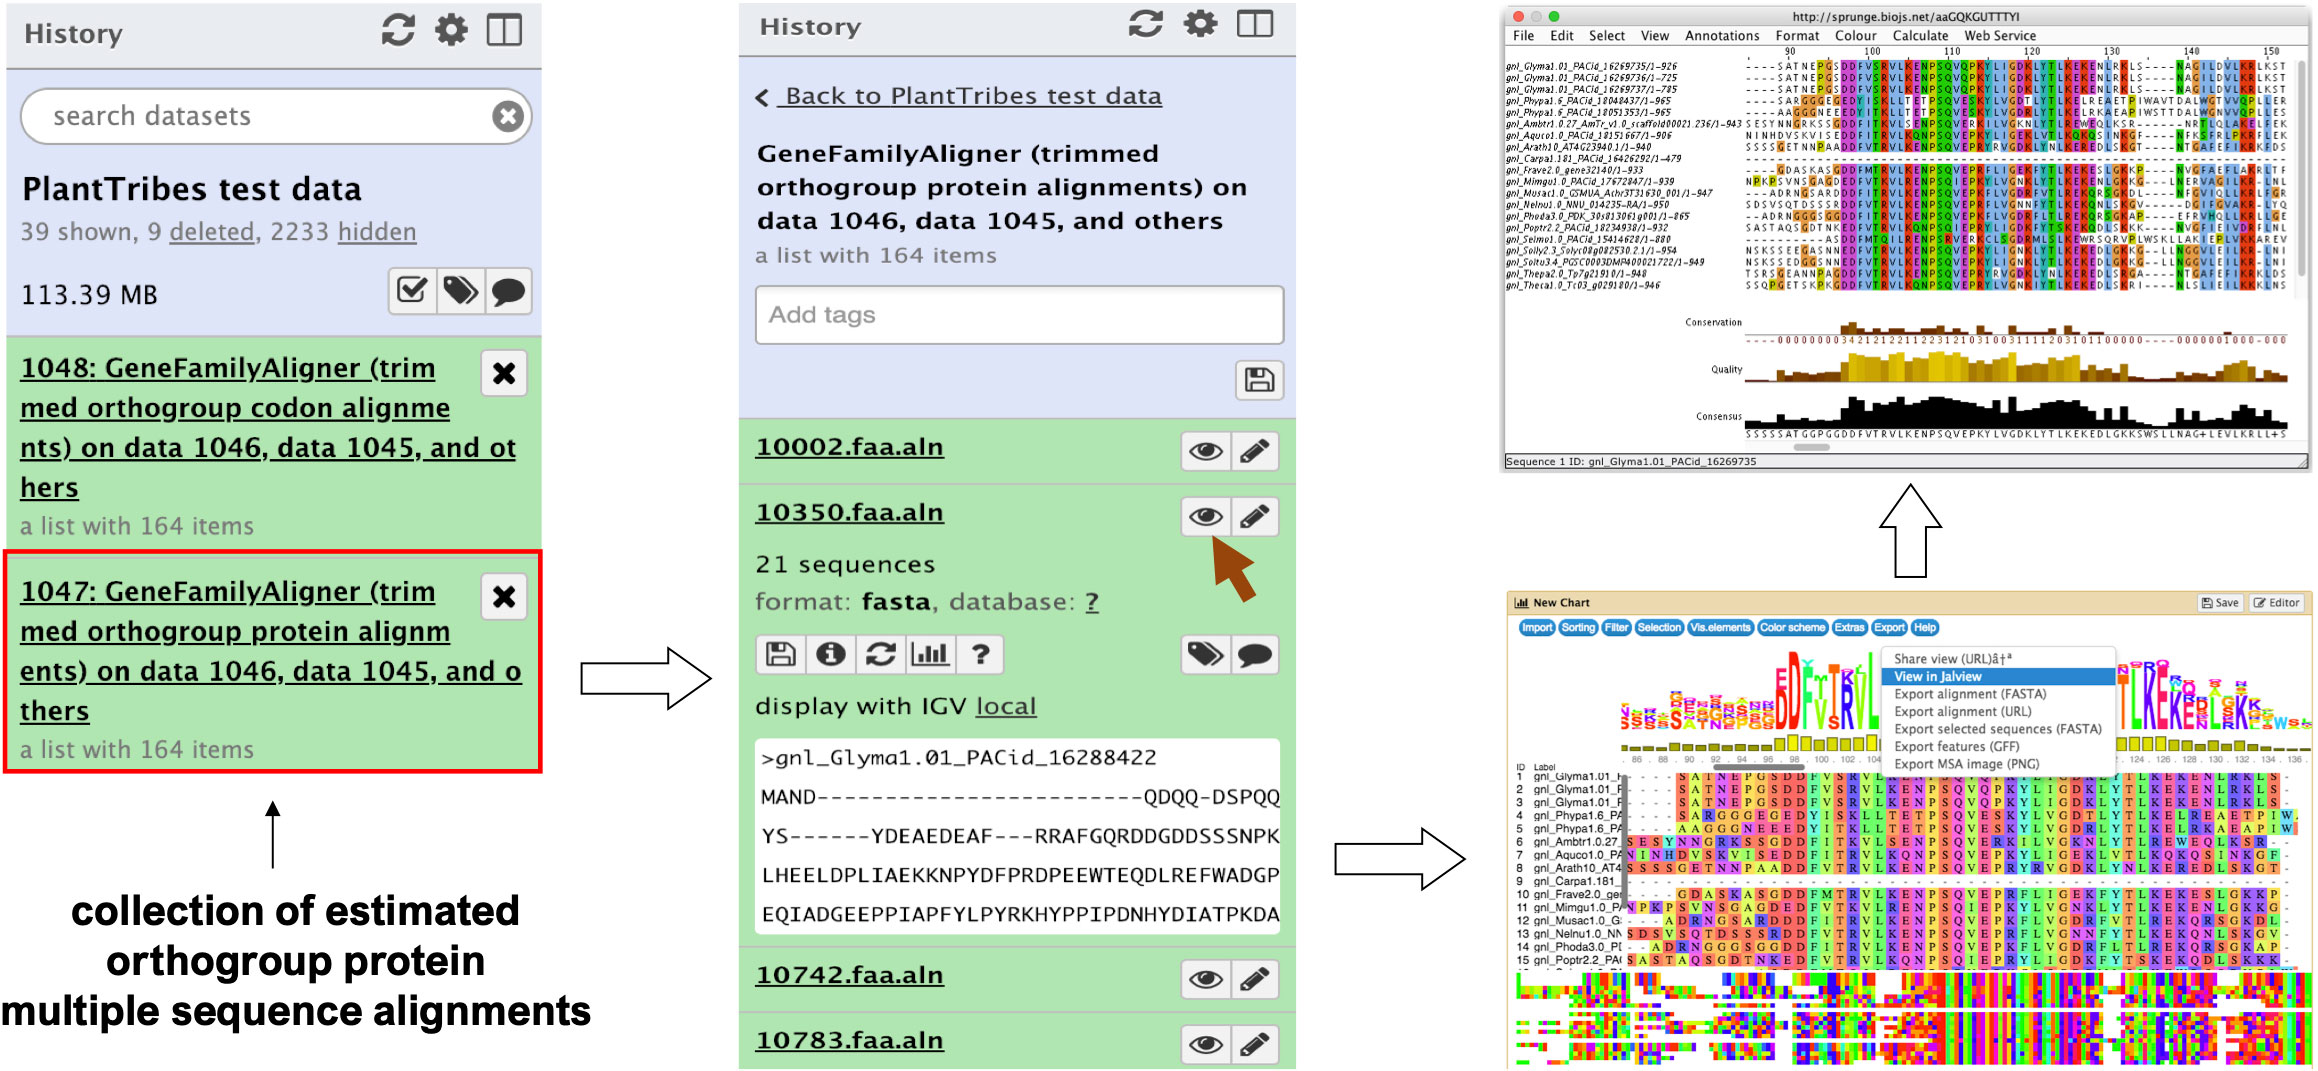
Figure 2 An illustration of an orthogroup multiple sequence alignment produced by the Galaxy PlantTribes2 GeneFamilyAligner tool using the test dataset. Results can be visualized in Galaxy with the MSAViewer visualization plugin and manually edited with Jalview Java Web Start.
2.2.4. Gene family phylogenetic inference
The GeneFamilyPhylogenyBuilder tool performs a gene family phylogenetic inference of multiple sequence alignments produced by the GeneFamilyAligner tool or from an external source. PlantTribes2 estimates maximum likelihood (ML) phylogenetic trees using either RAxML (Stamatakis, 2014) or FastTree (Price et al., 2010) algorithms. Optional tree optimization includes setting the number of bootstrap replicates for RAxML to conduct a rapid bootstrap analysis, searching for the best-scoring ML tree, and rooting the inferred phylogenetic tree with the most distant taxon in the orthogroup or specified taxa. In the Galaxy framework, either the Phylocanvas plugin (https://phylocanvas.org/) or the PHYLOViZ 2.0 (Nascimento et al., 2016) plugin provides several options for visualizing and rendering the phylogenetic trees produced by the GeneFamilyPhylogenyBuilder (Figure 3).
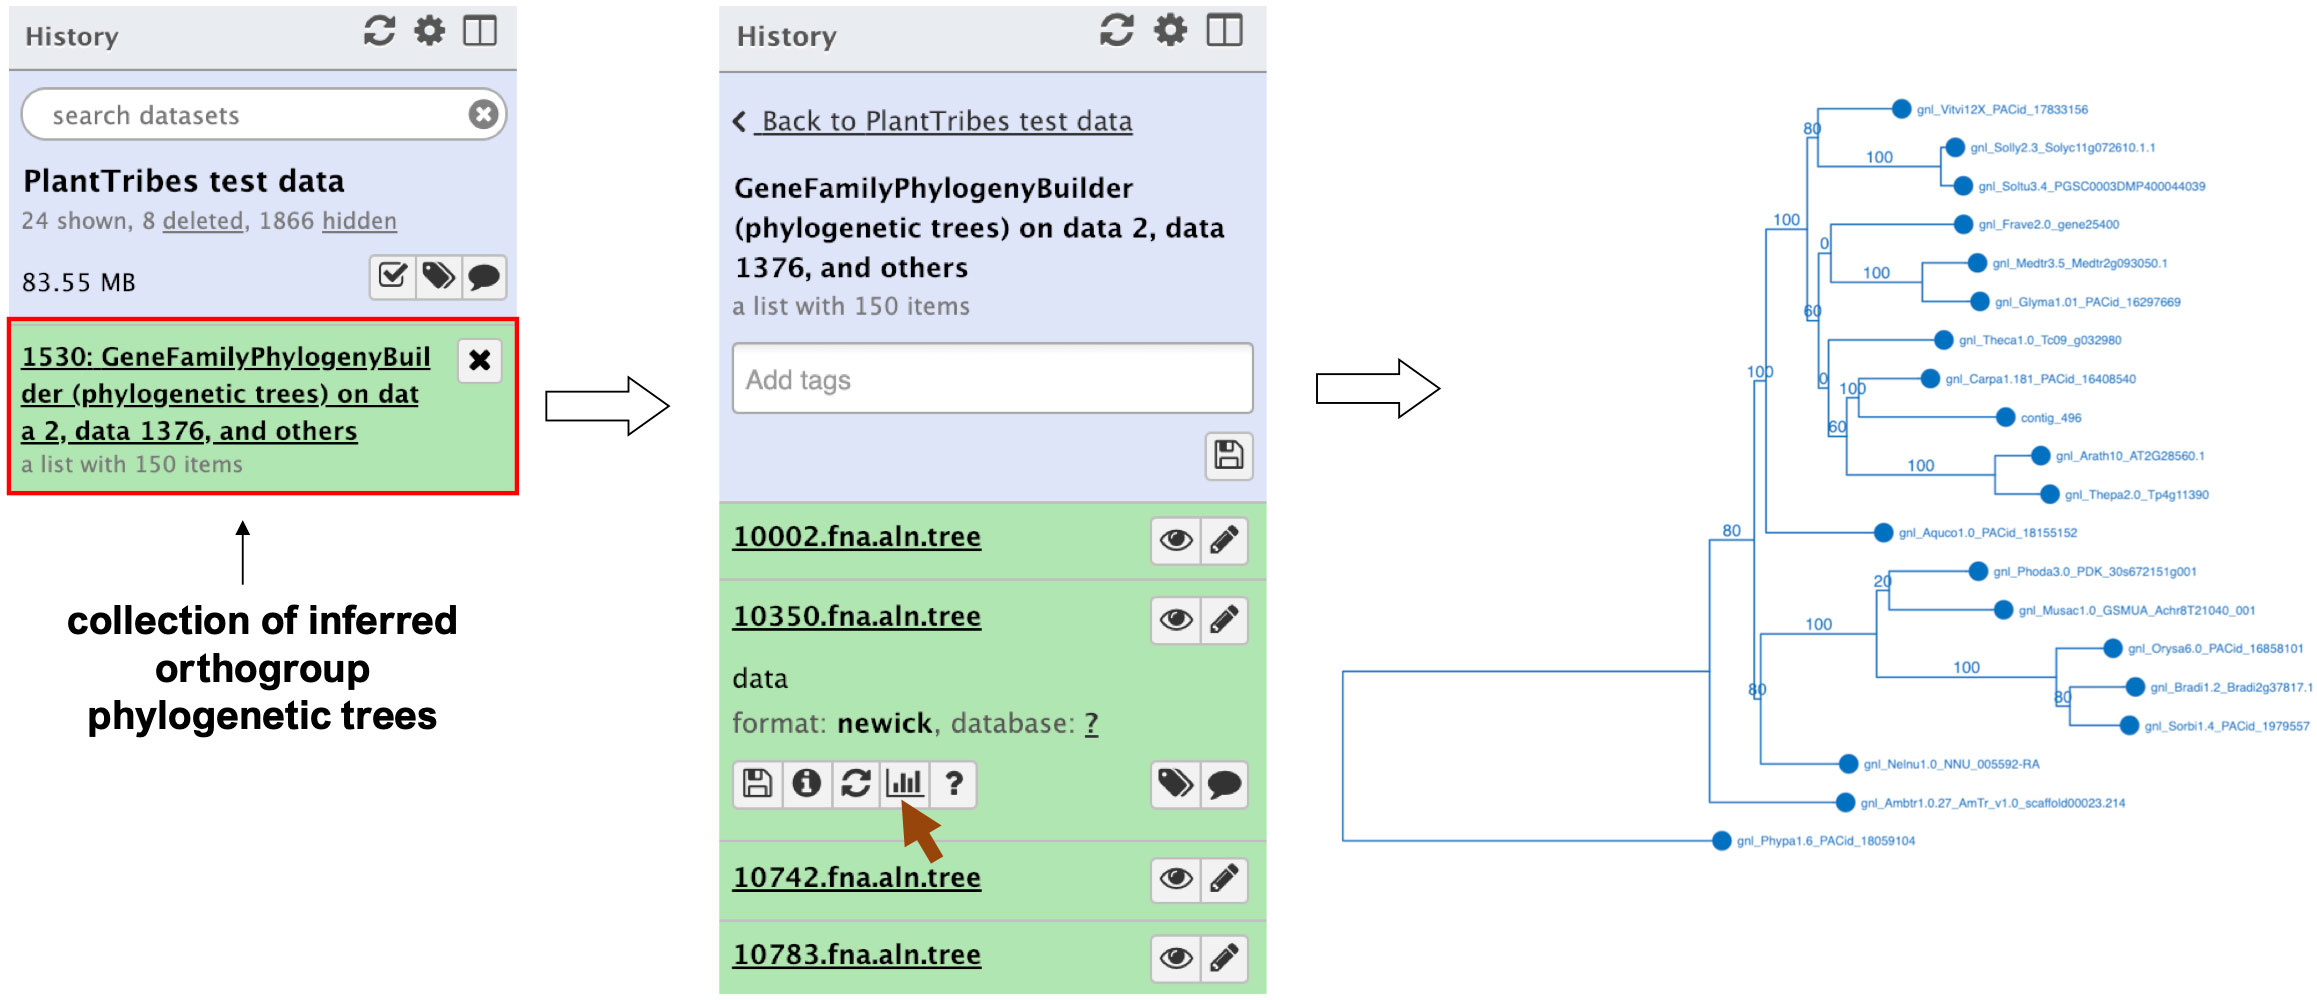
Figure 3 An illustration of an orthogroup phylogenetic tree produced by the Galaxy PlantTribes2 GeneFamilyPhylogenyBuilder using the test dataset. Results can be visualized in Galaxy using either the Phylocanvas (demonstrated here) or the PHYLOViZ plugin.
2.2.5. Estimation of genome duplications
The KaKsAnalysis tool estimates paralogous and orthologous pairwise synonymous (Ks) and non-synonymous (Ka) substitution rates using PAML (Yang, 2007) for a set of protein coding genes (i.e., produced by the AssemblyPostProcessor), with duplicates inferred from the phylogenomic analysis (using both the GeneFamilyClassifier and GeneFamilyPhylogenyBuilder) or from an external source. Optionally, the resulting set of estimated Ks values can be clustered into components using a mixture of multivariate normal distributions, implemented in the EMMIX (McLachlan and Peel, 1999) software, to identify significant duplication event(s) in a species or a pair of species. The KsDistribution tool then plots the Ks rates and fits the estimated significant component(s) onto the distribution (Figure 4).
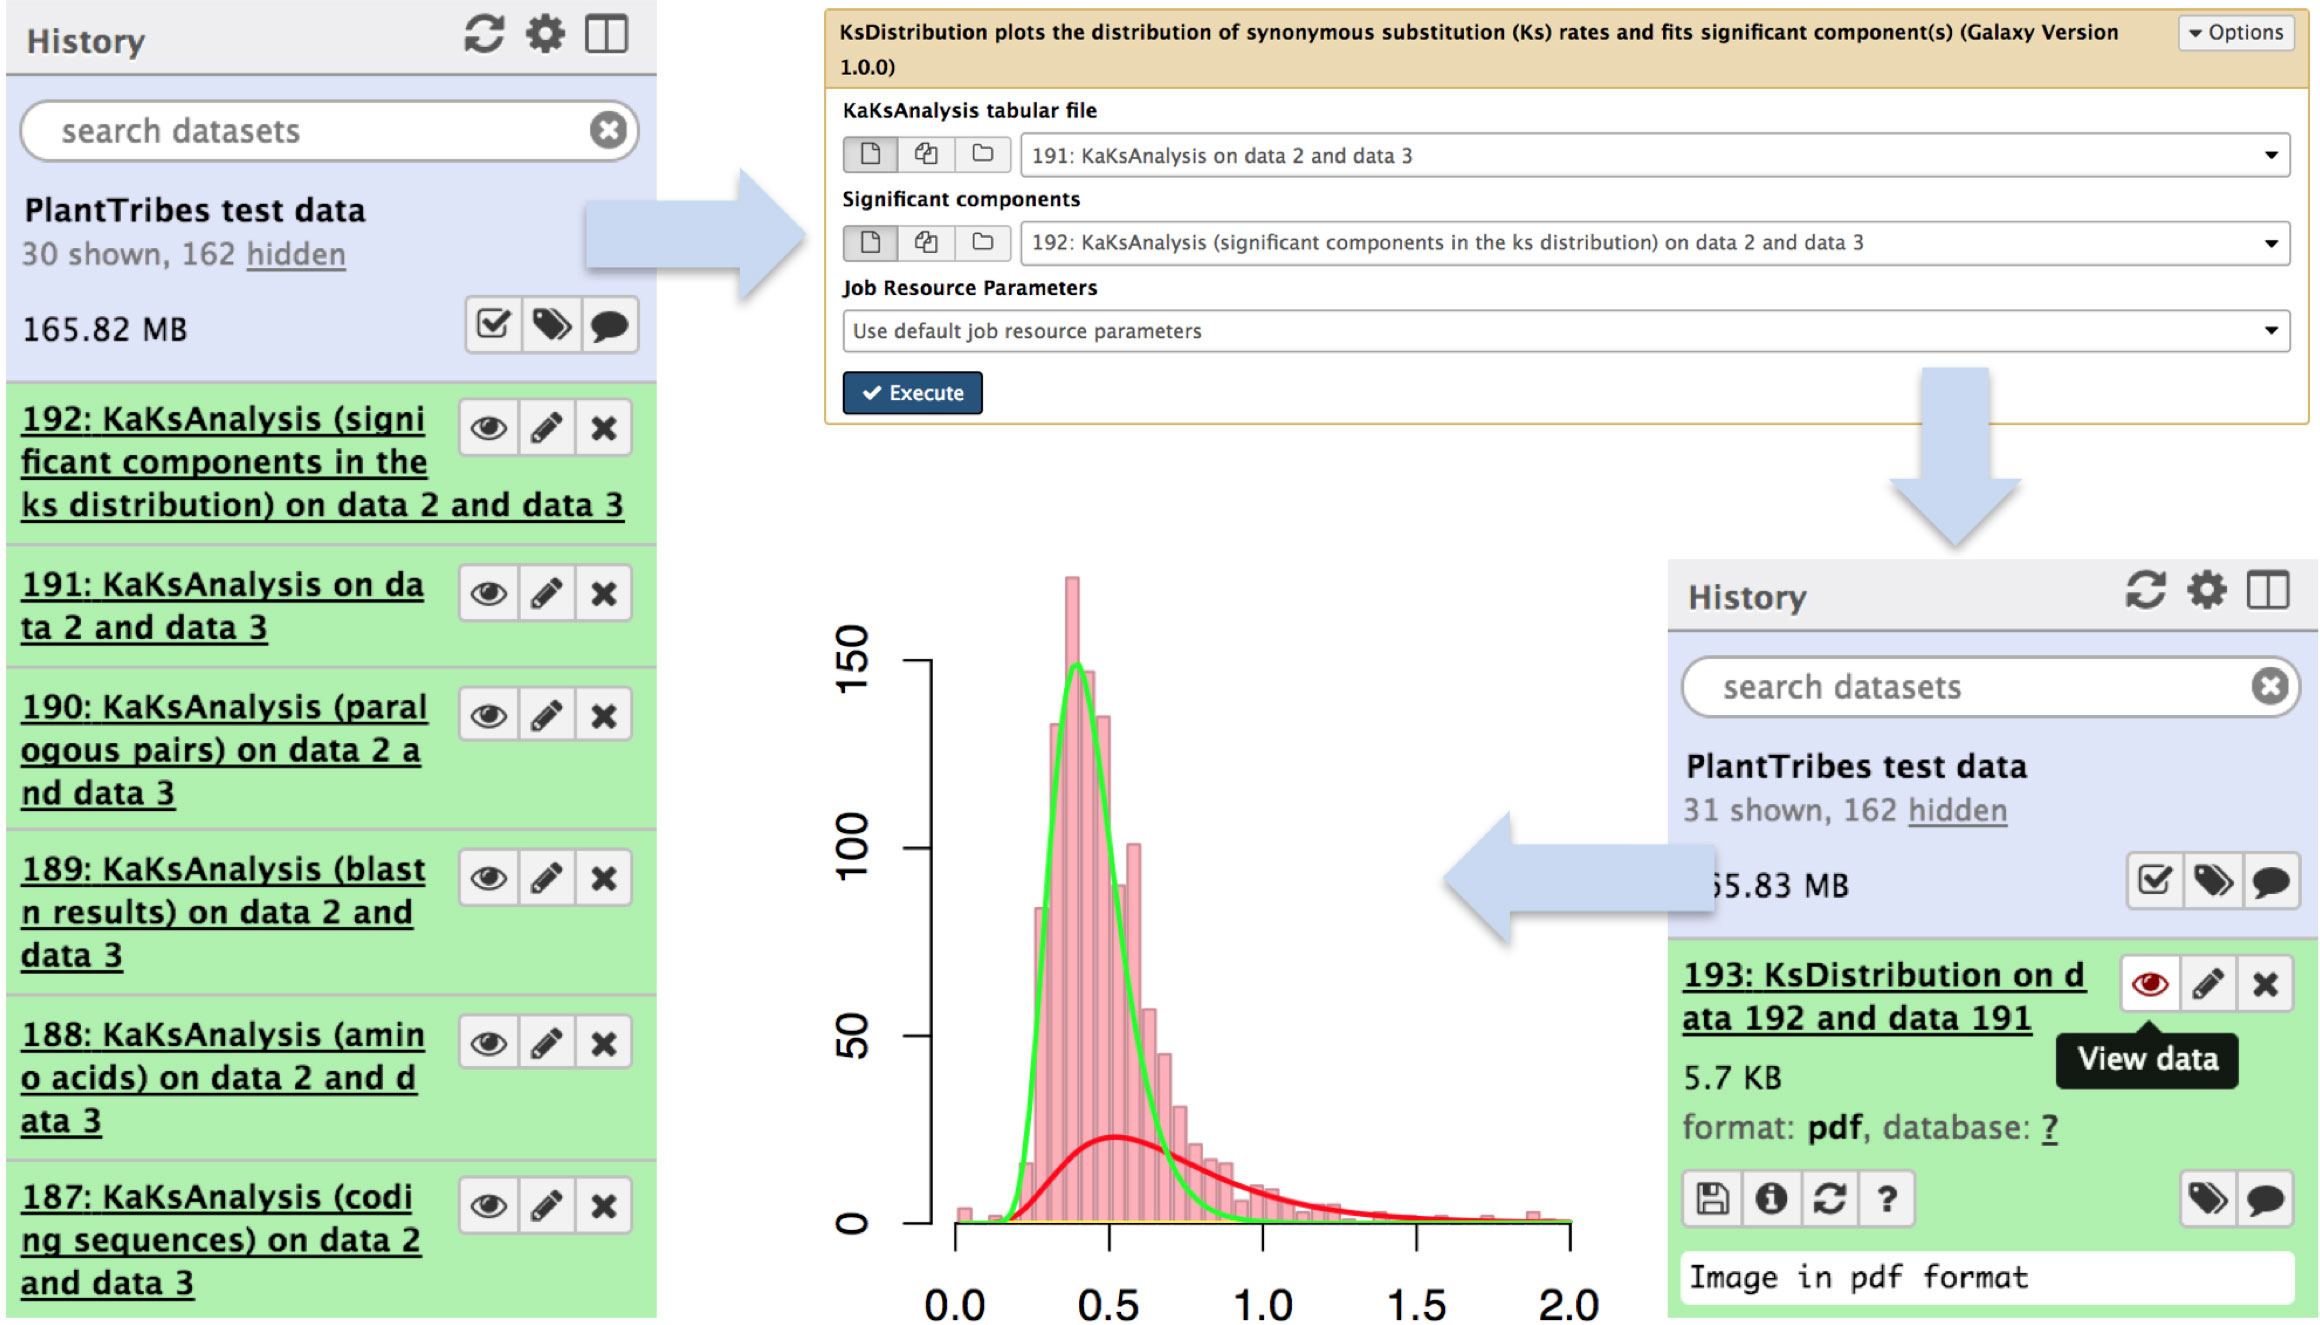
Figure 4 An illustration of genome duplication events detected using the Galaxy PlantTribes2 KaKsAnalysis tool. The KaKs analysis tool produces a list of outputs including self blastn results (item 189), a list of paralogous pairs (item 190), Ka (non-synonymous) and Ks (synonymous) substitution rates (item 191), and the significant components in the Ks distribution (item 192). Then the distribution of estimated paralogous pair Ks values is clustered into components using a mixture of multivariate normal distributions to identify significant duplication event(s) (item 193) and is visualized using Galaxy built-in tools.
3. Results
3.1. Performance evaluation of sequence classifiers
PlantTribes2 uses BLAST (blastp) and HMMER (hmmscan and hmmsearch) algorithms to classify inferred protein sequences into orthologous gene family clusters, a foundational step for many downstream analyses. To demonstrate the versatility of these two classifiers on gene family clusters, we present evaluations for classification algorithms using the pre-computed 22Gv1.1 gene family scaffold (Supplemental Table 2). This scaffold contains annotated protein coding sequences (CDSs) for 22 representative land plant genomes, including nine rosids, three asterids, two basal eudicots, five monocots, one basal angiosperm, one lycophyte, and one moss.
Three taxa with varying evolutionary distances in relationship to all the other taxa in the 22Gv1.1 gene family scaffold were selected: the only moss species, Physcomitrella patens, and two asterid sister species, Solanum lycopersicum and Solanum tuberosum. These three taxa were removed from the scaffold and then classified back to assess recall and precision of the BLAST and HMMER classifiers (Vihinen, 2012). Only protein sequences reassigned to their original orthologous clusters were considered true positives. In addition, F-score, a single metric that considers both recall and precision to measure the overall performance of the two classifiers, was calculated (Vihinen, 2012). The procedure is performed as described below:
(1) Distant: Physcomitrella patens was removed and sorted back into the scaffold to evaluate the performance of classifiers with distant species. No other moss or bryophyte species are present in this scaffold.
(2) Moderately Distant: Both Solanum lycopersicum and Solanum tuberosum were removed, and S. lycopersicum was sorted back into the scaffold to evaluate the performance of classifiers with moderately distant species. After removing both S. lycopersicum and S. tuberosum, no other sister species in the same plant family are present in the scaffold. However, close lineages, including three asterids and nine rosids, are present in the scaffold.
(3) Confamilial: Solanum lycopersicum was removed and sorted back into the scaffold to evaluate the performance of classifiers with confamilial species. Solanum tuberosum, a sister species from the same plant family, is present in the scaffold.
As shown in Figure 5, the overall classification performance for BLAST and HMMER is similar based on the F-scores across different evolutionary distances (73%-94% for BLAST, 67%-94% for HMMER). In addition, both classifiers have a higher recall rate when classifying into OrthoMCL and OrthoFinder clusters (90% - 96%) compared to GFam clusters (58% - 80%). HMMER is slightly more sensitive than BLAST when the evolutionary distance is significant, while BLAST is much more sensitive when classifying into GFam clusters at any evolutionary distance. Precision for both classifiers is similar across the evolutionary distance of the scaffold (78% - 95%). Classifying into OrthoFinder clusters yields much higher precision (80%-95%) than classifying into OrthoMCL (78%-86%) and GFam (81%-85%) clusters. These findings suggest that, regardless of the sequence classifier algorithm used or evolutionary distance, clusters inferred by orthology methods (OrthoFinder and OrthoMCL) result in better clustering performance compared to clusters inferred by a consensus domain-based method (GFam). We recommend using the merged classification results from BLAST and HMMER, as implemented in the pipeline, because it leverages the strength of both classifiers.
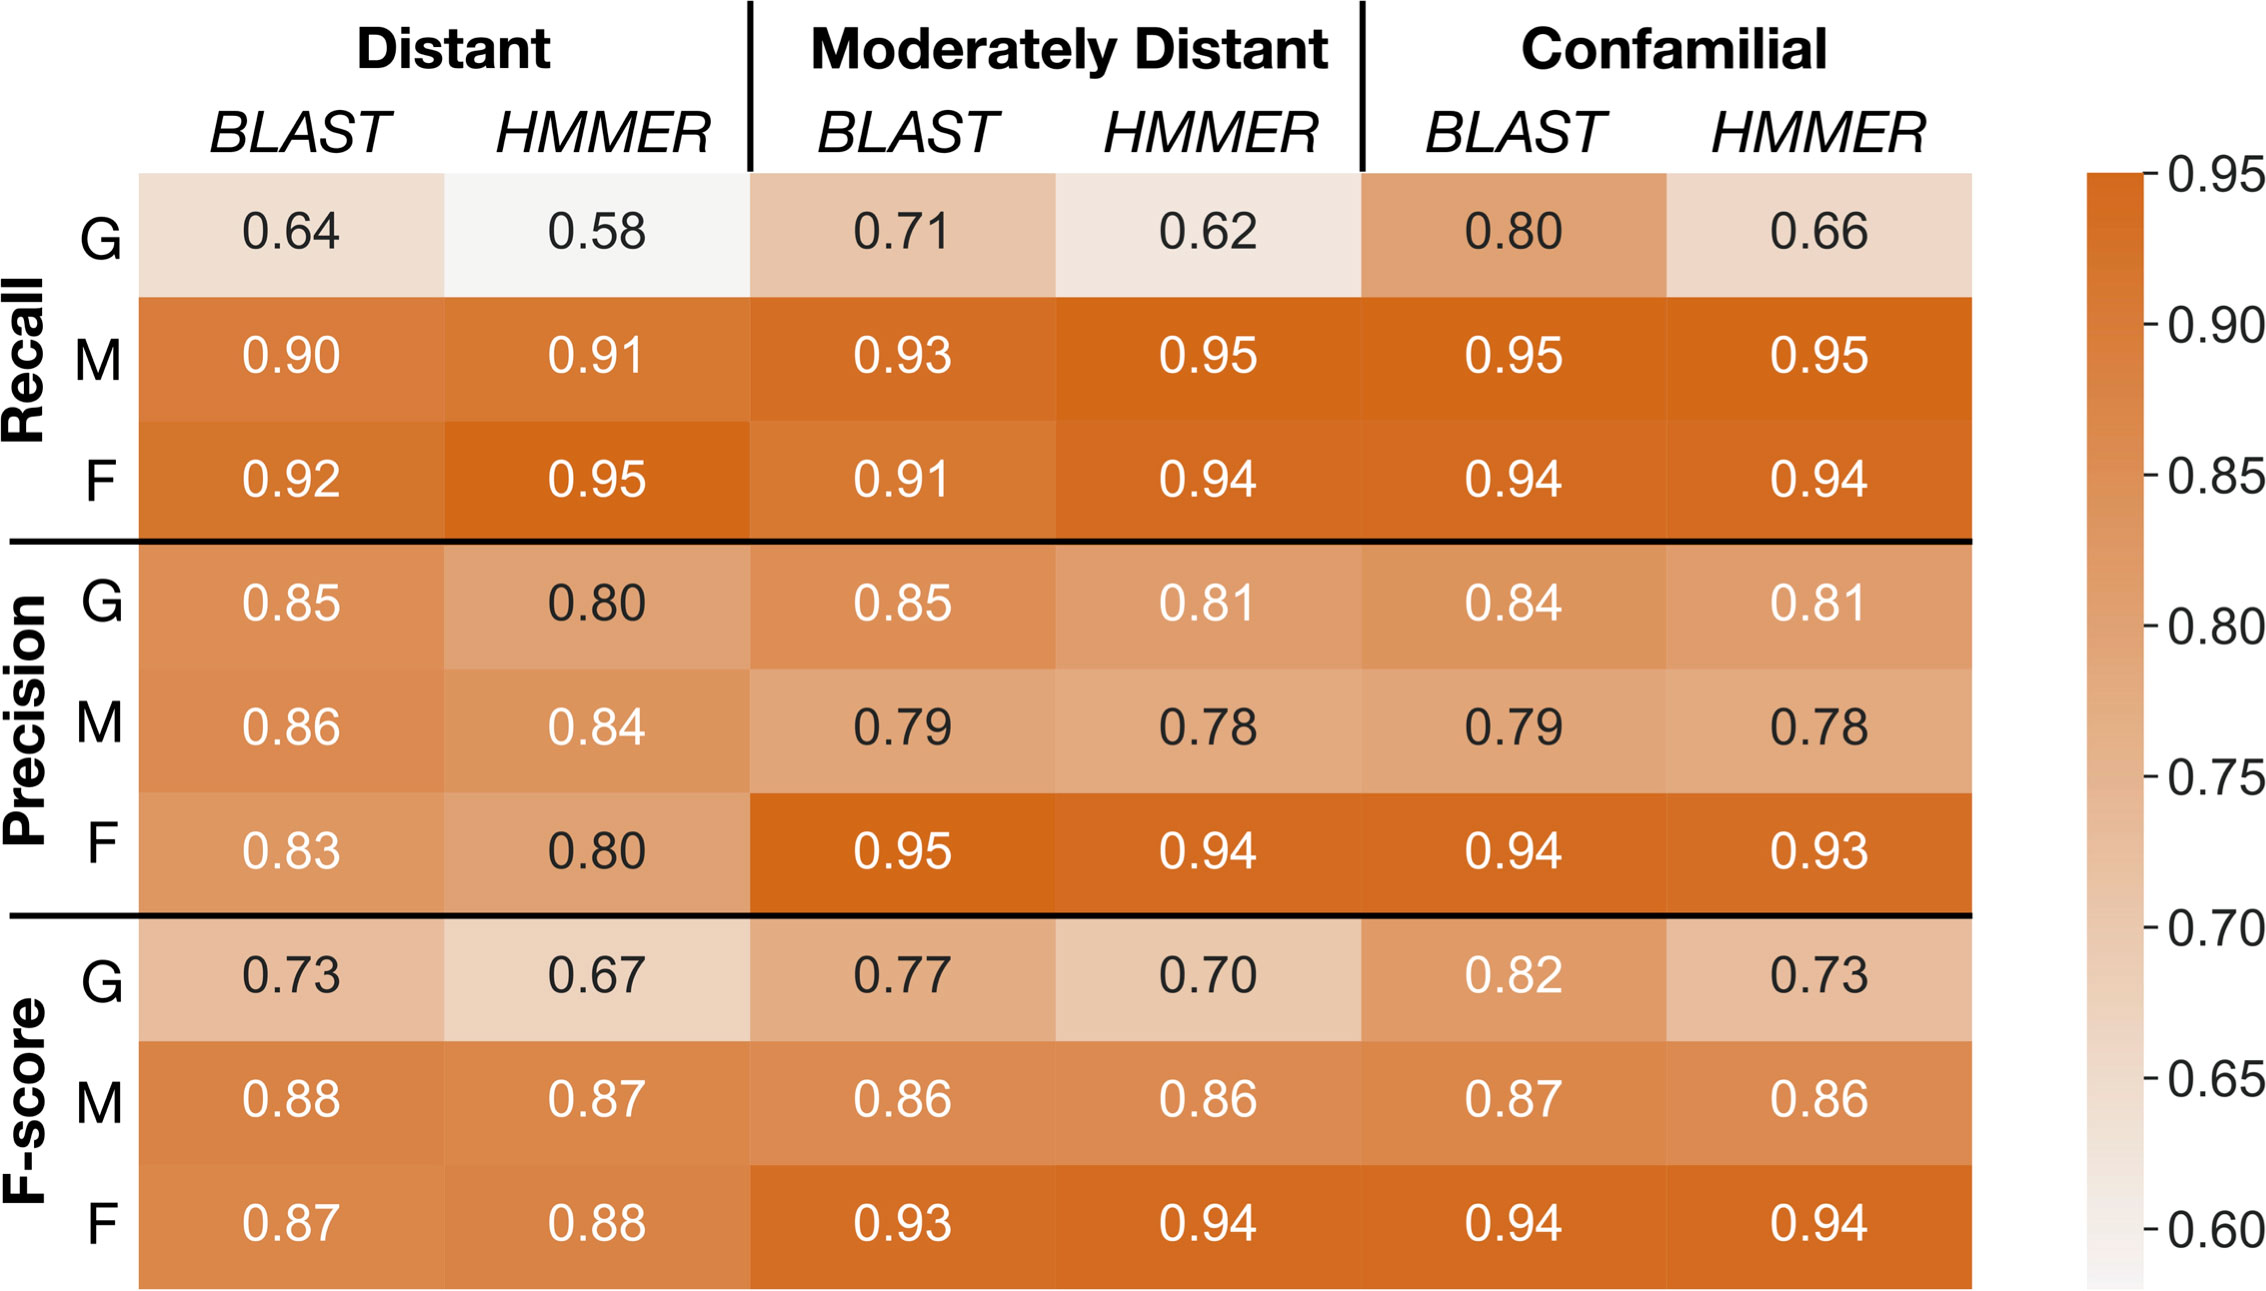
Figure 5 Summaries of performance evaluation of classification rates for BLAST and HMMER classifiers. Recall, precision, and F-score (Vihinen, 2012) for the two classifiers are measured on GFam (G), OrthoMCL (M), and OrthoFinder (F) clustering methods to determine how well taxa at different distances are classified into the PlantTribes2 22Gv1.1 gene family scaffold. Larger values are better. Distant: remove and sort back Physcomitrella patens, a species distantly related to all other scaffolding species; Moderately distant: remove Solanum lycopersicum and S. tuberosum, then sort back S. lycopersicum. No other Solanaceae species are present in the scaffold, but moderately distant species, i.e., other asterids, are used as scaffolding species; Confamilial: S. lycopersicum was removed and sorted back. A confamilial species, S. tuberosum, is present in the scaffold.
3.2. Examples of application
Here we provide examples of how to use PlantTribes2 to answer specific questions regarding (1) alleviating fragmentation issues in a de novo transcriptome assembly, (2) evaluation and improvement of gene families and gene models, and (3) assessing the quality of genomes in closely related species.
3.2.1. Evaluation of targeted gene family assembly
De novo assembly of RNA-Seq data is commonly used to reconstruct expressed transcripts for non-model species that lack quality reference genomes. However, heterogeneous sequence coverage, sequencing errors, polymorphism, and sequence repeats, among other factors, cause algorithms to generate contigs that are fragmented (Zhang et al., 2014; Honaas et al., 2016). In order to demonstrate the utility of the targeted gene family assembly function in PlantTribes2, we obtained raw Illumina transcriptome datasets sequenced by the Parasitic Plant Genome Project (http://ppgp.huck.psu.edu) that represent key life stages of three parasitic species in the Orobanchaceae family (Westwood et al., 2012; Yang et al., 2015b). These species span the full spectrum of plant parasitism (Westwood et al., 2010; Westwood et al., 2012), and include Triphysaria versicolor, Striga hermonthica, and Phelipanche aegyptiaca. Species-specific transcriptome assemblies were performed with Trinity (Haas et al., 2013) using two approaches: (1) combining raw Illumina reads from all development stages of the plant in a single assembly, and (2) multiple assemblies of individual developmental stages of the plant. A BUSCO (benchmarked universal single-copy orthologs) (Manni et al., 2021) assembly quality assessment using 1,440 universally conserved land plants’ single-copy orthologs suggests that the assembly combining all raw data recovers more conserved single-copy genes than any developmental stage-specific assembly (Combined v.s. Stage in Figure 6 and Supplemental Table 4). However, a meta-assembly of transcripts from both approaches with the targeted gene family function of the AssemblyPostProcessor tool using the 26Gv1.0 gene family scaffold recovers even more full-length conserved single-copy genes (Meta v.s. others in Figure 6 and Supplemental Table 4). Therefore, the meta-assembly implementation of the PlantTribes2 AssemblyPostProcessor tool can benefit many comparative transcriptome studies of non-model species to alleviate transcript fragmentation in gene families of interest.
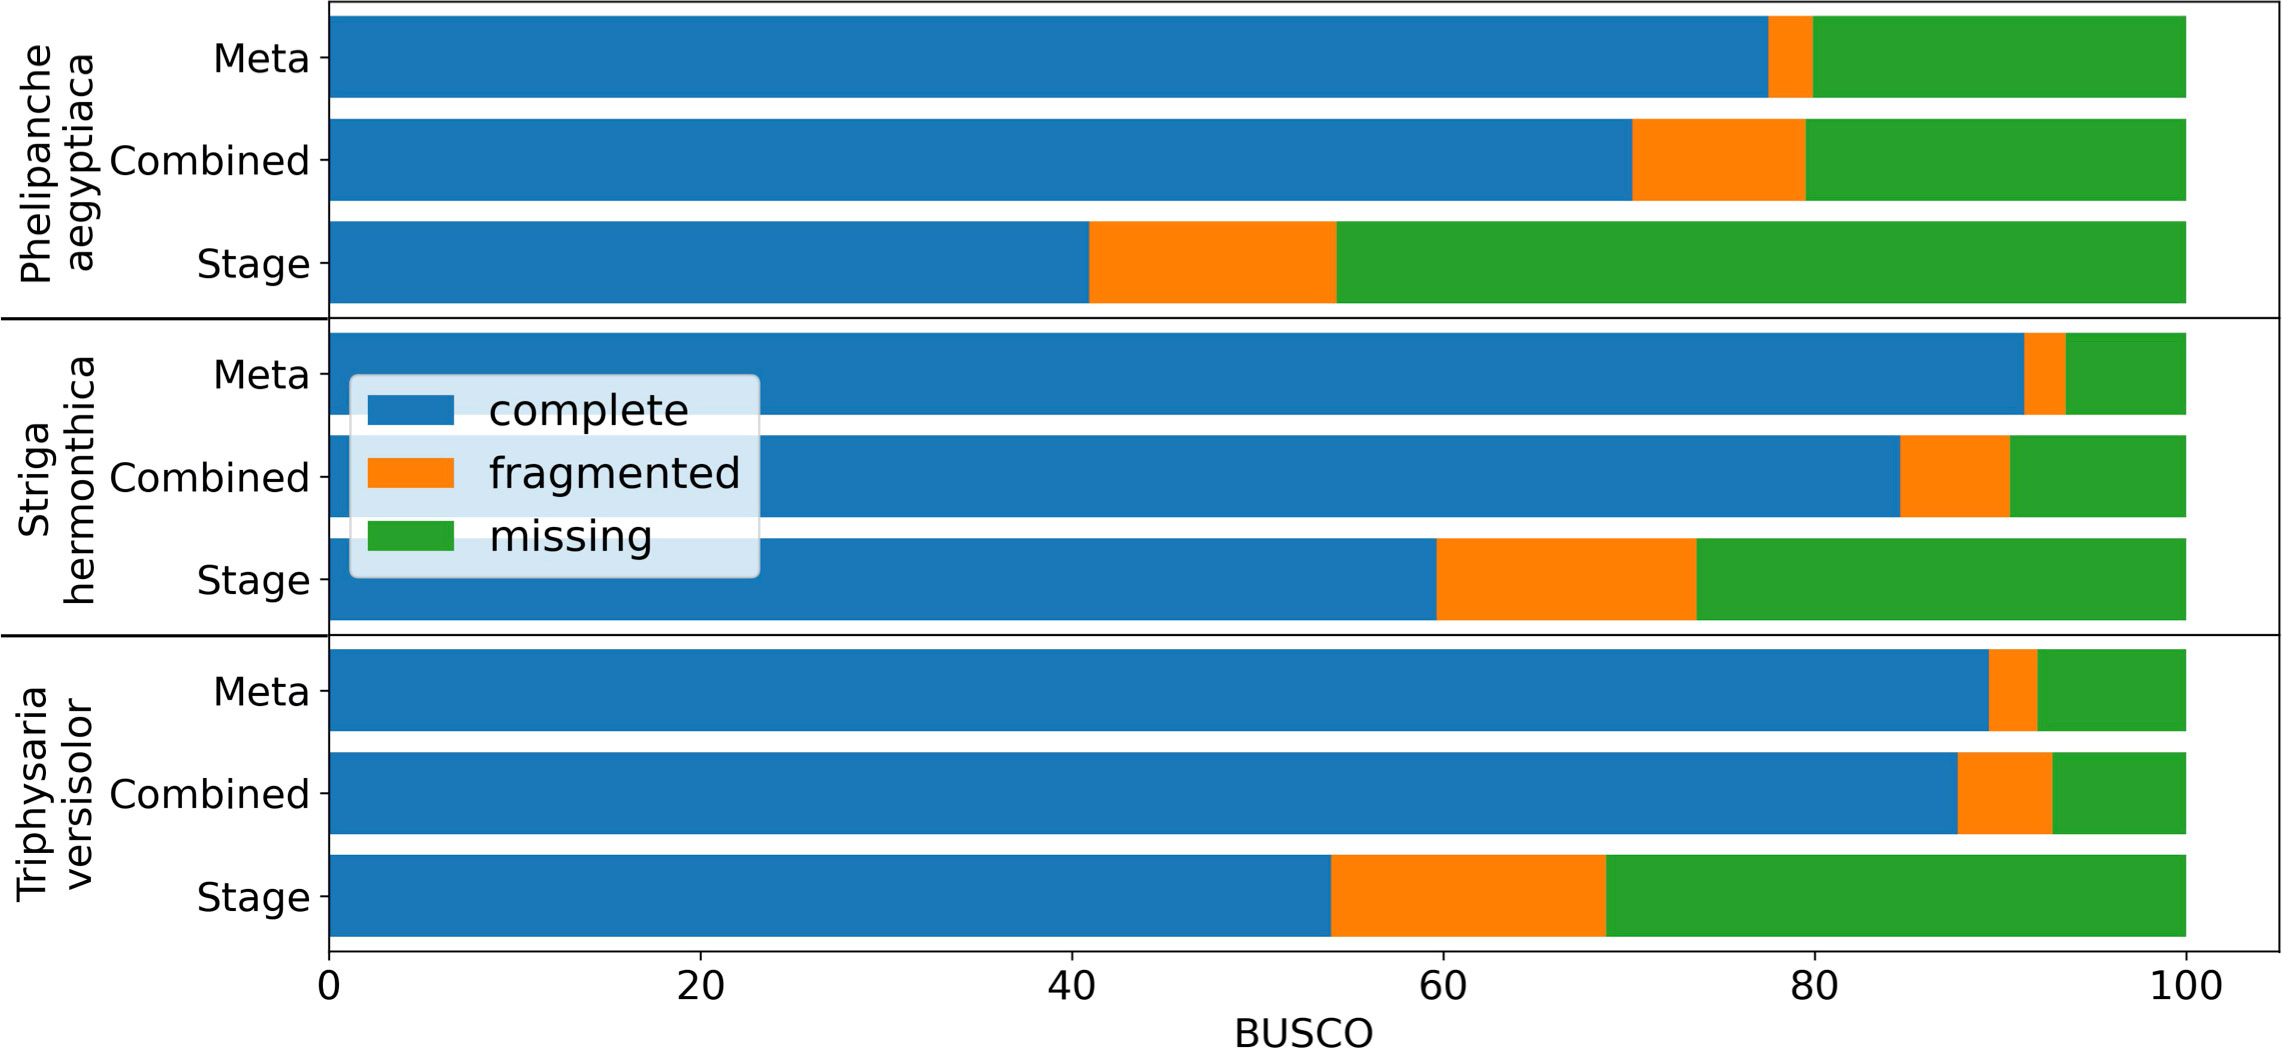
Figure 6 BUSCO completeness assessment of transcriptome assemblies to illustrate the results from targeted gene family assembly (meta-assembly) function in the PlantTribes2 AssemblyPostProcessor tool compared to Trinity approaches. Color bars indicate complete (blue), fragmented (orange), and missing (green) BUSCOs. Assemblies of parasitic plants, Phelipanche, Striga, and Triphysaria, examined include (1) developmental stage-specific assemblies (Stage, only the average of all the stages were shown in the plot), (2) assemblies combining all stage-specific raw data (Combined), and (3) meta-assembly of stage-specific assemblies and combined assembly (Meta) using AssemblyPostProcessor.
3.2.2. Application in evaluating and improving gene families
Gene and gene family studies in non-model organisms are challenging due to the varying quality of genome assemblies and annotations, as well as the lack of closely related species as an annotation reference. Thousands of genes lack accurate gene models in draft and early version genomes (Darwish et al., 2015; Marx et al., 2016; Li et al., 2017; Pilkington et al., 2018; Li et al, 2019; Liu et al., 2021) creating pitfalls for global-scale analyses, but especially for researchers conducting reverse genetics studies. For example, in the first version of the apple (Malus domestica) genome annotation, we discovered that the gene model of MDP0000250518, annotated as MdPIN8a by Song et al. (2016), is problematic. A nucleotide sequence comparison of MDP0000250518 and its orthologous genes in other Rosaceae genomes, identified using the PlantTribes2 orthogroup classification function, showed that this gene model is likely a combination of the putative MdPIN8a and a neighboring gene, which encodes a voltage dependent anion channel (VDAC) (Figure 7). These two genes are located about 3000bp apart on the same chromosome in most Rosaceae genomes (Supplemental Table 5). Analyses carried out using this incorrect gene model may confound or compromise the work. For example, in absence of the contextual gene family information we now have from analyses with PlantTribes2, the authors in Song et al. (2016) unknowingly designed primers for the MDP0000250518 gene model that targeted the VDAC gene rather than the actual gene of interest, MdPIN8a (Figure 7). We identified the mis-annotated gene using contextual gene family information; a reliable way to avoid such pitfalls.
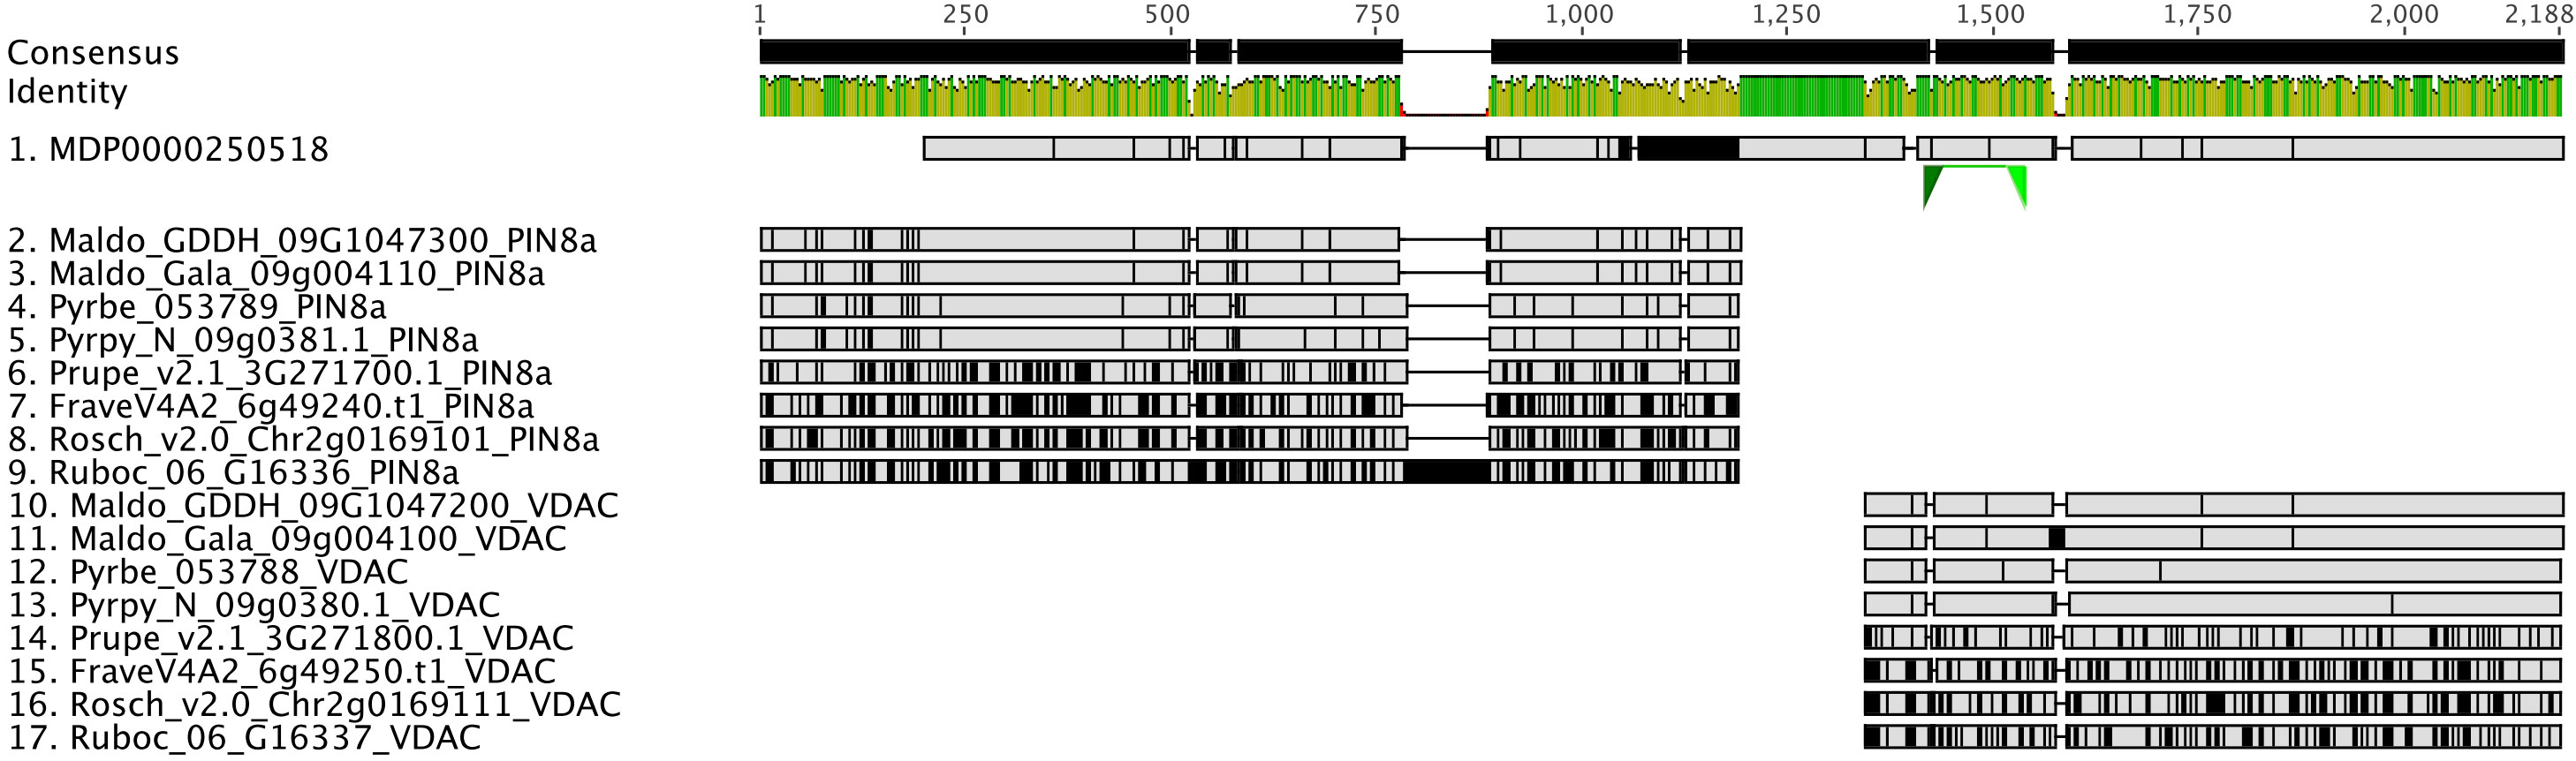
Figure 7 Identification of an incorrect auxin transporter gene model, MdPIN8a, in Malus domestica genome annotation version 1. Nucleotide sequence alignment of putative PIN8a and VDAC genes from 9 Rosaceae genomes were shown here. MDP0000250518 (sequence 1) gene model is a combination of two genes: The 5’ end of MDP0000250518 shares high sequence similarity with the PIN8a gene from other Rosaceae species (sequence 2 to 9), while its 3’ end shows evidence of homology to a neighboring gene, VDAC, in the investigated genomes (sequence 10 to 17). Green triangles below MDP0000250518 show the binding sites of the qRT-PCR primers used in the Song et al., 2016 research. Gray color indicates identical nucleotides compared to the consensus, while black color indicates different nucleotides. Genome abbreviations can be found in Supplemental Table 7.
Better gene models can be obtained from re-annotating existing or new genome assemblies with additional transcriptome data. For instance, tens of thousands of gene models were improved or added in the subsequent annotations in several strawberry genomes (Darwish et al., 2015; Li et al., 2017; Li et al, 2019; Liu et al., 2021). In later versions of apple genome annotations, erroneous gene models such as MdPIN8a and the neighboring gene, VDAC, are corrected and are now concordant with other Rosaceae (Figure 7). This improved gene information provides a better starting point for studies like Song et al., 2016, however, full reannotation of complex plant genomes is a time-consuming and a resource-intensive undertaking.
A more efficient solution is targeted gene model improvement by evaluation of genes of interest (GOIs) from a gene family perspective. The comparative genomic and phylogenomic tools offered by PlantTribes2 allows researchers to efficiently compare orthologous genes across many closely related species and identify problematic genes in a high-throughput fashion. In a recent study with a goal to identify tree architecture genes in Pyrus (pear), functions from PlantTribes2 were used at the core of the workflow (Zhang et al., 2022, the companion paper in this issue). Using the alignments and phylogenies generated by the GeneFamilyAligner and GeneFamilyPhylogenyBuilder tools from PlantTribes2, hundreds of problematic gene models were identified. For instance, two fragments of a putative pear DWARF4 (DWF4) gene were found in the Pyrus communis ‘Bartlett’ Double Haploid (Bartlett.DH) genome annotation (Linsmith et al., 2019), one of which showed little evidence of homology at the 3’ end of its coding sequence compared to other apple and pear DWF4 genes. This problem was easily recognized in the nucleotide sequence alignment and phylogeny produced by PlantTribes2 (Figures 8A, C). Moreover, the homologous sequences from the PlantTribes2 orthogroups were readily used as resources for target-gene family annotation tools, such as TGFam-Finder (Kim et al., 2020) and Bitacora (Vizueta et al., 2020). In the case of DWF4, using the PlantTribes2 derived orthogroup information as reference, a more complete DWF4 gene homologous to other Maleae sequences was annotated from the Bartlett.DH genome (Figures 8B, C). More examples like the DWF4 gene are presented in Zhang et al., 2022.
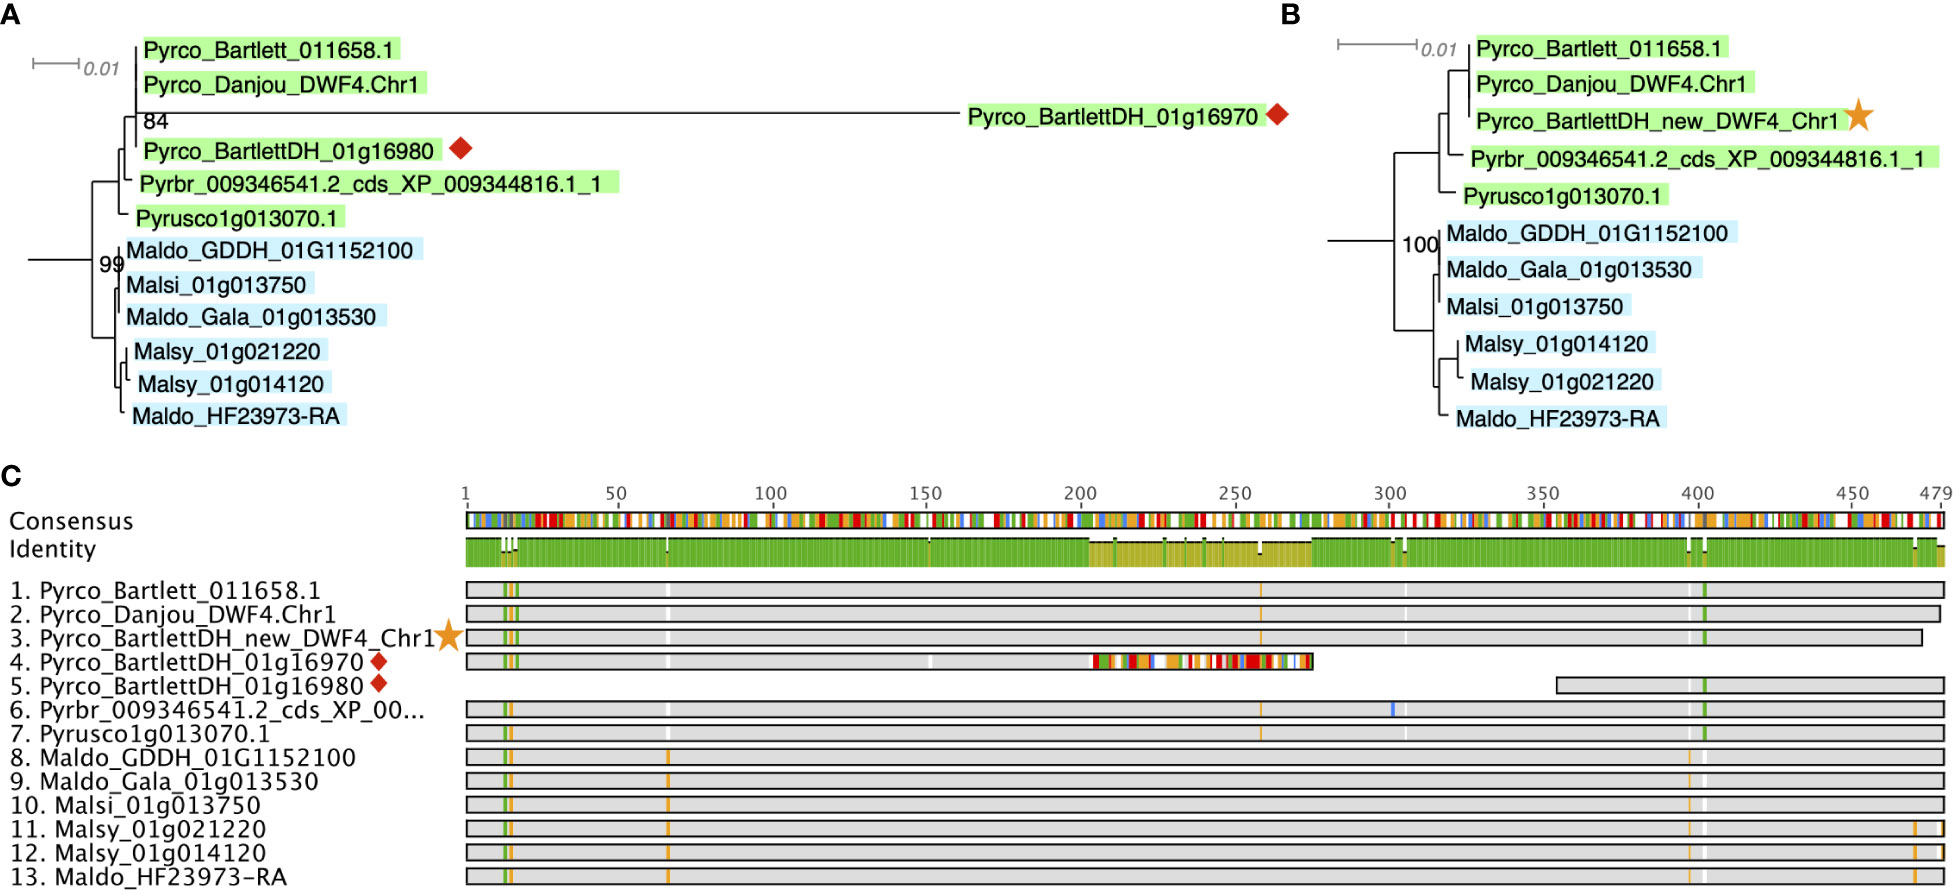
Figure 8 Example of a putative DWF4 gene before (red diamond) and after (yellow star) improvement. (A, B) show a section of the DWF4 gene family tree with Bartlett_DH gene models before and after improvement, respectively. (C) is the sequence alignment of the DWF4 gene coding region in Malus and Pyrus genomes. Gray color indicates identical nucleotides compared to the consensus, while colors indicate different nucleotides. Genome abbreviations can be found in Supplemental Table 7.
3.2.3. Application in evaluating genome quality
A BUSCO analysis is a widely accepted benchmark to assess the completeness and accuracy of genomic resources (Manni et al., 2021). However, it only takes into consideration a very small fraction of the gene space. By definition, BUSCOs appear as highly conserved single copy genes in many organisms and return rapidly to single copy following gene and genome duplication. BUSCO genes may not reflect the quality of more challenging regions of the genome and the integrity of complex and divergent gene families. With more genomic resources being produced, especially in some agronomically important genera/species, lineage-specific BUSCO databases have been developed, bringing in larger numbers of markers. For instance, the poales_odb10 contains 3 times more markers than the generic embryophyta_odb10. However, this type of database has only been developed for 4 plant orders (Brassicales, Solanales, Poales, and Fabales), and like other BUSCO databases, only single copy genes are used. Following the same philosophy as the lineage-specific BUSCO databases, the natural next step is a gene-by-gene assessment on a genome scale, as proposed by Honaas et al (2016) regarding de novo transcriptome assembly evaluation. Here we present a case study of using the objective orthogroup classification offered by PlantTribes2 to evaluate the quality of genome annotations from a comparative perspective in Rosaceae, a step towards a gene-by-gene approach.
The number of publicly available Rosaceae genomes, generated by researchers all around the world using different technologies, has increased exponentially in the last decade (Jung et al., 2019). To better estimate the accuracy and sensitivity of genome annotation across a wide range of Rosaceae species, we created family-specific “CoRe OrthoGroups (CROGs) - Rosaceae”. First, 26 representative genomes from six genera (Malus, Pyrus, Prunus, Fragaria, Rosa, and Rubus. Supplemental Tables 6, 7) in five major Rosaceae tribes were classified into the PlantTribes2 26Gv2.0 scaffold. Next, the union of orthogroups from each genus was generated, creating genus-level master orthogroups. Then the overlap of the six master orthogroups, consisting of 9656 orthogroups, were designated as the CROGs (Figure 9A, Supplemental Table 8), which is so far the most complete list of cores Rosaceae genes. Rich information from the CROGs, i.e., the percentage of CROGs captured in each genome, gene counts in CROGs, and sequence similarity compared to the CROG consensus, can be used to assess annotation quality, pinpoint areas needing improvement, and find potentially interesting biology.

Figure 9 CoRe OrthoGroups - Rosaceae (CROGs). (A) Upset plot showing overlapping orthogroups between six Rosaceae genera, including 9656 orthogroups shared by all six genera (designated as “CROGs – Rosaceae”). (B) High correlation between Rosaceae genome annotation BUSCOs and % CROGs captured in the genomes (p<0.01). (C) Z-score distribution of gene counts in CROGs among selected Rosaceae genomes excluding Malus and Pyrus, shown as a clustermap (upper) and a box plot (lower). Each column represents a genome and each row in the clustermap represents a CROG. (D) Z-score distribution of gene counts in CROGs among selected Malus and Pyrus genomes, shown as a clustermap (upper) and a box plot (lower). Genome abbreviations can be found in Supplemental Table 7.
First, we calculated the percentage of CROGs captured in 26 Rosaceae genomes and correlated the %CROGs with the corresponding annotation BUSCO scores (Supplemental Table 6). The high positive correlation (R2 = 0.82, Figure 9B) indicates that these two philosophically similar approaches draw the same conclusions for most genomes, however, CROGs provide additional information allowing more in-depth explorations of annotation quality.
Next, we calculated gene counts in each CROG. Due to the difference in chromosome numbers (17 chromosomes in Maleae and 9 in other genera) and a unique recent whole genome duplication event in the common ancestor of Maleae (Hodel et al, 2022), apple and pear genomes have more gene copies in most orthogroups than other Rosaceae. To make more appropriate comparisons, we generated two CROG gene count matrices, one for Maleae and one for other Rosaceae (Supplemental Tables 9, 10, respectively). Our hypothesis is that a high-quality genome will have a predictable and consistent number of genes in a large majority of CROGs. This is because issues that have predictable impacts on genome assembly and annotation are dependent on individual genome characteristics, the data used in assembly and annotation, and the various methodologies employed therein - thus creating a comparative framework with complementary error structure. Simply put, it is unlikely that a gene family will show a consistent yet erroneous shift in gene content due to methodological reasons alone. This perspective can reduce the false positive rate for evolutionary inference of lineage-specific shifts in gene family content by flagging changes in individual genomes that may be due to methodological bias.
As expected, in the non-Maleae matrix, nearly half of the CROGs (4,728) have the same number of genes or different gene counts in only 1 or 2 genomes. When we visualized the gene count matrix using the Seaborn z-score clustermap package (CROGs with standard deviation of 0 were removed prior to plotting), the four different versions of Fragaria vesca annotations clustered together (Figure 9C). They shared similar z-score patterns in most CROGs, but fewer low z-score regions (shown as cooler colors) were found in the later versions of annotation (v2.2 and v4.2). These two annotations also have a mean z-score closer to 0 and relatively small variance compared to the earlier annotations. A similar pattern was seen while comparing the first version of the apple genome, Maldo_GDv1, to the more recent ones (Maldo_Gala and Maldo_GDDH in Figure 9D). Our results are consistent with previous reports (Daccord et al., 2017; Li et al., 2017; Li et al, 2019) and the CROG approach provided a fast and easy-to-visualize way to summarize these findings.
The clustermaps also allowed us to gain new insights from these genomes. For instance, there is not clear clustering of Malus or Pyrus at the genus level, however, the more recent genomes, which have less variable z-score distribution centered near 0, are clustered together (Figure 9D). We hypothesize that the current clustering is mainly driven by genome annotation strategy and quality, and therefore it is showing methodological similarities rather than biological patterns. The fact that Malus domestica Gala (Maldo_Gala) is clustered with M. sieversii (Malsi) and M. sylvestris (Malsy), genomes generated using the same method, rather than the other high-quality M. domestica genome, Maldo_GDDH, supports this hypothesis (Daccord et al., 2017; Sun et al., 2020).
Another unexpected observation is that the earlier version of the European pear (Pyrus communis) genome, Pyrco_BPv1 (Chagné et al., 2014), shared a more similar gene count pattern with some of the best Maleae genomes. On the contrary, the second version, Pyrco_BPDH (Linsmith et al., 2019), a double haploid genome, does not. Apple and pear are highly heterozygous, which is known to cause fragmented genome assembly and introduce multiple alleles to the annotation. Sequencing isogenic genotypes, such as a double haploid, is a common solution (Daccord et al., 2017; Linsmith et al., 2019; Zhang et al., 2019). This process will reduce the complexity in genome assembly and should have little to no influence on the number of genes in a genome, or even in individual gene families. When a smaller number of protein coding genes were annotated from the Pyrco_BPDH genome compared to version one, the authors hypothesized that the difference is resulted from removal of allelic sequences annotated as genes (“allelic genes”) in the much more contiguous double haploid genome (Linsmith et al., 2019). However, our CROG gene count matrix indicates that the smaller gene number in Pyrco_BPDH is caused, at least in part, by CROG genes and gene families missing from the annotation - indeed the Pyrco_BPv1 genome captured a vast majority of the CROGs with the expected gene count, despite annotation of some allelic genes. This statement is supported by an investigation in putative tree architecture gene families by Zhang et al., 2022 (the companion paper). About half of the genes of interest were missing in the original Pyrco_BPDH annotation, but were recovered using a polished assembly and targeted annotation approaches (Figure 10).
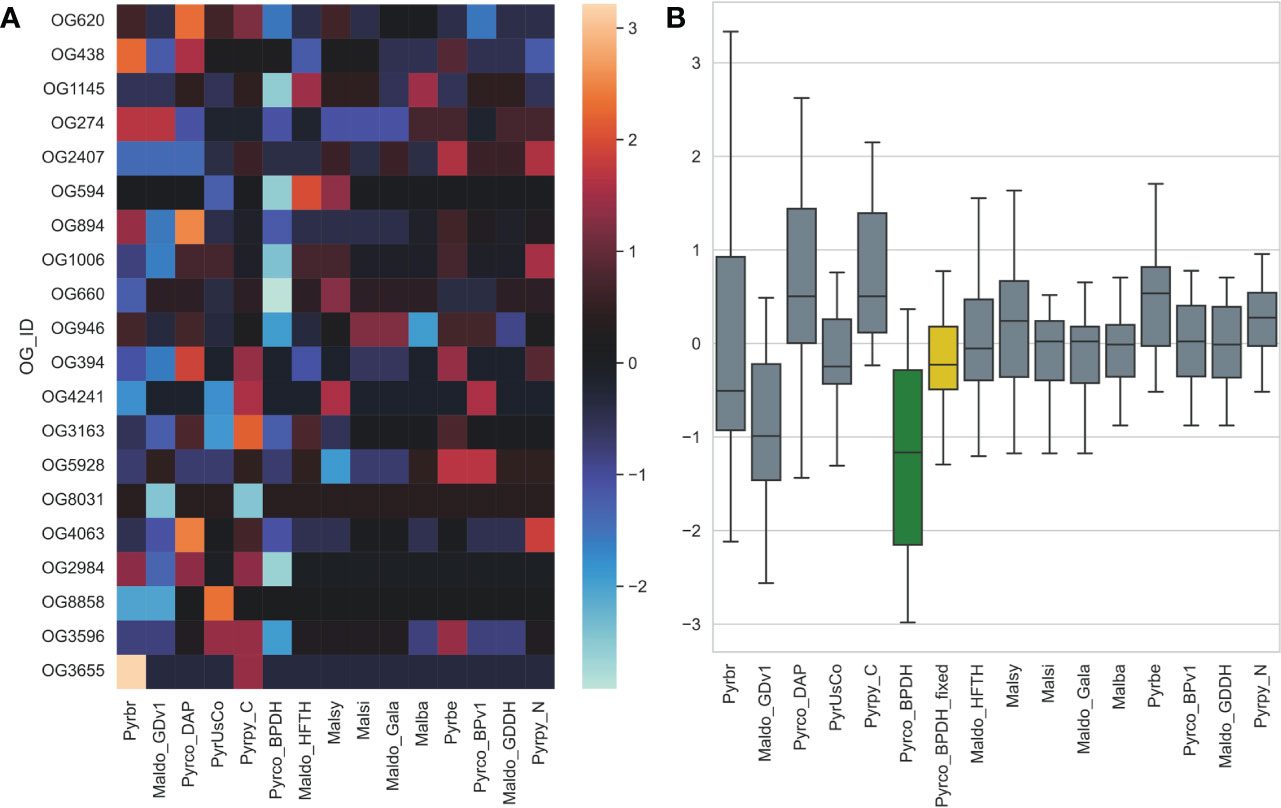
Figure 10 The gene count z-score of selected tree architecture gene families across Pyrus and Malus genomes. Pyrco_BPDH orthogroups have lower z-scores than most others, which is shown with a cooler color in the heatmap (A) and lower average z-score (green box in B), indicating fewer than expected gene counts. These missing genes were discovered after the targeted re-annotation process, which brought the average gene count z-score closer to 0 (yellow box in B) and comparable to other high-quality genomes. Genome abbreviations can be found in Supplemental Table 7.
The “hot” zones in the clustermaps also attract attention. To investigate the hot zones in the Maleae matrix, we examined the gene counts and annotation of 150 CROGs with the highest z-score from each genome. In most genomes, these CROG annotations lack a pattern, and the high z-score is caused by one or few extra copies, which may be caused by the introduction of alleles from fragmented assembly or could indicate genome-specific duplications. However, in some high z-score CROGs in Pyrus betulifolia (Pyrbe) (Dong et al., 2020), Malus sieversii (Malsi), M. sylvestris (Malsy), and M. domestica ‘Gala’ (Maldo_Gala) (Sun et al., 2020), the targeted genome has up to 10 times more genes than the others and the annotation of these CROGs are often related to transposons and repeat-containing genes (Supplemental Table 11). This finding suggests certain downstream analyses, such as repeat type comparison and gene family expansion estimation, can be bolstered against such pitfalls by a CROG analysis.
Using the PlantTribes2 orthogroup classification, we created a new method to evaluate genome quality in more depth, leveraging resources across an important plant family. The CROG gene count matrix does not only provide a highly effective way to visualize differences in gene numbers from a comparative genomic perspective, but also pinpoints where improvements could be made. As genomic resources are rapidly increasing, a CROG analysis can also help to inform the selection of the most appropriate genomes for comparative genomic studies, by avoiding specific issues related to assembly and annotation. Moreover, this approach can be applied to any groups of plants, creating custom CROGs for assessing the quality of genomes of interest.
4. Conclusions
PlantTribes2 uses pre-computed or expert gene family classifications for comparative and evolutionary analyses of gene families and transcriptomes for all types of organisms. The two main goals of PlantTribes2 are: (1) continual development of a scalable and modular set of analysis tools and methods that leverage gene family classifications for comparative genomics and phylogenomics to gain novel insight into the evolutionary history of genomes, gene families, and the tree of life; (2) to make these tools broadly available to the research community as a stand-alone package and also within the Galaxy Workbench. Many genomic studies, including inference of species relationships, the timing of gene duplication and polyploidy, reconstruction of ancestral gene content, the timing of new gene function evolution, detection of reticulate evolutionary events such as horizontal gene transfer, assessment of gene family and genome quality, and many others, can all be performed using PlantTribes2 tools. The modular structure, which allows component tools of the pipeline to be independent from each other, makes the PlantTribes2 tools easy to enhance over time.
Data availability statement
The datasets presented in this study can be found in online repositories: Project name: PlantTribes2 Archived version: 1.0.4 Project home page: https://github.com/dePamphilis/PlantTribes; Galaxy: https://usegalaxy.org Bioconda: https://bioconda.github.io/search.html?q=PlantTribes; Tutorials: https://github.com/dePamphilis/PlantTribes/blob/master/docs/Tutorial.md.; https://galaxyproject.org/tutorials/pt_gfam/; Operating system(s): Linux, Mac OS X; Programming language: Perl, Python; Other requirements: Web browser for Galaxy; 553 License: GNU.
Author contributions
EW, JL-M., and CD conceived and designed the research. EW, HZ, LH, and GK performed the analyses. All authors contributed to the article and approved the submitted version.
Funding
We acknowledge funding from the National Science Foundation (NSF) DBI-1238057, NSF IOS-0922742, the NSF Plant Cyberinfrastructure Program through iPlant (now CyVerse; DBI-0735191), the The iPlant Tree of Life Grand Challenge Project, USDA ARS, WTFRC grant AP-19-103.
Acknowledgments
The authors thank Heidi Hargarten for editing and revising the manuscript.
Conflict of interest
The authors declare that the research was conducted in the absence of any commercial or financial relationships that could be construed as a potential conflict of interest.
Publisher’s note
All claims expressed in this article are solely those of the authors and do not necessarily represent those of their affiliated organizations, or those of the publisher, the editors and the reviewers. Any product that may be evaluated in this article, or claim that may be made by its manufacturer, is not guaranteed or endorsed by the publisher.
Supplementary material
The Supplementary Material for this article can be found online at: https://www.frontiersin.org/articles/10.3389/fpls.2022.1011199/full#supplementary-material
References
Altenhoff, A. M., Levy, J., Zarowiecki, M., Tomiczek, B., Vesztrocy, A. W., Dalquen, D. A., et al. (2019). OMA standalone: Orthology inference among public and custom genomes and transcriptomes. Genome Res. 29, 1152–1163. doi: 10.1101/gr.243212.118
Ashburner, M., Ball, C. A., Blake, J. A., Botstein, D., Butler, H., Cherry, J. M., et al. (2000). Gene ontology: tool for the unification of biology. Nat. Genet. 25, 25–29. doi: 10.1038/75556
Barrett, T., Wilhite, S. E., Ledoux, P., Evangelista, C., Kim, I. F., Tomashevsky, M., et al. (2013). NCBI GEO: archive for functional genomics data sets - update. Nucleic Acids Res. 41, D991–D995. doi: 10.1093/nar/gks1193
Bel, M. V., Silvestri, F., Weitz, E. M., Kreft, L., Botzki, A., Coppens, F., et al. (2021). PLAZA 5.0: Extending the scope and power of comparative and functional genomics in plants. Nucleic Acids Res. 50, D1468–D1474. doi: 10.1093/nar/gkab1024
Berardini, T. Z., Reiser, L., Li, D., Mezheritsky, Y., Muller, R., Strait, E., et al. (2015). The arabidopsis information resource: Making and mining the “gold standard” annotated reference plant genome. Genesis 53, 474–485. doi: 10.1002/dvg.22877
Blankenberg, D., Kuster, G. V., Bouvier, E., Baker, D., Afgan, E., Stoler, N., et al. (2014). Dissemination of scientific software with galaxy ToolShed. Genome Biol. 15, 403. doi: 10.1186/gb4161
Blom, J., Kreis, J., Spänig, S., Juhre, T., Bertelli, C., Ernst, C., et al. (2016). EDGAR 2.0: an enhanced software platform for comparative gene content analyses. Nucleic Acids Res. 44, W22–W28. doi: 10.1093/nar/gkw255
Blum, M., Chang, H.-Y., Chuguransky, S., Grego, T., Kandasaamy, S., Mitchell, A., et al. (2020). The InterPro protein families and domains database: 20 years on. Nucleic Acids Res. 49, D344–D354. doi: 10.1093/nar/gkaa977
Bowers, J. E., Chapman, B. A., Rong, J., Paterson, A. H. (2003). Unravelling angiosperm genome evolution by phylogenetic analysis of chromosomal duplication events Nat. 422, 433–438. doi: 10.1038/nature01521
Camacho, C., Coulouris, G., Avagyan, V., Ma, N., Papadopoulos, J., Bealer, K., et al. (2009). BLAST+: Architecture and applications. BMC Bioinf. 10, 421. doi: 10.1186/1471-2105-10-421
Capella-Gutiérrez, S., Silla-Martínez, J. M., Gabaldón, T. (2009). trimAl: a tool for automated alignment trimming in large-scale phylogenetic analyses. Bioinformatics 25, 1972–1973. doi: 10.1093/bioinformatics/btp348
Carbon, S., Douglass, E., Dunn, N., Good, B., Harris, N. L., Lewis, S. E., et al. (2019). The gene ontology resource: 20 years and still GOing strong. Nucleic Acids Res. 47, D330–D338. doi: 10.1093/nar/gky1055
Carvalho, D. S., Schnable, J. C., Almeida, A. M. R. (2018). Integrating phylogenetic and network approaches to study gene family evolution: The case of the AGAMOUS family of floral genes. Evol. Bioinform. Online 14, 1176934318764683. doi: 10.1177/1176934318764683
Chagné, D., Crowhurst, R. N., Pindo, M., Thrimawithana, A., Deng, C., Ireland, H., et al. (2014). The draft genome sequence of European pear (Pyrus communis l. ‘Bartlett’). PloS One 9, e92644. doi: 10.1371/journal.pone.0092644
Chen, C., Chen, H., Zhang, Y., Thomas, H. R., Frank, M. H., He, Y., et al. (2020). TBtools: An integrative toolkit developed for interactive analyses of big biological data. Mol. Plant 13, 1194–1202. doi: 10.1016/j.molp.2020.06.009
Chen, F., Mackey, A. J., Stoeckert, C. J., Roos, D. S. (2006). OrthoMCL-DB: querying a comprehensive multi-species collection of ortholog groups. Nucleic Acids Res. 34, D363–D368. doi: 10.1093/nar/gkj123
Daccord, N., Celton, J.-M., Linsmith, G., Becker, C., Choisne, N., Schijlen, E., et al. (2017). High-quality de novo assembly of the apple genome and methylome dynamics of early fruit development. Nat. Genet. 49, 1099–1106. doi: 10.1038/ng.3886
Darling, A. E., Mau, B., Perna, N. T. (2010). progressiveMauve: Multiple genome alignment with gene gain, loss and rearrangement. PloS One 5, e11147. doi: 10.1371/journal.pone.0011147
Darwish, O., Shahan, R., Liu, Z., Slovin, J. P., Alkharouf, N. W. (2015). Re-annotation of the woodland strawberry (Fragaria vesca) genome. BMC Genomics 16, 29. doi: 10.1186/s12864-015-1221-1
Deelman, E., Vahi, K., Juve, G., Rynge, M., Callaghan, S., Maechling, P. J., et al. (2015). Pegasus, A workflow management system for science automation. Future Gener. Comp. Sy 46, 17–35. doi: 10.1016/j.future.2014.10.008
Derelle, R., Philippe, H., Colbourne, J. K. (2020). Broccoli: combining phylogenetic and network analyses for orthology assignment. Mol. Biol. Evol. 37, msaa159. doi: 10.1093/molbev/msaa159
Dong, X., Wang, Z., Tian, L., Zhang, Y., Qi, D., Huo, H., et al. (2020). De novo assembly of a wild pear (Pyrus betuleafolia) genome. Plant Biotechnol. J. 18, 581–595. doi: 10.1111/pbi.13226
Dunn, C. W., Howison, M., Zapata, F. (2013). Agalma: an automated phylogenomics workflow. BMC Bioinf. 14, 330–330. doi: 10.1186/1471-2105-14-330
Ebmeyer, S., Coertze, R. D., Berglund, F., Kristiansson, E., Larsson, D. G. J. (2021). GEnView: a gene-centric, phylogeny-based comparative genomics pipeline for bacterial genomes and plasmids. Bioinformatics 38, 1727–1728. doi: 10.1093/bioinformatics/btab855
Eddy, S. R. (2011). Accelerated profile HMM searches. PloS Comput. Biol. 7, e1002195. doi: 10.1371/journal.pcbi.1002195
Emms, D. M., Kelly, S. (2015). OrthoFinder: solving fundamental biases in whole genome comparisons dramatically improves orthogroup inference accuracy. Genome Biol. 16, 157. doi: 10.1186/s13059-015-0721-2
Emms, D. M., Kelly, S. (2019). OrthoFinder: phylogenetic orthology inference for comparative genomics. Genome Biol. 20, 238. doi: 10.1186/s13059-019-1832-y
Emms, D. M., Kelly, S. (2022). SHOOT: phylogenetic gene search and ortholog inference. Genome Biol. 23, 85. doi: 10.1186/s13059-022-02652-8
Enright, A. J., Dongen, S. V., Ouzounis, C. A. (2002). An efficient algorithm for large-scale detection of protein families. Nucleic Acids Res. 30, 1575–1584. doi: 10.1093/nar/30.7.1575
Fuentes, D., Molina, M., Chorostecki, U., Capella-Gutiérrez, S., Marcet-Houben, M., Gabaldón, T. (2021). PhylomeDB V5: an expanding repository for genome-wide catalogues of annotated gene phylogenies. Nucleic Acids Res. 50, D1062–D1068. doi: 10.1093/nar/gkab966
Gabaldón, T. (2008). Large-Scale assignment of orthology: back to phylogenetics? Genome Biol. 9, 235. doi: 10.1186/gb-2008-9-10-235
Gao, Y., Yang, Q., Yan, X., Wu, X., Yang, F., Li, J., et al. (2021). High-quality genome assembly of “Cuiguan” pear (Pyrus pyrifolia) as a reference genome for identifying regulatory genes and epigenetic modifications responsible for bud dormancy. Hortic. Res. 8, 197. doi: 10.1038/s41438-021-00632-w
Goodstein, D. M., Shu, S., Howson, R., Neupane, R., Hayes, R. D., Fazo, J., et al. (2012). Phytozome: a comparative platform for green plant genomics. Nucleic Acids Res. 40, D1178–D1186. doi: 10.1093/nar/gkr944
Gremme, G., Steinbiss, S., Kurtz, S. (2013). GenomeTools: A comprehensive software library for efficient processing of structured genome annotations. IEEE ACM Trans. Comput. Biol. Bioinform. 10, 645–656. doi: 10.1109/tcbb.2013.68
Haas, B. J., Papanicolaou, A., Yassour, M., Grabherr, M., Blood, P. D., Bowden, J., et al. (2013). De novo transcript sequence reconstruction from RNA-seq using the trinity platform for reference generation and analysis. Nat. Protoc. 8, 1494–1512. doi: 10.1038/nprot.2013.084
Hodel, R. G. J., Zimmer, E. A., Liu, B.-B., Wen, J. (2022). Synthesis of nuclear and chloroplast data combined with network analyses supports the polyploid origin of the apple tribe and the hybrid origin of the maleae-gillenieae clade. Front. Plant Sci. 12. doi: 10.3389/fpls.2021.820997
Honaas, L. A., Wafula, E. K., Wickett, N. J., Der, J. P., Zhang, Y., Edger, P. P., et al. (2016). Selecting superior De novo transcriptome assemblies: Lessons learned by leveraging the best plant genome. PloS One 11, e0146062. doi: 10.1371/journal.pone.0146062
Huang, X., Madan, A. (1999). ). CAP3: A DNA sequence assembly program. Genome Res. 9, 868–877. doi: 10.1101/gr.9.9.868
Huang, C.-H., Sun, R., Hu, Y., Zeng, L., Zhang, N., Cai, L., et al. (2016). Resolution of brassicaceae phylogeny using nuclear genes uncovers nested radiations and supports convergent morphological evolution. Mol. Biol. Evol. 33, 394–412. doi: 10.1093/molbev/msv226
Huerta-Cepas, J., Szklarczyk, D., Forslund, K., Cook, H., Heller, D., Walter, M. C., et al. (2016). eggNOG 4.5: A hierarchical orthology framework with improved functional annotations for eukaryotic, prokaryotic and viral sequences. Nucleic Acids Res. 44, D286–D293. doi: 10.1093/nar/gkv1248
Iseli, C., Jongeneel, C. V., Bucher, P. (1999). ESTScan: a program for detecting, evaluating, and reconstructing potential coding regions in EST sequences. Proc. Int. Conf Intelligent Syst. Mol. Biol. Ismb Int. Conf Intelligent Syst. Mol. Biol., 138–148.
Jiao, Y., Leebens-Mack, J., Ayyampalayam, S., Bowers, J. E., McKain, M. R., McNeal, J., et al. (2012). A genome triplication associated with early diversification of the core eudicots. Genome Biol. 13, R3–R3. doi: 10.1186/gb-2012-13-1-r3
Jiao, Y., Wickett, N. J., Ayyampalayam, S., Chanderbali, A. S., Landherr, L., Ralph, P. E., et al. (2011). Ancestral polyploidy in seed plants and angiosperms. Nature 473, 97–100. doi: 10.1038/nature09916
Jones, P., Binns, D., Chang, H.-Y., Fraser, M., Li, W., McAnulla, C., et al. (2014). InterProScan 5: genome-scale protein function classification. Bioinformatics 30, 1236–1240. doi: 10.1093/bioinformatics/btu031
Jung, S., Lee, T., Cheng, C.-H., Buble, K., Zheng, P., Yu, J., et al. (2019). 15 years of GDR: New data and functionality in the genome database for rosaceae. Nucleic Acids Res. 47, D1137–D1145. doi: 10.1093/nar/gky1000
Katoh, K., Standley, D. M. (2013). MAFFT multiple sequence alignment software version 7: Improvements in performance and usability. Mol. Biol. Evol. 30, 772–780. doi: 10.1093/molbev/mst010
Kim, S., Cheong, K., Park, J., Kim, M., Kim, J., Seo, M., et al. (2020). TGFam-finder: a novel solution for target-gene family annotation in plants. New Phytol. 227, 1568–1581. doi: 10.1111/nph.16645
Kriventseva, E. V., Kuznetsov, D., Tegenfeldt, F., Manni, M., Dias, R., Simão, F. A., et al. (2018). OrthoDB v10: sampling the diversity of animal, plant, fungal, protist, bacterial and viral genomes for evolutionary and functional annotations of orthologs. Nucleic Acids Res. 47, gky1053. doi: 10.1093/nar/gky1053
Lanza, V. F., Baquero, F., de la Cruz, F., Coque, T. M. (2016). AcCNET (Accessory genome constellation network): Comparative genomics software for accessory genome analysis using bipartite networks. Bioinformatics 33, 283–285. doi: 10.1093/bioinformatics/btw601
Li, Z., Baniaga, A. E., Sessa, E. B., Scascitelli, M., Graham, S. W., Rieseberg, L. H., et al. (2015). Early genome duplications in conifers and other seed plants. Sci. Adv. 1, e1501084. doi: 10.1126/sciadv.1501084
Li, F.-W., Brouwer, P., Carretero-Paulet, L., Cheng, S., de Vries, J., Delaux, P.-M., et al. (2018). Fern genomes elucidate land plant evolution and cyanobacterial symbioses. Nat. Plants 4, 460–472. doi: 10.1038/s41477-018-0188-8
Linsmith, G., Rombauts, S., Montanari, S., Deng, C. H., Celton, J.-M., Guérif, P., et al. (2019). Pseudo-chromosome-length genome assembly of a double haploid “Bartlett” pear (Pyrus communis l.). GigaScience 8, 1–17. doi: 10.1093/gigascience/giz138
Li, Y., Pi, M., Gao, Q., Liu, Z., Kang, C. (2019). Updated annotation of the wild strawberry Fragaria vesca V4 genome. Hortic. Res. 6, 61. doi: 10.1038/s41438-019-0142-6
Li, L., Stoeckert, C. J., Roos, D. S. (2003). OrthoMCL: Identification of ortholog groups for eukaryotic genomes. Genome Res. 13, 2178–2189. doi: 10.1101/gr.1224503
Liu, T., Li, M., Liu, Z., Ai, X., Li, Y. (2021). Reannotation of the cultivated strawberry genome and establishment of a strawberry genome database. Hortic. Res. 8, 41. doi: 10.1038/s41438-021-00476-4
Li, Y., Wei, W., Feng, J., Luo, H., Pi, M., Liu, Z., et al. (2017). Genome re-annotation of the wild strawberry Fragaria vesca using extensive illumina- and SMRT-based RNA-seq datasets. DNA Res. 25, dsx038. doi: 10.1093/dnares/dsx038
Lyons, E., Freeling, M. (2008). How to usefully compare homologous plant genes and chromosomes as DNA sequences. Plant J. 53, 661–673. doi: 10.1111/j.1365-313x.2007.03326.x
Manni, M., Berkeley, M. R., Seppey, M., Simão, F. A., Zdobnov, E. M. (2021). BUSCO update: novel and streamlined workflows along with broader and deeper phylogenetic coverage for scoring of eukaryotic, prokaryotic, and viral genomes. Mol. Biol. Evol. 38, 4647–4654. doi: 10.1093/molbev/msab199
Marks, R. A., Hotaling, S., Frandsen, P. B., VanBuren, R. (2021). Representation and participation across 20 years of plant genome sequencing. Nat. Plants 7, 1571–1578. doi: 10.1038/s41477-021-01031-8
Martinez, M. (2016). Computational tools for genomic studies in plants. Curr. Genomics 17, 509–514. doi: 10.2174/1389202917666160520103447
Marx, H., Minogue, C. E., Jayaraman, D., Richards, A. L., Kwiecien, N. W., Siahpirani, A. F., et al. (2016). A proteomic atlas of the legume Medicago truncatula and its nitrogen-fixing endosymbiont Sinorhizobium meliloti. Nat. Biotechnol. 34, 1198–1205. doi: 10.1038/nbt.3681
Matasci, N., Hung, L.-H., Yan, Z., Carpenter, E. J., Wickett, N. J., Mirarab, S., et al. (2014). Data access for the 1,000 plants (1KP) project. GigaScience 3, 17. doi: 10.1186/2047-217x-3-17
McLachlan, G. J., Peel, D. (1999). The EMMIX algorithm for the fitting of normal and t -components. J. Stat. Softw 4, 1–14. doi: 10.18637/jss.v004.i02
Mi, H., Ebert, D., Muruganujan, A., Mills, C., Albou, L.-P., Mushayamaha, T., et al. (2020). PANTHER version 16: A revised family classification, tree-based classification tool, enhancer regions and extensive API. Nucleic Acids Res. 49, gkaa1106. doi: 10.1093/nar/gkaa1106
Mirarab, S., Nguyen, N., Guo, S., Wang, L.-S., Kim, J., Warnow, T. (2015). PASTA: Ultra-Large multiple sequence alignment for nucleotide and amino-acid sequences. J. Comput. Biol. 22, 377–386. doi: 10.1089/cmb.2014.0156
Mistry, J., Chuguransky, S., Williams, L., Qureshi, M., Salazar, G. A., Sonnhammer, E. L. L., et al. (2020). Pfam: The protein families database in 2021. Nucleic Acids Res. 49, gkaa913. doi: 10.1093/nar/gkaa913
Mölder, F., Jablonski, K. P., Letcher, B., Hall, M. B., Tomkins-Tinch, C. H., Sochat, V., et al. (2021). Sustainable data analysis with snakemake. F1000research 10, 33. doi: 10.12688/f1000research.29032.1
Nagy, L. G., Merényi, Z., Hegedüs, B., Bálint, B. (2020). Novel phylogenetic methods are needed for understanding gene function in the era of mega-scale genome sequencing. Nucleic Acids Res. 48, 2209–2219. doi: 10.1093/nar/gkz1241
Nakaya, A., Ichihara, H., Asamizu, E., Shirasawa, S., Nakamura, Y., Tabata, S., et al. (2017). Plant genome DataBase Japan (PGDBj). Methods Mol. Biol. Clifton N J. 1533, 45–77. doi: 10.1007/978-1-4939-6658-5_3
Nascimento, M., Sousa, A., Ramirez, M., Francisco, A. P., Carriço, J. A., Vaz, C. (2016). PHYLOViZ 2.0: Providing scalable data integration and visualization for multiple phylogenetic inference methods. Bioinform. Oxf Engl. 33, 128–129. doi: 10.1093/bioinformatics/btw582
Oliveira, M. S., Alves, J. T. C., de Sá, P. H. C. G., de Veras, A. A. O. (2021). PAN2HGENE–tool for comparative analysis and identifying new gene products. PloS One 16, e0252414. doi: 10.1371/journal.pone.0252414
One Thousand Plant Transcriptomes Initiative (2019). One thousand plant transcriptomes and the phylogenomics of green plants. Nature 574, 679–685. doi: 10.1038/s41586-019-1693-2
Pabón-Mora, N., Wong, G. K.-S., Ambrose, B. A. (2014). Evolution of fruit development genes in flowering plants. Front. Plant Sci. 5. doi: 10.3389/fpls.2014.00300
Perrin, A., Rocha, E. P. C. (2021). PanACoTA: a modular tool for massive microbial comparative genomics. NAR Genom Bioinform. 3, lqaa106. doi: 10.1093/nargab/lqaa106
Pilkington, S. M., Crowhurst, R., Hilario, E., Nardozza, S., Fraser, L., Peng, Y., et al. (2018). A manually annotated Actinidia chinensis var. chinensis (kiwifruit) genome highlights the challenges associated with draft genomes and gene prediction in plants. BMC Genomics 19, 257. doi: 10.1186/s12864-018-4656-3
Price, M. N., Dehal, P. S., Arkin, A. P. (2010). FastTree 2 - approximately maximum-likelihood trees for Large alignments. PloS One 5, e9490. doi: 10.1371/journal.pone.0009490
Pucker, B. (2022). Automatic identification and annotation of MYB gene family members in plants. BMC Genomics 23, 220. doi: 10.1186/s12864-022-08452-5
Pucker, B., Reiher, F., Schilbert, H. M. (2020). Automatic identification of players in the flavonoid biosynthesis with application on the biomedicinal plant Croton tiglium. Plants 9, 1103. doi: 10.3390/plants9091103
Ren, R., Wang, H., Guo, C., Zhang, N., Zeng, L., Chen, Y., et al. (2018). Widespread whole genome duplications contribute to genome complexity and species diversity in angiosperms. Mol. Plant 11, 414–428. doi: 10.1016/j.molp.2018.01.002
Rothfels, C. J., Larsson, A., Li, F.-W., Sigel, E. M., Huiet, L., Burge, D. O., et al. (2013). Transcriptome-mining for single-copy nuclear markers in ferns. PloS One 8, e76957. doi: 10.1371/journal.pone.0076957
Sasidharan, R., Nepusz, T., Swarbreck, D., Huala, E., Paccanaro, A. (2012). GFam: a platform for automatic annotation of gene families. Nucleic Acids Res. 40, e152–e152. doi: 10.1093/nar/gks631
Sayers, E. W., Cavanaugh, M., Clark, K., Ostell, J., Pruitt, K. D., Karsch-Mizrachi, I. (2018). GenBank. Nucleic Acids Res. 47, D94–D99. doi: 10.1093/nar/gky989
Schreiber, F., Patricio, M., Muffato, M., Pignatelli, M., Bateman, A. (2014). TreeFam v9: a new website, more species and orthology-on-the-fly. Nucleic Acids Res. 42, D922–D925. doi: 10.1093/nar/gkt1055
Shahid, S., Kim, G., Johnson, N. R., Wafula, E., Wang, F., Coruh, C., et al. (2018). MicroRNAs from the parasitic plant Cuscuta campestris target host messenger RNAs. Nature 553, 82. doi: 10.1038/nature25027
Song, C., Zhang, D., Zhang, J., Zheng, L., Zhao, C., Ma, J., et al. (2016). Expression analysis of key auxin synthesis, transport, and metabolism genes in different young dwarfing apple trees. Acta Physiol. Plant 38, 43. doi: 10.1007/s11738-016-2065-2
Sonnhammer, E. L. L., Koonin, E. V. (2002). Orthology, paralogy and proposed classification for paralog subtypes. Trends Genet. 18, 619–620. doi: 10.1016/s0168-9525(02)02793-2
Spannagl, M., Nussbaumer, T., Bader, K. C., Martis, M. M., Seidel, M., Kugler, K. G., et al. (2016). PGSB PlantsDB: updates to the database framework for comparative plant genome research. Nucleic Acids Res. 44, D1141–D1147. doi: 10.1093/nar/gkv1130
Stamatakis, A. (2014). RAxML version 8: a tool for phylogenetic analysis and post-analysis of large phylogenies. Bioinformatics 30, 1312–1313. doi: 10.1093/bioinformatics/btu033
Sundell, D., Mannapperuma, C., Netotea, S., Delhomme, N., Lin, Y.-C., Sjödin, A., et al. (2015). The plant genome integrative explorer resource: PlantGenIE.org. New Phytol. 208, 1149–1156. doi: 10.1111/nph.13557
Sun, X., Jiao, C., Schwaninger, H., Chao, C. T., Ma, Y., Duan, N., et al. (2020). Phased diploid genome assemblies and pan-genomes provide insights into the genetic history of apple domestication. Nat. Genet. 52, 1423–1432. doi: 10.1038/s41588-020-00723-9
Tello-Ruiz, M. K., Naithani, S., Gupta, P., Olson, A., Wei, S., Preece, J., et al. (2020). Gramene 2021: harnessing the power of comparative genomics and pathways for plant research. Nucleic Acids Res. 49, gkaa979. doi: 10.1093/nar/gkaa979
Thanki, A. S., Soranzo, N., Haerty, W., Davey, R. P. (2018). GeneSeqToFamily: a galaxy workflow to find gene families based on the ensembl compara GeneTrees pipeline. Gigascience 7, giy005. doi: 10.1093/gigascience/giy005
The Amborella Genome Project. (2013). The Amborella genome and the evolution of flowering plants. Sci. (New York N.Y.) 342, 1241089. doi: 10.1126/science.1241089
The Galaxy Community. (2022). The Galaxy platform for accessible, reproducible and collaborative biomedical analyses: 2022 update. Nucleic Acids Research 50 (W1), W345–W351. doi: 10.1093/nar/gkac247
The UniProt Consortium (2021). UniProt: the universal protein knowledgebase in 2021. Nucleic Acids Res. 49, D480–D489. doi: 10.1093/nar/gkaa1100
Timilsena, P. R., Barrett, C. F., Nelson, A. P., Wafula, E. K., Ayyampalayam, S., McNeal, J. R., et al. (in press). Phylotranscriptomic analyses of mycoheterotrophic monocots show a continuum of convergent evolutionary changes in expressed nuclear genes from three independent nonphotosynthetic lineages. Genome Biology and Evolution.
Timilsena, P. R., Wafula, E. K., Barrett, C. F., Ayyampalayam, S., McNeal, J. R., Rentsch, J. D., et al (2022). Phylogenomic resolution of order- and family-level monocot relationships using 602 single-copy nuclear genes and 1375 BUSCO genes. Front Plant Sci 13, 876779. doi: 10.3389/fpls.2022.876779
Timme, R. E., Bachvaroff, T. R., Delwiche, C. F. (2012). Broad phylogenomic sampling and the sister lineage of land plants. PloS One 7, e29696. doi: 10.1371/journal.pone.0029696
Tomcal, M., Stiffler, N., Barkan, A. (2013). POGs2: A web portal to facilitate cross-species inferences about protein architecture and function in plants. PloS One 8, e82569. doi: 10.1371/journal.pone.0082569
Tommaso, P. D., Chatzou, M., Floden, E. W., Barja, P. P., Palumbo, E., Notredame, C. (2017). Nextflow enables reproducible computational workflows. Nat. Biotechnol. 35, 316–319. doi: 10.1038/nbt.3820
Valentin, G., Abdel, T., Gaëtan, D., Jean-François, D., Matthieu, C., Mathieu, R. (2020). GreenPhylDB v5: a comparative pangenomic database for plant genomes. Nucleic Acids Res. 49, D1464–D1471. doi: 10.1093/nar/gkaa1068
Vihinen, M. (2012). How to evaluate performance of prediction methods? measures and their interpretation in variation effect analysis. BMC Genomics 13, S2. doi: 10.1186/1471-2164-13-s4-s2
Viruel, J., Conejero, M., Hidalgo, O., Pokorny, L., Powell, R. F., Forest, F., et al. (2019). A target capture-based method to estimate ploidy from herbarium specimens. Front. Plant Sci. 10. doi: 10.3389/fpls.2019.00937
Vizueta, J., Sánchez-Gracia, A., Rozas, J. (2020). Bitacora: A comprehensive tool for the identification and annotation of gene families in genome assemblies. Mol. Ecol. Resour 20, 1445–1452. doi: 10.1111/1755-0998.13202
Wall, P. K., Leebens-Mack, J., Müller, K. F., Field, D., Altman, N. S., dePamphilis, C. W. (2008). PlantTribes: a gene and gene family resource for comparative genomics in plants. Nucleic Acids Res. 36, D970–D976. doi: 10.1093/nar/gkm972
Waterhouse, A. M., Procter, J. B., Martin, D. M. A., Clamp, M., Barton, G. J. (2009). Jalview version 2-a multiple sequence alignment editor and analysis workbench. Bioinformatics 25, 1189–1191. doi: 10.1093/bioinformatics/btp033
Westwood, J. H., dePamphilis, C. W., Das, M., Fernández-Aparicio, M., Honaas, L. A., Timko, M. P., et al. (2012). The parasitic plant genome project: New tools for understanding the biology of Orobanche and Striga. Weed Sci. 60, 295306. doi: 10.1614/ws-d-11-00113.1
Westwood, J. H., Yoder, J. I., Timko, M. P., dePamphilis, C. W. (2010). The evolution of parasitism in plants. Trends Plant Sci. 15, 227–235. doi: 10.1016/j.tplants.2010.01.004
Whittle, C. A., Kulkarni, A., Extavour, C. G. (2021). Evolutionary dynamics of sex-biased genes expressed in cricket brains and gonads. J. Evol. Biol. 34, 1188–1211. doi: 10.1111/jeb.13889
Wickett, N. J., Mirarab, S., Nguyen, N., Warnow, T., Carpenter, E., Matasci, N., et al. (2014). Phylotranscriptomic analysis of the origin and early diversification of land plants. Proc. Natl. Acad. Sci. 111, E4859–E4868. doi: 10.1073/pnas.1323926111
Williams, J. S., Der, J. P., dePamphilis, C. W., Kao, T.-H. (2014). Transcriptome analysis reveals the same 17 s-locus f-box genes in two haplotypes of the self-incompatibility locus of Petunia inflata. Plant Cell 26, 2873–2888. doi: 10.1105/tpc.114.126920
Xiang, Y., Huang, C.-H., Hu, Y., Wen, J., Li, S., Yi, T., et al. (2017). Evolution of rosaceae fruit types based on nuclear phylogeny in the context of geological times and genome duplication. Mol. Biol. Evol. 34, 262–281. doi: 10.1093/molbev/msw242
Yachdav, G., Wilzbach, S., Rauscher, B., Sheridan, R., Sillitoe, I., Procter, J., et al. (2016). MSAViewer: interactive JavaScript visualization of multiple sequence alignments. Bioinform. Oxf Engl. 32, 3501–3503. doi: 10.1093/bioinformatics/btw474
Yang, Z. (2007). PAML 4: phylogenetic analysis by maximum likelihood. Mol. Biol. Evol. 24, 1586–1591. doi: 10.1093/molbev/msm088
Yang, Y., Moore, M. J., Brockington, S. F., Soltis, D. E., Wong, G. K.-S., Carpenter, E. J., et al. (2015a). Dissecting molecular evolution in the highly diverse plant clade caryophyllales using transcriptome sequencing. Mol. Biol. Evol. 32, 2001–2014. doi: 10.1093/molbev/msv081
Yang, Z., Wafula, E. K., Honaas, L. A., Zhang, H., Das, M., Fernandez-Aparicio, M., et al. (2015b). Comparative transcriptome analyses reveal core parasitism genes and suggest gene duplication and repurposing as sources of structural novelty. Mol. Biol. Evol. 32, 767–790. doi: 10.1093/molbev/msu343
Yang, Z., Wafula, E. K., Kim, G., Shahid, S., McNeal, J. R., Ralph, P. E., et al. (2019). Convergent horizontal gene transfer and cross-talk of mobile nucleic acids in parasitic plants. Nat. Plants 5, 991–1001. doi: 10.1038/s41477-019-0458-0
Zeng, L., Zhang, Q., Sun, R., Kong, H., Zhang, N., Ma, H. (2014). Resolution of deep angiosperm phylogeny using conserved nuclear genes and estimates of early divergence times. Nat. Commun. 5, 4956. doi: 10.1038/ncomms5956
Zhang, L., Hu, J., Han, X., Li, J., Gao, Y., Richards, C. M., et al. (2019). A high-quality apple genome assembly reveals the association of a retrotransposon and red fruit colour. Nat. Commun. 10, 1494. doi: 10.1038/s41467-019-09518-x
Zhang, Y., Sun, Y., Cole, J. R. (2014). A scalable and accurate targeted gene assembly tool (SAT-assembler) for next-generation sequencing data. PloS Comput. Biol. 10, e1003737. doi: 10.1371/journal.pcbi.1003737
Zhang, H., Wafula, E. K., Eilers, J., Harkess, A. E., Ralph, P. E., Timilsena, P. R., et al. (2022). Building a foundation for gene family analysis in rosaceae genomes with a novel workflow: a case study in Pyrus architecture genes. Front. Plant Sci 13. doi: 10.3389/fpls.2022.975942
Zhang, N., Wen, J., Zimmer, E. A. (2015). Expression patterns of AP1, FUL, FT and LEAFY orthologs in vitaceae support the homology of tendrils and inflorescences throughout the grape family. J. Syst. Evol. 53, 469–476. doi: 10.1111/jse.12138
Keywords: gene family phylogenetics, multiple sequence alignment, genome duplication, galaxy, modular tools, applied agriculture, comparative genomics, CROG analysis
Citation: Wafula EK, Zhang H, Von Kuster G, Leebens-Mack JH, Honaas LA and dePamphilis CW (2023) PlantTribes2: Tools for comparative gene family analysis in plant genomics. Front. Plant Sci. 13:1011199. doi: 10.3389/fpls.2022.1011199
Received: 03 August 2022; Accepted: 02 December 2022;
Published: 31 January 2023.
Edited by:
Giorgio Gambino, National Research Council (CNR), ItalyReviewed by:
Aureliano Bombarely, Polytechnic University of Valencia, SpainJia-Ming Song, Guangxi University, China
Copyright © 2023 Wafula, Zhang, Von Kuster, Leebens-Mack, Honaas and dePamphilis. This is an open-access article distributed under the terms of the Creative Commons Attribution License (CC BY). The use, distribution or reproduction in other forums is permitted, provided the original author(s) and the copyright owner(s) are credited and that the original publication in this journal is cited, in accordance with accepted academic practice. No use, distribution or reproduction is permitted which does not comply with these terms.
*Correspondence: Claude W. dePamphilis, Y3dkM0A=psu.edu
†These authors have contributed equally to this work