
94% of researchers rate our articles as excellent or good
Learn more about the work of our research integrity team to safeguard the quality of each article we publish.
Find out more
ORIGINAL RESEARCH article
Front. Plant Sci., 20 September 2022
Sec. Plant Bioinformatics
Volume 13 - 2022 | https://doi.org/10.3389/fpls.2022.1006510
This article is part of the Research TopicGenetic Improvement of Triticeae Crops Based on High-throughput Phenotyping: Molecular Design for Yield, Resistance and ToleranceView all 14 articles
 Wei Luo1,2,3†Jieguang Zhou1,2†Jiajun Liu1,2Yanlin Liu2Yang Mu2Huaping Tang2Qiang Xu1,2Mei Deng2
 Qiantao Jiang1,2Guoyue Chen1,2
 Pengfei Qi1,2
 Jirui Wang1,2
 Yunfeng Jiang1,2
 Zhongxu Chen4
 Zhi Zheng5
 Yuming Wei1,2
 Youliang Zheng1
 Xiujin Lan1,2*
 Jian Ma1,2*
Trichomes are differentiated epidermal cells and exist on above-ground organs of nearly all land plants with important roles in resistance to a wide range of biotic and abiotic stresses. We attempted to obtain candidate gene (s) for Hairy glume (Hg), responsible for the trichome on wheat glume, by using bulked segregant exome capture sequencing (BSE-Seq), while Hg was only mapped in 0.52–3.26 Mb of 1AS. To further fine map this gene and identify candidate genes in this region, a near isogenic line-derived population consisting of 2,050 F2 lines was generated in the present study. By analyzing this population, Hg was fine mapped into a 0.90 cM region covering a physical distance of ~825.03 Kb encompassing 6 high- and 23 low-confidence genes in the reference genome of Chinese Spring. A presence-absence variation was identified in the fine mapping region through analyses of sequence-tagged sites markers and genome sequences of the hairy glume parent of the near isogenic lines. The results presented here will be useful for further cloning Hg in wheat.
Trichome (hair or pubescence) is a kind of unicellular or multicellular appendage with diverse functions on the plant epidermis in different organs (Werker, 2000). Previous studies showed that trichomes play important roles in resistance to a wide range of both biotic and abiotic stresses (Bickford, 2016; Galdon-Armero et al., 2018) as well as in plant defense regard to phytophagous insects (Handley et al., 2005). Additionally, hairy leaf sheath was significantly and positively correlated with increased grain yield, grain weight and grain weight per spike (Wan et al., 2015). However, glume trichome is undesirable based on some recent studies as it may be harmful to human health. It has been reported glume trichome is associated with the increased risk of developing esophageal squamous cell carcinoma following the consumption of contaminated wheat flour (Lian et al., 2019). In addition, it generates dust during harvesting and grain processes causing acute and chronic irritation to eyes, skin, and respiratory systems (Zhang et al., 2012).
QTL mapping has been routinely used to identify initial genomic regions affecting specific traits. In wheat, eight QTL conferring glume trichome have been identified. A genome-wide association study for 404 Indian bread wheat genotypes identified six putative QTL conferring hairy glume on 1A (at 292 and 511 Mb), 1B and 2B (Sheoran et al., 2019). Wu et al. (2021) reported a hairy glume gene on 2BL which was named Hg2. Hg has been long recognized as the dominant gene for glume hairiness (Kadam, 1936; Tsunewaki, 1961; Dubcovsky and Dvorák, 1995; Khlestkina et al., 2006) and it was initially mapped in a 3.3 cM region in our previous study (Luo et al., 2016). However, QTL mapping only provides limited resolution (Paterson et al., 1988) and molecular markers obtained from such studies can not be reliably used to tag targeted loci. The heterogeneity in genetic background in such mapping populations also makes accurate phenotyping of many quantitative traits difficult (Jiang et al., 2019). Therefore, fixing genetic backgrounds in regarding to a targeted locus becomes efficient for accurate phenotyping and can be achieved with near isogenic lines (NILs) or populations derived from NILs.
To further characterize Hg, a lot of efforts have been made including developing NILs and generating RNA sequences. In our previous study, seven pairs of NILs targeting Hg have been developed and difference between the two isolines was only detected on glume hairiness (Luo et al., 2020). Taken advantage of the unique feature of NILs where phenotypic difference between the two isolines of NILs mainly depends on the difference between their genomes at target locus, we also adopted multi-NIL RNA-Seq approach (Habib et al., 2017; Gao et al., 2019) to generate and analyze RNA sequences against two of the seven NIL pairs. This approach allowed us to reduce the number of candidate genes and identified 37 differentially expressed genes (DEGs) and 39 SNPs in the target region (Luo et al., 2020).
Cost of high throughput sequencing rapidly decreasing made genomic data across hundreds or even thousands of genotypes available. For example, Guo et al. (2020) released draft genome sequence of Tibetan semi-wild wheat (Triticum aestivum ssp. tibetanum Shao) and resequencing data of 245 wheat accessions. Genomic data of 641 wheat accessions were available on SnpHub (Wang et al., 2020). A recent study generated ten chromosome pseudomolecule and five scaffold assemblies of hexaploid wheat (Walkowiak et al., 2020). These data would be greatly helpful to explore large panels of high-quality genomic variation data and provide valuable resources for designing markers, identifying trait-related genes, and molecular breeding. Glume trichome in wheat has been studied for a century (Wu et al., 2021), while Hg has not been fine mapped. It is an opportunity to analyze it with the explosive sequencing data. Together with the available transcriptomic and genomic data, we also explored candidate region of Hg by bulked segregant exome capture sequencing (BSE-Seq) analysis. By developing and exploiting a NIL-derived population consisting of 2,050 F2 lines, we aimed to fine map Hg in the present study.
Firstly, a population of 260 F2 plants segregating at Hg generated by crossing a hairy wheat ‘3B1A’ (Figure 1A) with a non-hairy wheat accession ‘Baiying1’ (Figure 1B) was used for genetic analysis of Hg. These F2 plants were harvested and further cultivated (20 seeds of each line), and the trichome trait for each plant was investigated for confirming the phenotype of each line.
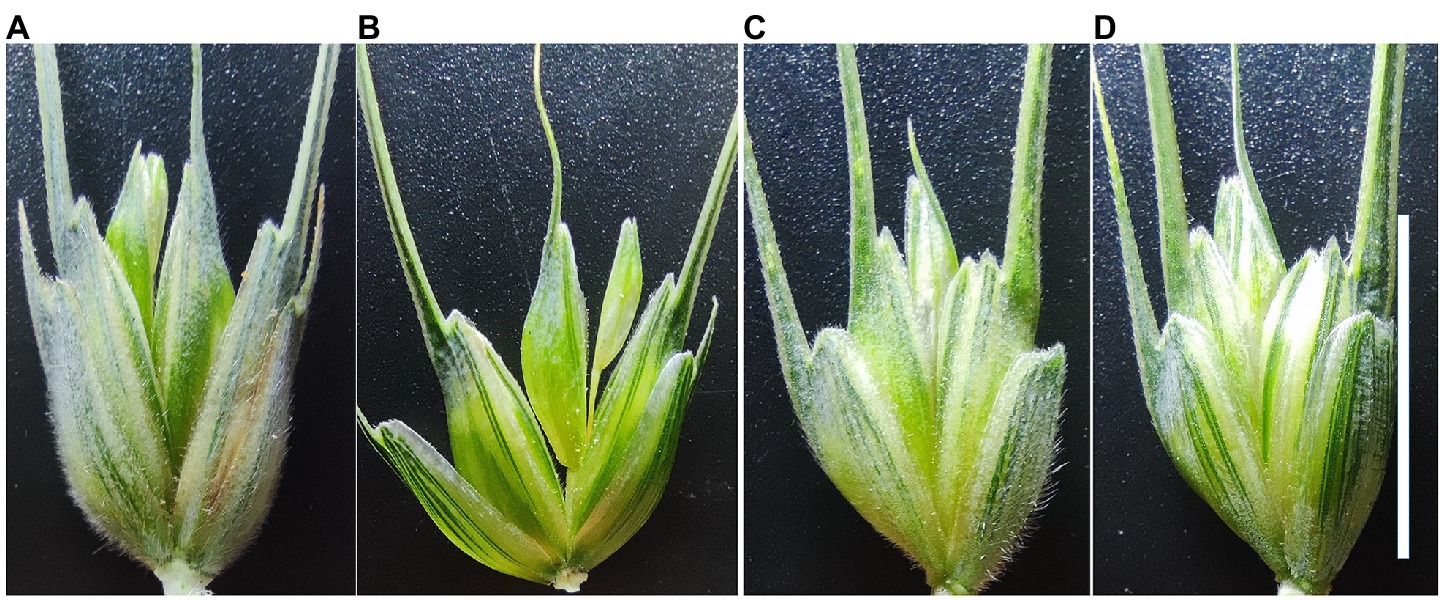
Figure 1. Phenotypes of the glume with or without trichome. The four glumes are (A) ‘3B1A’, (B) ‘Baiying1’, (C) hairy iso-line of NIL1, and (D) non-hairy iso-line of NIL1, respectively. Scale bar = 1 cm.
Secondly, fifty hairy and fifty non-hairy lines were randomly selected from a population of recombinant inbred lines (RILs) derived from the cross between Tibetan semi-wild wheat (Triticum aestivum ssp. tibetanum Shao) ‘Q1028’ (hairy glume) and variety ‘Zhengmai9023’ (non-hairy glume) from a previous study (Luo et al., 2016) to confirm the initial location of Hg and refine makers flanking the targeted region in this study. In addition, seven pairs of NILs about glume trichome were also developed from the RIL population in a previous study (Luo et al., 2020). In the present study, an F2 population consisting of 2,050 plants was generated by crossing the two isolines of NIL1 (Figures 1C,D) to fine map Hg.
The 260 F2 plants of ‘3B1A’ × ‘Baiying1’ materials were planted in 1.5 m rows with 0.3 m space between rows in Wenjiang experimental farm of the Triticeae Research Institute, Sichuan Agricultural University, China. The 2,050 F2 plants derived from the crossing of the two isolines of NIL1 were cultivated in the 5 × 10 plug tray with 50 cm in length × 28 cm in width × 10 cm in height. The tray was placed in the greenhouse (constant temperature at 22°C, light for 16 h and darkness for 8 h) of Triticeae Research Institute, Sichuan Agricultural University. The phenotypes of wheat glumes were investigated and recorded as hairy or non-hairy.
The approximately equal leaf of 32 homozygous hairy and 32 non-hairy F3 lines of ‘3B1A’ × ‘Baiying1’ were sampled and pooled separately. DNA of the two pools and parents were extracted using the cetyltrimethylammonium bromide method. Exome capture sequencing (Illumina HiSeq Nova platform) and analysis for the four libraries (‘3B1A’, ‘Baiying1’, hairy pool, and non-hairy pool) were performed by Tiancheng Weilai Technology1 (Chengdu, China) using a wheat exome capture panel. It contained 268.9 Mb capture space and covered 107,400 high confidence (HC) genes and 132,688 HC transcripts of International Wheat Genome Sequencing Consortium (IWGSC) Annotation v1.1 (Dong et al., 2020).
Both SNP-index and G’ methods were used to screen the significant region for bulk segregant analysis, and R package QTLseqr (Mansfeld and Grumet, 2018) was used to calculate SNP-index and G’ based on sliding window. Allelic frequency with the significance of linearity was performed using Euclidean distance (ED; Hill et al., 2013). ED value of each locus was calculated, the 4th power of the original ED was set as correlation value to eliminate background noise, and Loess was used to fit the ED value (Ji et al., 2021). varBScore was also used for BSE-Seq analysis (Dong et al., 2020).
The resequencing data of 641 wheat accessions were collected and analyzed on the database of SnpHub (Wang et al., 2020). In our previous study, 83 of the 641 accessions including 24 hairy and 59 non-hairy genotypes were observed (Supplementary Table S1; Luo et al., 2019). Resequencing data of these 83 genotypes were downloaded and used to detect the InDel and SNP variations in the candidate region.
The flanking genomic sequences of InDel (more than 14 base pairs) were used as templates to develop InDel markers. HC genes from IWGSC Annotation v1.1 identified from the initial mapping region were used to detect the sequence variants between the two isolines of the NIL1. The variations between the NIL1 were used for developing PCR-based markers, including KASP (Kompetitive Allele-Specific PCR) and CAPS (cleaved amplified polymorphic sequence) markers. Some HC and low confidence (LC) genes in the fine mapping region were used as templates to develop sequence-tagged sites (STS) markers. Primers for CAPS and KASP markers were designed on websites2,3 and those for the others were designed using WheatOmics 1.0 (Ma et al., 2021).
Primer synthesis and gene sequencing were completed by Tsingke Biotechnology Co., Ltd. (Chengdu, China4). The amplification for KASP markers were carried out with KASP-TF V4.0 2× Master Mix (LGC Genomics, Hoddeson, United Kingdom) using CFX96 Touch Real-Time PCR Detection System (Bio-Rad, Hercules, United States) according to the manufacturer’s instructions. Other markers were amplified by 2× Taq Master Mix (P213; Vazyme Biotech Co., Ltd., Nanjing, China).
In order to detect the chromosome variation in the fine mapping region, the STS markers were amplified in NIL1. The amplification products were analyzed by 2% agarose gel electrophoresis. Furthermore, the chromosome variation was preliminarily analyzed using the genomic sequence of the hairy glume parent of NIL1.
The 30-fold wheat whole-genome data of ‘Q1028’ was provided by Triticeae Research Institute, Sichuan Agricultural University (unpublished). The leaves of ‘Q1028’were used to extract genomic DNA using Plant Genomic DNA Kit of Tiangen Biotech Co., Ltd. (Beijing, China). Genomic DNA of ‘Q1028’ was sent to BerryGenomics (Beijing, China) for resequencing using 10× Genomics. After quality control, sequencing reads were mapped to IWGSC Reference Sequences (RefSeq) v1.0 (IWGSC, 2018) using Resequencing Analysis function of Toolbox on CLC Genomics Workbench 12.0.5 The parameters for mapping resequencing reads of ‘Q1028’ to reference genomes were shown in Supplementary Table S2. Then the Whole Genome Coverage Analysis was performed in the Resequencing Analysis function of Toolbox on CLC Genomics Workbench 12.0 with the following parameters: P -Value threshold = 0.0001, Minimum length = 50, Create regions = Yes, Create report = Yes.
Chi-square test demonstrated that the ratio of hairy:non-hairy glume fit the 3:1 segregation ratio in the F2 populations of ‘3B1A’ × ‘Baiying1’ (Table 1). The 2,050 NIL-derived F2 plants derived from the cross between the NIL1 also displayed a 3:1 segregation ratio for the hairy and the non-hairy glume (Table 1). These results indicated that hairy glume trait was controlled by a dominant gene in ‘3B1A’ and hairy isoline of NIL1.
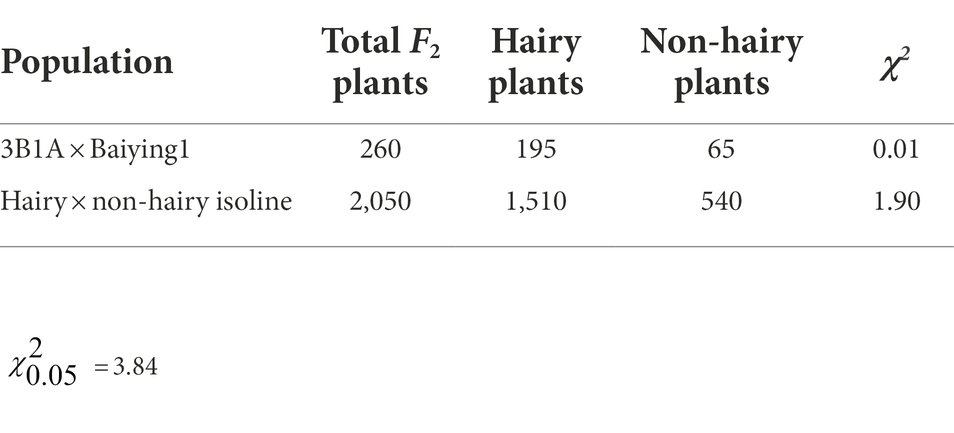
Table 1. Chi-square test for hairy:non-hairy glume.
BSE-Seq generated 29, 26, 62 and 57 Gb raw data from ‘3B1A’, ‘Baiyin1’, the hairy and non-hairy pools, respectively, and their data size reached about 109, 101, 234 and 214 times to the exome capture panel (Supplementary Table S3). The Q30 of the library was over 91% (Supplementary Table S3). Furthermore, the percentage of properly paired reads was more than 98% in each library (Supplementary Table S3). A total of 13,895 nonsymmetrical variations were obtained from the two bulked pools, and half of these variations were concentrated at chromosome 1A (Figure 2A; Supplementary Table S4). The variations at the distal terminus of 1AS was the densest, and several regions with no SNPs were detected on this interval, for example, 1.34–2.16 (only 21 sites were detected around 1.7 Mb in this gap) Mb (Figure 2B; Supplementary Table S4).
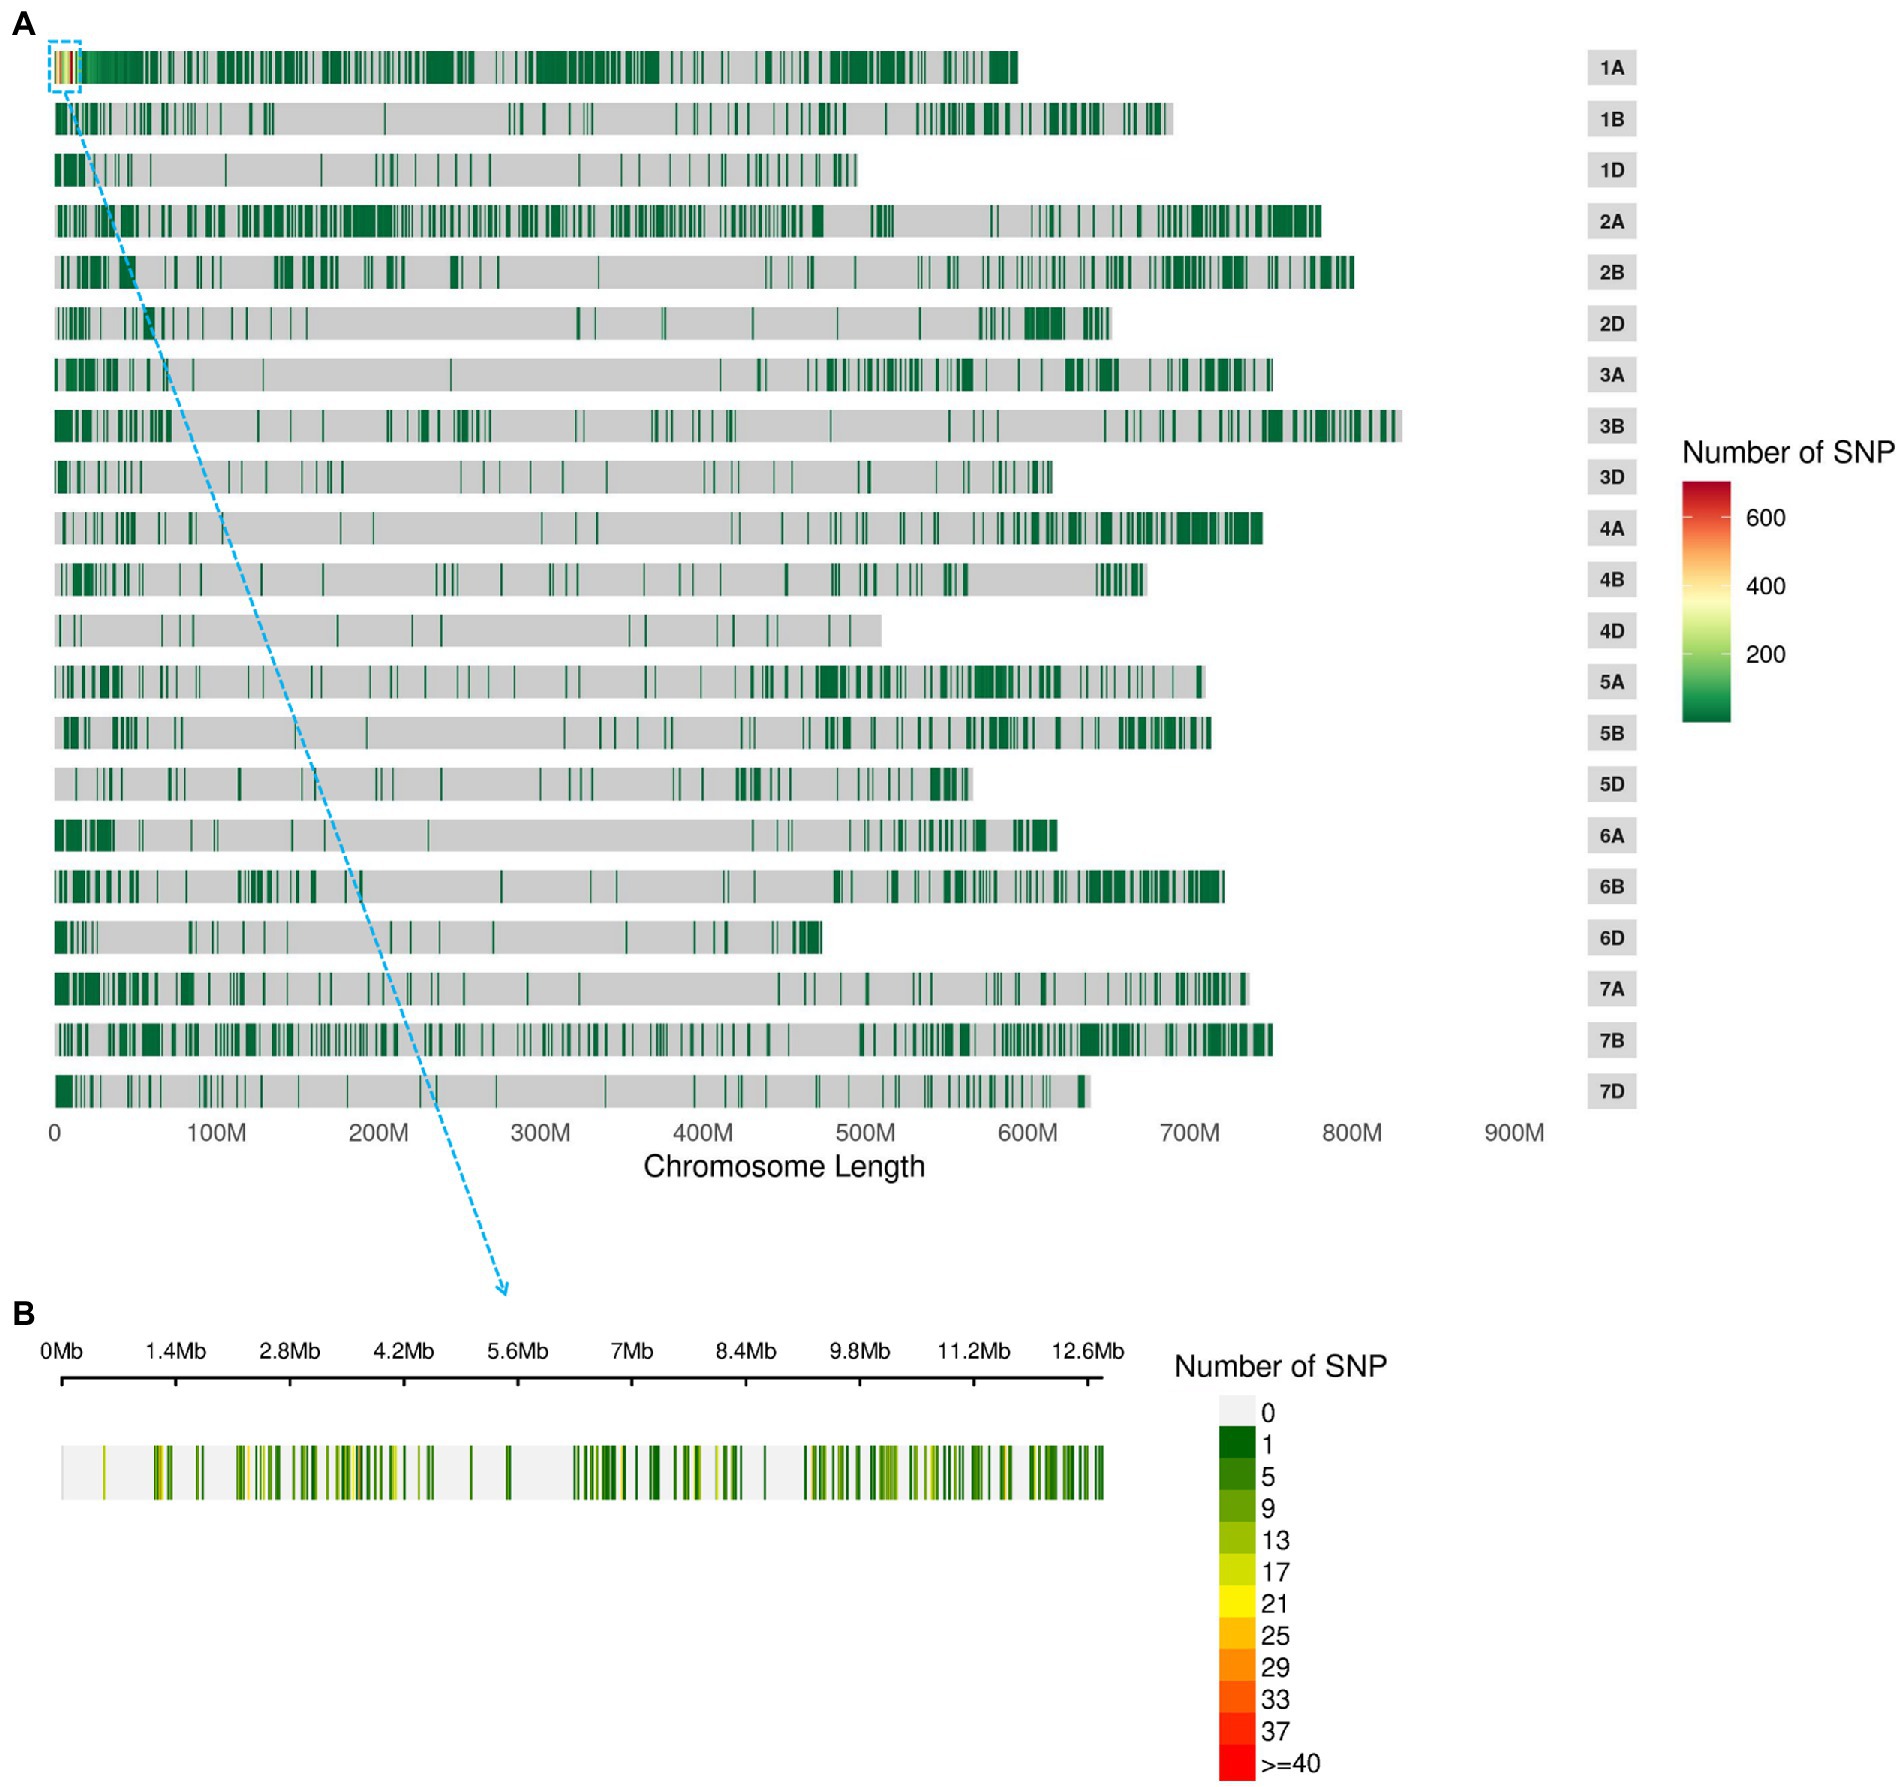
Figure 2. The nonsymmetrical variations of BSE-Seq analysis. The variable sites in the genome (A) and 1–10 Mb of chromosome 1A (B).
In the varBScore analysis, the peak scoring points were distributed in three regions on chromosome 1A, namely, 1.20–1.21, 6.56–6.57 and 10.72–12.59 Mb (Supplementary Figure S1). The results of tricube-smoothed ∆(SNP-index) showed that only one region existed on 1AS (0.52–3.26 Mb) with a confidence interval of larger than 99%, indicating that a single locus for glume trichome was defined in the genome (Figure 3). A similar result was also detected in G’ analysis, and the peak values of tricube-smoothed ∆(SNP-index) and G’ were both at 521,162 bp on 1AS (Supplementary Figure S2). In the result of ED analysis, the top 1% fitted ED values were distributed in 0.52–14.08 Mb (Supplementary Figure S3), and the peak value was also at 521,162 bp. These results suggested that the candidate gene of Hg may be located at 0.52–3.26 Mb of 1AS, and a gap, 1.34–2.16 Mb, existed in the region.
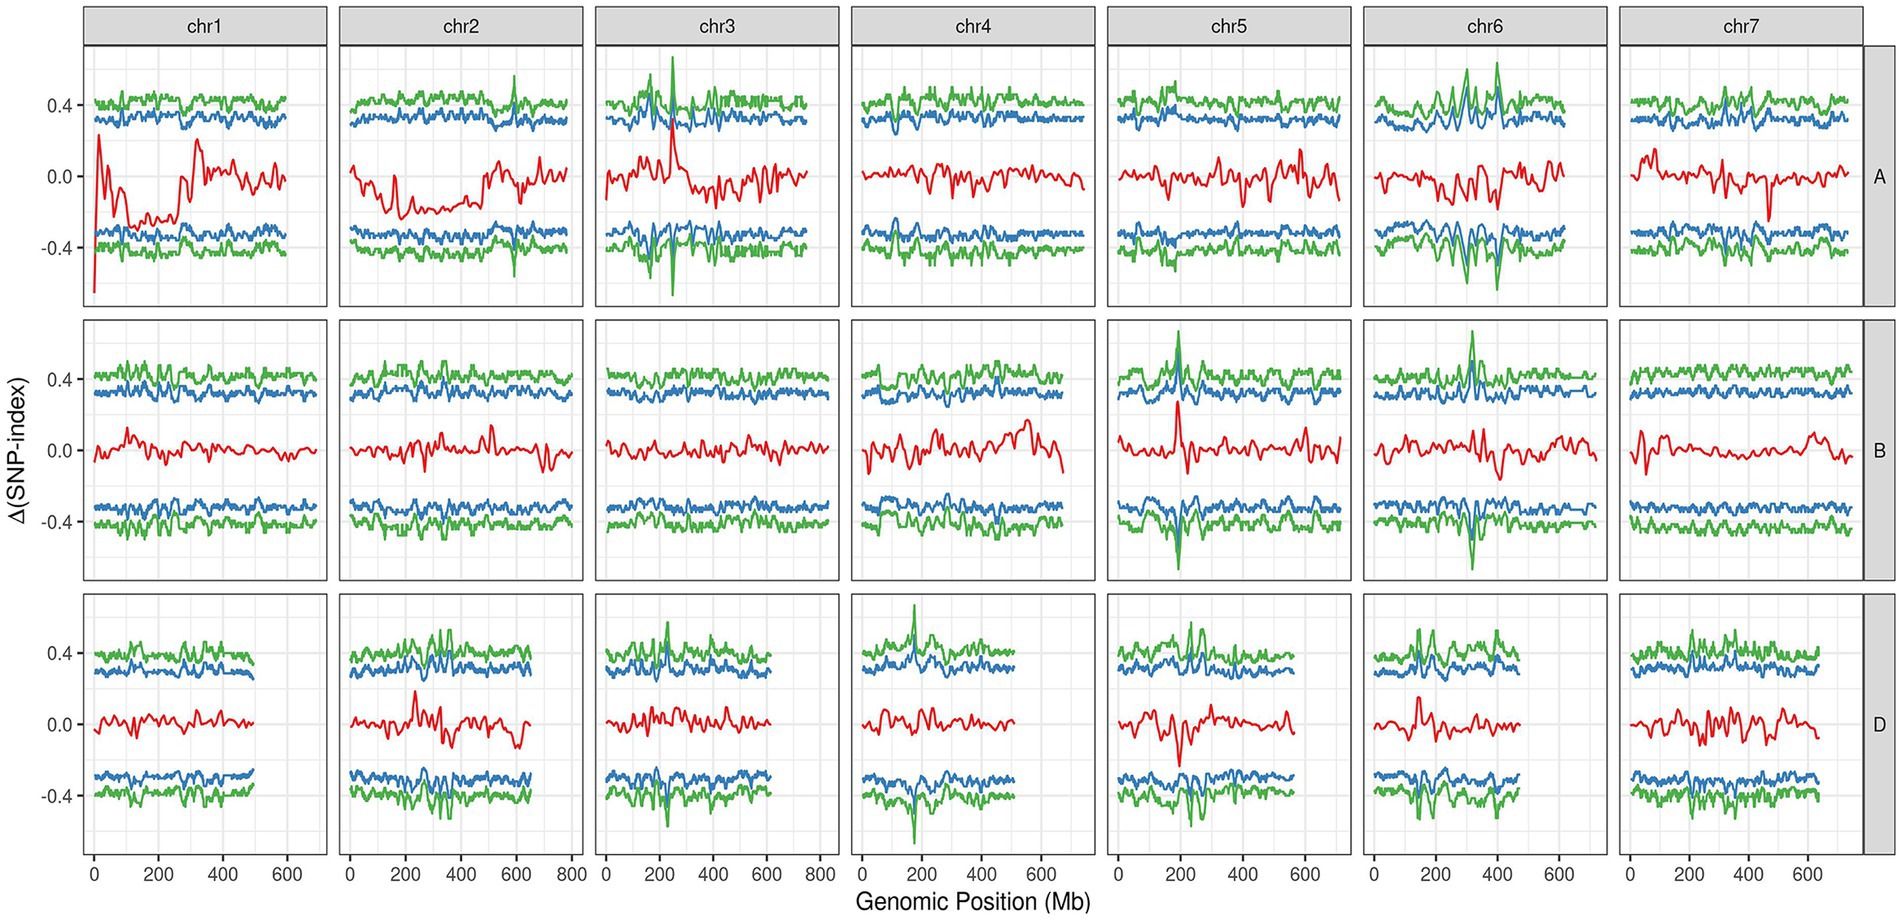
Figure 3. The tricube-smoothed ∆(SNP-index; red line) of BSE-Seq analysis. The blue and green lines indicated for confidence intervals of 95 and 99%, respectively.
A total of 27,607 polymorphic sites (Figure 4A) among the 83 resequencing accessions were obtained including 22,046 SNPs and 5,561 InDels. Of them, 163 InDel markers (Supplementary Table S5) and 19 KASP markers (Supplementary Table S6) were developed and used to screen against the NIL1, and eight markers were detected polymorphism between the two isolines.
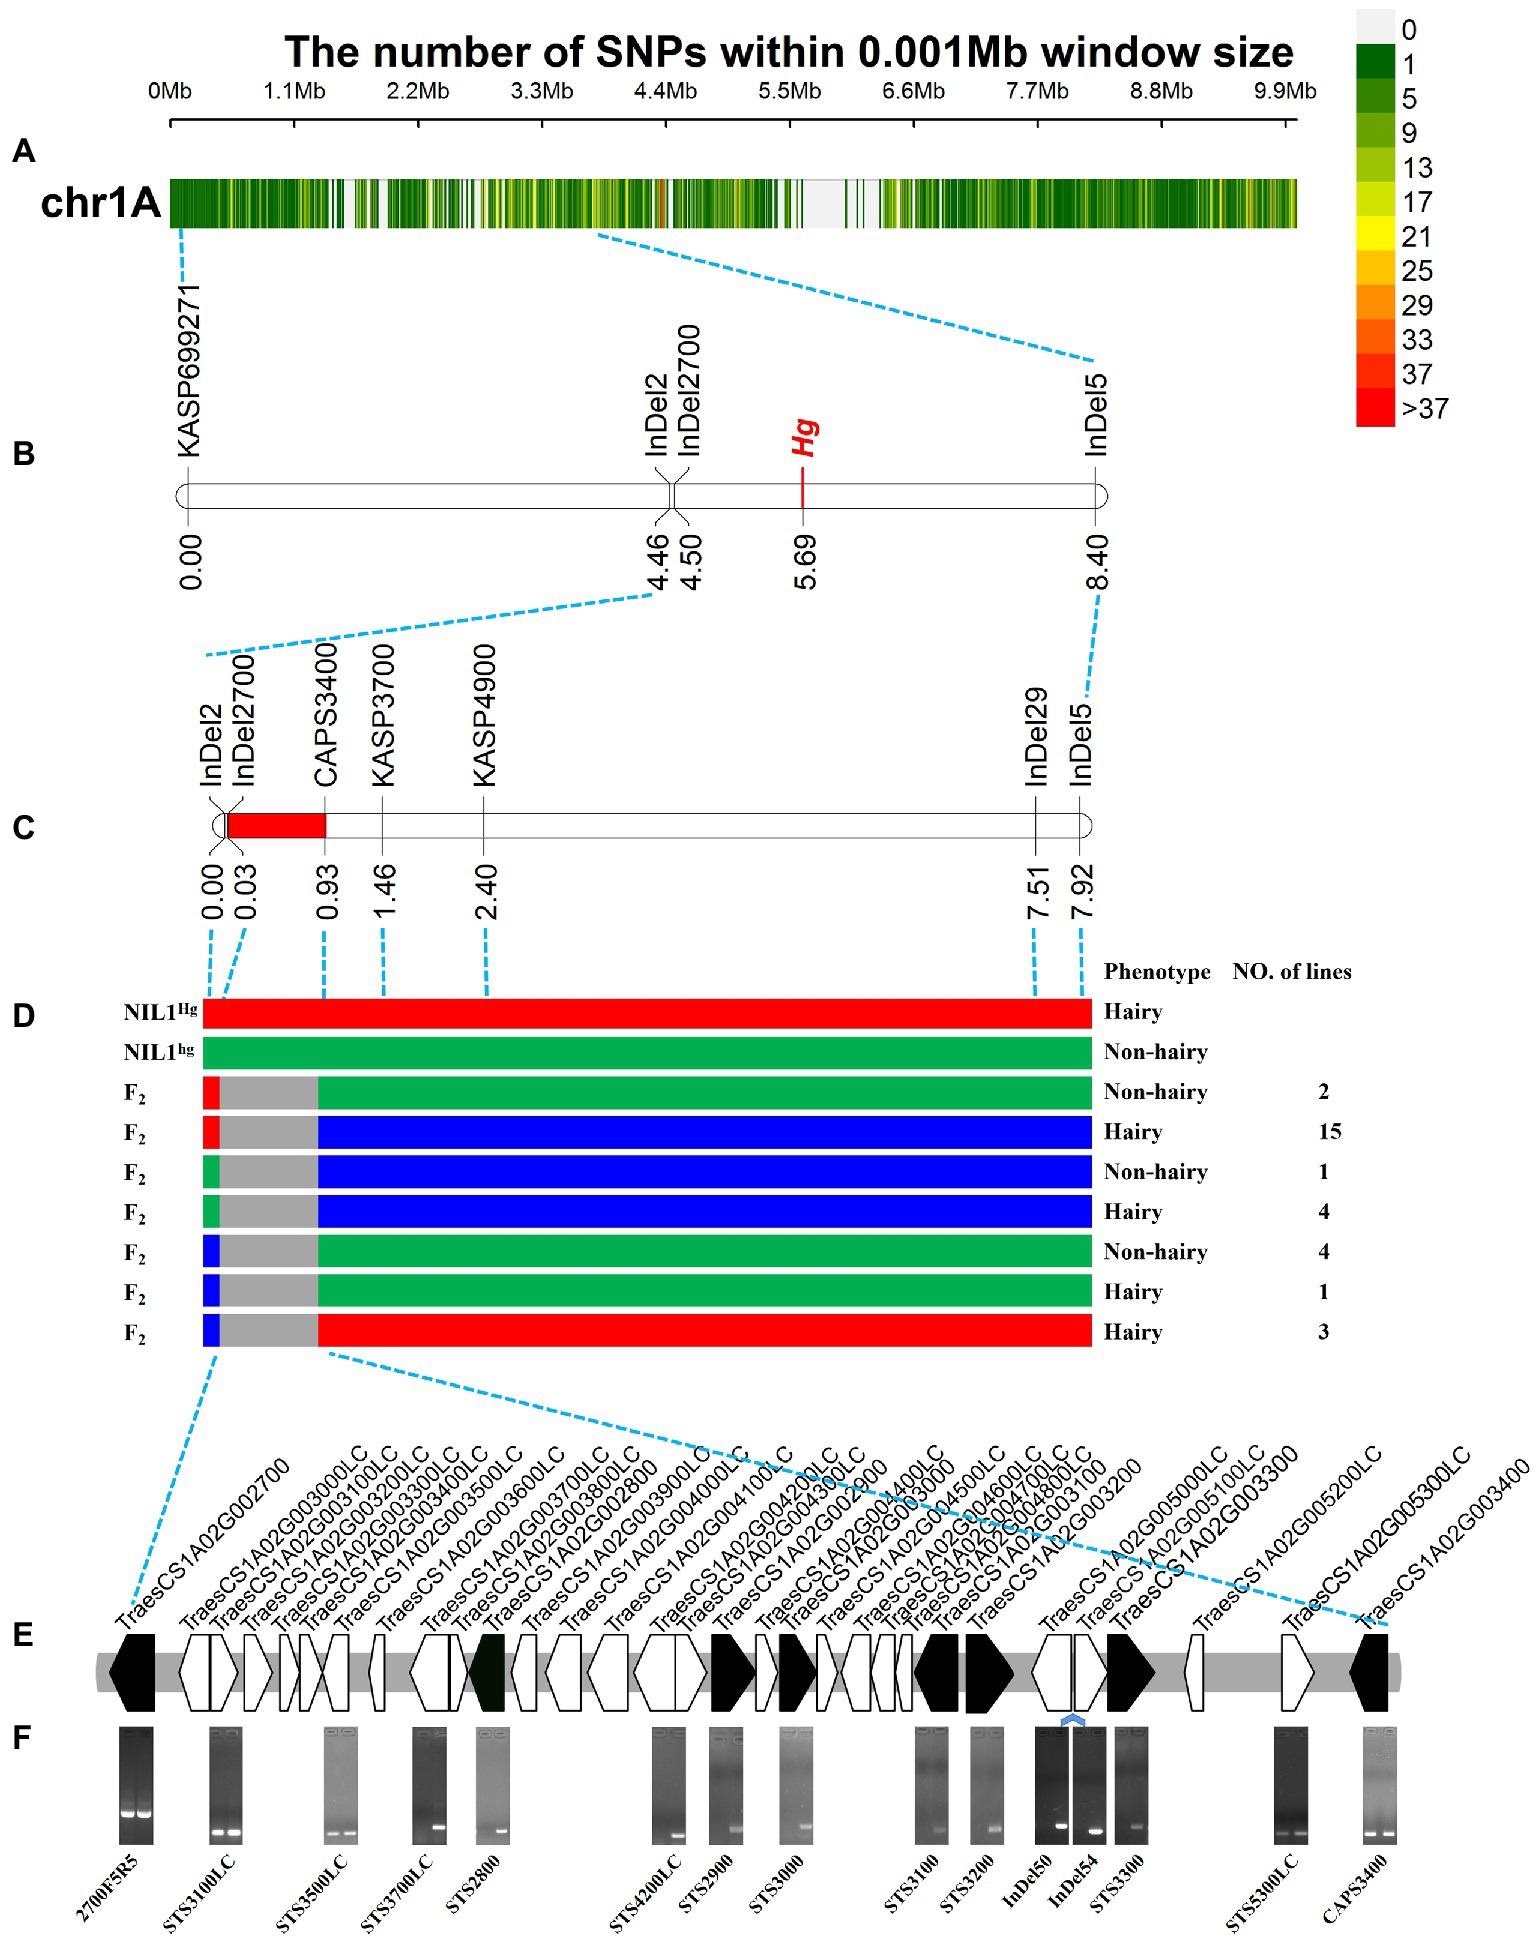
Figure 4. Fine mapping of Hg. (A) The variations in 0–10 Mb among the 83 released resequencing wheat accessions. (B) The primary mapping of Hg with the markers based on the resequencing data. (C) The fine mapping region of Hg. (D) The recombinants from the fine mapping region, the three colors indicated the genotypes of hairy (red), heterozygous (blue), and non-hairy lines (green), respectively. (F) The genes in fine mapping region from IWGSC Annotation v1.1. (D) The amplification of the primers for the genes in the mapping region. The bands of TraesCS1A02G002700 were the amplification products using sequencing primers of 2700F5 and 2700R5; STS4200LC was designed based on the overlapping sequence of TraesCS1A02G004200LC and TraesCS1A02G004300LC; InDel50 and InDel54 were two InDel markers based on the re-sequencing data in the region between TraesCS1A02G005000LC and TraesCS1A02G005100LC; the bands of TraesCS1A02G003400 were the amplification products of CAPS3400F and CAPS3400R (Enzyme digestion has not been carried out). The left and right lanes were the hairy and non-hairy isolines, respectively.
The newly developed markers were then used to screen the 100 RILs to confirm the initial location of Hg. Hg was located in the region between InDel2 and InDel5 (Figure 4B). After that, TraesCS1A02G002700 (one of the closest gene to InDel2) was isolated based on the chromosome 1A specific primers (Supplementary Table S7) and sequenced in NIL1, and a 122 bp sequence was detected to be inserted in the hairy isoline. An InDel marker, InDel2700, was designed and mapped closer to Hg in the RIL population (Figure 4B).
Based on the positions and sequences of the two flanking markers, twelve genes (Supplementary Table S7) were sequenced from the two isolines of NIL1 and three polymorphic markers (CAPS3400, KASP3700, and KASP4900; Supplementary Table S8) were generated and used to genotype the population and construct a high-density genetic map covering the targeted region. Finally, Hg was placed into a 0.90 cM region between InDel2700 and CAPS3400 covering a physical region of ~825.03 Kb (1,337,248-2,162,275 bp; Figure 4C). By assessing the whole population of 2,050 lines with the two flanking markers (InDel2700 and CAPS3400), 30 recombinants were identified (Figure 4D). Phenotyping of these recombinants found that 23 were hairy and the other 7 were non-hairy (Figure 4D). Six HC and 23 LC genes (Figure 4E; Supplementary Table S8) were annotated in this fine mapping region according to IWGSC Annotation v1.1.
In the fine mapping region, some genes can be easily amplified in non-hairy isoline of NIL1 while no bands or target sequences were obtained in the hairy isoline. For instance, the target sequence for the homolog TraesCS1A02G003000, was obtained in the non-hairy isolines of NIL1, while the amplified sequence from hairy isolines was more similar to the homoeolog on 1B (Supplementary Figure S4).
STS markers were then designed for the conserved region of 6 HC and 5 LC genes (Figure 4E; Supplementary Table S9). As expected, the 11 STS and 2 InDel markers were detected in non-hairy isoline of NIL1 (Figure 4F). However, the markers between TraesCS1A02G003500LC and TraesCS1A02G005300LC were not detected in hairy isoline of NIL1 (Figure 4F). These results indicated that a presence-absence variation (PAV) might exist in the fine mapping region.
A gap was detected in the region from ~1.40 Mb to ~2.10 Mb when mapping the resequencing reads of Q1028 to IWGSC RefSeq v1.0. There was a low coverage region with a few reads and most of these reads showed huge difference relative to the reference sequence. For example, a gap was shown in 1.82–1.90 Mb, and a normal region was shown in 2.17–2.25 Mb (Figure 5). It was found that the number of abnormal reads in fine mapping region were larger than in the flanking regions (Figure 6). The abnormal high and low coverage reads were quite less and larger than the flanking regions (Figure 6), respectively. Taken together, the PAV was further identified through resequencing of the donor of Hg.
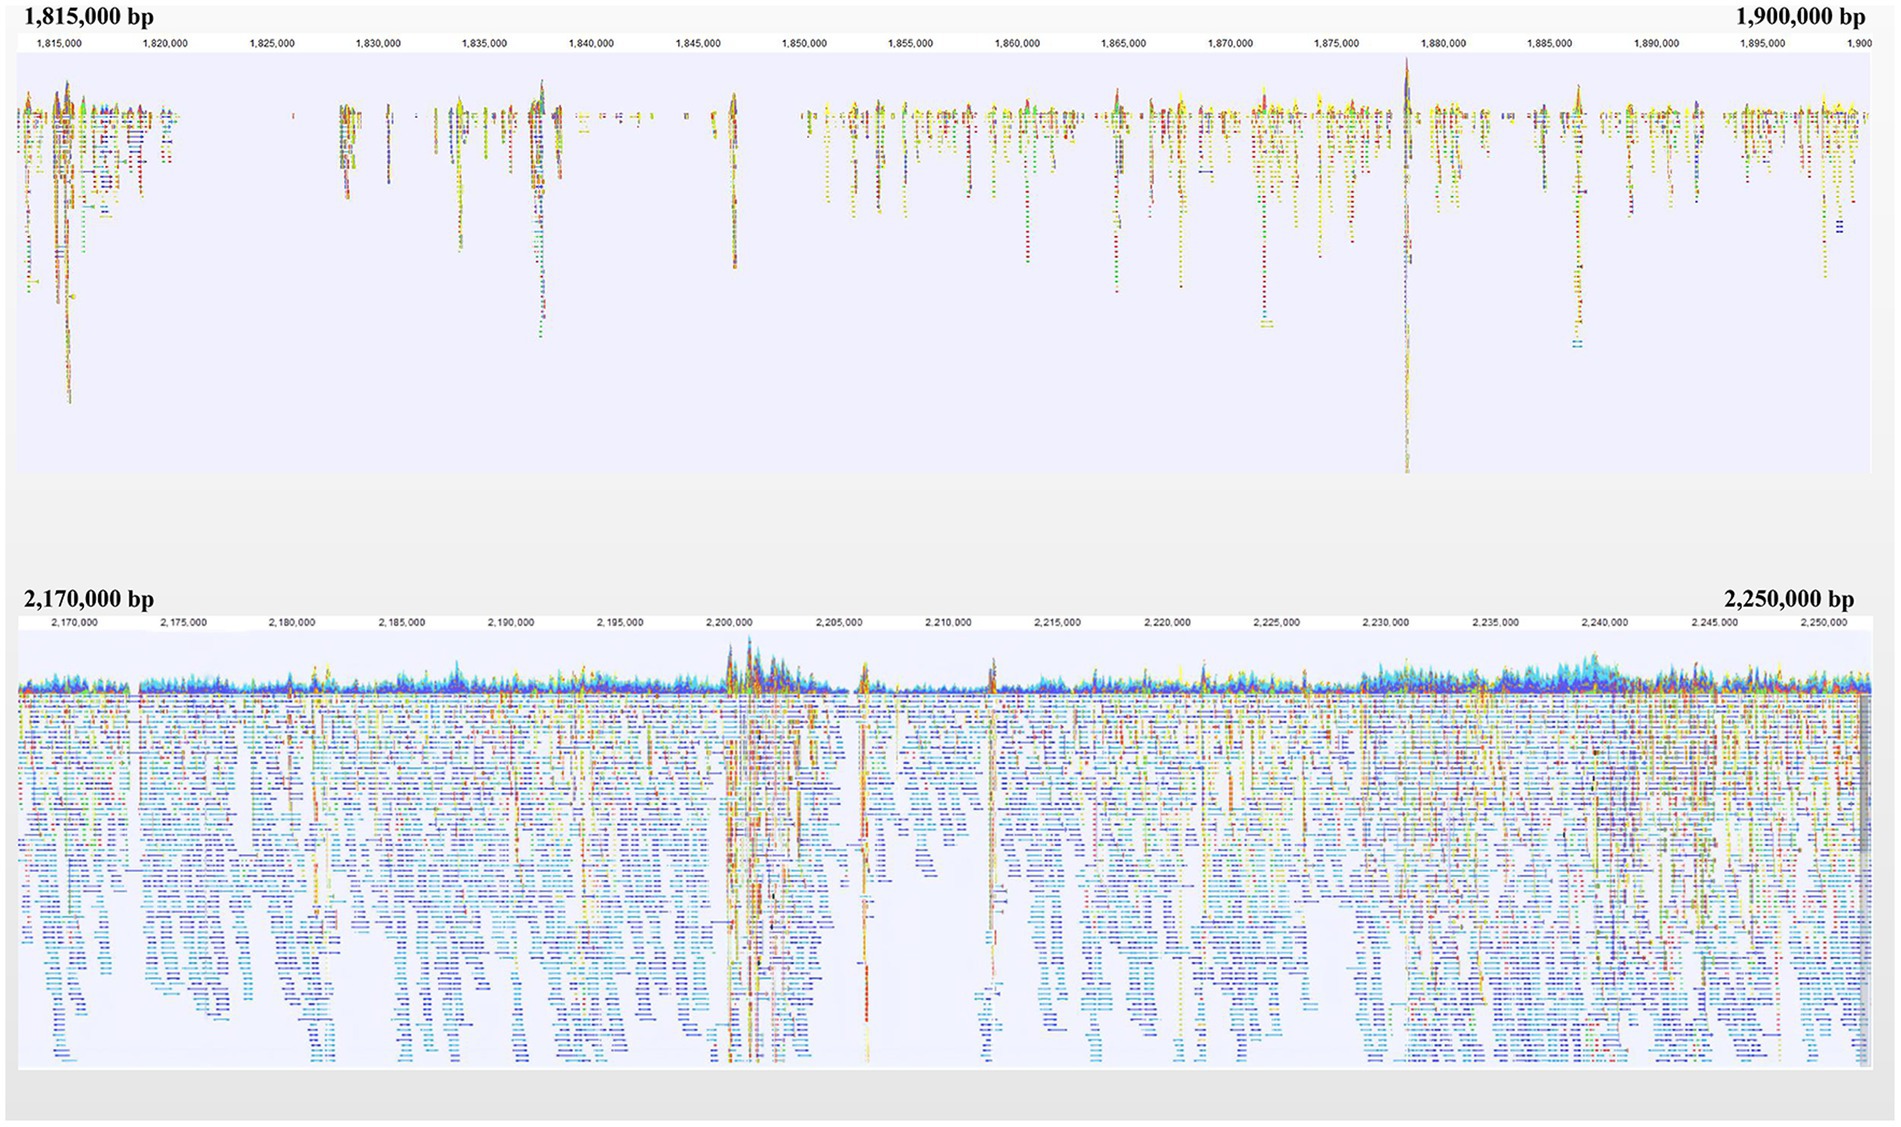
Figure 5. Navigation overview of two reads mapping regions on Chromosome 1A. Each color block represented a read. Each color block represents a read. The closer it is to blue or red, the more similar or different the read is to the reference, respectively.
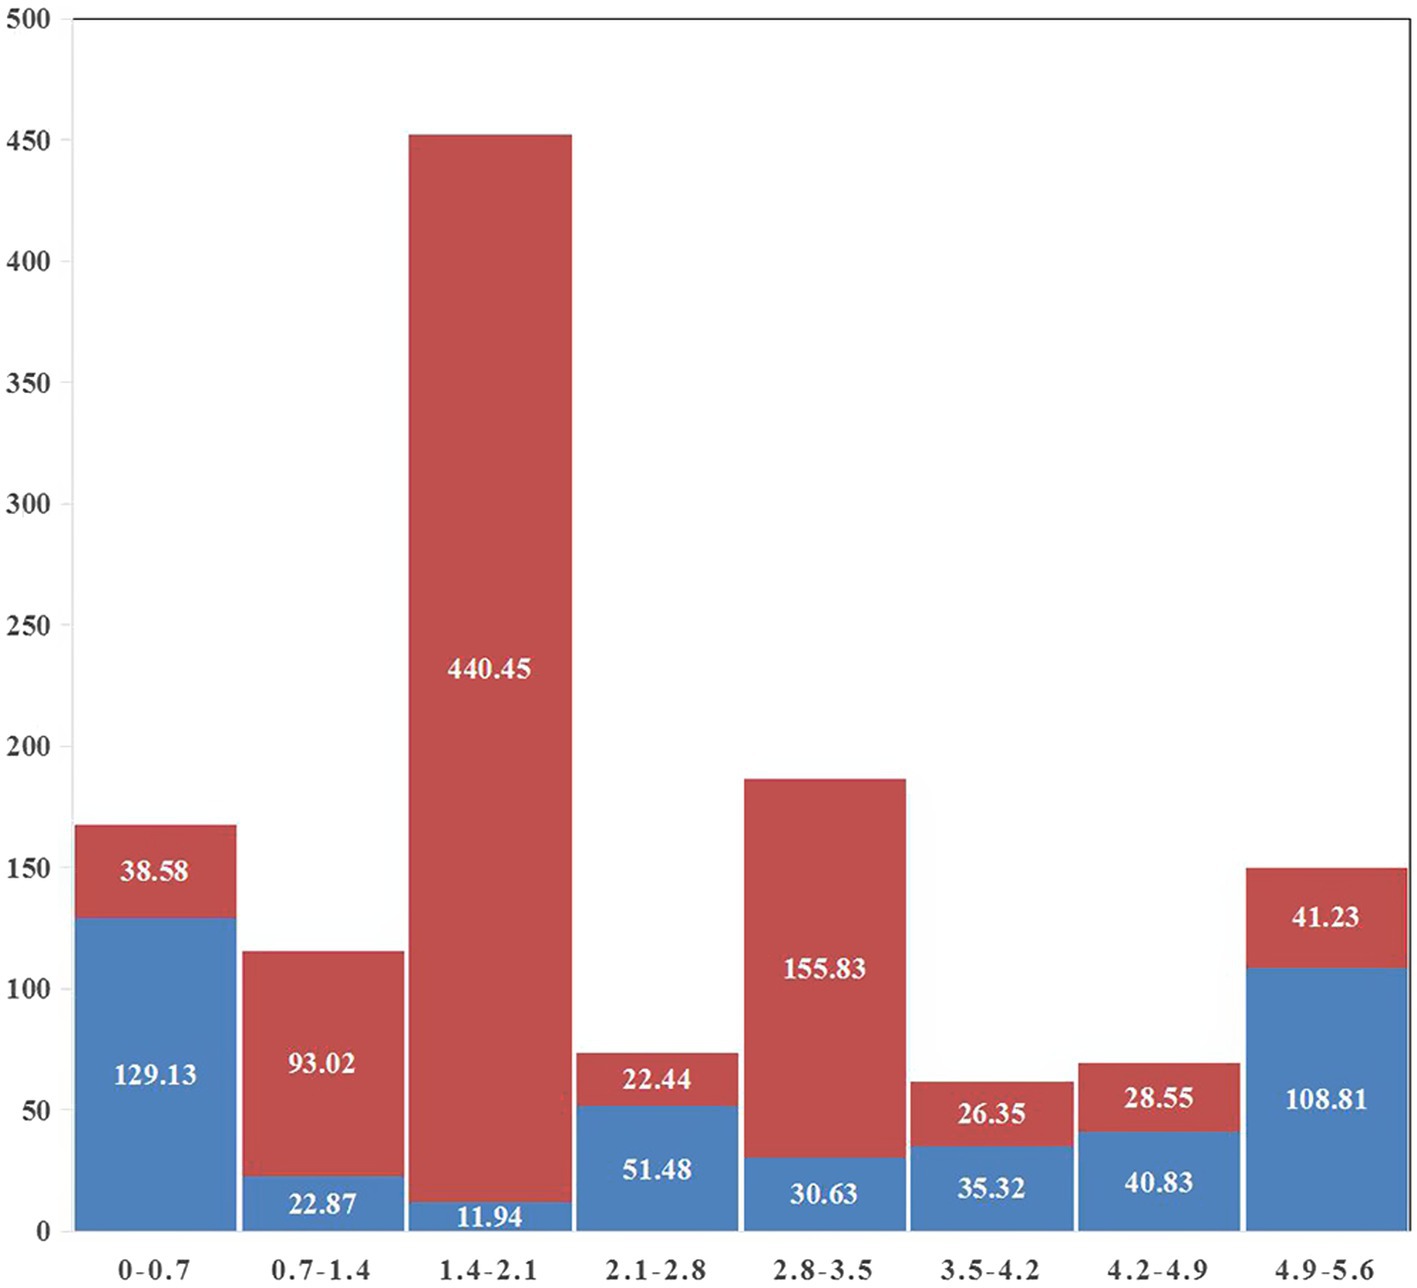
Figure 6. Statistics of abnormal reads coverage around fine mapping interval. Red and blue indicated low and high coverage, respectively. The abscissa was the physical map of 1A (MB) and the ordinate was the total length of abnormal reads (KB).
Hg as the dominant gene for glume trichome has been studied for many years. However, candidate genes underlying this locus remain unknown. In the present study, we developed and assessed a large NIL-derived population targeting this locus and finally placed this gene into a 0.90 cM genetic region corresponding to a ~825.03 Kb physical region (1,337,248–2,162,275 bp) on chromosome 1AS. A PAV was identified in the candidate region according to amplification results of STS markers and sequencing data analysis of Q1028. This PAV at the mapping region may hamper the following work of gene cloning of Hg.
It has been reported that prediction of candidate genes via fine mapping was impeded by chromosome variation, so alternative approaches have been arisen to solve the problem. Nsabiyera et al. (2019) suggested resequencing of the parents of mapping population and de novo assemble of the target region was the ideal way to obtain the functional genes. Lang et al. (2021) used the same method and discovered the gene for pre-harvest sprouting resistance gene from synthetic hexaploid in a PAV region on 3D. Hewitt et al. (2021) isolated the functional gene conferring powdery mildew resistance by single chromosome enrichment sequencing for 7A. These reports provided us clues to explore the candidate genes from a chromosome variation region.
Chromosome variants might be involved in crop domestication and adaptation (Huang et al., 2021). Besides the distal terminus of 1AS, chromosome variation has been reported at the distal terminus of other chromosomes. For example, a heat stress tolerance gene was mapped in the PAV region at the distal terminus of 4AL (Zhai et al., 2021). Bunt resistance gene Bt9 was located on the distal terminus of 6DL, and PAV markers for Bt9 selection had been identified (Morris and Beecher, 2012). Furthermore, there was a rearrangement at the distal region of chromosome 7AL (Hewitt et al., 2021). These variants indicated that chromosome extremities were the most variational regions in wheat (De Oliveira et al., 2020), which was proved by wheat-rice comparative genomics, and gene evolution appeared preferentially at chromosome extremities due to the high frequency of recombination duplication and divergence (See et al., 2006).
We found that the percentage of hairy glume in released wheat cultivars is much less than that of wild or semi-wild wheat (Luo et al., 2019). Furthermore, 35.7% of the genes in bread wheat were dispensable (Montenegro et al., 2017). It was reported that trichome is not necessary for the growth and development of the plant itself although it provides resistance to biotic and abiotic stress (Zhang et al., 2020). Trichome on wheat glume may be a dispensable structure controlled by dispensable genes, while it may provide clues for studying the evolution and domestication of wheat.
In summary, Hg was fine mapped in a ~ 825.03 Kb physical region on chromosome 1A, and a PAV was identified in this region. Assembling of resequencing data may be an effective way to explore Hg.
The data presented in the study are deposited in the National Genomics Data Center (NGDC) repository, accession number PRJCA010932.
WL finished the study and wrote this manuscript. JZ participated in glasshouse work, phenotype investigation, and data analysis. JL, YL, and YM helped phenotype investigation. HT helped data analysis and maker development. QX and MD collected and analyzed data. QJ, GC, and PQ helped with data analysis and revision. JW and YJ analyzed resequencing data. ZC performed BSE-Seq analysis. ZZ and YW revised the manuscript. YZ and XL discussed results. JM designed the experiments, guided the entire study, and extensively revised this manuscript. All authors participated in the research and approved the final manuscript.
This research was funded by the National Natural Science Foundation of China (31970243 and 31971937), Sichuan Science and Technology Program (2022YFH0053, 2022NSFSC1729, and 2021YFH0083), and the Basic Research Project of Science and Technology Plan of Guizhou Province (ZK[2021] General 131). We thank the anonymous referees for critical reading and revising this manuscript.
The authors declare that the research was conducted in the absence of any commercial or financial relationships that could be construed as a potential conflict of interest.
All claims expressed in this article are solely those of the authors and do not necessarily represent those of their affiliated organizations, or those of the publisher, the editors and the reviewers. Any product that may be evaluated in this article, or claim that may be made by its manufacturer, is not guaranteed or endorsed by the publisher.
The Supplementary material for this article can be found online at: https://www.frontiersin.org/articles/10.3389/fpls.2022.1006510/full#supplementary-material
SUPPLEMENTARY FIGURE S1 | Result of varBScore analysis for BSE-Seq. The above and below figures were drawn based on the varBScore of the variable sites of the whole genome and chromosome 1A, respectively.
SUPPLEMENTARY FIGURE S2 | Tricube-smoothed G’ value for BSE-Seq.
SUPPLEMENTARY FIGURE S3 | Result of ED analysis for BSE-Seq. The above and below figures were drawn based on the fitted curve and original value, respectively.
SUPPLEMENTARY FIGURE S4 | Sequence comparison of amplified TraesCS1A02G003000 in NIL1.
2. ^https://galaxy.triticeaetoolbox.org/
3. ^http://www.polymarker.info/
5. ^https://digitalinsights.qiagen.com/products-overview/discovery-insights-portfolio/analysis-and-visualization/qiagen-clc-genomics-workbench/
Bickford, C. P. (2016). Ecophysiology of leaf trichomes. Funct. Plant Biol. 43, 807–814. doi: 10.1071/FP16095
De Oliveira, R., Rimbert, H., Balfourier, F., Kitt, J., Dynomant, E., Vrana, J., et al. (2020). Structural variations affecting genes and transposable elements of chromosome 3B in wheats. Front. Genet. 11, 891. doi: 10.3389/fgene.2020.00891
Dong, C., Zhang, L., Chen, Z., Xia, C., Gu, Y., Wang, J., et al. (2020). Combining a new exome capture panel with an effective varBScore algorithm accelerates BSA-based gene cloning in wheat. Front. Plant Sci. 11, 1249. doi: 10.3389/fpls.2020.01249
Dubcovsky, J., and Dvorák, J. (1995). Ribosomal RNA multigene loci: nomads of the Triticeae genomes. Genetics 140, 1367–1377. doi: 10.1093/genetics/140.4.1367
Galdon-Armero, J., Fullana-Pericas, M., Mulet, P. A., Conesa, M. A., Martin, C., and Galmes, J. (2018). The ratio of trichomes to stomata is associated with water use efficiency in Solanum lycopersicum (tomato). Plant J. 96, 607–619. doi: 10.1111/tpj.14055
Gao, S., Zheng, Z., Powell, J., Habib, A., Stiller, J., Zhou, M., et al. (2019). Validation and delineation of a locus conferring Fusarium crown rot resistance on 1HL in barley by analysing transcriptomes from multiple pairs of near isogenic lines. BMC Genomics 20, 650. doi: 10.1186/s12864-019-6011-8
Guo, W., Xin, M., Wang, Z., Yao, Y., Hu, Z., Song, W., et al. (2020). Origin and adaptation to high altitude of Tibetan semi-wild wheat. Nat. Commun. 11, 5085. doi: 10.1038/s41467-020-18738-5
Habib, A., Powell, J. J., Stiller, J., Liu, M., Shabala, S., Zhou, M., et al. (2017). A multiple near isogenic line (multi-NIL) RNA-seq approach to identify candidate genes underpinning QTL. Theor. Appl. Genet. 131, 613–624. doi: 10.1007/s00122-017-3023-0
Handley, R., Ekbom, B., and Ågren, J. (2005). Variation in trichome density and resistance against a specialist insect herbivore in natural populations of Arabidopsis thaliana. Ecol. Entomol. 30, 284–292. doi: 10.1111/j.0307-6946.2005.00699.x
Hewitt, T., Müller, M. C., Molnár, I., Mascher, M., Holušová, K., Šimková, H., et al. (2021). A highly differentiated region of wheat chromosome 7AL encodes a Pm1a immune receptor that recognizes its corresponding AvrPm1a effector from Blumeria graminis. New Phytol. 229, 2812–2826. doi: 10.1111/nph.17075
Hill, J. T., Demarest, B. L., Bisgrove, B. W., Gorsi, B., Su, Y. C., and Yost, H. J. (2013). MMAPPR: mutation mapping analysis pipeline for pooled RNA-seq. Genome Res. 23, 687–697. doi: 10.1101/gr.146936.112
Huang, Y., Huang, W., Meng, Z., Braz, G. T., Li, Y., Wang, K., et al. (2021). Megabase-scale presence-absence variation with Tripsacum origin was under selection during maize domestication and adaptation. Genome Biol. 22, 237. doi: 10.1186/s13059-021-02448-2
IWGSC (2018). Shifting the limits in wheat research and breeding using a fully annotated reference genome. Science 361:eaar7191. doi: 10.1126/science.aar7191
Ji, G., Xu, Z., Fan, X., Zhou, Q., Yu, Q., Liu, X., et al. (2021). Identification of a major and stable QTL on chromosome 5A confers spike length in wheat (Triticum aestivum L.). Mol. Breed. 41:56. doi: 10.1007/s11032-021-01249-6
Jiang, Y., Habib, A., Zheng, Z., Zhou, M., Wei, Y., Zheng, Y.-L., et al. (2019). Development of tightly linked markers and identification of candidate genes for Fusarium crown rot resistance in barley by exploiting a near-isogenic line-derived population. Theor. Appl. Genet. 132, 217–225. doi: 10.1007/s00122-018-3209-0
Kadam, B. (1936). Genetics of the Bansi wheat of the Bombay-Deccan and a synthetic Khapli-part I. Proc. Indian As. B. 4, 357–369.
Khlestkina, E. K., Pshenichnikova, T. A., Roder, M. S., Salina, E. A., Arbuzova, V. S., and Borner, A. (2006). Comparative mapping of genes for glume colouration and pubescence in hexaploid wheat (Triticum aestivum L.). Theor. Appl. Genet. 113, 801–807. doi: 10.1007/s00122-006-0331-1
Lang, J., Fu, Y., Zhou, Y., Cheng, M., Deng, M., Li, M., et al. (2021). Myb10-D confers PHS-3D resistance to pre-harvest sprouting by regulating NCED in ABA biosynthesis pathway of wheat. New Phytol. 230, 1940–1952. doi: 10.1111/nph.17312
Lian, C., Zuo, X., and Tian, L. (2019). A possible role of biogenic silica in esophageal cancer in North China? Environ. Sci. Pollut. R. 26, 8340–8343. doi: 10.1007/s11356-019-04332-w
Luo, W., Liu, J., Ding, P., Li, C., Liu, H., Mu, Y., et al. (2020). Transcriptome analysis of near-isogenic lines for glume hairiness of wheat. Gene 739:144517. doi: 10.1016/j.gene.2020.144517
Luo, W., Liu, J., Ding, P., Zou, Y., Li, T., Xie, Q., et al. (2019). Domestication of glume hairiness in wheat. J. Sichuan Agr. Univ. 37, 743–754. doi: 10.16036/j.issn.1000-2650.2019.06.001
Luo, W., Ma, J., Zhou, X.-h., Jiang, Y.-f., Sun, M., Yang, Y.-j., et al. (2016). Genetic analysis of glume hairiness (Hg) gene in bread wheat (Triticum aestivum L.). Genet. Resour. Crop Evol. 63, 763–769. doi: 10.1007/s10722-016-0393-0
Ma, S., Wang, M., Wu, J., Guo, W., Chen, Y., Li, G., et al. (2021). WheatOmics: A platform combining multiple omics data to accelerate functional genomics studies in wheat. Mol. Plant 14, 1965–1968. doi: 10.1016/j.molp.2021.10.006
Mansfeld, B. N., and Grumet, R. (2018). QTLseqr: an R package for bulk segregant analysis with next-generation sequencing. Plant Genome 11:180006. doi: 10.3835/plantgenome2018.01.0006
Montenegro, J. D., Golicz, A. A., Bayer, P. E., Hurgobin, B., Lee, H., Chan, C. K., et al. (2017). The pangenome of hexaploid bread wheat. Plant J. 90, 1007–1013. doi: 10.1111/tpj.13515
Morris, C. F., and Beecher, B. S. (2012). The distal portion of the short arm of wheat (Triticum aestivum L.) chromosome 5D controls endosperm vitreosity and grain hardness. Theor. Appl. Genet. 125, 247–254. doi: 10.1007/s00122-012-1830-x
Nsabiyera, V., Baranwal, D., Qureshi, N., Kay, P., Forrest, K., Valarik, M., et al. (2019). Fine mapping of Lr49 using 90K SNP chip array and flow-sorted shromosome sequencing in wheat. Front. Plant Sci. 10, 1787. doi: 10.3389/fpls.2019.01787
Paterson, A. H., Lander, E. S., Hewitt, J. D., Peterson, S., Lincoln, S. E., and Tanksley, S. D. (1988). Resolution of quantitative traits into Mendelian factors by using a complete linkage map of restriction fragment length polymorphisms. Nature 335, 721–726. doi: 10.1038/335721a0
See, D. R., Brooks, S., Nelson, J. C., Brown-Guedira, G., Friebe, B., and Gill, B. S. (2006). Gene evolution at the ends of wheat chromosomes. Proc. Natl. Acad. Sci. U. S. A. 103, 4162–4167. doi: 10.1073/pnas.0508942102
Sheoran, S., Jaiswal, S., Kumar, D., Raghav, N., Sharma, R., Pawar, S., et al. (2019). Uncovering genomic regions associated with 36 agro-morphological traits in Indian spring wheat using GWAS. Front. Plant Sci. 10, 527. doi: 10.3389/fpls.2019.00527
Tsunewaki, K. (1961). Monosomic and conventional gene analyses in common wheat IV. Glume hairiness and ear density. JPN. J. Genet. 36, 55–62.
Walkowiak, S., Gao, L., Monat, C., Haberer, G., Kassa, M. T., Brinton, J., et al. (2020). Multiple wheat genomes reveal global variation in modern breeding. Nature 588, 277–283. doi: 10.1038/s41586-020-2961-x
Wan, H., Yang, Y., Li, J., Zhang, Z., and Yang, W. (2015). Mapping a major QTL for hairy leaf sheath introgressed from Aegilops tauschii and its association with enhanced grain yield in bread wheat. Euphytica 205, 275–285. doi: 10.1007/s10681-015-1457-5
Wang, W., Wang, Z., Li, X., Ni, Z., Hu, Z., Xin, M., et al. (2020). SnpHub: an easy-to-set-up web server framework for exploring large-scale genomic variation data in the post-genomic era with applications in wheat. GigaScience 9:giaa060. doi: 10.1093/gigascience/giaa060
Werker, E. (2000). Trichome diversity and development. Adv. Bot. Res. 31, 1–35. doi: 10.1016/S0065-2296(00)31005-9
Wu, P., Yang, L., Guo, G., Hu, J., Qiu, D., Li, Y., et al. (2021). Molecular mapping and identification of a candidate gene for new locus Hg2 conferring hairy glume in wheat. Plant Sci. 307:110879. doi: 10.1016/j.plantsci.2021.110879
Zhai, H., Jiang, C., Zhao, Y., Yang, S., Li, Y., Yan, K., et al. (2021). Wheat heat tolerance is impaired by heightened deletions in the distal end of 4AL chromosomal arm. Plant Biotechnol. J. 19, 1038–1051. doi: 10.1111/pbi.13529
Zhang, Y., Song, H., Wang, X., Zhou, X., Zhang, K., Chen, X., et al. (2020). The roles of different types of trichomes in tomato resistance to cold, drought, whiteflies, and botrytis. Agronomy 10, 411. doi: 10.3390/agronomy10030411
Keywords: fine mapping, BSE-Seq, hairy glume, wheat, presence-absence variation
Citation: Luo W, Zhou J, Liu J, Liu Y, Mu Y, Tang H, Xu Q, Deng M, Jiang Q, Chen G, Qi P, Wang J, Jiang Y, Chen Z, Zheng Z, Wei Y, Zheng Y, Lan X and Ma J (2022) Fine mapping of the Hairy glume (Hg) gene in a chromosome variation region at the distal terminus of 1AS. Front. Plant Sci. 13:1006510. doi: 10.3389/fpls.2022.1006510
Edited by:
Xiaoli Fan, Chengdu Institute of Biology (CAS), ChinaReviewed by:
Junming Li, Chinese Academy of Sciences, ChinaCopyright © 2022 Luo, Zhou, Liu, Liu, Mu, Tang, Xu, Deng, Jiang, Chen, Qi, Wang, Jiang, Chen, Zheng, Wei, Zheng, Lan and Ma. This is an open-access article distributed under the terms of the Creative Commons Attribution License (CC BY). The use, distribution or reproduction in other forums is permitted, provided the original author(s) and the copyright owner(s) are credited and that the original publication in this journal is cited, in accordance with accepted academic practice. No use, distribution or reproduction is permitted which does not comply with these terms.
*Correspondence: Xiujin Lan, bGFueGl1amluQDE2My5jb20=; Jian Ma, amlhbm1hQHNpY2F1LmVkdS5jbg==
†These authors have contributed equally to this work
Disclaimer: All claims expressed in this article are solely those of the authors and do not necessarily represent those of their affiliated organizations, or those of the publisher, the editors and the reviewers. Any product that may be evaluated in this article or claim that may be made by its manufacturer is not guaranteed or endorsed by the publisher.
Research integrity at Frontiers
Learn more about the work of our research integrity team to safeguard the quality of each article we publish.