 Mansour Thiao
 Godar Sene
 Moustapha Ndiaye2
 El Hadji Samba Ndao Sylla
- 1Laboratoire Commun de Microbiologie (LCM) Institut de Recherche pour le Developpement/Institut Sénégalais de Recherche Agricole/Université Cheikh Anta Diop (IRD/ISRA/UCAD), Département de Biologie végétale, Faculté des Sciences et Techniques, Université Cheikh Anta Diop de Dakar, Dakar, Senegal
- 2Laboratoire de Botanique, Département de Biologie végétale, Faculté des Sciences et Techniques, Université Cheikh Anta Diop de Dakar, Dakar, Senegal
Soil properties and microbial activities are indicators that shape plant communities and evolution. We aimed to determine the interdependency between trees, belowground herbaceous plants, soil characteristics, and arbuscular mycorrhizal communities. Vachellia seyal and Prosopis chilensis and their associated herb layers were targeted. Soils sampled beneath the trees and outside the canopies were subjected to physicochemical and microbial characterization. Randomly collected living roots of trees and dominant herbs were checked for arbuscular mycorrhizal colonization. A tree seedlings nursery was conducted using black bags filled with the following substrates: natural soil 100%, soil mixed with leaf tree plants (LTPs) as organic matter at 10%, soil mixed with LTP at 20%, soil mixed with LTP at 30%, and soil mixed with LTP at 50%. As a result, the presence of trees improves both herb richness and diversity. Soil mycorrhizal inoculum potentials are higher beneath V. seyal than P. chilensis and decreased significantly with increasing distance from trees. The soil MIP decreased with increasing organic matter content for both tree species but was more pronounced for P. chilensis. Soil salinity is lower beneath V. seyal and higher under P. chilensis and outside the canopies. Soil fertility parameters such as carbon, nitrogen, and available phosphorus are higher beneath the trees and then decreased as the distance to the trees increases. We conclude that microbial communities, soil properties, and herb richness and diversity increased beneath the trees but decreased with increasing distance from the trees. This effect is tree species-dependent as P. chilensis increased soil salinity and decreased the belowground density of herbs.
Introduction
Land salinization is affecting more and more lands around the world (Sène, 2012; Fall, 2016). In Senegal, the area covered by salinization was estimated at 1,200,000 ha (Sieverding, 1991). This phenomenon of salinization is distributed in Senegal in the coastal areas and the catchment areas of the Senegal, Sine, Saloum, and Casamance rivers, thus affecting a large part of the Senegalese groundnut basin. Most crops such as cereals are sensitive to salt (Evelin et al., 2009); thus, vegetation cover and agricultural production decrease accordingly. The main effects of salinity responsible for low plant productivity are growth suppression due to generally low osmotic potential during germination, emergence, and seedling growth (Miller and Jastrow, 2000) and growth suppression due to specific ion toxicity. In Senegal, in the southern part of the Fatick region, the land affected by salinization is in an ecosystem where the tree species Vachellia seyal and Prosopis chilensis are well represented and are symbiotic partners of soil microorganisms (Faye et al., 2019). Arbuscular mycorrhizal fungi (AMF) are widely present in saline soils (Aliasgharzadeh et al., 2001), but the presence of salt in soil can affect the establishment of a functional AMF symbiosis (Liu et al., 2018). Plant root colonization by AMF can also be reduced in the presence of sodium chloride (He et al., 2007). AMF symbiosis can mitigate the effects of salt stress on plants (Aroca et al., 2013). The telluric microflora, through its abundance and diversity, can play a fundamental role in restoring and maintaining soil fertility, protecting plants against telluric pathogens, as well as plant tolerance to environmental stresses and plant hydromineral nutrition. The AMF represented in these soil microbial communities are involved in the mobilization of phosphorus (Yang et al., 2014) and water (van der Heijden et al., 1998), respectively. They thus contribute to plant adaptation in poor soils and in soils subjected to environmental stress. Their abundance and specific diversity in soils could be synonymous with ecological behavior in response to abiotic and biotic factors. There are also other organisms that perform biological functions in the functioning of the soil ecosystem. For several decades, in the Sahelian zones, climatic disturbances associated with anthropic pressure have led to the disappearance of a large part of the vegetation cover. Climate change, the increase in the area of land affected by drought and salinization, anthropogenic pressure on land, and the resettlement of displaced populations have led to significant changes in ecosystems. This is reflected in places by a reduction in arable land, a decrease in vegetation cover, and the abandonment by populations of land whose use is expensive and difficult to achieve. Attempts at reforestation have already been undertaken with monospecific tree plantations (Smith and Read, 1997). Knowledge of the soil microflora associated directly or indirectly with trees in plantations and natural stands is an important link in the management of soil fertility and ecosystem stability. AMF are microsymbionts whose activities can have impacts on the structure and evolution of plant communities. In order to achieve greater efficiency in soil fertility management, it is therefore important to exploit all the potentialities offered by soil AMF in relation to plant formations. From this point of view, the analysis of the structure of plant formations whose components are interrelated with the AMF becomes an important indicator. For this purpose, phytosociology provides effective study tools that give useful information in the diagnosis and interpretation of results in the case of studying the evolution and stability of vegetation. The information collected from the studies of vegetation and its interactions with soil microorganisms could allow the identification of the most important factors in the evolution and stability of vegetation.
Material and methods
Phytosociological survey
Description of the study area, device model, and phytosociological survey method used
The area of interest for this study is located in Sadioga (GPS coordinates X = 344398, Y = 1579053) in Senegal, about 77 km south of Fatick City. The average annual temperature is 37°C. Like Senegalese regions, there are about three rainy months (July, August, and September), with a maximum of rainfall in August. The floristic study was carried out at the edge of the tannas (salt-affected soils near the salted lake), during the rainy season, in a homogeneous landscape with a predominance of two tree species V. seyal and P. chilensis in the tree layer. The trees under which the surveys were carried out have areas where their canopies overlap. Thus, five devices representing five trees of V. seyal and five trees of P. chilensis (equidistant at 20 ± 3 m) satisfying this choice were located. Phytosociological surveys, with average diameters of 9.3 m ± 10 cm, were carried out under the canopies of V. seyal trees and P. chilensis trees and outside the canopies of the trees. To do this, stakes were set up at the edge of the branches around the trees, and then a rope was used to connect the stakes in order to delimit the area where the encountered herbaceous species were recorded. Herbaceous plants were then identified at the site by observing their respective vegetative apparatus (stems, leaves, and flowers) and using identification flora tools (Berhaut, 1971; Noba and Ba, 1992; Mbaye et al., 2001; Noba, 2002; Noba et al., 2004; Sarr et al., 2007; Bassène, 2008; Ngom et al., 2016). Circular phytosociological surveys with a diameter of 9.3 m ± 10 cm were also carried out outside the canopies at 20 m far from the trunks of trees. For each survey, every herbaceous specie was listed and then assigned a semiquantitative coefficient of abundance–dominance and a coefficient of sociability/aggregation as well as a presence/absence coefficient. The abundance/dominance coefficients assigned to the species encountered at the field were transformed into semiquantitative abundance/dominance codes (AD code) according to the Braun–Blanquet scale and into quantitative codes (AD num) as shown in Table 1 (Gillet, 2000).
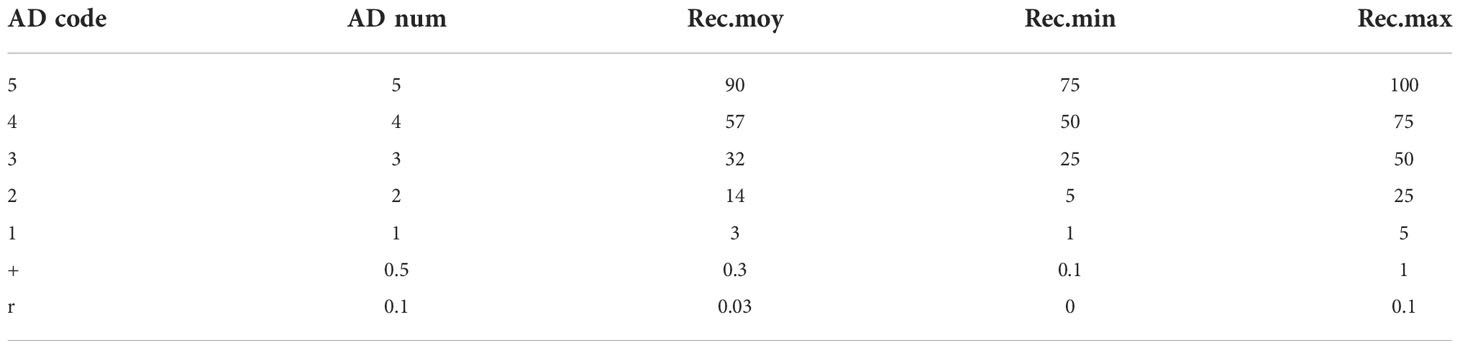
Table 1 Correspondence between the abundance–dominance code (AD), quantitative abundance–dominance coefficient (AD num), and average, minimum, and maximum cover (Gillet, 2000).
Analyses of survey similarities and association between species
The similarity between surveys was estimated by calculating Jacquard’s similarity coefficient (CSJ). The number of common species between surveys R1 (beneath V. seyal) and R2 (beneath P. chilensis), between R1 and R3 (outside the canopies of the tree), and between R2 and R3 was determined. The formula CSJ = a/(a + b + c), where “a” is the number of species common to both surveys, “b” is the number of species specific to the first survey, and “c” is the number of species specific to the second survey, was applied. Species associations were determined by calculating Jacquard’s association coefficients (CAJ). The formula CAJ = a/(a + b + c), where “a” is the number of surveys in which the two species being compared are present together, “b” is the number of surveys in which the first species is present alone, and “c” is the number of surveys in which the second species is present alone, was applied.
Living root sampling
Living root samples were collected in situ at the site from the trees of both V. seyal and P. chilensis species and from herbaceous plants found under the trees and outside of their canopies. The collected roots were then placed in labeled tubes containing ethanol (70%) and placed in a temperature controller. On arrival at the laboratory, the roots were thoroughly rinsed with sterile demineralized water, soaked in 70% ethanol, and stored at 4°C until analysis.
Soil sampling and analysis
Soil samples were taken at the edge of the tannas under the canopies of V. seyal and P. chilensis trees at 0 m near the trunks and outside the canopies of trees at 20 m far from the trunks. For each of the soil samples, four replicates were taken, which corresponds to a total of 12 samples for each of the five devices. At each sampling, the surface of soil containing debris was cleared, and soil was collected from the depth horizon 0–25 cm. Soil analyses were carried out by the Soil and Plant Analyses Laboratory of the Centre of Agricultural Research (CRA) at Saint-Louis (Senegal). For each soil sample, particle size, electrical conductivity (EC), carbon-to-nitrogen ratio (C/N), organic matter (OM), nitrogen (N), total phosphorus(P2O5), calcium (Ca2+), available phosphorus (P ass), sodium (Na+), potassium (K+) and magnesium (Mg2+) contents, cationic exchange capacity (CEC), water pH, and KCl pH were analyzed using standard analytical methods.
Mycorrhizal inoculum potentials of soil
The mycorrhizal inoculum potential (MIP) of soils was estimated by measuring the AMF colonization of living roots, the most probable number (MPN) of propagules capable to generate mycorrhizae as described by Plenchette et al. (1989), the root AMF colonization rate in soil collected beneath the trees and outside of canopies, and the AMF colonization of roots in the presence of several rates of organic matter (OM).
Living root AMF colonization
For natural mycorrhization assessment, living root samples were collected in situ from the trees of both V. seyal and P. chilensis species and from dominant herbaceous plants found under and outside the canopies of the tree species. Collected roots were then placed in labeled tubes containing ethanol (70%) and placed in a temperature controller. On arrival at the laboratory, the roots were thoroughly rinsed with sterile demineralized water, soaked in 70% ethanol, and stored at 4°C until analysis. The roots were then processed as below for mycorrhization rate determination. A comparison test was applied to define groups based on species frequencies of mycorrhization and intensities of mycorrhization rates.
Root thinning
Roots were first treated with 10% KOH in a water bath (at 100°C) for 45 min for herbaceous plants and 60 min for trees in order to empty their cellular contents (Phillips and Hayman, 1970). This treatment was repeated 30 min later, and residual KOH was removed from the roots by a series of rinses with tap water. The roots were then placed in bleach diluted 8-fold for 10 min to complete the clearing and rinsed again several times with tap water. They were then placed in 5% hydrochloric acid for 10 min to neutralize the bleach.
Root staining
The thinned roots were then stained by dipping in 0.05% trypan blue in a solution with an equal volume of lactic acid, glycerol, and distilled water (Phillips and Hayman, 1970). The mixture was then placed in a water bath at 100°C for 60 min. After this staining step, the excess dye was removed by rinsing with sterilized demineralized water, and the roots were stored at 4°C in the last wash water until they were observed.
Observation of the roots
For each sample, root fragments of about 1 cm were placed between the slide and the coverslip, crushed in glycerol, and observed under a microscope. The observation of hyphae, vesicles, or arbuscules in the roots was used to estimate the levels of colonization (endomycorrhization) of the root samples. The estimation of root colonization by AMF was done using the method of Trouvelot et al. (1986). The latter established a scoring system to estimate the proportion of root cortex colonized by AMF based on six classes and the presence of arbuscules (in the mycorrhizal part) based on four classes. These different classes are described in the diagram below.
Estimation of root mycorrhization
The frequency and intensity of mycorrhization were calculated according to the following formulas:
Frequency of mycorrhization of the root system noted F % = (number of mycorrhizal fragments)
F% = (number of mycorrhized fragments/total number of observed fragments) × 100
Mycorrhization intensity of the system noted I% = (95n5+)
I% = (95n5 + 70n4 + 30n3 + 5n2 + n1)/total number of fragments observed
Where n5 = number of fragments scored 5, n4 = number of fragments scored 4, n3 = number of fragments scored 3, n2 = number of fragments scored 2, and n1 = number of fragments scored 1.
Most probable number of AMF community
The capacity of soils to support mycorrhization from propagules (spores, infected root fragments, and mycelium) was estimated by the MPN method described by Plenchette et al. (1989). Maize (Zea mays), which is a highly mycotrophic species (Wang et al., 2008; Abdelilah et al., 2017), was used as an endophytic plant. For each sample, sieved dry soil (<2 mm) was autoclaved at 140°C for 45 min. A series of 1/10th dilutions from 10−1 to 10−6 was performed with five replicates per dilution level. Dilutions were made by homogenizing each sample with different proportions of non-sterile and sterilized soil. Maize seeds were disinfected in bleach (90%) diluted by half for 3 min and then in 70% ethanol for 3 min. They were then rinsed several times with sterile demineralized water and soaked in sterile demineralized water for 3 h. After soaking, they were sown in pots at a rate of two seeds per pot. After germination, the seedlings were removed to one plant and watered as needed for 6 weeks. After 6 weeks of cultivation, the maize plants were harvested and the roots carefully rinsed with sterilized demineralized water and kept in cold storage (4°C) in 70% alcohol. The harvested roots were then processed as described above, and the number of propagules capable of generating mycorrhizae per gram of soil was deduced from the reading (Sieverding, 1991) with a probability of 95% according to the table of Cochran (1950).
Symbiotic root colonization by AMF community in soil collected beneath the trees and outside of canopies
For experimental determination of mycorrhization rate, maize seeds were used for germination of cultivation. They were then sown in the soils. For each soil sampled, a replicate of five plants was applied. After 8 weeks of cultivation, the plants were harvested and the root systems were used to estimate mycorrhization rates. The frequency (F) of colonization was determined by noting the presence or absence of propagules (hyphae, vesicles, or arbuscules) in each root fragment. Each observation was scored + (presence of propagules) or − (absence of propagules).
Soil mycorrhizal infection potential in the presence of organic matter
A randomized complete block design using bulk soil samples was conducted in a nursery using V. seyal and P. chilensis seedlings cultivated in black polythene bags (8 × 13 cm with 200 ml capacity) filled with five substrate types: natural soil 100% (substrate A), soil (90%) mixed with leaf tree plants (LTPs) as organic matter at 10% (substrate B), soil (80%) mixed with LTP at 20% (substrate C), soil (70%) mixed with LTP at 30% (substrate D), and soil (50%) mixed with LTP at 50% (substrate E). These mixtures were composted for 1 month and then the nursery of V. seyal was set on a substrate of V. seyal organic matter and the nursery of P. chilensis was set on a substrate containing P. chilensis organic matter. Replicates of five were made for each level of organic matter and for all soils. Seeds of V. seyal and P. chilensis were then treated and sown in pots. The seedlings were grown for 3 months in a greenhouse. At the end of the 3 months of cultivation, mycorrhization rates were assessed as described above.
Statistical analysis
Phytosociological data were analyzed using the phytosociological tool presence–absence, association index, and abundance–dominance indexes and by calculating Jacquard’s coefficients similarity and Jacquard’s association indexes. Other data were analyzed with the RStudio application using Kruskal and ANOVA tests.
Results
Phytosociological survey
Phytosociological and similarity analyses and species associations
The results of floristic and ecological analyses of herbaceous species are shown in Table 2 (presence–absence), Table 3 (association index), and Table 4 (abundance–dominance indexes). The number of species found in all surveys is 29. Five species were found beneath the trees and were not found outside the canopies. The number of common species between surveys under canopies of V. seyal and P. chilensis is 16. The number of species found only beneath the trees of V. seyal surveys is 9. The number of species found only beneath the trees of P. chilensis surveys is 3. Jacquard’s coefficient of similarity CSJ between the V. seyal and P. chilensis surveys is equal to: = 0.57.
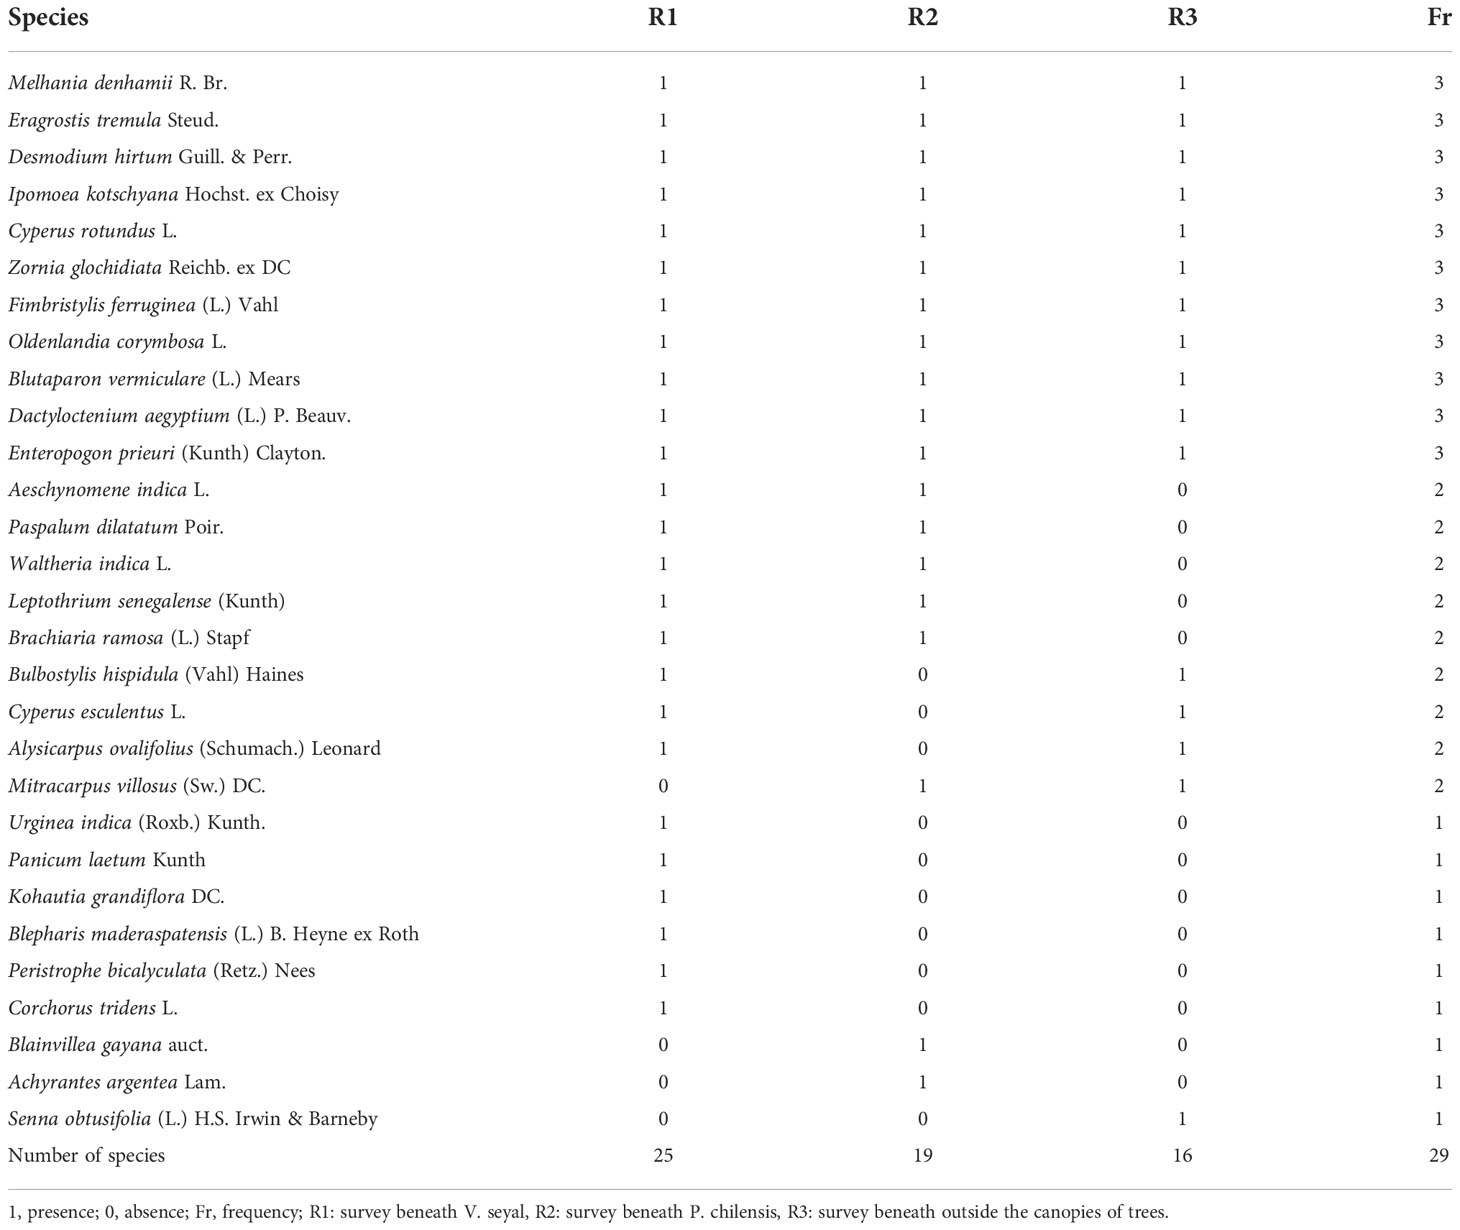
Table 2 The presence–absence of herbaceous species beneath Vachellia seyal and Prosopis chilensis, and outside their canopies.
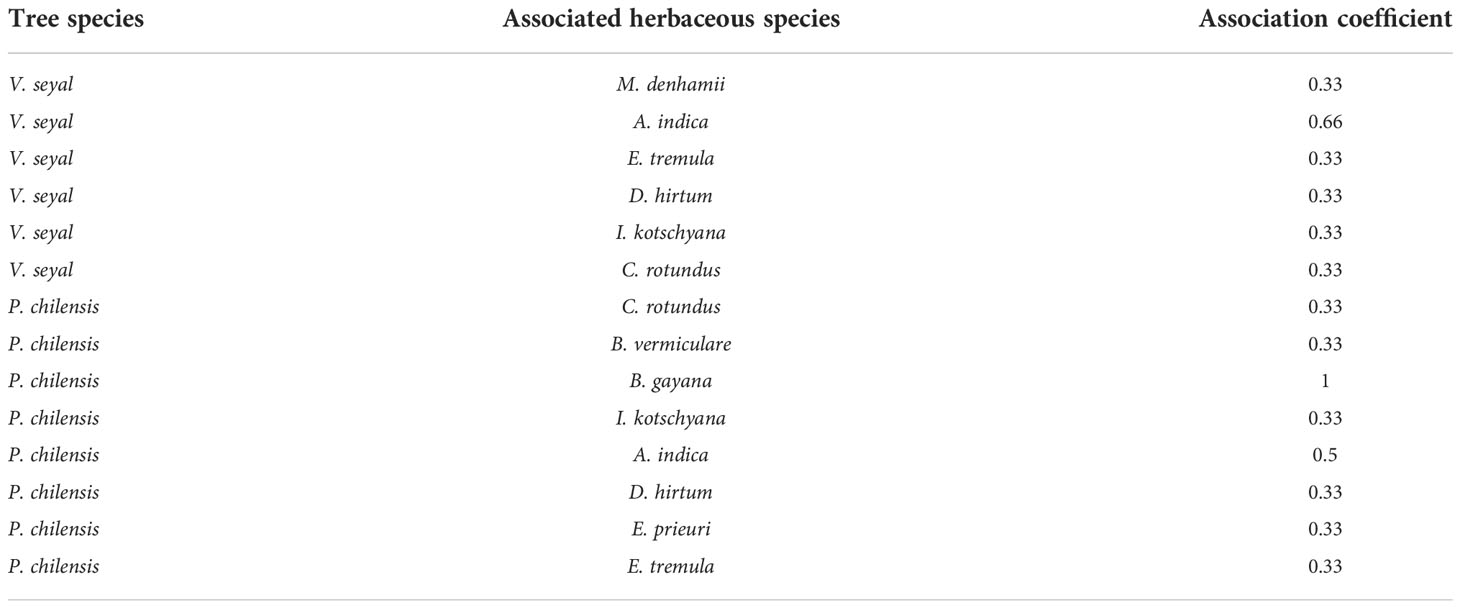
Table 3 Association coefficient of Vachellia seyal and of Prosopis chilensis vs. herbaceous species.
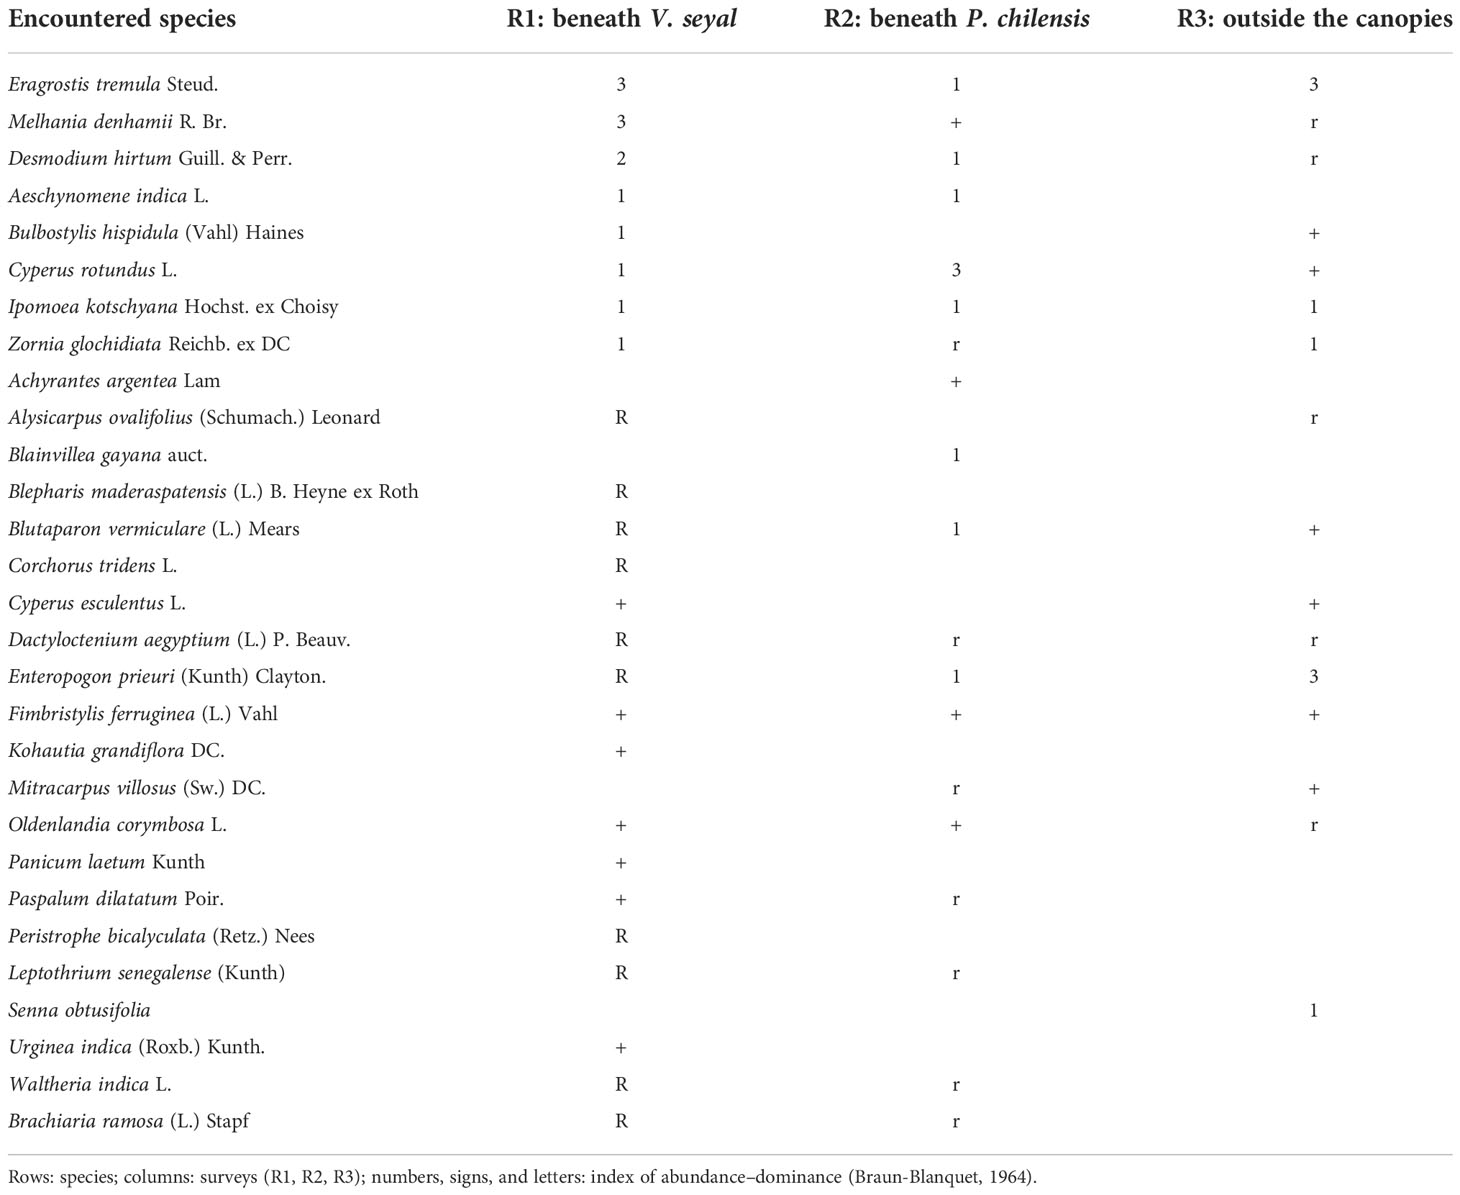
Table 4 Crude floristic table beneath Vachellia seyal and Prosopis chilensis trees and outside their canopies.
The number of common species between surveys beneath the trees of V. seyal and outside tree canopies is 14. The number of species found only beneath the trees of V. seyal surveys is 11. The number of species found only outside the canopies is 2. Jacquard’s similarity coefficient CSJ between surveys beneath the trees of V. seyal and outside the canopies is equal to: = 0.52.
The number of common species between the surveys beneath the trees of P. chilensis and outside the canopies is equal to 12. The number of species found only beneath the trees of P. chilensis surveys is 7. The number of species found only out of the tree canopies is 4. Jacquard’s similarity coefficient CSJ between beneath the trees of P. chilensis and outside of tree canopies surveys is as follows: = 0.52.
The coefficients of association (CAs) calculated (Table 3) between V. seyal and the five herbaceous species that have the highest cover beneath the trees of V. seyal are CA(V.seyal_vs_M.denhamii) = 0.33, CA(V.seyal_vs_E.tremula) = 0.33, CA(V.seyal_vs_D.hirtum) = 0.33, CA(V.seyal_vs_I.kotschyana) = 0.33, and CA(V.seyal_vs_C.rotundus) = 0.33.
The calculated CAs (Table 3) between P. chilensis and the eight herbaceous species that have the highest cover beneath the trees of P. chilensis are CA(P.chilensis_vs_C.rotundus) = 0.33, CA(P.chilensis_vs_B.vermiculare) = 0.33, CA(P.chilensis_vs_B.gayana) = 1, CA(P.chilensis_vs_I.kotschyana) = 0.33, CA(P. chilensis_vs_A.indica) = 0.5, CA(P.chilensis_vs_D.hirtum) = 0.33, CA(P.chilensis_vs_E.prieuri) = 0.33, and CA(P.chilensis_vs_E.tremula) = 0.33.
The abundance–dominance coefficients of the herbaceous species are shown in Table 4. Beneath the trees of V. seyal, Melhania denhamii R. Br. and Eragrostis tremula Steud. have the highest values (3) of AD code. After these two species, Desmodium hirtum Guill. & Perr. has an AD code of 2. The species Bulbostylis hispidula (Vahl) Haines, Cyperus rotundus L., Ipomoea kotschyana Hochst. ex Choisy, Aeschynomene indica L., and Zornia glochidiata Reichb. ex DC have an AD code of 1. The other species represented beneath the trees of V. seyal have AD codes of + or r. Beneath the trees of P. chilensis, only C. rotundus has an AD code of 3. The species E. tremula, D. hirtum, I. kotschyana, Blainvillea gayana, Blutaparon vermiculare, and Enteropogon prieuri have AD codes of 1. The other species found beneath the trees of P. chilensis have AD codes of + or r. Outside the canopies of the trees, only E. tremula has an AD code of 3. The species I. kotschyana, Z. glochidiata, and Senna obtusifolia have AD codes of 1. The other species found outside the canopies of the trees have AD codes of + or r.
In Table 4, the coefficients 0 and 1 indicate if species were found (1 = presence) or not (0 = absence), respectively. The values 3, 2, and 1 in the last column (Fr) indicate how many times the corresponding species were found in the surveys (absolute species frequencies). The values in the last row indicate the number of species per survey, and the last number in this row represents the total number of species recorded (observed species richness). The average number of species per survey is 20 (total number of species for all surveys divided by the number of surveys) with a variance of 1.45 (total number of species 29 divided by the average number of species 20). The analysis in Tables 2 and 4 shows that the species richness (or floristic richness) varies between 16 and 25 and there are 29 species for all the surveys. The average species richness is 20 with a variance of 1.45. It is higher beneath the trees than outside the crowns. Under the trees, it is higher beneath V. seyal than beneath P. chilensis.
The herbaceous species M. denhamii, E. tremula, D. hirtum, I. kotschyana, C. rotundus, Z. glochidiata, Fimbristylis ferruginea, Oldenlandia corymbosa, B. vermiculare, Dactyloctenium aegyptium, and E. prieuri are associated with V. seyal, P. chilensis, and the area outside the canopies of the trees. These are the most frequent species when considering all the surveys with a relative frequency of 3. They are the common species. Among them, E. tremula has the highest abundance–dominance coefficient (AD code) with a value of 3 both beneath the trees of V. seyal and outside the canopies of the trees, corresponding to a coverage of 25% to 50% of the survey area. In contrast, its individuals are scattered with an AD code of 1 beneath the trees of P. chilensis. Melhania denhamii has an AD code value of 3 beneath the trees of V. seyal, but beneath the trees of P. chilensis, it has few individuals with low cover and rare individuals outside the tree canopies. Enteropogon prieuri has an AD code of 3 outside the canopies of the trees. In contrast, its individuals are rare beneath the trees of V. seyal and scattered beneath the trees of P. chilensis. Desmodium hirtum has an AD code of 2 corresponding to a cover of 25% to 50% of the surface beneath the trees of V. seyal. In contrast, beneath the trees of P. chilensis and outside the canopies of the trees, its individuals are respectively scattered and rare. For C. rotundus, it presents an AD code of 3 (25% to 50% cover) beneath the trees of P. chilensis, but its individuals are scattered with a low cover beneath the trees of V. seyal and are rare outside the tree canopy. The other species are globally present with scattered and rare individuals beneath the trees and outside the canopies of trees.
The herbaceous species A. indica, Paspalum dilatatum, Waltheria indica, Leptothrium senegalense, and Brachiaria ramosa are related to V. seyal and P. chilensis. They have a relative frequency of 2 and have not been found outside the tree canopies. They belong to the rare and infrequent species. Their individuals are scattered and rare with AD codes of 1, +, and r. The other species below have their individuals either scattered or rare depending on the case. The herbaceous species B. hispidula, Cyperus esculentus, and Alysicarpus ovalifolius are associated with V. seyal and the area outside the tree canopy with a relative frequency of 2. They belong to the infrequent rare species. They have not been found beneath the trees of P. chilensis. Their individuals are scattered and rare with low cover. The species Mitracarpus villosus is associated with P. chilensis and the area outside the tree canopy with a relative frequency of 2. It is a rare and infrequent species. It presents a few individuals with a low cover outside the canopy and rare individuals beneath the trees of P. chilensis. It was not found beneath the trees of V. seyal. The herbs Urginea indica, Panicum laetum, Kohautia grandiflora, Blepharis maderaspatensis, Peristrophe bicalyculata, and Corchorus tridens are only associated with V. seyal with a relative frequency of 1. The first three mentioned have few individuals with very low cover and the last three have rare individuals. They have not been found beneath the trees of P. chilensis and outside the canopies of the trees. They are among the unique species encountered only once. The same is true for B. gayana and Achyrantes argentea which are related to P. chilensis with a relative frequency of 1, with respectively scattered and few individuals with very low cover and which were not encountered beneath the trees of V. seyal and in the area outside the tree canopies. Senna obtusifolia is related to the area outside the canopies with a relative frequency of 1 and is one of the single species with scattered individuals. It was not found beneath the tree species.
Structure and coverage percentages of the herbaceous flora
Structure of the herbaceous flora beneath Vachellia seyal
The structure of the herbaceous flora beneath V. seyal is represented in Table 5. Beneath the canopies of the trees of V. seyal, dicotyledons are represented by six families, 13 genera, and 13 species. Monocotyledons are represented by three families, 11 genera, and 12 species. The proportions of families, genera, and species in these two classes are 66.67% vs. 33.33%, 54.17% vs. 45.83%, and 52% vs. 48%, respectively. Thus, a total of nine families, 23 genera, and 25 species were recorded. Twenty-five herbaceous species are found beneath the trees of V. seyal. In the area up to a diameter of about 2.2 m from the trunk, M. denhamii has a greater number of individuals, and its sociability coefficient reaches 5. The density of its individuals started to decrease, and individuals of E. tremula became more abundant from 2.2 to 2.7 m at the periphery of the survey area. In this part area the trees of V. seyal, the sociability coefficient of M. denhamii decreases to 3. In the area outside the V. seyal canopies, the sociability coefficient of M. denhamii comes down to 1. In the area beneath the trees of the V. seyal canopy close to the periphery, the sociability coefficient of E. tremula is 2. Beyond this and in the uncovered area, the sociability coefficient of E. tremula is 3, and its individuals occupy most of the herbaceous cover, with individuals forming dense groups in some places. After M. denhamii, D. hirtum had more individuals in the vicinity of the V. seyal trunk with a sociability coefficient of 3. The other species recorded beneath the trees of V. seyal had a sociability coefficient of 1.
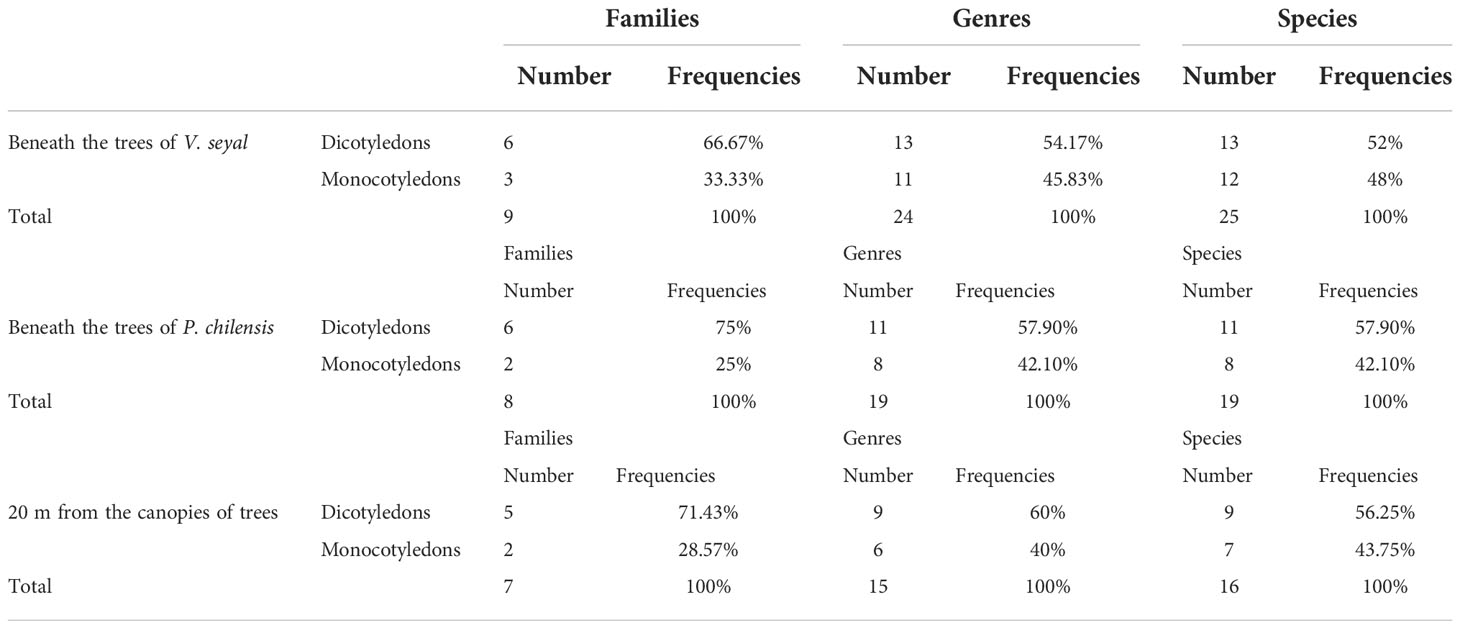
Table 5 Structure of the herbaceous flora.
Structure of the flora beneath Prosopis chilensis
The structure of the herbaceous flora beneath P. chilensis is represented in Table 5. Beneath the trees of P. chilensis, dicotyledons are represented by six families, 11 genera, and 11 species. Monocotyledons are represented by two families, eight genera, and eight species. The proportions in terms of families, genera, and species between the two classes are 75% vs. 25%, 57.90% vs. 42.10%, and 57.90% vs. 42.10%, respectively. Thus, eight families, 19 genera, and 19 species were recorded. Nineteen (19) herbaceous species were found beneath the trees of P. chilensis. The area around the trunk up to about 1.5 to 2 m is sparse. The few individuals present are widely spaced. In the area toward the periphery, the density of individuals increases moderately and remains low with a predominance of C. rotundus which is the species with the most individuals. Its sociability coefficient reaches 3. The sociability coefficient of the other species present in a very sparse manner is 1. The area beneath the trees of P. chilensis has far fewer individuals compared with the area beneath the trees of V. seyal.
Structure of the flora outside the canopies of the trees
The structure of the herbaceous flora outside the canopies of V. seyal and P. chilensis is represented in Table 5. Outside the canopies of the trees, in the herbaceous flora, dicotyledons are present with five families, nine genera, and nine species. Monocotyledons are represented by two families, six genera, and seven species. The proportions in terms of families, genera, and species between the two classes are 71.43% vs. 28.57%, 60% vs. 40%, and 56.25% vs. 43.75%, respectively. Thus, seven families, 15 genera, and 16 species were recorded. The number of herbaceous species found outside the canopies of the trees is 16. The two most represented species are E. prieuri and E. tremula. Their sociability coefficient is 4. Senna obtusifolia was only found outside the canopies of the trees. The sociability coefficient of the other species is 1.
Coverage percentages of herbaceous flora
The overall herbaceous coverage beneath the trees of V. seyal is estimated to be 95.40% (Table 6). The herbaceous species B. maderaspatensis, C. tridens, P. laetum, P. bicalyculata, and U. indica are found only beneath the trees of V. seyal. The average coverage of herbaceous species beneath the trees of P. chilensis is estimated at 54.41% (Table 7). Cyperus rotundus occupied 58.81% of the herbaceous cover beneath the trees of P. chilensis (32% of the 54.41%). The species A. argentea and B. gayana are recorded only beneath the trees of P. chilensis. The coverage of herbaceous species outside the canopies of the trees is 77.65% (Table 8). The two most represented species outside the canopies of the trees are E. prieuri and E. tremula which occupy 82.42% of the herbaceous coverage.
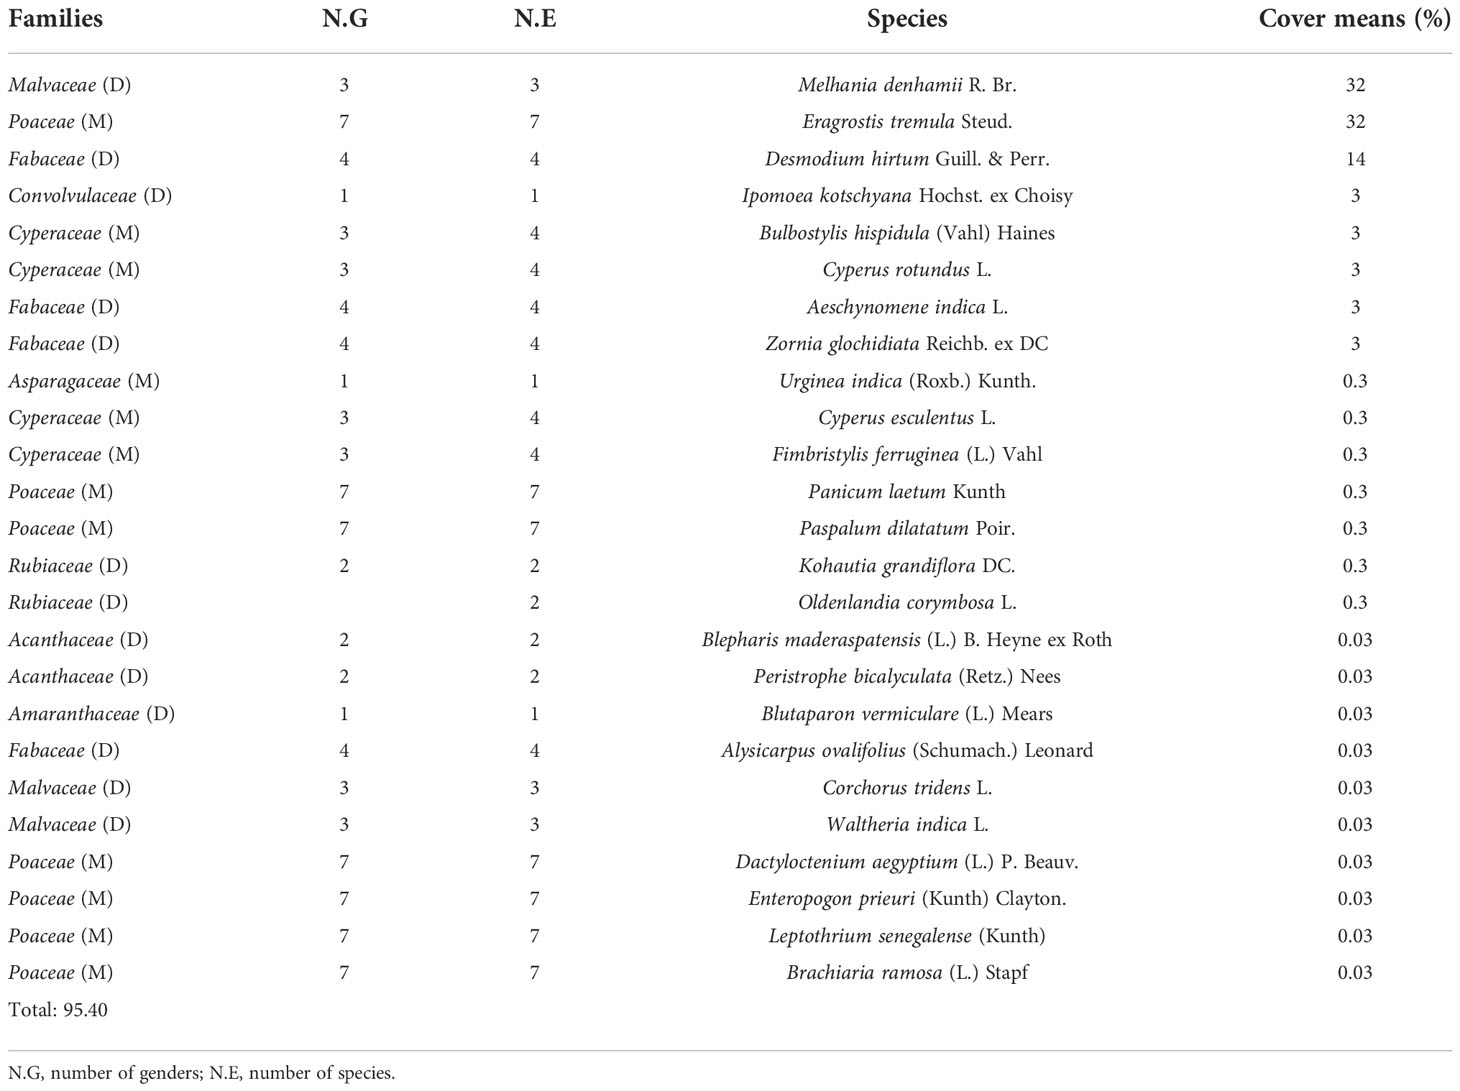
Table 6 Percentages of the coverage of herbaceous species beneath Vachellia seyal.
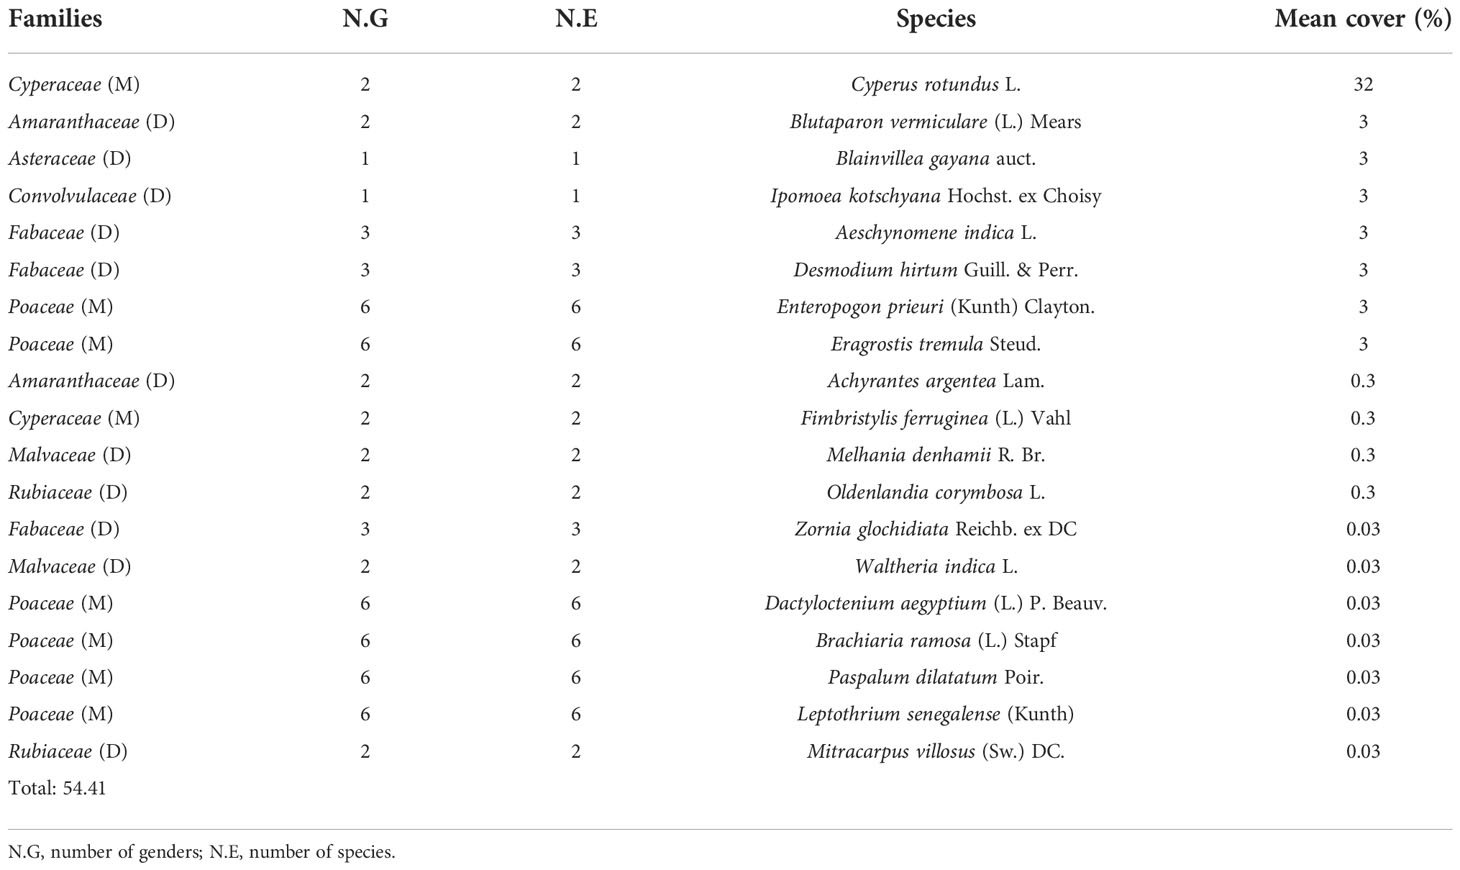
Table 7 Percentages of the coverage of herbaceous species beneath Prosopis chilensis.
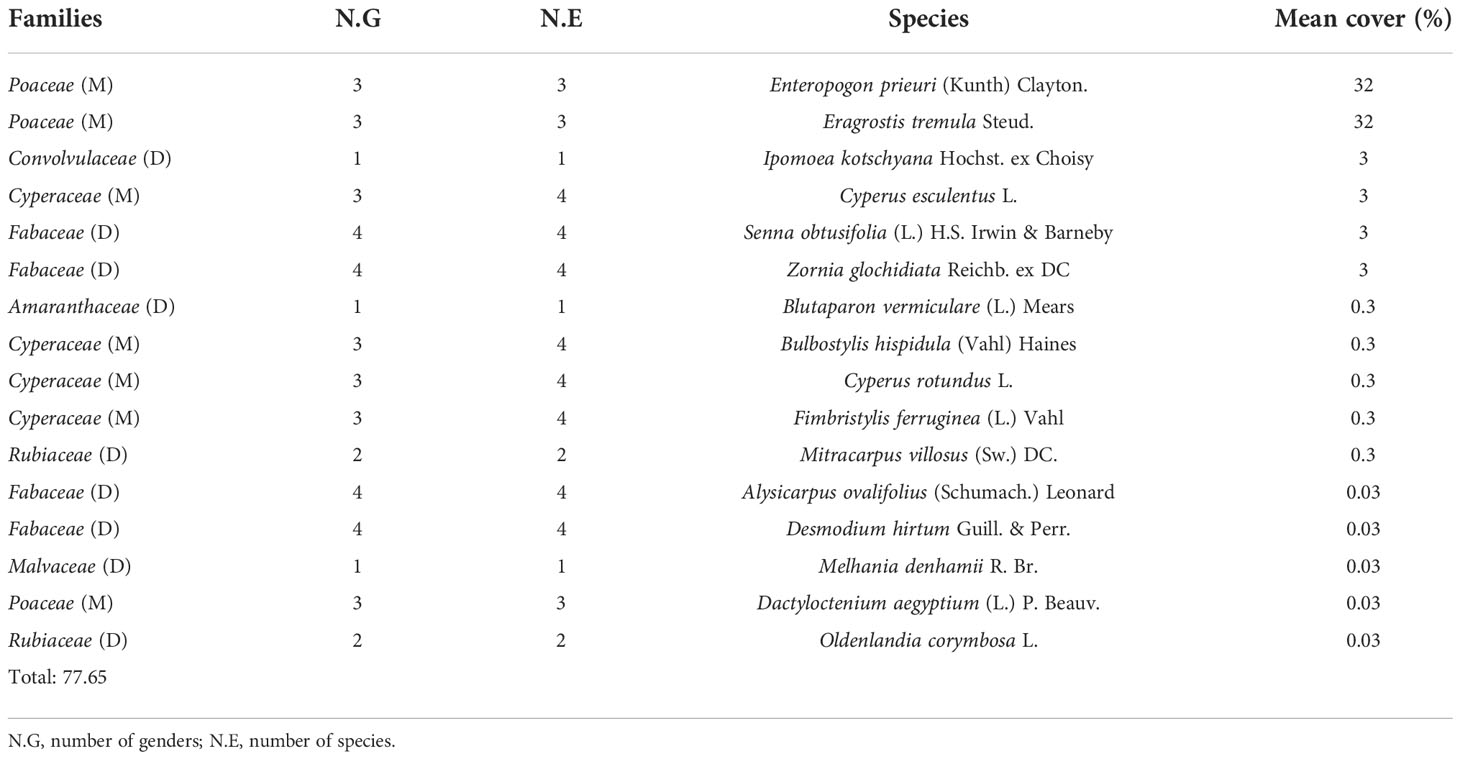
Table 8 Percentages of the coverage of herbaceous species outside the canopies of Vachellia seyal and Prosopis chilensis.
Soil analysis
Water pH and KCl pH
The results of water pH and KCl pH are shown in Figures 1A, B. Soil water pH values do not show significant differences depending on whether the soil is beneath the trees of V. seyal and P. chilensis or is 20 m away from the trunks of trees. However, soil KCl pH varies significantly when comparing soils beneath the trees of V. seyal and P. chilensis and soils 20 m away from the trunks of trees. They are lower in the soils beneath the trees and are also lower for soils beneath the trees of V. seyal than beneath the trees of P. chilensis.
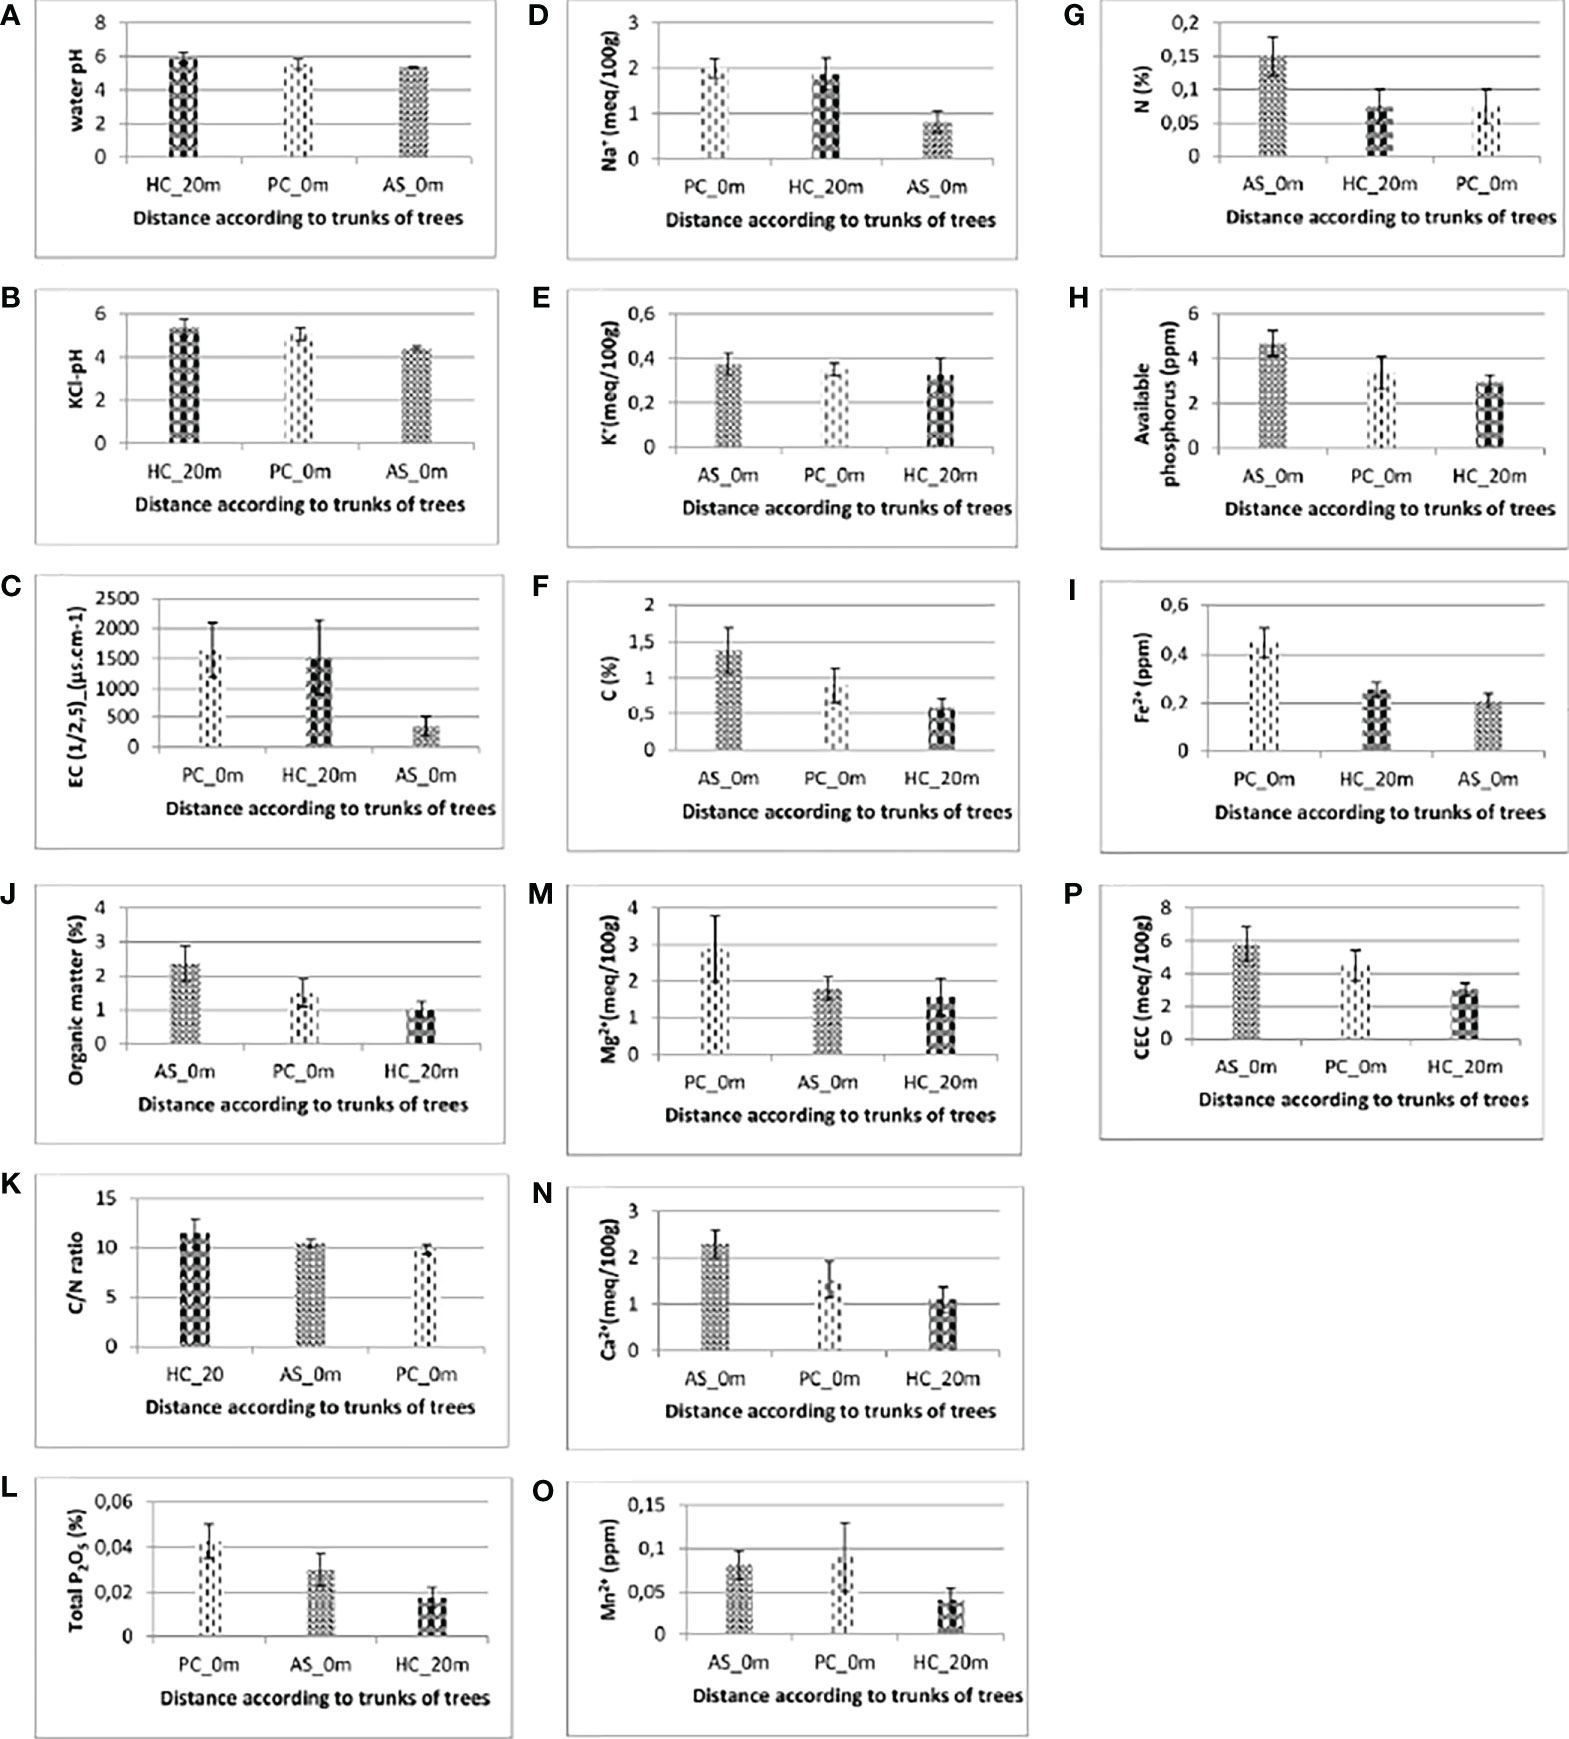
Figure 1 Soil water pH (A), KCl-pH (B), electrical conductivity (C), sodium content (D), potassium content (E), percentages of carbon (F), nitrogen content (G), available phosphorus (H), iron Fe2+ content (I), organic matter content (J), C/N ratio (K), Total P2O5 content (L), magnesium content (M), calcium content (N), manganese content (O) and cation exchange capacity (P) of soils.AS, Vachellia seyal; Pc, Prosopis chilensis; HC, out cover of trees.
Electrical conductivity and soil sodium and potassium contents
The results of the EC and sodium content of the soils are represented, respectively, in panels C and D of Figure 1. The EC values varied significantly in the soil beneath V. seyal compared with the soil beneath P. chilensis and soil at 20 m distance from the trunks of trees. The EC is more than 4.38 times lower in the soils beneath V. seyal than in soils 20 m away from the trunks of trees and 4.72 times lower in the soils beneath the trees of V. seyal compared with the soils beneath the trees of P. chilensis. The values of sodium content varied significantly. The average values of sodium (Na+ meq/100 g) in the soils are 1.875 at 20 m distance from the trunks of trees, 2 at 0 m beneath the trees of P. chilensis, and 0.825 at 0 m under the trees of V. seyal. Thus, the amount of Na+ is higher in soils beneath P. chilensis and in soils 20 m away from the canopies of the trees. The sodium content is more than two times lower in soils under the trees of V. seyal compared with soils under the trees of P. chilensis and to soils 20 m distance from the trunks of trees. The EC and the Na+ content have a strong Pearson correlation link with an index of 0.84 (Figure 2).
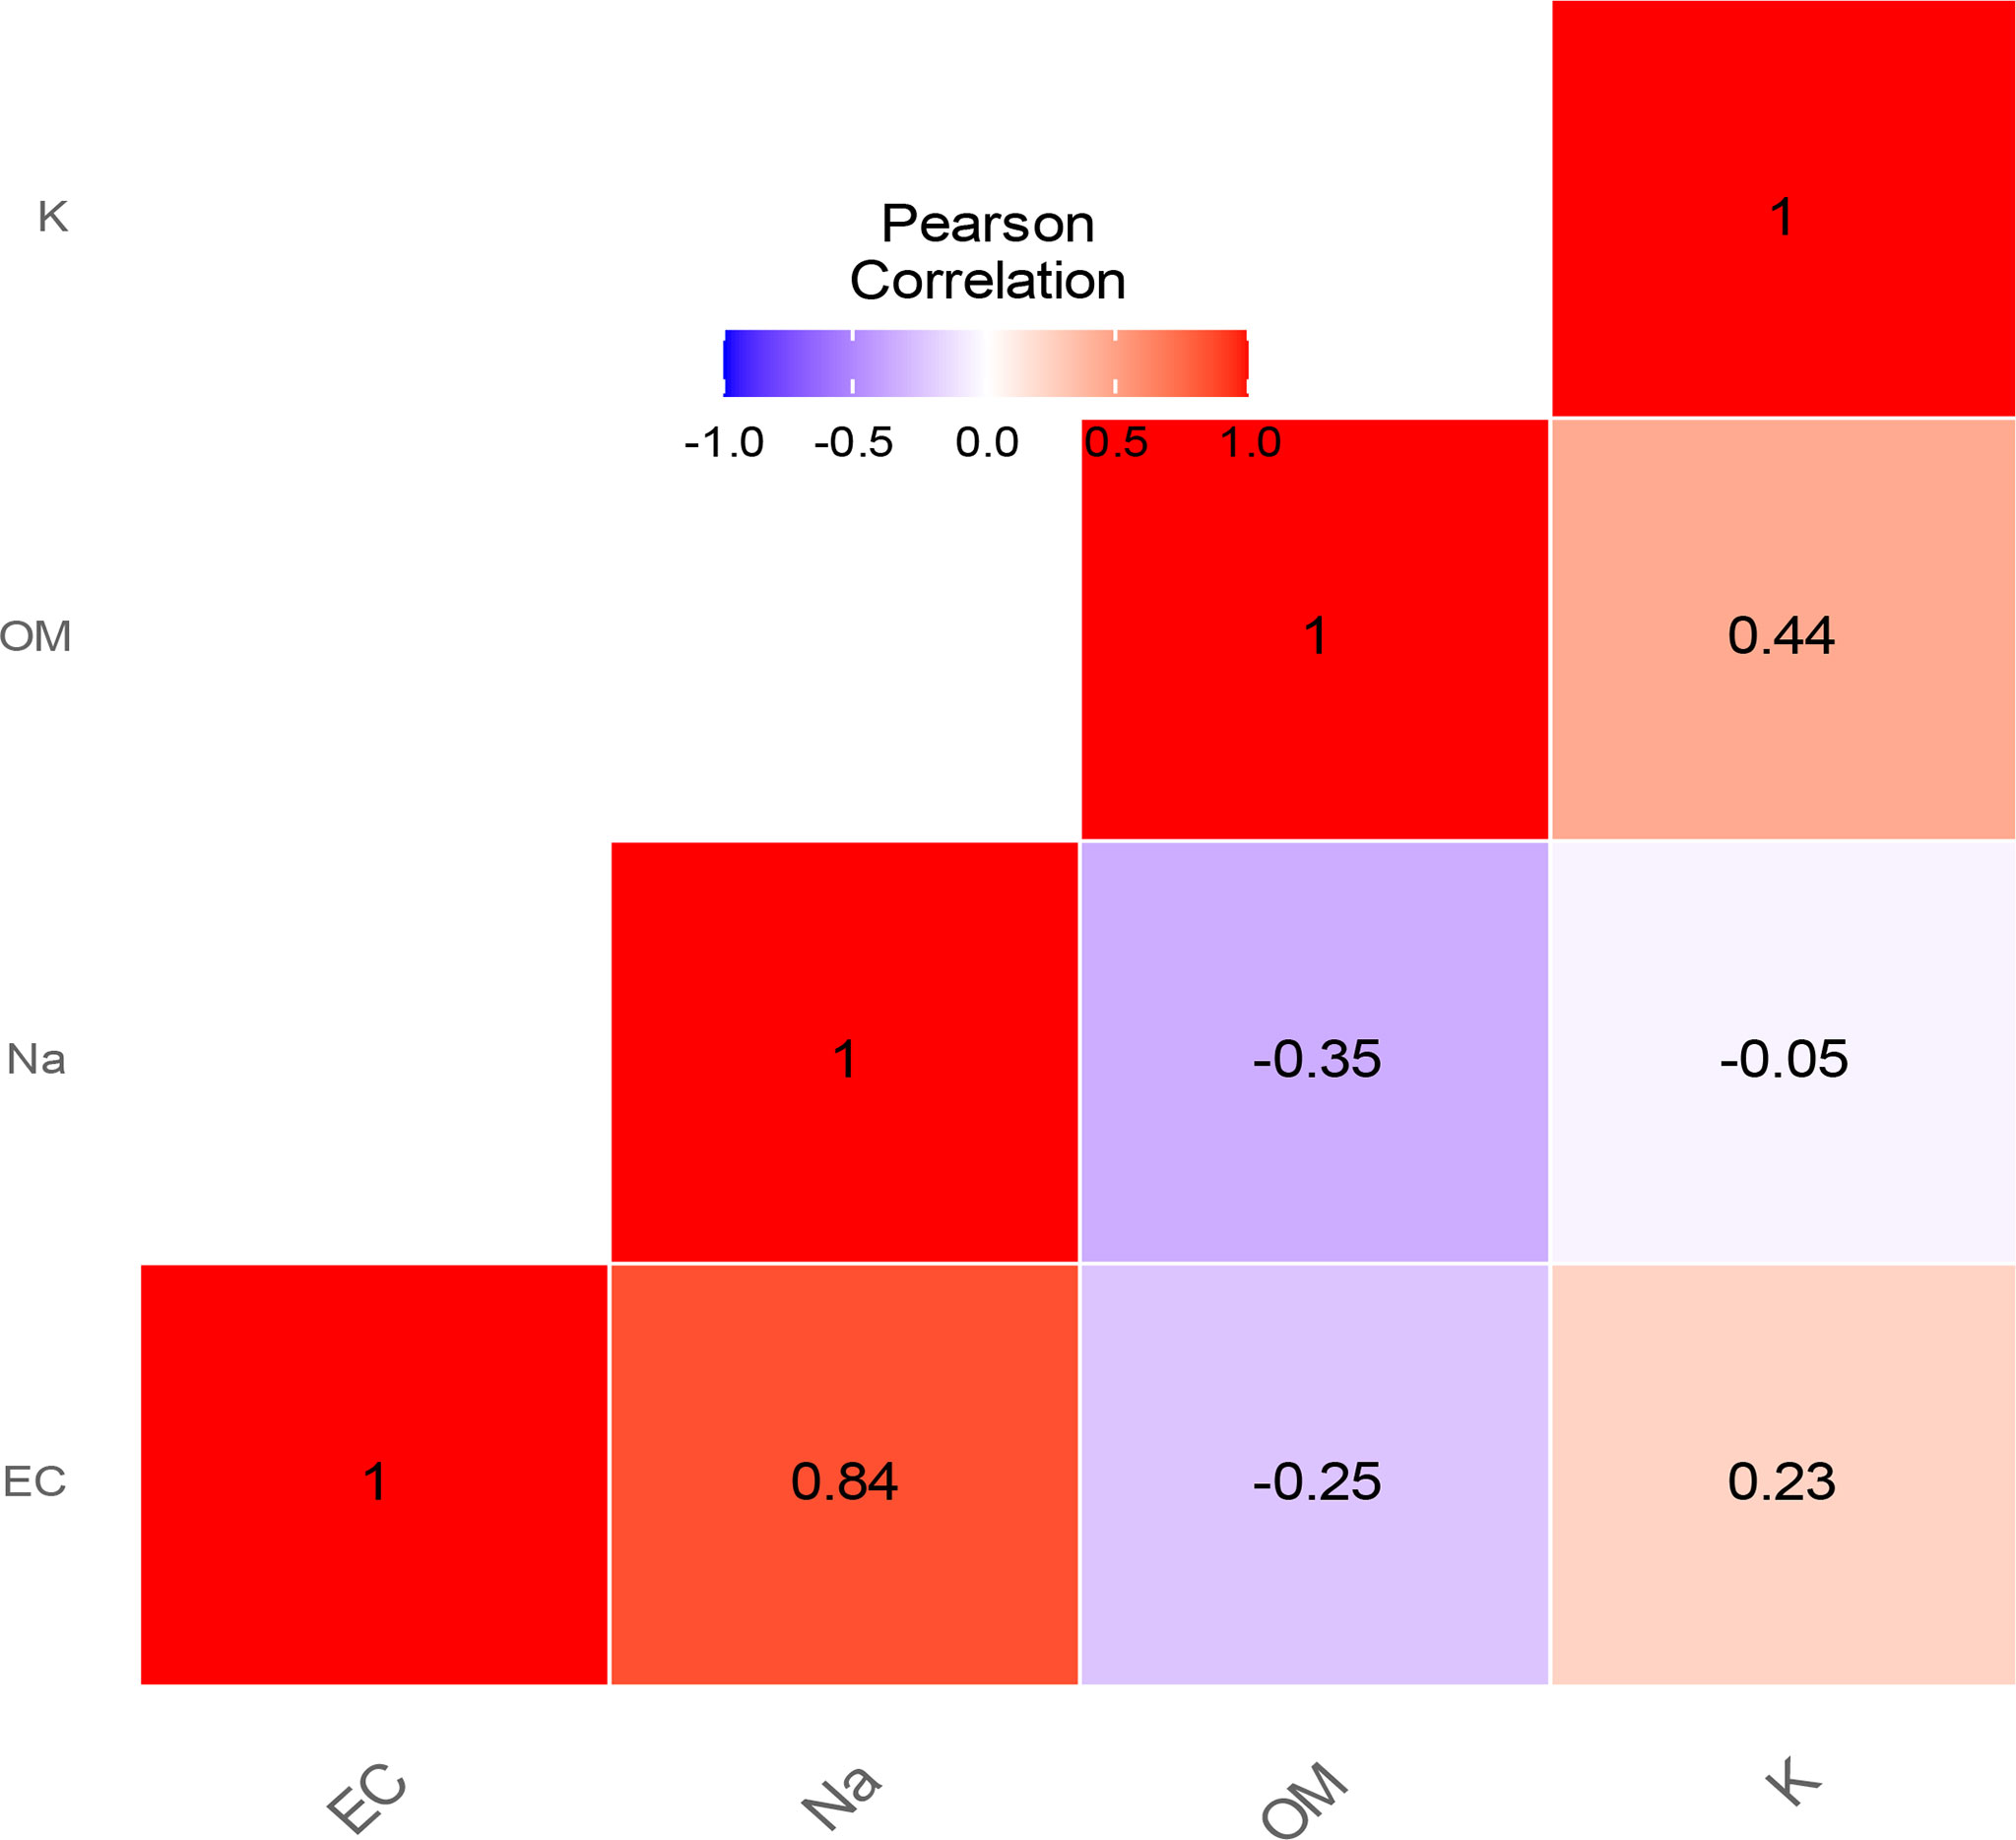
Figure 2 Pearson correlation between EC, Na, OM, and K.
Fertility parameters
The results of fertility parameter measurements are presented in Figure 1. The results of the measurements of soil potassium (K+) content are shown in Figure 1E. Statistical analysis (Kruskal, pV = 0.829 > 0.05) shows that the amount of K+ does not vary significantly in soils depending on the tree species and/or the distance to the trunks of the trees. In soils, the percentages of carbon (Figure 1F) and nitrogen (Figure 1G) contents and the amounts of available phosphorus (Figure 1H) and iron (Figure 1I) varied significantly depending on the distance between the soil sampling site and the trunks of trees and also depending on species (V. seyal or P. chilensis). The quantities of carbon are higher in soils at 0 m under the trees than in soils 20 m away from the trunks of trees. They are higher in soils beneath the trees of V. seyal than in soils beneath the trees of P. chilensis. The average percentage values of carbon are 0.6 at 20 m distance from the trunks of trees, 0.9 at 0 m beneath the trees of P. chilensis, and 1.375 at 0 m in soils beneath the trees of V. seyal. The percentage values of nitrogen measured are twice higher (0.15%) for soils at 0 m beneath the trees of V. seyal compared with soils at 0 m beneath the trees of P. chilensis (0.075%) and soils 20 m away from the trees (0.075%). The amounts of available phosphorus in the soils are higher in soils beneath the trees than in soils 20 m outside the canopies of the trees. They are higher in soils beneath V. seyal than in soils beneath the trees of P. chilensis and are also 1.5 times higher in soils beneath the trees of V. seyal than at 20 m distance from the canopies of the trees. Mean values for iron (Fe2+) in soils are 0.25625 20 m from the trunks of trees, 0.44725 at 0 m beneath the trees of P. chilensis, and 0.20725 at 0 m beneath V. seyal. They are significantly higher in soils beneath P. chilensis than in soils at 20 m distance from the trunks and in soils beneath V. seyal.
The results of OM measurements are shown in Figure 1J. Statistical analysis (Kruskal, pV = 0.19 > 0.05) shows that OM values in soils do not vary significantly according to treatment (species and/or distance). Mean percent values of OM are 1.025 in soils 20 m away from the trunks of trees, 1.5 in soils at 0 m beneath P. chilensis, and 2.35 in soils at 0 m beneath V. seyal. They are higher in soils beneath the trees than in soils outside the canopies 20 m away from the trees, and they are higher in soils beneath V. seyal trees than in soils beneath P. chilensis trees. The OM values in soils beneath V. seyal are more than twice higher compared with soils 20 m from the trunks of trees.
The results of the C/N ratio measurements are shown in Figure 1K. C/N values do not vary significantly (ANOVA, pV = 0.431 > 0.05). The mean values are 11.5 in soils 20 m from the trunks of trees, 9.825 in soils at 0 m beneath P. chilensis, and 10.475 in soils at 0 m beneath V. seyal.
The results of measurements of total phosphorus (total P2O5) percentages in soils are shown in Figure 1L. Statistical analysis (ANOVA, pV = 0.0699 > 0.05) shows that the percentage of total phosphorus in soils does not vary significantly according to species factor. The mean values of total phosphorus percentages in soils are 0.0175 20 m from the trunks of trees, 0.0425 at 0 m beneath P. chilensis, and 0.03 at 0 m beneath V. seyal. They are higher in soils beneath the trees than in soils 20 m outside the canopies of the trees. They are higher in soils beneath P. chilensis trees than in soils beneath V. seyal trees. They are almost 2.5 times higher in soils beneath P. chilensis than in soils outside the canopies of the trees.
The results of soil magnesium (Mg2+) content measurements are shown in Figure 1M. Statistical analysis (ANOVA, pV = 0.334 > 0.05) shows that quantities of Mg2+ in soils do not vary significantly according to treatment (species and/or distance to the trees). The average values of quantities of Mg2+ in the soils are 1.575 at 20 m distance from the trunks of trees, 2.875 at 0 m beneath P. chilensis, and 1.8 at 0 m beneath V. seyal. They are higher in soils beneath P. chilensis trees and almost equal in soils beneath V. seyal trees and outside the canopies 20 m from the trees.
The results of the measurements of calcium (Ca2+) content in soils are shown in Figure 1N. Statistical analysis (ANOVA, pV = 0.0735 > 0.05) shows that quantities of Ca2+ in soils do not vary significantly according to treatment (species and/or distance to trees). The average values of quantities of Ca2+ in the soils are 1.1 at 20 m from the trunks of trees, 1.525 at 0 m beneath P. chilensis, and 2.3 at 0 m beneath V. seyal. They are higher in soils under the trees than in soils 20 m outside the canopies of the trees. They are higher in soils beneath V. seyal than in soils beneath P. chilensis. They are twice as high in soils beneath V. seyal compared with soils at 20 m outside the canopies of the trees.
The results of the measurements of soil manganese (Mn2+) contents are shown in Figure 1O. Statistical analysis (ANOVA, pV = 0.293 > 0.05) shows that the amounts of Mn2+ in soils do not vary significantly according to treatment (species and/or distance to the trees). However, they are higher in soils under the trees than in the soils 20 m from the trunks of trees. They are slightly higher in soils beneath P. chilensis than in soils beneath V. seyal. The results of the measurements of copper (Cu) and zinc (Zn) in soils are zero and, therefore, have not been plotted.
The results of the CEC measurements in soils are shown in Figure 1P. Statistical analysis (ANOVA, pV = 0.12 > 0.05) shows that the cation exchange capacity in soils does not vary significantly according to treatment (species and/or distance to the trees). The average CEC values in soils are 3 at 20 m distance from the trunks of trees, 4.5 at 0 m beneath P. chilensis, and 5.8 at 0 m beneath V. seyal. They are higher in soils under the trees than in soils 20 m from the trunks of trees. They are higher in soils beneath V. seyal than in soils beneath P. chilensis. They are almost twice as high in soils beneath V. seyal trees compared with soils 20 m from the canopies of the trees.
The correlation indexes (Figure 3) show a strong link between carbon, nitrogen, available phosphorus (P ass), and CEC. Calcium content also shows links with carbon content, nitrogen content, available phosphorus, OM, and CEC.
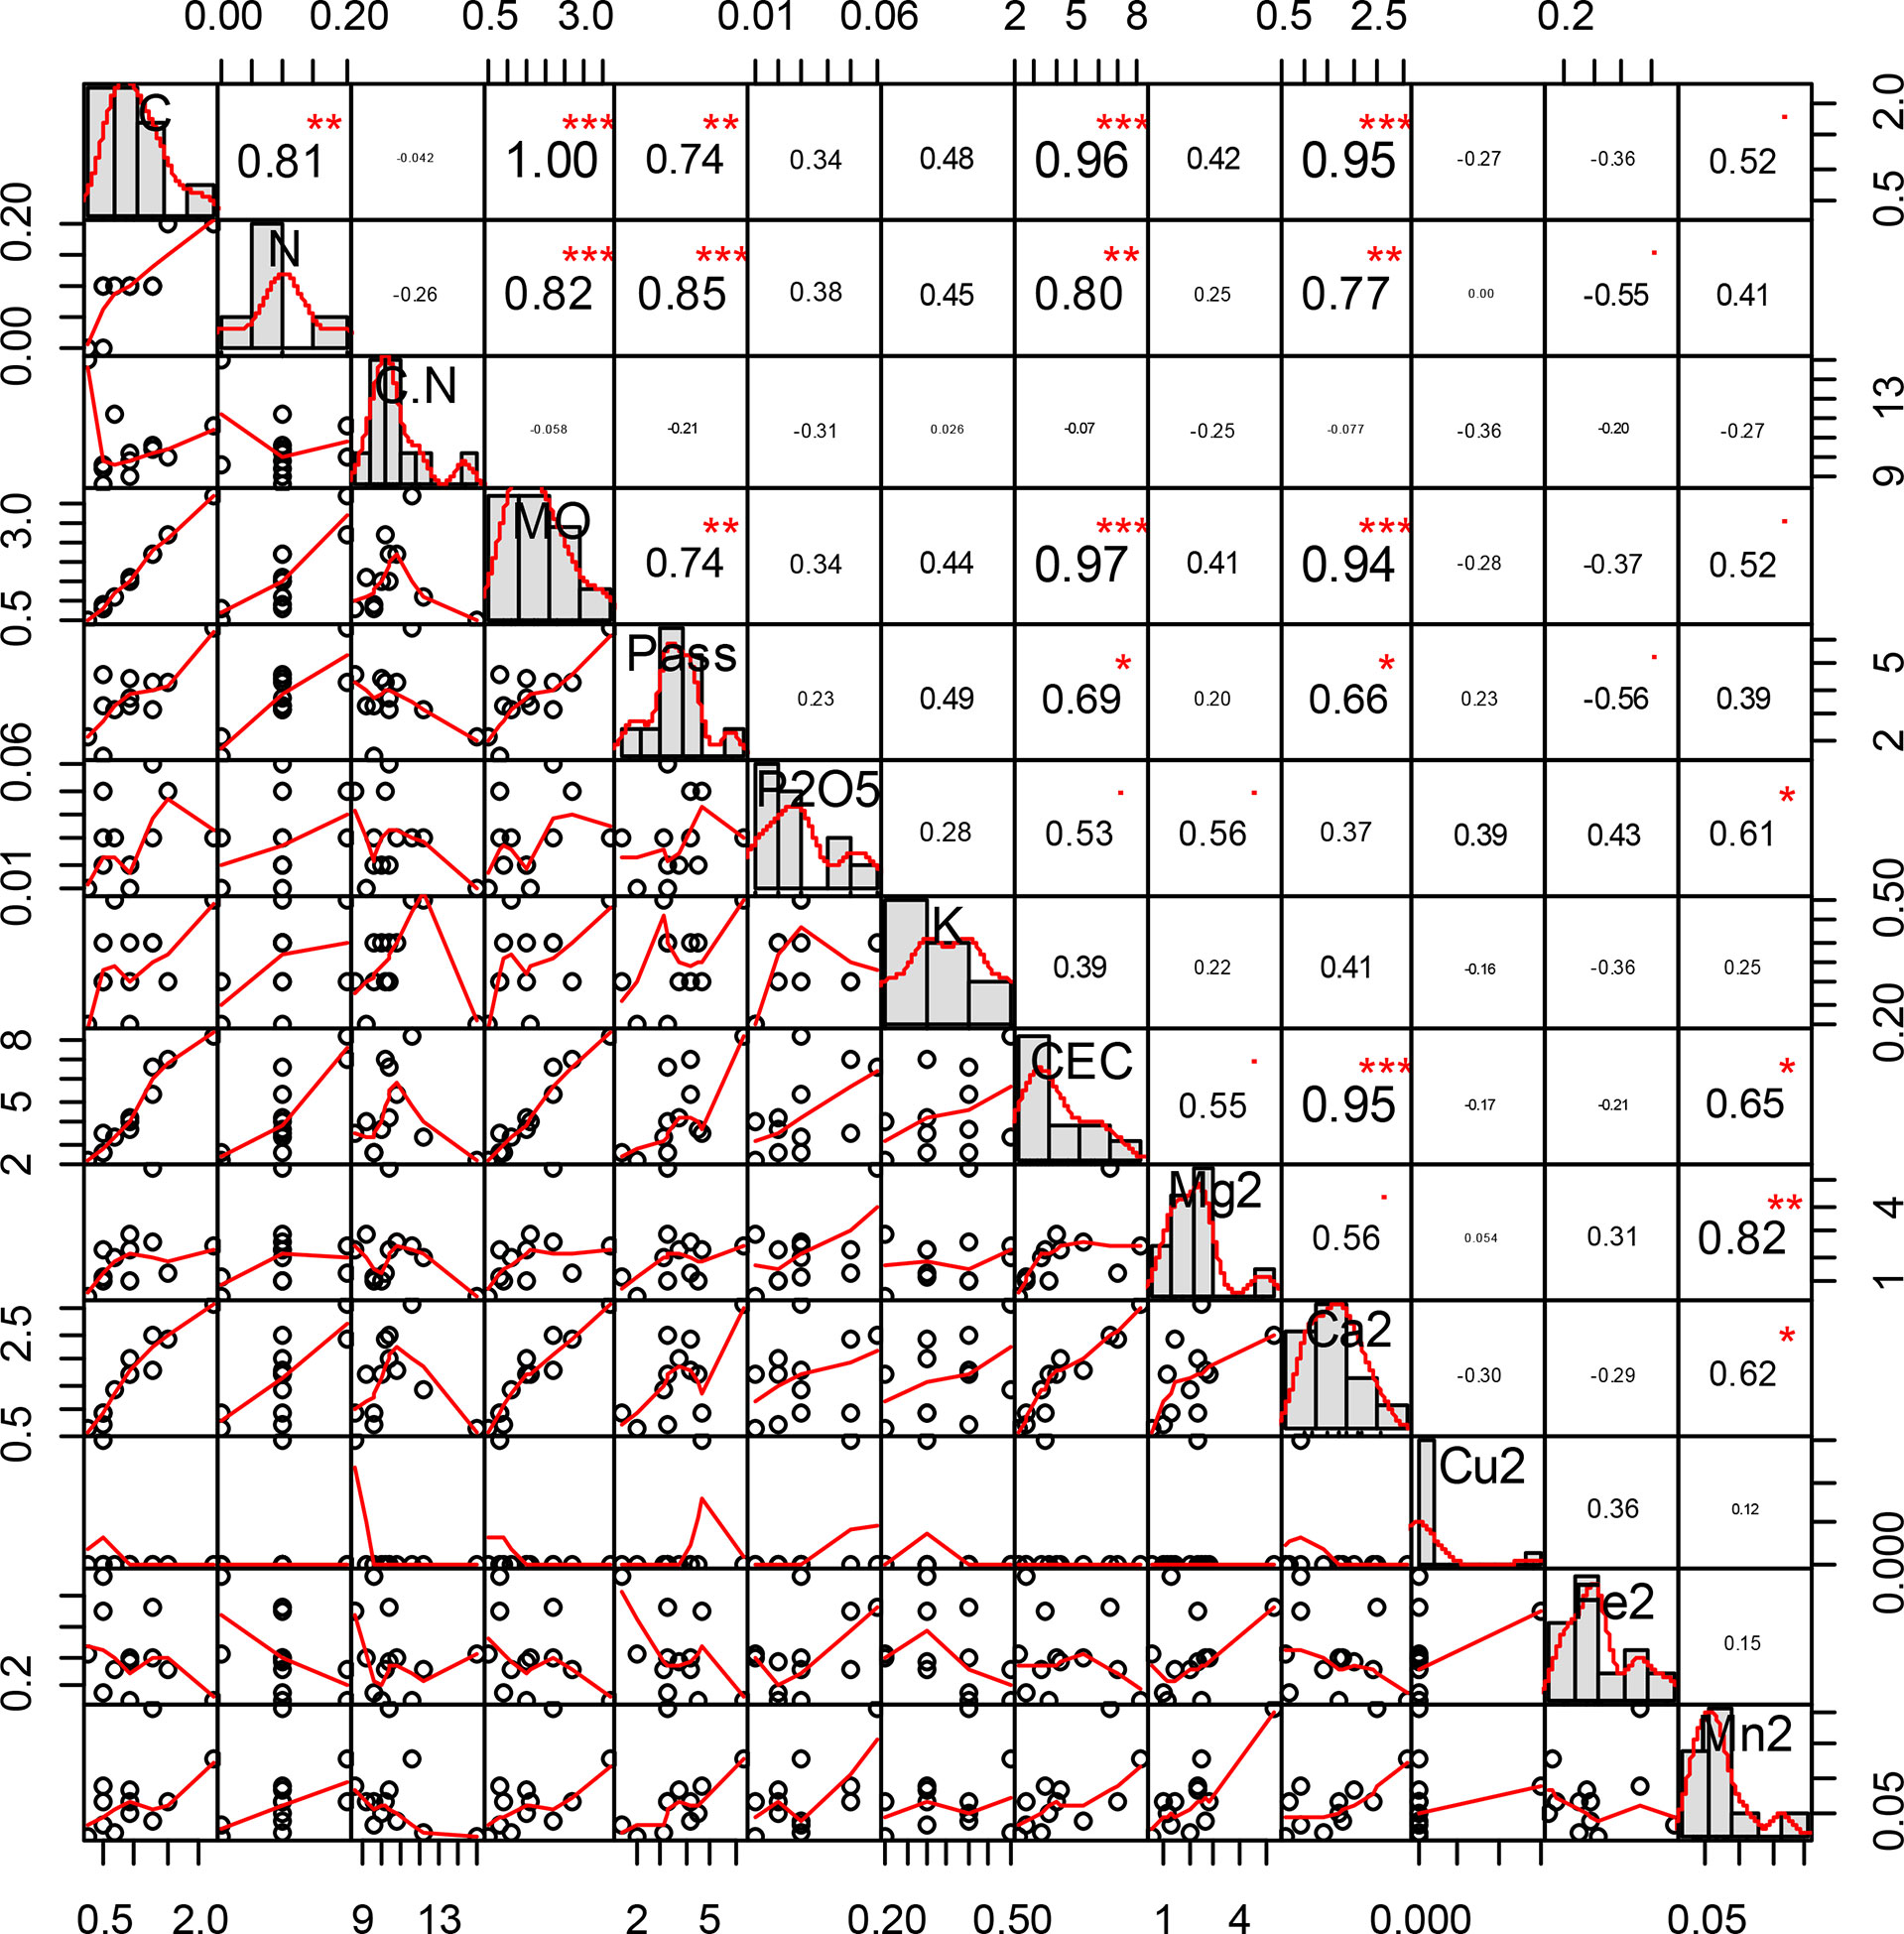
Figure 3 Correlation indexes between carbon, nitrogen, available phosphorus (P ass), and cation exchange capacity (CEC). “*” = Statistically significant difference at 5%, "**" = Statistically significant difference at 1% and "***" = Statistically significant difference 0.1%.
The results of bulk density measurements of soils are shown in Figure 4. Statistical analysis (ANOVA, pV = 0.509 > 0.05) shows that the bulk density of soils does not vary significantly according to treatment (species and/or distance to the trees). It was slightly higher in soils 20 m from the canopies than in soils under the trees. For the results of soil moisture measurements, statistical analysis (ANOVA, pV = 0.206 > 0.05) shows that soil moisture values do not vary significantly according to treatment (species and/or distance to the trees). The mean soil moisture values obtained are 0.20475% beneath V. seyal trees, 0.052 beneath P. chilensis, and 0.054 at 20 m outside the canopies of the trees. They are almost four times higher in soils beneath V. seyal than in soils beneath P. chilensis and in soils at 20 m from the trees.
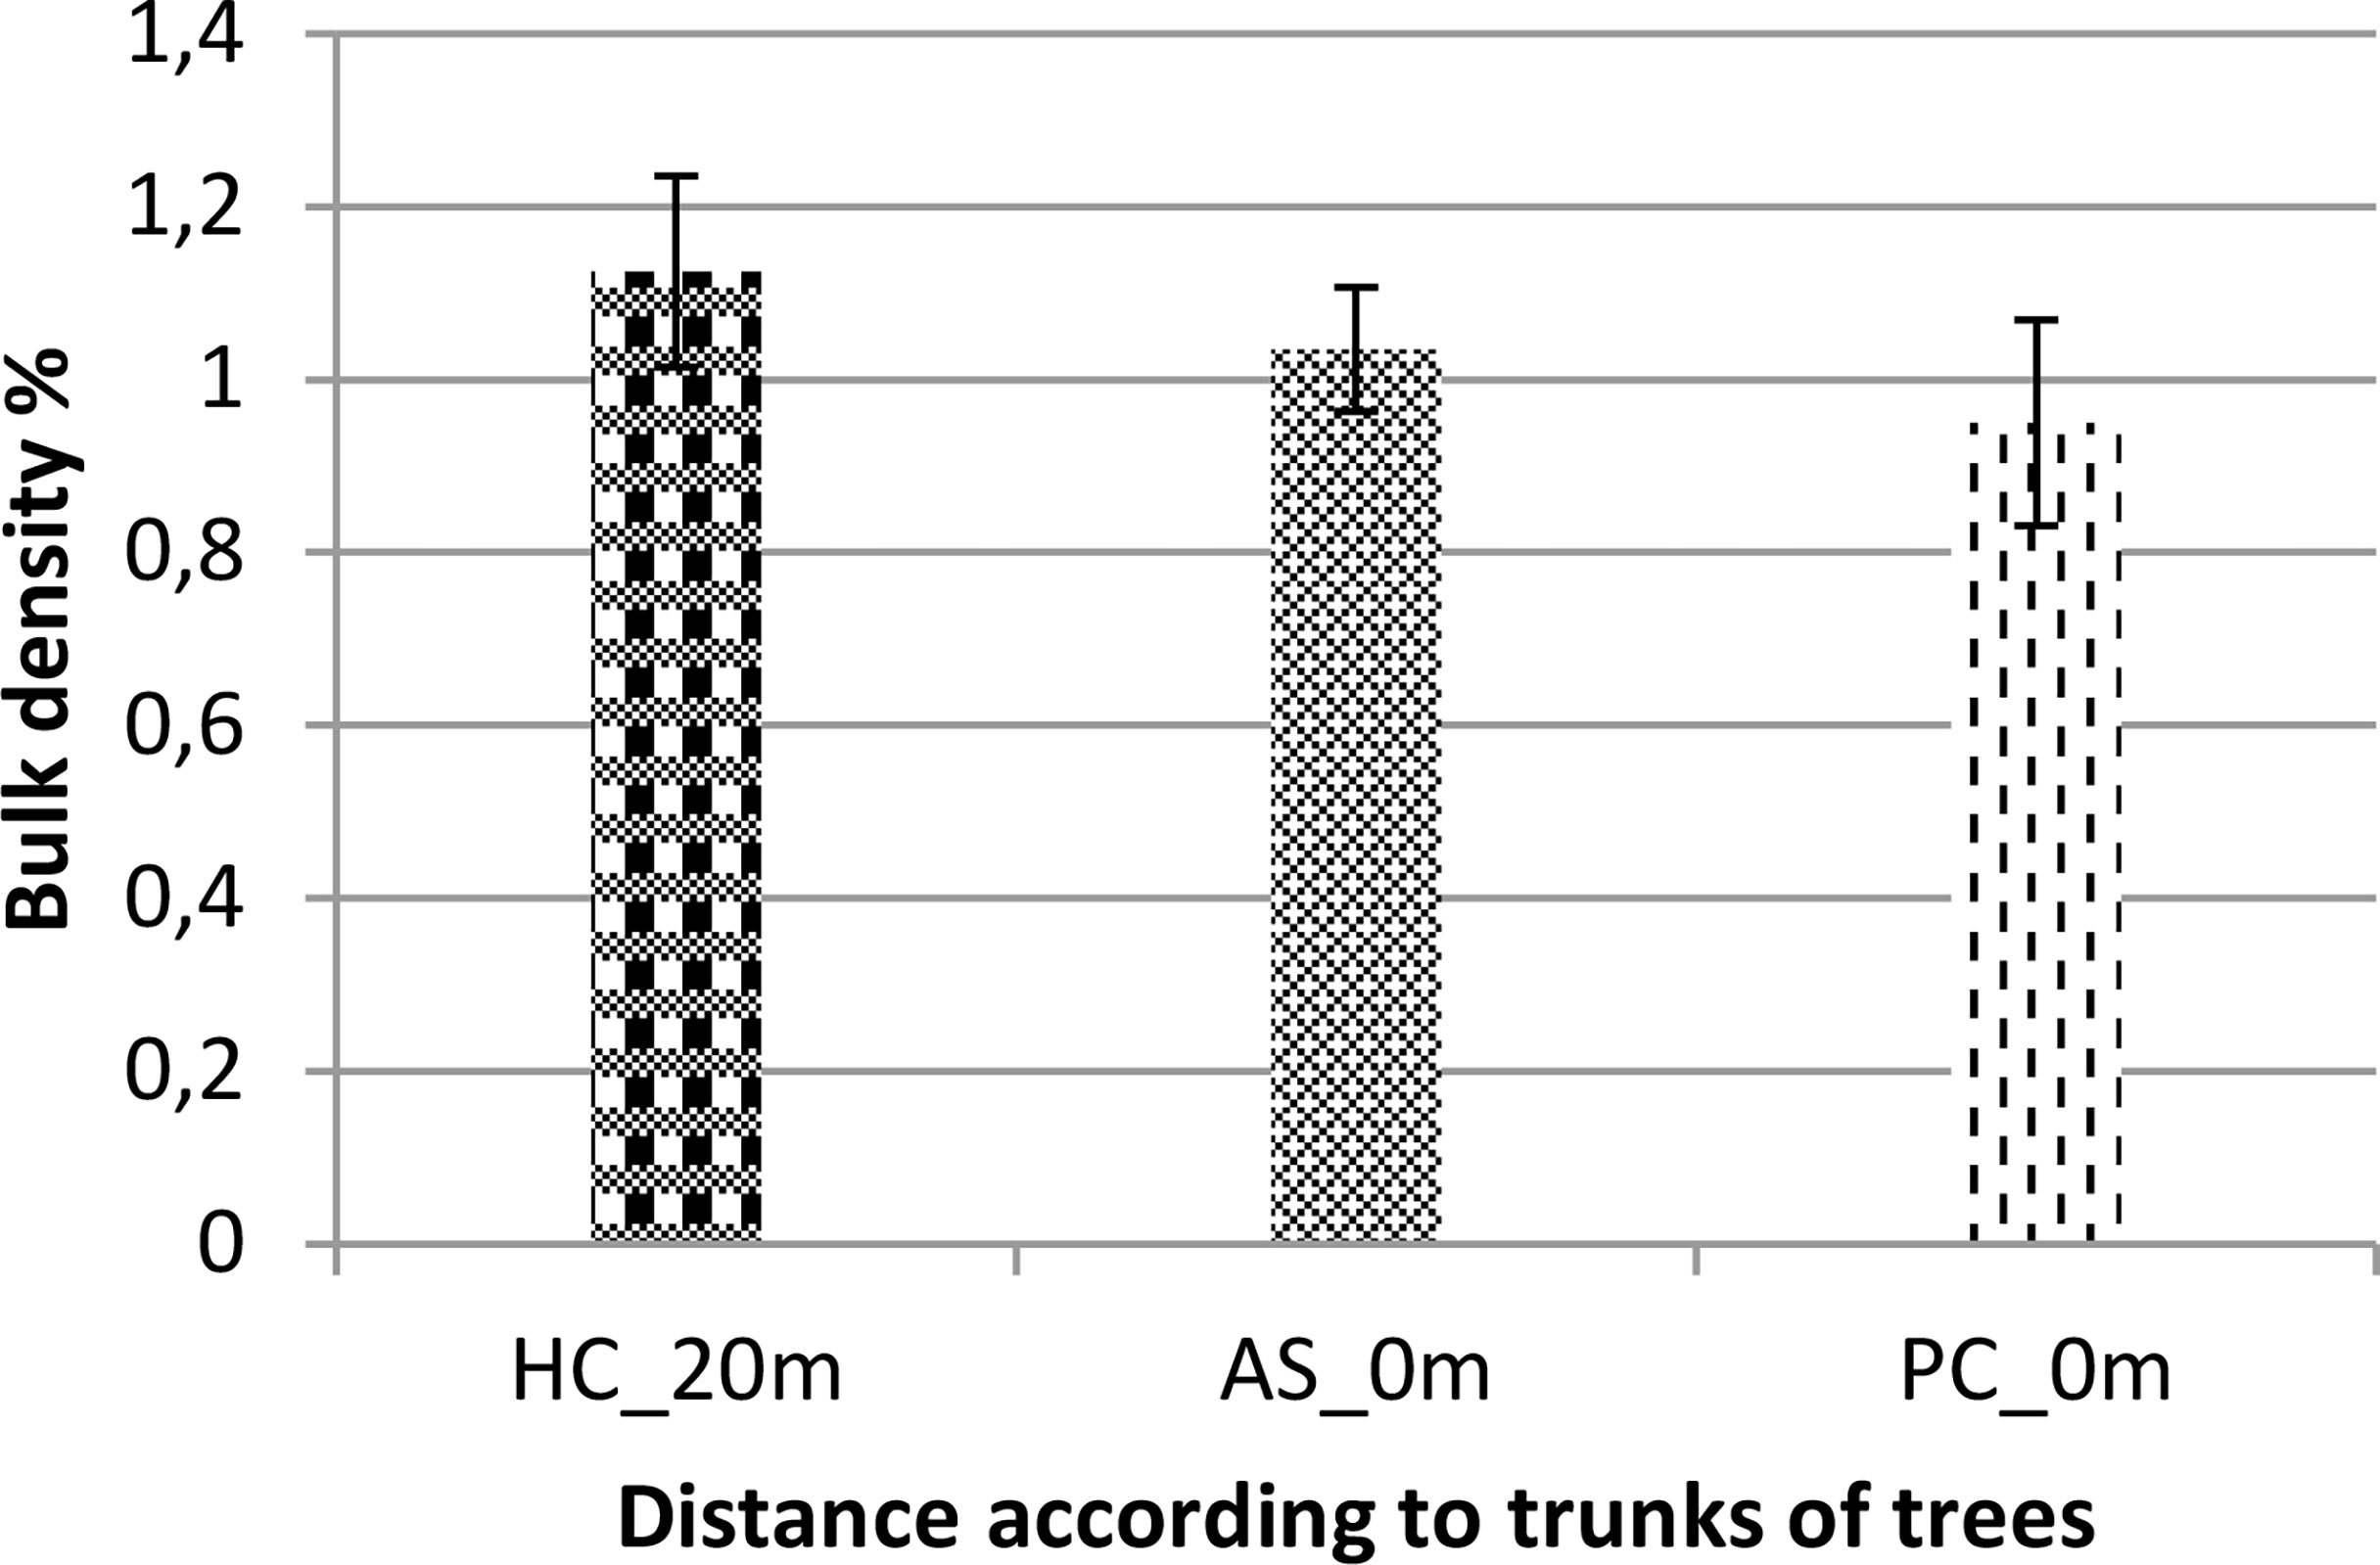
Figure 4 Soil bulk density based on the distance to the trunks of trees. AS, Vachellia seyal; Pc, Prosopis chilensis; HC, out of cover of trees.
Mycorrhizal inoculum potentials
Natural living root AMF colonization
The results of natural living root AMF colonization representing the contribution of herbaceous species in mycorrhization potential in terms of frequencies of mycorrhization (FM) and intensities of mycorrhization (IM) are shown in Figure 5. Vachellia seyal has higher root FM and IM than P. chilensis. The FM and IM of Z. glochidiata are higher beneath V. seyal than outside the canopies of the trees. Melhania denhamii has almost the same mycorrhization rate beneath V. seyal than outside the canopies of the trees. Eragrostis tremula has a better mycorrhization rate outside the canopies of the trees than beneath V. seyal. Ipomea kotschyana and A. indica have higher FM but with lower IM beneath V. seyal than outside the canopies. Cyperus rotundus has a slightly better rate outside the canopies than beneath V. seyal. Ipomoea kotschyana, A. indica, and C. rotundus have much higher rates beneath P. chilensis than beneath V. seyal and outside the canopies.
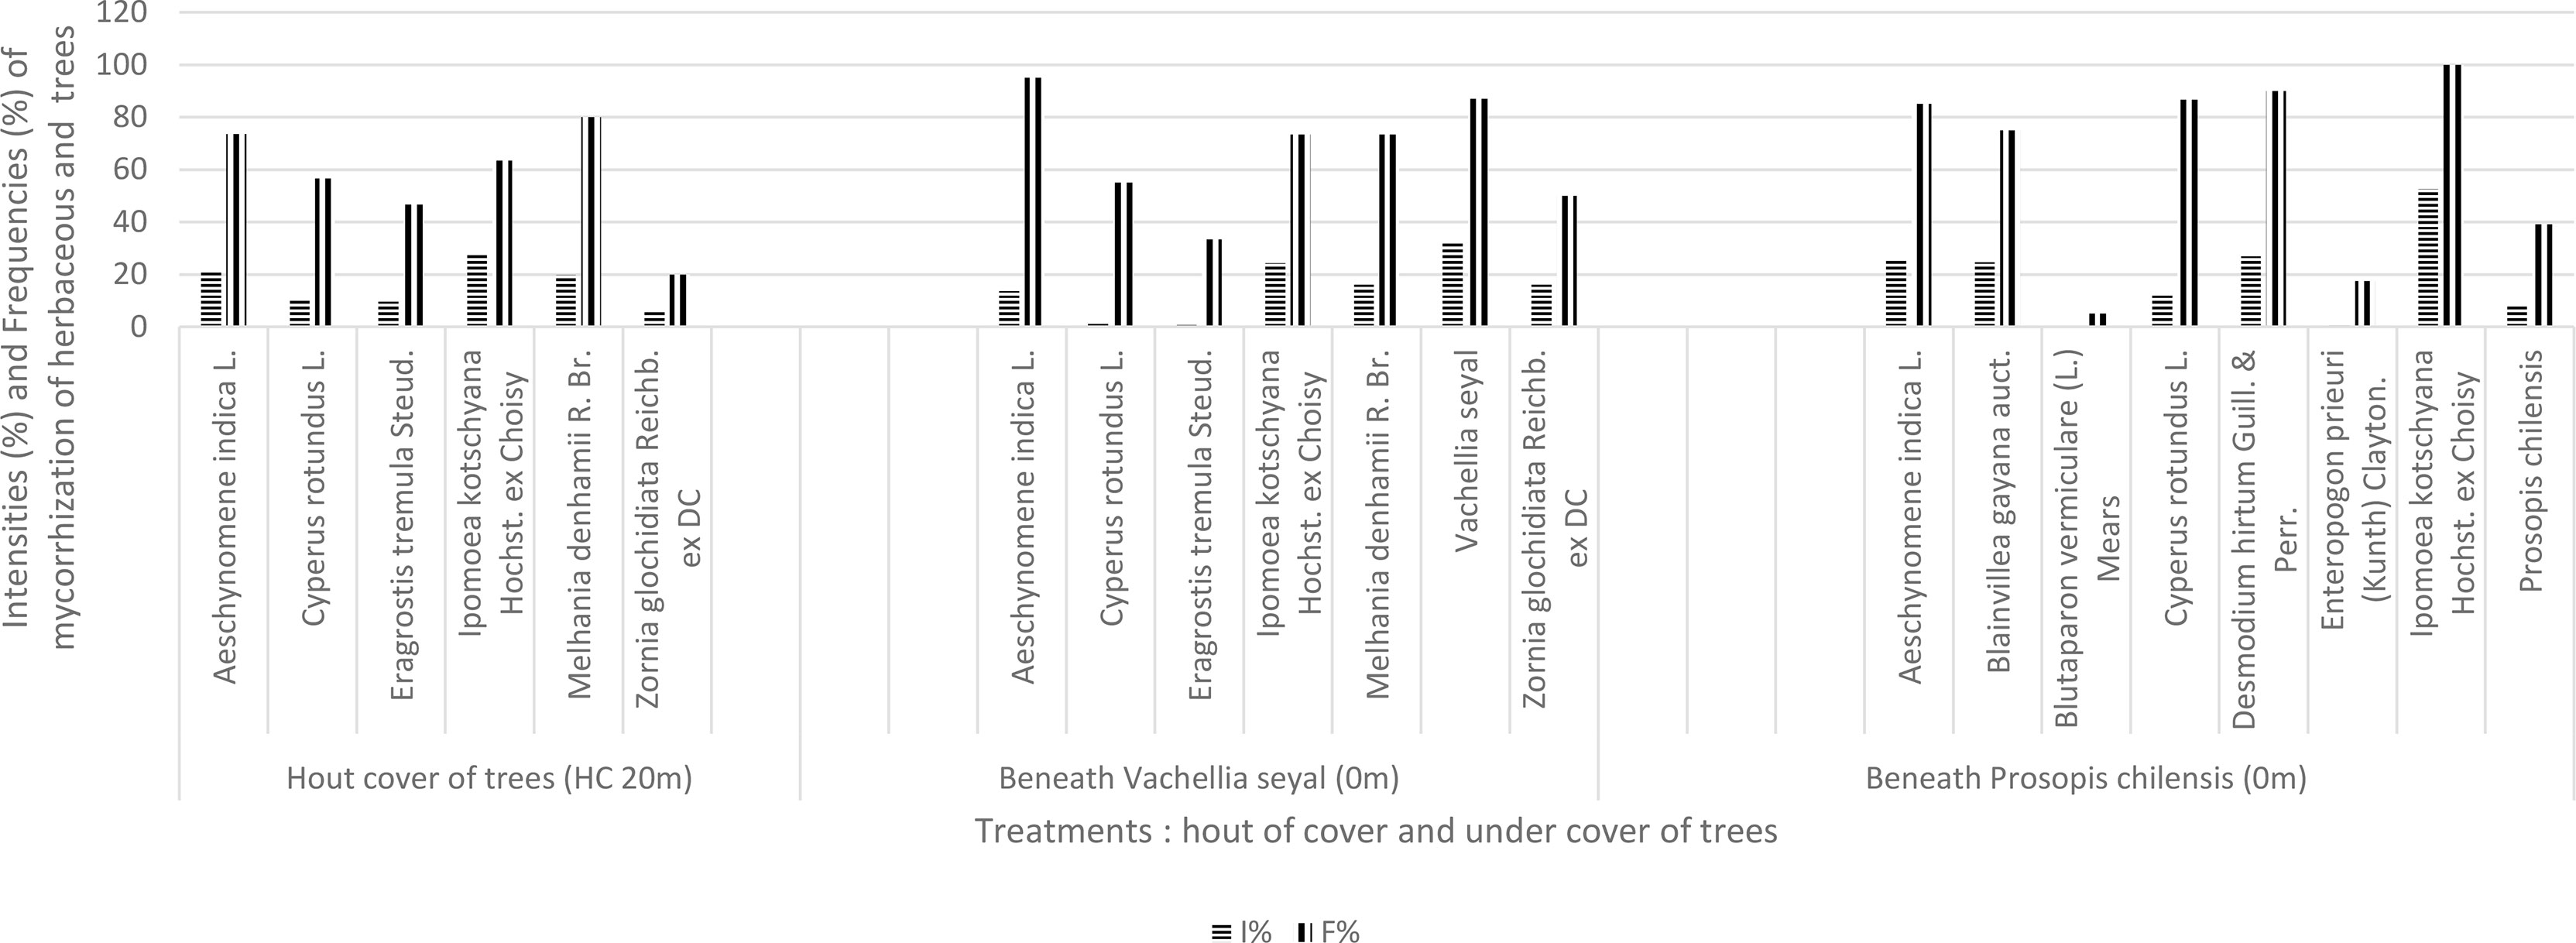
Figure 5 Contribution of herbaceous and tree species to FM and IM (VS, Vachellia seyal; PS, Prosopis chilensis).
The average IM values of the living roots of the herbaceous species collected directly from the site outside and under the canopies of the trees are shown in Figure 6. The results show that the IM of most overgrown herbaceous species are almost identical under P. chilensis and outside the canopies of the trees, but they are higher for the soil beneath V. seyal. The IM of the most overgrown herbaceous species are also higher compared with the mean IM of all herbaceous species for the soils beneath V. seyal. The mean IM of all herbaceous species are higher than the average IM of most overgrown herbaceous species for soil beneath P. chilensis.
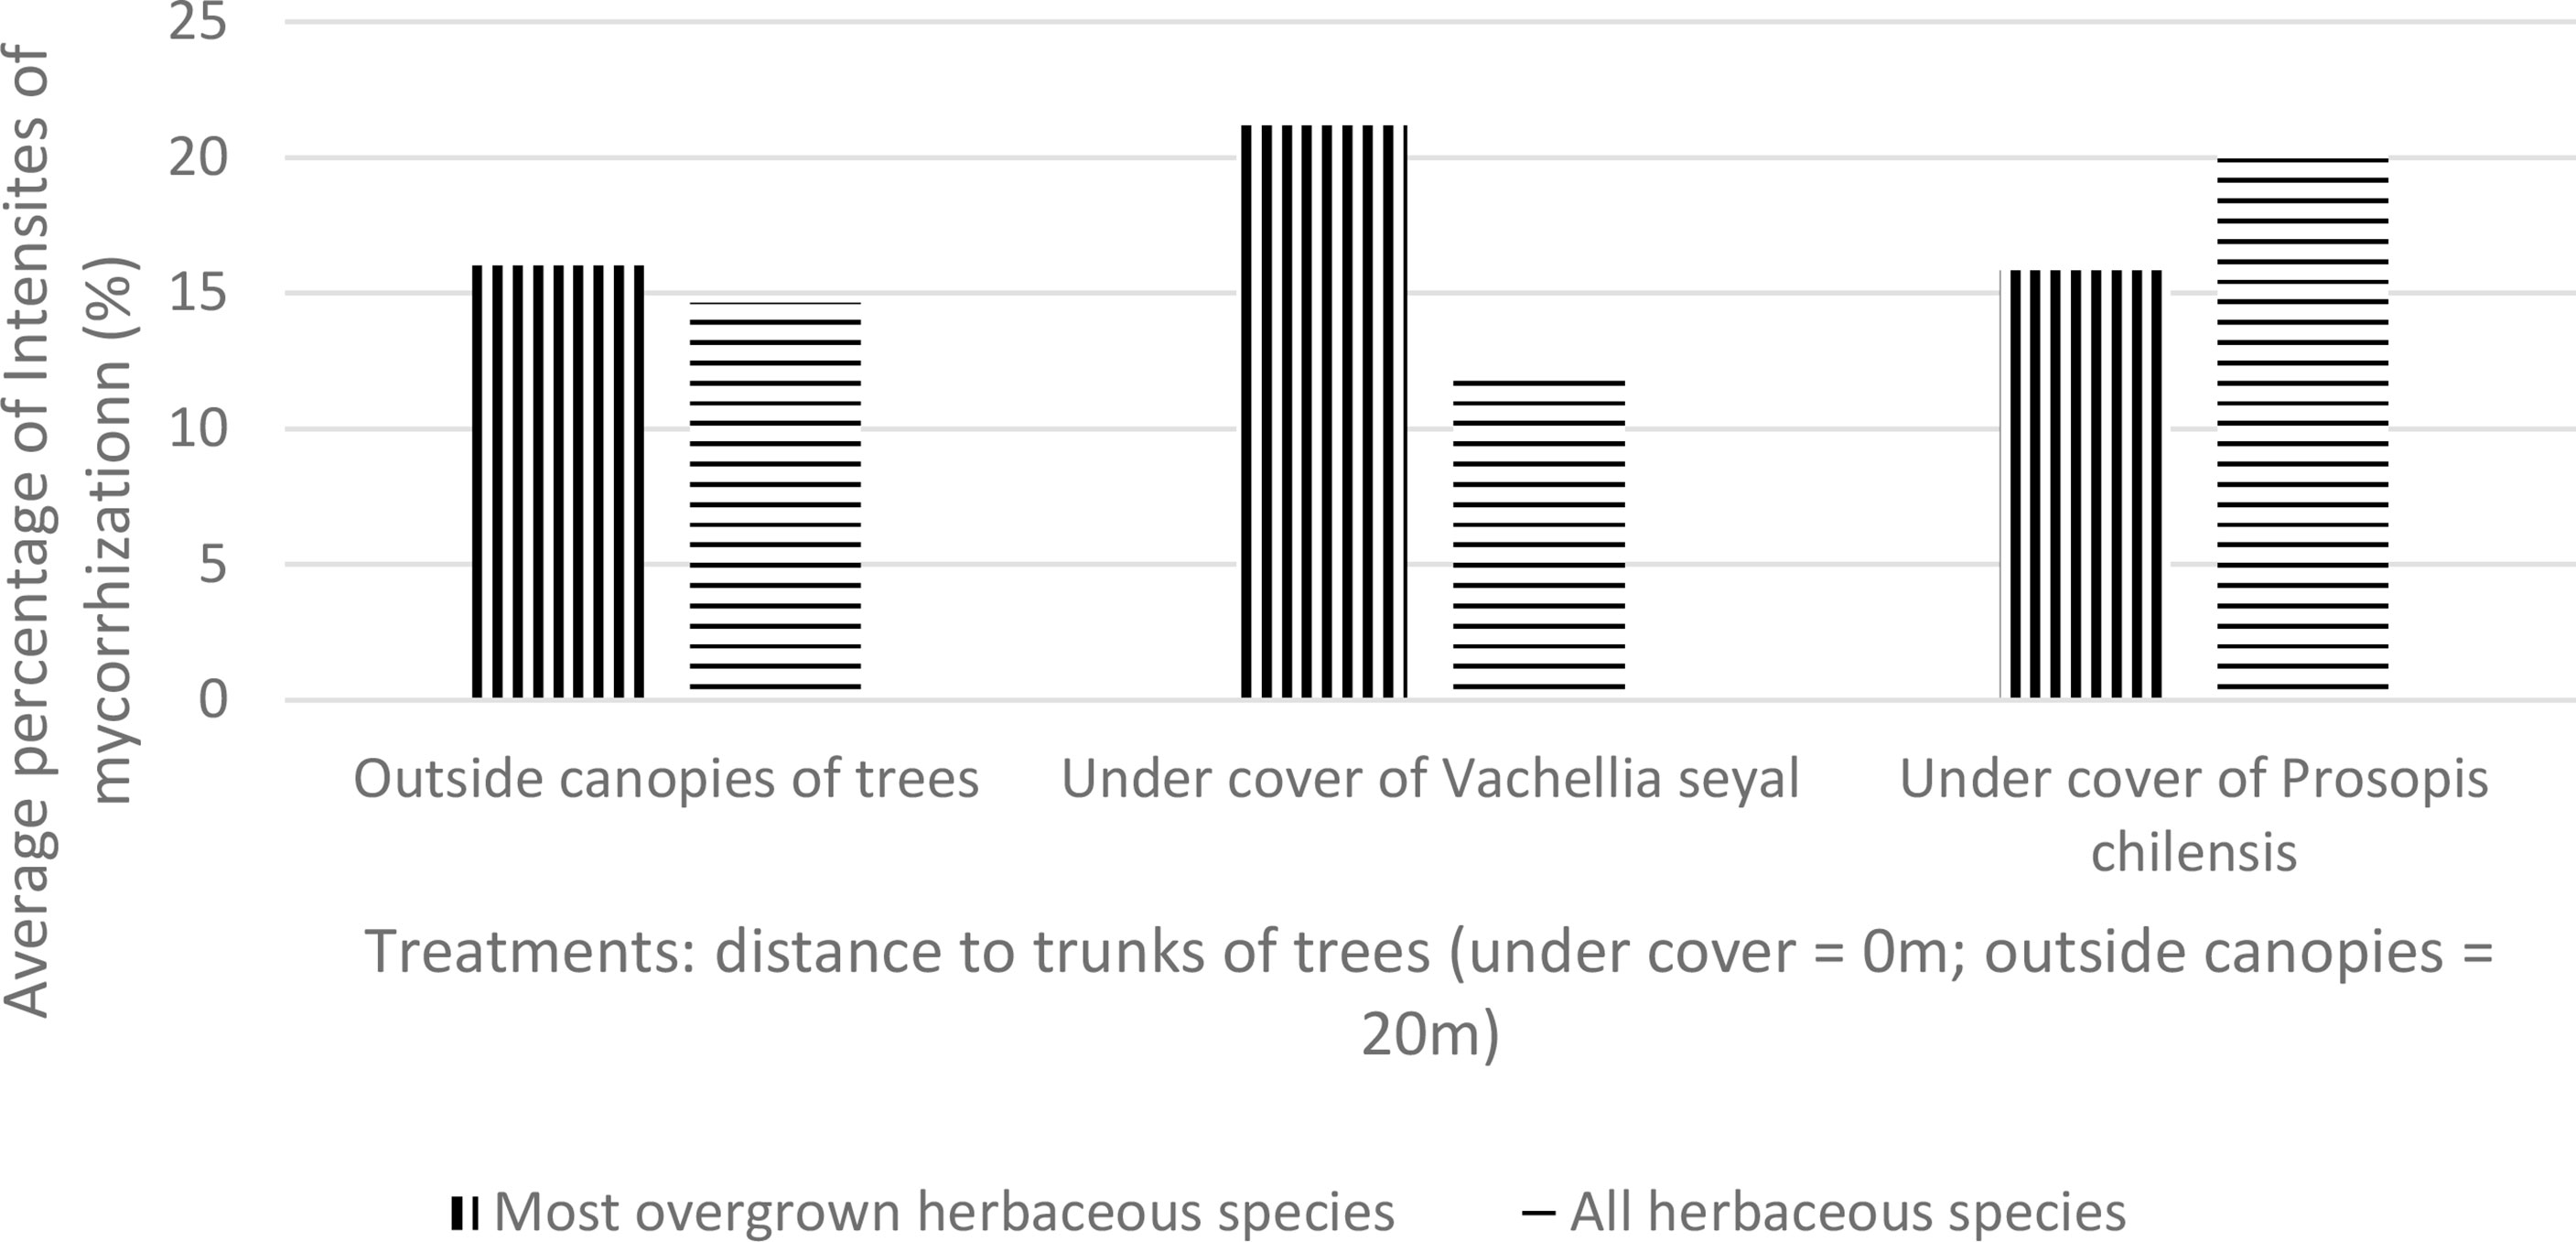
Figure 6 Mycorrhization rate of natural living roots of herbaceous species beneath the trees and outside the canopies of trees.
Figure 7 shows the averages of FM for the most overgrown herbaceous species (Z. glochidiata, E. tremula, and I. kotschyana outside the canopies of the trees; I. kotschyana, A. indica, C. rotundus, M. denhamii, E. tremula, and Z. glochidiata under the canopies of the trees of V. seyal; and D. hirtum, I. kotschyana, B. vermiculare, E. prieuri, B. gayana, A. indica, and C. rotundus under the canopies of the trees of P. chilensis). These results show that the average values of most overgrown herbaceous species are higher beneath V. seyal and decrease outside the canopies of trees and beneath P. chilensis. On the other hand, the mean values of FM of all herbaceous species are almost equal beneath P. chilensis and beneath V. seyal.
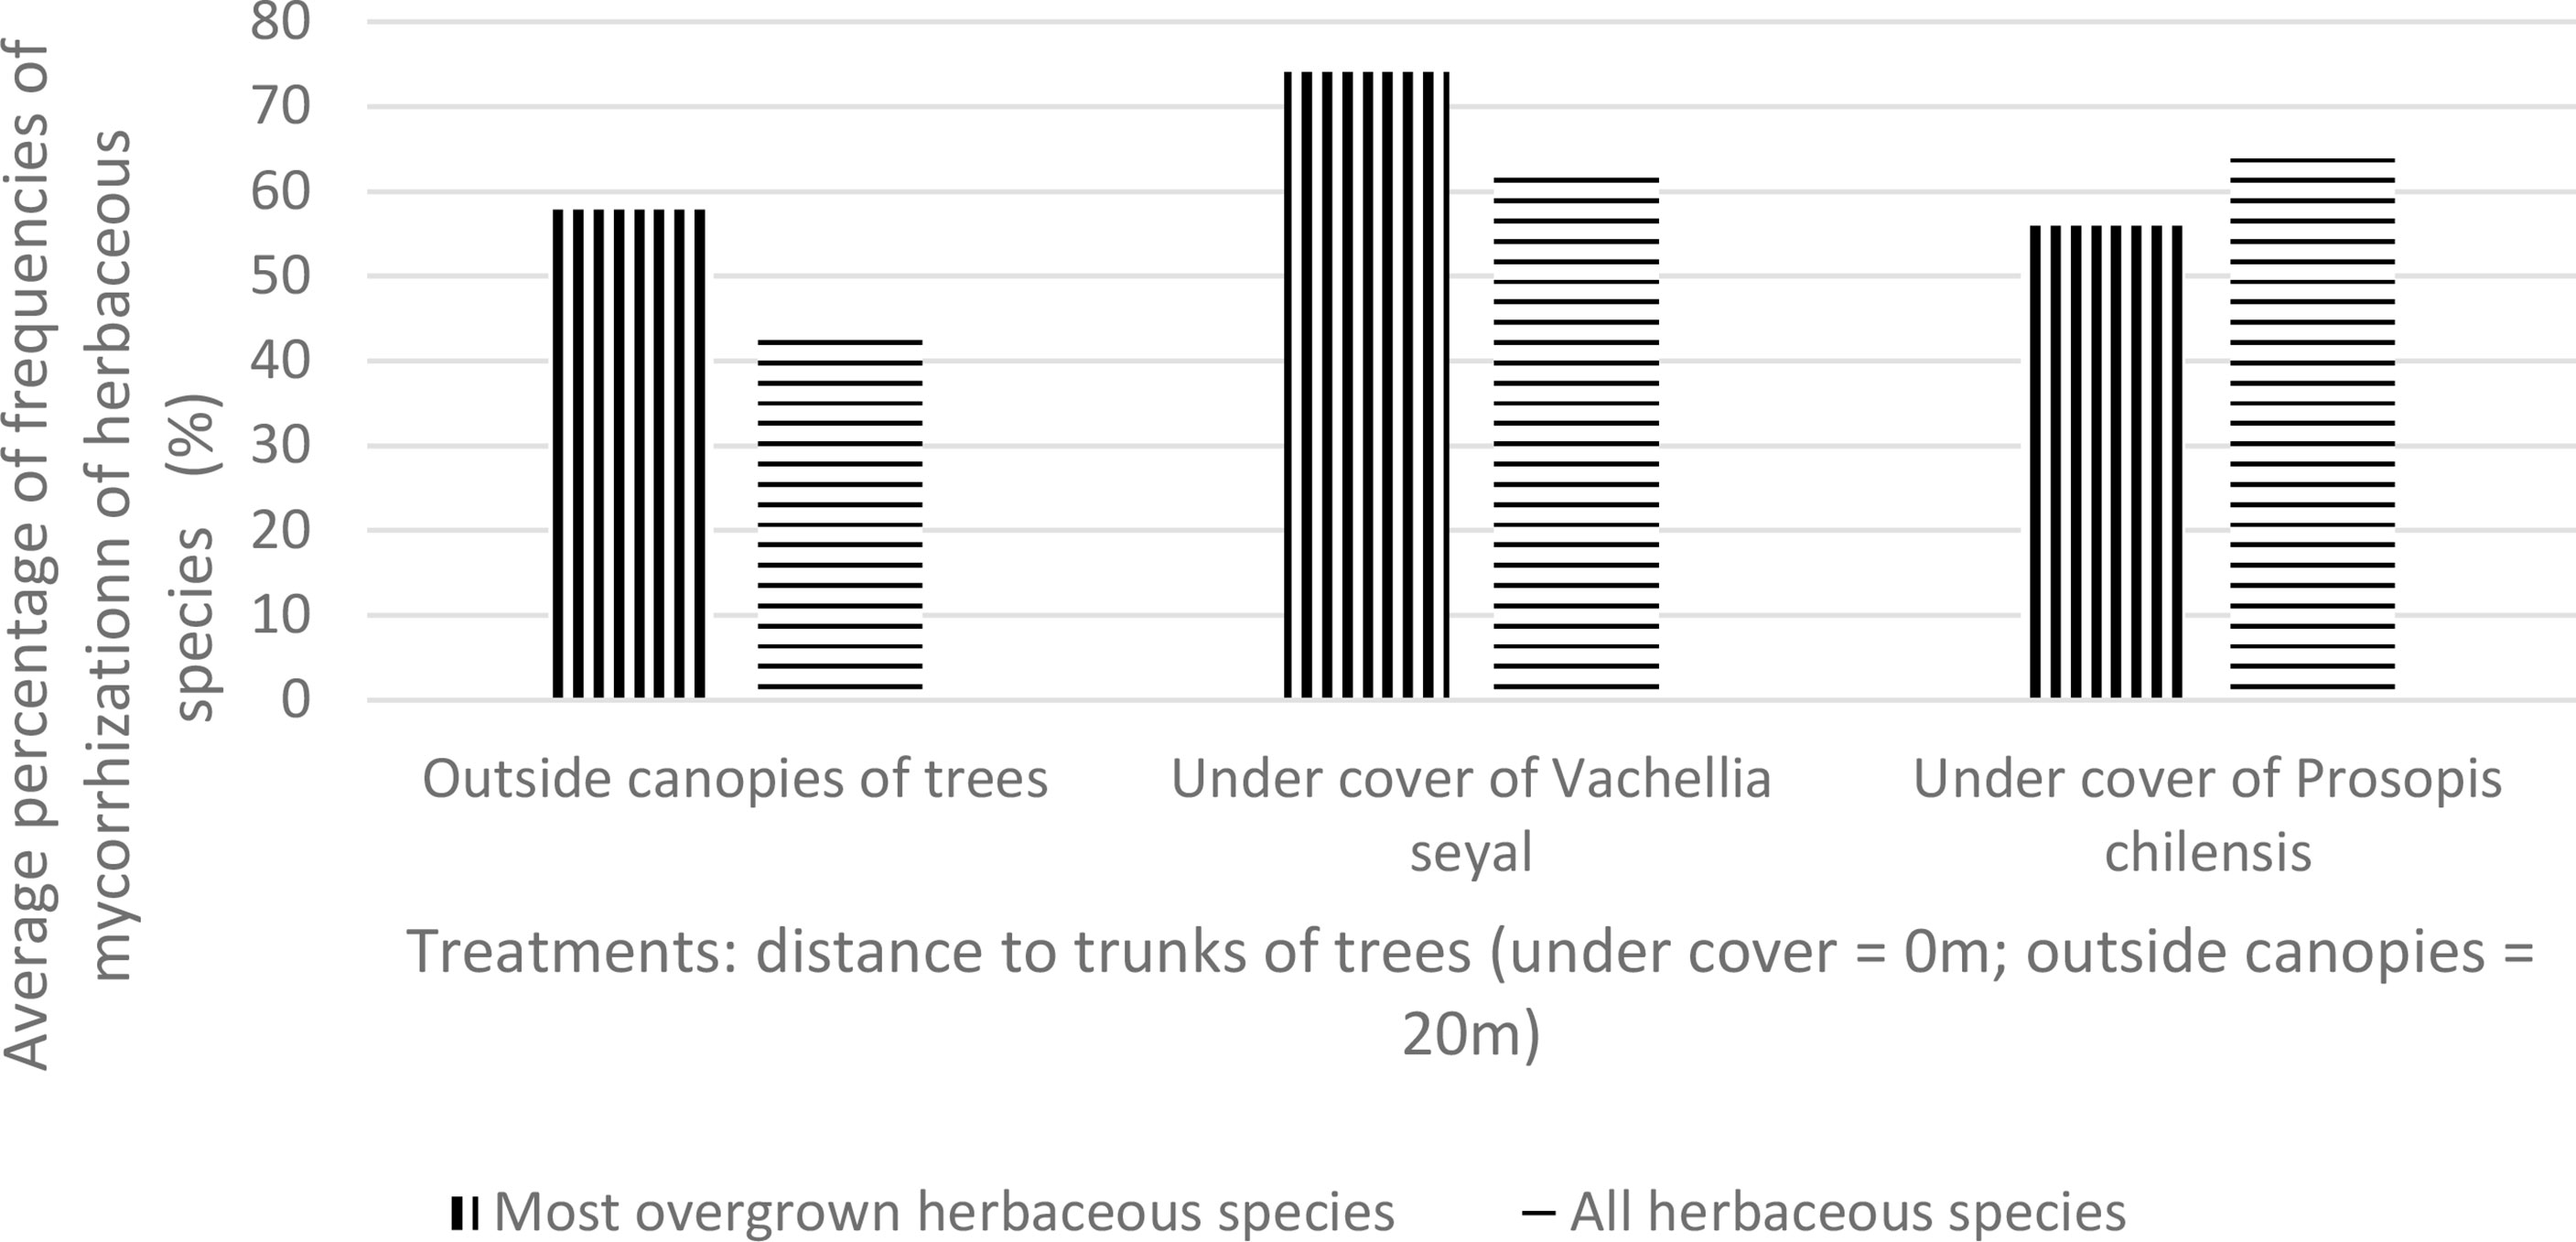
Figure 7 Average mycorrhization rate of natural living roots of herbaceous species with the highest cover indexes beneath the trees and outside the canopies of trees.
Figures 8 and 9 show also the natural AMF mycorrhization of grasses and trees. The non-parametric median comparison tests applied to FM and IM allowed the identification of groups for both cases. The FM allowed the identification of two groups (Table 9). The first group comprises D. hirtum, V. seyal, B. gayana, I. kotschyana, A. indica, C. rotundus, and M. denhamii and the second group consists of E. tremula, P. chilensis, Z. glochidiata, E. prieuri, and B. vermiculare. The FM of the first group are higher or equal to 70% and those of the second group are lower or equal to 40%. Vachellia seyal belongs to the first group and P. chilensis belongs to the second group.
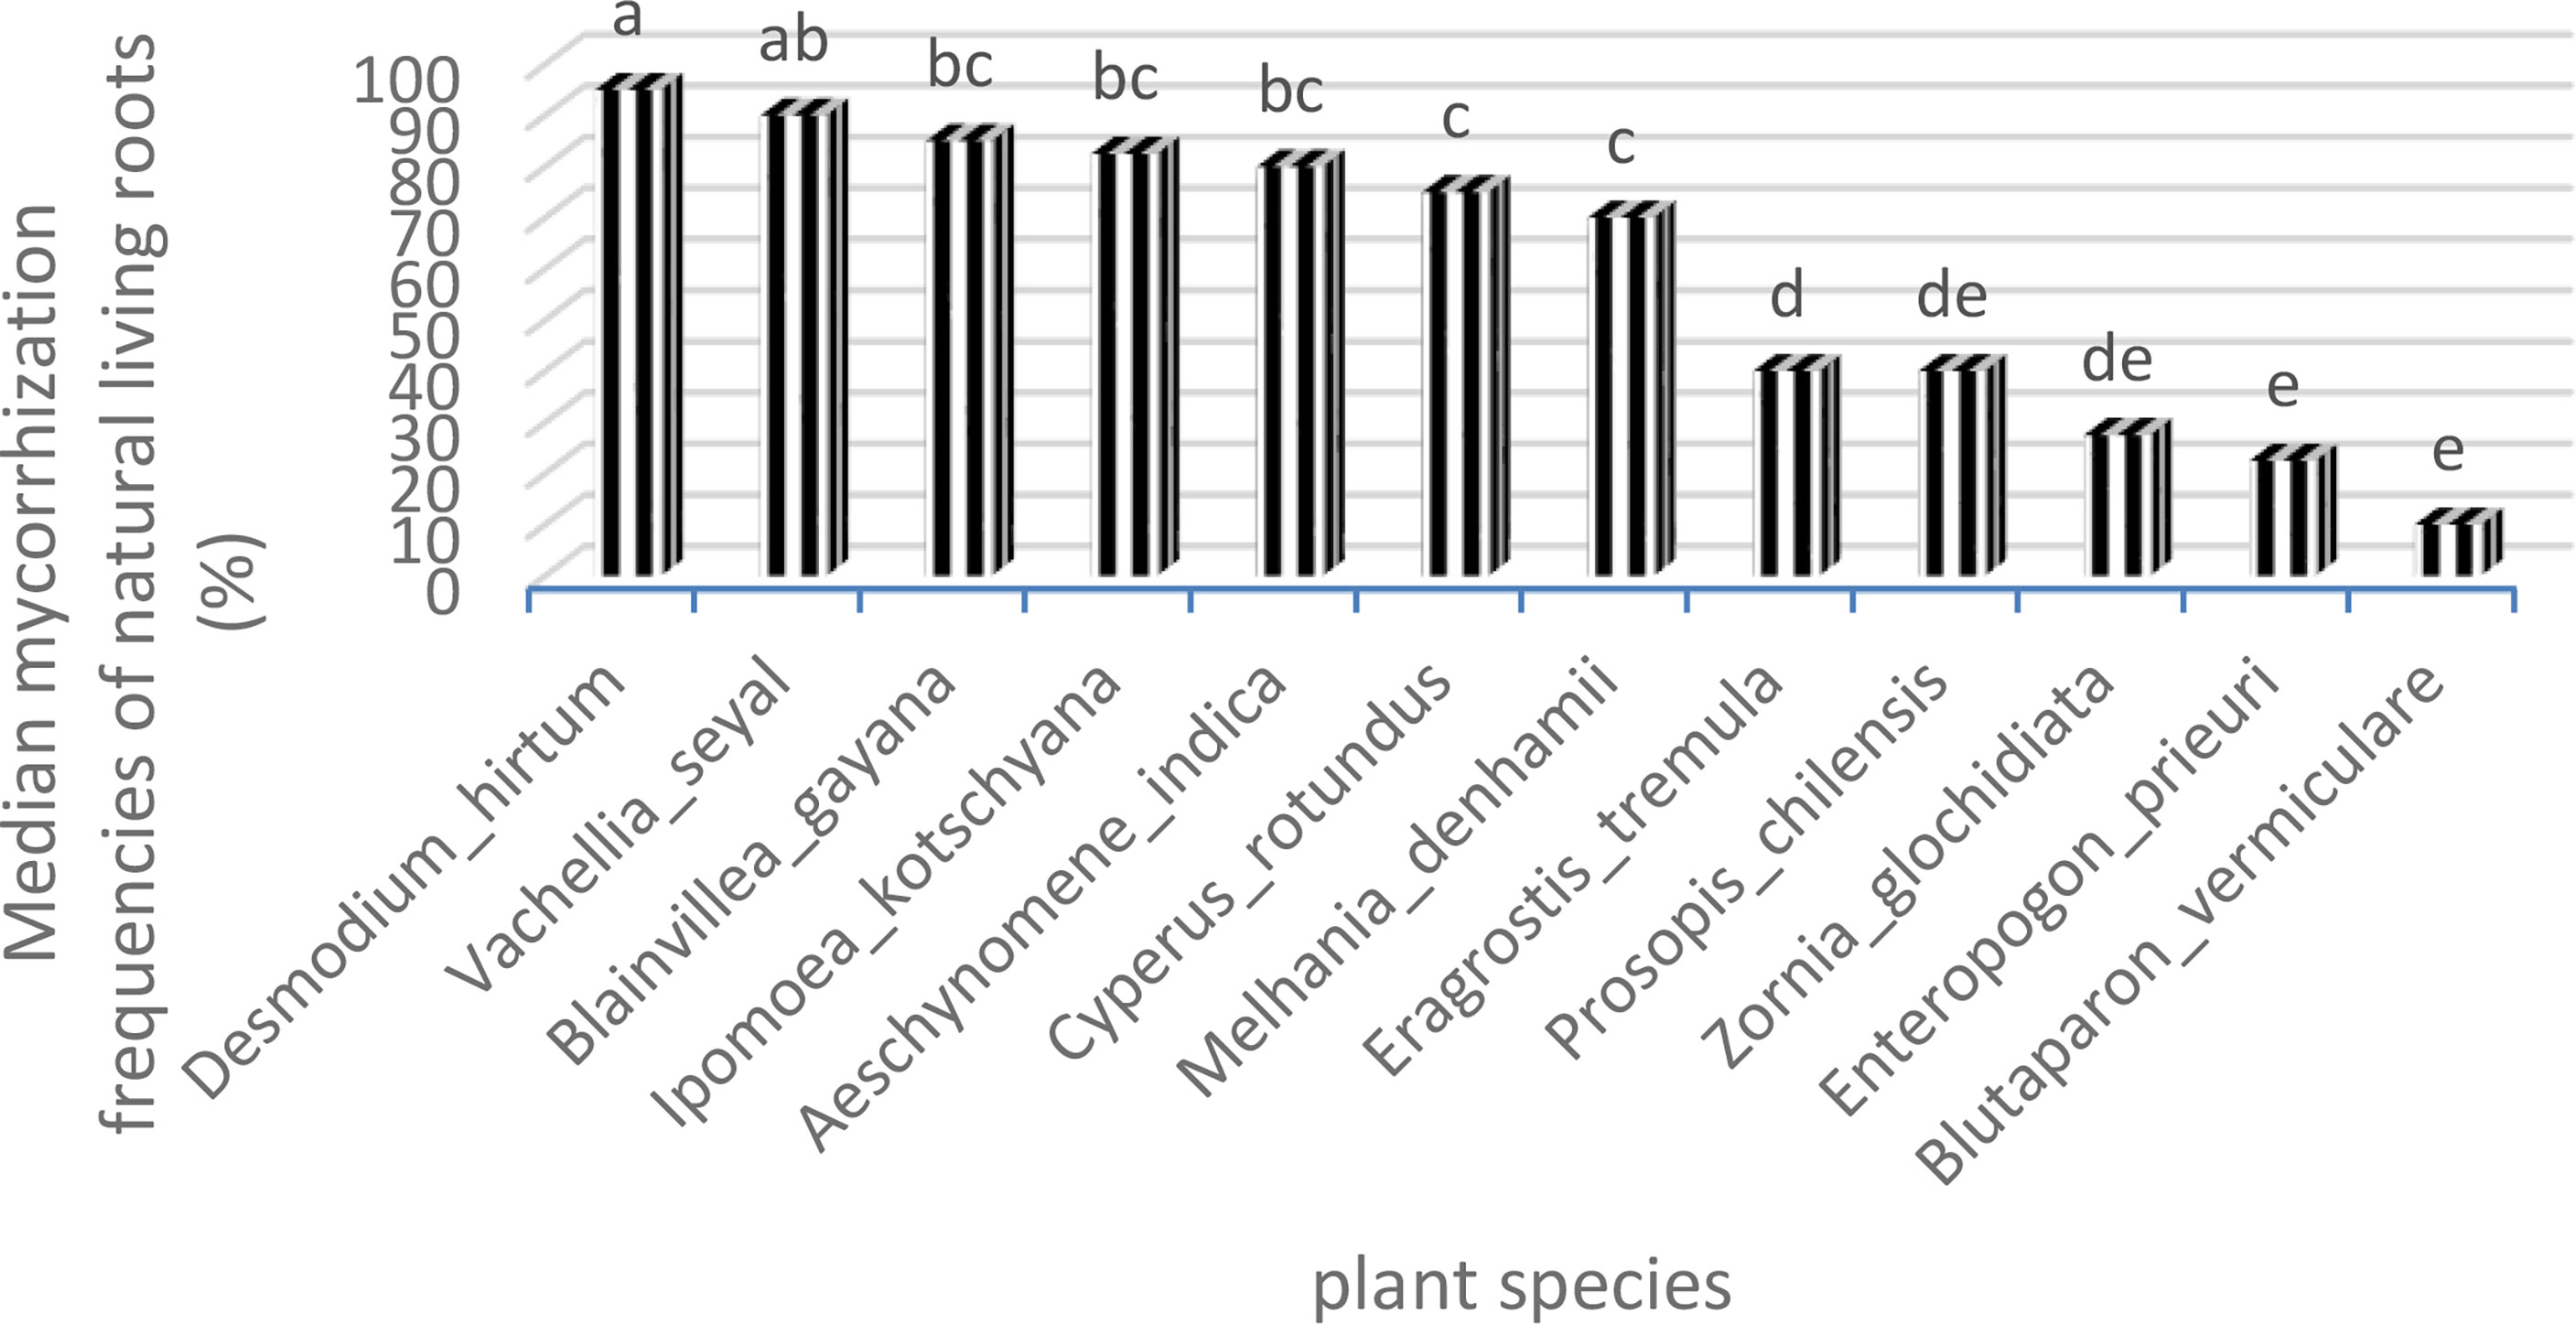
Figure 8 Frequencies of mycorrhization of natural living roots. Means with identical letters are statistically equivalent at the 5% level.
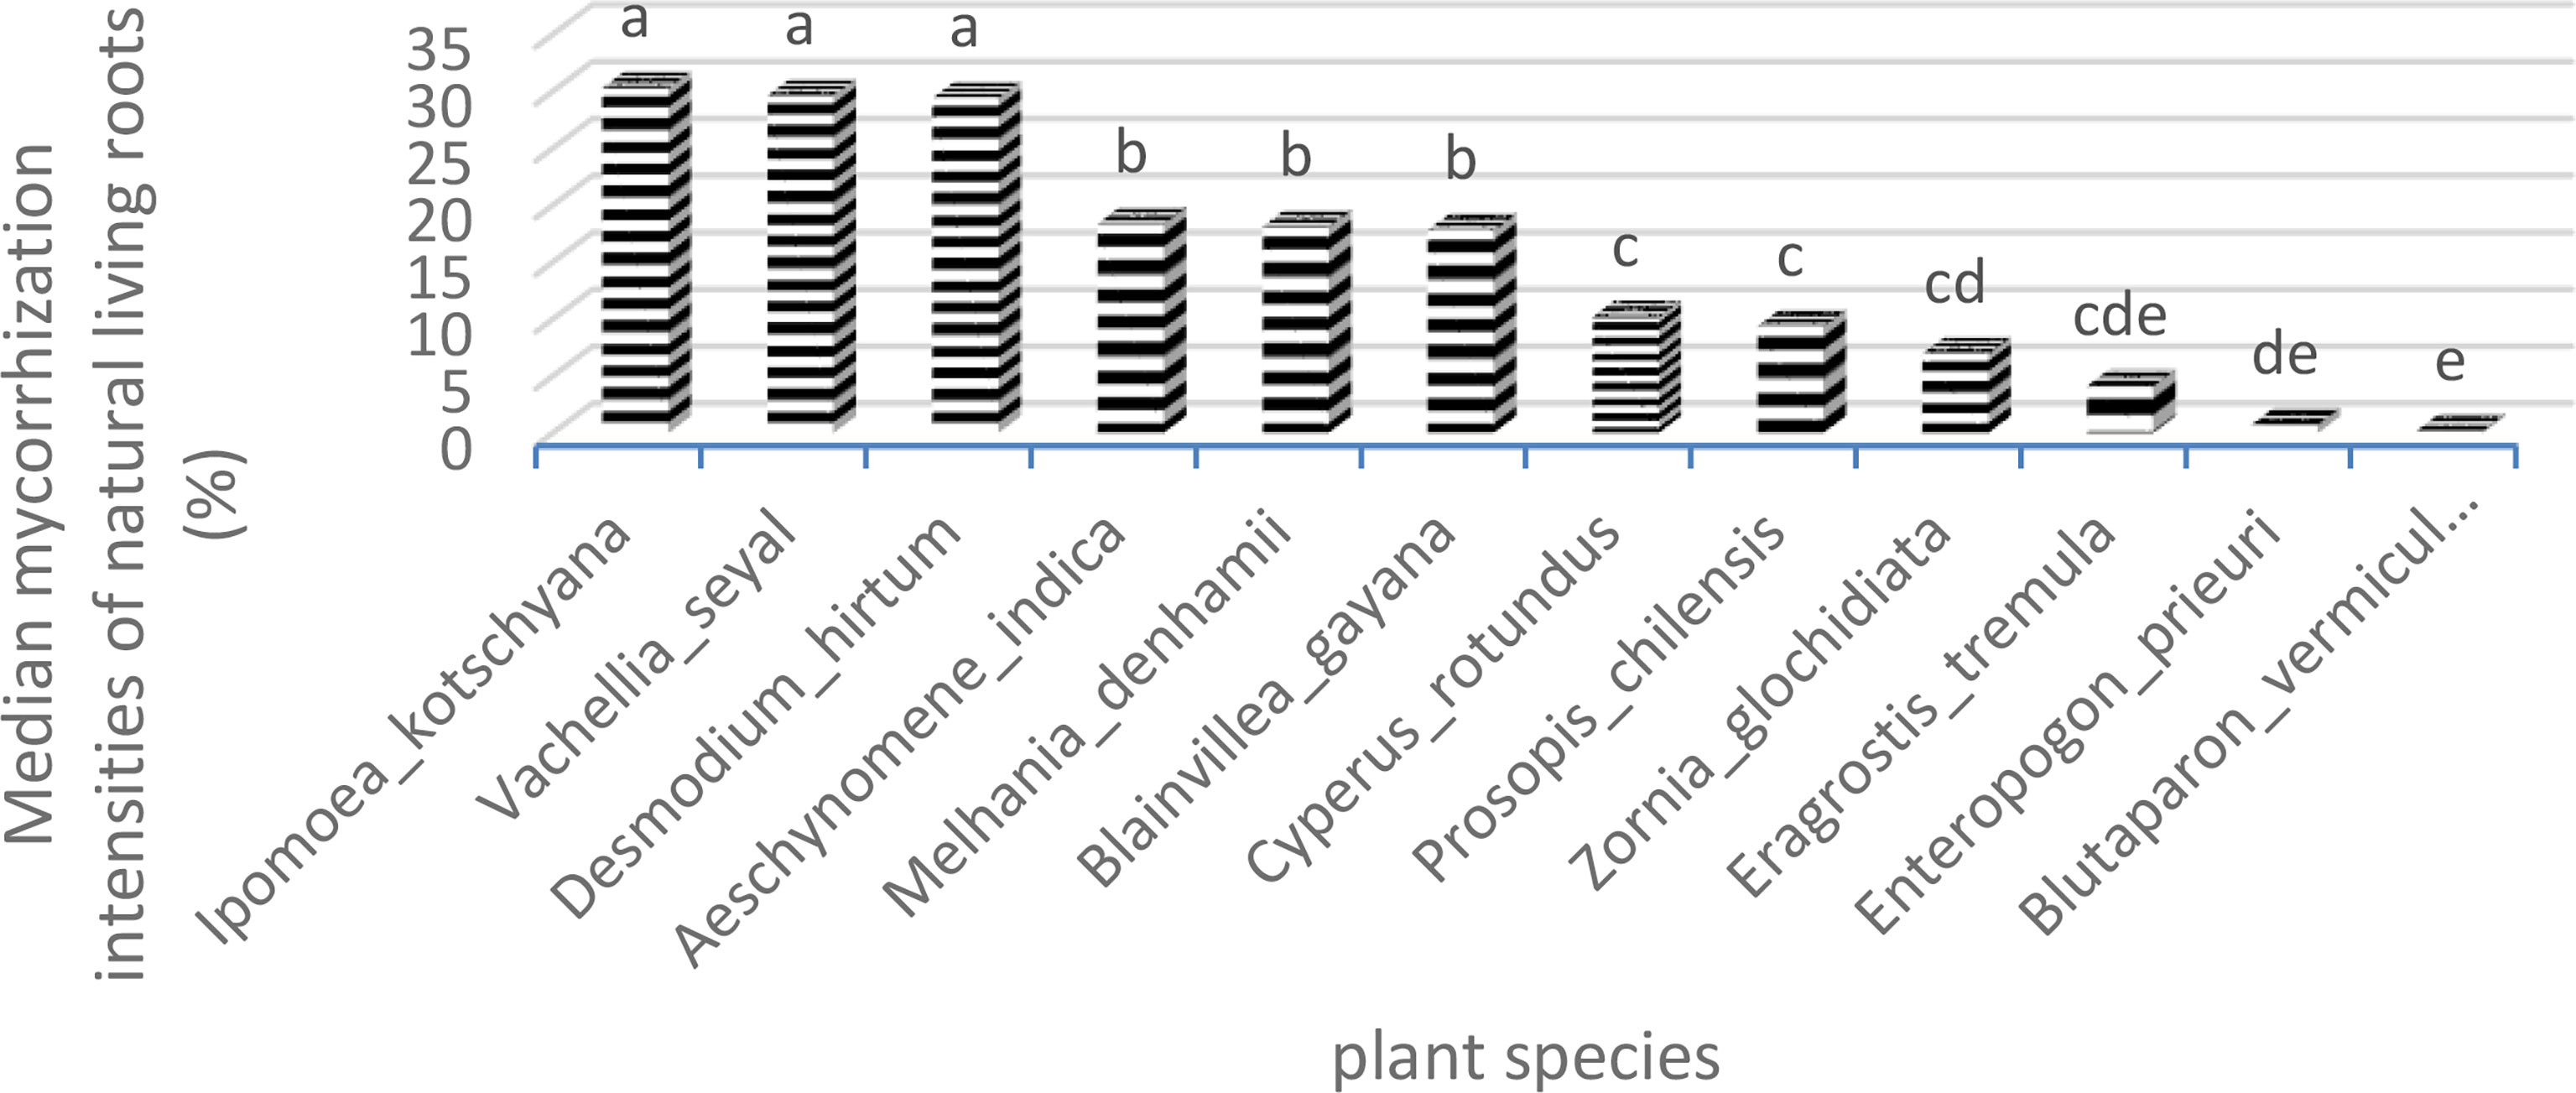
Figure 9 Intensities of mycorrhization of natural living roots. Means with identical letters are statistically equivalent at the 5% level.
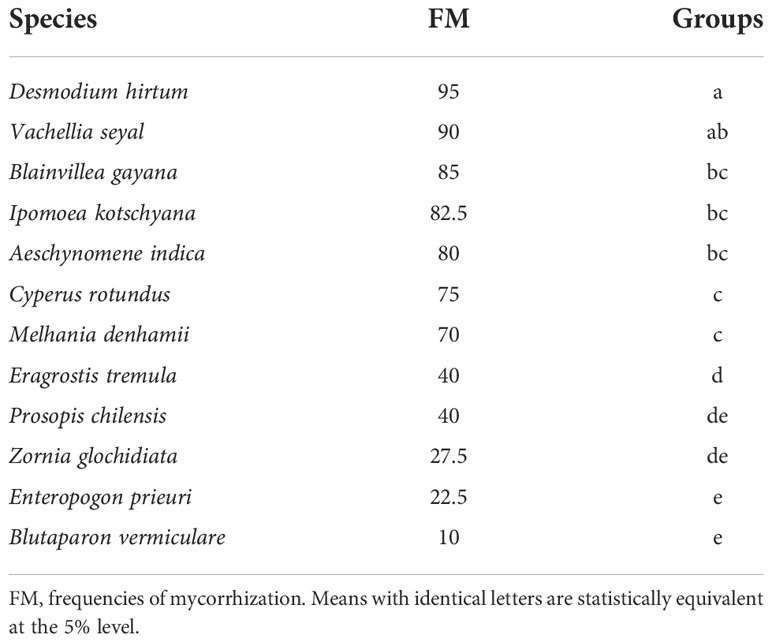
Table 9 Tree–herbaceous plant groupings according to mycorrhization frequencies of natural living roots.
The comparisons of medians applied to the IM allowed the identification of three groups (Table 10). The first group comprises I. kotschyana, V. seyal, and D. hirtum with intensity values between 29.4% and 30.7%. The second group comprises A. indica, M. denhamii, and B. gayana with intensity values between 17.8% and 18.36%. The third group comprises C. rotundus, P. chilensis, Z. glochidiata, E. tremula, E. prieuri, and B. vermiculare with intensity values between 0.2% and 10.17%. The first two groups are more homogeneous in terms of IM values, and the third group is more heterogeneous with lower IM values. The groups defined according to the FM are more heterogeneous than those defined according to the IM.
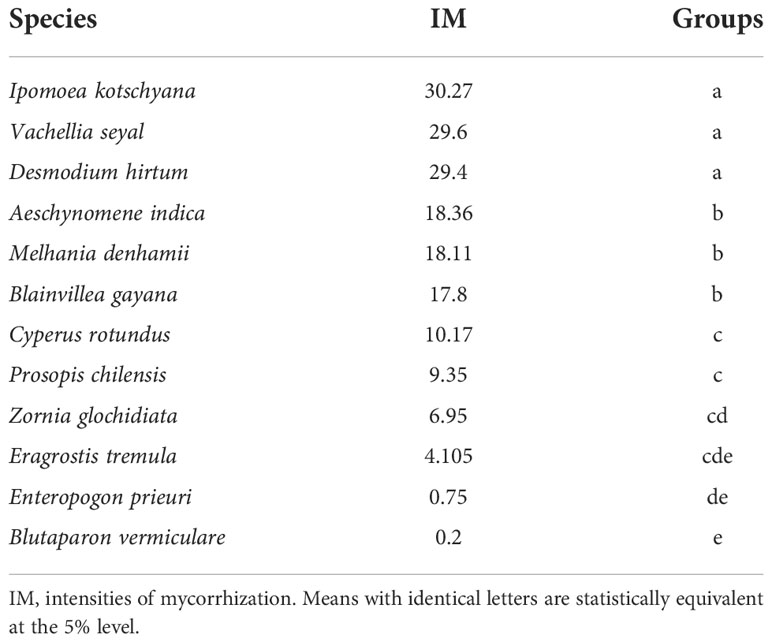
Table 10 Tree–herb grouping as a function of intensities of mycorrhization of living root.
Most probable number of AM fungi community
The results of the MPN of AMF propagules in soil capable to generate mycorrhizae are represented in Figure 10. The MPN for soils beneath the trees at distances of 0, 1.5, and 20 m from the trunks of trees did not show significant differences for each species. However, values are higher in soils beneath V. seyal than in soils beneath P. chilensis. For both V. seyal and P. chilensis species, MPN values are higher in soils 1.5 m from tree trunks.
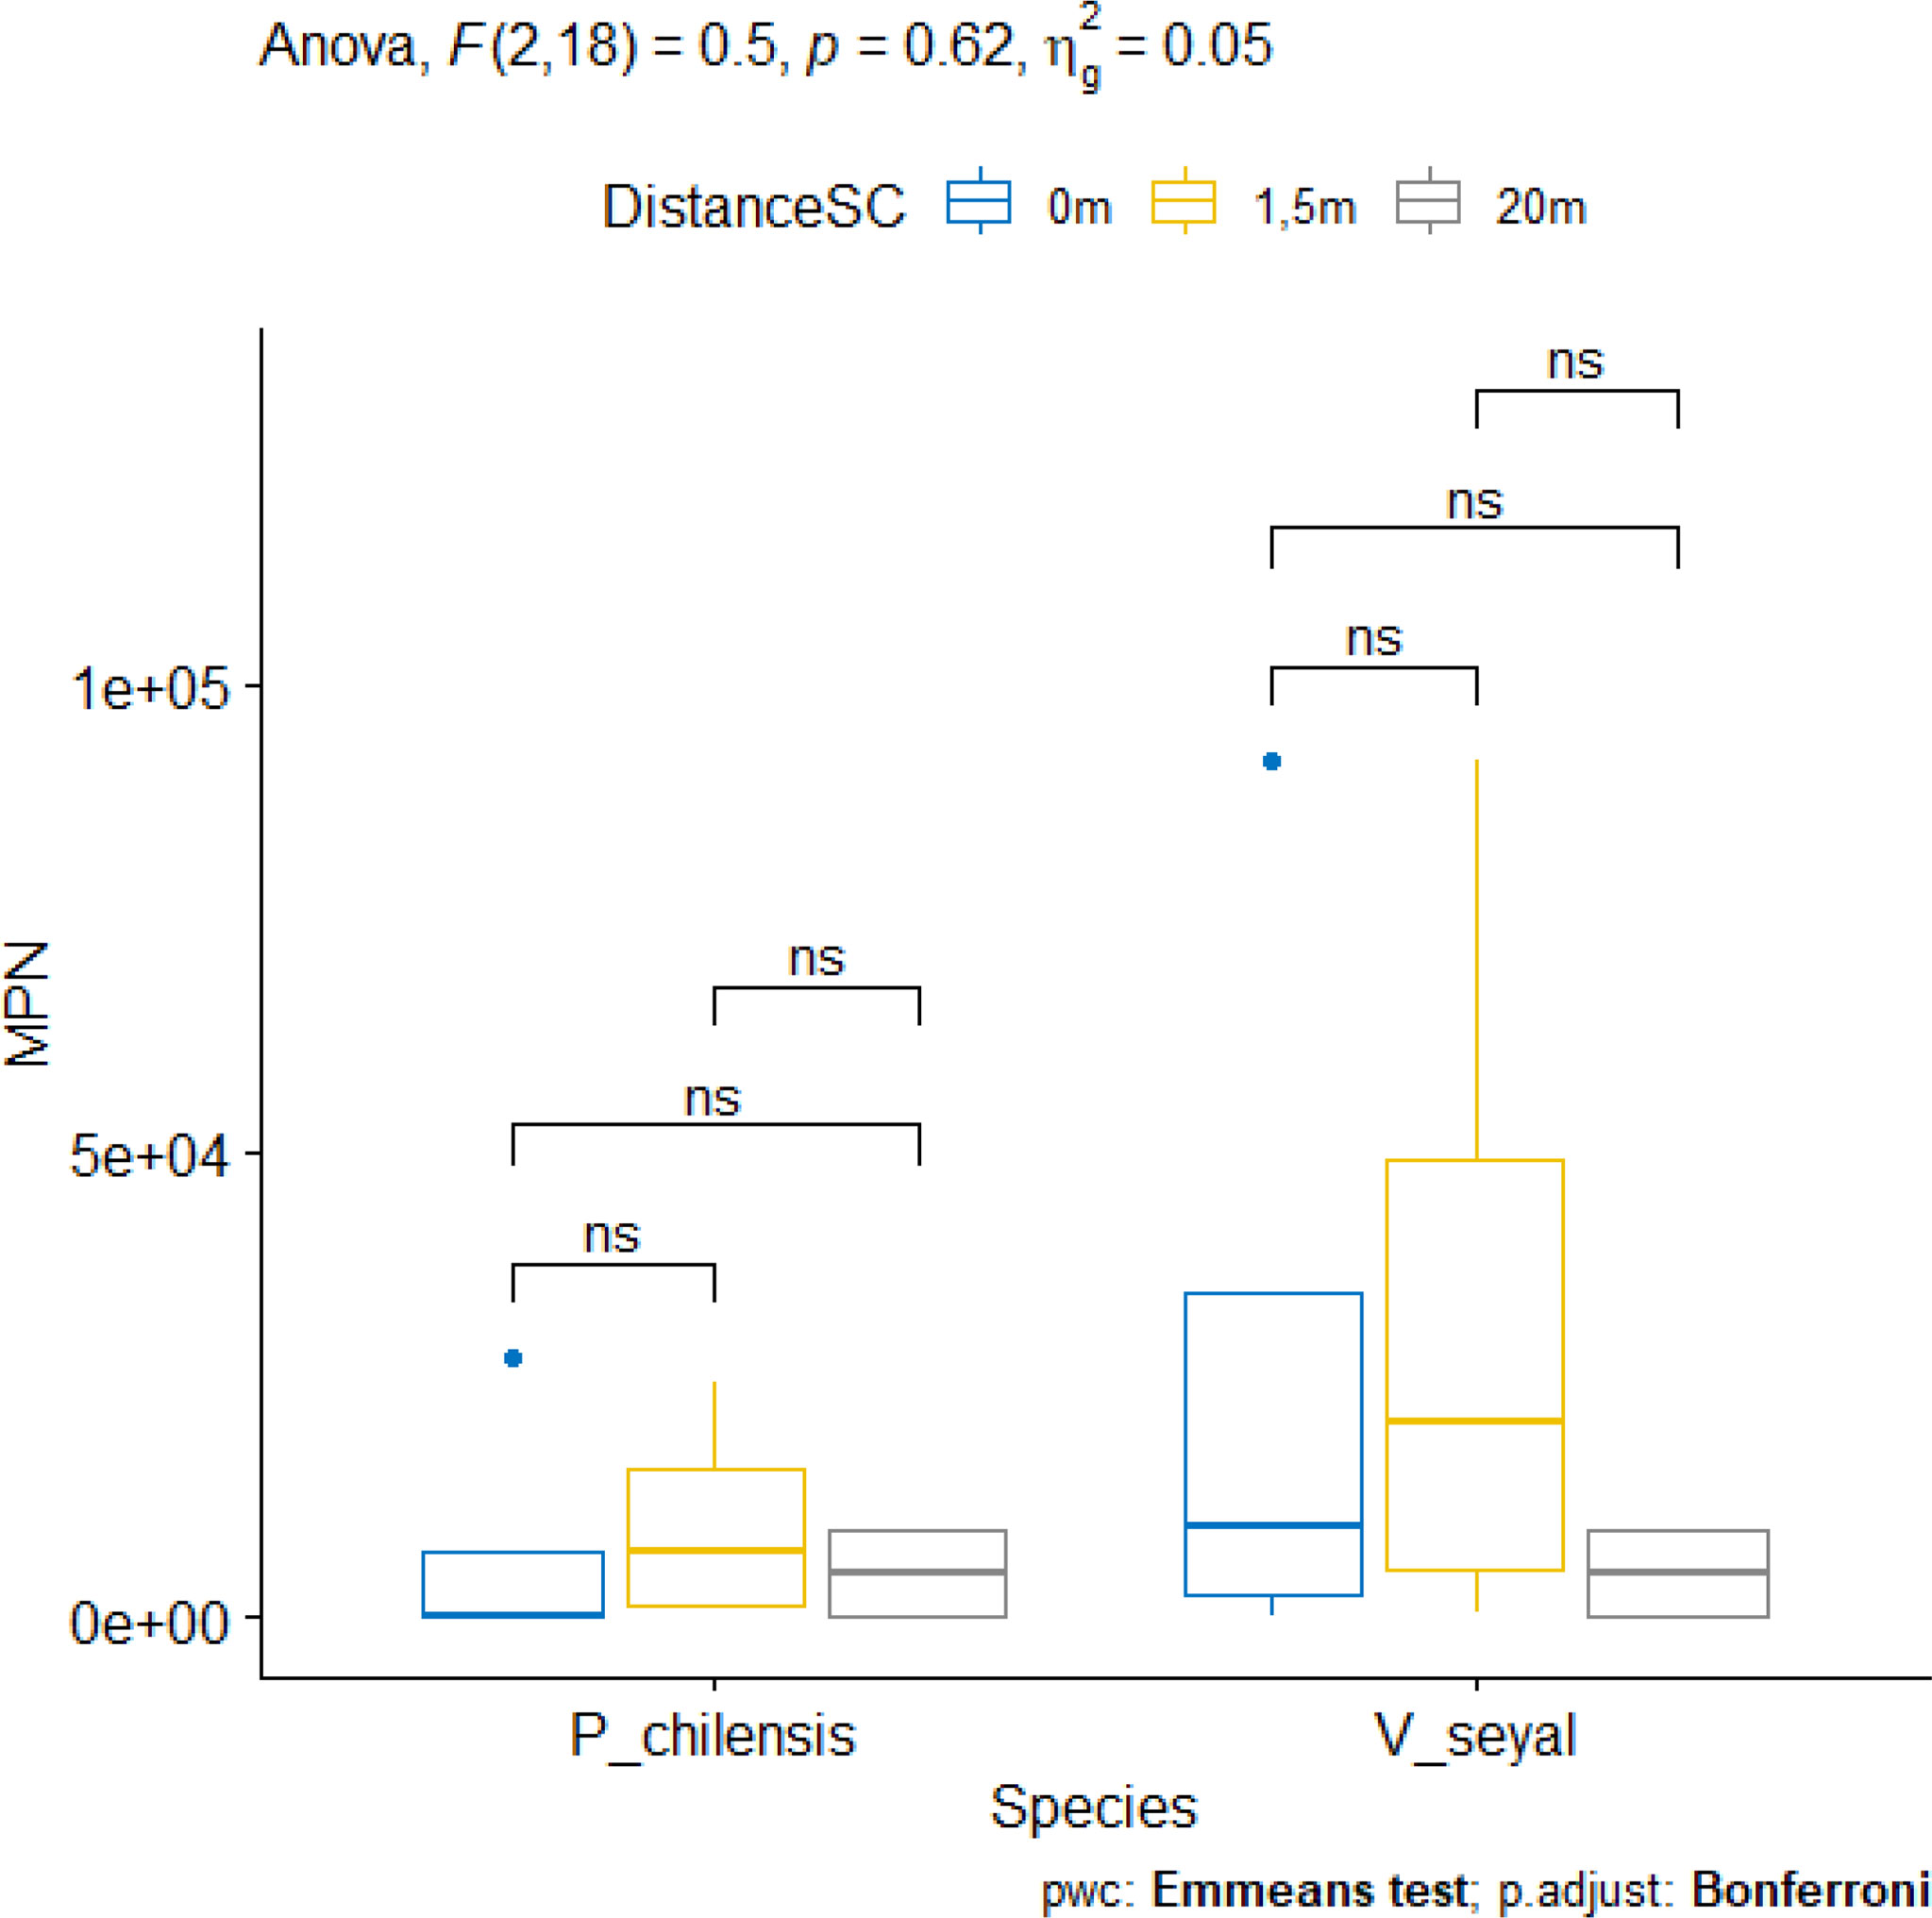
Figure 10 Most probable number (MPN) of propagules in soil beneath the trees and according to the distance from the trunk. *ns* = non-significant.
Symbiotic root colonization by AM fungi community in soil collected beneath the trees and outside of the canopies
The results of the measurement of FM and IM according to tree species are shown in Figure 11. The FM and the IM show significant differences between species (Figure 11). They are higher in the roots of plants grown on soil from beneath V. seyal than in the roots of plants grown on soil from beneath P. chilensis. The estimated FM are about 50% beneath P. chilensis but over 75% beneath V. seyal. The IM values are slightly above 10% for the roots of plants grown on soil from beneath P. chilensis and about 20% for the roots of plants grown on soil from beneath V. seyal. Compared with treatments under the trees and outside the canopies of trees (Figure 12), the FM and the IM also show significant differences. They are very significantly higher beneath the canopies of trees than outside the canopies.
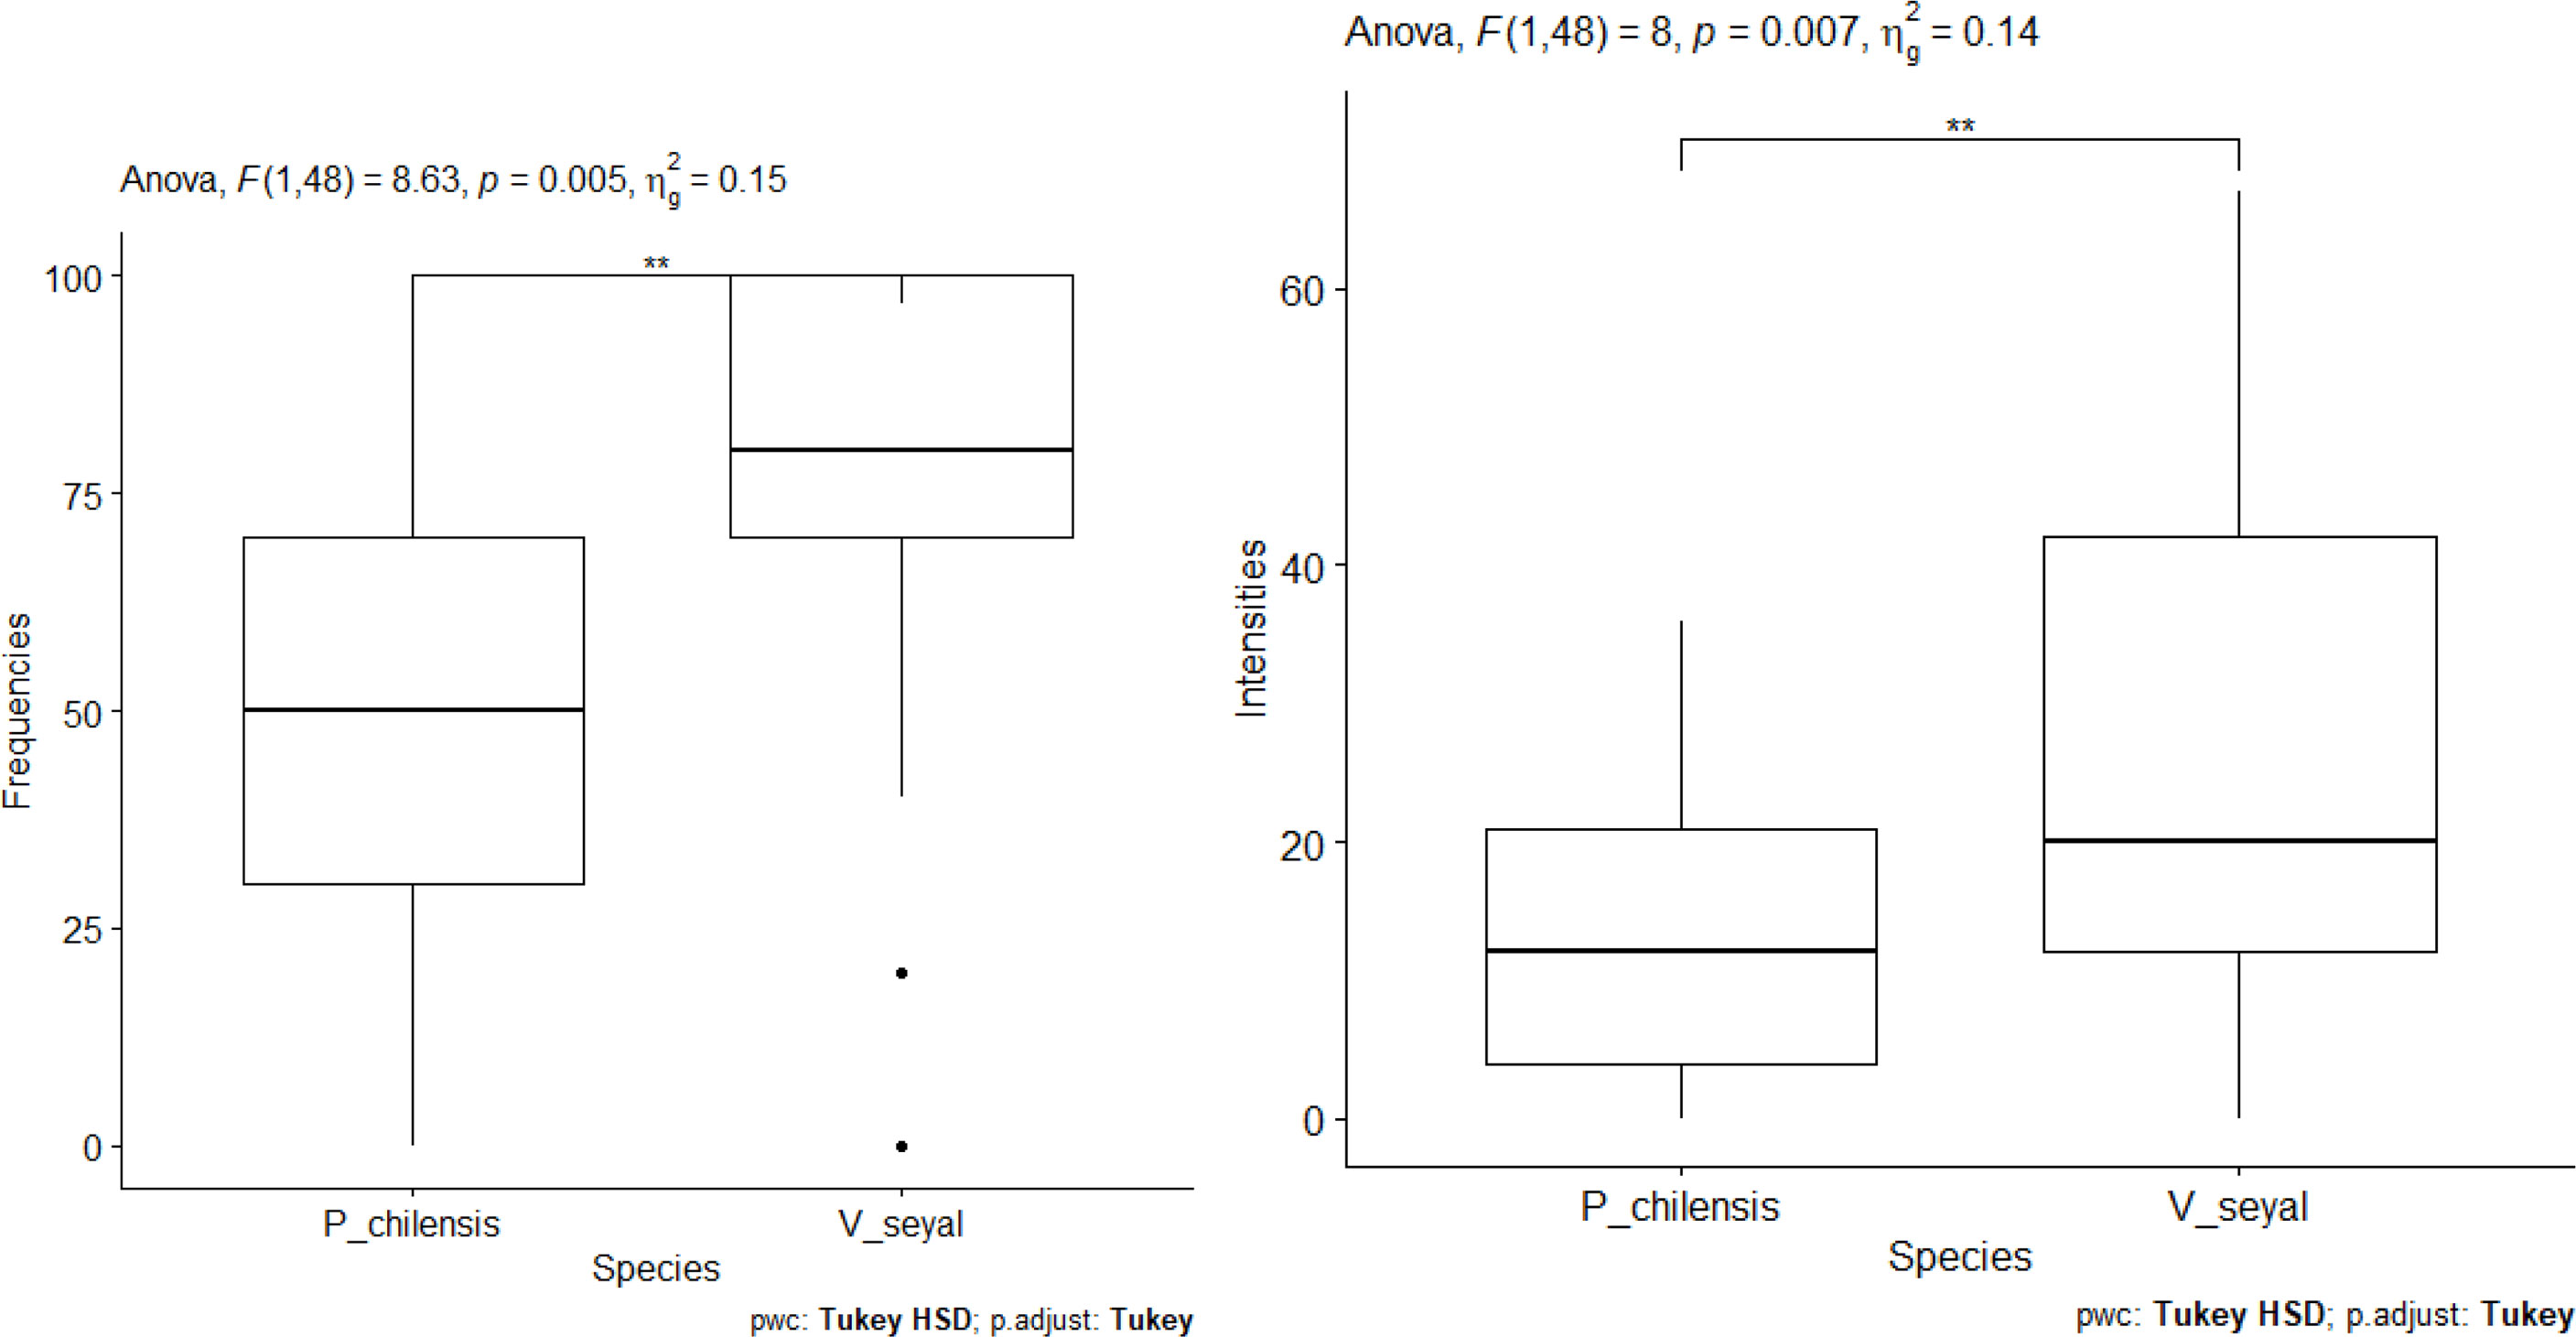
Figure 11 Frequencies of mycorrhization and intensities of mycorrhization according to tree species. "**" = Statistically significant difference at 1%.
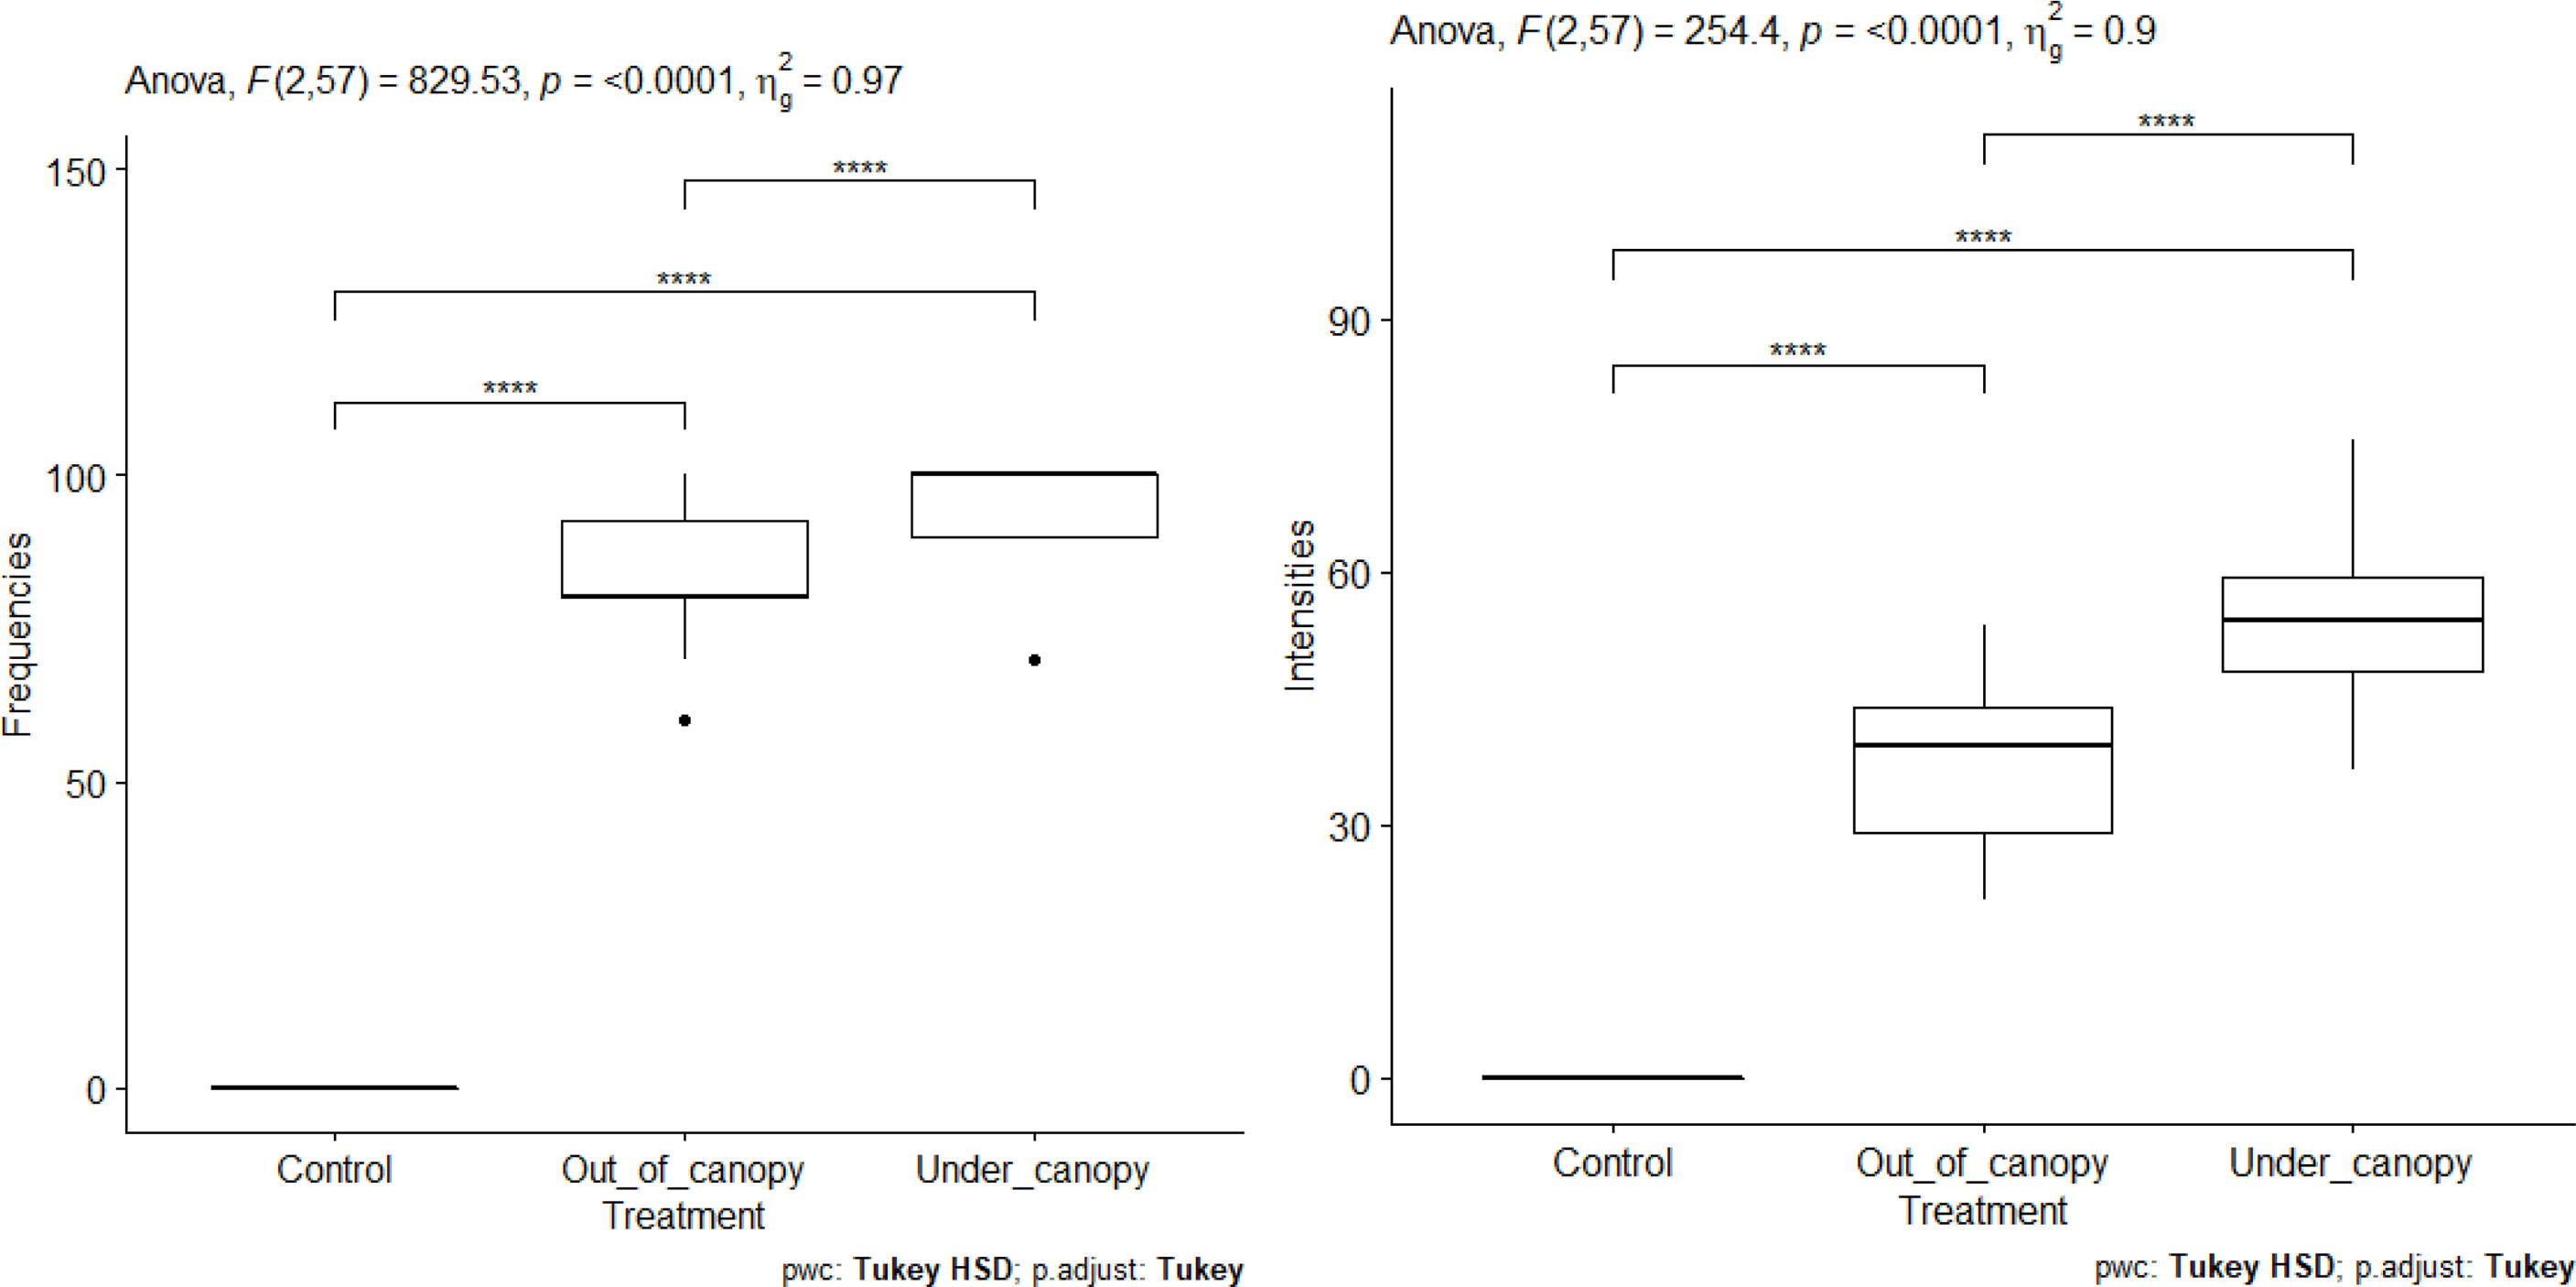
Figure 12 Frequencies of mycorrhization and intensities of mycorrhization according to treatment out of the tree canopy and under the tree canopy. "****" = Statistically significant difference 0.1%.
AM root colonization rate in the presence of organic matter
The FM (Figure 13) of roots decrease with increasing organic matter in soils beneath V. seyal and in soils beneath P. chilensis. The FM are higher in the roots of V. seyal plants than in the roots of P. chilensis plants in all percentages of OM. The FM reached 100% on the roots of V. seyal plants at 0% OM and then decreased to 94%, 82%, 82%, and 22%, respectively, in the presence of 10%, 20%, 30%, and 50% OM, respectively. For the roots of P. chilensis plants, the FM values for the same percentages of OM are 84%, 79.8%, 52%, and 30%, respectively. The increase of soil OM content from 0% to 10% does not have any effect on root FM which is higher in V. seyal roots. The increase of soil OM content from 10% to 20% does not affect the FM of V. seyal roots, but it decreases significantly the FM of P. chilensis roots.
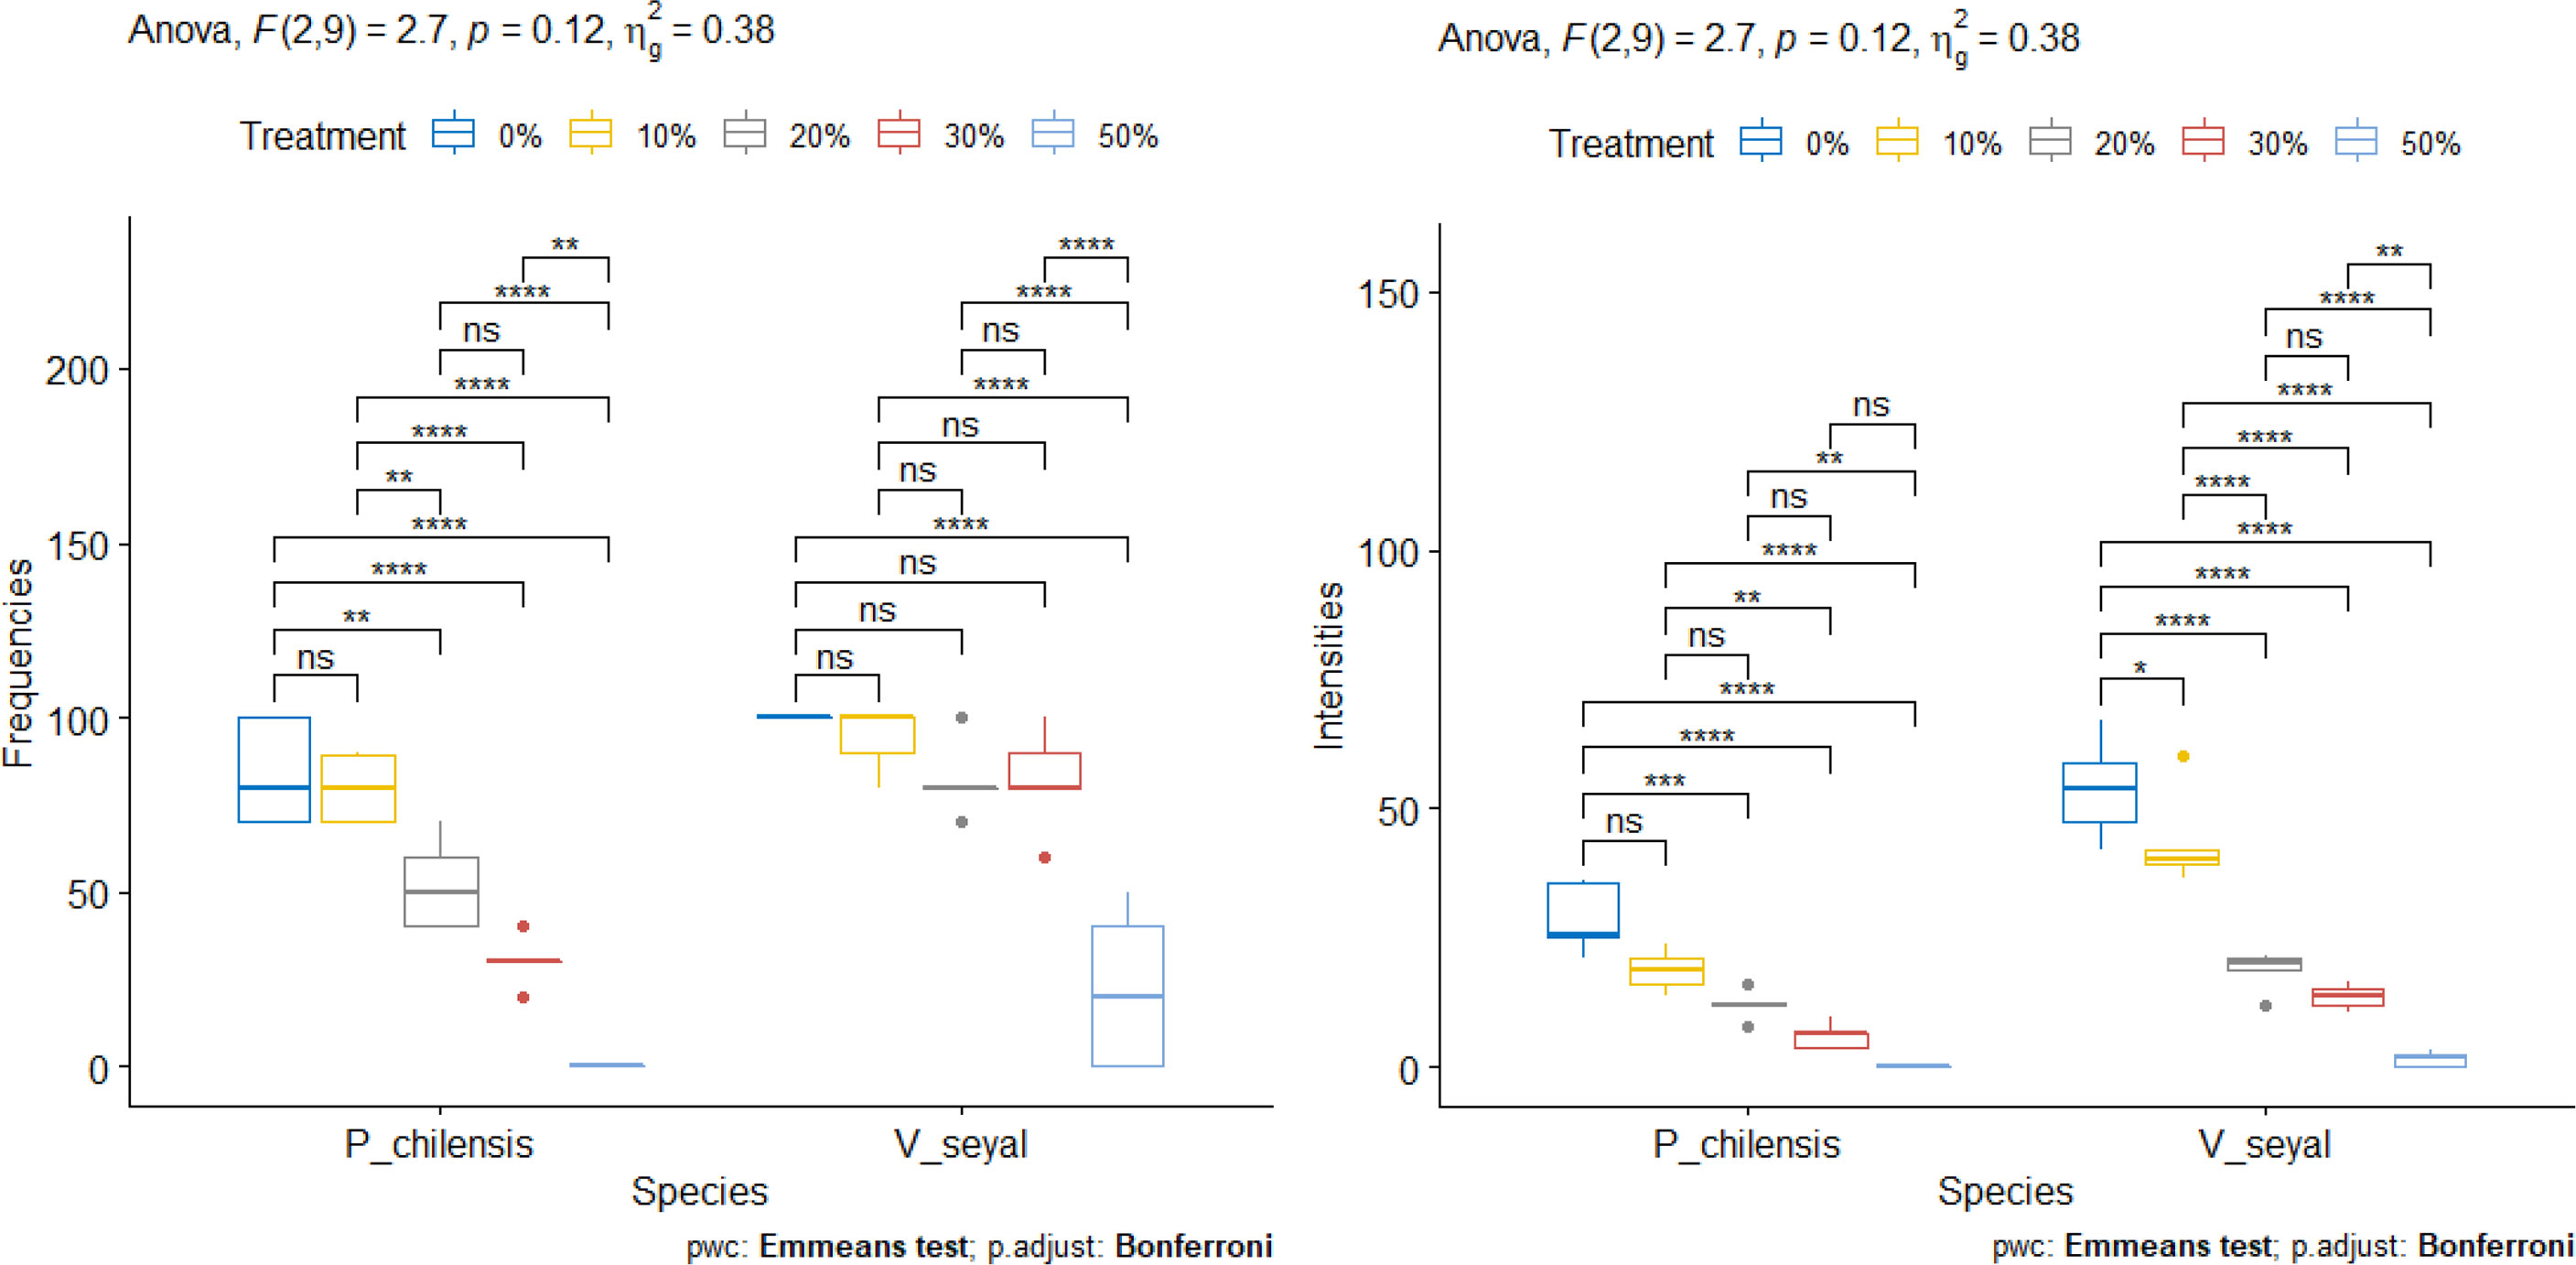
Figure 13 Frequencies of mycorrhization (FM) and intensities of mycorrhization (IM) according to the rate of organic matter. “*” = Statistically significant difference at 5%, “**” = Statistically significant difference at 1% and “***” = Statistically significant difference 0.1% and *ns* = non-significant.
For V. seyal plants, significant decreases are noted in root FM between soil OM rate 0% and 50% OM, as well as between 10% and 50%, between 20% and 50%, and between 30% and 50%. The decrease in root FM is not significant with increases in OM ranging from 0% to 30%.
For P. chilensis plants, increases in soil OM rate from 0% to 10% do not generate a significant decrease in root FM. However, the increase of soil OM content from 10% to 20% induced a significant decrease in root FM. So, no significant decrease in root FM noted with OM levels from 20% to 30% also means that it will induce a decrease in root FM. However, significant decreases in root FM are noted if there is an increase in OM rate from 0%, 10%, 20%, or 30% to 50% OM. This means that it is not recommendable to fertilize the soil with OM of P. chilensis at a rate of 50%. Increases of OM rate up to 30% result in significant decreases in root FM compared to 0% and 10% OM.
The IM values (Figure 13) of the roots of both V. seyal and P. chilensis decrease with the increase of soil OM rate. The IM values are higher in the roots of V. seyal plants than in the roots of P. chilensis plants in all percentages of OM.
For V. seyal plants, increases in OM rate in soil up to 50% decrease significantly the IM. Decreases in the IM are also observed after increases in OM rate at all levels except for the one between 20% and 30% OM.
For P. chilensis plants, increases in OM from 0% to 50%, from 10% to 50%, and from 20% to 50% resulted in significant decreases in the IM. The increases in OM rate from 0% to 10% or from 10% to 20% or from 30% to 50% do not result in significant decreases in the IM.
Discussion
The results of water pH measurements show that soils at 0 m under the trees are slightly more acidic than the soils 20 m from the trunks of trees. The pH values are approximately equal beneath V. seyal trees to beneath P. chilensis trees. Soil pH values 20 m from the trunks of trees are higher. This difference shown in soil pH could be related to a higher OM content in soil under the trees and more beneath V. seyal. OM provides litter and tends to lower soil pH, but it also plays an important role in protecting microorganisms from antimicrobial agents. According to the work of Liu et al. (2018), soil OM is strongly related to vegetation cover, and there are links between vegetation properties and soil characteristics. Similarly, the results of this work show a direct link between the presence of trees and OM resulting in higher OM levels in soils under the trees than at a distance of 20 m from the trunks of trees. OM also constitutes a reserve of carbon and nitrogen in terrestrial ecosystems (Schlesinger, 1997), which would explain higher soil carbon and nitrogen content beneath V. seyal trees. Regarding KCl pH, which expresses an acidity reserve, meaning pH values that a soil could take on in the event of a change in conditions (addition of OM, etc.), the values measured show significant differences for soils under the trees and soils 20 m from the trunks of trees. They are lower under the trees than at 20 m distance from the trunks of trees, which reflects smaller variations in pH in the event of a change in the environment but also a greater potential for solubilization of substances. The presence of trees thus has an impact on the alkaline or acidic status of the soil.
Electrical conductivity measurements showed significantly higher values (Kruskal, pV = 0.049< 0.05) for soils 20 m from the trunks of trees and soils beneath P. chilensis trees compared with soils collected beneath V. seyal trees. These results indicate higher salinity levels in soils 20 m from the trunks of trees and in soils beneath P. chilensis trees compared with soils beneath V. seyal trees. Referring to the work of Faye et al. (2019), soil 1 outside the tree canopies and soil 1 at 0 m beneath P. chilensis can be considered hypersaline as they have respective EC values of 3,200 and 2,870 S cm−1 exceeding the threshold of 2,000 S cm−1; soil 2 outside the canopies of trees and soil 2 at 0 m beneath P. chilensis are very salty as they have respective EC values of 1,690 and 1,799 S cm−1 which are within the limits between 1,000 and 2,000 S cm−1; soils 1 and 2 at 0 m beneath V. seyal are salty to slightly salty with EC values of 817 and 276 S cm−1. The presence of V. seyal trees would have a significant effect in reducing the salinity level in soils. The lower salinity levels in soils beneath V. seyal trees compared with soils beneath P. chilensis trees and uncovered soils may also explain the presence of more herbaceous plants with higher density beneath V. seyal trees than beneath P. chilensis trees and uncovered soils. The presence of V. seyal lowers the salinity level and, thus, increases the species richness of the grasses. It would then have the potential to restore the vegetation cover because soils with the same numbers have the same distance to the tans and should have similar salinity levels. If this is not the case, it means that the presence of the trees has had an effect on salinity. The EC levels recorded in the soils at 0 m beneath V. seyal correspond to values at which the herbaceous layer, the shrub layer, and the tree layer of the flora can develop. The higher salinity levels beneath P. chilensis compared with outside the canopies of trees indicate that P. chilensis concentrates salt, which may contribute to a reduction in herbaceous density beneath P. chilensis.
Soil sodium (Na+) contents (Kruskal, pV = 0.041< 0.05) varied significantly if comparing soils beneath V. seyal, soils beneath P. chilensis, and soils 20 m from the trunks of trees. Sodium levels are higher in soils collected beneath P. chilensis trees and in soils collected at a distance of 20 m from the trunks of trees. The average Na+ soil content is 1.875 meq/100 g at 20 m from the trunks of trees, 2 meq/100 g at 0 m beneath P. chilensis, and 0.825 meq/100 g at 0 m beneath V. seyal trees. Sodium contents are more than two times lower in soils beneath V. seyal trees compared with soils beneath P. chilensis trees and in soils 20 m outside the canopies of trees. These results on sodium levels confirm those on electrical conductivity showing lower salinity levels in soils beneath V. seyal trees. Furthermore, Pearson’s correlation index of 0.84 indicates that soil sodium content is strongly related to electrical conductivity. The presence of V. seyal trees would thus reduce soil Na+ content by a factor of more than 2. On the other hand, the presence of P. chilensis trees seems to increase soil sodium content. This fact also explains the greater number of herbaceous plants with a greater plant cover present beneath V. seyal trees than beneath P. chilensis trees.
Available phosphorus levels vary significantly and are higher in soils under the trees than in soils 20 m outside the canopies of trees. These higher levels of available phosphorus for soils beneath V. seyal trees reflect the effects of trees on phosphorus availability. Indeed, the presence of trees also generates the presence of herbaceous plants that associate with AMF, which solubilize phosphorus and make it available to plants. These symbiotic associations are confirmed by the results on higher mycorrhizal potentials in soils under the trees. Microorganisms decompose plant debris, thus contributing to increasing soil phosphorus levels. Zhang et al. (2016) report that increasing vegetation cover is beneficial for increasing phosphorus. Liu et al. (2018) also showed a positive correlation between vegetation cover and total soil phosphorus content. These observations are in line with the results of this study which shows higher levels of total phosphorus under the trees than at 20 m from the trunks of trees. Total phosphorus contents are higher in soils beneath P. chilensis than in soils beneath V. seyal, which could mean that the presence of V. seyal has an effect on phosphorus uptake which will result in lower total phosphorus levels under its trees. This effect would be by a factor of 1.39. When comparing total phosphorus levels under the trees, it is 1.41 times higher beneath P. chilensis than beneath V. seyal. Total phosphorus levels beneath P. chilensis are almost 2.5 times higher than under the trees. The analysis of results also shows that the presence of trees contributes to increased phosphorus levels in soils; this could be a result of the decomposition of plant litter. In saline soils, phosphate ions generally precipitate with Ca2+, Mg2+, and Zn2+ ions and, thus, become less available to plants (Azcón-Aguilar et al., 1979). Thus, in addition to the contribution of AMF in making phosphorus available, salinity levels become lower under the trees (lower electrical conductivity) and, particularly, beneath V. seyal would be more favorable for phosphorus availability in soils under the trees compared with soils 20 m outside the canopies of trees with higher EC. The acidic status of the soils is also favorable to phosphorus solubilization, and this is reflected in this study by higher levels of available phosphorus in soils under the trees, which also have lower pH. These conditions could prevent the precipitation of important ions (including phosphorus) caused by salinity (Azcón-Aguilar et al., 1979) and make them available to plants, which is essential to help alleviate stress (Cantrell and Linderman, 2001).
Analysis of the results shows that the carbon content is significantly higher in soils under the trees than at distances of 20 m from the trunks of trees. Soils beneath V. seyal, receiving OM input from deciduous leaves, contain up to 1.5 times more carbon and more than twice as much nitrogen as soils beneath P. chilensis, whose leaves are more rarely deciduous. They also contain up to more than twice as much carbon and nitrogen as soils 20 m from the trunks of trees. Exudates from the roots of P. chilensis also contribute to soil carbon content; this fact may explain the much more carbon in soils beneath P. chilensis than in soils 20 m from the trunks of trees which do not benefit as much from the presence of trees.
The C/N ratio is a good indicator of inorganic nitrogen retention (Templer et al., 2012). This is because OM deposited in soil is degraded by microorganisms. In this study, the C/N ratios below 25 mean that microorganisms release nitrogen during the decomposition of OM in the soil. The higher C/N values beneath V. seyal and out of cover correlate positively with the fact that the corresponding soils have a sandier texture and are consistent with the results of the studies of Marty et al. (2017) and Callesen et al. (2007). The C/N values of about 10 under the canopies of trees reflect microbial OM decomposition activity with an increasing rate.
Soil iron contents shows significant differences. Iron levels are higher in soils beneath P. chilensis than in soils beneath V. seyal and in soils 20 m outside the canopies of trees. They are lower in soils beneath V. seyal.
The CEC of soils shows a high correlation coefficient with the levels of carbon, nitrogen, OM, and available phosphorus with values of 0.96, 0.80, 0.97, and 0.69, respectively. The CEC of soils did not show significant differences. However, the CEC is higher under the trees than at a distance of 20 m from the trunks of trees; this reflects a higher soil fertility potential under the trees than 20 m from the trunks of trees. It is higher beneath V. seyal trees than beneath P. chilensis trees and is favorable for the availability of K+, Ca2+, and Mg2+ ions to plants in these soils because their recharge into the soil solution is better.
Regarding bulk density and moisture, statistical analyses (ANOVA, pV = 0.509 > 0.05) do not show significant differences between soils. However, the presence of AMF under the trees favors the formation of aggregates in the soil (Wright and Upadhyaya, 1998). AMF mycelia also play an important role in the formation of stable aggregates in the soil (Miller and Jastrow, 2000). In contrast, moisture is almost four times higher beneath V. seyal trees than beneath P. chilensis and 20 m from the trunks of trees; this is more favorable for maintaining the abundance and diversity of soil microflora.
The site where floristic surveys were carried out shows a floristic and ecological homogeneity. These two requirements (repetition of V. seyal and P. chilensis individuals and existence of saline stress in the area) mean that the analysis of the data should provide helpful information for the management of this ecosystem. In the previous surveys conducted, dicotyledons were more represented than monocotyledons under the trees and outside the canopies of trees. The survey similarity coefficients of 0.57 calculated between surveys beneath V. seyal and surveys beneath P. chilensis and 0.52 between each of these two above types of survey and surveys outside the canopies of trees show that they have many species in common by referring to the results of the study of de Bello et al. (2007), and therefore, a significant number of species occur in the areas where the surveys were conducted. This reflects biodiversity and that environmental conditions under the canopies of trees and outside the canopies would be similar. Species recorded could then be quite authentic to this site and would generally tolerate the main ecological factors. The main differences are in their abundance and dominance in specific locations that have particular conditions that favor the development of one or another species. Exploitation of their potential could be implemented in programs for the recovery of land affected by salinization. Under the canopies of V. seyal trees, the most frequently found herbaceous species have the same pairwise association coefficients and would be related to specific conditions under the trees. In contrast, under the canopies of P. chilensis, the association indexes between herbaceous species are variable, thus showing different preferences toward the presence of trees. The analysis of presence–absence results shows that a total of 29 species were recorded. The specific richness of species is variable depending on whether the surveys were taken under or outside the canopies of trees. The results showed that the presence of trees has a favorable effect on herbaceous vegetation, compared with control outside the canopies of trees, because it improves the species diversity. The number of species per survey is higher under the trees than outside the canopies of trees. It is higher beneath V. seyal than beneath P. chilensis. The presence of trees thus seems to have a positive influence on the number of herbaceous species present. The presence of trees provides litter that improves soil quality and availability of nutrients, favoring soil fertilization and, therefore, favorable development of grasses under the trees (Remigi et al., 2008; Diallo et al., 2013). Higher soil moisture under the trees favors the development of grasses. If we compare the structure (floristic or species richness) under the canopies of V. seyal, there are 24 genders and 25 species; under the canopies of P. chilensis, there are 19 genders and 19 species, whereas outside the canopies of trees, there are 15 genders and 16 species. These results reflect a higher diversity beneath V. seyal than beneath P. chilensis, and the lowest diversity is found outside the canopies of trees. The similarity analysis also revealed seven groups among the herbs. This abundance of herbaceous plants under the canopies of V. seyal could also be explained by the microbial potential in the rhizosphere of trees but also by a sharing of mutualistic networks such as that of AMF. These beneficial effects would favor the establishment of several species, some of which are more abundant because they grow more rapidly and have more efficient occupancy strategies.
In terms of sociability, excluding E. tremula and E. prieuri, herbaceous plants perform better beneath V. seyal trees than outside the canopies of the trees and beneath P. chilensis. Melhania denhamii and D. hirtum seem to be more associated with V. seyal. They would be elective species favored there by a selective advantage existing in the perimeter around the trunk in a radius of less than 1 m where their individuals are very abundant with high cover rates and more numerous compared with individuals of other species. This abundance under the canopies of trees is very pronounced at the perimeter within a radius of about 2 m from the trunk of trees. This pattern, which is repeated beneath all V. seyal trees in the same area of the site, may be related to a preference of these species for association with V. seyal trees. This preference could be related to a specificity of this part beneath the trees because beyond this, M. denhamii and D. hirtum are represented by few individuals at the periphery of canopies and by rare individuals outside the canopies of trees. This confirms the link between V. seyal and the presence of M. denhamii and D. hirtum. This decrease in density of M. denhamii and D. hirtum individuals is concomitant with the appearance and increase in density of E. tremula individuals at the periphery of canopies of V. seyal trees. Eragrostis tremula exhibits the highest abundance–dominance index outside the canopies of trees, whereas its individuals were not found within a radius of about 1 m around the trunks of V. seyal trees. The presence of trees would have an impact on the density of its individuals, which are more numerous outside the canopies than under the trees. Cyperus rotundus presents the highest cover under the canopies of P. chilensis. It is more closely related to P. chilensis, where it alone has the highest AD code and its individuals are scattered under the canopies of V. seyal and have a very low cover outside the canopies of trees. This result confirms a preference of C. rotundus for association with P. chilensis. Enteropogon prieuri does not seem to be strongly related to V. seyal and P. chilensis as it has one of the highest cover coefficients outside the canopies with a high AD code, but its individuals are scattered under the canopies of P. chilensis and very rare under the canopies of V. seyal. In summary, the AD codes of M. denhamii and D. hirtum decrease from the trunks of V. seyal to outside canopies, that of C. rotundus decreases from the canopies of P. chilensis to outside canopies, and those of E. tremula and E. prieuri decrease from outside canopy areas to canopy areas.
The association preferences between V. seyal, M. denhamii, and D. hirtum could be due to an AMF shared colonization network conferring an advantage. Indeed, the roots of V. seyal, M. denhamii, and D. hirtum showed quite high IM and FM around the trunk of trees, which could justify their association. Eragrostis tremula, which has a low IM and a relatively low FM, would not have benefited much from the selective advantage of the AMF shared network between V. seyal, M. denhamii, and D. hirtum. This mycorrhization advantage is less beneath P. chilensis, which has low values of IM and FM, as well as C. rotundus, which is dominant under its canopy. The other species present (I. kotschyana Hochst. ex Choisy, D. hirtum Guill. & Perr., A. indica L., B. gayana auct.), even if they have high IM and FM, have small AD codes and, therefore, would not benefit from their symbioses. In addition, the low herbaceous cover beneath P. chilensis could be due to the allopathic effect of its litter or roots. If the site is to be reforested with V. seyal, it should be combined with M. denhamii and/or, if P. chilensis is to be used, with I. kotschyana and/or C. rotundus. The mycorrhizal potential of these grasses would be a factor in the success of reforestation. The risk in these cases would be the loss of monocotyledons such as E. tremula and E. prieuri, which provide fodder for cattle, sheep, and goats in the area. Another risk associated with the use of P. chilensis is a loss of herbaceous diversity.
Estimation of MPNs of propagules capable of generating mycorrhizae shows that soils collected under the trees have a higher mycorrhizal infectivity potential. MPNs are higher in soils beneath V. seyal trees than in soils beneath P. chilensis trees. During the rainy season, a large number of herbaceous plants under the trees also contribute to increase root fragments in the soils and so increase the mycorrhizal infectivity potential. Soil MPN values decrease in soils outside the canopies of trees. This decrease may be related to the fact that soils outside the canopies of trees are predominantly occupied by the grasses E. tremula and E. prieuri which have low living root FM and IM. It is reported in the scientific literature that AMF are widely represented in saline soils (Aliasgharzadeh et al., 2001) and they can improve salt stress tolerance (Giri et al., 2007). However, salted soil can interfere with the establishment of a functional mycorrhizal symbiosis (Juniper and Abbott, 1993; Juniper and Abbott, 2006); this may justify the low values of MPN soils outside the canopies of trees. In contrast, the roots of herbaceous species such as M. denhamii, D. hirtum, I. kotschyana, and Z. glochidiata, which are predominantly present beneath V. seyal trees, and the roots of V. seyal trees have higher FM and IM and, thus, contribute significantly to increase MPN in soils under the trees. Their presence also supports the renewal of propagule stocks. The results confirm that V. seyal and P. chilensis trees form mycorrhizal symbioses with AMF. The works of Ingleby et al. (1997) in Senegal reported that 64% of Prosopis juliflora plants were colonized by AMF. Measurements of FM and IM show that the roots of P. chilensis and V. seyal plants have good mycorrhization potential.
FM and IM vary significantly between species (V. seyal or P. chilensis) when plants of these species are grown on the same soil types containing their own OM, respectively. FM and IM are significantly higher with V. seyal roots than with P. chilensis roots, respectively. The lower soil salinity beneath the trees of V. seyal could be a more favorable factor for the establishment of the AMF symbiosis than higher soil salinity beneath P. chilensis. The higher soil moisture beneath the trees of V. seyal could also be a more favorable factor compared with soils beneath P. chilensis where the salinity constraint is exerted on the AMF. When comparing FM and IM on soils under the canopies of trees and outside the canopies of trees, FM and IM are significantly higher for the roots of plants grown on soils beneath the trees.
In the presence of OM, root FM decreased for both V. seyal and P. chilensis. The roots of V. seyal plants have higher FM than those of P. chilensis regardless of the percentage of OM in the soil. In the presence of 30% OM, the FM of V. seyal roots remained high at more than 80% compared with P. chilensis roots which were at 52%. Thus, for V. seyal, leaf litter does not hinder the establishment of symbiosis with AMF, and even an OM amendment would be more favorable to plant growth. These results are in line with the work of Baar et al. (1994) and Conn and Dighton (2000) who similarly show that leaf litter extracts influence AMF growth. Increases in soil OM have a less repressive impact on V. seyal plants than on P. chilensis plants in terms of FM. The increase of soil OM content from 10% to 20% does not affect the FM of V. seyal roots, but it decreases significantly the FM of P. chilensis roots. For V. seyal roots, the increase of OM content to 50% induces a significant decrease of FM. However, a 30% increase in OM could be beneficial as it does not interfere with mycorrhization.
For P. chilensis, a low increase in soil OM content from 0% up to 10% does not induce a decrease on root FM. However, an increase of soil OM content from 10% to 20% decreases significantly the root FM. So, no significant decrease in root FM noted with OM levels from 20% to 30% also means that 30% of OM will induce a decrease of root FM as well as a 50% increase of soil OM content decreased significantly the root FM. The IM of the roots of both V. seyal and P. chilensis decrease if the soil OM content increases in all percentages of OM. IM are still higher for the roots of V. seyal than the roots of P. chilensis for all percentages of OM. For V. seyal, the increase in all percentages of OM induced decreases in IM except from 20% to 30%. The highest IM are for 10% of OM that allows 43.8% of IM. For P. chilensis, an increase from 10% or 20% up to 30% in OM reduced significantly the IM, but a gradual increase of 10% from each level did not induce a significant decrease of IM. FM exceed 90% in soils at 0 m under the canopies of trees. The IM reached 48% and 57%, respectively, in the soils beneath the trees of V. seyal and the trees of P. chilensis. FM and IM are higher in the roots of plants grown on soil 0 m under the trees than in the roots of plants grown on soil 20 m outside the canopies of trees. So, the presence of trees enhances the mycorrhizal potential of soils, and this confirms the results showing higher MPN values for soils from plant rhizospheres. These AMF beneath V. seyal may be recommended in programs to rehabilitate the mycorrhizal potential of these saline soils. These autochthonous strains could be very effective in terms of colonization rate and symbiotic efficiency compared with collection strains as shown in the work of Estrada et al. (Estrada et al., 2013b; Estrada et al., 2013a). It is known that the existence of stressful conditions encourages plants to establish mycorrhizal symbiosis. If the roots of plants grown in soil 20 m from the trunks of trees have lower FM and IM values, this means that AMF are not abundant outside the canopies of trees. This low mycorrhizal potential of soils outside the canopies of trees may be related to the higher salinity levels at these locations as confirmed by the EC and Na+ content values. The mycorrhizal potentials of soils then decrease from the trunks of trees to the uncovered area.
Natural living roots collected from herbaceous plants and trees in the site show a diversity of mycorrhization potential. The IM and the FM of herbs are improved beneath V. seyal, concordant with the density and diversity of herbaceous species under V. seyal, but this is not the same case beneath P. chilensis where there is no abundance and diversity of herbaceous species. The IM and the FM of the most overgrown herbaceous species are enhanced at the expense of the other species under V. seyal. Non-parametric median comparison tests applied to the FM and the IM allowed, in both cases, to identify groups. With the FM, two groups were defined. In the first group, the herbaceous species D. hirtum, B. gayana, I. kotschyana, A. indica, C. rotundus, and M. denhamii were identified with FM that are greater than or equal to 70%; they are all associated with V. seyal except for B. gayana. The second group consists of E. tremula, Z. glochidiata, E. prieuri, and B. vermiculare with FM greater than or equal to 40% and are associated with P. chilensis.
Three groups were defined with the comparisons of the median of IM. The first group contains I. kotschyana and D. hirtum with IM values between 29.4% and 30.7% and which are associated with V. seyal. These two herbaceous plants have a good contribution to the mycorrhizal potential of soils beneath V. seyal considering their natural FM and IM. The second group consists of A. indica, M. denhamii, and Blainvillea gayana with intensity values between 17.8% and 18.36%. The third group consists of C. rotundus, Z. glochidiata, E. tremula, E. prieuri, and B. vermiculare with IM values between 0.2% and 10.17% and is associated with P. chilensis.
The first two groups are more homogeneous in terms of IM values and the third group is more heterogeneous with lower IM values. Groups defined according to FM are more heterogeneous than groups defined according to IM. The higher natural living root mycorrhization rates of V. seyal compared with P. chilensis may also be a consequence of a higher number of plant-parasitic nematodes (results not shown here) beneath P. chilensis trees competing with AMF in root colonization. This has already been reported in scientific literature. Yang et al. (2014) reported the negative effects of nematodes on mycorrhizal colonization. Borowicz (2001) also reported that interactions of plant-parasitic nematodes with AMF affect plant health as they share the same roots of their host plants and can then be directly affected by competition with each other or indirectly by physiological and chemical changes in the plant. Similarly, plants infected with plant-parasitic nematodes are exposed to physiological and biochemical changes that can affect their interactions with AMF (Frew et al., 2018). These plant-parasitic nematodes are ubiquitous and represent an important component of ecological functioning (Kardol et al., 2010).
Conclusion
The presence of V. seyal reduces salinity levels as shown by soil electrical conductivity and soil sodium content. It also improves soil fertility and mycorrhizal potential and increases herbaceous diversity, species richness, and density of individual herbs. These improvements decrease in the soils if the distance to the trunks of trees increases. The presence of P. chilensis increases soil salinity levels and reduces the density of herbaceous individuals. Results showed that salinity levels, indicated by electrical conductivity and Na+ content, were lower in soils beneath V. seyal than in soils beneath P. chilensis and in soil 20 m from the trunks of trees. Soil fertility parameters such as carbon, nitrogen, organic matter, available phosphorus, total phosphorus, potassium, calcium, and cation exchange capacity are higher in soils under the trees compared with uncovered soils. They are higher beneath V. seyal. These levels decrease in the soils if the distance to the trunks of trees increases.
The presence of trees has a positive impact on the number and diversity of herbaceous plants. Herbaceous species’ richness is higher under the trees than outside the canopies of trees and is higher beneath V. seyal than beneath P. chilensis. Herbaceous species’ diversity decreases with increasing distance from the trunks of trees. Dicotyledonous plants are more represented than monocotyledonous plants. The high density of M. denhamii individuals around the trunks of V. seyal decreases outside the canopies of trees. The density of E. prieuri and E. tremula is very low under the trees but increases in soil outside the canopies. One species, S. obtusifolia, was only found outside the canopies of trees. The species A. indica, P. dilatatum, W. indica, L. senegalense, and B. ramosa were only found under the trees and seem to be maintained because of the presence of tree species.
Soil mycorrhizal potentials are highest under the trees and decrease outside the canopies of trees. They are higher beneath V. seyal. AMF most probable numbers are higher in soils beneath V. seyal than in soils beneath P. chilensis. They are much higher in soils at 0 m compared with soils 20 m from the trunks of trees. They are very low in soils outside the canopies of trees. Mycorrhization rates (FM and IM) decrease when soil OM content increases. Vachellia seyal roots had higher mycorrhization rates than P. chilensis roots in all tested levels of OM. The average IM values of herbaceous natural living roots taken directly from outside the canopies of trees and under the trees are almost equal. However, FM values are higher under the trees and are roughly equal under both canopies of trees. The average mycorrhization rates of herbaceous plants that have the highest indexes of cover are higher beneath V. seyal and decrease outside the canopies of trees. They are almost equal beneath P. chilensis and outside the canopies of trees. The natural living root FM for herbaceous plants and trees present two distinct groups: one group with values greater than or equal to 70%, including V. seyal, and one group with values less than or equal to 40%, including P. chilensis. The IM values present three groups: one group with IM between 29.4% and 30.7%, a second group with IM between 17.8% and 18.36%, and a third group with IM between 0.2% and 10.17%. Our results indicate that V. seyal is a good species for the reclamation of saline lands.
Data availability statement
The original contributions presented in the study are included in the article/supplementary material. Further inquiries can be directed to the corresponding authors.
Author contributions
Mansour THIAO is the main author of the article, he designed and set up all the experiments. He followed the experiments, collected and analyzed the data and wrote the first manuscript. He also wrote the final paper integrating the suggestions of the other authors. Godar SENE and Moustapha NDIAYE contributed to the soil sampling and phytosociological studies during the phtytosociological surveys, the identification of species, the estimation of abundance-dominance coefficients, the collection of roots in situ and the transport of samples. Godar SENE contributed to the design of some of the experiments on soil microbial potential. He also contributed to the formatting of the manuscript. El Hadji Samba Ndao SYLLA supervised and followed the different steps of the design of the experiments and corrected the versions of the manuscript. All authors listed have made a substantial, direct, and intellectual contribution to the work and approved it for publication.
Funding
Projzt FIRST 2013 Mansour THIAO, Financing of research projects by the scientific and technical research impulse fund of the Ministry of Higher Education, Research and Innovation of Senegal
Acknowledgments
The authors thank the University Cheikh Anta Diop of Dakar and the Senegalese Ministry of Higher Education, Research and Innovation for funding parts of this work. Our gratitude also goes to Ousseynou Gueye, Cheikh Ndiaye, and Mathieu Ndigue Faye for their technical help and support.
Conflict of interest
The authors declare that the research was conducted in the absence of any commercial or financial relationships that could be construed as a potential conflict of interest.
Publisher’s note
All claims expressed in this article are solely those of the authors and do not necessarily represent those of their affiliated organizations, or those of the publisher, the editors and the reviewers. Any product that may be evaluated in this article, or claim that may be made by its manufacturer, is not guaranteed or endorsed by the publisher.
References
Abdelilah, M., Mohamed, A. E. M., Said, W., Ali, B. (2017). Évaluation des potentialités mycorhizogènes en lien avec les paramètres physico-chimiques des sols de palmeraies du maroc (Marrakech et tafilalet). Cah. Agric. 26, (45012) 1–7. doi: 10.1051/cagri/2017044
Aliasgharzadeh, N., Rastin, S. N., Towfighi, H., Alizadeh, A. (2001). Occurrence of arbuscular mycorrhizal fungi in saline soils of the tabriz plain of Iran in relation to some physical and chemical properties of soil. Mycorrhiza 11, 119–122. doi: 10.1007/s005720100113
Aroca, R., Ruiz-Lozano, J. M., Zamarreñob, A. M., Paza, J. A., Garcia-Minab, J. M., Pozoa, ,. M. J., et al. (2013). Arbuscular mycorrhizal symbiosis influences strigolactone production under salinity and alleviates salt stress in lettuce plants. J. Plant Physiol. 170, 47–55. doi: 10.1016/j.jplph.2012.08.020
Azcón-Aguilar, C., Azcón, R., Barea, J. M. (1979). Endomycorrhizal fungi and rhizobium as biological fertilizers for Medicago sativa in normal cultivation. Nature 279, 325–327. doi: 10.1038/279325a0
Baar, J., Ozinga, W. A., Sweers, I. L., Kuyper, T. W. (1994). Stimulatory and inhibitory effects of needle litter and grass extracts on the growth of some ectomycorrhizal fungi. Soil Biol. Biochem. 26, 1073–1079. doi: 10.1016/0038-0717(94)90123-6
Bassène, C. (2008). “Hyptis suaveolens l. poit. LAMIACEAE) dans les systèmes agropastoraux de la communauté rurale de mlomp : étude de quelques aspects de la biologie et proposition de méthodes de contrôle,” in Mémoire de DEA (Université Cheikh Anta Diop: Faculté des Sciences et Techniques) 89p.
Berhaut, J. (1971). Flore illustrée du sénégal, dicotylédones : tome 1 (Acanthacées à Avicenniacées. Dakar: Ministère du Développement Rural), 626p. Illustrations Geog, 5.
Borowicz, V. A. (2001). Do arbuscular mycorrhizal fungi alter plant-pathogen relations? Ecology 82, 3057–3068. doi: 10.1890/0012-9658(2001)082[3057:DAMFAP]2.0.CO;2
Callesen, I., Raulund-Rasmussen, K., Westman, C. J., Tau-Strand, L. (2007). Nitrogen pools and C/N ratios in well-drained nordic forest soils related to climate and soil texture. Boreal Environ. Res. 12 (6), 681–692.
Cantrell, I. C., Linderman, R. G. (2001). Preinoculation of lettuce and onion with VA mycorrhizal fungi reduces deleterious effects of soil salinity. Plant Soil 233, 269–281. doi: 10.1023/A:1010564013601
Cochran, W. G. (1950). Estimation of bacterial densities by means of the "most probable number". Biometrics 6, 105–116. doi: 10.2307/3001491
Conn, C., Dighton, J. (2000). Litter quality influences on decomposition, ectomycorrhizal community structure and mycorrhizal root surface acid phosphatase activity. Soil Biol. Biochem. 32, 489–496. doi: 10.1016/S0038-0717(99)00178-9
de Bello, F., Lepš, J., Sebastià, M. T. (2007). Grazing effects on the species-area relationship: Variation along a climatic gradient in NE Spain. J. Veg. Sci. 18, 25–34. doi: 10.1111/j.1654-1103.2007.tb02512.x
Diallo, A., Agbangba, E. C., Ndiaye, O., Guisse, A. (2013). Ecological structure and prediction equations for estimating tree age, and dendometric parameters of acacia senegal in the Senegalese semi-arid zone-ferlo. Am. J. Plant Sci. 4, 1046. doi: 10.4236/ajps.2013.45129
Estrada, B., Aroca, R., Barea, J. M., Ruiz-Lozano, J. M. (2013b). Native arbuscular mycorrhizal fungi isolated from a saline habitat improved maize antioxidant systems and plant tolerance to salinity. Plant Sci. 201, 202 42–202 51. doi: 10.1016/j.plantsci.2012.11.009
Estrada, B., Aroca, R., Maathuis, F. J. M., Barea, J. M., Ruiz-lozano, J. M. (2013a). Arbuscular mycorrhizal fungi native from a Mediterranean saline area enhance maize tolerance to salinity through improved ion homeostasis. Plant Cell Environ. 36, 1771–1782. doi: 10.1111/pce.12082
Evelin, H., Kapoor, R., Giri, B. (2009). Arbuscular mycorrhizal fungi in alleviation of salt stress: A review. Ann. Bot. 104, 1263–1280. doi: 10.1093/aob/mcp251
Fall, D. (2016). Contribution à l’amélioration de la tolérance à la salinité de Senegalia senegal (L.) britton, vachellia seyal (Delile) p. hurter et Prosopis juliflora (Swartz) DC par inoculation microbienne et apport de coques d’arachide. Thèse Doctorat unique UCAD. p, 175.
Faye, B., Tine, D., Ndiaye, D., Diop, C., Faye, G., et Ndiaye, A. (2019). Évolution des terres salées dans le nord de l’estuaire du saloum (Sénégal). Géomorphol.: relief processus environnement vol.25 - n°2, 81–90. doi: 10.4000/geomorphologie.13125
Frew, A., Powell, J. R., Gaétan, G., Alison, E. B., Scott, N. J. (2018). Mycorrhizal fungi enhance nutrient uptake but disarm defences in plant roots, promoting plant-parasitic nematode populations. Soil Biol. Biochem. 126, 123–132. doi: 10.1016/j.soilbio.2018.08.019
Gillet, F. (2000). La phytosociologie synusiale intégrée guide méthodologique (Institut de Botanique, Doc Labo Ecol Vég, 1: Université de Neuchâtel).
Giri, B., Kapoor, R., Mukerji, K. G. (2007). Improved tolerance of Acacia nilotica to salt stress by arbuscular mycorrhiza Glomus fasciculatum may be partly related to elevated K/Na ratios in root and shoot tissues. Microb. Ecol. 54, 753–760. doi: 10.1007/s00248-007-9239-9
He, Z., He, C., Zhang, Z., Zou, Z., Wang, H. (2007). Changes of antioxidative enzymes and cell membrane osmosis in tomato colonized by arbuscular mycorrhizae under NaCl stress. Colloids Surf. B: Biointerface 59, 128–133. doi: 10.1016/j.colsurfb.2007.04.023
Ingleby, K., Diagne, O., Deans, J. D., Lindley, D. K., Neyra, M., Ducousso, M. (1997). Distribution of roots, arbuscular mycorrhizal colonization and spores around fast-growing tree species in Senegal. For. Ecol. Manage. 90, 19–27. doi: 10.1016/S0378-1127(96)03875-3
Juniper, S., Abbott, L. K. (1993). Vesicular-arbuscular mycorrhizas and soil salinity. Mycorrhiza 4, 45–57. doi: 10.1007/BF00204058
Juniper, S., Abbott, L. K. (2006). Soil salinity delays germination and limits growth of hyphae from propagules of arbuscular mycorrhizal fungi. Mycorrhiza 16, 371–379. doi: 10.1007/s00572-006-0046-9
Kardol, P., Cregger, M. A., Campany, C. E., Classen, A. T. (2010) Soil ecosystem functioning under climate change: plant species and community effects. Ecol. 91, 767–781. doi: 10.1890/09-0135.1
Liu, S., Hou, X., Yang, M., Cheng, F., Coxixo, A., Wu, X., et al. (2018). Factors driving the relationships between vegetation and soil properties in the yellow river delta, China. Catena 165, 279–285. doi: 10.1016/j.catena.2018.02.004
Marty, C., Houle, D., Gagnona, C., Courchesne, F. (2017). The relationships of soil total nitrogen concentrations, pools and C/N ratios with climate, vegetation types and nitrate deposition in temperate and boreal forests of eastern Canada. Catena 152, 163–172. doi: 10.1016/j.catena.2017.01.014
Miller, R. M., Jastrow, J. D. (2000). “Mycorrhizal fungi influence soil structure,” in Y. Kapulnik and D. D. Douds jr. (Eds.), Arbuscular Mycorrhizas: Physiology and functions, (pp. 3–18). (Dordrecht: Kluwer Academic). doi: 10.1007/978-94-017-0776-3_1
Ngom, A., Mbaye, M. S., Barnaud, A., Kane, A., Ba, N., Gueye, M., et al. (2016). Révision du genre digitaria haller (Poaceae) au sénégal : proposition d’une clé de détermination pour une meilleure identification des espèces. Int. J. Biol. Chem. Sci. 10, 58–86. doi: 10.4314/ijbcs.v10i1.6
Noba, K. (2002). “La flore adventice dans le sud du bassin arachidier (Sénégal) : structure, dynamique et impact sur la production du mil et de l’arachide,” in Thèse de doctorat d’Etat de biologie végétale (FST, UCAD, Dakar: Option Malherbologie).
Noba, K., Ba, A. T. (1992). Réexamen de la systématique de 3 espèces du genre boerhavia L.(Nyctaginaceae). Webbia 46, 327–339. doi: 10.1080/00837792.1992.10670527
Noba, K., Ba, A. T., Caussanel, J. P., Mbaye, M. S., et Barralis, G. (2004). Flore adventice des cultures vivrières dans le sud du bassin arachidier (Sénégal). Webbia 59, 293–308. doi: 10.1080/00837792.2004.10670774
Phillips, J. M., Hayman, D. S. (1970). Improved procedures for clearing roots and staining parasitic and vesicular-arbuscular mycorrhizal fungi for rapid assessment of infection. Trans. Br. Mycol. Soc 55, 158–161. doi: 10.1016/S0007-1536(70)80110-3
Plenchette, C., Perrin, R., Duvert, P. (1989). The concept of soil infectivity and a method for its determination as applied to endomycorrhizas. Can. J. Bot. 67, 112–115. doi: 10.1139/b89-016
Remigi, P., Faye, A., Kane, A., Deruaz, M., Thioulouse, J., Cissoko, M., et al. (2008). The exotic legume tree species acacia holosericea alters microbial soil functionalities and the structure of the arbuscular mycorrhizal community. Appl. Environ. Microbiol. 74, 1485–1493. doi: 10.1128/AEM.02427-07
Sarr, R. S., Mbaye, M. S., et Ba, A. T. (2007). La flore adventice des cultures d’oignon dans la zone péri-urbaine de Dakar (Niayes) sénégal. Webbia 62, 205–216. doi: 10.1080/00837792.2007.10670823
Schlesinger, W. H. (1997). Biogeochemistry: An analysis of global change (San Diego, California, USA: Academic Press).
Sène, G. (2012). Impacts de plantations monospécifiques d’essences forestières exotiques et d’essences forestières autochtones sur l’abondance et la diversité de la microflore symbiotique (rhizobiums et champignons mycorhiziens) sous-jacente et les caractéristiques physicochimiques du sol en zone sahélienne. Thèse Doctorat unique UCAD, 221.
Sieverding, E. (1991). Vesicular-arbuscular mycorrhiza management in tropical agrosystems. GTZ Germany, 371.
Templer, P. H., Mack, M. C., Chapin, F. S., Christenson, L. M., Compton, J. E., Crook, H. D., et al. (2012). Sinks for nitrogen inputs in terrestrial ecosystems: A meta-analysis of 15N tracer field studies. Ecology 93, 1816–1829. doi: 10.1890/11-1146.1
Trouvelot, A., Kough, J. L., et Gianinazzi-Pearson, V. (1986). “Mesure du taux de mycorhization VA d’un système radiculaire. recherche de méthods d’estimation ayant une signification fonctionnelle,” in Physiology and genetics aspects of mycorrhizae. Eds. Gianinazi-Pearson, V., Gianinazzi, S. (Paris: INRA), 217–221.
van der Heijden, M. G. A., Boller, T., Wiemken, A., Sanders, I. R. (1998). Different arbuscular mycorrhizal fungal species are potential determinants of plant community structure. Ecology 79, 2082–2091. doi: 10.1890/0012-9658(1998)079[2082:DAMFSA]2.0.CO;2
Wang, Y. Y., Westberg, M., Walker, C., Hurme, T., Zhang, X., Lindström, K. (2008). Diversity and infectivity of arbuscular mycorrhizal fungi in agricultural soils of the sichuan province of mainland China. Mycorrhiza 18 (2), 59–68. doi: 10.1007/s00572-008-0161-x
Wright, S., Upadhyaya, A. (1998). A survey of soils for aggregate stability and glomalin, a glycoprotein produced by hyphae of arbuscular mycorrhizal fungi. Plant Soil 198, 97–107. doi: 10.1023/A:1004347701584
Yang, S. J., Zhang, Z. L., Xue, Y. X., Zhang, Z. F., Shi, S. Y. (2014). Arbuscular mycorrhizal fungi increase salt tolerance of apple seedlings. Bot. Stud. 55, 70–77. doi: 10.1186/s40529-014-0070-6
Keywords: Vachellia seyal, Prosopis chilensis, herbaceous, arbuscular mycorrhizal fungi, salinity, soil fertility
Citation: Thiao M, Sene G, Ndiaye M and Sylla EHSN (2022) Assessment of the potential of Vachellia seyal and Prosopis chilensis for the reclamation of saline soil lands in the peanut basin production of Senegal. Front. Plant Sci. 13:1001895. doi: 10.3389/fpls.2022.1001895
Received: 24 July 2022; Accepted: 10 November 2022;
Published: 09 December 2022.
Edited by:
Mohamed Hijri, Université de Montréal, CanadaReviewed by:
Jean Legeay, Mohammed VI Polytechnic University, MoroccoEes Ahmad, National Bureau of Agriculturally Important Microorganisms (ICAR), India
Copyright © 2022 Thiao, Sene, Ndiaye and Sylla. This is an open-access article distributed under the terms of the Creative Commons Attribution License (CC BY). The use, distribution or reproduction in other forums is permitted, provided the original author(s) and the copyright owner(s) are credited and that the original publication in this journal is cited, in accordance with accepted academic practice. No use, distribution or reproduction is permitted which does not comply with these terms.
*Correspondence: Mansour Thiao, bWFuc291ci50aGlhb0B1Y2FkLmVkdS5zbg==; Godar Sene, Z29kYXIuc2VuZUB1Y2FkLmVkdS5zbg==