 Zenglian Qi1
 Yuanjie Dong
- 1College of Resources and Environment, Shandong Agricultural University, Taian, China
- 2Agronomy College, Shandong Agricultural University, Taian, China
Coated, slow/controlled release, or stabilized enhanced-efficiency nitrogen fertilizers (EENFs) are effective in improving nitrogen utilization efficiency (NUE) and crop yield. Better performance is expected from coated, stabilized EENFs where urease and nitrification inhibitors are treated in coated fertilizers. Firstly, five coated EENFs with different mass proportions of nature rubber (NR) in coating were prepared: CU0, CU1, CU2, CU3, CU4, and CU5 (0, 10, 20, 30, 40, and 50% of NR in coating). The controlled release performance of CU was tested by hydrostatic release test and the microstructure of controlled release urea, so as to screen the optimal addition ratio of NR (ER: NR = 7:3, CU3). Secondly, two coated, stabilized EENFs, CSU1 and CSU2, were prepared with natural rubber-modified epoxy resin (ER: NR = 7:3) as coating material. Seven treatments of different N fertilization were set up: CK (no N fertilization), urea, CU3, SU1, and SU2 (urease and nitrification inhibitors-treated urea fertilizers), CSU1 and CSU2 (urease and nitrification inhibitors-treated natural rubber-modified epoxy resin-coated urea fertilizers). Ammonia volatilization experiment and column leaching experiment showed that compared with conventional urea, NH3 volatilization loss was reduced by 20% and inorganic N leaching loss was reduced by 26% from CSU2, respectively. In the pot experiment, maize grain yield of 162.92 and 206.96 g/pot was achieved by CSU1 and CSU2, respectively, 41 and 79%, respectively, higher than that achieved by conventional urea. SUs treatments were more effective than conventional urea treatment in improving maize grain yield and NUE, but lower than in CSUs. The NUE, nitrogen fertilizer apparent utilization efficiency, partial factor productivity of applied N, and nitrogen utilization efficiency were 46, 30, 46, and 32%, respectively, higher in CSU1 and 58, 62, 58, and 29%, respectively, higher in CSU2 than in the conventional urea treatment. Compared with CSU1, CSU2 had better agronomic effectiveness with a higher NUE. It is recommended that urease and nitrification inhibitors be sandwiched between urea prill and the coating for preparation of novel, environmentally friendly coated, stabilized EENFs with high agronomic effectiveness, high NUE, and low N loss.
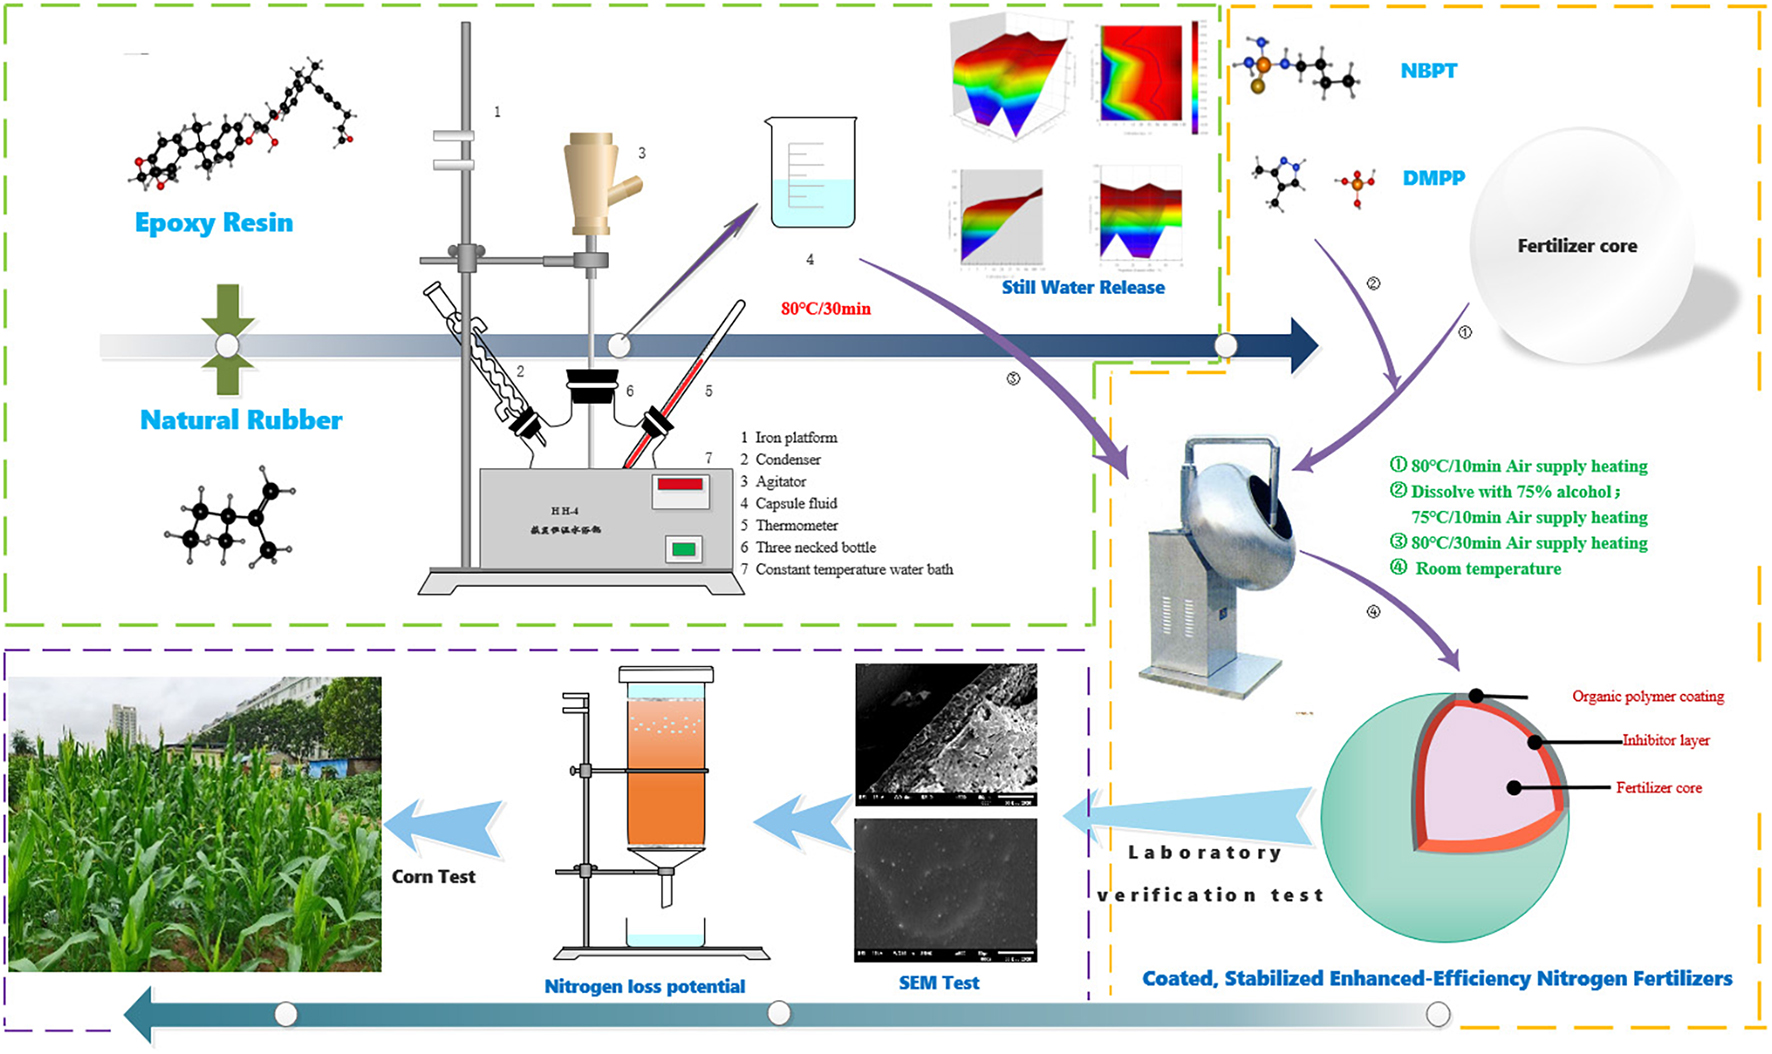
Graphical Abstract. Synthesis process, inspection and application of EENFs.
Introduction
Nitrogen (N) is the most important mineral element for crop growth (Nasima, 2011; Santos et al., 2020) and greatly influences the yield and quality of agricultural products (Savin et al., 2019). However, soil N supply is limited and N fertilizers are commonly applied to maintain crop yield levels (Santos et al., 2020; Khampuang et al., 2021). The improvement of soil fertility requires the use of fertilizers, which now play an important role in agricultural productivity and food security. Globally, experience has shown that fertilization is the most effective way of increasing food production (Araujo et al., 2017). According to the Food and Agriculture Organization of the United Nations, since 1978, the total consumption of agricultural fertilizers has been 1.49 billion tons, of which N fertilizer accounts for 63% of the total consumption of agricultural fertilizers in China (FAO, 2019). Urea (46% N) is currently the main N fertilizer synthesized in China, accounting for more than 50% of the total N fertilizers produced (Li et al., 2015).
However, urea is usually directly spread on soil surface before irrigation in China (Ju and Gu, 2014), which leads to rapid hydrolysis of the fertilizer. Studies have shown that more than 50% of the applied N can be lost via surface runoff, leaching, and volatilization, resulting in low N use efficiency (NUE) (Azeem et al., 2014; Huang et al., 2017; Pereira et al., 2017). In 2015, NUE in China, India, United States, and the world was 30, 21, 41, and 35%, respectively (Omara et al., 2019). In China, more than 35 million tons of chemical N fertilizers were used in agricultural production in 2012, of which, at least 60% were lost to the environment (Huang et al., 2015), causing a series of environmental problems such as air pollution, water pollution, and soil degradation (Geng et al., 2016; Alhaj Hamoud et al., 2019b; Xiao et al., 2019).
According to the plant nutrient theory, optimal growth can be achieved if the nutrients were supplied based on the relative growth rate of crops. Developing coated controlled-release urea or urease/nitrification inhibitors is crucial, which can synchronize nutrient release rates for requirement patterns of the crop in the natural field.
Coating urea prills with organic polymers can prevent urea prills from direct contact with water and soil, thus effectively slowing down urea dissolution, reducing N loss, and improving NUE (Ji et al., 2013; Azeem et al., 2014; Geng et al., 2016). Such coated urea fertilizers are controlled release enhanced-efficiency N fertilizers (EENFs). Ji et al. (2017) reported that basal application of controlled-release EENFs significantly increased maize yield and NUE while reducing N loss as compared with conventional urea at the same N application rate.
Recent studies showed that combined application of urease inhibitor and urea reduces ammonia (NH3) volatilization loss (Ji et al., 2014; Li et al., 2015; Santos et al., 2020), increases crop yield, and improves NUE (Li et al., 2015). Urease inhibitors are the general term for a class of substances that have inhibitory effects on soil urease activity. Therefore, urease inhibitors can delay urea hydrolysis which is catalyzed by urease (Ji et al., 2014). N-(n-Butyl) thiophosphoric triamide (NBPT) is one of the most widely used urease inhibitors (Adotey et al., 2017). It is a structural analog of urea acting with mixed inhibition on urease activity (Zanin et al., 2015).
Combined application of nitrification inhibitor and urea effectively inhibits the activity of ammonia (NH3) oxidizing bacteria, delays the biological oxidation of NH4+ to NO3– (nitrification process), reduces NO3– loss and N2O emission, and improves NUE (Kawakami et al., 2012). 3,4-dimethylpyrazole phosphate (DMPP) is a commonly used nitrification inhibitor. It has the characteristics of high efficiency, non-toxicity, high stability, and high specificity. Souza et al. (2019) reported that the combined application of urea and DMPP would mitigate N2O emission. Abalos et al. (2014) recommended that nitrification and urease inhibitors be used to increase crop productivity and NUE.
Urea fertilizers treated with urease inhibitor and/or nitrification inhibitor are stabilized EENFs where urea is stabilized from rapid hydrolysis and/or nitrification. However, urease and nitrification inhibitors are subjected to adsorption, fixation, and degradation in soil (Engel et al., 2015; Santos et al., 2020), which greatly affect their action time and inhibitory efficiency. It is speculated that when coated, stabilized EENFs would present better agronomic effectiveness and higher NUE. Epoxy resin (ER) is a good coating material for controlled release fertilizers (Li et al., 2020b). However, it does not readily degrade and its accumulation in soil could be an environmental concern. Natural rubber (NR, mainly cis-1,4-polyisoprene) is a natural, green, and renewable material. In this study, ER was first modified with NR at different mass proportions for preparation of NR-modified ER-coated EENFs (referred to as CUs). Optimal NR mass proportion was chosen based on the N release characteristics of CUs. Then, two coated, stabilized EENFs (referred to as CSUs) were prepared with NR at optimal proportion in coating and urease and nitrification inhibitors treated using two methods. Nitrogen loss potential of the CSUs was evaluated with a NH3 volatilization experiment and a column leaching experiment, and agronomic effectiveness of the CSUs was evaluated with a pot experiment. Results from this study will provide a theoretical basis and technical support for the development of more environmentally friendly and more efficient EENFs.
Materials and Methods
Preparation of CUs
Firstly, NR-modified ER was prepared by mixing NR with ER at mass proportions of 0, 10, 20, 30, 40, and 50% in a three-necked flask equipped with a stirrer, a condenser, and a thermometer. The flask was immersed in water bath at 80°C for 30 min to obtain liquefied NR-modified ER.
Secondly, 1 kg urea (2–4 mm, 46% N) was loaded into a rotary drum blender (WKY-400, China) and preheated at 80 ± 2°C for 10 min. Then, 10.0 g liquefied NR-modified ER were poured onto the rotating urea prills and cured for 8 min. This step was repeated three times so that a total of 40.0 g liquefied NR-modified ER were used. Six CUs, i.e., CU0, CU1, CU2, CU3, CU4, and CU5, were prepared with NR mass proportion in coating of 0, 10, 20, 30, 40, and 50%, respectively.
Microstructure Analyses of the CUs and Their Coatings
The surface and cross-sectional morphologies of the CUs were observed with a scanning electron microscope (SEM; JSM-6610LV, Japan) (Tian et al., 2019).
Characterization of N Release From the CUs
A nitrogen release experiment was conducted to learn the appropriate mass proportion of NR for ER modification. Nitrogen release characteristics of the CUs were evaluated using the national standard method GB/T 23348-2009 (GAQS, IQPRC, SA, 2009). Briefly, 10.0 g CU were placed into a 250-ml glass bottle containing 200 ml distilled water at 25°C. Nitrogen concentration in the solution was determined using the Kjeldahl (1883) method after 1, 3, 5, 7, 10, 14, 28, 42, 56, and 84 days until cumulative N release rate was ≥80%, which is a common benchmark for complete release (Yang et al., 2013). Three replicates were set up for each CU. The CU with the best N release performance would be identified according to the controlled release period and its NR proportion in coating would be adopted in the subsequent preparation of CSUs.
Preparation of Stabilized EENFs and CSUs
In order to test the effect of different formulations of inhibitor and urea on inhibitor activity, two types of uncoated, stabilized EENFs (referred to as SUs) were prepared: SU1 and SU2. The first type, SU1, was prepared by mixing 1 kg urea thoroughly with 1.15 g NBPT and 2.30 g DMPP. The preparation procedure of SU2 was similar to that of the CUs. Briefly, 1.15 g NBPT and 2.30 g DMPP were dissolved in 80 ml 75% ethanol solution. After 1 kg urea was loaded into a rotary drum blender (WKY-400, China) and preheated at 80 ± 2°C for 10 min, 20 ml of the NBPT and DMPP containing ethanol solution was poured onto the rotating urea prills and cured for 8 min. This step was repeated three times and SU2 was obtained.
Two CSUs (i.e., CSU1 and CSU2) were prepared in the same way as the CUs except that for CSU1, the first 10 g liquefied NR-modified ER contained 1.15 g NBPT and 2.30 g DMPP, and for CSU2, SU2 was used instead of urea. That is, NBPT and DMPP were homogeneously distributed in the innermost layer of the coating in CSU1, whereas they were sandwiched between the coating and the urea in CSU2. The surface and cross-sectional morphologies of the CSUs were observed with a SEM (JSM-6610LV, Japan) (Tian et al., 2019).
Evaluation of the N Loss Potential of the SUs and CSUs
Two experiments were conducted to evaluate the N loss potential, including volatilization and leaching loss, of the SUs and CSUs.
The soil used in this study, including these two experiments and the pot experiment described later, was collected from the experimental station of the College of Resources and Environment, Shandong Agricultural University, China. The basic physical and chemical properties of the soil are shown in Table 1.

Table 1. Basic physical and chemical properties of the soil used in this study.
For NH3 volatilization loss evaluation, urea, CU3, the SUs, and the CSUs were each mixed thoroughly with 250 g soil at 0.6 g N/kg dry soil in plastic boxes. In addition, boxes containing only 250 g soil without fertilizer (CK) were also prepared. After soil moisture was adjusted to 60% of field water holding capacity with distilled water, a Petri dish containing 10 ml 3% boric acid indicator solution was placed on the soil as a trap for volatilized NH3. The boxes were sealed and incubated at 25°C in the dark. The boric acid traps were replaced with new ones at regular intervals during the 40 days of incubation and titrated with sulfuric acid standard solution (0.005 mol/l) for NH3 quantification (Zhou, 2017).
A column leaching experiment was conducted for evaluation of ammonium and nitrate leaching loss potential of the CU3, SUs, and CSUs. PVC columns (6.0 cm in diameter and 15.0 cm in height) were first packed with a thin layer of quartz sand, then 2000 g soil, and finally a thin layer of quartz sand again. The SUs and CSUs were each mixed thoroughly with the top 5 cm of soil at 0.6 g N/kg dry soil. Columns without fertilizer added were also set up as control (CK). Distilled water was added to saturate the soil for 24 h. Then, 100 ml distilled water was added to the column every 4 days for a total of 1000 ml water in 40 days. Leachate was collected for NH4+-N and NO3–-N determination using an AA3 continuous flow analyzer (BL-TECH, Germany). Soil inorganic N content was calculated as the sum of NH4+-N and NO3–-N.
Pot Experiment
The pot experiment adopted a completely randomized block design. Seven treatments of different N fertilizations were set up: CK (no application of N fertilizer), urea, CU3, SU1, SU2, CSU1, and CSU2. Plastic pots (lower diameter 23.0 cm, upper diameter 35.0 cm, and height 43.5 cm) were used, and 15 kg of soil were put in each pot. The N fertilizers were applied at 0.15 g N/kg dry soil (equivalent to 337.5 kg N/ha). Calcium superphosphate was used as phosphorus fertilizer at 0.1 g P2O5/kg dry soil (equivalent to 225 kg P2O5/ha) and potassium chloride as potassium fertilizer at 0.1 g K2O/kg dry soil (equivalent to 225 kg P2O5/ha). The phosphorus and potassium fertilizers, SUs, and CSUs were applied as basal fertilizers in the subsurface soil layer, while urea was split-applied as basal fertilizer (50%) and topdressing (50%, at the jointing stage). Five seeds of maize (Zea mays Ziyu 2) were sown in each pot on June 10, 2020 and thinned to one seedling at the 5-leaf stage.
At the seedling (June 20), jointing (July 10), tasseling (August 10), flowering (August 17), and mature (September 22) stages of maize, three pots were randomly taken from each treatment. Plant heights were measured. After maize roots were removed, fresh soil samples were taken and extracted with 1 mol/l KCl for determination of NH4+-N and NO3–-N with an AA3 continuous flow analyzer (BL-TECH, Germany). Urease activity was measured by the sodium phenate-sodium hypochlorite colorimetric method (Santos et al., 2020) using air-dried soil (<1 mm). Maize was harvested on October 22. Ears per plant, grains per ear, and 100-grain weight were recorded. Plant and grain samples were first oven-dried at 105 °C for 30 min and then at 75°C to constant weight. The samples were digested with H2SO4/H2O2 and N content was determined by the Kjeldahl (1883) method. Maize grain yield, N utilization efficiency (NUTE), partial factor productivity of applied N (NPFP), N fertilizer apparent utilization efficiency (NFUE), and N use efficiency (NUE) were calculated as follows:
Soil apparent nitrification rate was calculated as:
Statistical Analysis
Microsoft Excel 2016 was used for data processing and Origin 2021 software was used for figure drawing. Data were subjected to analysis of variance (ANOVA) using IBM SPSS Statistics 21.0 and means were separated by Duncan’s multiple range test (P < 0.05).
Results
Microstructure of the CUs
The surface and cross-sectional morphologies of the CUs are shown in Figure 1. The surface of the CUs became rougher with more NR in the coating. Pin holes of various sizes were observed on the surface of CU0 (Figure 1A). There were tiny bumps on the surface of CU3 (Figure 1D), whereas the surfaces of CRU4 and CRU5, the latter in particular, showed sheet structure (Figures 1E,F). The coating of CU0 displayed a compact structure, whereas that of CU1 was porous (Figures 1G,H). Loose sheet structure of the coating became more prominent with more NR (Figures 1I–L).
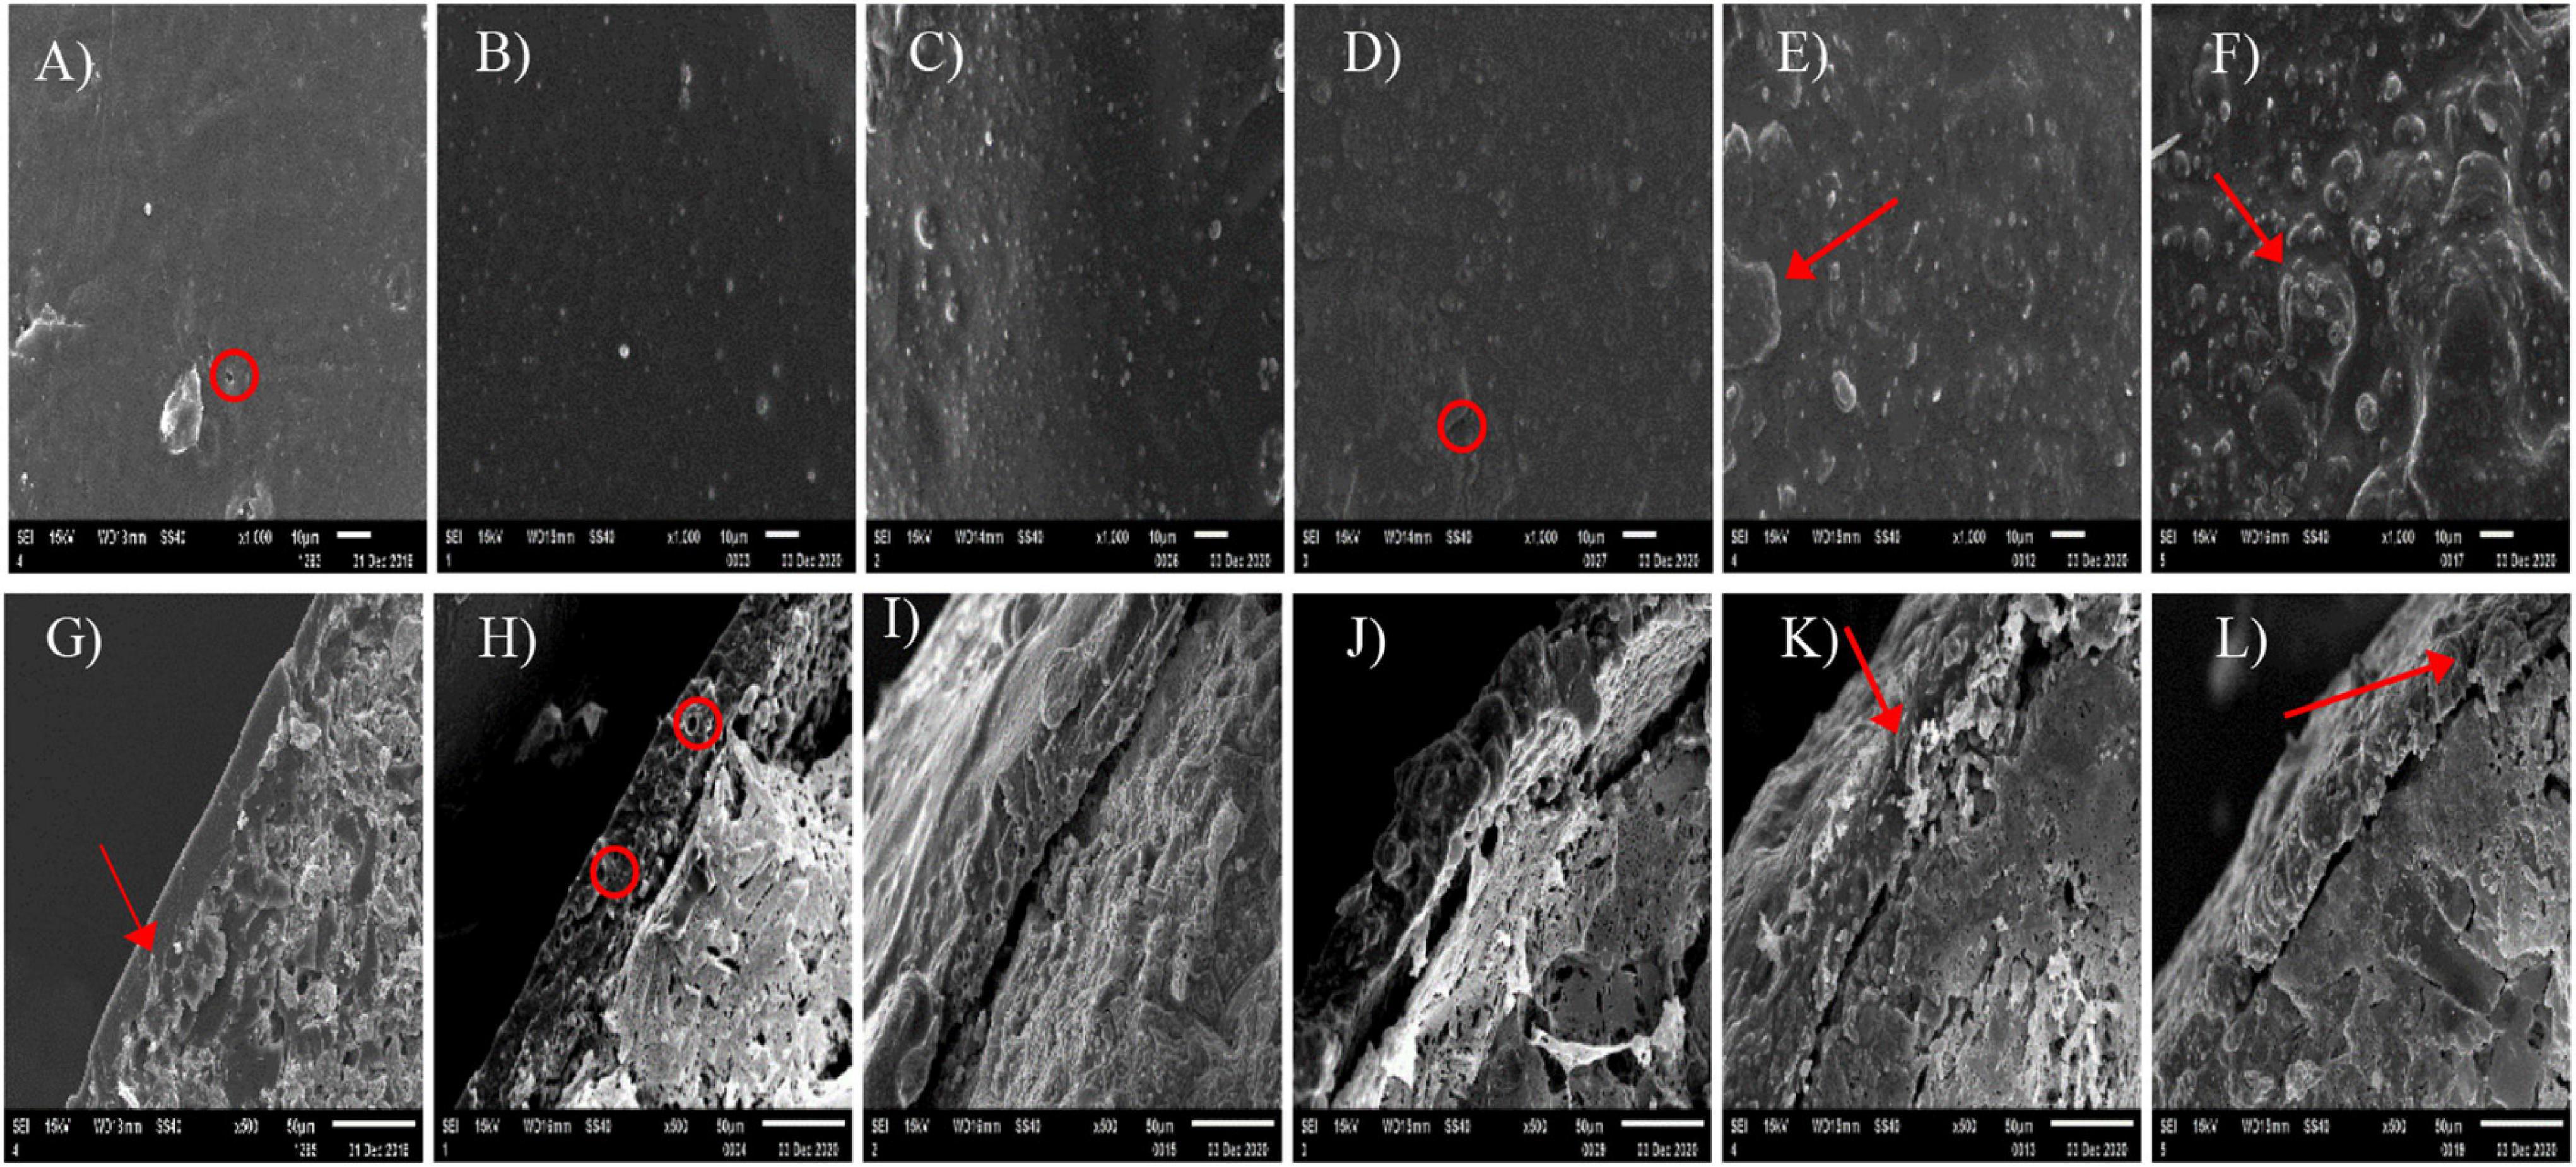
Figure 1. Surface (A–F) and cross sectional (G–L) scanning electron microscope (SEM) images of the prepared natural rubber-modified epoxy resin-coated urea fertilizers (CUs). Natural rubber mass proportions in coating were 0% (CU0, the 1st column), 10% (CU1, the 2nd column), 20% (CU2, the 3rd column), 30% (CU3, the 4th column), 40% (CU4, the 5th column), and 50% (CU5, the 6th column).
Nitrogen Release Characteristics of the CUs
Nitrogen was released rapidly from CU4 and CU5, with first-day release of 44 and 42%, respectively (Figure 2). After only 7 days of incubation, over 70% of total N had been released from the two CUs, and after 28 and 42 days, 80% of total N had been released from CU4 and CU5, respectively. In contrast, N release from CU2 and CU3 was much slower in the early stage of incubation, with merely approximately 15% being released in the first week. The N release period of CU2 and CU3 was 75 and 73 days, respectively, comparable to that of CU0 (84 days). For CU1, over 30% of total N was released in the first day of incubation, nearly 50% was released in the first 7 days, and 80% was released in 61 days. In a word, of the five NR-modified ER-coated EENFs, CU2 and CU3 presented the most comparable N release performance to that of CU0. Their first-day N release rates were far lower than 15% and their N release periods were approximately two and a half months, well meeting the requirement for a controlled release N fertilizer stated in the national standard method GB/T 23348-2009. The N release characteristics of the CUs were closely related to the structure of their coatings. The rapid N release from CU4 and CU5 is attributed to the loose sheet structure of their coatings, whereas the rapid N release from CU1 is due to the porous structure of its coating (Figure 1). Both loose sheet and porous structures are favorable for the diffusion of water through the coating and subsequent diffusion of N solution out to the soil (i.e., N release). Considering that the N release pattern of CU3 was more similar to that of CU0 and that a smaller proportion of ER would be better for the environment, the NR mass proportion of 30% in coating was adopted for the subsequent preparation of CSUs.
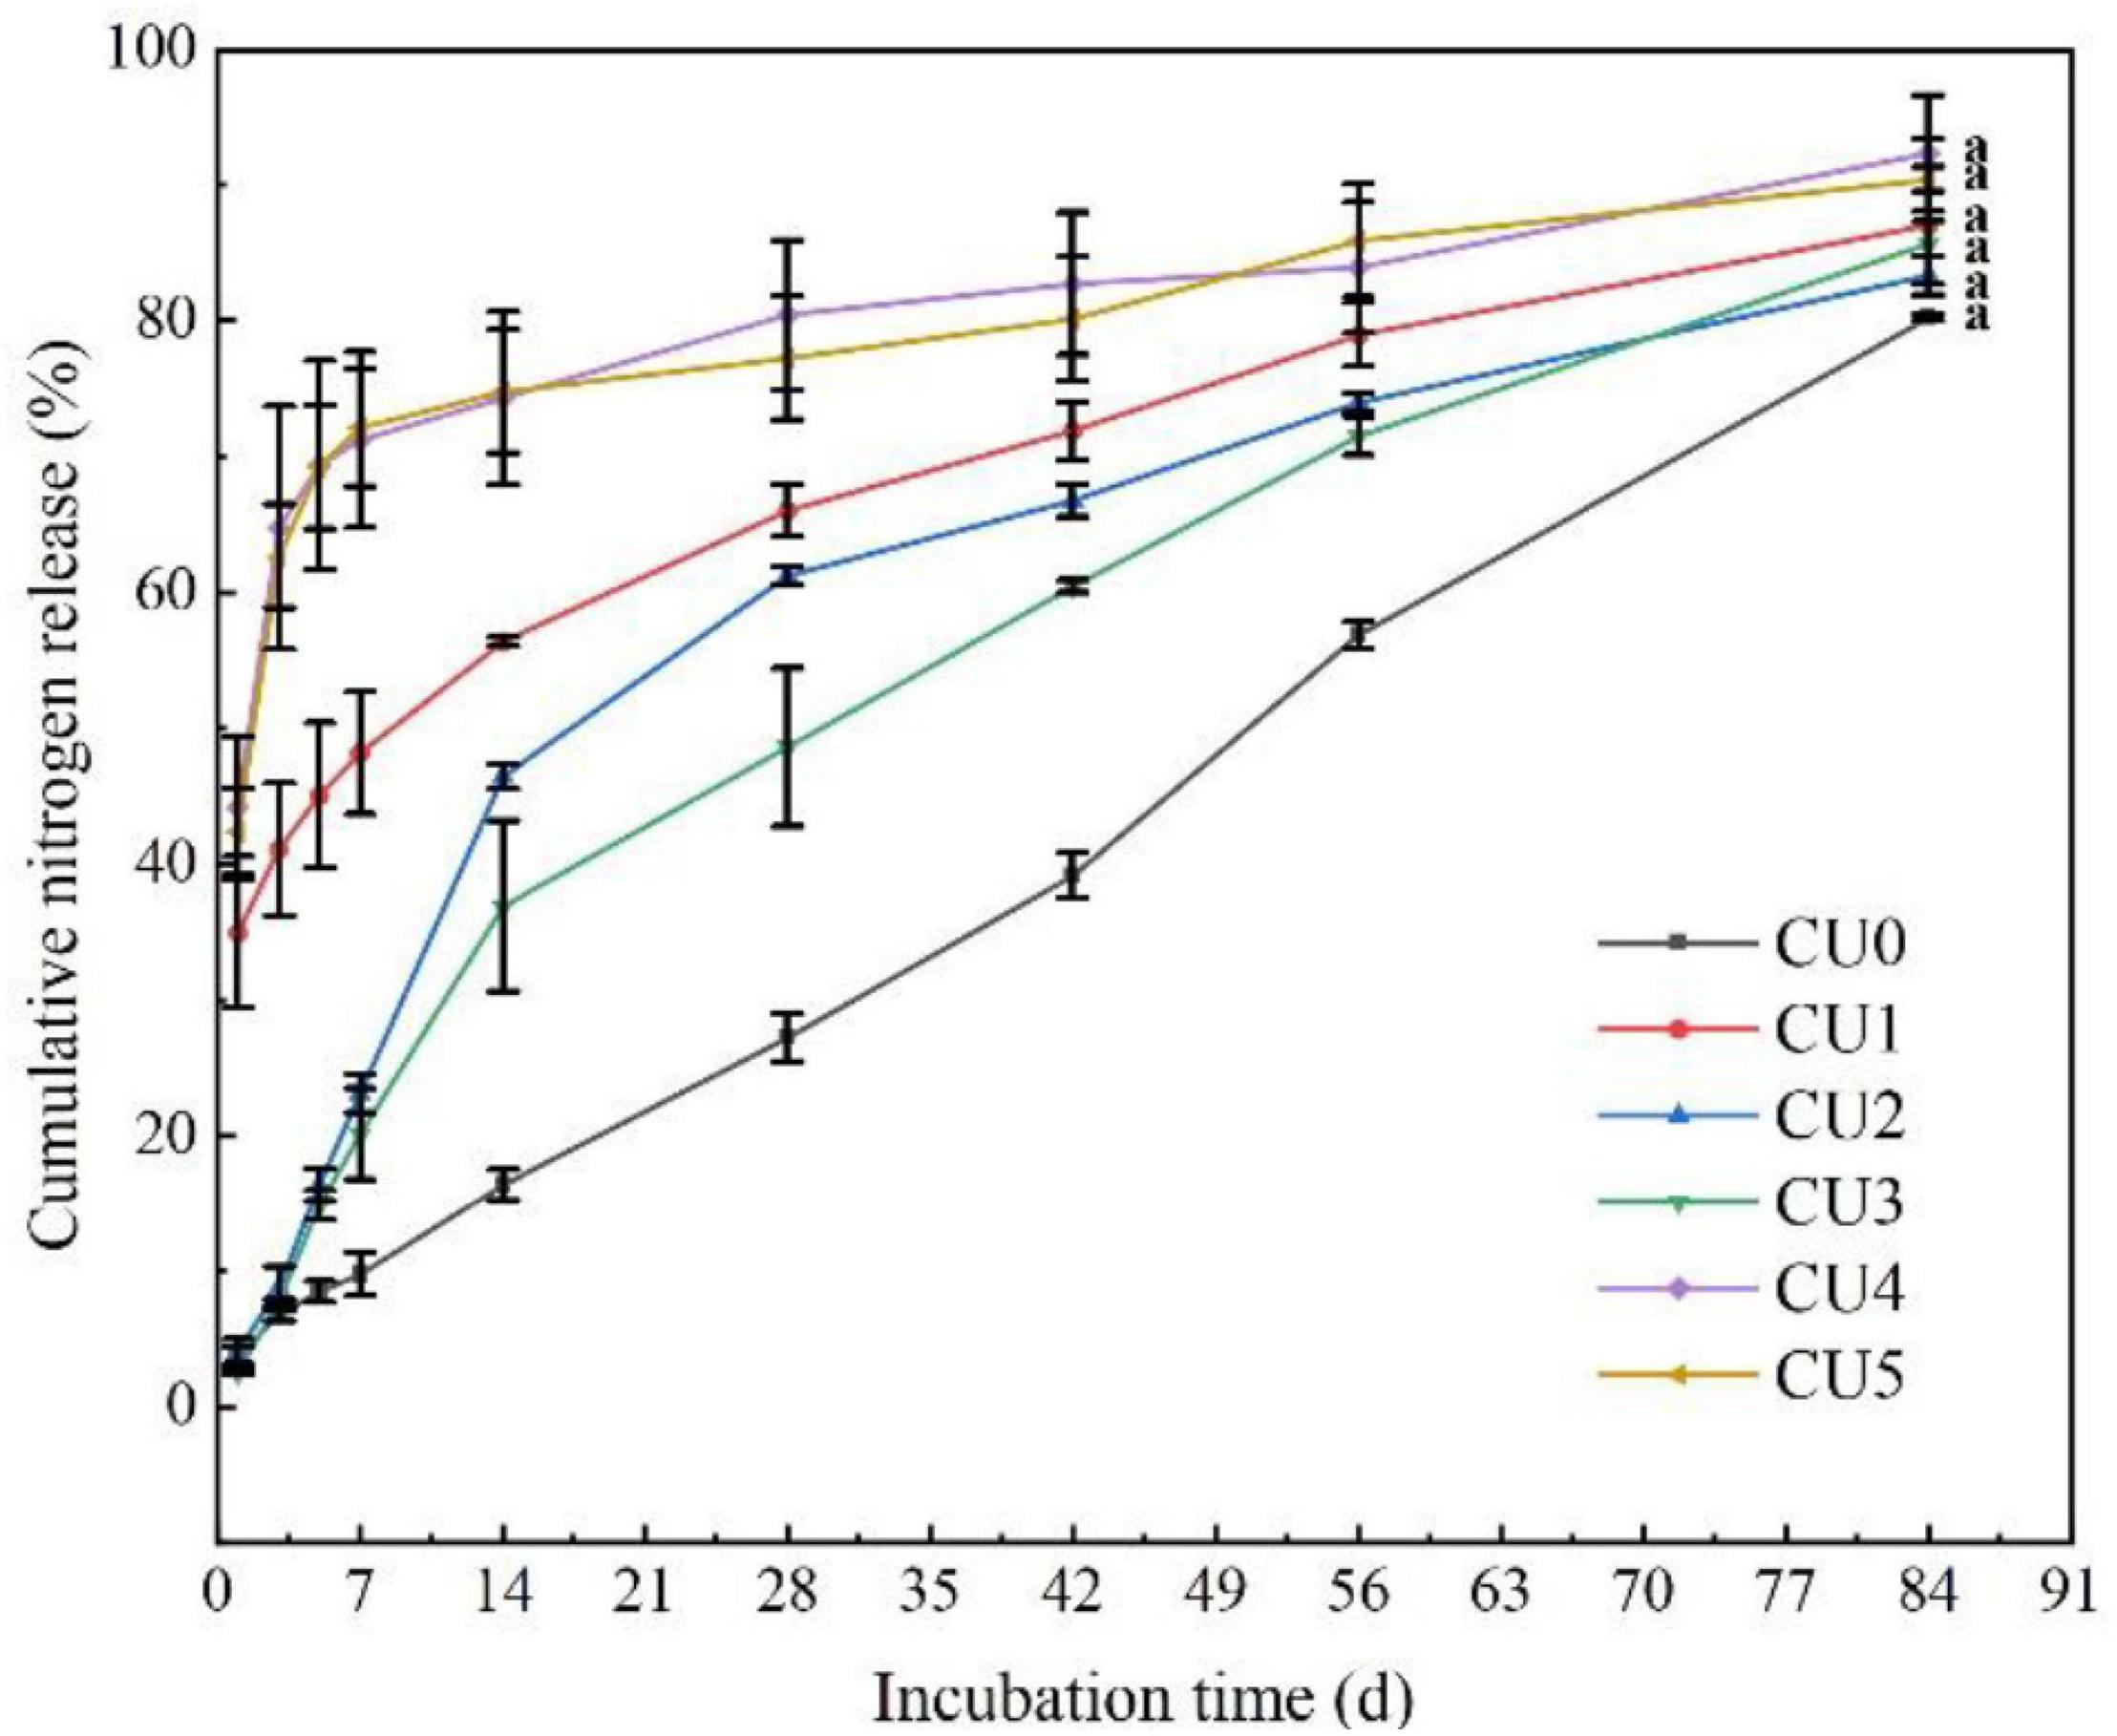
Figure 2. Nitrogen release curves of the natural rubber-modified epoxy resin-coated urea fertilizers (CUs). Natural rubber mass proportions in coating were 0% (CU0), 10% (CU1), 20% (CU2), 30% (CU3), 40% (CU4), and 50% (CU5).
Nitrogen Loss Potential of the SUs and CSUs
A large amount of NH3 volatilized from urea was measured in the first week of incubation, with peak volatilization of 1.13 mg NH3-N at day 3 (Figure 3A), indicating rapid hydrolysis of conventional urea after applied to the soil. Ammonia volatilization in the conventional urea treatment decreased continuously from day 4 to 9, fluctuated in day 10–19, and then decreased continuously again, with daily volatilization lower than those of the CU3, SU, and CSU treatments from day 16 on. In contrast, NH3 volatilization from the CU3, SU, and CSU treatments, which mainly occurred during days 7–17, was small during the entire incubation period, with even the peak daily volatilization smaller than 0.4 mg NH3-N. The NH3 volatilization in the CU3 reached the peak on the 14th day, which was 4 days later than the peak in the SU2. The NH3 volatilization rate of EENFs was higher than that of conventional urea during days 23–40. On the 40th day, the NH3 volatilization rate of CU3 was significantly higher than that of SUs and CSUs. During the cultivation stage, the NH3 volatilization accumulation of conventional urea was higher than that of EENFs (Figure 3B). Compared with the conventional urea treatment, the NH3 volatilization was significantly decreased by 10, 12, 13, 14, and 20% in CU3, SU1, SU2 CSU1, and CSU2, respectively. In addition, NH3 volatilization from the CSU2 treatment was significantly lower than those from the CU3, CSU1, and SUs treatments, whereas there were no significant differences between CSU1 and SUs.
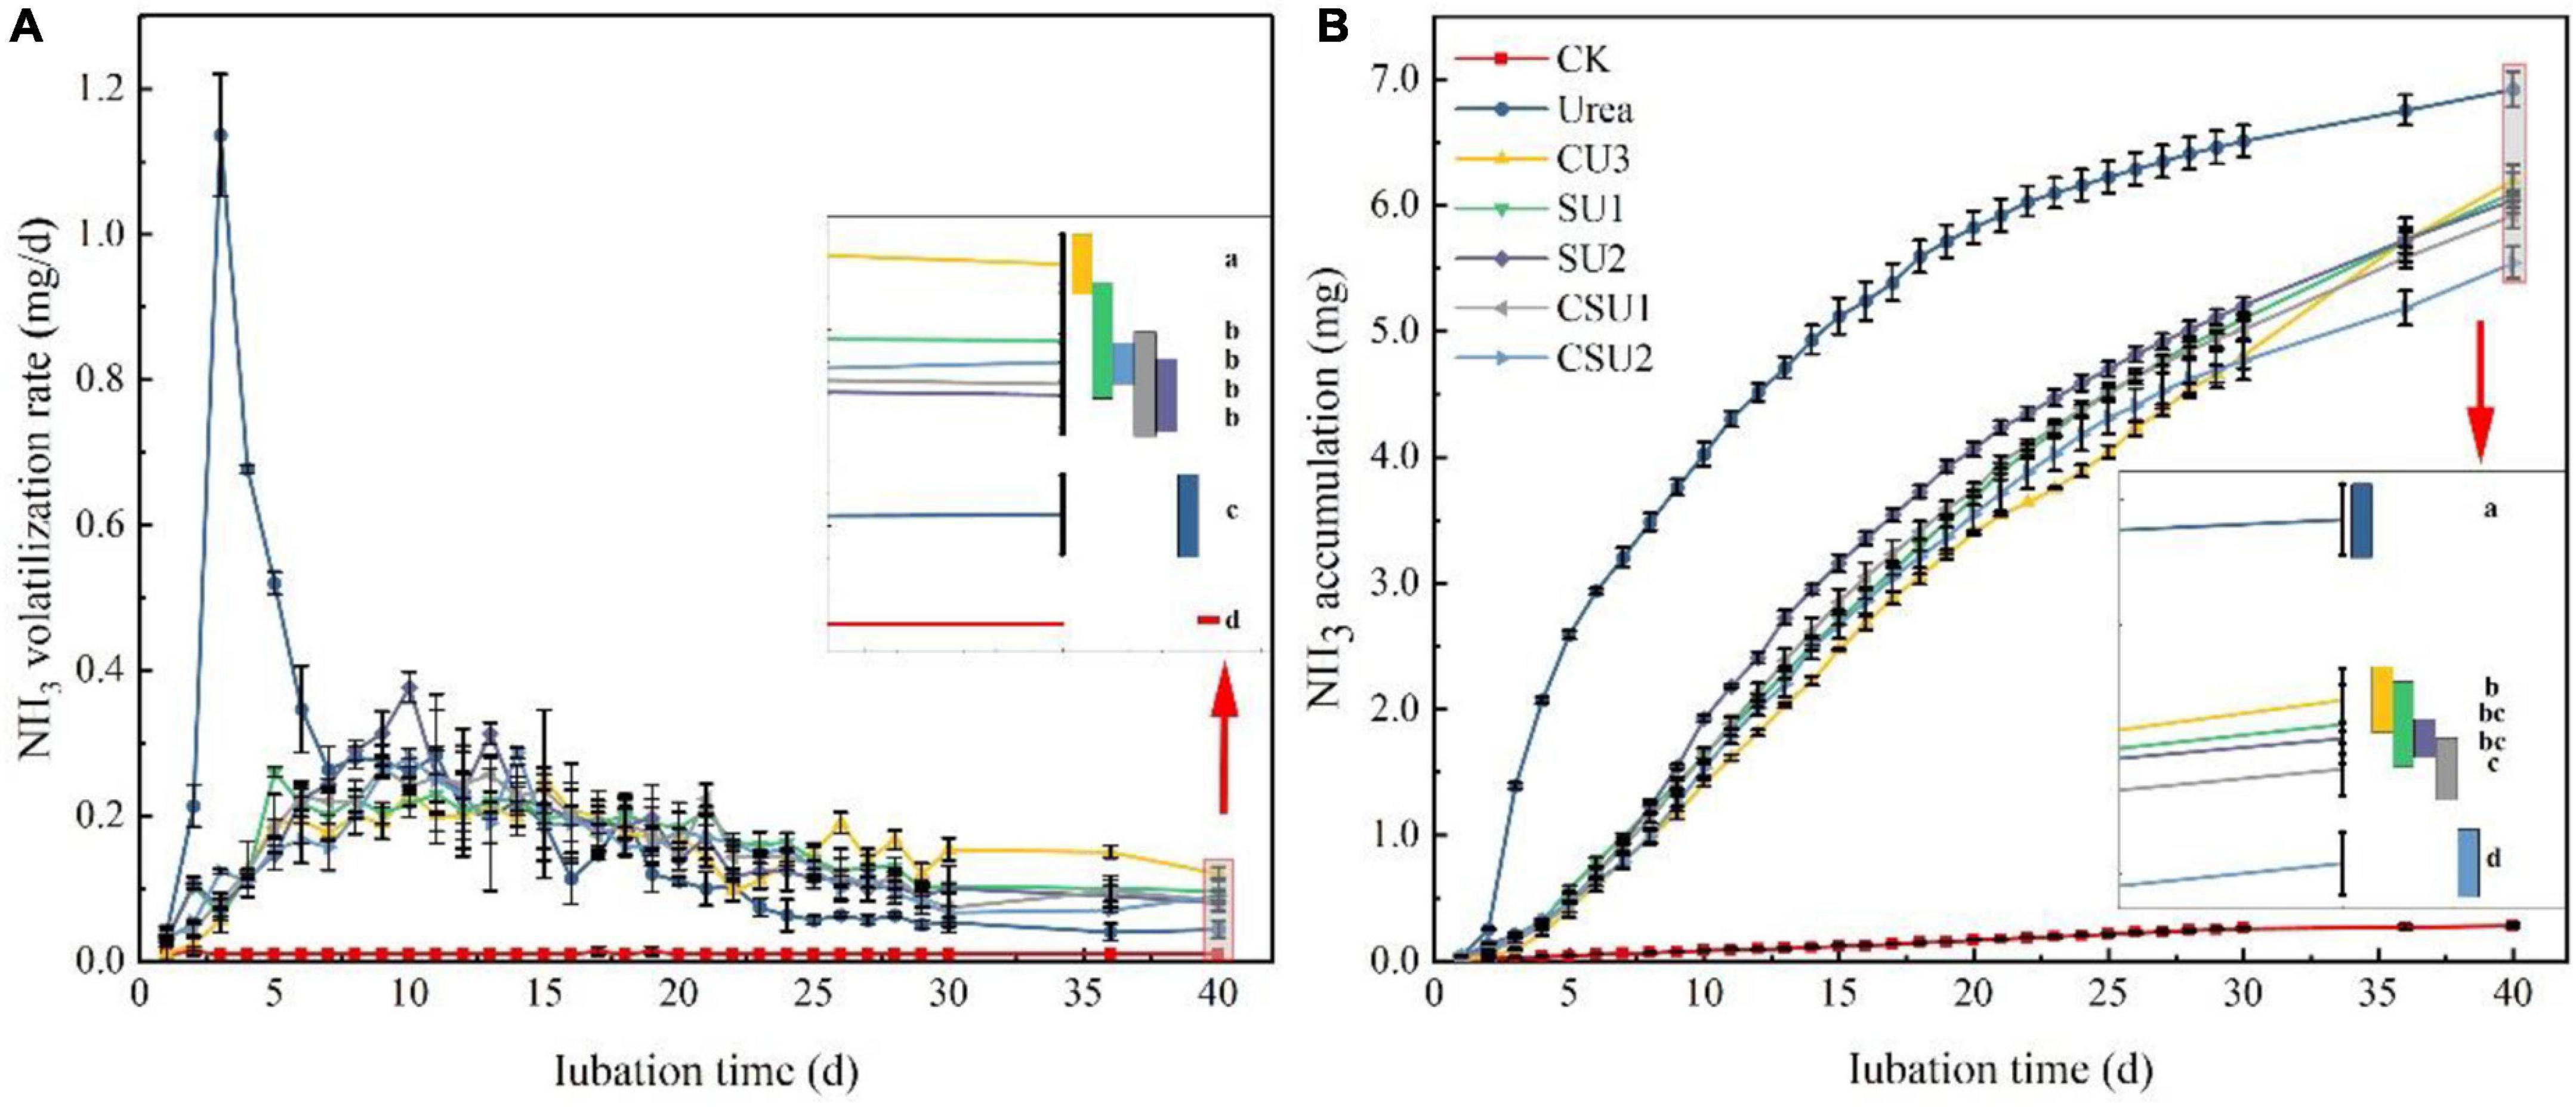
Figure 3. Ammonia volatilization rate (A) and accumulative volatilization (B) of the treatments with application of conventional urea, the natural rubber-modified epoxy resin-coated urea fertilizers (CU3), urease and nitrification inhibitors treated urea (SU1 and SU2), and inhibitors treated natural rubber-modified epoxy resin-coated urea (CSU1 and CSU2). CK: no urea was applied.
Leaching loss of NH4+-N, NO3–-N, and inorganic N from the CU3, SUs, CSUs, and conventional urea are shown in Figure 4. The peak NH4+-N leaching rate occurred at day 8, 16, 12, 16, 12, and 24 in the urea, CU3, SU1, SU2, CSU1, and CSU2 treatments, respectively (Figure 4A). Compared with the urea treatment, the peak NH4+-N leaching rate decreased by 52, 20, 39, 57, and 66% in SU1, SU2, CSU1, and CSU2, respectively. Throughout the leaching experiment, NH4+-N was the major inorganic N in the leachates from the conventional urea, SU1, and SU2 treatments. In addition, the leached amount of NH4+-N from the CSUs treatments was significantly lower than those from the SU1 and SU2 treatments, whereas there were no significant differences between CSU1 and CSU2 (Figure 4B). Furthermore, the leached amount of NH4+-N from the SU treatments was significantly less than that from the conventional urea treatment, and the leached amount of NH4+-N from the CSU treatments was significantly less than that from the SU treatments. In the 40 days of incubation, the cumulative leached amount of NH4+-N was 46, 13, 22, 50, and 54% lower from CU3, SU1, SU2, CSU1, and CSU2, respectively, than from conventional urea.
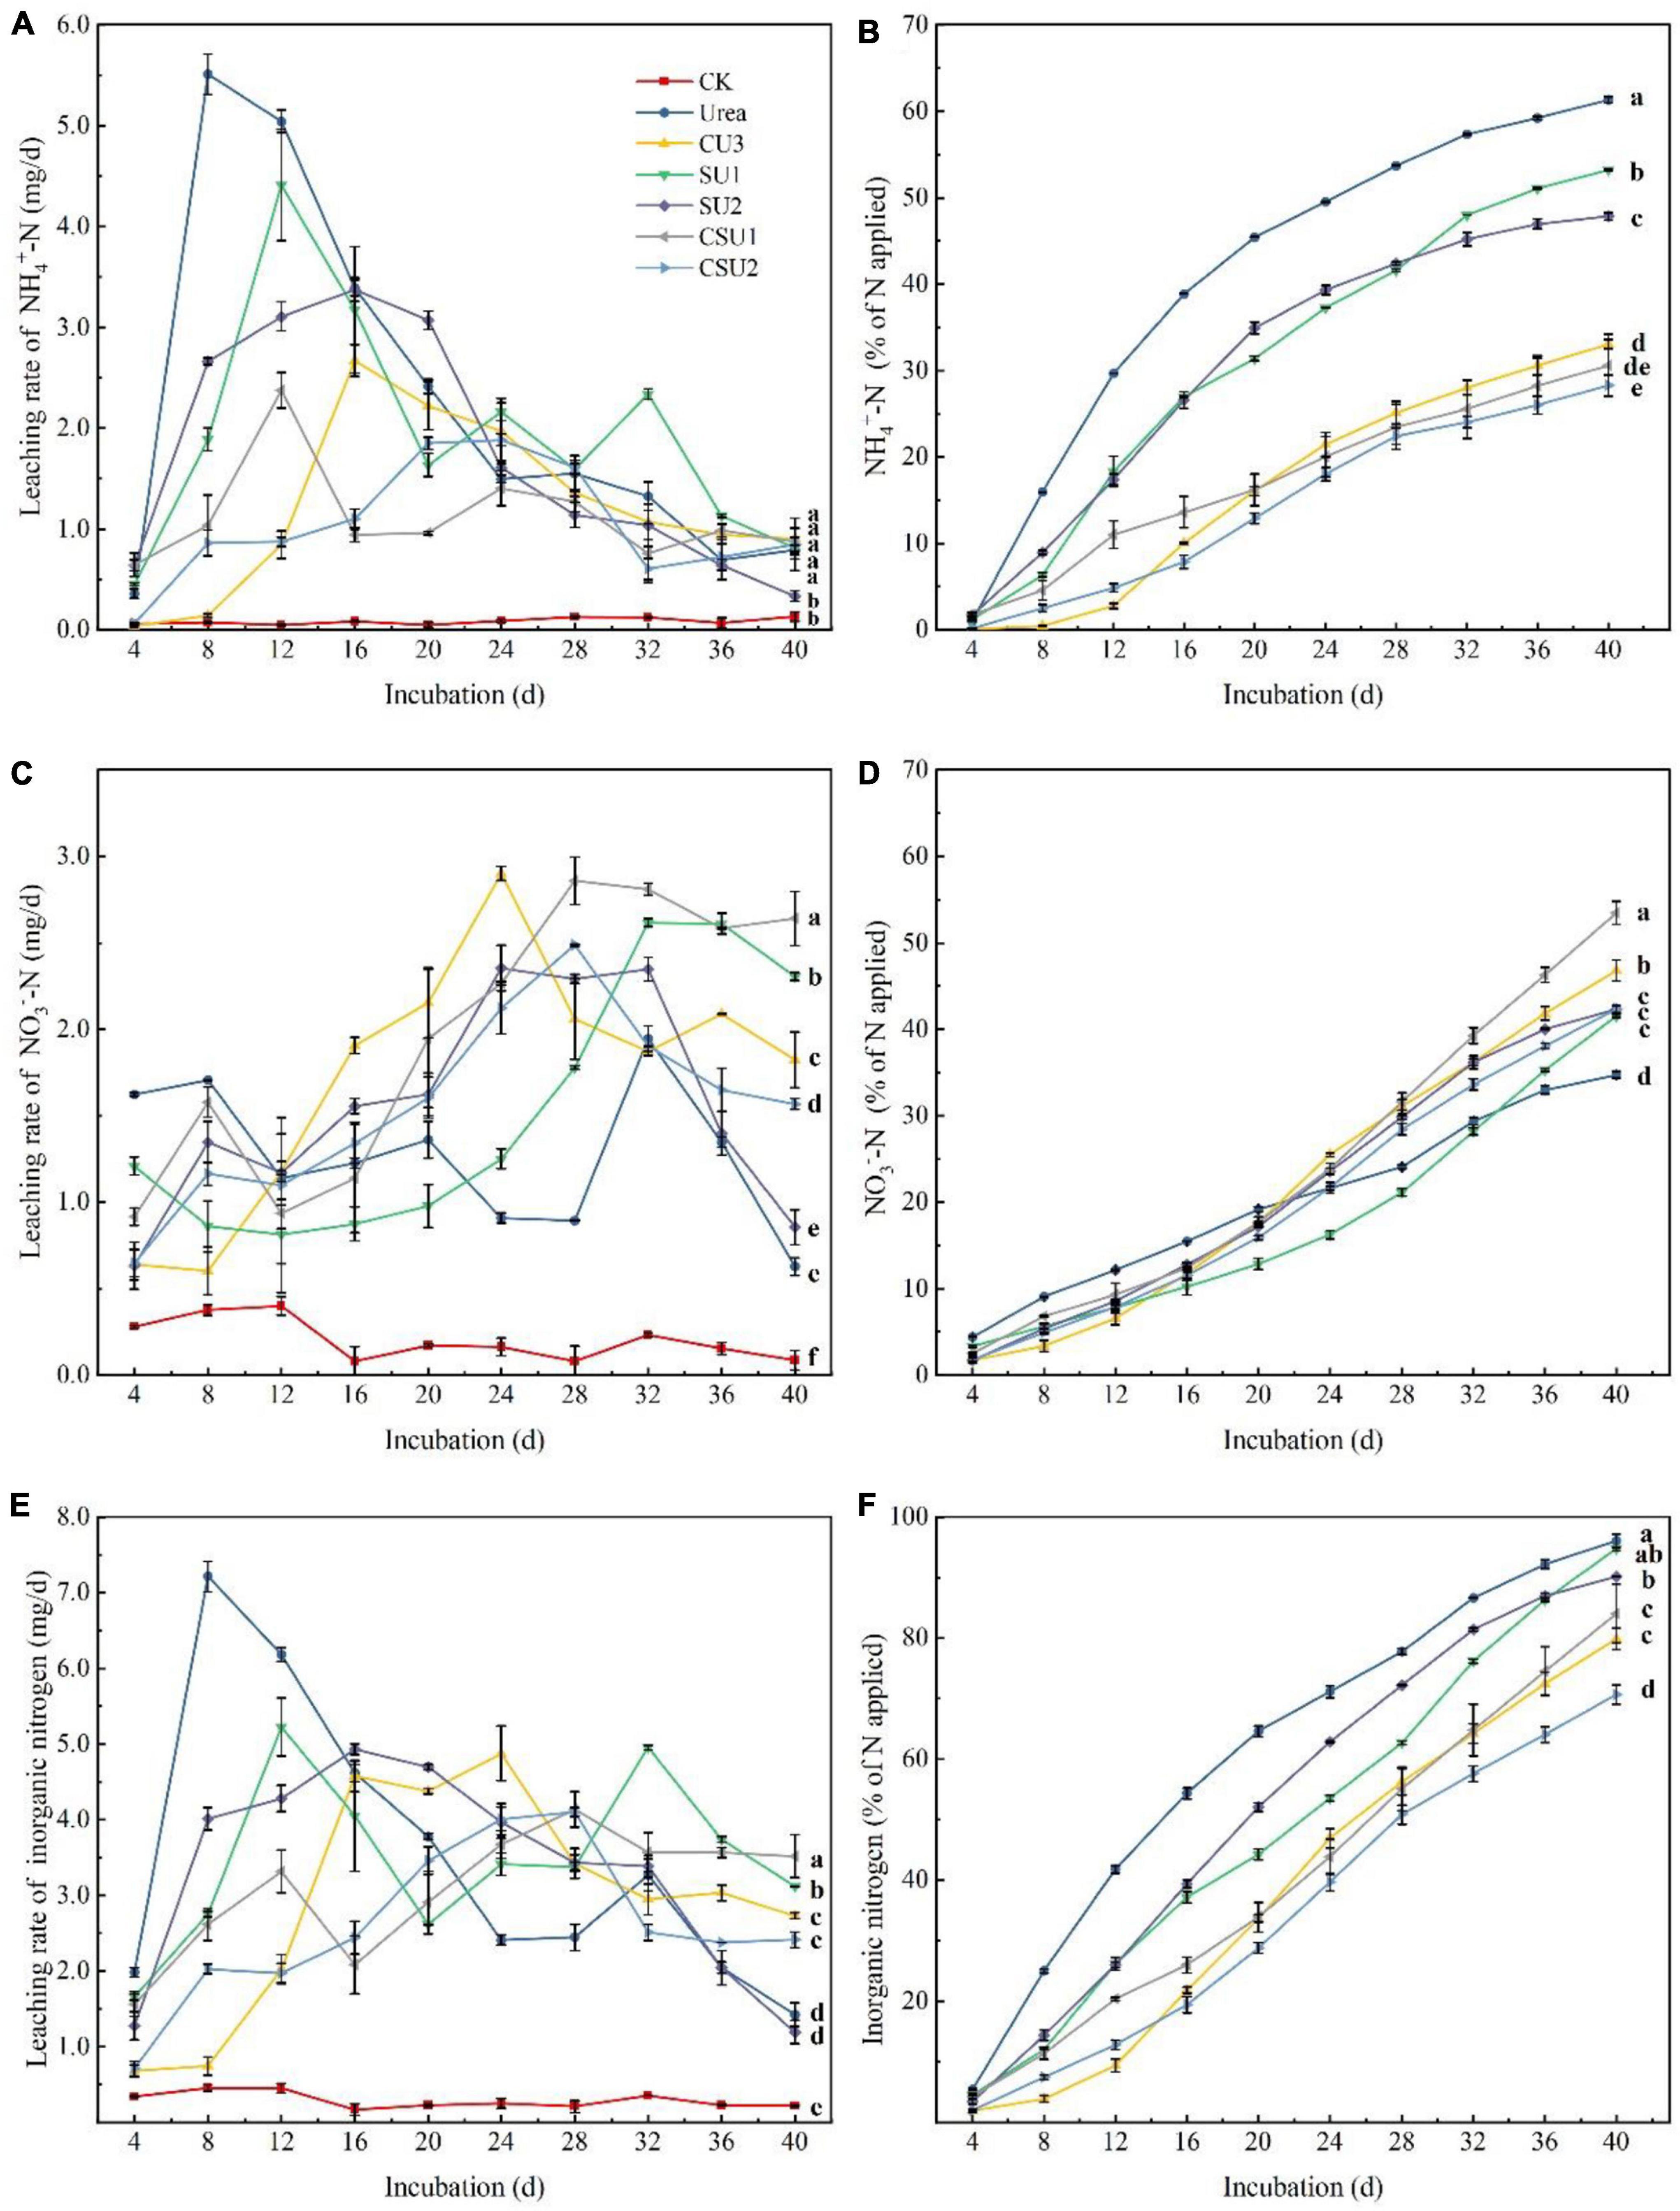
Figure 4. Leaching rates and cumulative leached amounts of NH4+-N and NO3–-N from urea, the natural rubber-modified epoxy resin-coated urea fertilizers (CU3), urease and nitrification inhibitors treated urea (SU1 and SU2), and the coated and urease and nitrification inhibitors treated urea fertilizers (CSU1 and CSU2). (A) NH4+-N leaching rate; (B) Cumulative leached NH4+-N; (C) NO3–-N leaching rate; (D) Cumulative leached NO3–-N; (E) Inorganic N leaching rate; (F) Cumulative leached inorganic N.
The leaching dynamics of NO3–-N was different from that of NH4+-N. It can be seen from Figure 4C that the NO3–-N leaching rate of conventional urea was higher than those of the CU3, SUs, and CSUs in the first 12 days. This is due to the rapid hydrolysis of urea, which generated a large amount of NH4+-N, the substrate of nitrification, and accelerated the production of NO3–-N. The NO3–-N leaching rate in the conventional urea treatment decreased from day 20 to 28 and was lower than those in the SU and CSU treatments during day 24–28. In the 40 days of incubation, the cumulative leached amount of NO3–-N was 38, 47, 42, 43, 53, and 42% from U, CU3, SU1, SU2, CSU1, and CSU2, respectively (Figure 4D). The decrease was attributed to the rapid hydrolysis of urea and leaching of NH4+-N out from the column, which led to weak nitrification and low NO3–-N in the later stage. In contrast, in the SU and CSU treatments, NO3–-N leaching rate was low in the early stage and increased in the later stage. This is attributed to the presence of DMPP, which inhibits nitrification. With the gradual dissolution of DMPP, its inhibition on nitrification became weaker and more NH4+-N was converted to NO3–-N.
The leaching loss of soil inorganic N was calculated (Figure 4F). After the incubation, the leaching loss of soil inorganic N was significantly reduced in CU3, SU2, CSU1 and CSU2 by 17, 6, 13, and 26%, respectively, compared with the conventional urea treatment. There was no significant difference in the leached amount of inorganic N between the SU1 and conventional urea treatments. In terms of leached amount of applied N, the fertilizers were in the order of: conventional urea and SU1 > SU2 > CSU2 and CU3 > CSU2.
Agronomic Effectiveness of the SUs and CSUs
Changes in Soil Inorganic N and Apparent Nitrification Rate During Maize Growth
In the conventional urea treatment, soil NH4+-N content decreased with time during maize growth (Figure 5A). It was over 20 mg/kg at the seedling stage and decreased to slightly more than 15 mg/kg at the jointing stage and lower than 15 mg/kg at the tasseling and flowering stages. In contrast, in the CU3, SU and CSU treatments, soil NH4+-N content was low at the seedling stage, 15 mg/kg or even lower, increased at the jointing, tasseling, and flowering stages, and then decreased significantly at the mature stage. In the conventional urea treatment, the high NH4+-N content at the early growth stages of maize may exceed plant demand and lead to N loss to the environment, resulting in low NUE and eutrophication of waters, whereas the low NH4+-N content in the maize rapid growth stages may constrain plant growth, leading to low crop yield. In contrast, the temporal changes of NH4+-N content in the SU and CSU treatments presented a plant demand-synchronized pattern, which not only meets plant nutrient demand but also minimizes N loss.
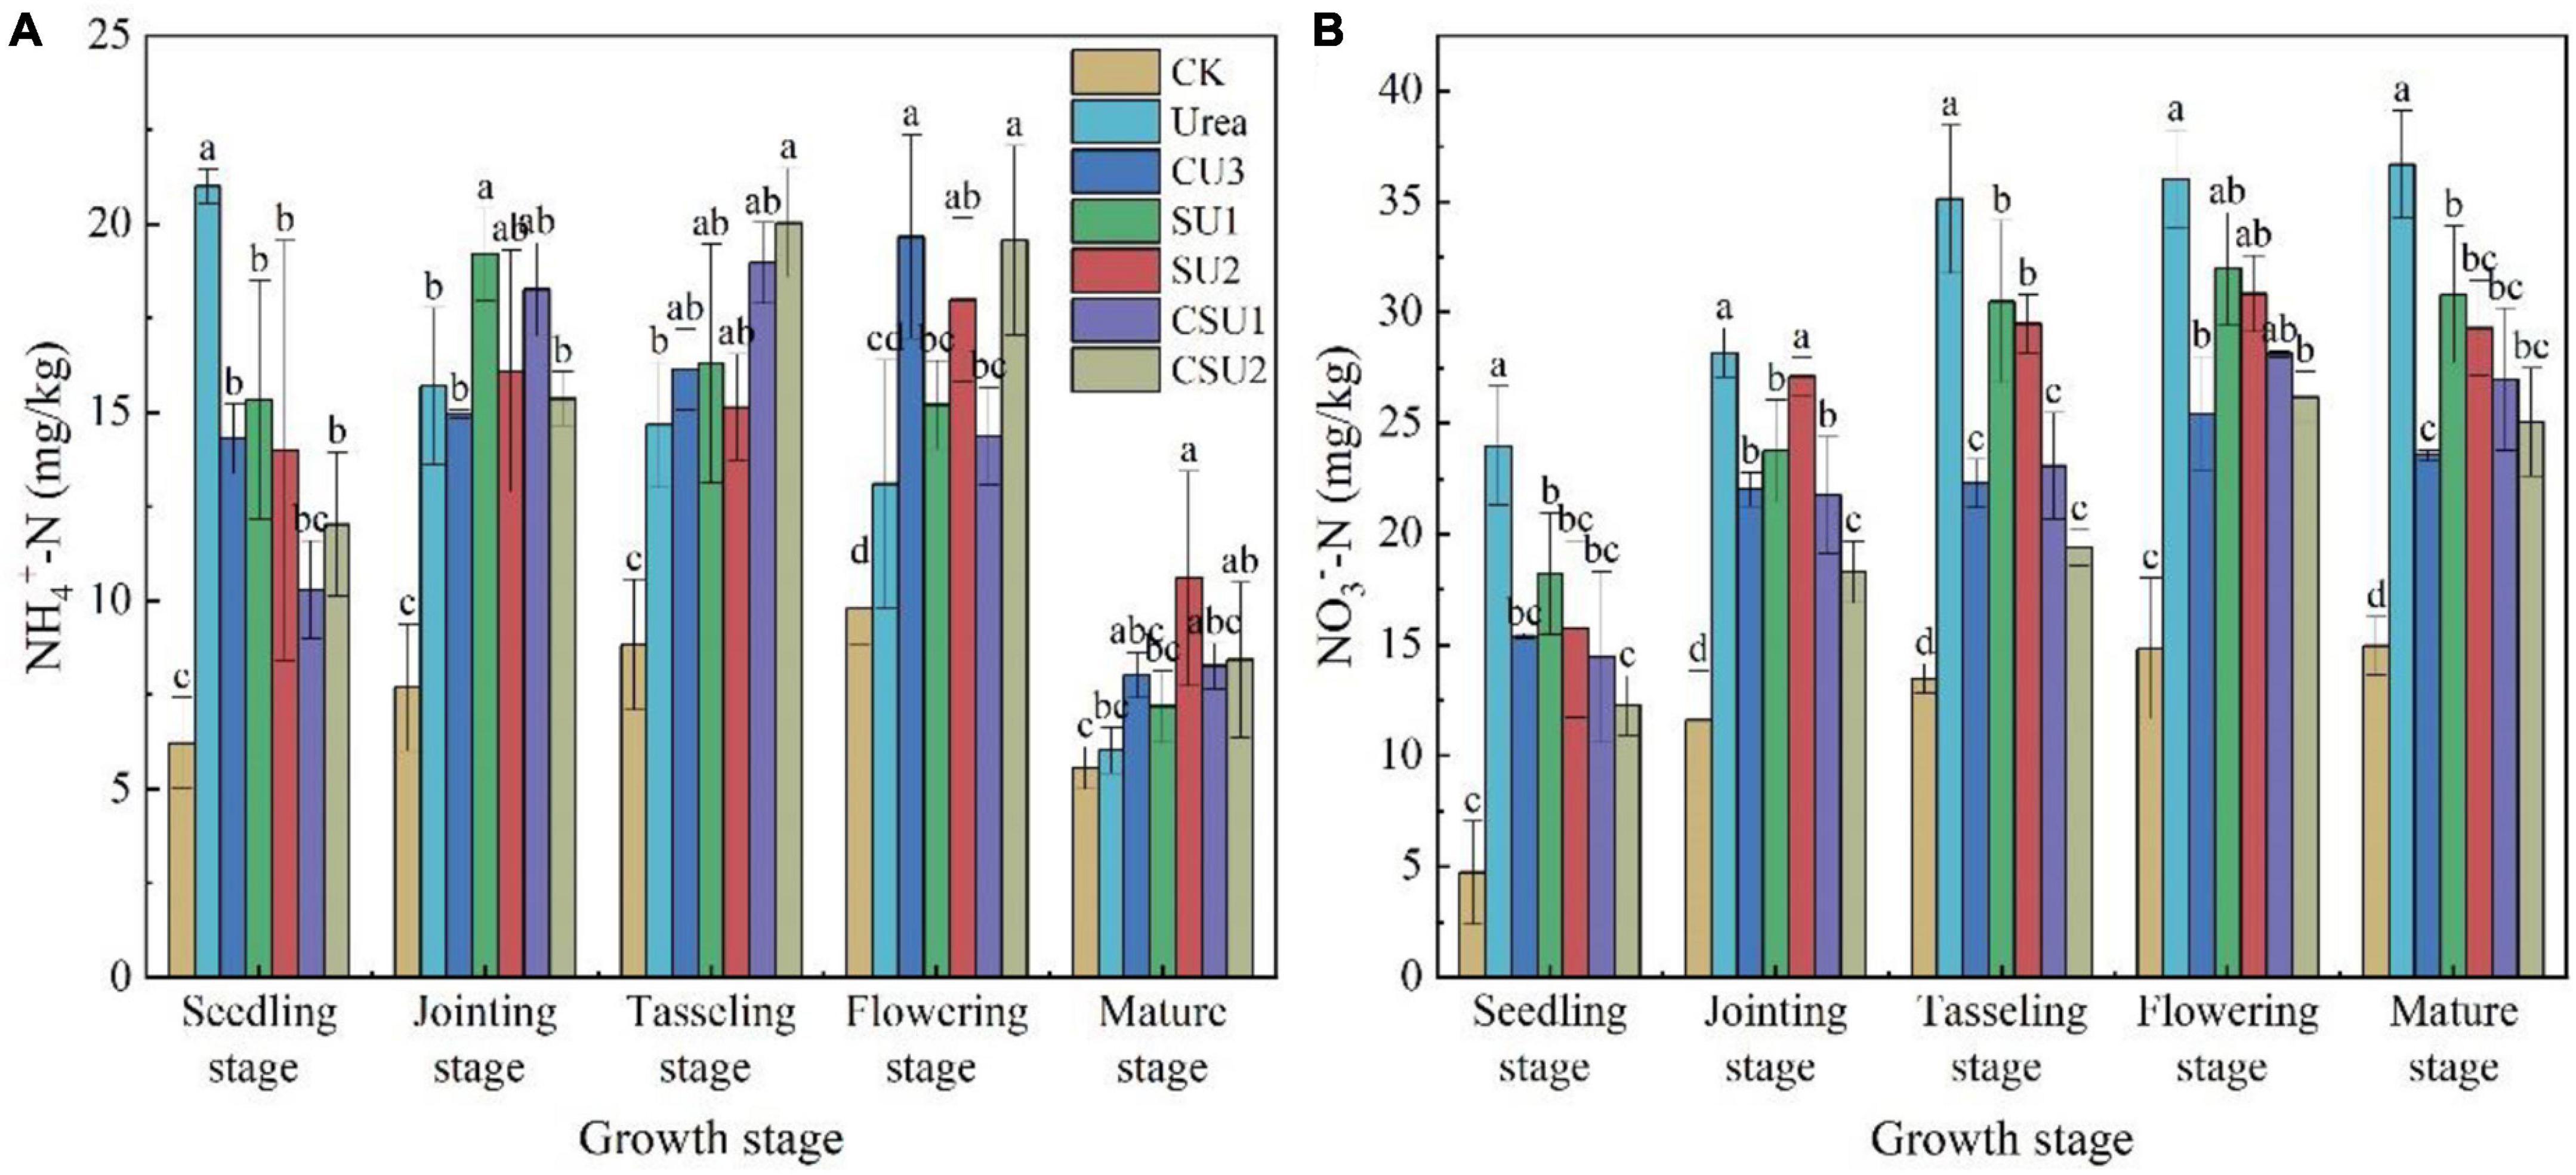
Figure 5. Soil NH4+-N (A) and NO3–-N (B) contents at different growth stages of maize in the different treatments of the pot experiment. CK: no N fertilizer was applied; Urea: conventional urea; CU3: the natural rubber-modified epoxy resin-coated urea fertilizers; SU1 and SU2: urease and nitrification inhibitors treated urea fertilizers; CSU1 and CSU2: urease and nitrification inhibitors treated natural rubber-modified epoxy resin-coated urea fertilizers. Different letters indicate significant differences between treatments for a same growth stage (P < 0.05).
The NO3–-N content increased with time in the conventional urea treatment, whereas it increased with time until the flowering stage and decreased a little bit at the mature stage in the other treatments (Figure 5B). In addition, it was always higher in the conventional urea treatment than in the other fertilization treatments, demonstrating the effectiveness of nitrification inhibitor in inhibiting the oxidation conversion of NH4+-N to NO3–-N. The results of this experiment validated the effects of three different fertilizers: coated (CU3), inhibitor (SUS) and combined coating and inhibitor (CSUS) on soil N transformation. The combined effect of coating and inhibitor was stronger than coating alone or adding inhibitor to increase the nutrient content in the critical period of maize growth and reduce the NO3–-N in the whole growth stage.
The apparent nitrification rate in the conventional urea treatment was high during maize growth (Table 2), resulting in high soil NO3–-N content (Figure 5B). At the jointing stage of maize, the apparent nitrification rate in CU3, SU1, SU2, CSU1, and CSU2 was 7, 14, 2, 16, and 16%, respectively, lower than that in the conventional urea treatment. At the tasseling stage, the apparent nitrification rate in the CSU treatments was on average 26 and 21% lower than that in the SU treatments and conventional urea treatment, respectively. At the flowering and mature stage of maize, the apparent nitrification rate in CSU2 was 21 and 13% lower than that in conventional urea. From the tasseling stage to the maturity stage, the apparent nitrification rate of CU3 was lower than that of SUs treatment. The low apparent nitrification rate in the CSU treatments was due to the presence of the NR-modified ER coating and the biochemical inhibitors (NBPT + DMPP). The coating and inhibitors not only physically slowed down the dissolution of urea, but also chemically and biologically slowed down the hydrolysis and oxidation conversion of urea, reducing NH3 volatilization loss at the early stage of fertilization and NO3–-N leaching loss at the later stage. The coating and inhibitors (CSU) not only physically slowed down the dissolution of urea, but also chemically and biologically slowed down the hydrolysis and oxidation conversion of urea, reducing NH3 volatilization loss at the early stage of fertilization and NO3–-N leaching loss at the later stage.
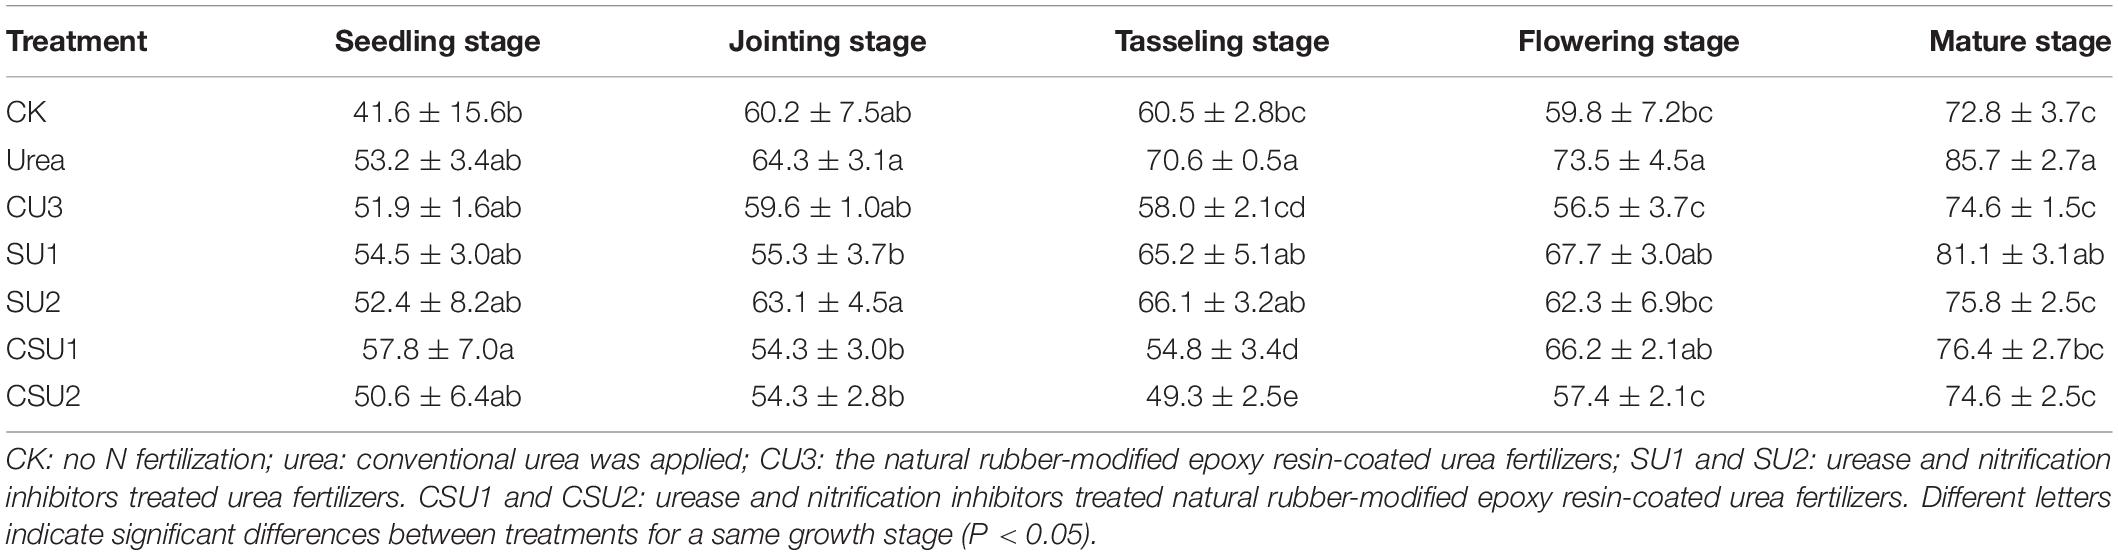
Table 2. Soil apparent nitrification rate (%) at different growth stages of maize in the different treatments.
Urease Activity
The urease activity was always higher in the conventional urea treatment than in the other treatments (Figure 6). Compared with the conventional urea treatment, soil urease activity in the CSU2 treatment was lower by 20, 13, 7, 20, and 32% at the seedling, jointing, tasseling, flowering, and mature stages, respectively. Soil urease activity in the SU treatments was lower than that in the CSU treatments at the seedling and jointing stages but was higher at the tasseling, flowering, and mature stages.
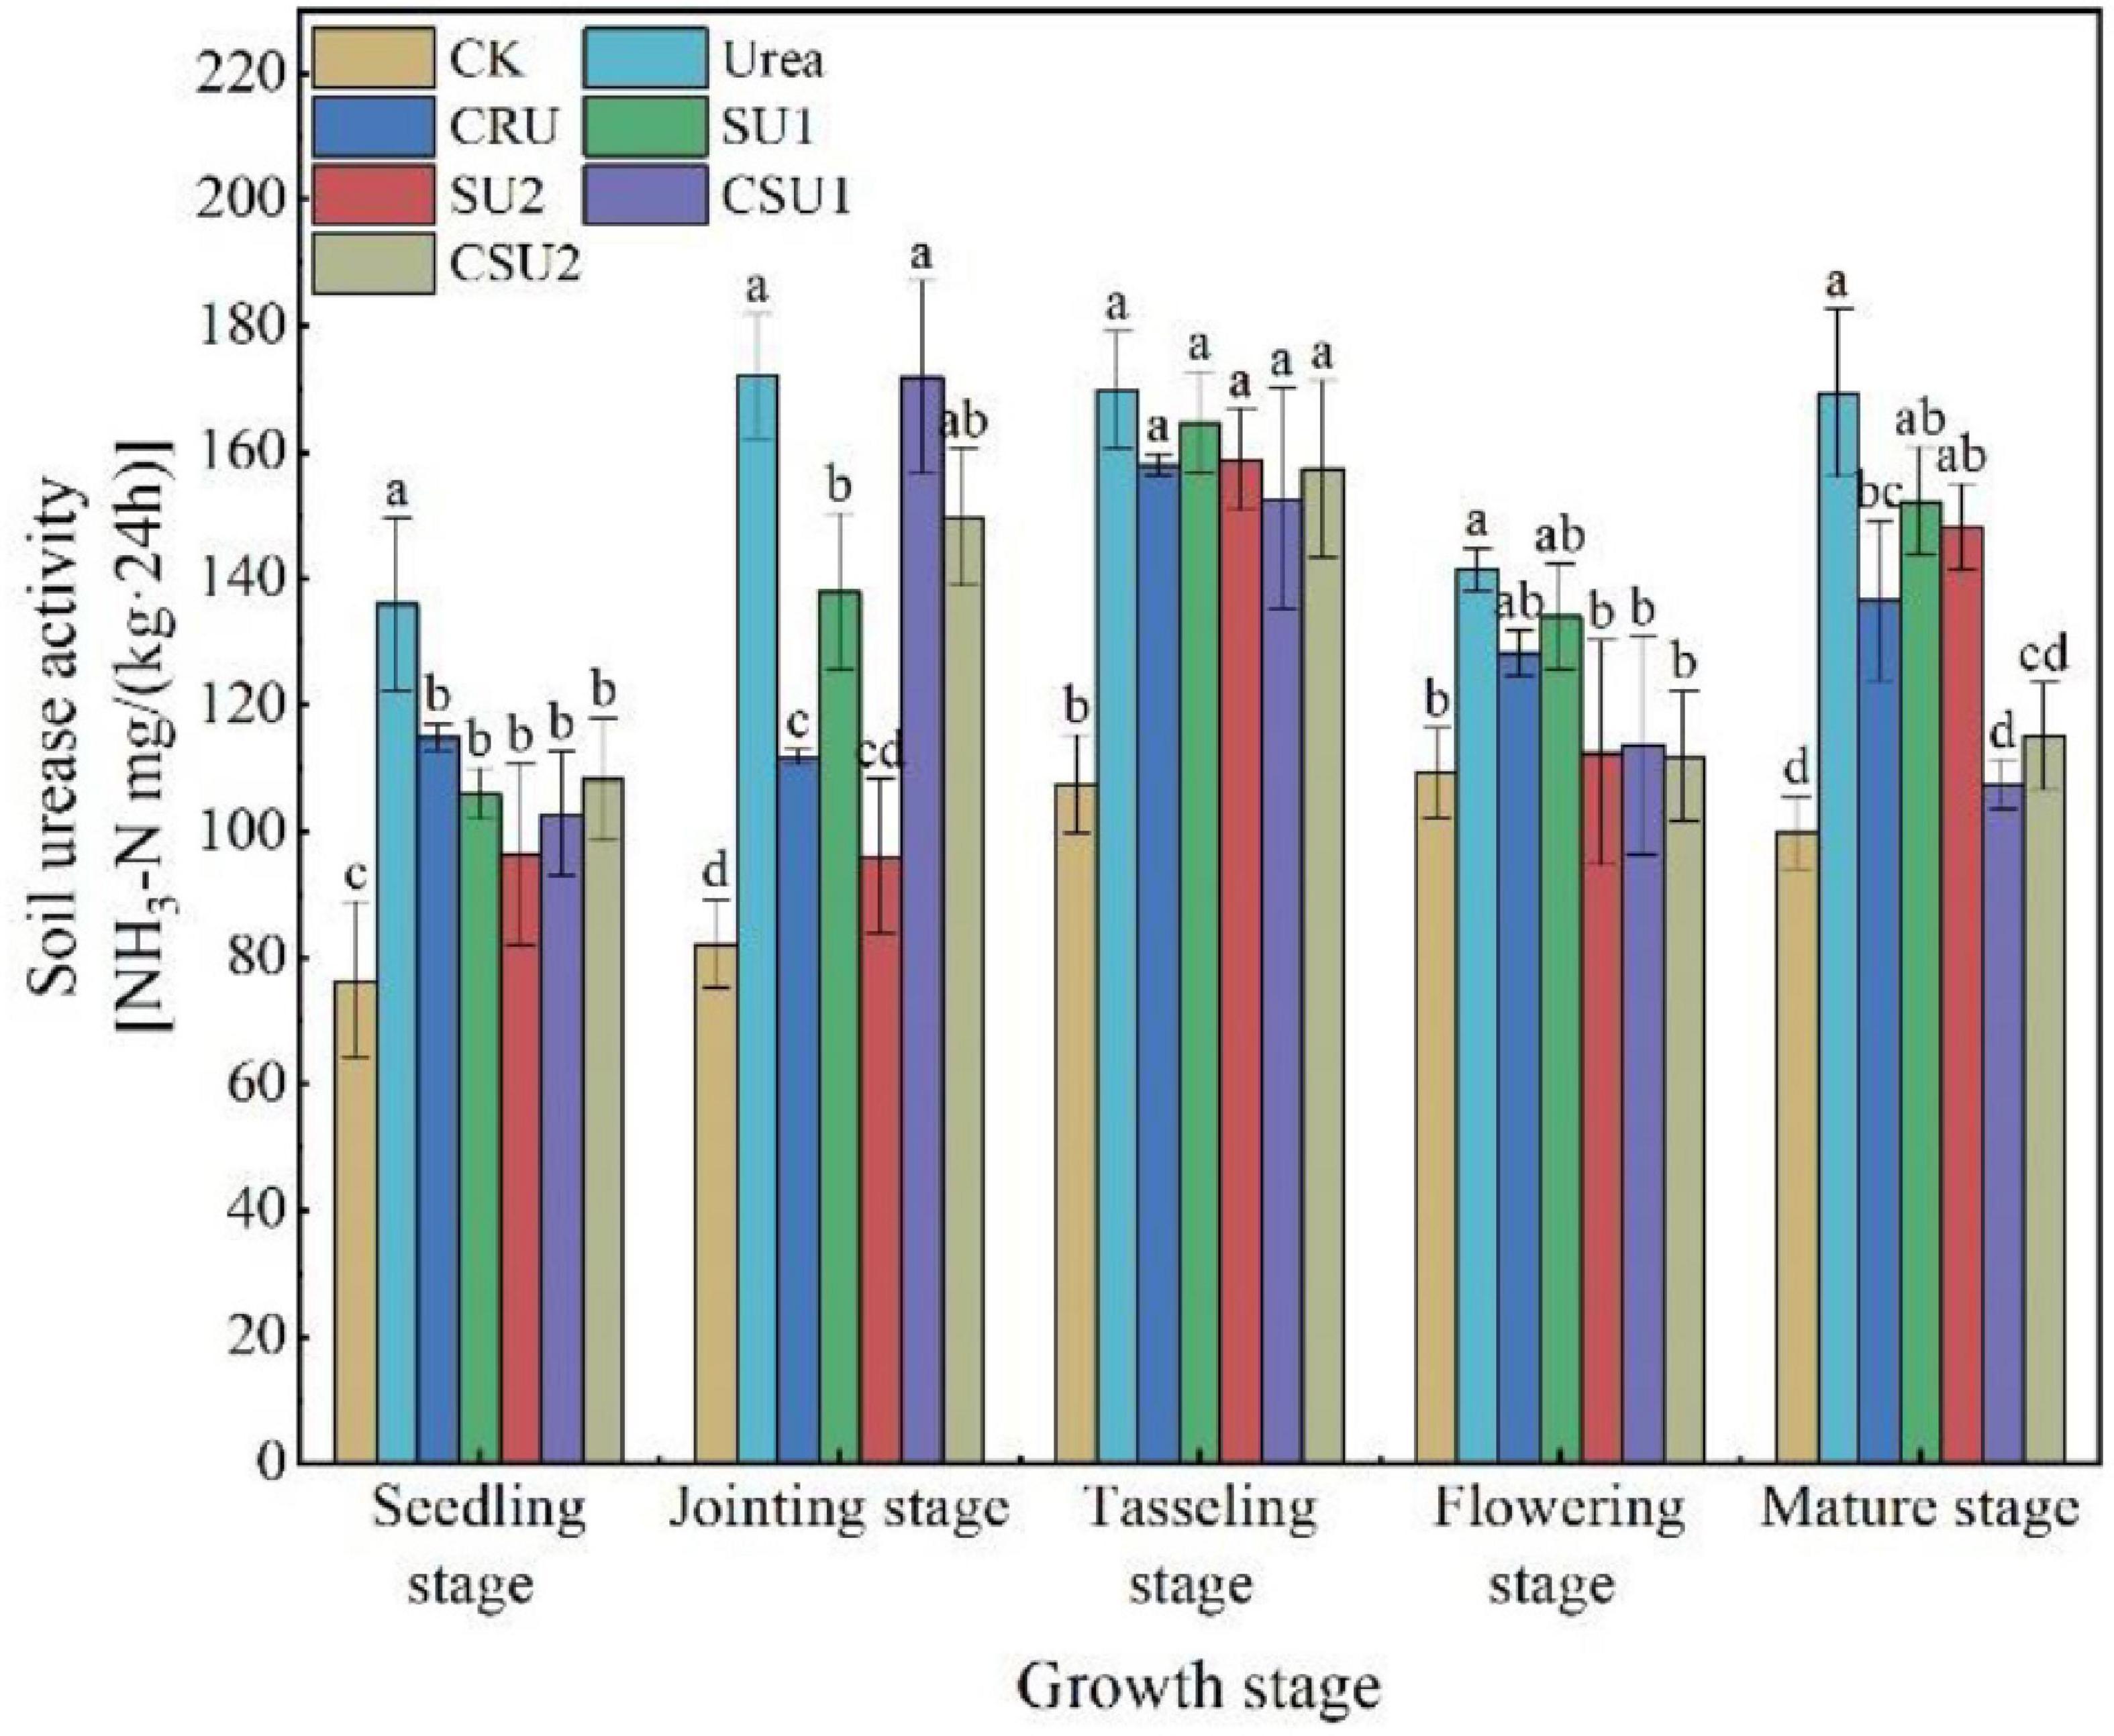
Figure 6. Soil urease activity at different growth stages of maize in the different treatments. CK: no N fertilization; urea: conventional urea; CU3: the natural rubber-modified epoxy resin-coated urea fertilizers; SU1 and SU2: urease and nitrification inhibitors treated urea fertilizers; CSU1 and CSU2: urease and nitrification inhibitors treated natural rubber-modified epoxy resin-coated urea fertilizers. Different letters indicate significant differences between treatments for a same growth stage (P < 0.05).
Plant Height and Grain Yield
Maize plant height in the CU3, SU, and CSU treatments increased more rapidly and was higher than that in CK and the conventional urea treatment at the jointing and tasseling stages (Figure 7). However, plant height in the CU3, SU, and CSU treatments was much smaller than that in CK and the conventional urea treatment at the flowering and mature stages, indicating that the N supply pattern in the CU3, SU, and CSU treatments could meet the N demand of maize in the transition from vegetative growth to reproductive growth of the maize.
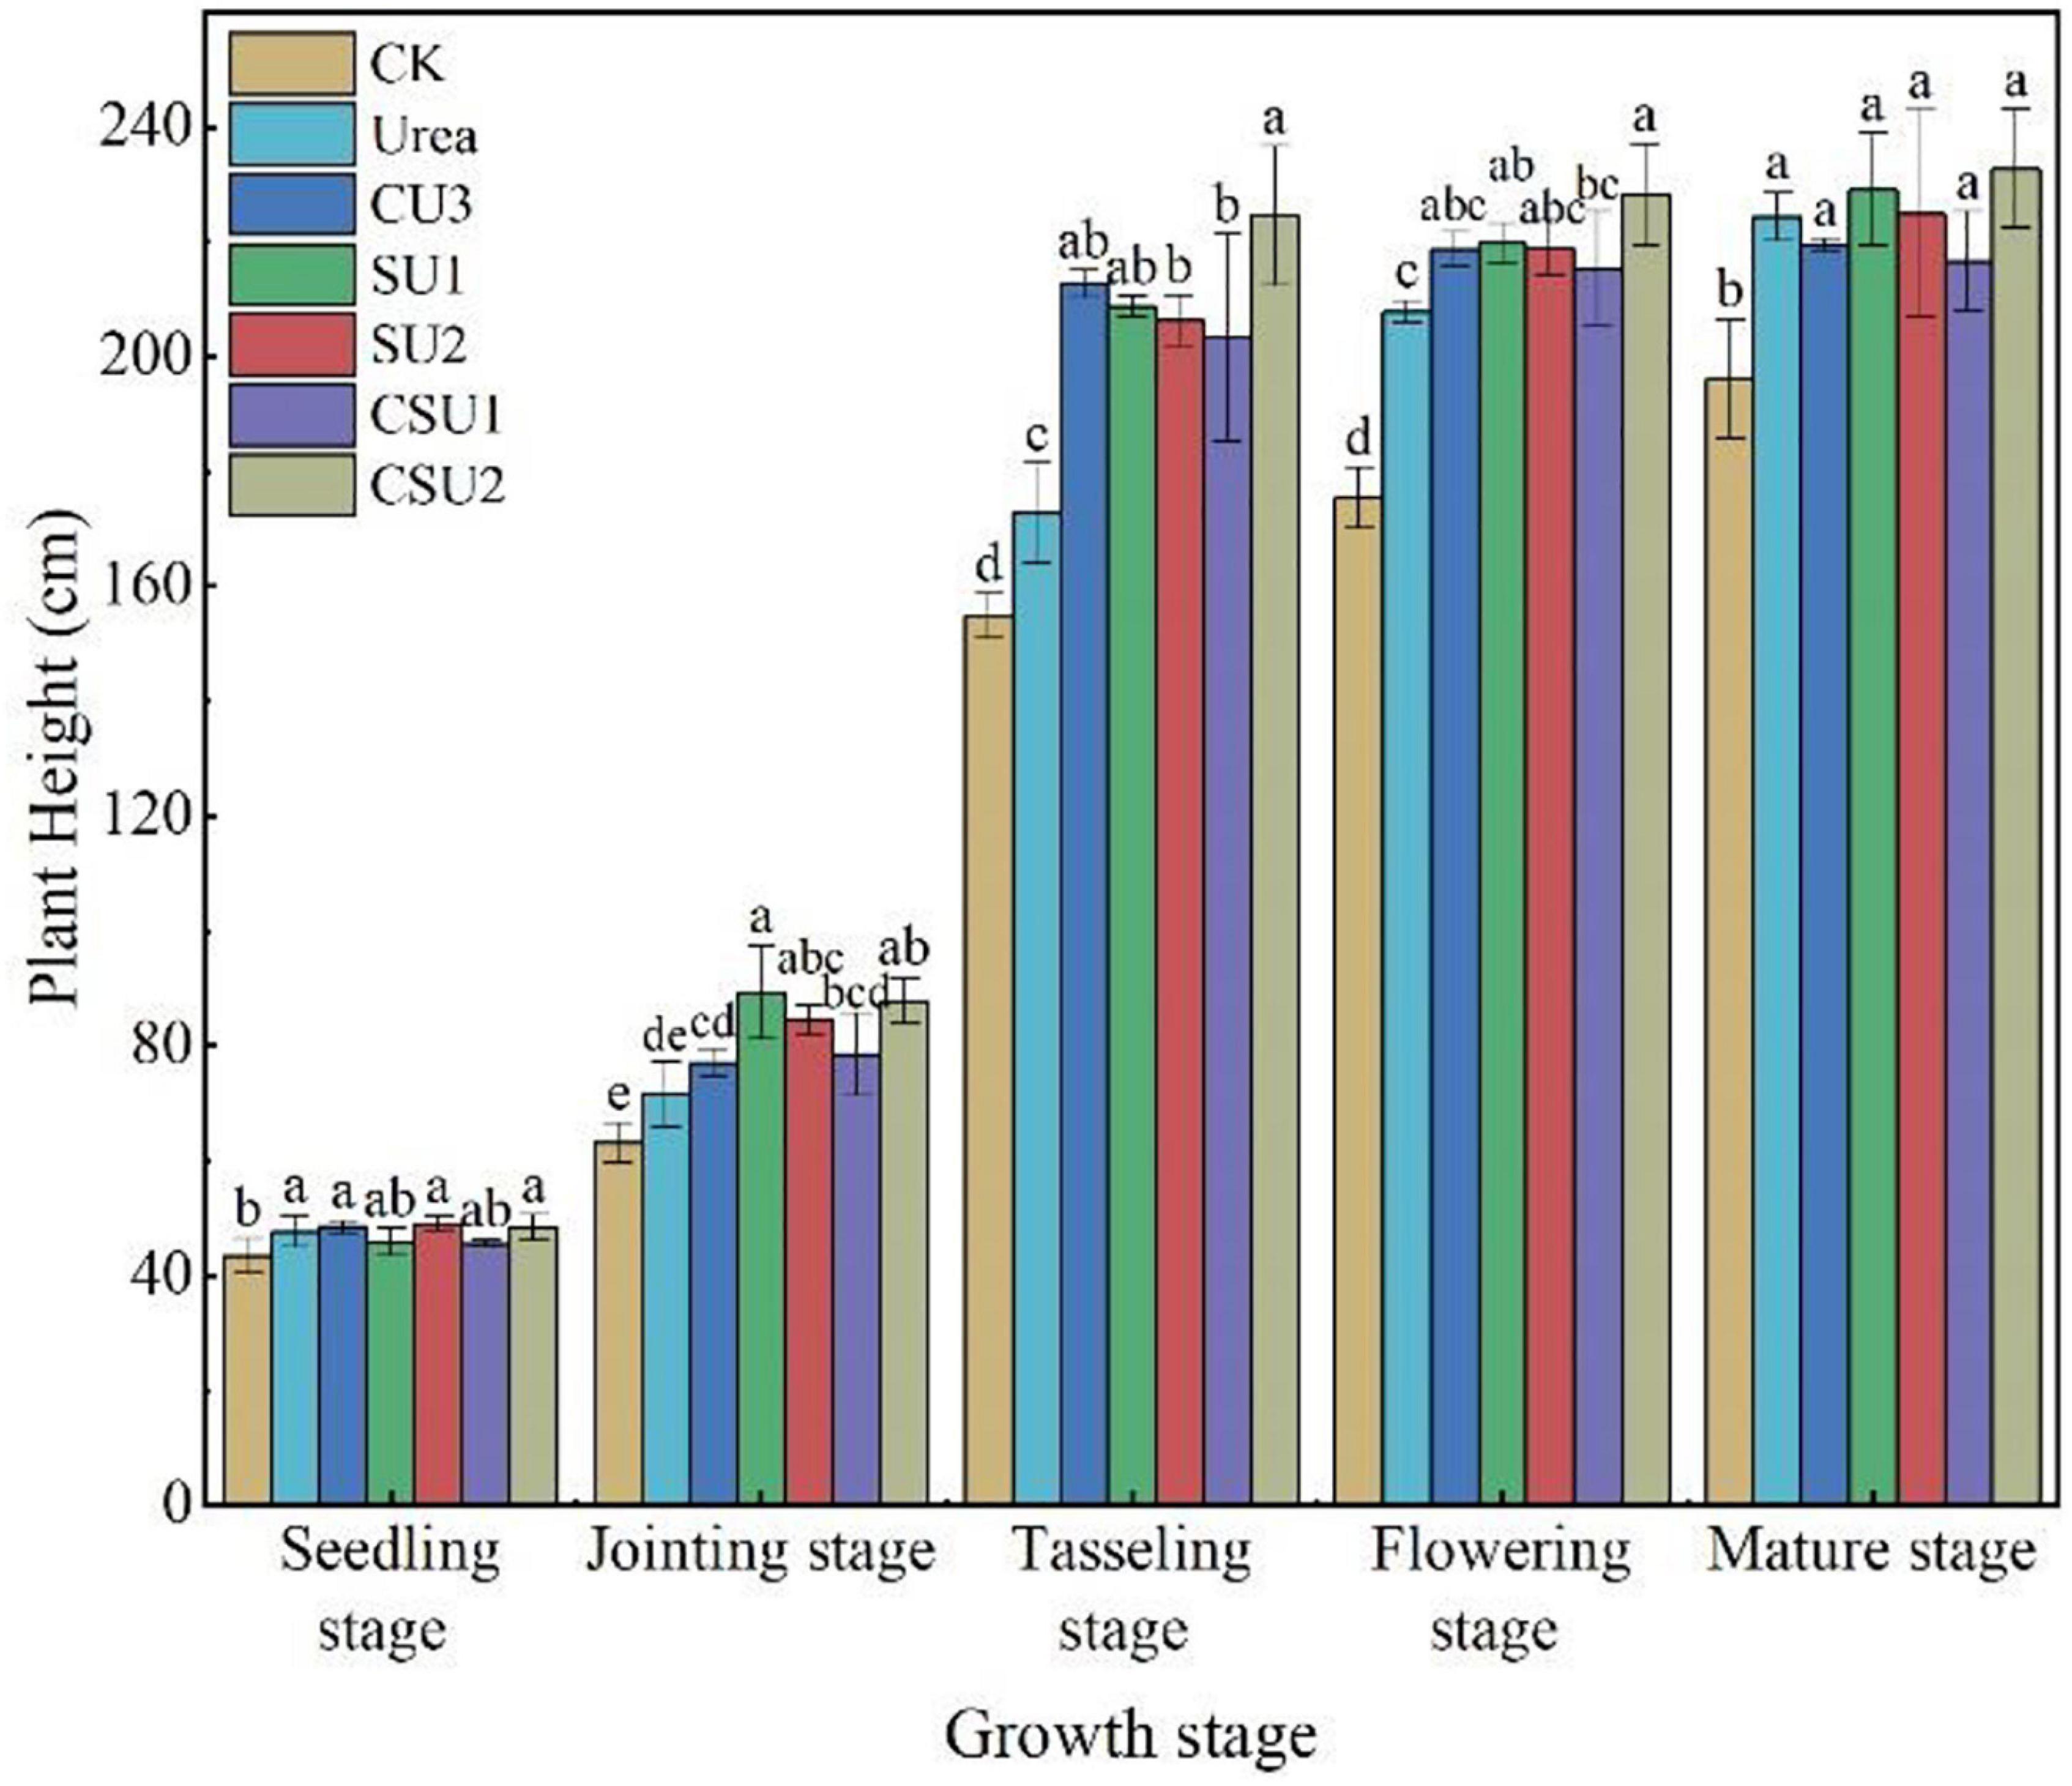
Figure 7. Maize plant height at different growth stages in different treatments. CK: no N fertilization; urea: conventional urea; CU3: the natural rubber-modified epoxy resin-coated urea fertilizers; SU1 and SU2: urease and nitrification inhibitors treated urea fertilizers; CSU1 and CSU2: urease and nitrification inhibitors treated natural rubber-modified epoxy resin-coated urea fertilizers. Different letters indicate significant differences between treatments for a same growth stage (P < 0.05).
The highest maize grain yield was obtained in CSU2, followed by CSU1, CU3, SU1, SU2, and urea (Table 3). Maize grain yield in the CU3, SU, and CSU treatments was 12–79% higher than that in the conventional urea treatment. The grain yield difference between the CSU treatments and the conventional urea treatment was significant. There was no significant difference in maize yield between CU3 and SU treatments. Though the grain yields in the SU treatments were higher than that in the urea treatment, the differences were not significant, indicating that direct exposure of the urea prills and inhibitors to the soil had greatly compromised the agronomic effectiveness of the urea fertilizer and the effectiveness of the inhibitors as well.
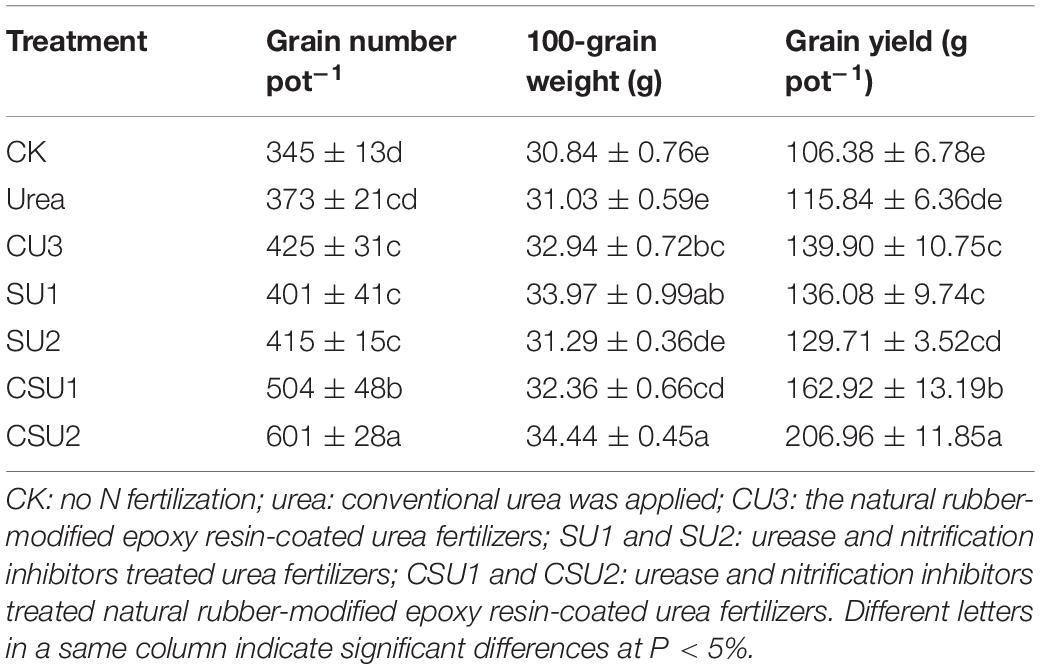
Table 3. Maize grain yield and yield formation factors.
NUE, NFUE, NPFP, and NUTE
The different treatments had significantly different NUE, NFUE, NPFP and NUTE (Table 4). The highest NUE, NFUE, NPFP, and NUTE values were all obtained in CSU2, whereas the lowest values were obtained in the conventional urea treatment. The NUE, NFUE, NPFP, and NUTE values were 46, 30, 46, and 32%, respectively, higher (P < 0.05) in CSU1 and 58, 62, 58, and 29%, respectively, higher (P < 0.05) in CSU2 than in the conventional urea treatment. The highest NUE was obtained in CSU2, followed by CSU1, SU1, CU3, SU2, and urea, which was consistent with the change of maize yield. The NUE values confirm that stabilizing urea with urease and nitrification inhibitors is effective in improving its NUE and that coating can further improve its NUE, implying less N loss to the environment.
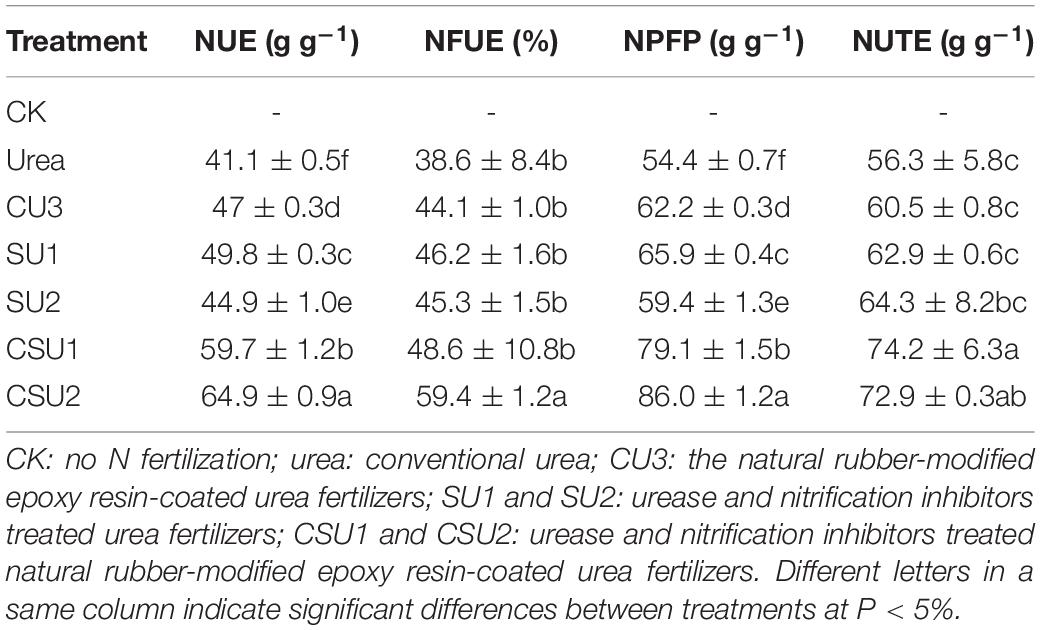
Table 4. Nitrogen use efficiency (NUE), nitrogen fertilizer apparent utilization efficiency (NFUE), partial factor productivity of applied N (NPFP), and nitrogen utilization efficiency (NUTE) of the different treatments.
Discussion
Evaluation of the Controlled Release Mechanism of CUs and CSUs
Nitrogen requirement for maize during the growth stage followed an “S-shaped” curve (Zheng et al., 2017). Therefore, N supplement according to the different nutrient demands in each growth stage is particularly important for a high and stable yield of maize. Conventional quick-acting N fertilizer needs to be topdressing during the crop growth period. Advantageously, the basic application of controlled release EENFs can meet N demand during the crop growth stage and significantly improve the matching degree between soil N supply and crop nutrient demand (Geng et al., 2016; Xiao et al., 2019), promote crop yield and NUE. It was found that the N release performance of controlled release EENFs is related to the characteristics of coating material and thickness, as well as environmental factors such as soil temperature and moisture (Zhang et al., 2018). The difference in coating material characteristics is the direct factor affecting the N release of controlled release EENFs. An et al. (2021) reported that the nutrient release of coated fertilizers mainly has three stages, including the transport of water into the capsule, dissolution of fertilizers and release of the nutrients through coating materials. This experiment used natural rubber (NR)-modified ER as coating material to prepare coated EENFs. The results of the SEM (Figure 1D) showed that the surface of CU3 was smooth, without apparent protrusions, and the surface film holes were moderate. There were a few nutrient channels in the cross section of CU3. It is speculated that the controlled release mechanism of CU3 was consistent with the nutrient diffusion mechanism of conventional resin-coated urea. After coated controlled release EENFs were applied to the soil, as soil moisture penetrates into the membrane shell and dissolves the urea core, the osmotic pressure difference between the inside and outside of the membrane gradually increases. The pressure on the membrane shell changes the microstructure (the density of nutrient channels on the membrane shell increases), and the N was slowly released through the nutrient channel under the action of osmotic pressure. The hydrostatic release curve showed that the nutrient release process of CU3 could be roughly divided into two stages. (1) The first stage (1–7 days) is the slow-release period, in which the cumulative release of N was 20%; (2) The second stage (8–56 days) is the rapid release period, and the cumulative amount of N was 71%. The “N backward shift” phenomenon in hydrostatic release was consistent with high-yield maize still needed to absorb more N to meet crop material synthesis demand in the mid-late growth stage (Wang et al., 2010). The results demonstrated that the content of NR would reduce the controlled release performance as compared with CU0. However, controlling the amount of NR could reduce the amount of ER and reduce the pressure of resin on the soil environment without significantly changing the controlled-release performance of CU0.
To strengthen the matching degree between crop nutrient requirements and soil nitrogen supply, NR mass proportion of 30% in coating was adopted in the subsequent preparation of two EENFs: CSU1 (inhibitors homogeneously distributed in the innermost layer of the coating) and CSU2 (inhibitors sandwiched between urea and coating). Theoretically, the slow dissolution of N and NBPT + DMPP could be controlled simultaneously to realize the dual regulation of conventional urea dissolution and transformation. Li et al. (2020a) reported that the slow-release periods of coated controlled-release urea for N, hydroquinone (HQ), and dicyandiamide (DCD) were 56, 42, and 14 days, respectively. However, because determination of NBPT and DMPP content requires high-performance liquid chromatography (HPLC) (Santos et al., 2020). Therefore, it is difficult to directly determine the activity of NBPT and DMPP in EENFs and the controlled release performance of the organic membrane shell on the inhibitor. Furthermore, there is uncertainty about the true DMPP and NBPT application rate with the coated fertilizers due to eventual loss of inhibitor while treating the fertilizer with the coating. For this reason, we used other methods to prove the sustained release effect of the physical film on N, NBPT, and DMPP. Firstly, we compared the SEM of CU3 and CSUs to clarify the effect of adding inhibitors on the envelope. Secondly, we compared the effects of CU3, SUs, and CSUs on soil N regulation ability, corn growth and yield to clarify the combined effect of coating, inhibitor, and coating + inhibitor. The SEM images of the surface and cross-section of CSU1 and CSU2 showed that spraying the inhibitor on the urea surface could improve the smoothness of the urea surface and make the film closely combined with urea (Figure 8D). Compared with CU3 (Figure 1D), the surface of the membrane shell of CSU2 was smooth, and the adhesion between the membrane shell and the urea surface was closer (Figures 8C,D). Combined with the CU3 nutrient release characteristic curve (Figure 2) and the scanning electron microscope test of CSUs (Figure 8), CSU1 and CSU2 could simultaneously realize the slow dissolution of N and inhibitors, and the controlled release performance of CSU2 was better than that of CSU1.
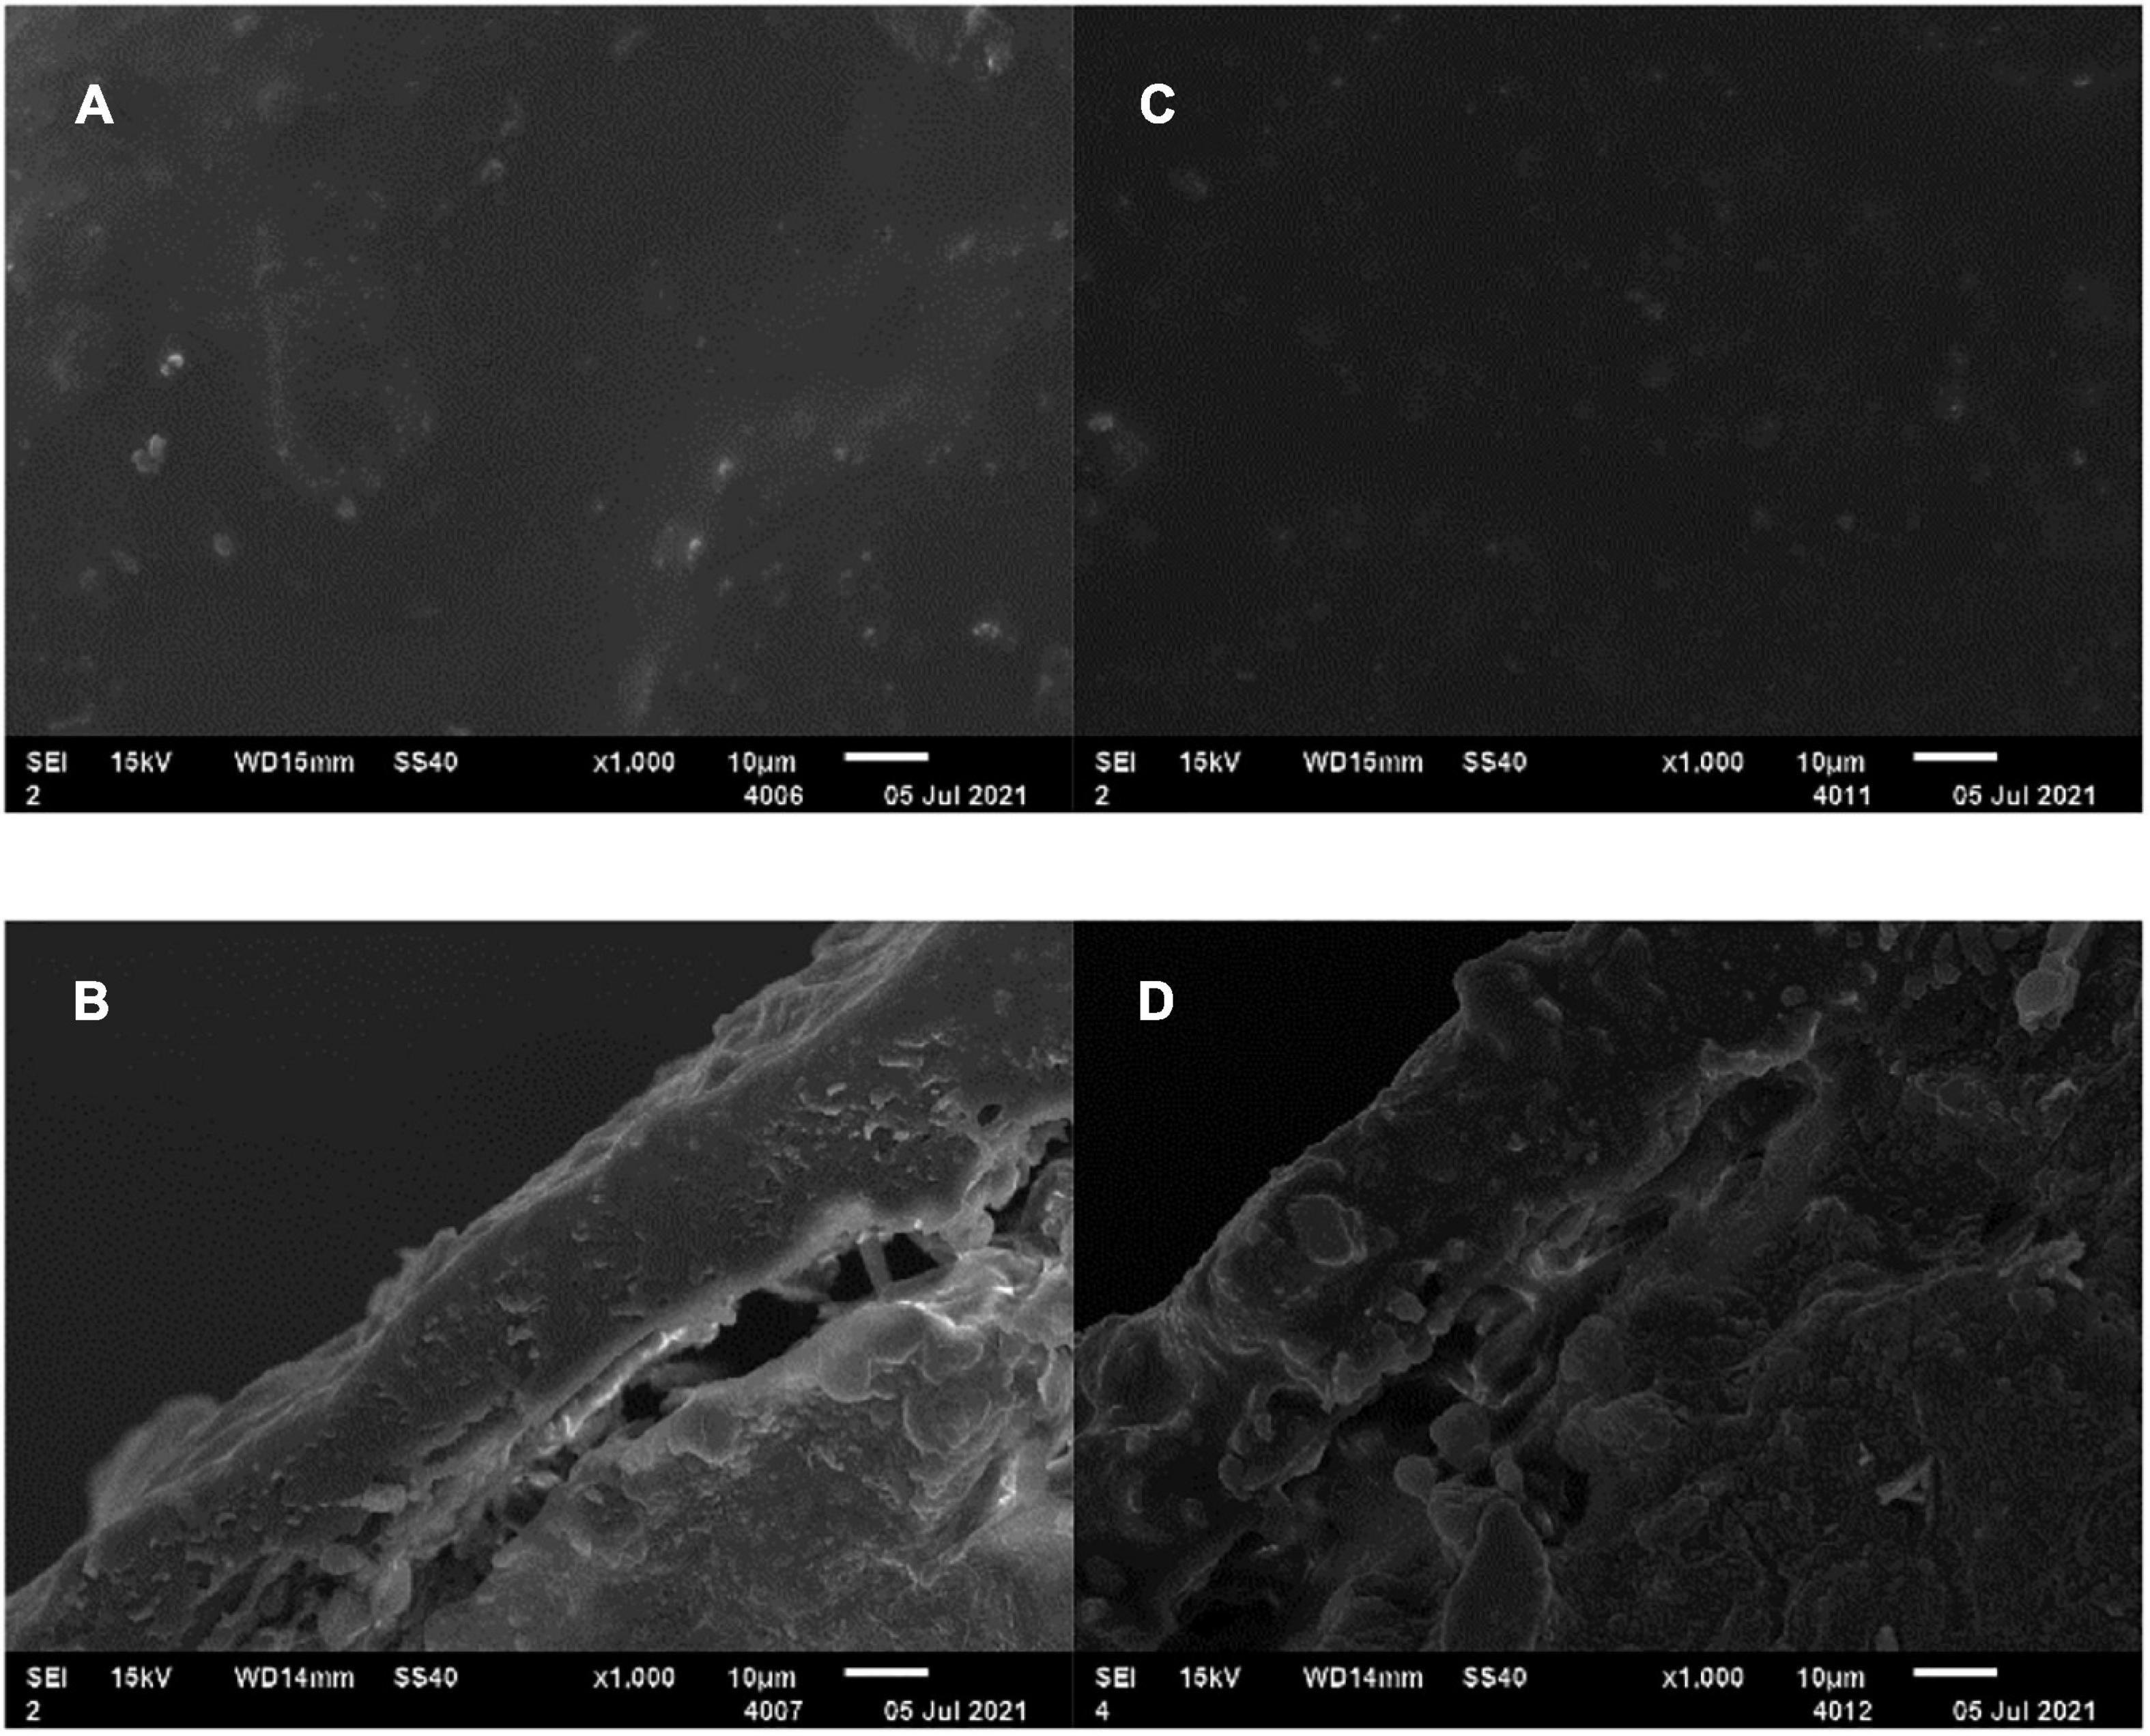
Figure 8. SEM of CSU1 and CSU2. (A) SEM of CSU1 surface (×1000); (B) CSU1 section electron microscope (×1000); (C) SEM of CSU2 surface (×1000); (D) CSU2 section electron microscope (×1000).
Evaluation of the N Loss Potential and Soil Nitrogen Supply Capacity of the EENFs
Both NH4+-N and NO3--N are the primary N forms absorbed by the plants (Zheng et al., 2017) and also the primary source of N loss (Xiao et al., 2019). After urea is applied to soil, it is rapidly hydrolyzed to (NH4)2CO3 under the soil urease, decomposition of the (NH4)2CO3 produces NH4+-N. The rapid hydrolysis of urea will cause a large amount of surplus NH4+-N, which is converted to NH3 (Adotey et al., 2017). However, this phenomenon provides sufficient substrate for nitrification so that soil nitrification is active (Xiao et al., 2019), resulting in the loss of NO3--N, N2O, and N2. Urease and ammonia-oxidizing bacteria are the main factors of the soil N cycle. Inhibiting urease and ammonia-oxidizing bacteria can delay urea hydrolysis and transformation. Many studies have improved the duration of inhibitors by controlling the slow release of inhibitors. Li et al. (2020a) reported that the combined coating of HQ and urea could significantly reduce soil urease activity and prolong the action time of urease inhibitors during the growth period of wheat. Santos et al. (2020) found that the combined NBPT and biodegradable biofilm materials prepare controlled release urea, which could prolong the action time of NBPT and reduce the loss of N and NH3 volatilization. Zhang (2004) reported that the controlled dissolution of urea and DCD could significantly improve the nitrification inhibition effect. In this study, the results of the EENFs on NH3 volatilization loss and leaching loss were consistent with previous research conclusions. In addition, the leaching and NH3 volatilization tests were carried out without crop interference. The soil NH3 volatilization curves of SU1, SU2, CSU1, and CSU2 changed steadily throughout the culture stage (Figure 3). In the later stage of the leaching test, the leaching rate of NO3--N of CSU1 and CSU2 was higher than that of SU1, SU2, and U (Figure 4). The changing trend of Figures 4E,F showed that the NBPT + DMPP could reduce N loss at the initial stage of fertilization, ensure sufficient N supply in the later stage of soil, which was also confirmed in the maize pot experiment (Figure 5). The results of the N loss potential clearly demonstrated that the urease and nitrification inhibitors effectively reduced N loss from urea, but their effectiveness weakened and N loss accelerated over time. Furthermore, compared with SU, CU3 was better in reducing N leaching loss, because the existence of the coating layer hinders the direct contact of nitrogen with the soil. When inhibitors treated urea were coated, both the fertilizer and the inhibitors were protected and the effective period of the inhibitors was prolonged. In addition, the inhibitors were more effective when sandwiched between the coating and the urea (CSU2) than when treated in the inner layer of the coating (CSU1).
Consistently, the higher availability of nutrients in the soil, the greater nutrients utilization by the crop plant (Alhaj Hamoud et al., 2019a). The change trend of inorganic N in maize pot experiment was found that different additional methods of NBPT + DMPP would affect soil N loss and soil N supply capacity. SU1 and SU2 reduced N leaching loss, while the accumulation of leaching loss increased rapidly in the later stage of culture as compared with the conventional urea. The leaching rate curves of CSU1 and CSU2 were stable during the culture period, these may be due to the physical film on the outer layer of the inhibitor, CSU1 and CSU2 could maintain the appropriate content of soil nutrients during the growth stage of maize (Figure 5), which might be due to CSU2 having two main regulatory effects on soil N transformation. Firstly, the physical film avoided the direct contact between urea and inhibitor and soil and controlled the slow release of urea and inhibitor. Secondly, the combination of NBPT and DMPP can, respectively, inhibit urease activity (Figure 6) and reduce the apparent nitrification rate of soil NH4+-N (Table 2), and regulate the transformation process of dissolving N. In addition, the results of the maize pot experiment showed that the NH4+-N in CSU2 soil reached the maximum at the heading stage of maize (Figure 5) to ensure sufficient N supply in the middle and late stage of maize growth.
Effects of EENFs on Maize Yield and NUE
Crop yield and NUE are essential indicators for rational fertilization (Feng et al., 2020). The researchers (Yang et al., 2011; Geng et al., 2016; Zheng et al., 2016) reported that controlled-release urea met the long-term N demand of crops and improved crop yield and NUE. Li et al. (2020b) discussed that the combination of urea and HQ coated controlled-release urea could increase wheat yield by 56% compared with U. This experiment found that EENFs increased production significantly compared with conventional urea, consistent with the above report. Compared with U, CU3, SUs, and CSUs could promote the growth of maize and significantly increase maize yield and NUE 12–79% (Table 3) and 10–59% (Table 4), respectively. The growth stage of summer maize is from June to October each year, and the soil temperature and moisture are relatively high, which can accelerate the process of soil N conversion. Uncoated, stabilized EENFs (SUs) could regulate N transformation in the early stage of maize growth, however, the regulation ability of N delayed in the late stage of maize growth. In addition, CU3 could prevent the dissolution of N to a certain extent, but it was also greatly affected by the soil environment. The inhibitor and urea were co-coated (CSUs), and the hindering effect of the physical film layer could prolong the dissolution time of the inhibitor and N, and reduce the degradation and fixation of the inhibitor in the soil. The combined effect of coating and inhibitor strengthens the N supply capacity of the soil, guarantees effective nutrient supply in the middle and late stages of maize growth. Furthermore, the application of coated, stabilized EENFs in maize pot experiment was conducive to improve the matching degree between soil nutrient supply and maize nutrient demand, so that CSUs was better than SUs and CU3 in improving maize yield and NUE.
Conclusion
Incorporation of NR in the ER coating reduces the usage of ER, whose accumulation in soil could be an environmental concern. When the ratio of ER to NR was 7:3, the NR-modified ER-coated urea presented good N release performance with a low first-day release and a long release period.
The incorporation method of urease and nitrification inhibitors significantly affected the N loss (NH3 volatilization, NH4+ and NO3– leaching) and agronomic effectiveness of the CSUs. Compared with CSU1 where the inhibitors were homogeneously distributed in the innermost layer of the coating, less N was lost from CSU2 where the inhibitors were sandwiched between the fertilizer and the coating. In the treatment with CSU2 application of the pot experiment, soil NH4+ was low at the seedling and mature stages of maize but was high at the jointing, tasseling, and flowering stages, well matching the dynamic N demand of maize. Application of CSU2 significantly increased maize grain yield 27% and nitrogen use efficiency 9% as compared with CSU1 application. The results of this study provide a support for preparation of novel environmentally friendly coated, stabilized EENFs not only with low N loss and high NUE but also with less usage of ER.
Data Availability Statement
The original contributions presented in the study are included in the article/supplementary material, further inquiries can be directed to the corresponding author/s.
Author Contributions
YD: conceptualization, methodology, writing – reviewing and editing, and supervision. ZQ: data curation, writing – original draft preparation, software, and investigation. MW and YL: data curation, writing – original draft preparation, visualization, and investigation. MH: supervision. XD: software and validation. All authors contributed to the article and approved the submitted version.
Funding
This research was funded by the National Key Research and Development Program of China (No. 2017YFD0201705) and the Major Agricultural Application Technology Innovation Projects of Shandong Province of China (No. SD2019ZZ021).
Conflict of Interest
The authors declare that the research was conducted in the absence of any commercial or financial relationships that could be construed as a potential conflict of interest.
Publisher’s Note
All claims expressed in this article are solely those of the authors and do not necessarily represent those of their affiliated organizations, or those of the publisher, the editors and the reviewers. Any product that may be evaluated in this article, or claim that may be made by its manufacturer, is not guaranteed or endorsed by the publisher.
References
Abalos, D., Jeffery, S., Sanz-Cobena, A., Guardia, G., and Vallejo, A. (2014). Meta-analysis of the effect of urease and nitrification inhibitors on crop productivity and nitrogen use efficiency. Agricult. Ecosyst. Environ. 189, 136–144. doi: 10.1016/j.agee.2014.03.036
Adotey, N., Kongchum, M., Li, J., Whitehurst, G. B., Sucre, E., and Harrell, D. L. (2017). Ammonia Volatilization of Zinc Sulfate-Coated and NBPT-Treated Urea Fertilizers. Agronomy J. 109, 2918–2926. doi: 10.2134/agronj2017.03.0153
Alhaj Hamoud, Y., Wang, Z., Guo, X., Shaghaleh, H., Sheteiwy, M., Chen, S., et al. (2019b). Effect of irrigation regimes and soil texture on the potassium utilization efficiency of rice. Agronomy 2019:9020100. doi: 10.3390/agronomy9020100
Alhaj Hamoud, Y., Shaghaleh, H., Sheteiwy, M., Guo, X., Elshaikh, N. A., Ullah Khan, N., et al. (2019a). Impact of alternative wetting and soil drying and soil clay content on the morphological and physiological traits of rice roots and their relationships to yield and nutrient use-efficiency. Agricult. Water Manage. 223:105706. doi: 10.1016/j.agwat.2019.105706
An, X., Wu, Z., Qin, H., Liu, X., He, Y., Xu, X., et al. (2021). Integrated co-pyrolysis and coating for the synthesis of a new coated biochar-based fertilizer with enhanced slow-release performance. J. Cleaner Product. 283:124642. doi: 10.1016/j.jclepro.2020.124642
Araujo, B. R., Romao, L. P. C., Doumer, M. E., and Mangrich, A. S. (2017). Evaluation of the interactions between chitosan and humics in media for the controlled release of nitrogen fertilizer. J. Environ. Manage. 190, 122–131. doi: 10.1016/j.jenvman.2016.12.059
Azeem, B., KuShaari, K., Man, Z. B., Basit, A., and Thanh, T. H. (2014). Review on materials & methods to produce controlled release coated urea fertilizer. J. Control Release 181, 11–21. doi: 10.1016/j.jconrel.2014.02.020
Engel, R. E., Towey, B. D., and Gravens, E. (2015). Degradation of the Urease Inhibitor NBPT as Affected by Soil pH. Soil Sci. Soc. Am. J. 79, 1674–1683. doi: 10.2136/sssaj2015.05.0169
Feng, X., Zhan, X., Wang, Y., Zhao, Y., Wang, X., and Li, J. (2020). Effects of stabilized nitrogen fertilizer reduction on nitrogen uptake of spring maize and inorganic nitrogen supply in soils. J. Plant Nutrit. Fertiliz. 26, 1216–1225.
GAQS, IQPRC, SA (2009). Slow release fertilizer: GB/T 23348-2009. Beijing: Standards Press of China.
Geng, J., Chen, J., Sun, Y., Zheng, W., Tian, X., Yang, Y., et al. (2016). Controlled Release Urea Improved Nitrogen Use Efficiency and Yield of Wheat and Corn. Agronomy J. 108, 1666–1673. doi: 10.2134/agronj2015.0468
Huang, J., Huang, Z., Jia, X., Hu, R., and Xiang, C. (2015). Long-term reduction of nitrogen fertilizer use through knowledge training in rice production in China. Agricult. Syst. 135, 105–111. doi: 10.1016/j.agsy.2015.01.004
Huang, J., Xu, C., Ridoutt, B. G., Wang, X., and Ren, P. (2017). Nitrogen and phosphorus losses and eutrophication potential associated with fertilizer application to cropland in China. J. Cleaner Product. 159, 171–179. doi: 10.1016/j.jclepro.2017.05.008
Ji, J., Li, Y., Liu, S., Tong, Y., Ren, G., Li, J., et al. (2017). Effects of Controlled-Release Urea on Grain Yield of Spring Maize, Nitrogen Use Efficiency and Nitrogen Balance. J. Agricult. Resour. Environ. 34, 153–160.
Ji, Y., Liu, G., Ma, J., Zhang, G., and Xu, H. (2014). Effects of Urea and Controlled Release Urea Fertilizers on Methane Emission from Paddy Fields: A Multi-Year Field Study. Pedosphere 24, 662–673. doi: 10.1016/s1002-0160(14)60052-7
Ji, Y., Liu, G., Ma, J., Zhang, G., Xu, H., and Yagi, K. (2013). Effect of controlled-release fertilizer on mitigation of N2O emission from paddy field in South China: a multi-year field observation. Plant Soil 371, 473–486. doi: 10.1007/s11104-013-1700-6
Ju, X., and Gu, B. (2014). Status-quo, problem and trend of nitrogen fertilization in China. J. Plant Nutrit. Fertiliz. 20, 783–795.
Kawakami, E. M., Oosterhuis, D. M., Snider, J. L., and Mozaffari, M. (2012). Physiological and yield responses of field-grown cotton to application of urea with the urease inhibitor NBPT and the nitrification inhibitor DCD. Eur. J. Agronomy 43, 147–154. doi: 10.1016/j.eja.2012.06.005
Khampuang, K., Rerkasem, B., Lordkaew, S., and Prom-u-thai, C. (2021). Nitrogen fertilizer increases grain zinc along with yield in high yield rice varieties initially low in grain zinc concentration. Plant Soil 2021:05090–w. doi: 10.1007/s11104-021-05090-w
Kjeldahl, J. (1883). Neue Methode zur Bestimmung des Stickstoffs in organischen Körpern. Zeitschrift für Analytische Chemie 22, 366–382.
Li, Q., Yang, A., Wang, Z., Roelcke, M., Chen, X., Zhang, F., et al. (2015). Effect of a new urease inhibitor on ammonia volatilization and nitrogen utilization in wheat in north and northwest China. Field Crops Res. 175, 96–105. doi: 10.1016/j.fcr.2015.02.005
Li, Y., Wang, M., Zhang, Q., Zhu, Y., Dong, Y., and He, M. (2020b). Effects of coated urease inhibitor synergic urea on wheat growth and its mechanism. J. Soil Water Conservat. 34, 283–289. doi: 10.13870/j.cnki.stbcxb.2020.02.040
Li, Y., He, M., Dai, X., and Dong, Y. (2020a). Preparation of dual controlled release urea with nitrogen inhibitor and resine coating and the effects on soil nitrogen supply capacity and wheat yield. J. Plant Nutrit. Fertiliz. 26, 1612–1624.
Nasima, J. (2011). A field evaluation of coated urea with biodegradable materials and selected urease inhibitors. Afr. J. Biotechnol. 10:2415. doi: 10.5897/ajb11.2415
Omara, P., Aula, L., Oyebiyi, F., and Raun, W. R. (2019). World Cereal Nitrogen Use Efficiency Trends: Review and Current Knowledge. Agrosyst. Geosci. Environ. 2, 1–8. doi: 10.2134/age2018.10.0045
Pereira, E. I., Nogueira, A. R., Cruz, C. C. T., Guimarães, G. G. F., Foschini, M. M., Bernardi, A. C. C., et al. (2017). Controlled Urea Release Employing Nanocomposites Increases the Efficiency of Nitrogen Use by Forage. ACS Sustainable Chem. Engine. 5, 9993–10001. doi: 10.1021/acssuschemeng.7b01919
Santos, C. F., Silva Aragão, O. O. D., Silva, D. R. G., Jesus, E. D. C., Chagas, W. F. T., Correia, P. S., et al. (2020). Environmentally friendly urea produced from the association of N-(n-butyl) thiophosphoric triamide with biodegradable polymer coating obtained from a soybean processing byproduct. J. Cleaner Prod. 276:123014. doi: 10.1016/j.jclepro.2020.123014
Savin, R., Sadras, V. O., and Slafer, G. A. (2019). Benchmarking nitrogen utilisation efficiency in wheat for Mediterranean and non-Mediterranean European regions. Field Crops Res. 241:107573. doi: 10.1016/j.fcr.2019.107573
Souza, E. F. C., Rosen, C. J., and Venterea, R. T. (2019). Contrasting effects of inhibitors and biostimulants on agronomic performance and reactive nitrogen losses during irrigated potato production. Field Crops Res. 240, 143–153. doi: 10.1016/j.fcr.2019.05.001
Tian, H., Liu, Z., Zhang, M., Guo, Y., Zheng, L., and Li, Y. (2019). Biobased Polyurethane, Epoxy Resin, and Polyolefin Wax Composite Coating for Controlled-Release Fertilizer. ACS Appl. Mater. Interf. 11, 5380–5392. doi: 10.1021/acsami.8b16030
Wang, Y., Li, C., Tan, J., Han, Y., and Zhang, X. (2010). Studies on Plant Nitrogen Accumulation Characteristics and the Effect of Single Application of Base Fertilizer on Super-High-Yield Summer Maize. Sci. Agricult. Sin. 43, 3151–3158.
Xiao, Y., Peng, F., Zhang, Y., Wang, J., Zhuge, Y., Zhang, S., et al. (2019). Effect of bag-controlled release fertilizer on nitrogen loss, greenhouse gas emissions, and nitrogen applied amount in peach production. J. Cleaner Prod. 234, 258–274. doi: 10.1016/j.jclepro.2019.06.219
Yang, Y., Tong, Z., Geng, Y., Li, Y., and Zhang, M. (2013). Biobased polymer composites derived from corn stover and feather meals as double-coating materials for controlled-release and water-retention urea fertilizers. J. Agric. Food Chem. 61, 8166–8174. doi: 10.1021/jf402519t
Yang, Y.-C., Zhang, M., Zheng, L., Cheng, D.-D., Liu, M., and Geng, Y.-Q. (2011). Controlled Release Urea Improved Nitrogen Use Efficiency, Yield, and Quality of Wheat. Agronomy J. 103, 479–485. doi: 10.2134/agronj2010.0343
Zanin, L., Tomasi, N., Zamboni, A., Varanini, Z., and Pinton, R. (2015). The Urease Inhibitor NBPT Negatively Affects DUR3-mediated Uptake and Assimilation of Urea in Maize Roots. Front. Plant Sci. 6:1007. doi: 10.3389/fpls.2015.01007
Zhang, H. (2004). Controlling Mechanism of Coated Urea Combined with Adding Inhibitor. Corvallis, OR: Institute of Applied Ecology.
Zhang, S., Shen, T., Yang, Y., Li, Y., Wan, Y., Zhang, M., et al. (2018). Controlled-release urea reduced nitrogen leaching and improved nitrogen use efficiency and yield of direct-seeded rice. J. Environ. Manage. 220, 191–197. doi: 10.1016/j.jenvman.2018.05.010
Zheng, W., Liu, Z., Zhang, M., Shi, Y., Zhu, Q., Sun, Y., et al. (2017). Improving crop yields, nitrogen use efficiencies, and profits by using mixtures of coated controlled-released and uncoated urea in a wheat-maize system. Field Crops Res. 205, 106–115. doi: 10.1016/j.fcr.2017.02.009
Zheng, W., Sui, C., Liu, Z., Geng, J., Tian, X., Yang, X., et al. (2016). Long-Term Effects of Controlled-Release Urea on Crop Yields and Soil Fertility under Wheat-Corn Double Cropping Systems. Agronomy J. 108, 1703–1716. doi: 10.2134/agronj2015.0581
Keywords: enhanced-efficiency nitrogen fertilizer, natural rubber, urease inhibitor, nitrification inhibitor, maize yield, nitrogen use efficiency
Citation: Qi Z, Dong Y, He M, Wang M, Li Y and Dai X (2021) Coated, Stabilized Enhanced-Efficiency Nitrogen Fertilizers: Preparation and Effects on Maize Growth and Nitrogen Utilization. Front. Plant Sci. 12:792262. doi: 10.3389/fpls.2021.792262
Received: 10 October 2021; Accepted: 07 December 2021;
Published: 23 December 2021.
Edited by:
Nicola Tomasi, University of Udine, ItalyReviewed by:
Mohamed Sheteiwy, Mansoura University, EgyptAndreas Siegfried Pacholski, Thünen Institut, Germany
Copyright © 2021 Qi, Dong, He, Wang, Li and Dai. This is an open-access article distributed under the terms of the Creative Commons Attribution License (CC BY). The use, distribution or reproduction in other forums is permitted, provided the original author(s) and the copyright owner(s) are credited and that the original publication in this journal is cited, in accordance with accepted academic practice. No use, distribution or reproduction is permitted which does not comply with these terms.
*Correspondence: Yuanjie Dong, eXVhbmppZWRvbmdAMTYzLmNvbQ==