 Yi Li1
 Hengling Wei
 Hantao Wang
- 1State Key Laboratory of Cotton Biology, Institute of Cotton Research of Chinese Academy of Agricultural Sciences, Anyang, China
- 2Zhengzhou Research Base, State Key Laboratory of Cotton Biology, Zhengzhou University, Zhengzhou, China
The K+ efflux antiporter (KEA) mediates intracellular K+ and H+ homeostasis to improve salt tolerance in plants. However, the knowledge of KEA gene family in cotton is largely absent. In the present study, 8, 8, 15, and 16 putative KEA genes were identified in Gossypium arboreum, G. raimondii, G. hirsutum, and G. barbadense, respectively. These KEA genes were classified into three subfamilies, and members from the same subfamilies showed similar motif compositions and gene structure characteristics. Some hormone response elements and stress response elements were identified in the upstream 2000 bp sequence of GhKEAs. Transcriptome data showed that most of the GhKEAs were highly expressed in roots and stems. The quantificational real-time polymerase chain reaction (qRT-PCR) results showed that most of the GhKEAs responded to low potassium, salt and drought stresses. Virus-induced gene silencing (VIGS) experiments demonstrated that under salt stress, after silencing genes GhKEA4 and GhKEA12, the chlorophyll content, proline content, soluble sugar content, peroxidase (POD) activity and catalase (CAT) activity were significantly decreased, and the Na+/K+ ratio was extremely significantly increased in leaves, leading to greater salt sensitivity. Under high potassium stress, cotton plants silenced for the GhKEA4 could still maintain a more stable Na+ and K+ balance, and the activity of transporting potassium ions from roots into leaves was reduced silenced for GhKEA12. Under low potassium stress, silencing the GhKEA4 increased the activity of transporting potassium ions to shoots, and silencing the GhKEA12 increased the ability of absorbing potassium ions, but accumulated more Na+ in leaves. These results provided a basis for further studies on the biological roles of KEA genes in cotton development and adaptation to stress conditions.
Introduction
With changes in the global environment, crops are facing abiotic stress environments such as soil salinization, drought and extreme temperatures in the process of production. Salt stress is one of the most important abiotic stress factors, that seriously affect the growth, development and survival of plants (Munns, 2002; Liu et al., 2010). Although cotton is considered to be a salt-tolerant and drought-tolerant crop, the restrictions on cotton growth and yield caused by high salt and drought stress cannot be ignored. Research has shown that when the salt concentration exceeds a certain threshold, the normal physiological function and material metabolism of cotton are significantly affected, and the growth and development of cotton are inhibited, which leads to a decrease in yield and a deterioration in fiber quality (Sharif et al., 2019). On the one hand, when the salt concentration is high, the content of sodium ions is significantly higher than the content of potassium ions, resulting in a higher Na+/K+ ratio, which destroys the water balance in the plant cells (Hauser and Horie, 2010); on the other hand, salt stress can lead to plant membrane damage, enzyme activity inhibition, metabolic disorders, etc., resulting in plant growth inhibition and even death (Munns and Tester, 2008). K+ is one of a large number of mineral elements needed by plants, and it also plays an important role in plant salt tolerance (Britto and Kronzucker, 2008). Plants balance excessive Na+ by accumulating K+ to reduce the damage caused by salt stress (Cuin et al., 2003). Therefore, it is very important for plants to absorb and transport potassium ions effectively.
In plants, there are many proteins that consume energy to absorb potassium ions from the outside environment, that is, proteins that carry out active transport. These proteins, called potassium transporters, are divided into three families according to their structures and functions: the KUP/HAK/KT family, the HKT family and the CPA family (Gierth and Maser, 2007). The CPA (Cation Proton Antiporter) family mediates the homeostasis of ions and pH in cells, maintains osmotic balance, and regulates plant growth and development and signal transduction. The CPA family is divided into two subfamilies: CPA1 and CPA2. The CPA1 subfamily is mainly NHX (Na+/H+ exchanger) transporters, and the CPA2 subfamily includes KEA (K+ efflux antiporter) and CHX (Cation/H+ exchanger) transporters (Chanroj et al., 2011). The numbers of CHX gene families have increased dramatically from charophyte algae to flowering plants (Aranda-Sicilia et al., 2012). Fan et al. (2020) studied the molecular evolution and expansion of KUP gene family in Gossypium hirsutum and G. barbadense, and found that KUP family genes showed different expression levels under various stress treatment. In our previous study, KUP/HAK/KT gene family and NHX gene family have been identified and found to be involved in abiotic stress response (Fu et al., 2020; Yang et al., 2021). Compared with the diverse CHX gene family, the number of KEA family members varies from plant to plant. Seven, 4, 4, 12, 6, and 24 KEA family members were identified in Populus trichocarpa, Oryza sativa, Sorghum bicolor, Glycine max, Zea mays, and Triticum aestivum, respectively (Ye et al., 2013; Sze and Chanroj, 2018; Sharma et al., 2020). The KEA family in higher plant was first reported in Arabidopsis thaliana and originated from bacterial glutathione-regulated K+ efflux antiporters KefB and KefC with an N-terminal Na+/H+ exchanger domain and a C-terminal KTN-NAD (H)-binding domain (also known as the TrkA-N domain) (Maser et al., 2001; Choe, 2002; Chanroj et al., 2012). The AtKEA family was divided into KEAI and KEAII. KEAI was divided into Ia and Ib according to its N-terminal domain and had a complete C-terminal KTN domain, which was closely related to EcKefB and EcKefC proteins (Booth, 2003; Fujisawa et al., 2007; Chanroj et al., 2012). KEAII lost the KTN domain at the C-terminus and had high homology with cyanobacteria, which was similar to the transmembrane coiled coil protein 3 (TMCO3) (Chanroj et al., 2012). The first research on the KEA family showed that AtKEA2 was located on the chloroplast, and was involved in the regulation of K+ and the pH of the plastid (Aranda-Sicilia et al., 2012). The inner envelope AtKEA1 and thylakoid AtKEA3 transporters were reported to be involved in chloroplast function, osmotic regulation, photosynthesis and pH regulation, and resisted high potassium and high hygromycin in yeast (Zheng et al., 2013; Kunz et al., 2014). In addition, genetic analysis showed that AtKEA4, AtKEA5, and AtKEA6 had similar tissue expression patterns, and they cooperated with endosomes NHX5 and NHX6 to promote the pH homeostasis and salt tolerance (Zhu et al., 2018). Therefore, the KEA gene family not only plays a significant role in K+ transport but also may be involved in abiotic stress responses in plants.
However, to date, there have been no reports on the genome-wide identification and characterization of the cotton KEA gene family members. With the publication of the cotton genome sequence and transcriptome data, it is possible to comprehensively identify and analyze the KEA gene family, which is also a key step in studying the function of cotton KEA genes. In this study, members of the KEA gene family in G. arboreum, G. raimondii, G. hirsutum, and G. barbadense were identified. The physical and chemical properties, chromosome distributions, gene structures, evolutionary relationships, gene replications and expression patterns were comprehensively analyzed. The functions of GhKEA4 and GhKEA12 under salt and potassium stresses were preliminarily explored by virus-induced gene silencing (VIGS) experiments. This research provides basic data for further study on the function of KEA genes in cotton.
Materials and Methods
Identification of the K+ Efflux Antiporter Gene Family
The genome databases of Gossypium arboreum (accession number: PRJNA382310) (Du et al., 2018), Gossypium raimondii (accession number: PRJNA171262) (Paterson et al., 2012), Gossypium hirsutum (accession number: PRJNA433615) (Wang M. et al., 2019) and Gossypium barbadense (accession number: PRJNA433615) (Wang M. et al., 2019) were obtained from the CottonGen database1 (Yu et al., 2014). In addition, the genome databases of Arabidopsis thaliana (accession number: PRJNA10719), Oryza sativa (accession number: PRJNA448171), Zea mays (Schnable et al., 2009), Populus trichocarpa (Tuskan et al., 2006), Sorghum bicolor (accession number: PRJNA374837), Triticum aestivum (Mayer et al., 2014) and Glycine max (accession number: ACUP00000000) were downloaded from the phytozome database2. The protein sequences of AtKEA1-AtKEA6 were used to construct the hidden markov model (HMM) of the conserved domain of a specific KEA gene family. The HMMER 3.0 program and the constructed HMM model were used to search the predicted KEAs from the above plant genomes. The default parameter of the e-value threshold was set at 1e-50. Then, the NCBI Conserved Domain Database3 and SMART database4 were used to confirm whether the candidate protein sequences contain the special domain of the KEA family (Letunic et al., 2015). The protein sequence length, molecular weight (Mw), isoelectric point (pI), grand average of hydropathicity (GRAVY) and subcellular localization of the identified KEA members were predicted from the ExPasy website5 and ProtComp 9.06 (Artimo et al., 2012).
Sequence Alignments and Phylogenetic Analysis
All the identified KEA protein sequences from G. arboreum, G. raimondii, G. hirsutum, G. barbadense, Arabidopsis thaliana, Oryza sativa, Zea mays, Populus trichocarpa, Sorghum bicolor, Triticum aestivum, and Glycine max were aligned by ClustalX 2.0 (Larkin et al., 2007). The phylogenetic tree was constructed using the neighbor-joining (NJ) method of MEGA 7.0 with the p-distance model and 1000 bootstrap replications (Kumar et al., 2016).
Locations of K+ Efflux Antiporter Gene on Cotton Chromosomes and Gene Duplication Analysis
The chromosome physical locations of the KEA gene family were extracted from the genome annotation file information of G. hirsutum, G. raimondii, G. barbadense, and G. arboreum, and the positions of KEA genes on chromosomes were visualized with Map Chart 2.2 software (Voorrips, 2002). The replication gene pairs of G. hirsutum, G. raimondii, and G. arboreum were detected by MCScanX software (Wang et al., 2012), and gene replication was confirmed according to the following conditions: the coverage of the alignment sequence was ≥80% of the longer gene; the similarity of the regions on the alignment was ≥80%; tightly linked genes on the same chromosome were considered tandem duplications. Circos was adopted to plot the diagram of segmental duplication events on chromosomes (Krzywinski et al., 2009). KaKs_Calculator 2.0 software was used to calculate the non-synonymous mutation rate (Ka) and synonymous mutation rate (Ks) of KEA gene replication (Wang et al., 2010).
Gene Structure and Conserved Motif Analysis
The GhKEA proteins were used for multiple sequence alignment by ClustalX 2.0. The exon-intron structures of upland cotton KEA genes were analyzed on the Gene Structure Display Server (GSDS 2.07) (Hu et al., 2015). The conserved motifs of KEA proteins were identified by the MEME program. The optimization parameters were set as follows: size distribution, zero or once per sequence; motif count, 10; pattern width, between 6 and 50 residues (Bailey et al., 2006).
Promoter Region Cis-Acting Element Analysis
DNA sequences 2000 bp upstream of the KEA start codon (ATG) were retrieved from the G. hirsutum genome database and submitted to PlantCARE8 for analysis of cis-acting elements (Lescot et al., 2002).
Gene Expression Pattern Analysis
The raw RNA-sequencing data of G. hirsutum TM-1 in different tissues were obtained from previously reported transcriptome data (accession number: PRJNA248163) (Zhang et al., 2015). TBtools was used to draw a heatmap, using row-scale and zero to one scale methods, showing the expression patterns of GhKEAs (Chen et al., 2020).
Plant Materials and Treatments
In this study, G. hirsutum Texas Marker-1 (TM-1) was cultivated by hydroponics with hoagland nutrient solution by Solarbio Biology Co., Ltd., and grown in a climate-controlled chamber with a light/dark cycle of 16 h at 28°C/8 h at 22°C. When the third true leaf was unfolded (approximately 4 weeks), it was treated with NaCl (300 mMol/L), KCl (0.03 mMol/L), PEG6000 (30%) and control group. Samples were taken at 0, 1, 3, 6, 12, and 24 h respectively. All the samples were immediately frozen in liquid nitrogen and stored at –80°C.
Construction of the Virus-Induced Gene Silencing Vector and Determination of Physiological Parameters
The GhKEA4 (Ghir_D12G011600.1) and GhKEA12 (Ghir_A06G009360.1) fragments of 300 nt were introduced by primers, respectively. The fragments of the above genes were then ligated into the pYL156 vector. The primers used for vector construction are listed in Table 1. The recombinant vector was transformed into Agrobacterium tumefaciens LBA4404. According to the method mentioned by Gao et al. (2016), we injected LBA4404 bacterial solution carrying pYL156 (empty vector), pYL156-GhKEA4, pYL156-GhKEA12, pYL156-CLA1 (positive control) and pYL192 (helper vector) into the cotyledons of TM-1. After 24 h of dark treatment, the cotton plants were moved to a greenhouse with 12 h of light/12 h of darkness for approximately 15 days, and then treated with NaCl. Before salt treatment, 5–6 leaves of control plants and VIGS plants were taken and weighed immediately. Then the leaves were placed in a petri dish with filter paper, placed in a 28°C incubator, set to three repeats, and weighed every other hour. Water loss rate of isolated leaves = (leaf fresh weight-leaf dry weight)/leaf fresh weight × 100%. The experiment was repeated three times independently.

Table 1. List of the primers used to construct PYL-156 vectors in present study.
After 24 h of 300 mM NaCl treatment, 0.1 g of sample powder mixed by at least 20 cotton plants were taken to determine the total chlorophyll content, soluble sugar content and proline (Pro) content, as well as catalase (CAT) activity and peroxidase activity (POD). And three biological replicates were performed. Chlorophyll was extracted with a ratio of ethanol to acetone (1:1), and the absorbance was measured at 663 and 645 nm (Sun et al., 2013). Other indicators used the kit developed by Solarbio Biology Co., Ltd., and the specific operation steps were guided according to the operating instructions.
Measurement of K+ and Na+ Concentration
First, control plants and plants silenced for the target gene were sampled before and after treatment with 300 mM NaCl (high salt), 0.2 mM KCl (low potassium) and 10 mM KCl (high potassium). The samples were then quickly put at 105°C for 30 min to kill and dried at 80°C for 48 h until the weight was unchanged. 0.5 g of plant sample was weighed and used for determination of Na+ and K+ contents (Bao, 2005).
RNA Extraction and Quantificational Real-Time Polymerase Chain Reaction Analysis
Total RNA was isolated from the collected samples using the RNA-prep Pure Plant Kit (TIANGEN, Beijing, China). One microgram of RNA was reverse transcribed into cDNA using the Prime Script RT Reagent kit (Takara, Japan), and the system was diluted fivefold upon completion of reverse transcription for the next experiment. SYBR Premix Ex Taq (Takara) and the ABI 7500 Real-time PCR system (Applied Biosystems) were used to carry out quantificational real-time polymerase chain reaction (qRT-PCR) experiments. The protocol was performed as follows: step 1: 95°C for 30 s; step 2: 40 cycles of 95°C for 5 s, and 60°C for 34 s; and step 3: melting curve analysis. For each sample, three biological repeats were performed to obtain reliable results (Livak and Schmittgen, 2001). The specificity of the qRT-PCR primers was demonstrated by ePCR and melting curves. The cotton histone-3 gene (GenBank accession number AF024716) was used as an internal reference gene to normalize the expression level of the target gene (Liu et al., 2017). The data were calculated according to the 2–ΔΔCt formula (Livak and Schmittgen, 2001). Gene specific primers for qRT-PCR were designed by Oligo 7 (Table 2).
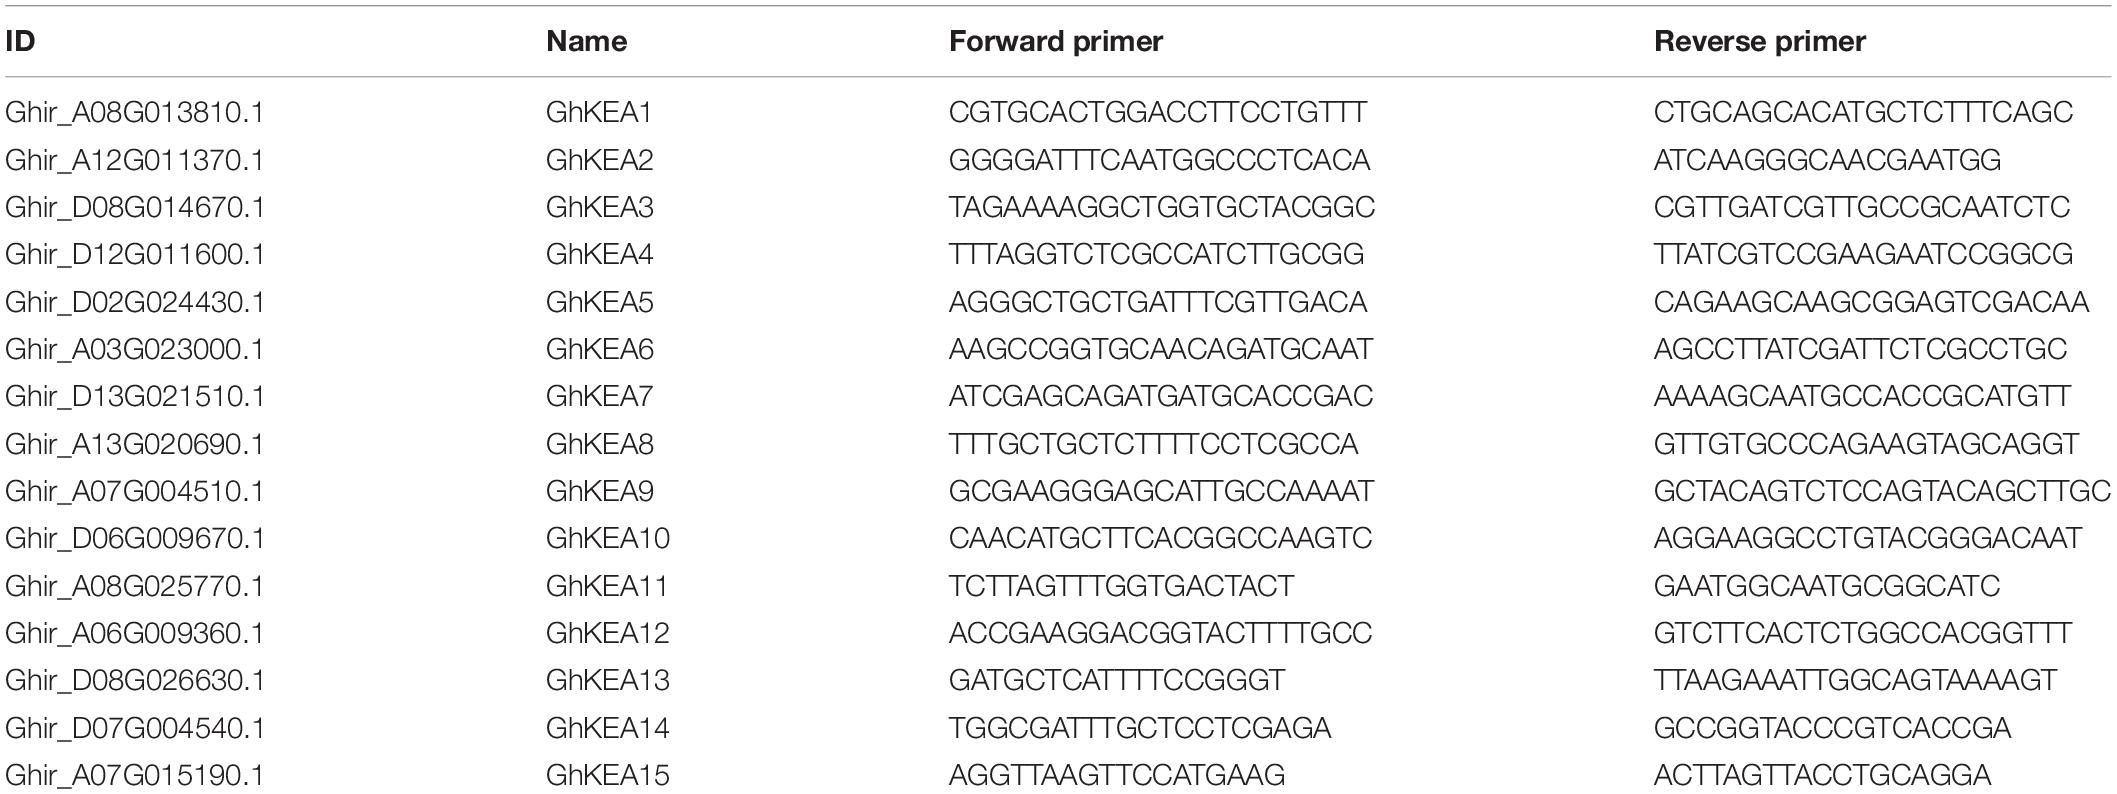
Table 2. List of the primers used for quantitative real-time PCR in present study.
Results
Identification and Characteristics of K+ Efflux Antiporters in Gossypium spp.
Based on the HMM model of the KEA specific protein conserved domain constructed by the ATKEA1–ATKEA6 protein sequences, a total of 8, 8, 15, and 16 KEA members were identified from G. arboreum, G. raimondii, G. hirsutum, and G. barbadense, respectively (Table 3). All these putative genes were detected to contain the typical Na+/H+ exchanger domain (pfam: PF00999) and some members contained the TrkA-N domain (pfam: PF02254) of the KEA gene family in CDD and SMART databases. The confirmed members of the KEA gene family were named GaKEA1 to GaKEA8, GrKEA1 to GrKEA8, GhKEA1 to GhKEA15 and GbKEA1 to GbKEA16 according to the size of the e-values screened. These putative GaKEAs encoded proteins ranging from 595 amino acids (aa) (GaKEA8) to 1209 aa (GaKEA2), while GrKEAs encoded ranging from 573 aa (GrKEA6) to 1209 aa (GrKEA2), GhKEAs encoded 121 aa (GhKEA15) to 1210 aa (GhKEA2) and GbKEAs encoded 441 aa (GbKEA16) to 1209 aa (GbKEA2 and GbKEA4). Most members of the KEA family have transmembrane domains, which means that these proteins may be located on the membrane. The location of these proteins on chromosomes and the predicted molecular weight (MW), isoelectric point (pI) and grand average of hydropathicity (GRAVY) are shown in Table 3.
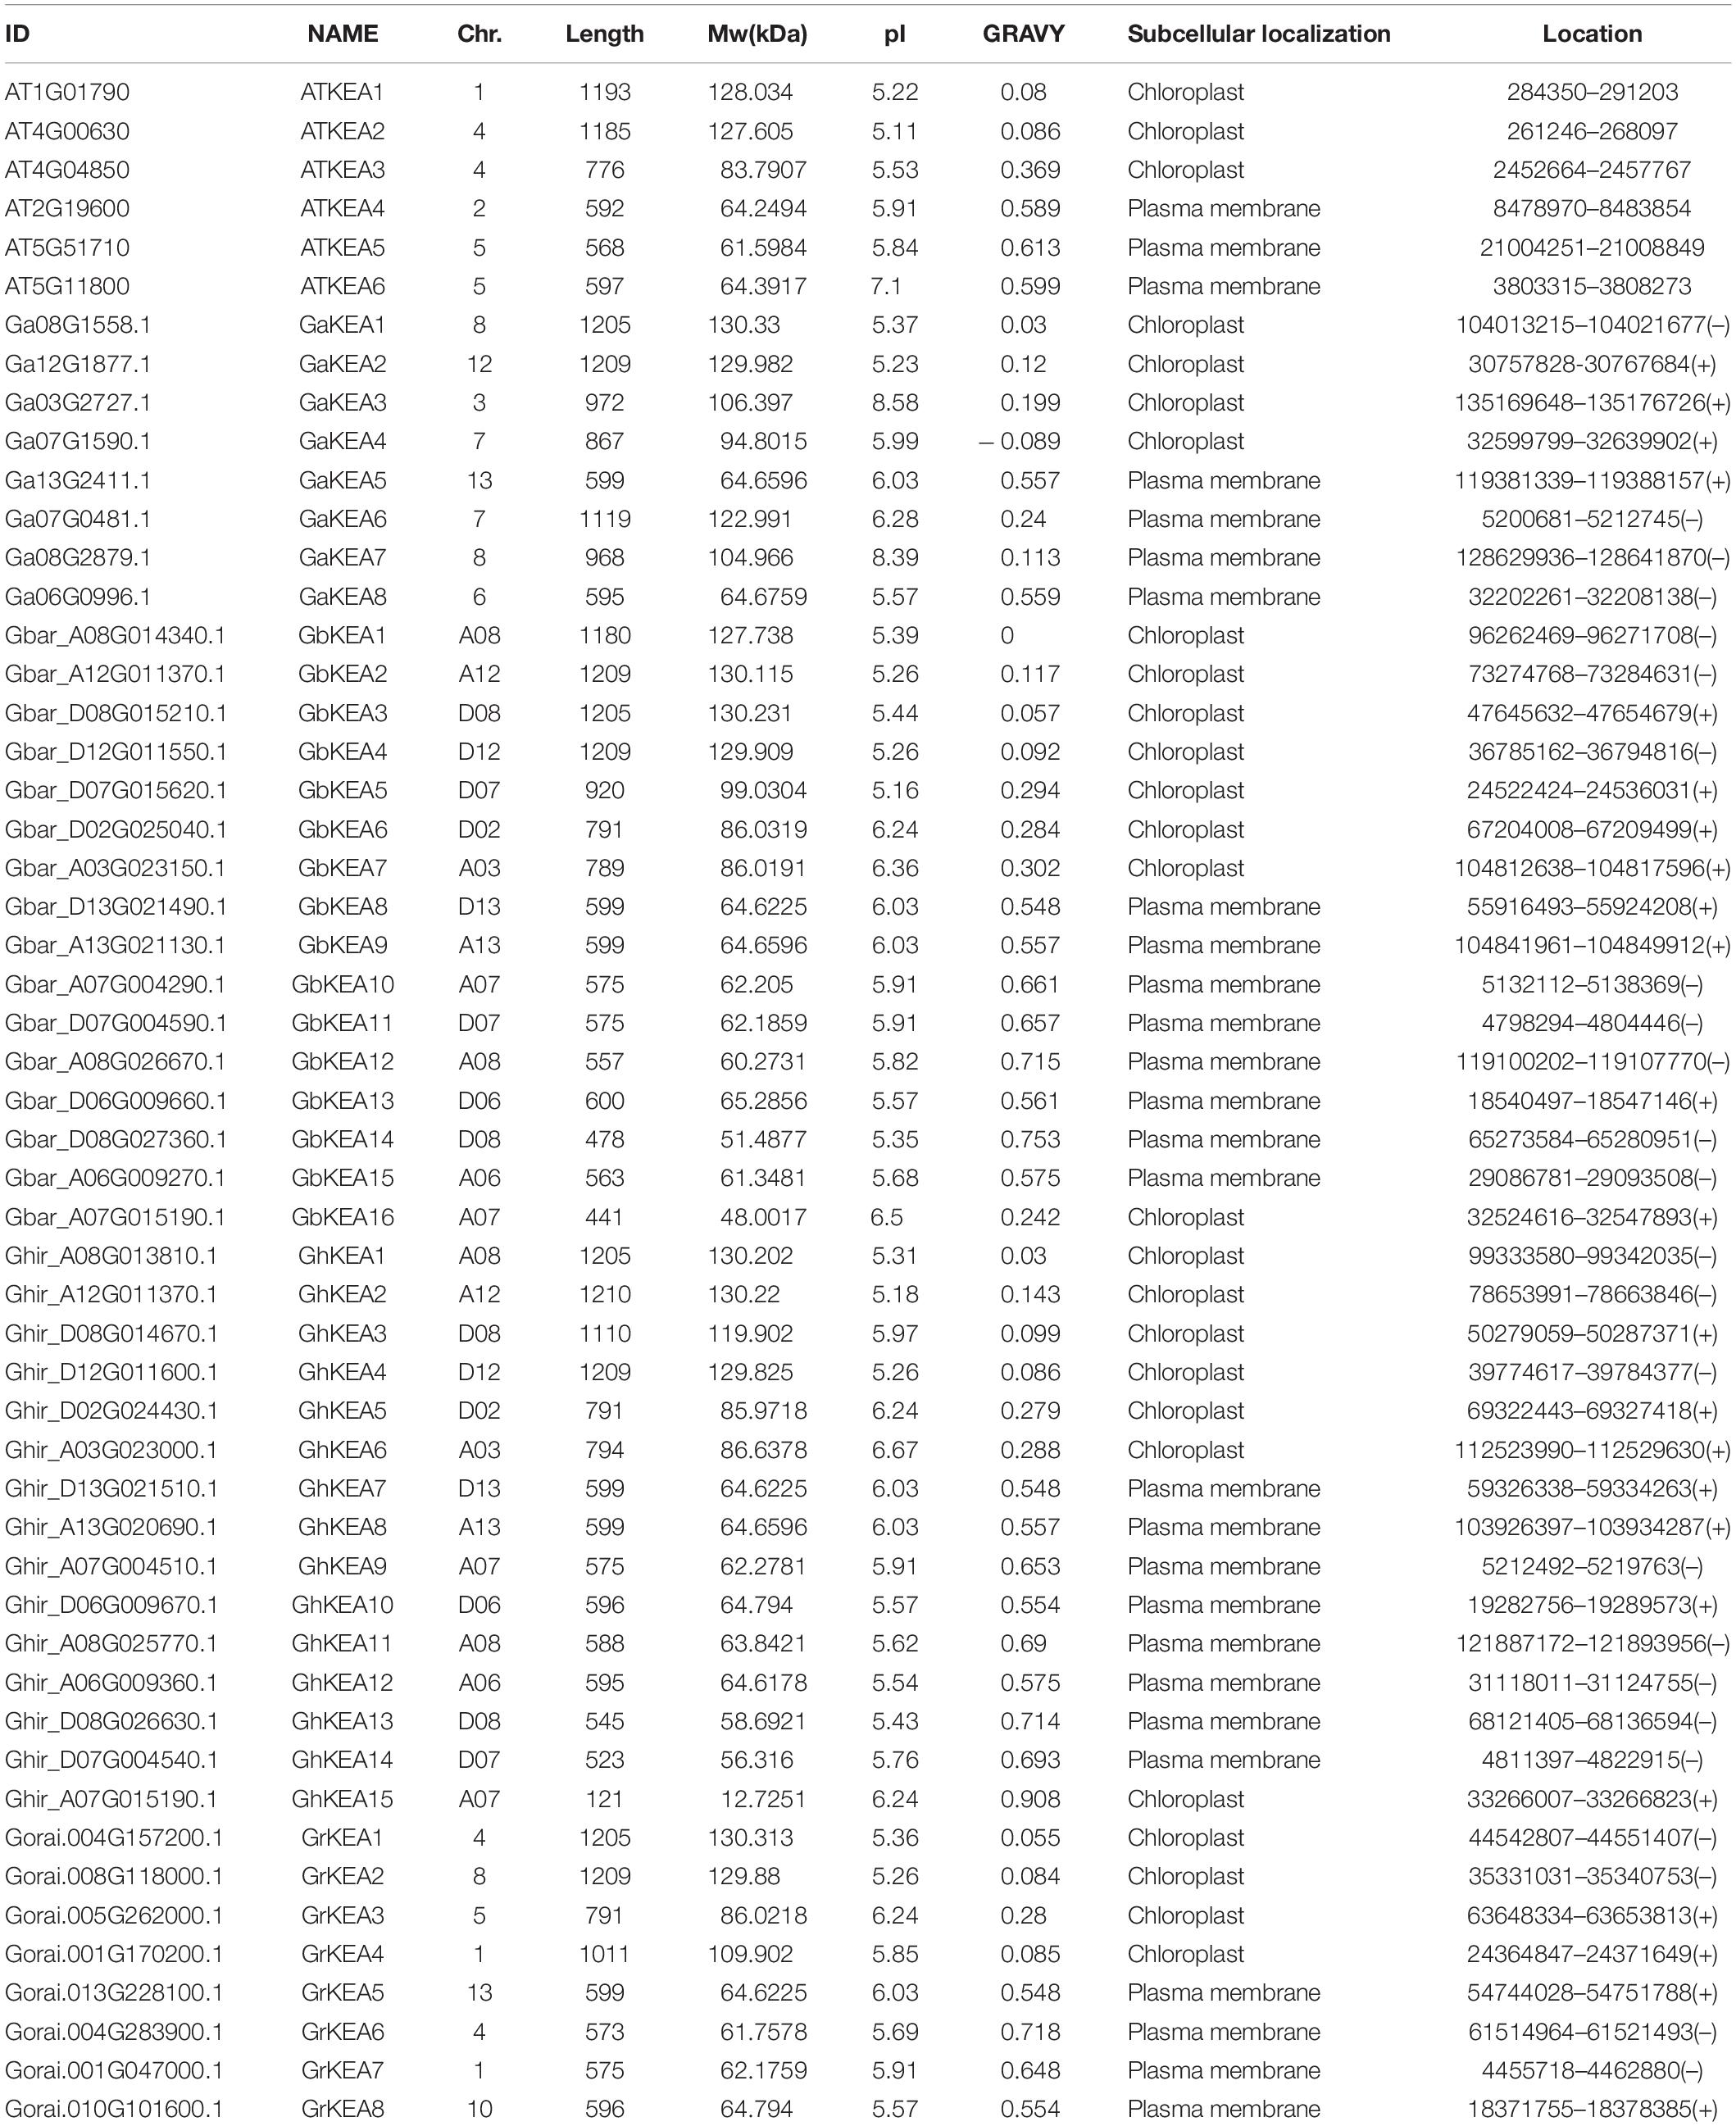
Table 3. Basic information for KEAs in Arabidopsis thaliana, G. arboreum, G. raimondii, G. hirsutum, and G. barbadense.
The results of subcellular localization prediction indicated that the proteins in KEAI were found to be located in the chloroplast (Table 3). AtKEA1, -2, -3 in Arabidopsis belong to the KEAI clade were shown to be subcellular localized in chloroplasts (Aranda-Sicilia et al., 2012; Kunz et al., 2014; Sheng et al., 2014). Online tool prediction showed that the proteins in the KEAII clade were located in the plasma membrane (Table 3). However, KEA4, -5, -6 in Arabidopsis belong to the KEAII clade were shown to be subcellular localized to the Golgi, trans-Golgi reticulum, and the prevacuolar compartment/multivesicular bodies (Zhu et al., 2018; Wang Y. et al., 2019). This is inconsistent with the online website prediction results, and the subcellular localization results of KEA in upland cotton require further validation.
Phylogenetic Analysis
Using the same method, a total of 4, 7, 7, 4,13, and 12 members were identified from Oryza sativa, Zea mays, Populus trichocarpa, Sorghum bicolor, Triticum aestivum, and Glycine max, respectively (Table 4). To examine the evolutionary relationship of KEA proteins, an unrooted phylogenetic tree was constructed using 94 KEA protein sequences from 11 species (excluding TaKEA8, TaKEA12, TaKEA13, ZmKEA6, ZmKEA7, OsKEA4 short sequences, as they did not meet the requirement of 1000 bootstrap replicates) (Figure 1). The phylogenetic tree was divided into three main categories namely KEAIa, KEAIb, and KEAII, which were consistent with the members of the AtKEA gene family (Aranda-Sicilia et al., 2012; Chanroj et al., 2012). The 11 species had distributed members in all three classifications. Among these members, the KEAII branch was the largest group, containing 46 members, while branch KEAIb was the smallest, with only 16 members. However, in the two large categories of KEAI and KEAII, the distributions of members were basically uniform. For example, 7 and 8 members of upland cotton were distributed in branch KEAI and branch KEAII, respectively. By checking the sequence characteristics, we determined that the sequence of KEAIa was the longest (except GhKEA15 and GbKEA16), and the length of KEAII was the shortest.

Table 4. The KEA member ID and their names of seven species.
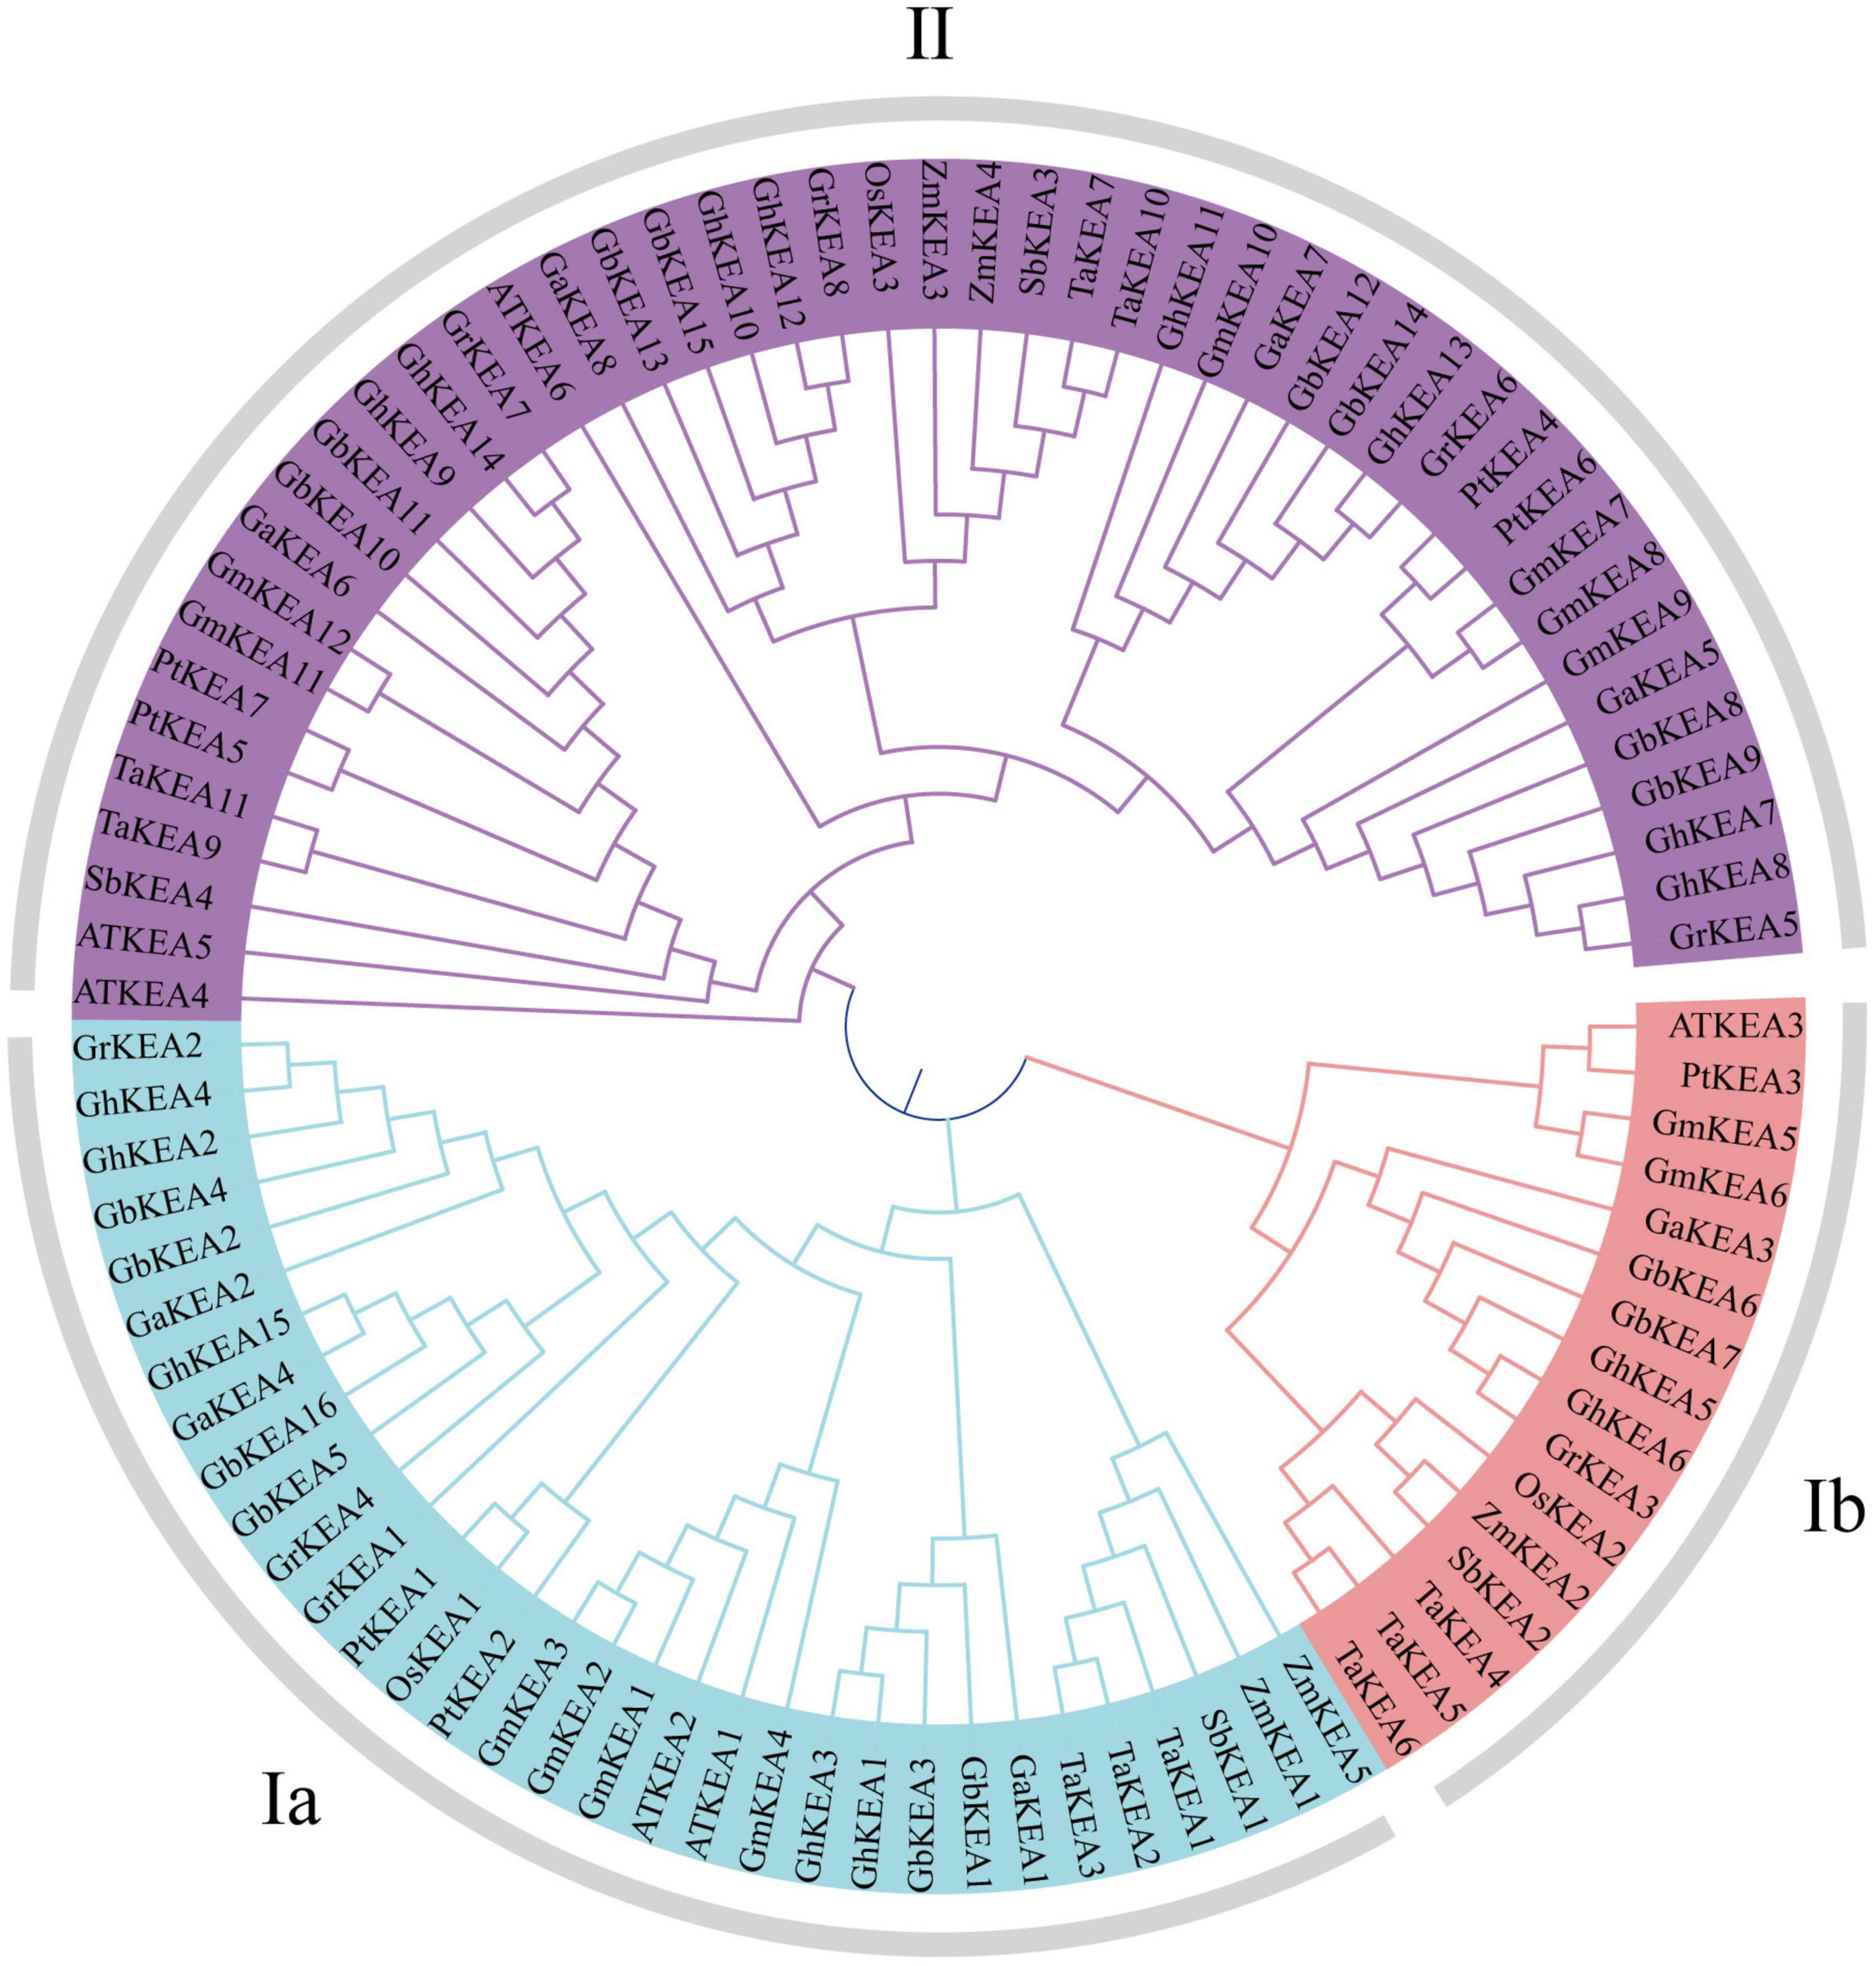
Figure 1. Phylogenetic relat ionship of KEA gene family. The analysis included full-length protein sequences from G. hirsutum, G. raimondii, G. barbadense, G. arboreum, Arabidopsis thaliana, Oryza sativa, Zea mays, Populus trichocarpa, Sorghum bicolor, Triticum aestivum, and Glycine max. Using MEGA software, 1000 bootstrap repetitive phylogenetic trees were constructed by neighbor-joining method.
Chromosome Distribution and Gene Replication Events
To determine the evolutionary relationship of KEA genes in cotton, the number and location of genes on the chromosome were analyzed (Figure 2). Each chromosome contained only one or two KEA genes. All GaKEAs and GrKEAs were distributed on 6 chromosomes, while GhKEAs and GbKEAs were distributed on six chromosomes of At subgenomes and six chromosomes of Dt subgenomes. Comparing the location and number of chromosomes on which the GaKEAs were located with the At subgenomic chromosomes on which the GhKEAs and the GbKEAs were located, we found that the location and number of genes distributed on these chromosomes of the KEA genes were basically the same. This phenomenon suggested that the distributions of KEA genes in the cotton genome were relatively conservative.

Figure 2. Chromosome distribution of KEAs in G. arboreum, G. raimondii, G. hirsutum, and G. barbadense. The scale stands for mega-base (Mb). The chromosome numbers are shown above each vertical line.
Gene replication events are very important for the expansion of the gene family. In general, gene replication events include tandem repeats and segmental repeats (Cannon et al., 2004; Xu et al., 2012). In this study, tandem repeat genes were defined as adjacent homologous genes on a single chromosome, and there was no more than one intermediate gene. A total of 9, 12, and 10 gene duplication pairs were identified between the At and Dt subgenomes of G. hirsutum and their corresponding ancestral A and D diploid genomes, respectively (Table 5). The data showed that all members of the KEA gene family were amplified only by segmental replication, which meant that segmental replication played a key role in the evolution of the KEA gene family. The syntenic relationships of putative KEA genes among two diploid genomes (G. arboreum and G. raimondii) and subgenomes in cultivated allotetraploid (G. hirsutum) were shown in Figure 3. The results showed that GaKEAs and GrKEAs were distributed among 5 and 6 chromosomes of A geneme and D genome, respectively, whereas GhKEAs were distributed among 6 and 6 chromosomes of At and Dt subgenomes, respectively. The Ka:Ks ratio can be used to judge whether the homologous gene is under positive selection pressure (Ka:Ks > 1) or purification selection pressure (Ka:Ks < 1). The results showed that the Ka:Ks ratios of GhKEA gene pairs were less than 1, indicating that KEA homologous gene pairs had undergone purifying selection during evolution and may have similar functions (Table 5).
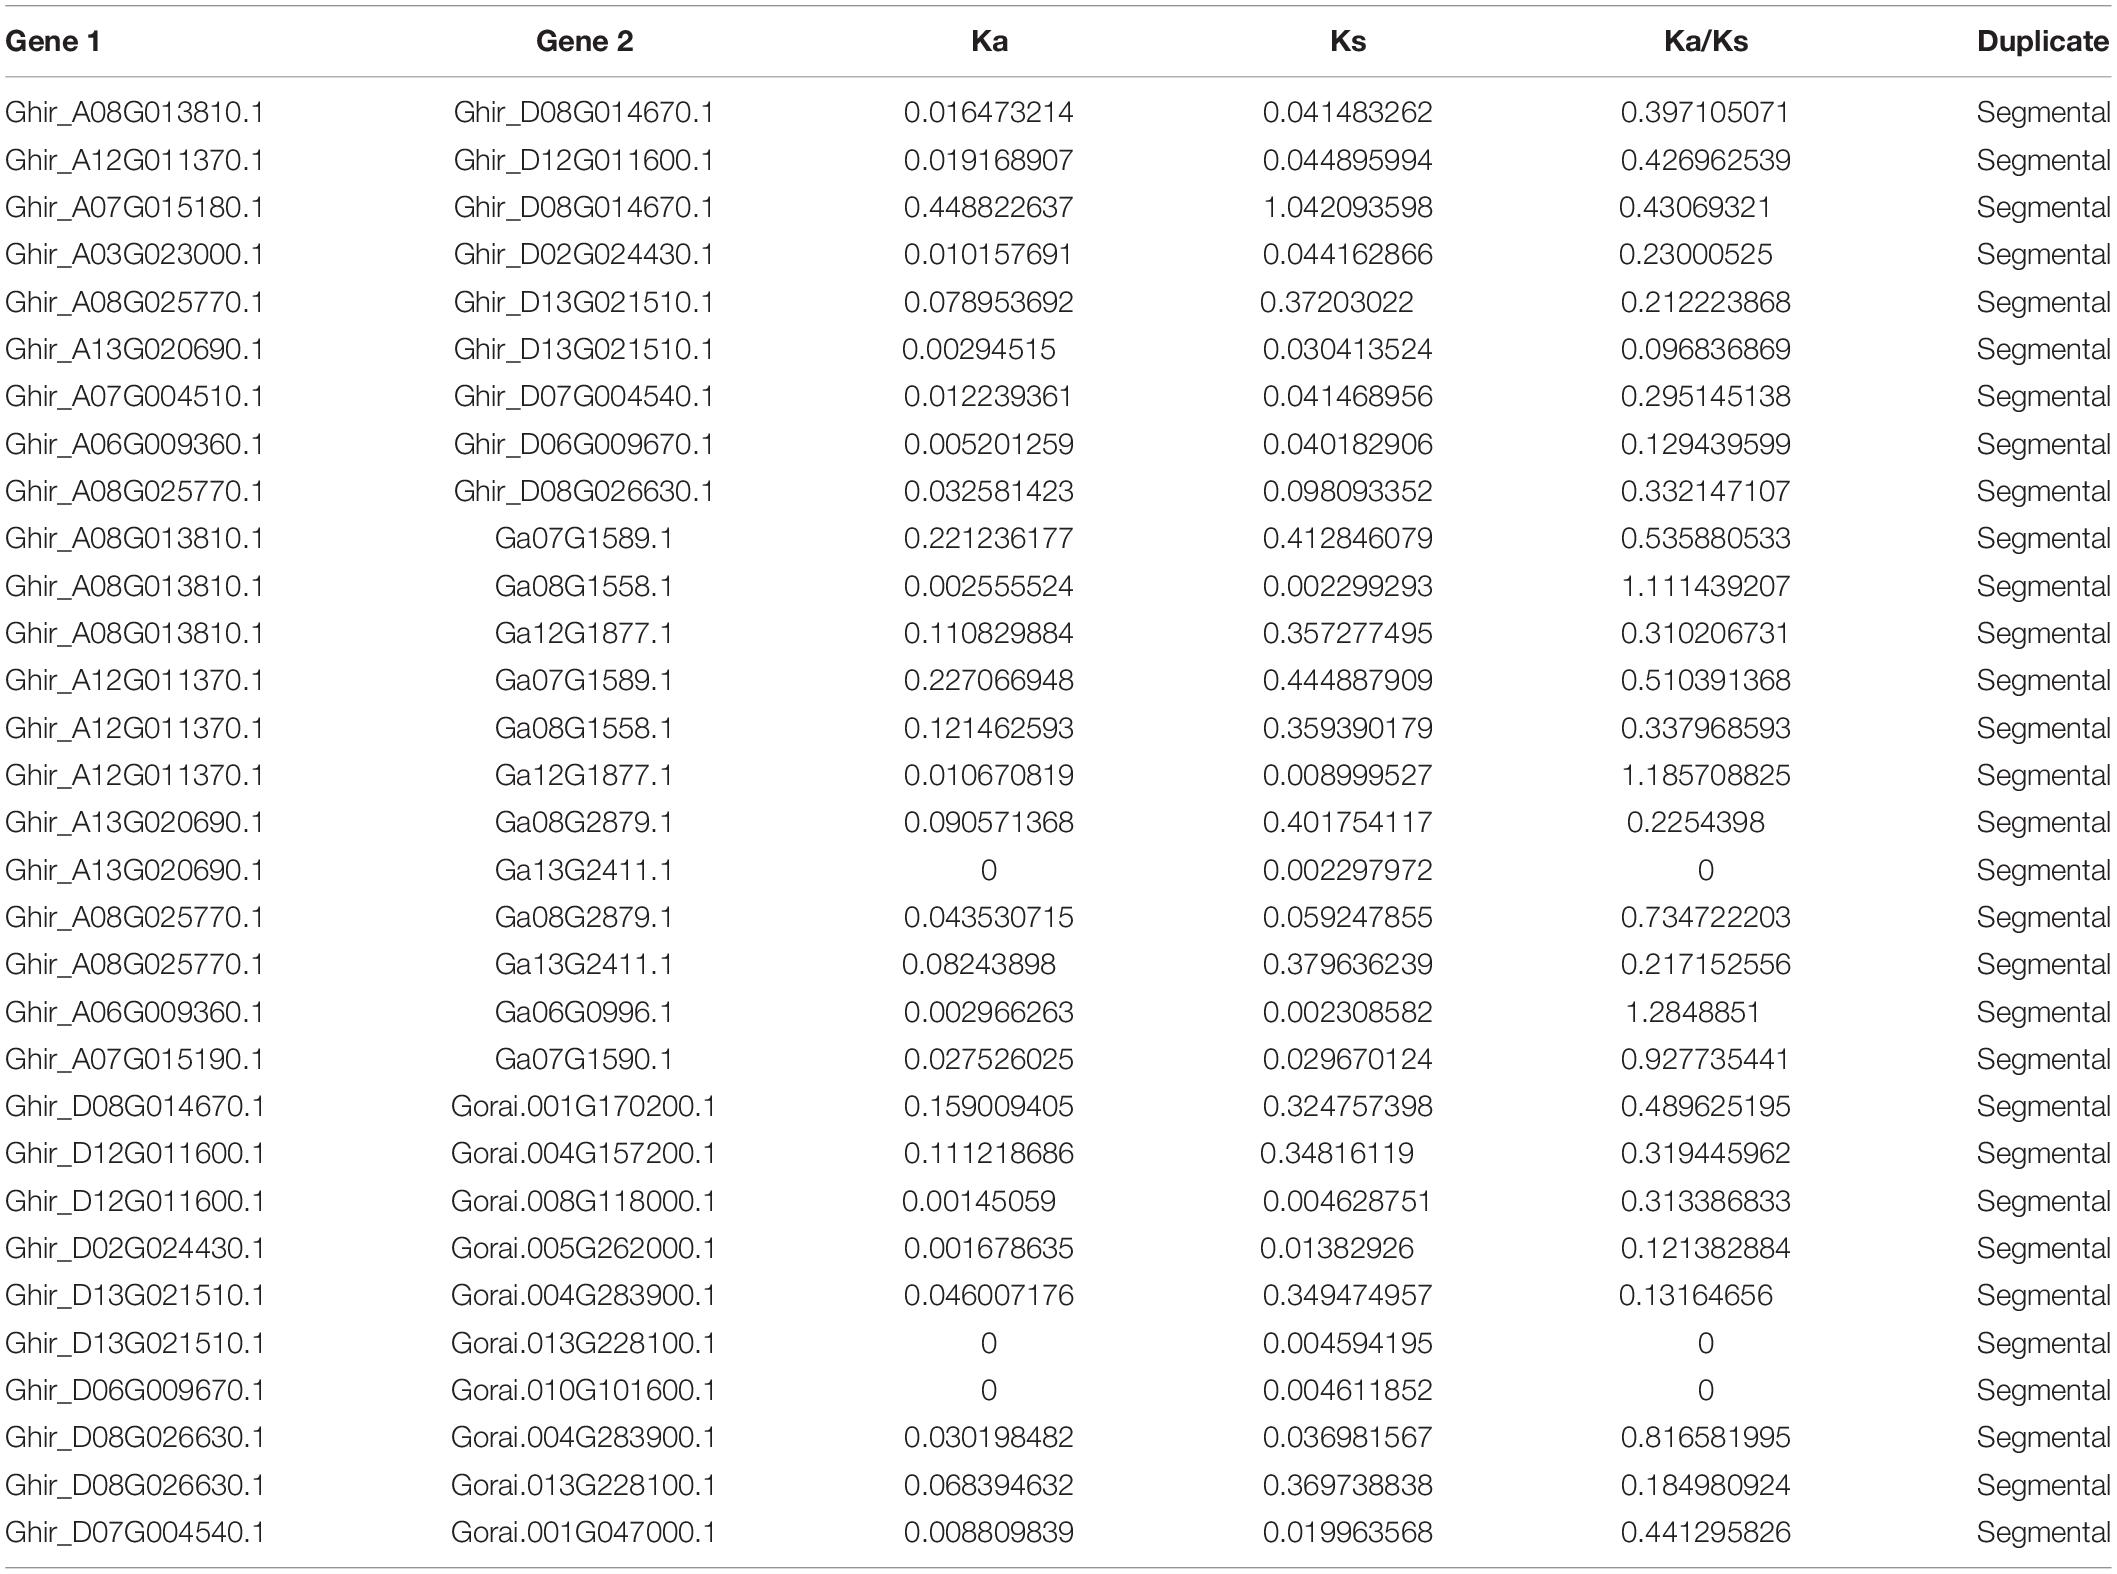
Table 5. The Ka/Ks ratio of repetitive gene pairs between upland cotton A and D subgenomes and their corresponding ancestor An and D diploid genomes.
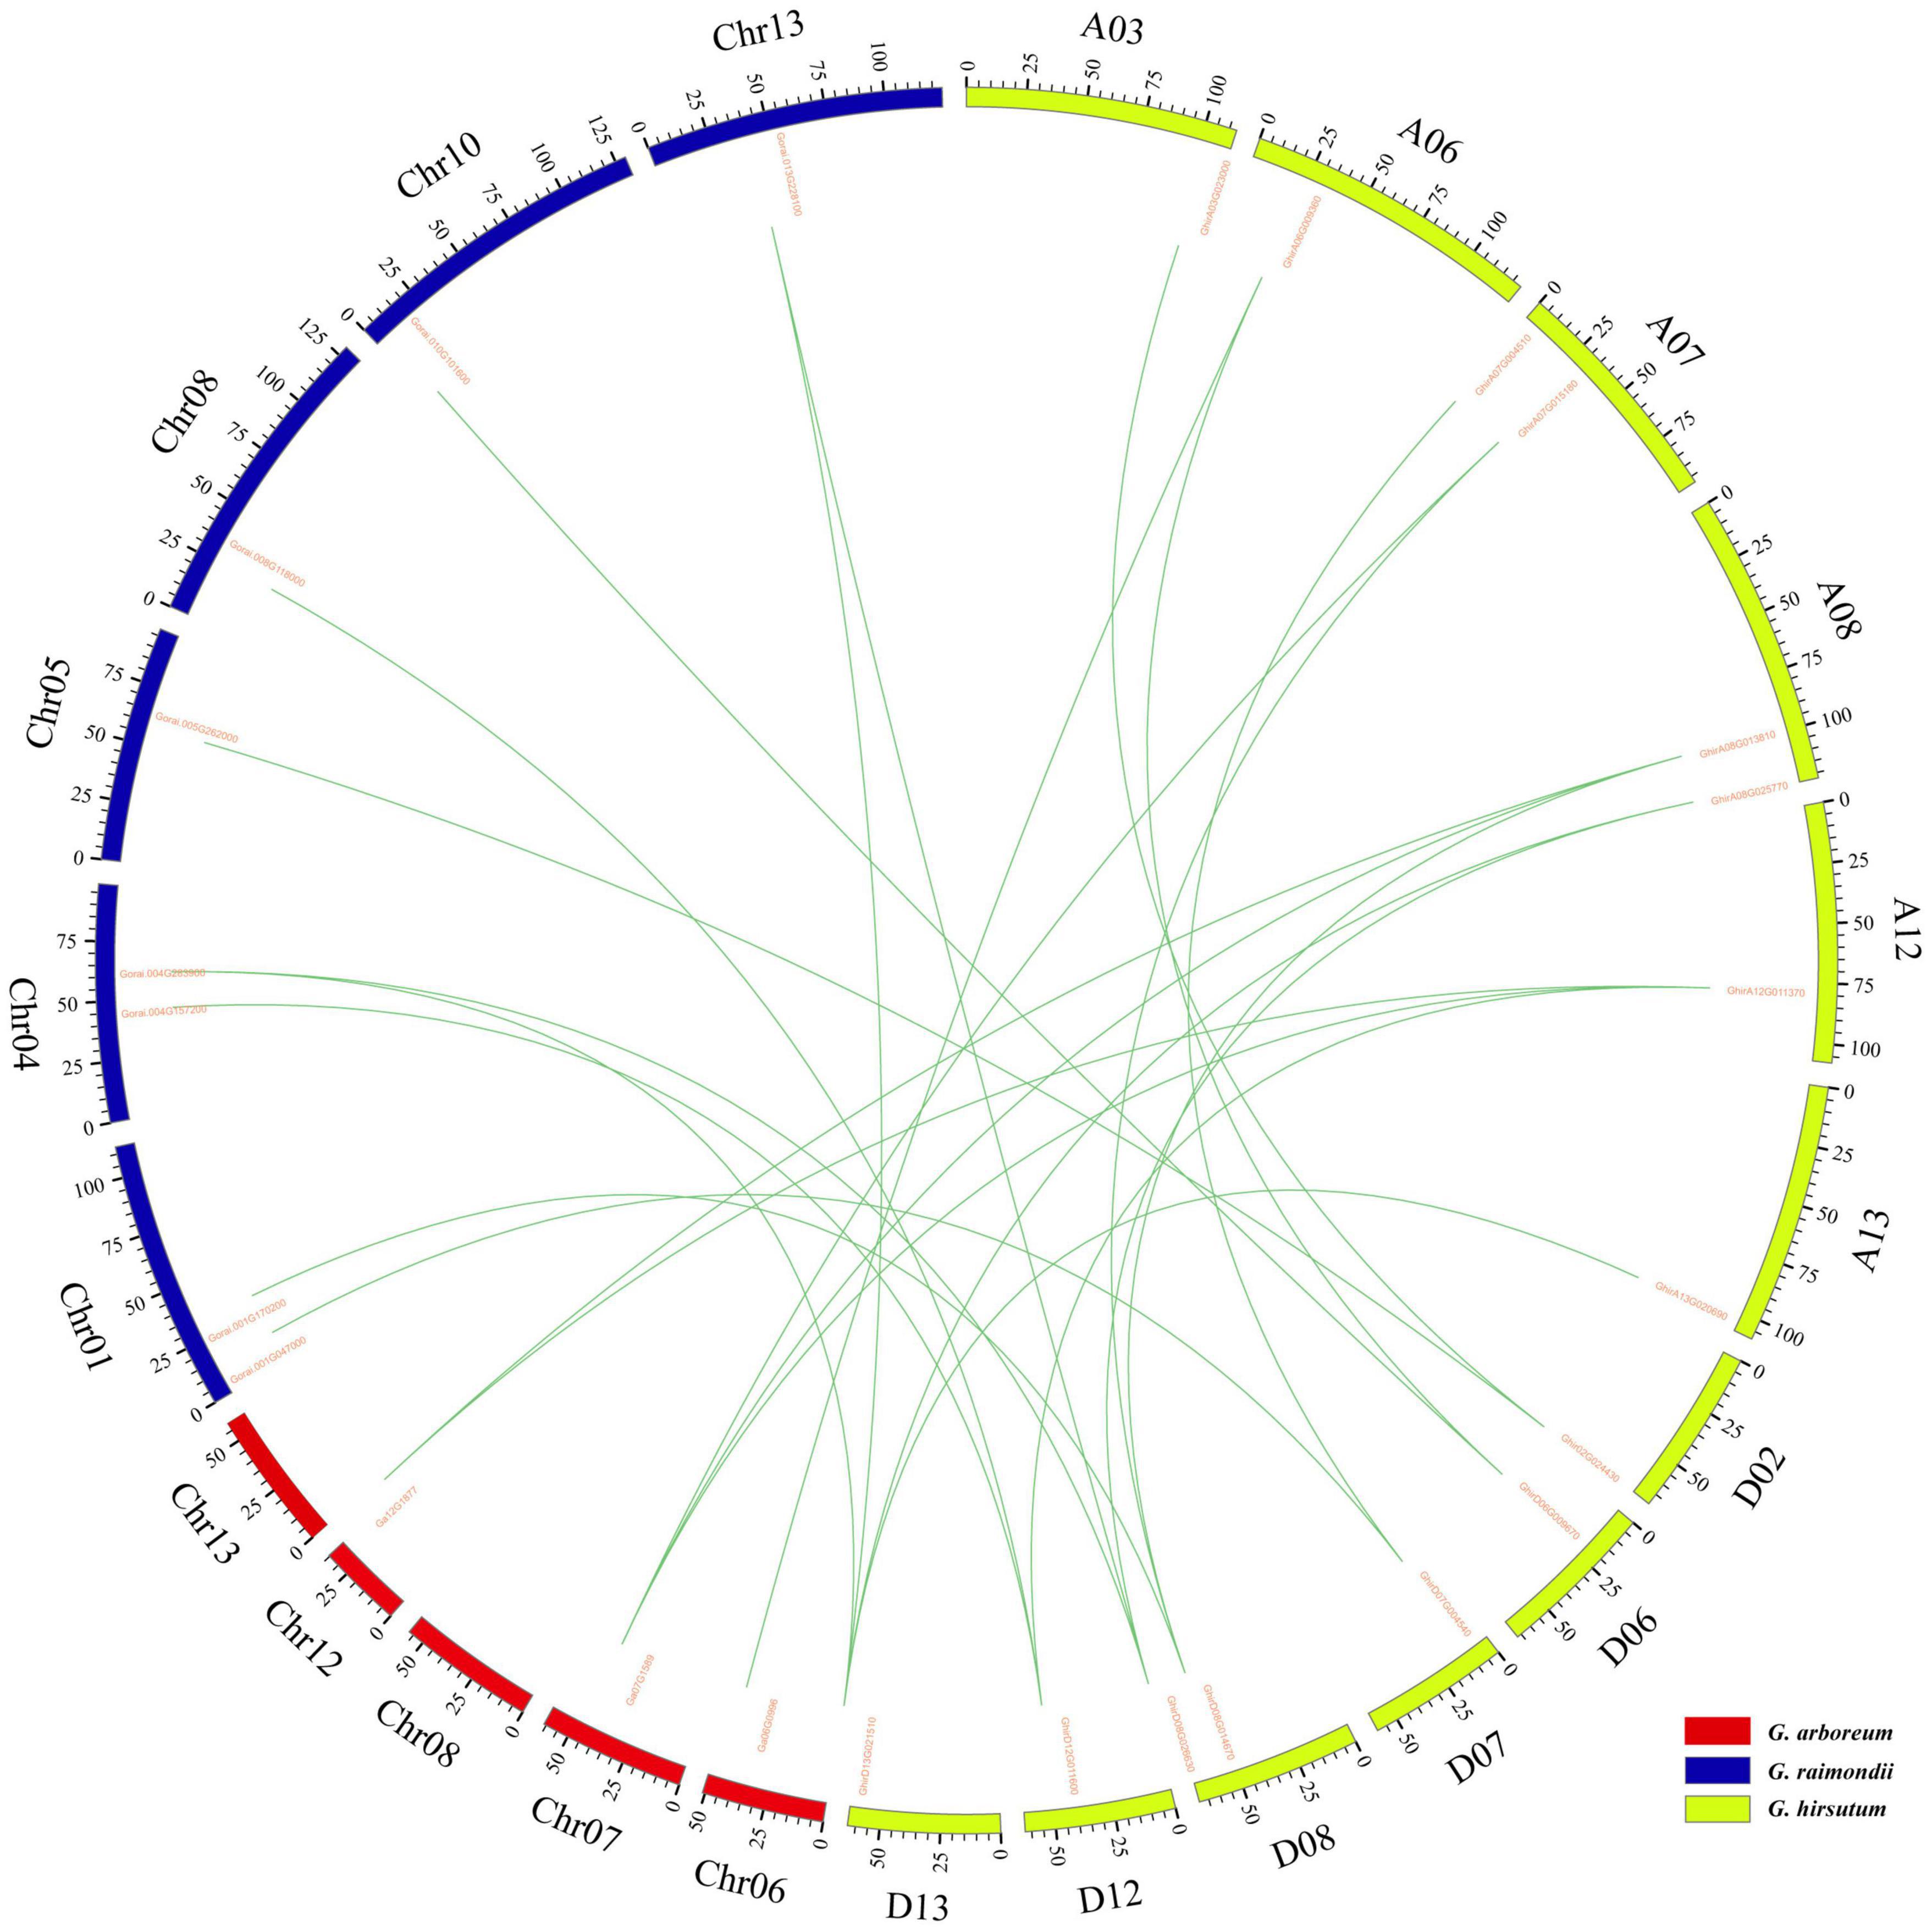
Figure 3. Syntenic relationships among KEA genes of two diploid (G. arboreum, G. raimondii) and one allotetraploid (G. hirsutum) cotton was visualized in a circos plot. The chromosomes of G. arboreum, G. raimondii, and G. hirsutum were shaded with red, blue, and green colors, respectively.
Analysis of Gene Structure and Conservative Motif Distribution
Phylogenetic analysis showed that the GhKEA gene family was divided into three groups, containing 8, 2, and 5 members (Figure 4A). The sequences of most members of each subfamily were similar, indicating their close evolutionary relationship. The gene length of GhKEA15 was the shortest and that of GhKEA13 was the longest. The exon numbers of GhKEAs were ranged from 4 to 20, but most of the genes contained at least 15 exons, except that GhKEA15 contained only 4 exons (Figure 4B). The GhKEA proteins were further analyzed by the MEME program and 10 conserved motifs were identified (Figure 4C). Most GhKEA members contained multiple motifs, except GhKEA15 (1 motif), and motif 1, motif 2, motif 3, motif 4, motif 7, and motif 10 were widely distributed in these members. Motif 5 existed in the KEAIb and KEAII classes, motif 6 only did not exist in KEAIb, and motif 8 and motif 9 existed only in the KEAII class. Members of the same subfamily have similar motif characteristics, exon-intron structures and gene lengths, supporting a close evolutionary relationship.
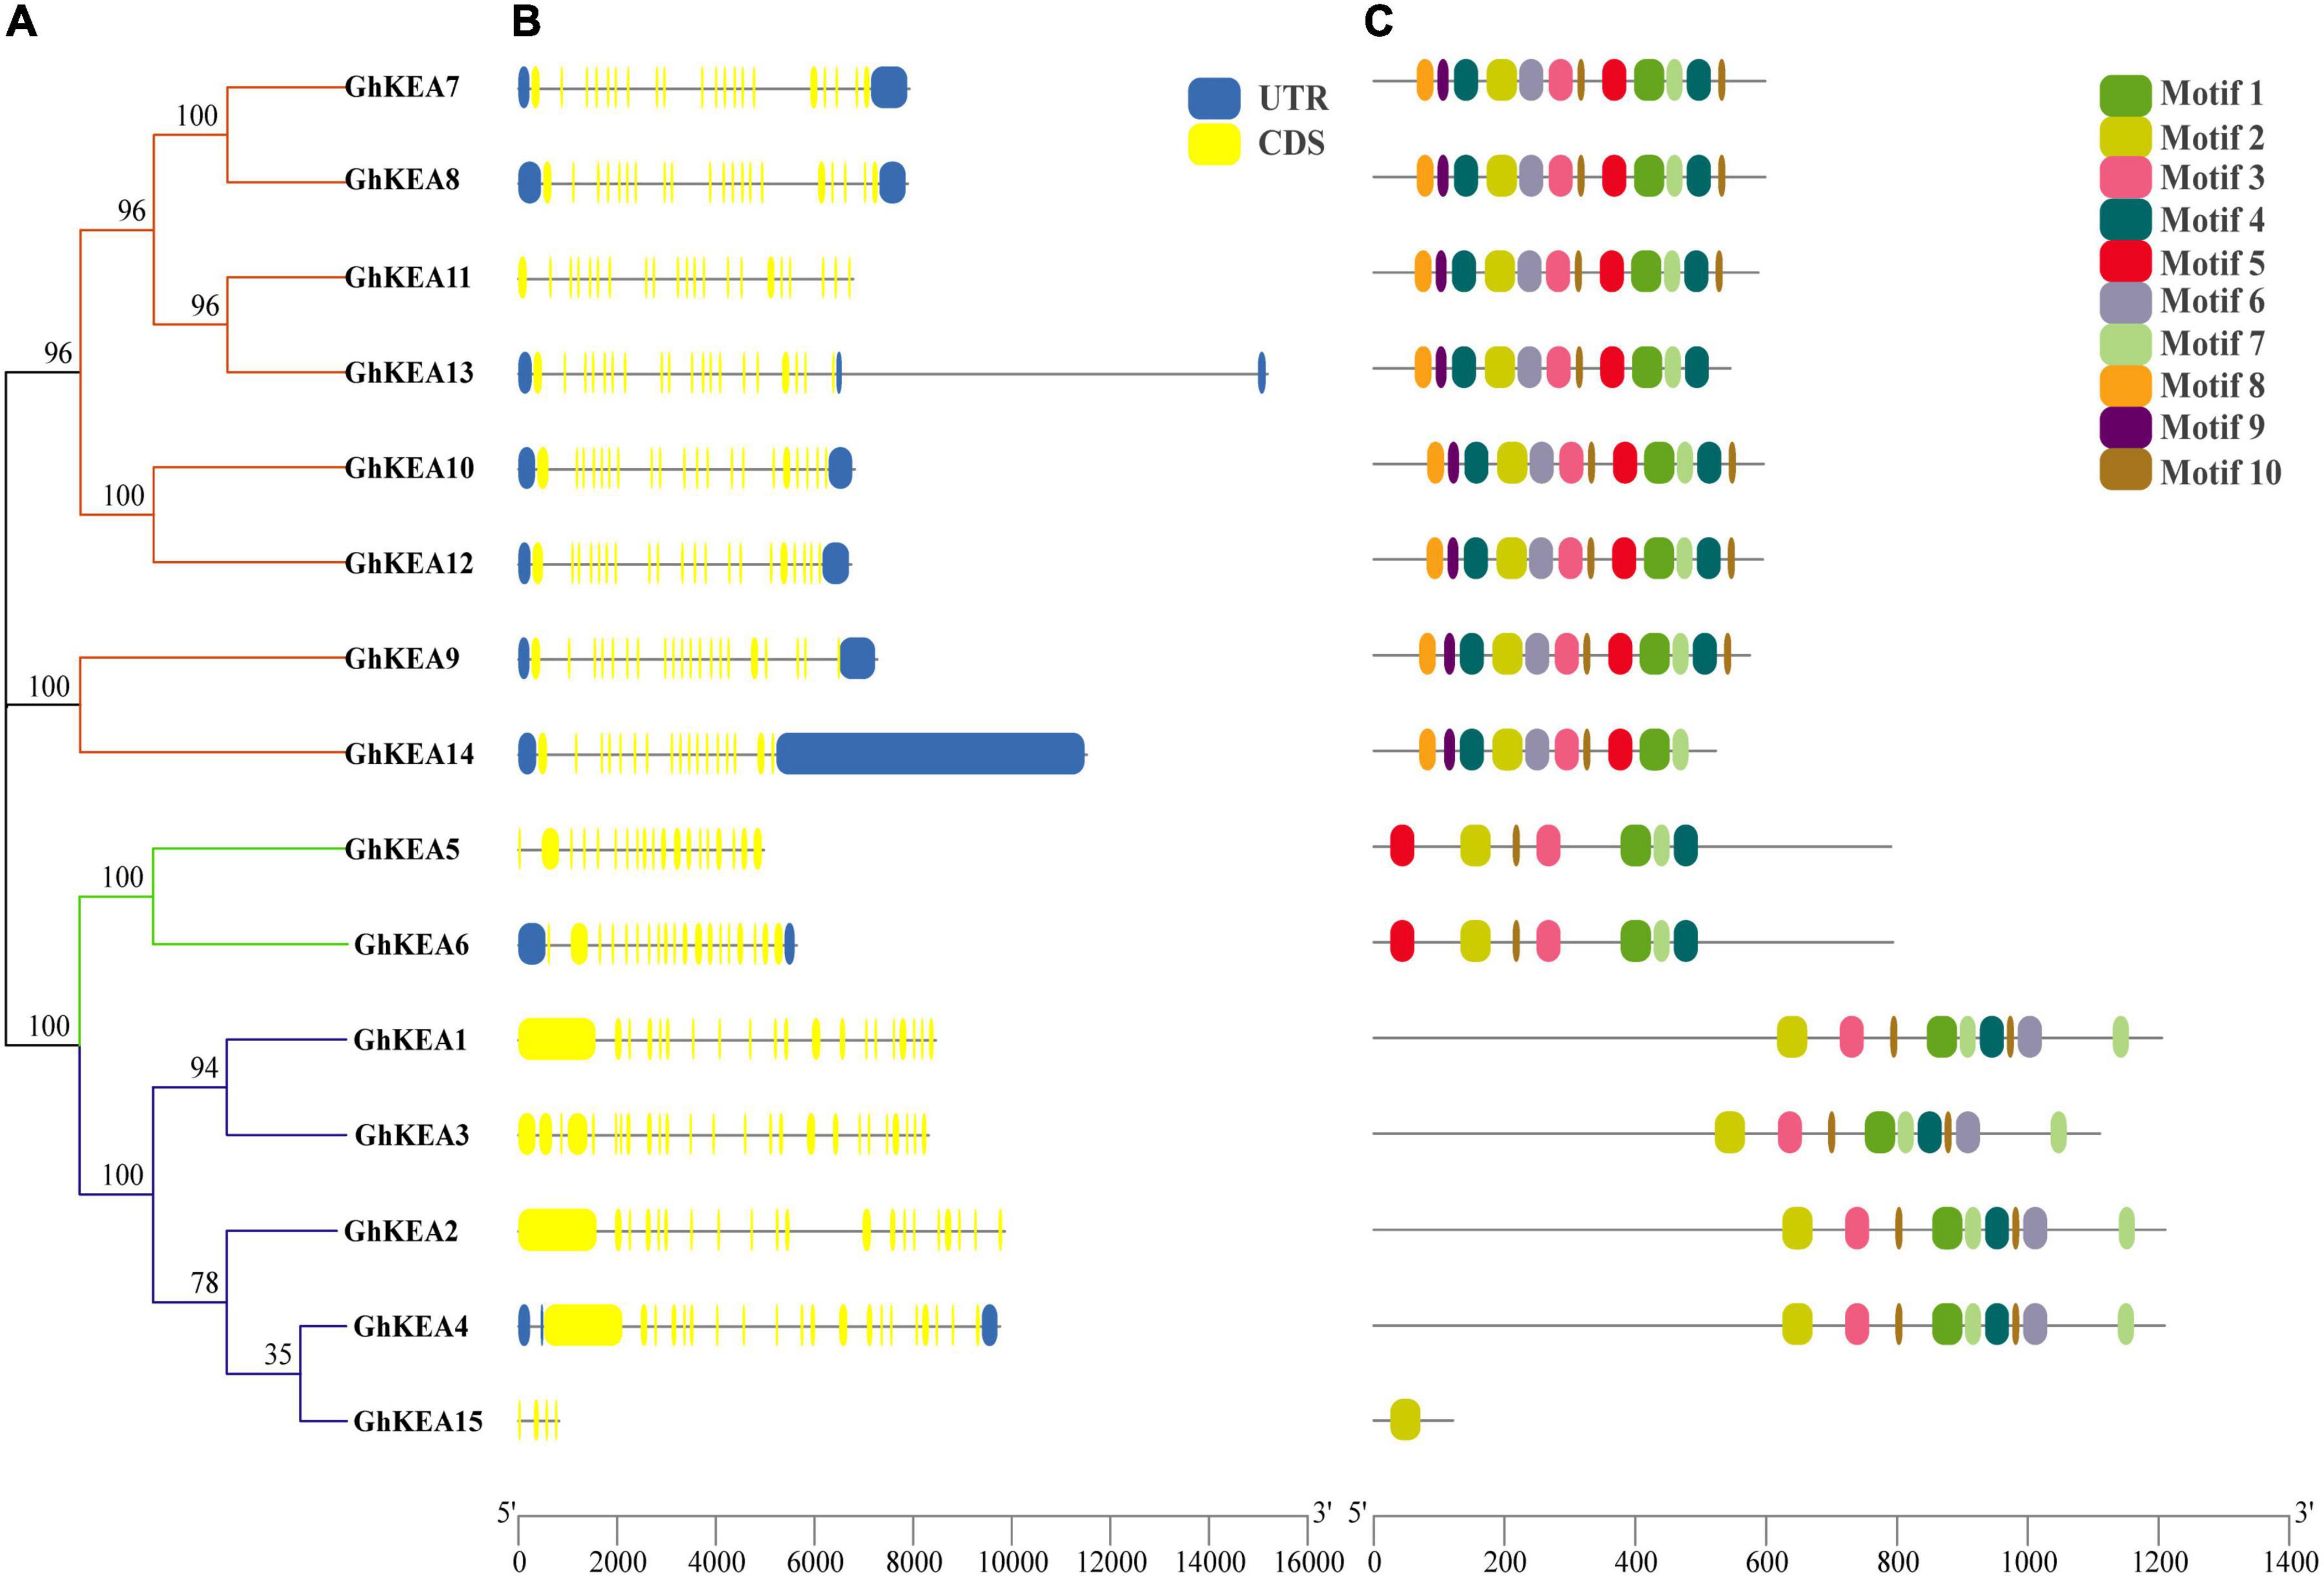
Figure 4. Phylogenetic relationship, exon-intron structure, and conserved motif of KEA genes in G. hirsutum. (A) The rootless tree is constructed in MEGA, and the three subfamilies are represented by different colors. (B) The number, length, and location of exons and introns in GhKEAs. Boxes and lines represent exons and introns, respectively. (C) Distribution of conserved motifs in the GhKEA gene family.
Analysis of Cis-Elements in Putative GhKEA Promoter Regions
To analyze the cis-elements that may be involved in the regulation of GhKEAs, the upstream 2000 bp sequence from the start codon (ATG) of each GhKEA gene was extracted for analysis. The cis-elements were classified into hormone response elements, stress response elements and plant growth and development elements (Figure 5). The hormone response elements included mainly salicylic acid (SA), methyl jasmonate (MeJA), gibberellin (GA), auxin (IAA) and abscisic acid (ABA). Most of the GhKEAs promoter regions contained 2–4 hormone response elements, except GhKEA11 (1 ABA response element). Of these, GhKEA5, GhKEA6, GhKEA8, and GhKEA12 contained the most hormone response elements, while GhKEA14 contained the largest number. Among these hormone response elements located in the promoter regions of GhKEAs, the largest number is the MeJA response element, followed by the ABA response element (Figure 5A). Previous studies have shown that MeJA and ABA were the main plant hormone signaling molecules under stress (Mantyla et al., 1995; Pichersky and Gershenzon, 2002), so we speculated that GhKEAs might be involved in various stress responses of upland cotton.
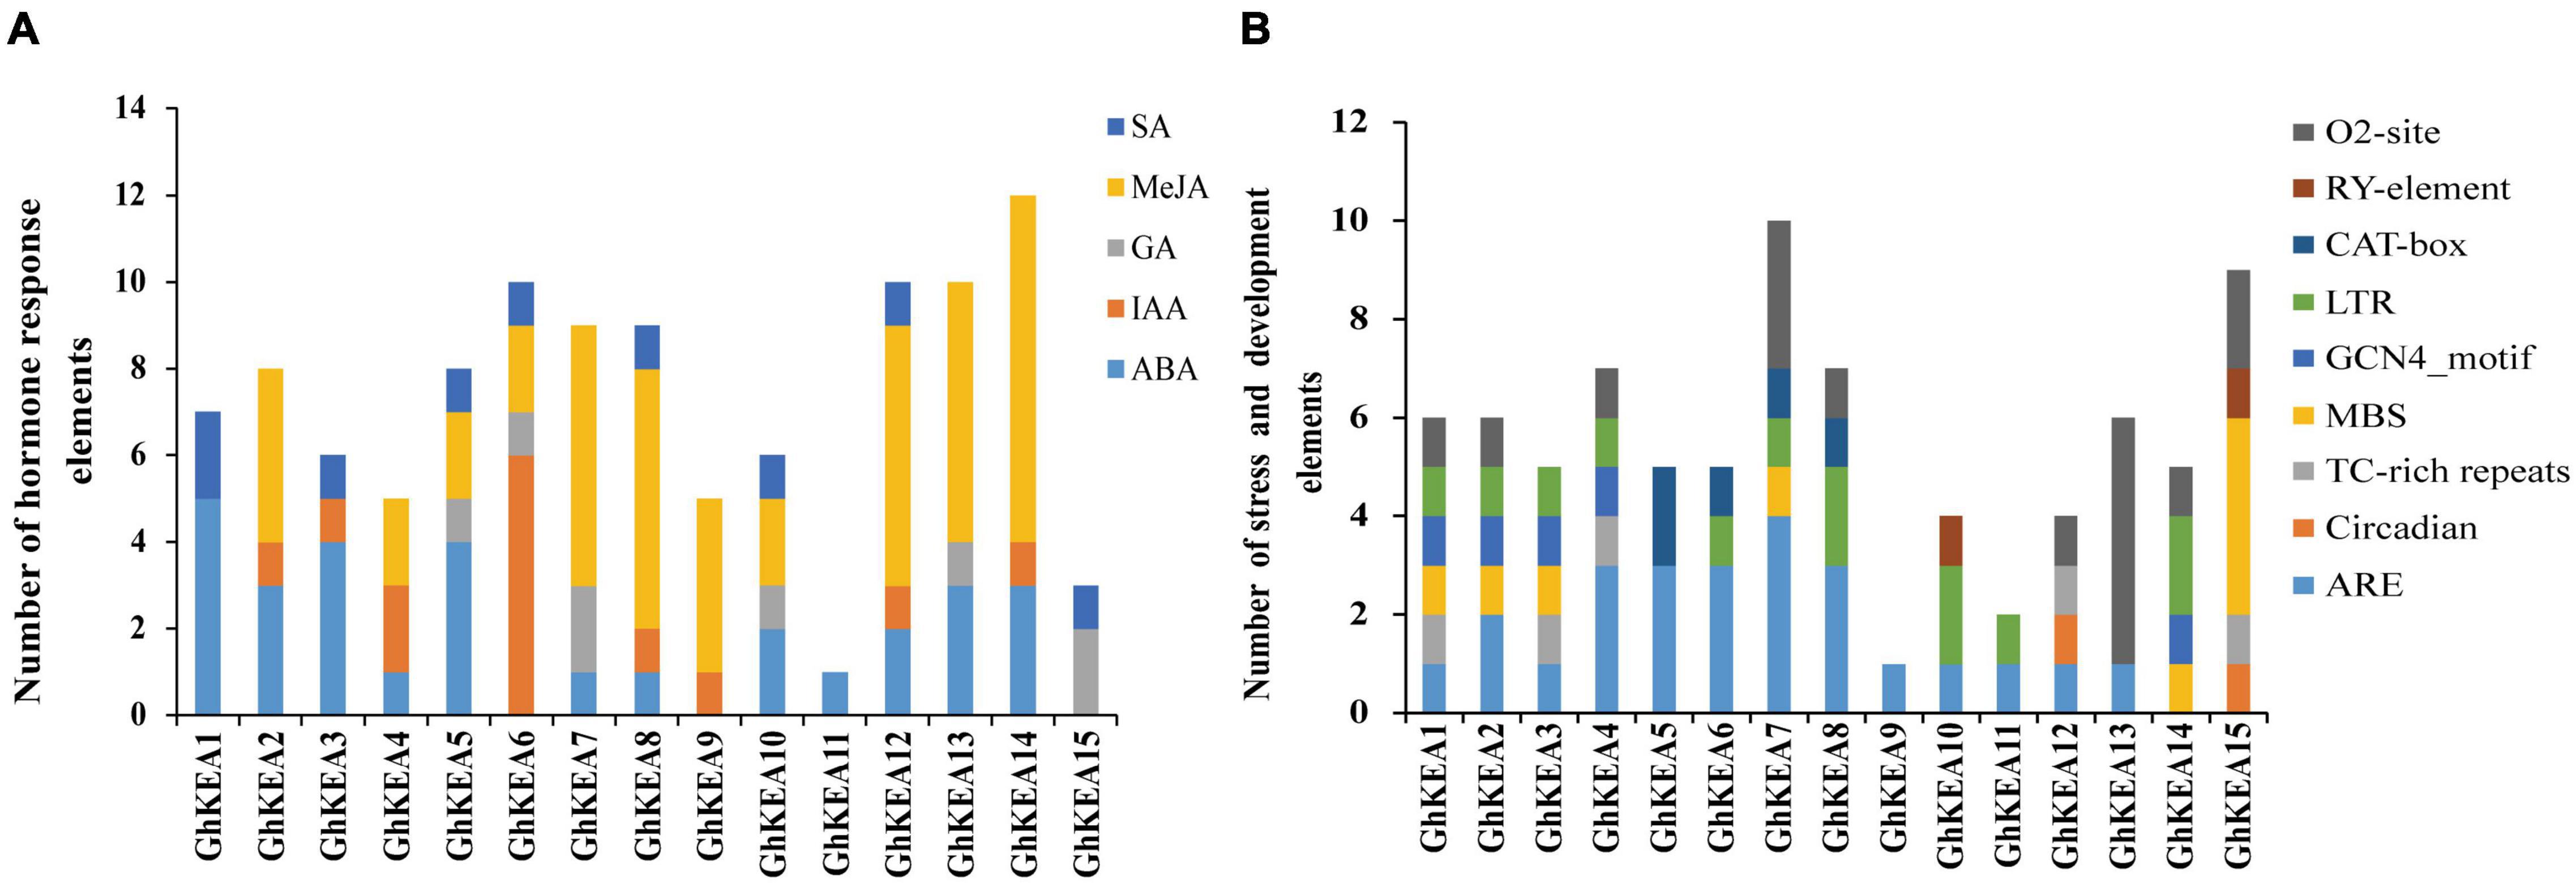
Figure 5. The number of plant hormone cis-acting elements and induced stress cis-acting elements in the promoter fragment of GhKEAs. (A) The sum of hormone response cis-acting elements in each member of GhKEAs. (B) The sum of cis-acting elements of stress and development in each member of GhKEAs.
The stress response elements and plant growth and development elements of the GhKEAs were shown in Figure 5B. GhKEA1 contained most kinds of elements, including zein metabolism regulation elements (O2-site), low temperature response elements (LTR), endosperm expression regulatory elements (GCN4_motif), drought response elements (MBS), defense and stress elements (TC-rich repeats) and anaerobic induction elements (ARE). In addition, GhKEA7 contained the largest number of components, while GhKEA9 contained only one ARE element. Among the elements, the content of anaerobic inducible elements (AREs) was the highest, followed by Zein metabolic regulatory elements (O2 sites). In previous study, zein and its hydrolyzates have antioxidant activity (Diaz-Gomez et al., 2018), so we inferred that GhKEAs could have high antioxidant activity and antioxidant stability. These results further indicated that the KEA genes might be involved in the stress response of upland cotton.
Organ Expression Pattern Analysis of GhKEAs
To determine the expressions of GhKEAs in various tissues of upland cotton, the transcription data of GhKEAs in different tissues (anther, filament, pistil, petal, root, leaf, and stem) in TM-1 were analyzed. As shown in Figure 6, GhKEAs were widely expressed in different tissues, and the same gene was highly expressed in several different tissues. The expressions of GhKEAs in these tissues could be divided into three groups. Group a contained GhKEA1, GhKEA3, GhKEA5, and GhKEA6, which were expressed in anthers, petals and leaves. Group b consisted of GhKEA9, GhKEA10, GhKEA11, and GhKEA13, which were highly expressed in the pistils. The last group c was composed of GhKEA2, GhKEA4, GhKEA7, GhKEA8, GhKEA12, and GhKEA14, these genes were highly expressed in the pistils, roots and stems. The multiple expression patterns indicated that the functions of GhKEAs had been differentiated in long-term evolution.
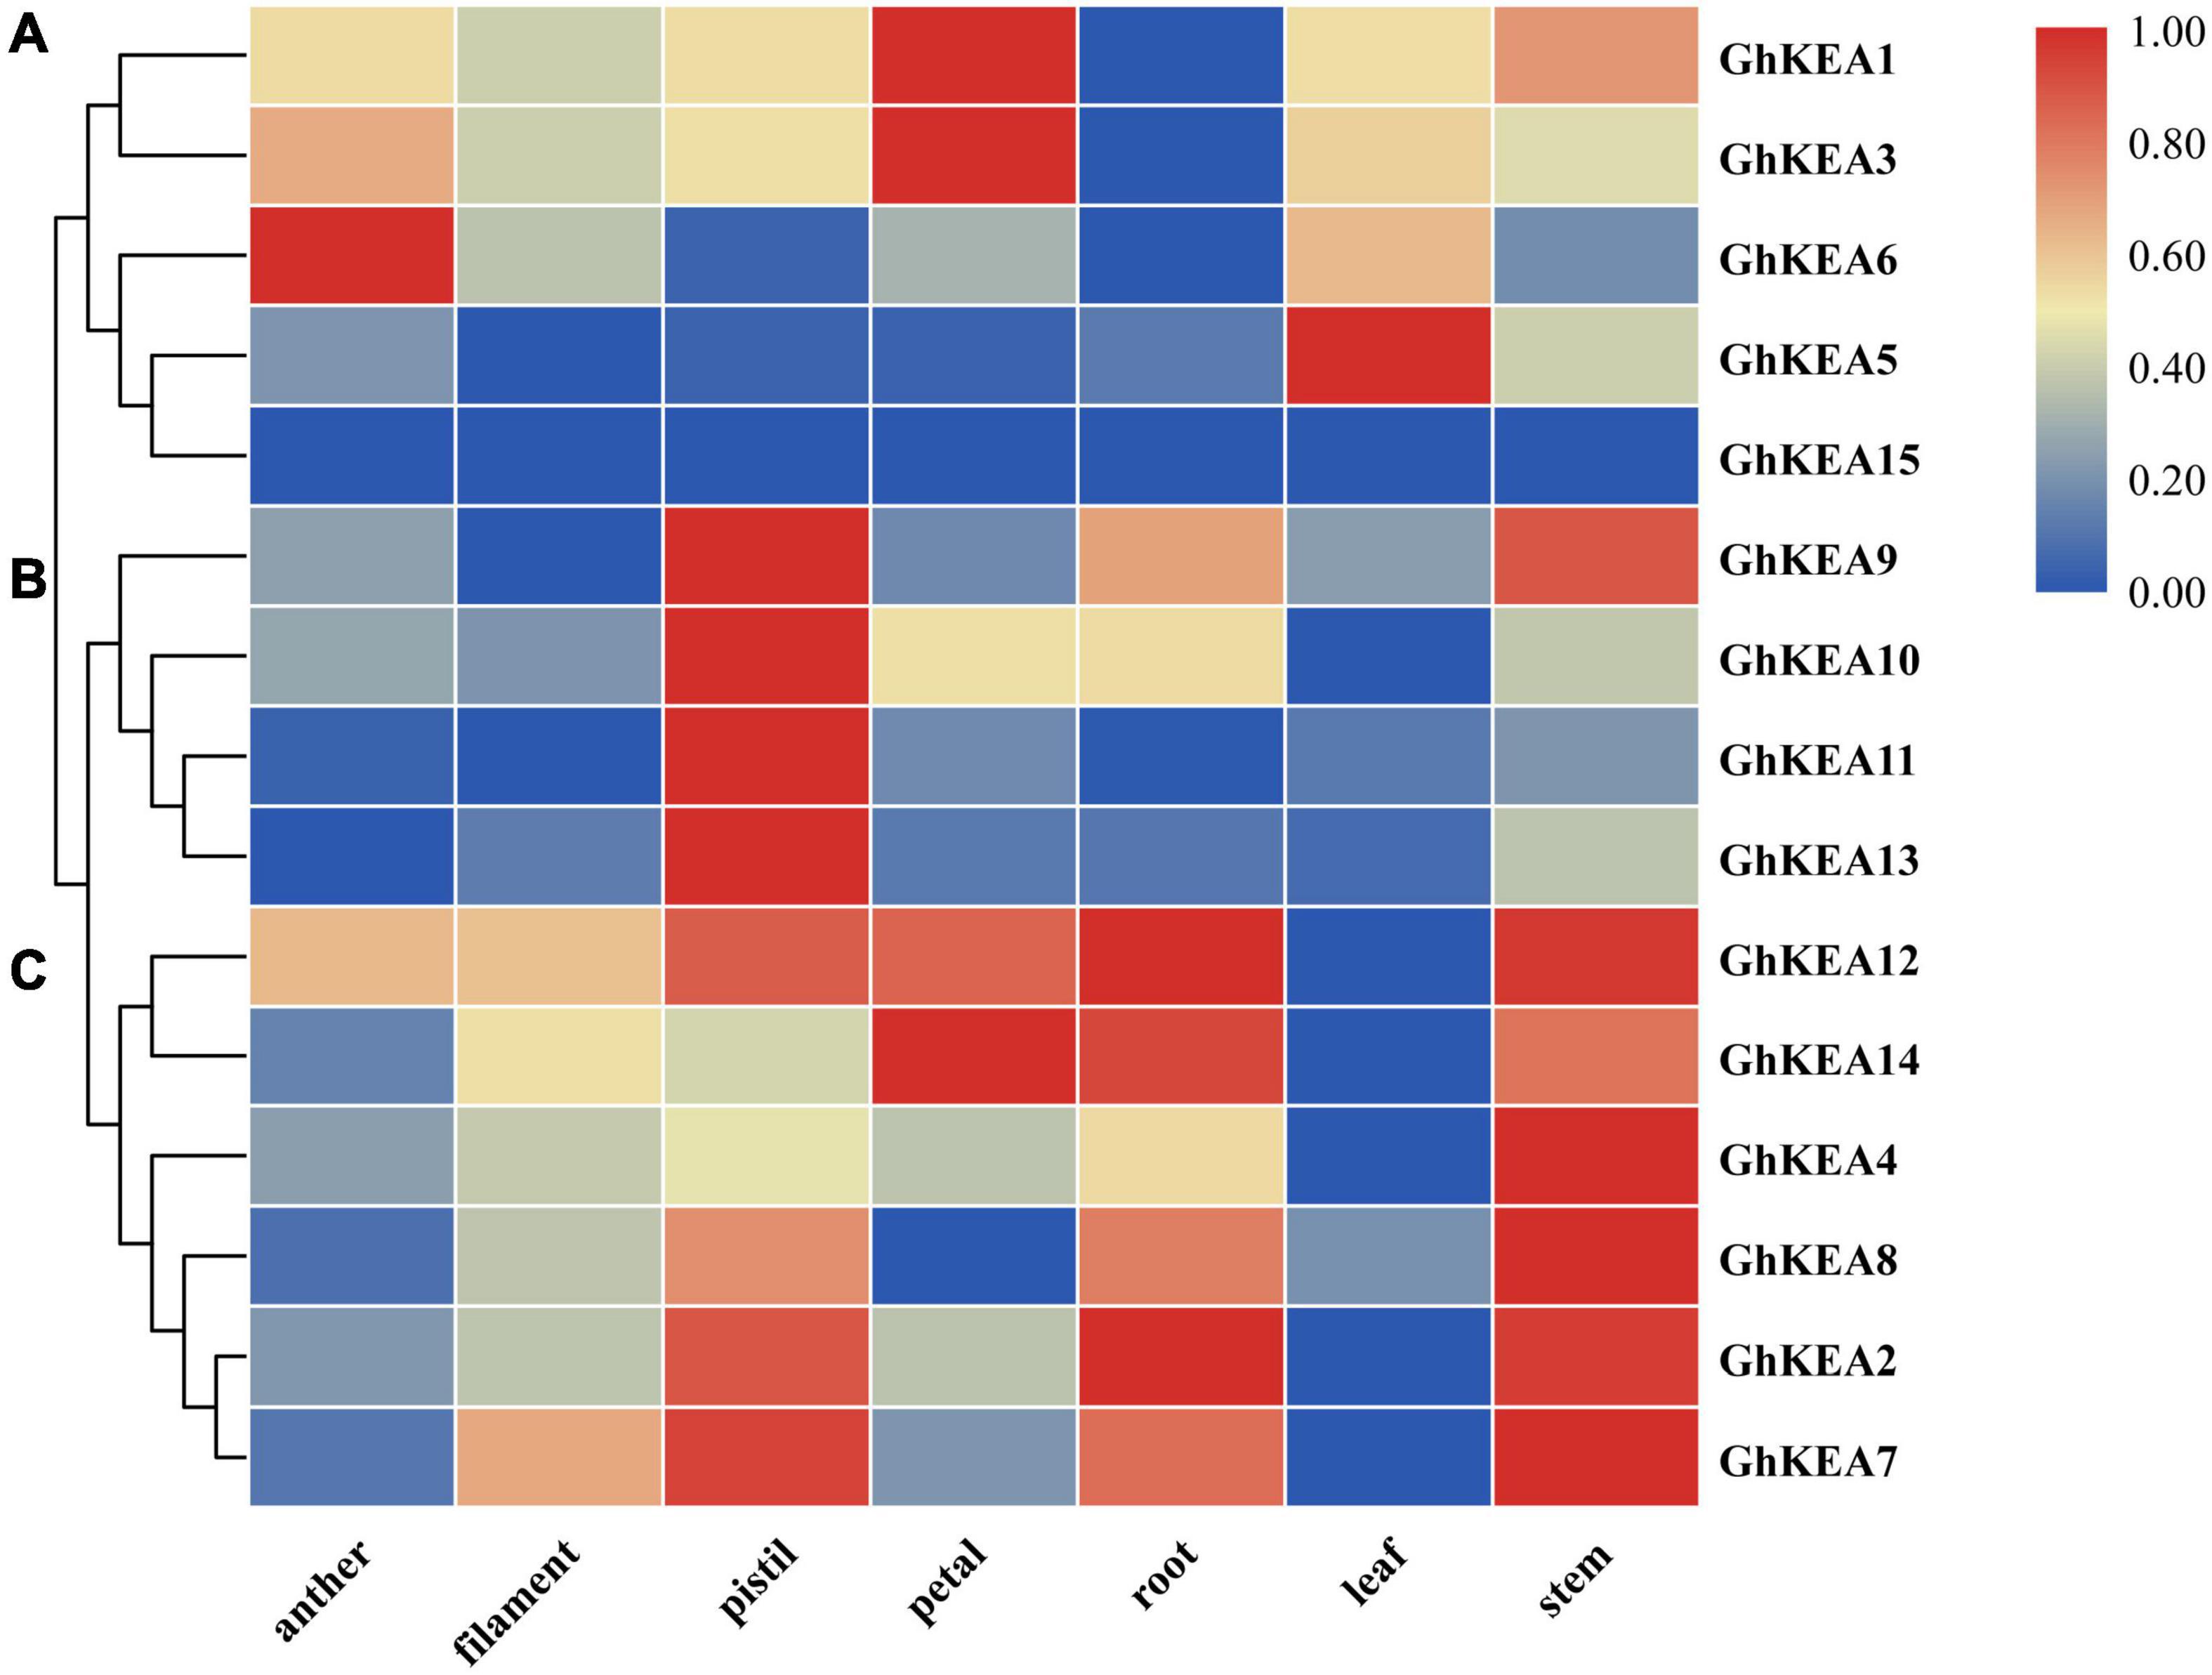
Figure 6. Hierarchical clustering of GhKEAs expression levels in ten different tissues of TM-1. The genes are displayed on the right side of each line, and the phylogenetic relationship is shown on the left (A–C).
GhKEAs Expression Patterns Under Multiple Stresses
According to the analysis of cis-elements in the promoter region and previous studies on the KEA genes in other plants, GhKEAs might be involved in the stress response. To test this hypothesis, we used the available transcriptome data to analyze the expression profiles of 15 GhKEAs under salt and drought treatments, and further verified by qRT-PCR experiment. As shown in Figure 7A, GhKEAs were regulated by PEG treatments. The transcriptome data showed that the expression levels of GhKEA2, GhKEA4, GhKEA9, GhKEA10, GhKEA12, GhKEA13, and GhKEA14 were significantly upregulated under PEG stress. However, the expression levels of GhKEA1, GhKEA3, GhKEA5, GhKEA6, and GhKEA7 were significantly downregulated. In addition, the expression levels of GhKEA8 and GhKEA11 were decreased at first and then increased. Then, we selected five genes from each of the above upregulated and downregulated groups to carry out qRT-PCR experiments and further verify their response to drought stress. The data showed that GhKEAs expressions could be regulated by PEG treatment (Figure 7B). After PEG treatment, the expressions of GhKEA2, GhKEA4, GhKEA10, GhKEA12, and GhKEA14 were increased, while the expressions of GhKEA1, GhKEA3, GhKEA5, GhKEA6, and GhKEA7 were decreased, which was basically consistent with the results in the transcriptome database.
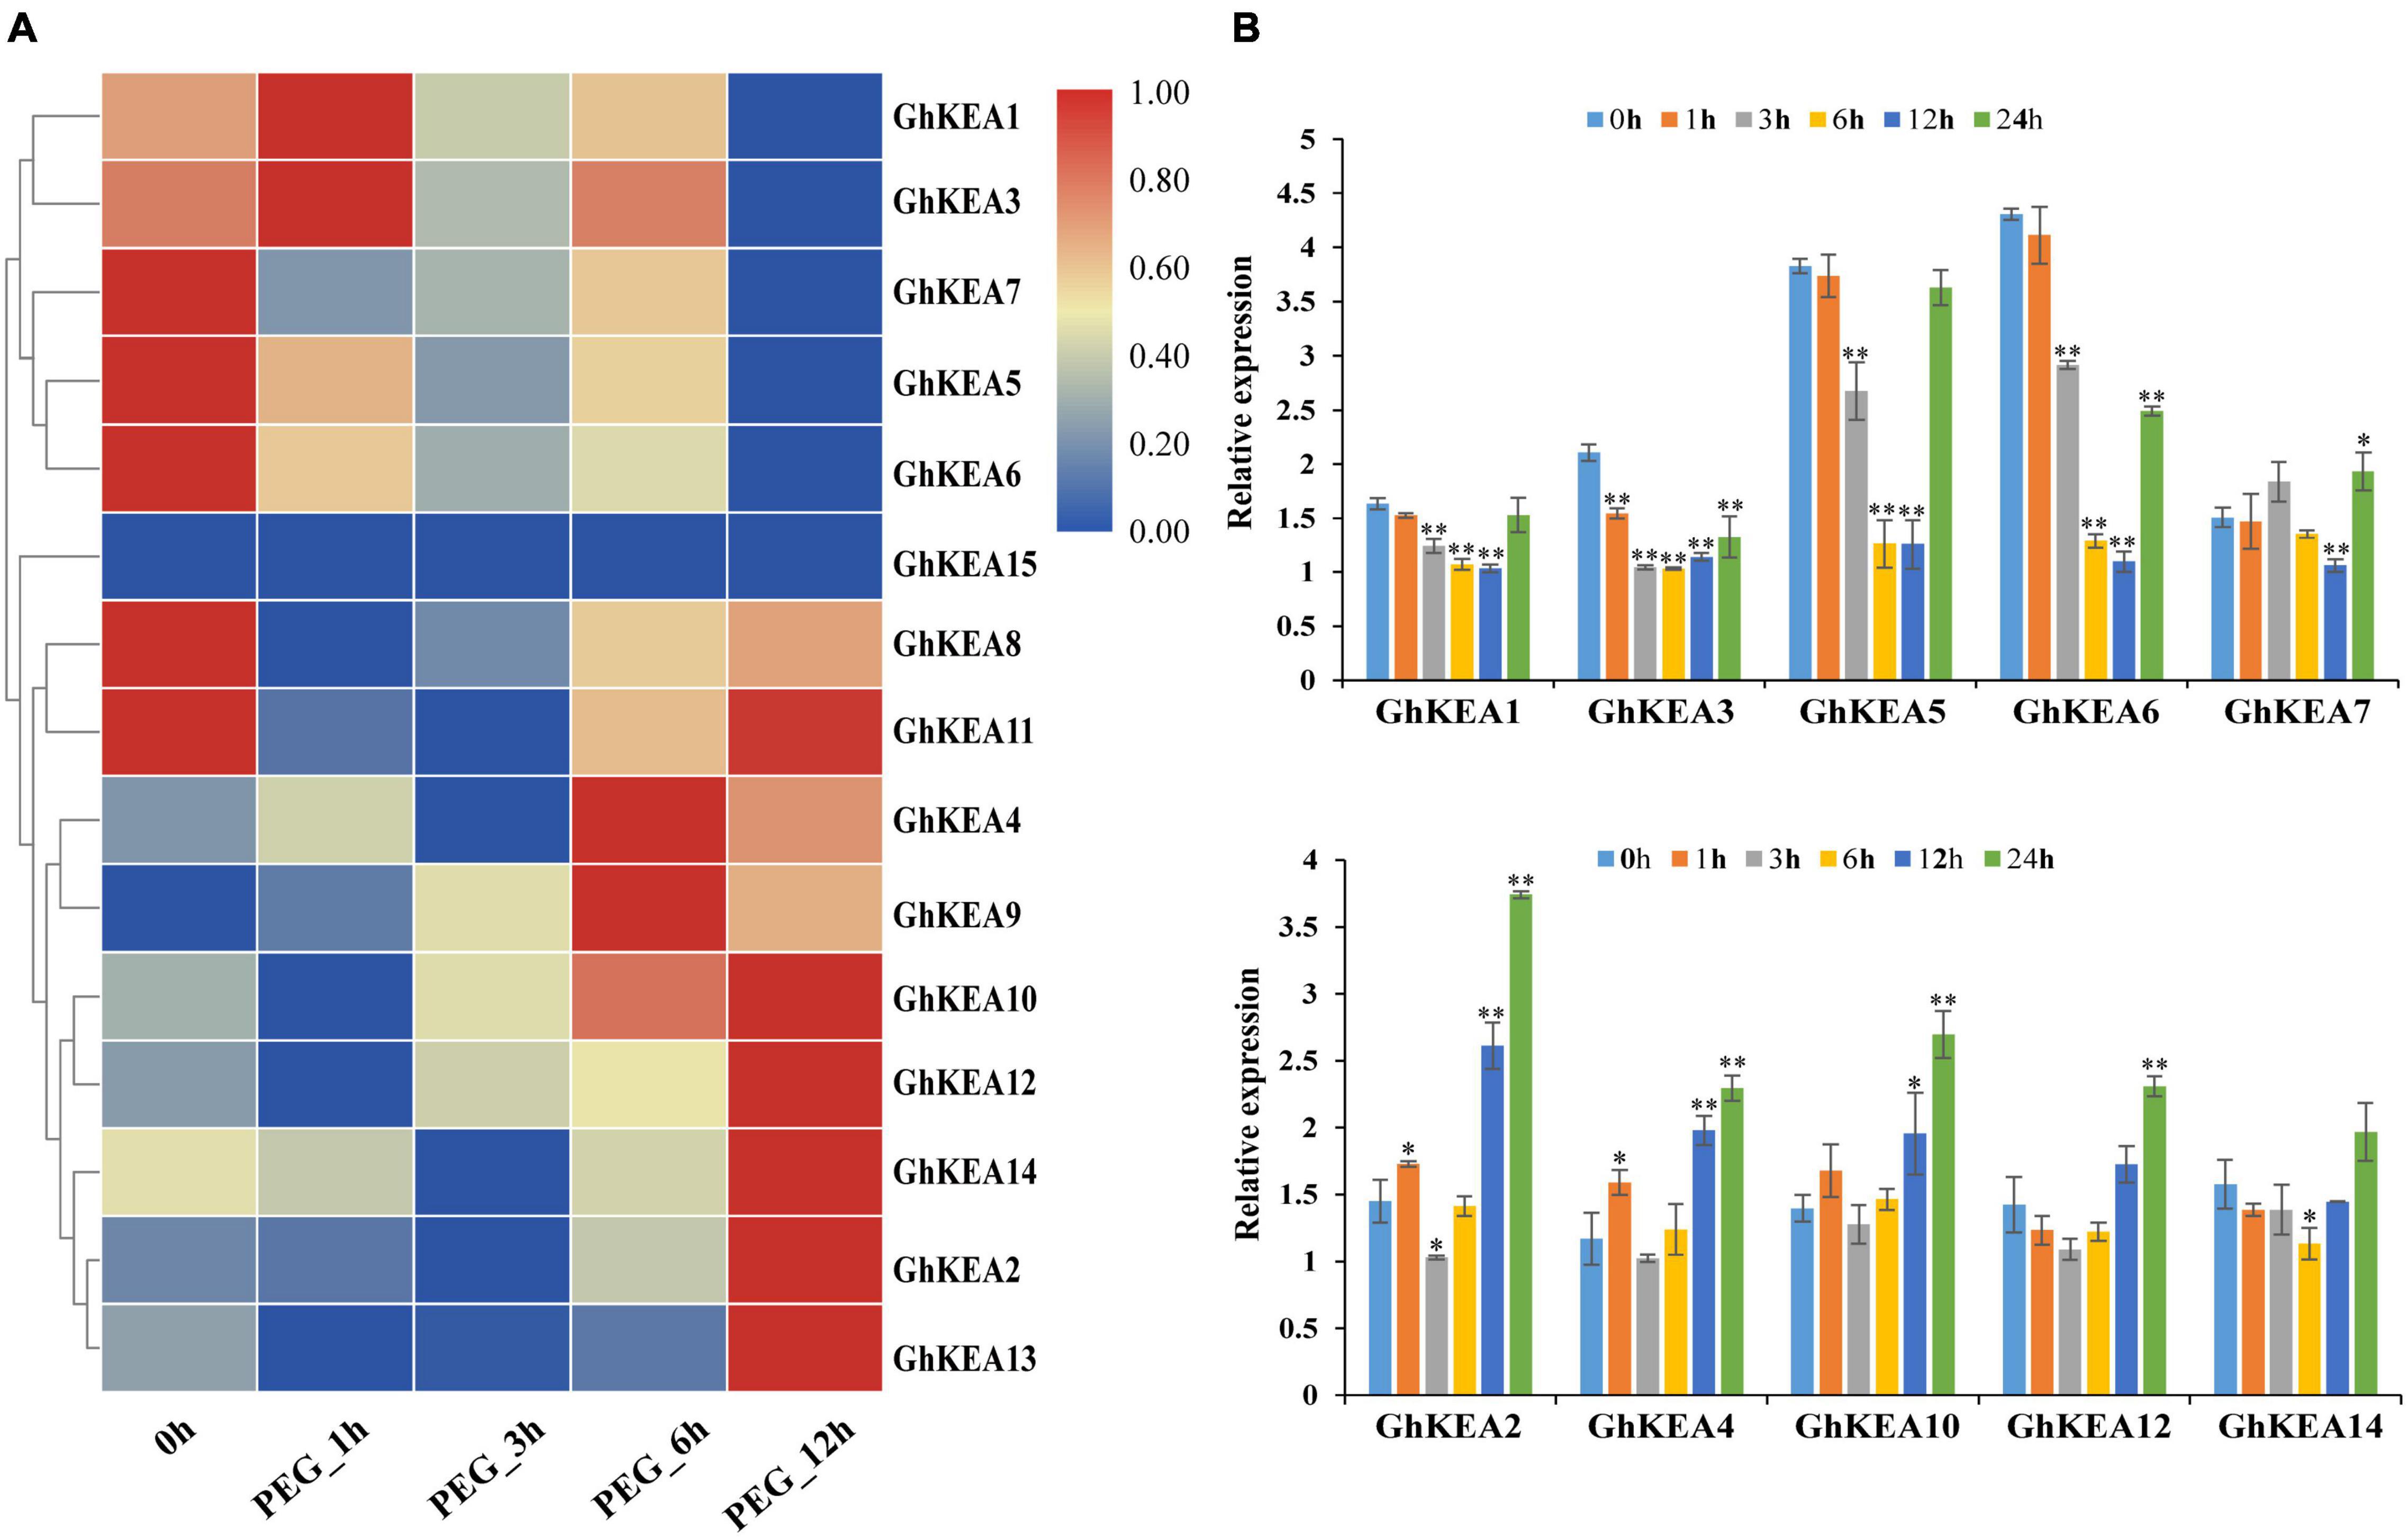
Figure 7. Expression profiles of GhKEAs under drought stress. (A) Hierarchical clustering of 15 GhKEAs expression levels under PEG treatment. (B) Quantificational real-time polymerase chain reaction (qRT-PCR) results of 10 GhKEAs under PEG treatment. 0, 1, 3, 6, 12, and 24 h represent hours after PEG treatment. The experiments were repeated three times and provided consistent results. The gene names are shown on the right. Color blocks represent the relative expression levels of GhKEAs. Error bars indicates SD (**p < 0.01, 0.01 < *p < 0.05, n = 3).
At the same time, we also analyzed the gene expression pattern under salt conditions in publicly available RNA-seq data, and the results showed that the expressions of GhKEAs were induced by salt stress (Figure 8A). The expressions of GhKEA9, GhKEA10, and GhKEA12 were upregulated, while the expressions of GhKEA5, GhKEA6, and GhKEA11 were downregulated. What’s more, the expressions of GhKEA7, GhKEA8, GhKEA13, and GhKEA14 were upregulated at first and then downregulated, and reached the highest level at 1 h after treatment, while the expressions of GhKEA1, GhKEA2, GhKEA3, and GhKEA4 were also upregulated and then downregulated. The difference was that the expressions of these 4 genes reached the highest level at 3–6 h. The inconsistent expression patterns of GhKEAs under the same stress may be due to their different promoter elements, resulting in their possible regulation by different upstream genes and thus affecting their expression patterns. We selected 10 GhKEAs from the above groups to further investigate the effect of salt stress on their expressions by qRT-PCR (Figure 8B). The results were basically consistent with the RNA-seq data; the expression levels of GhKEA2, GhKEA7, GhKEA8, GhKEA13, and GhKEA14 were upregulated at first and then downregulated, GhKEA5 and GhKEA11 were downregulated, and GhKEA9, GhKEA10, and GhKEA12 were upregulated.

Figure 8. Expression profiles of GhKEAs under salt stress. (A) Hierarchical clustering of 15 GhKEAs expression levels under NaCl treatment. (B) qRT-PCR results of 10 GhKEAs under NaCl treatment. 0, 1, 3, 6, 12, and 24 h represent hours after NaCl treatment. The experiments were repeated three times and provided consistent results. The gene names are shown on the right. Color blocks represent the relative expression levels of GhKEAs. Error bars indicates SD (**p < 0.01, 0.01 < *p < 0.05, n = 3).
To verify the potential roles of GhKEAs in potassium absorption and transport, qRT-PCR experiments were used to observe whether the GhKEAs responded to low potassium treatment. The results are shown in Figure 9. The expressions of GhKEAs responded to low potassium treatment, and 15 GhKEAs were divided into three groups according to their expression characteristics. In group a, the expressions of GhKEAs were downregulated after low potassium treatment. The expressions of GhKEA5, GhKEA6, and GhKEA15 in group b were upregulated at first, then downregulated, and then upregulated. The gene expressions in group c first increased and then decreased. Among them, the expressions of GhKEA7, GhKEA8, GhKEA9, and GhKEA12 reached the highest level at 1 h after low potassium treatment, while the expressions of GhKEA2, GhKEA4, and GhKEA11 reached the highest level at 12 h, and only GhKEA10 reached the highest level at 3 h. These results indicated that GhKEAs might regulate the abiotic stress response to low potassium ions in the environment and participate in the absorption and transport of potassium ions in cotton.
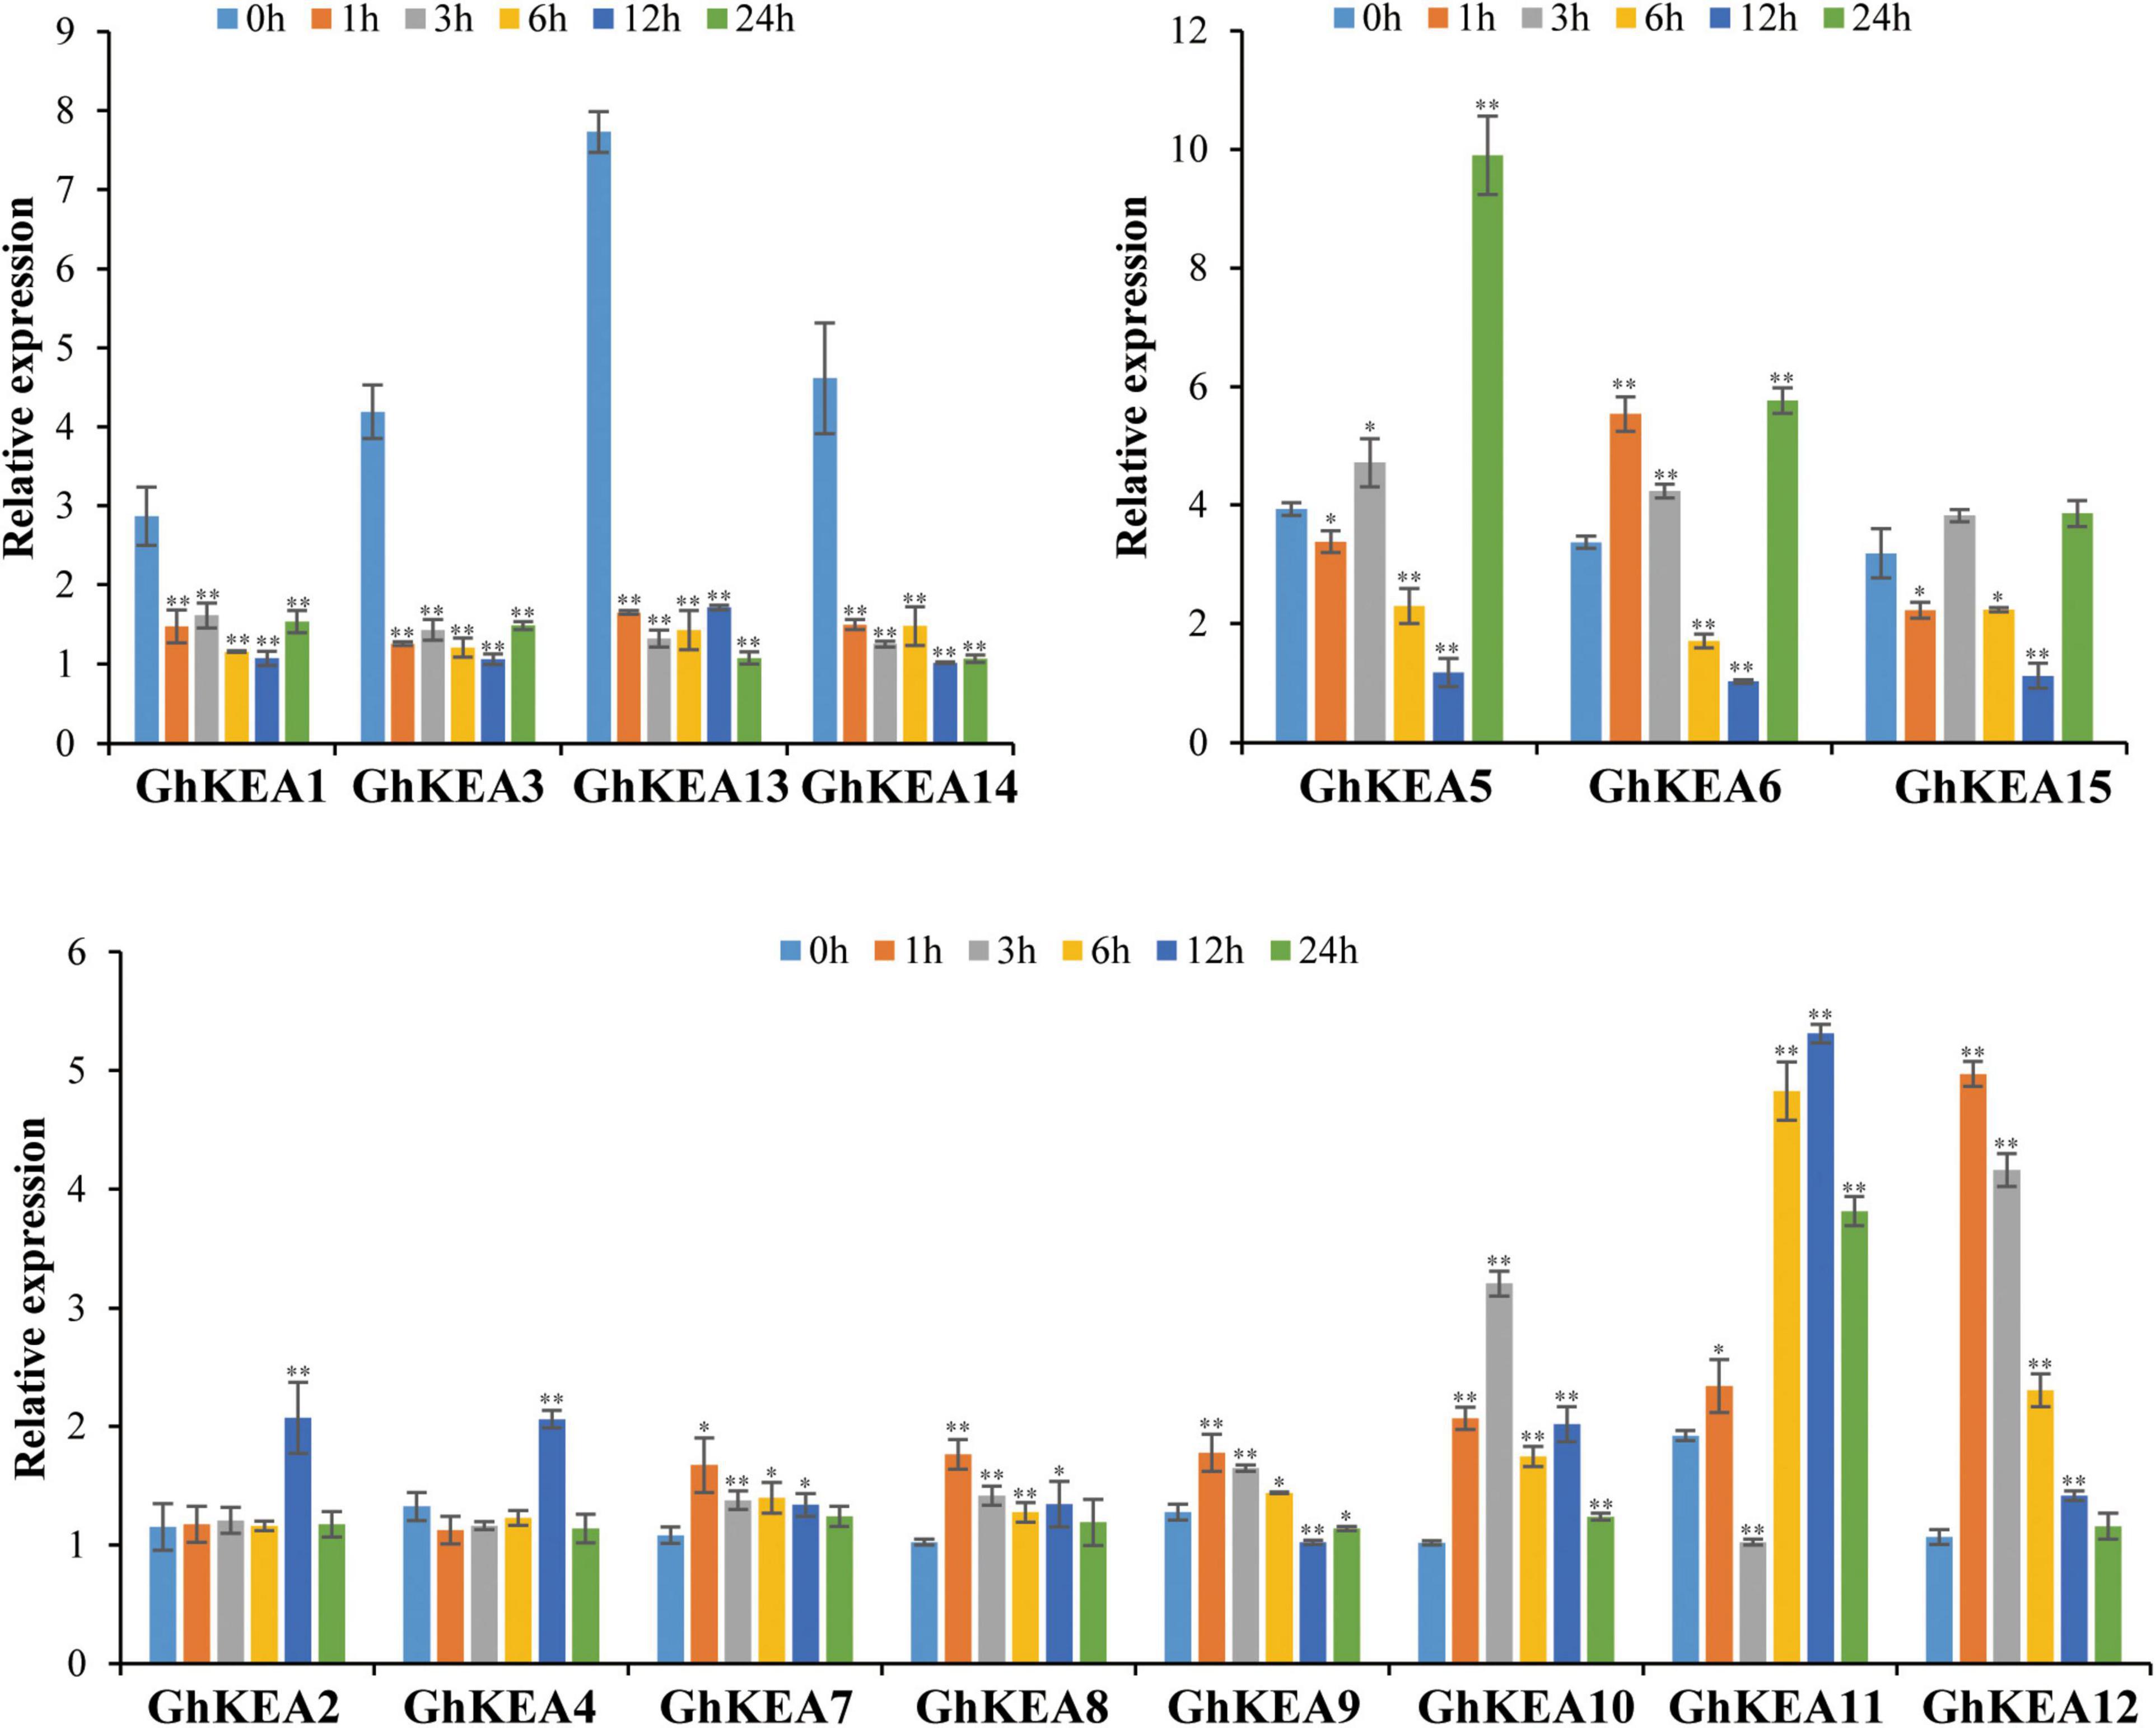
Figure 9. The qRT-PCR results of GhKEAs under low potassium treatment. 0, 1, 3, 6, 12, and 24 h represent hours after low potassium treatment. Error bars show the standard deviation of three biological repeats.
Silencing of GhKEA4 and GhKEA12 Compromise the Tolerance of Cotton to Salt Stress
Analysis of the promoter regions of GhKEAs revealed that the promoter regions of both GhKEA4 and GhKEA12 contain ABA and MeJA hormone response elements as well as antioxidant response elements ARE. GhKEA12 was significantly differentially expressed under low potassium stress and significantly up-regulated by drought and salt stress. The expression of GhKEA4 was significantly up-regulated under drought stress, while it also responded to low potassium and high salt stress. Then, GhKEA4 and GhKEA12 were selected for the VIGS experiments and salt treatments. The albino phenotype on the pYL156-CLA1 cotton plant ensured the success of the VIGS experiment (Figure 10A). As shown in Figure 10B, the expressions of the GhKEA4 and GhKEA12 in the corresponding VIGS plants leaves were significantly lower than the expressions in the pYL156 empty vector plants, indicating that the genes had been silenced successfully. Then these plants were treated with salt to observe the phenotype. Figure 10A showed that after salt stress, cotton plants silenced for GhKEA4 and GhKEA12 showed obvious wilting compared with control cotton plants. Subsequently, the leaves of these plants were treated with drought in vitro, to calculate the water loss rate of detached leaves. The results showed that the water loss rates of cotton leaves were significantly higher than that of control plants after silencing GhKEA4 and GhKEA12 genes, indicating that the water holding capacity of leaves decreased after silencing the target gene (Figure 10E). In order to further investigate the effects of salt stress on the physiological and biochemical characteristics of plants, the chlorophyll content, proline content, soluble sugar content, peroxidase (POD) activity and catalase (CAT) activity in VIGS cotton leaves were measured after salt stress. The results showed that after salt treatment, CAT and POD in control plants were extremely significantly and significantly higher than those in plants silenced for the target gene (Figure 10F). Furthermore, the soluble sugar, proline and total chlorophyll contents in the leaves of control plants were significantly higher than those of plants silenced for the target gene (Figures 10G–I). These results indicated that the salt tolerance of cotton plants decreased after silencing GhKEA4 and silencing GhKEA12.
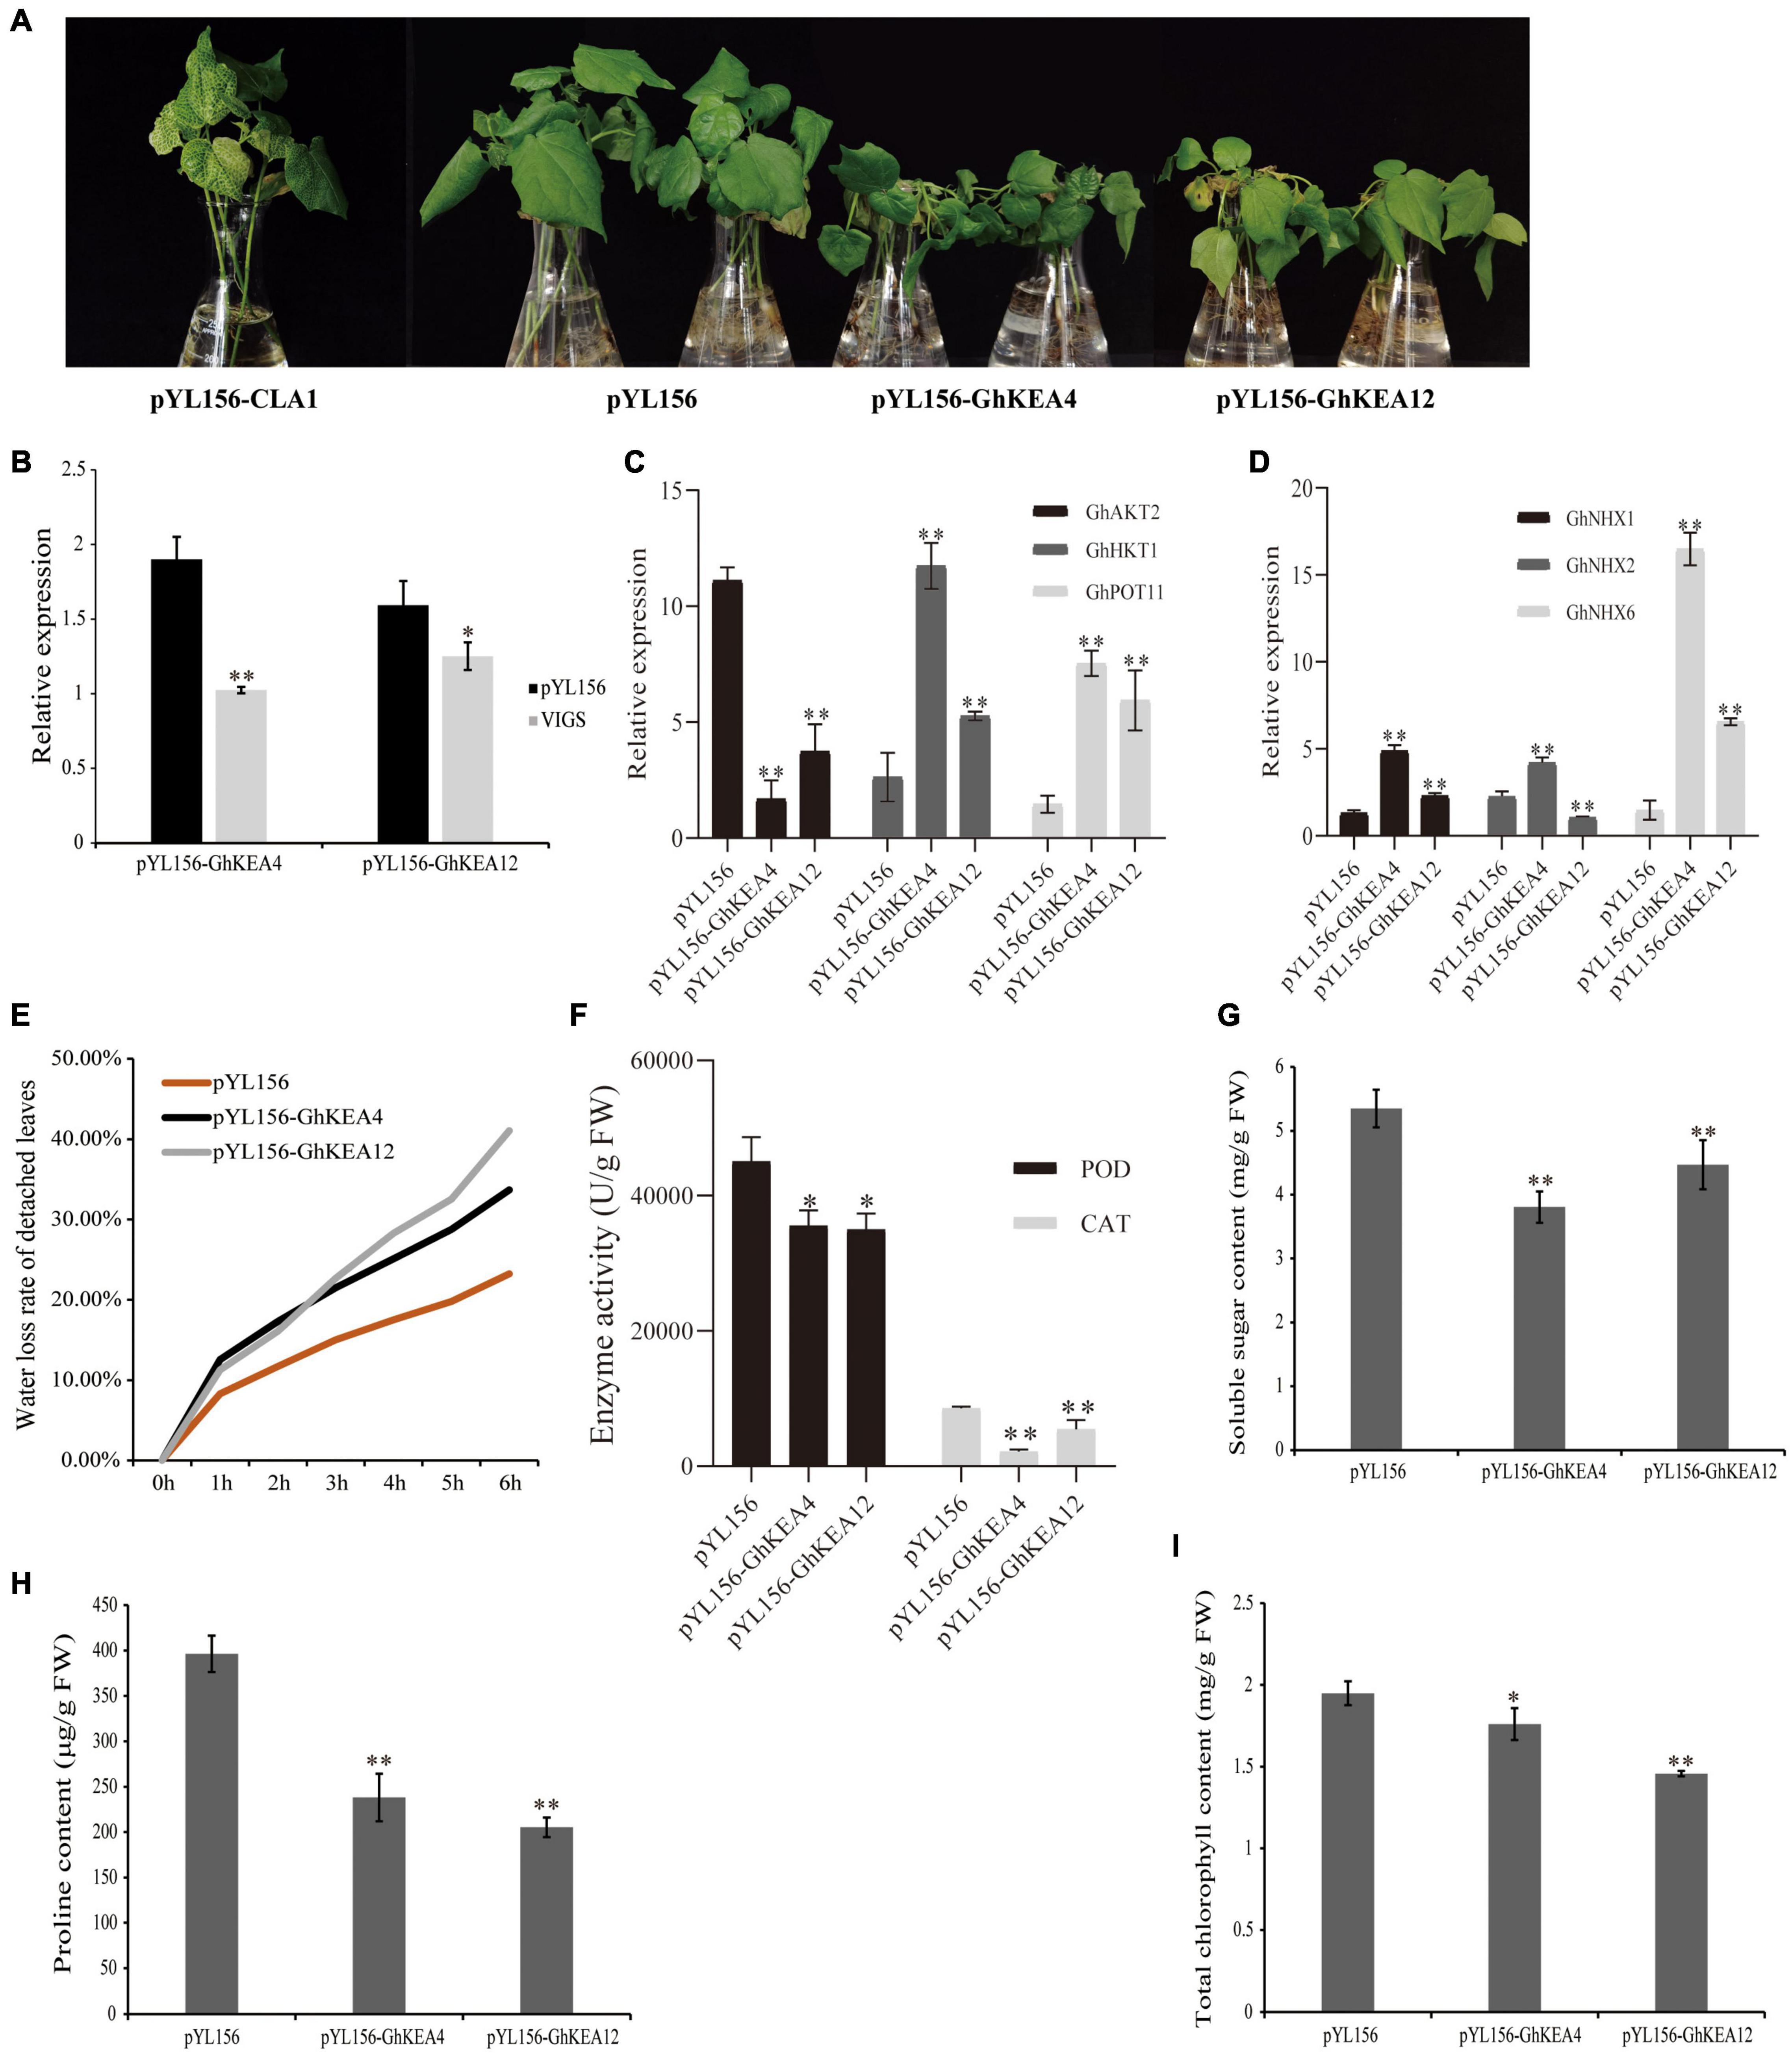
Figure 10. Silencing GhKEA4 and Silencing GhKEA12 in cotton can destroy the tolerance of cotton to salt stress. (A) The phenotypes of positive control, empty control, and virus-induced gene silencing (VIGS) plants under salt treatment. (B) The expression levels of GhKEA4 and GhKEA12 in pYL156 and VIGS plants leaves. (C,D) Relative expression levels of K and Na transport related genes in pYL156 and VIGS plants leaves. (E) The water loss rate of isolated leaves of control plants and VIGS plants leaves. (F) The activities of CAT and POD in empty control and VIGS plants leaves after salt treatment. (G–I) After salt treatment, the contents of soluble sugar, proline and chlorophyll in empty control and VIGS plants leaves. Error bars indicate SD (**p < 0.01, 0.01 < *p < 0.05, n = 3).
In addition, the results of the expression levels of related genes encoding K and Na transporters showed that GhAKT2 was down-regulated, GhHKT1, GhPOT11, GhNHX1, and GhNHX6 were up-regulated in plants silenced for the target gene, while GhNHX2 was up-regulated in plants silenced for GhKEA4 and down-regulated in plants silenced for GhKEA12 (Figures 10C,D).
K+ and Na+ Contents in Virus-Induced Gene Silencing Cotton Plants Under High Salt, High Potassium, and Low Potassium Stress
In order to preliminarily characterize the potassium ion transport activity of KEA gene, the K+ and Na+ content in cotton silenced for GhKEA4 and GhKEA12 before and after high salt, high potassium, and low potassium treatments were measured. The results showed that under control conditions (untreated), after silencing GhKEA4 in cotton plants, the Na+ content in stems and roots was extremely significantly higher than that in empty vector control plants, the K+ content in the entire plant was significantly increased, but only the Na+/K+ ratio in roots was extremely significantly increased (Figures 11B,C). After silencing the GhKEA12 gene in cotton plants, the Na+ content in leaves was extremely significantly higher than that in empty vector control plants, the K+ content in the entire plant was extremely significantly increased, and only the Na+/K+ ratio in stems was extremely significantly decreased (Figure 11A). The results showed that the Na+/K+ balance could be basically maintained after silencing GhKEA4 and GhKEA12 genes.
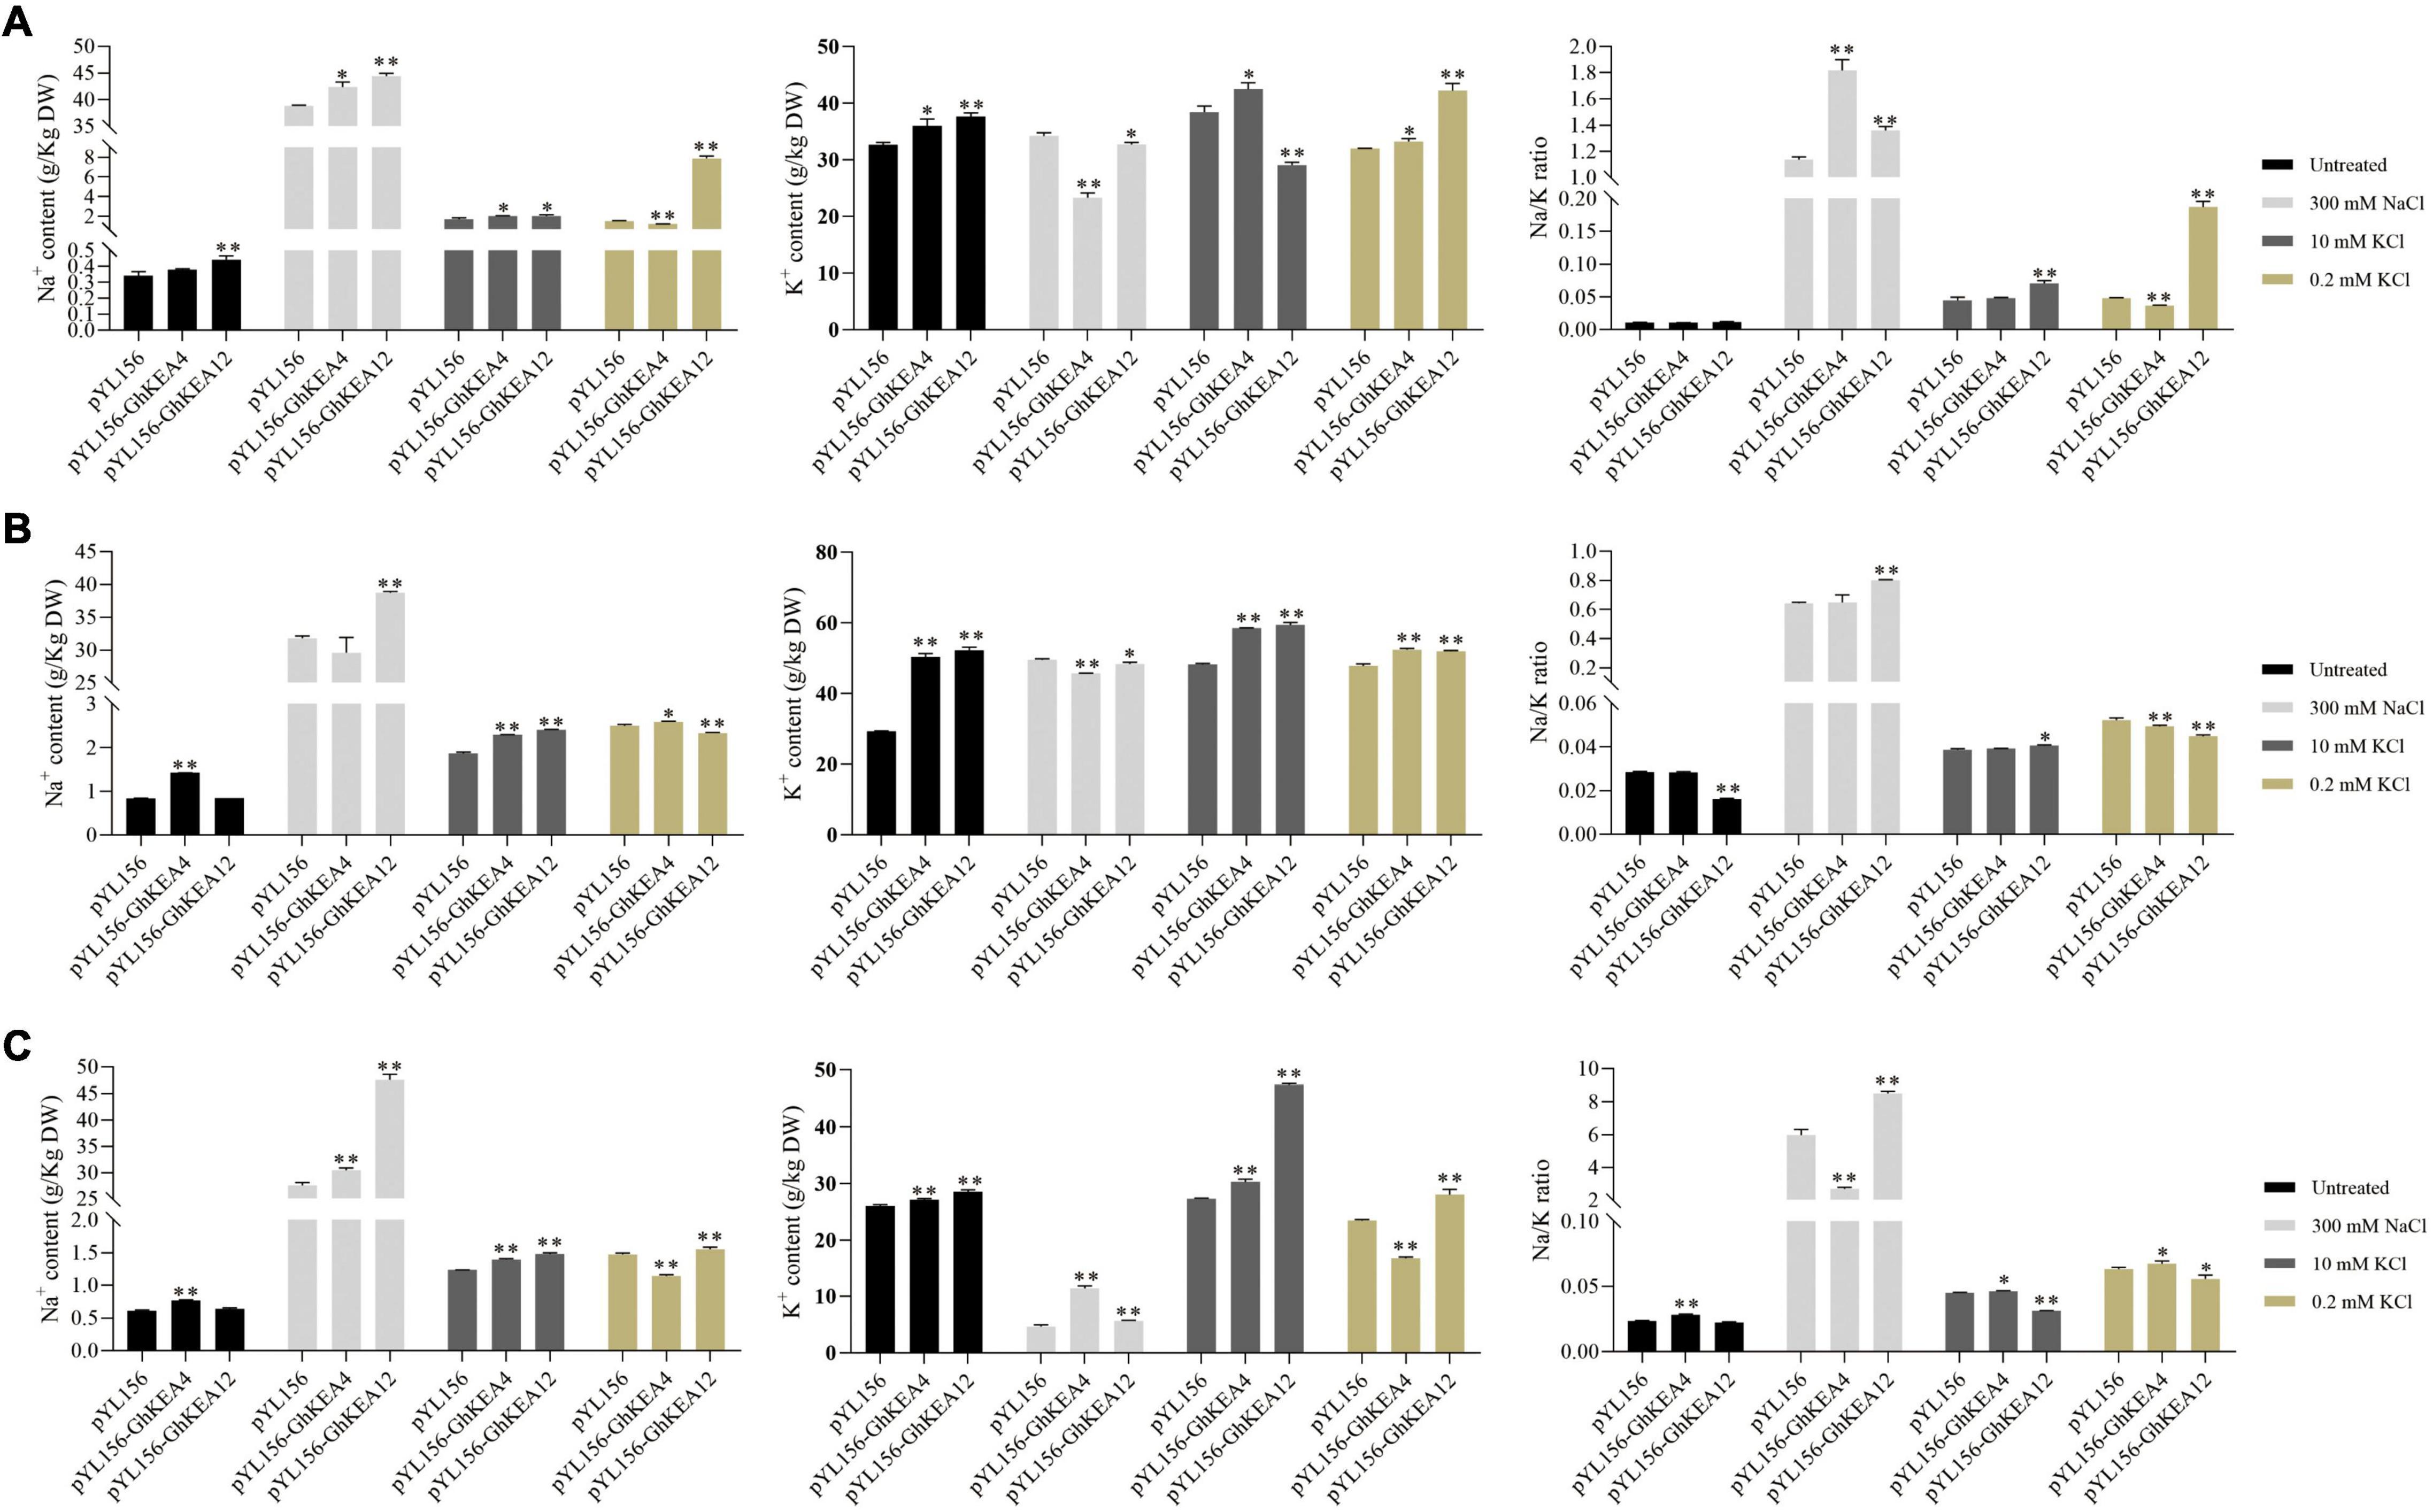
Figure 11. Changes in Na+, K+ content and Na+/K+ ratio in plants injected with empty vector and in plants silenced for GhKEA4 and silenced for GhKEA12 under high salt, high and low potassium stress. (A) Leaf. (B) Stem. (C) Root. Error bars indicate SD (**p < 0.01, 0.01 < *p < 0.05, n = 3).
Under salt stress, after silencing the GhKEA4 gene in cotton plants, the Na+ content in leaves and roots was significantly higher than that in unloaded control plants, the K+ content was significantly decreased in leaves and stems and significantly increased in roots, and the Na+/K+ ratio was significantly increased in leaves and significantly decreased in roots (Figure 11), indicating that silencing the GhKEA4 gene decreased the potassium ion transport activity from the lower ground to the shoot of plants under salt stress, resulting in a higher Na+/K+ ratio in leaves. After silencing GhKEA12, the Na+ content in the plants was extremely significantly increased, the K+ content was extremely significantly increased in the roots, significantly decreased in the leaves and stems, and the Na+/K+ ratio in the plants was extremely significantly increased (Figure 11), indicating that the potassium transport activity was decreased and the sodium transport activity was increased in the plants silenced GhKEA12, resulting in the plants with a higher Na+/K+ ratio.
Under high potassium treatment, the contents of Na+ and K+ in plants silenced with GhKEA4 increased significantly, but their Na/K ratio did not change significantly (Figure 11), indicating that cotton silenced with GhKEA4 could still maintain a more stable Na+ and K+ balance. Additionally, Na+/K+ ratio was significantly increased in leaves and stems and significantly decreased in roots in GhKEA12-silenced plants, indicating that potassium ion transport activity from roots to leaves was reduced in plants with GhKEA12 gene silencing.
Under low potassium stress, the Na+ content in leaves and roots of plants silenced for the GhKEA4 was extremely significantly decreased and significantly increased in stems. K+ content was significantly increased in leaves and stems and extremely significantly decreased in roots. Na+/K+ ratio was extremely significantly decreased in leaves and stems and significantly increased in roots (Figure 11), indicating that silencing of GhKEA4 gene increased the activity of plants to transport potassium to shoots under low potassium conditions; K+ content in plants silenced with GhKEA12 was extremely significantly increased, the Na+ content in leaves and roots was extremely significantly increased in stems, Na+/K+ was extremely significantly increased in leaves, and significantly decreased in stems and roots, indicating that silencing with GhKEA12 gene improved the ability of plants to absorb potassium, but accumulated more Na+ in leaves, resulting in higher Na+/K+ in leaves.
Discussion
The AtKEAs are homologous to EcKefB and EcKefC of Escherichia coli (Chanroj et al., 2012). When EcKefB/EcKefC binds to its helper proteins EcKefF and glutathione, the conformation of the KTN domain changes, which turns on the potassium ion transport switch of EcKefB/EcKefC (Miller et al., 2000; Roosild et al., 2002, 2009, 2010). Some studies have shown that the expressions of AtKEA1, AtKEA3, and AtKEA4 were enhanced under low potassium stress, and the expressions of AtKEA2 and AtKEA5 were enhanced under sorbitol and abscisic acid treatment (Aranda-Sicilia et al., 2012; Kunz et al., 2014; Zhu et al., 2018). The CPA family in some plants has been identified and verified (Maser et al., 2001; Chanroj et al., 2012; Ye et al., 2013; Zhou et al., 2016; Sharma et al., 2020), but there are few studies to identify the CPA family in cotton, especially the KEA family, which is a subfamily of the CPA family. In the current study, we identified the members of the KEA family in cotton by sequence similarity, and then carried out a comprehensive bioinformatics analysis of the KEA gene in cotton. The comprehensive analysis of the characteristics of the cotton KEA gene family will provide a basis for further research.
Evolution and Characterization of the K+ Efflux Antiporter Gene Family in Cotton Species
Genome-wide doubling events occurring in the process of plant evolution have had a lasting and far-reaching impact on plants, and some plants have even experienced whole-genome doubling events repeatedly (Tuskan et al., 2006). Approximately 130 million years ago, the common ancestor of dicotyledons experienced a genome-wide triploid event (Jaillon et al., 2007). Then, cotton independently experienced a genome-wide pentaploid event (Paterson et al., 2012; Wang et al., 2016). Allotetraploid upland cotton enlarged the number of genes after multiple replication events. In this study, 8, 8, 15, and 16 KEA genes were identified in G. raimondii, G. arboreum, G. hirsutum, and G. barbadense, respectively. The number of KEA genes in tetraploid cotton is approximately the sum of KEA genes in G. arboreum and G. raimondii. The unbalanced distribution of KEA genes on each chromosome number proved the existence of genetic variation in the process of evolution (Paterson et al., 2012; Zhu and Li, 2013; Yu et al., 2014). Based on the classification of the KEA gene family in Arabidopsis (Maser et al., 2001), all putative KEA genes in this study can be divided into three subfamilies. The lineal homologous genes of monocotyledons tend to form lineal homologous gene pairs at the end of the branches of phylogenetic trees, while the KEA genes of dicotyledons tend to be clustered together, possibly due to the different functions of KEA proteins in monocotyledons and dicotyledons (Li et al., 2016). Furthermore, the gene members of each subfamily not only have similar gene structure, sequence length and motif structure, but also have the same results of subcellular location prediction. These results suggested that the members of the KEA gene family may show relatively conservative functions in the growth of upland cotton, especially those of the same subfamily (Palusa et al., 2007). The similarities and differences in the gene structure, domain and motif of GhKEAs may be related to the long evolutionary history and gene replication of cotton (He and Zhang, 2005). In the process of gene family evolution, tandem replication and segmented replication contributed to the emergence of gene families to a certain extent. We found that GhKEAs could be amplified only by segmental replication, indicating that segmental replication played a key role in the evolution of the GhKEA gene family. Collinear analysis showed that most of the KEA homologous gene pairs between the At and Dt subgenomes of G. hirsutum and their corresponding A and D diploid genomes were located in the collinear region. Based on these results, we speculated that whole genome replication was the main driving force for the expansion of the KEA gene from diploid to allotetraploid.
GhKEAs May Play an Important Role in Facilitating K+ Homeostasis
Maintaining the homeostasis of intracellular ions is not only the basic cellular activity needed for plant growth, but also the basis for regulating plant growth and development and coping with environmental stress (Yang et al., 2019). Previous studies have shown that AtKEA1, -3, and -4 are induced by low potassium stress (Zheng et al., 2013) and that the AtKEA gene family plays a key role in K+ homeostasis and osmoregulation (Zheng et al., 2013; Kunz et al., 2014; Zhu et al., 2018). In this report, the expression characteristics of GhKEAs under low potassium stress were characterized for the first time, and most of the GhKEAs were induced by low potassium stress. For example, GhKEA12, as an ortholog of AtKEA4, showed significant changes in its expression levels under low potassium stress. Many studies have demonstrated that the KEA family with Na+/H+ exchanger domains and NAD-binding (KTN) domains participates in the absorption and transport of potassium ions (Qiu et al., 2003; Bölter et al., 2020). Therefore, to preliminarily explore the involvement of GhKEAs in K+ transport, the contents of K+ and Na+ in the leaves of silenced GhKEA4 cotton plants and silenced GhKEA12 cotton plants were examined. In addition, silencing GhKEA4 and GhKEA12 decreased the activity of transporting potassium ions in leaves under high salt condition, resulting in higher Na/K ratio in leaves. Silencing GhKEA12 inhibited K+ transport activity and increased Na+ content in cotton leaves under high potassium stress. Silencing GhKEA12 increased K+ transport activity and Na+ absorption capacity under low potassium stress. However, the effect of silencing GhKEA4 gene on K+ transport activity in plant leaves was very low under high and low potassium stresses. GhKEA4 is an ortholog of AtKEA2, and it has been shown that AtKEA2 is involved in K+ homeostasis in chloroplasts or plastids (Aranda-Sicilia et al., 2012), which is consistent with our results. Alternatively, it has also been shown that AtKEA2 has an important function in maintaining local osmotic pressure, ionic and pH homeostasis, and the formation of thylakoid membranes (Kunz et al., 2014; Ali, 2016; Aranda-Sicilia et al., 2016). While GhKEA12 is an ortholog of AtKEA6, AtKEA6 likewise plays a role in maintaining ion homeostasis (Zhu et al., 2018), as indicated by the K+ uptake system (Tsujii et al., 2019). Overall, our results demonstrated that the GhKEAs were involved in regulating the dynamic balance of intracellular K+ during the growth and development of cotton.
It has been shown that AKT1 is involved in K+ uptake in the micromolar concentration range (Spalding et al., 1999); HKT1 and KUP7 have an important role in regulating K homeostasis in plants (Han et al., 2016; Wang et al., 2018); and Na+ and H+ exchange rates are significantly increased in vacuoles of plants overexpressing the AtNHX1 gene (Apse et al., 1999). We found significant changes in the expression levels of these genes in cotton silenced for GhKEA4 or GhKEA12 genes. These results suggest that there may be a “genetic compensation” mechanism for potassium ion absorption and transport in cotton.
GhKEAs Regulate Cotton Response to Salt Stress
We analyzed the cis-acting elements in the promoter region of the upland cotton KEA gene family and found a variety of stress-responsive cis-acting elements such as TC-rich repeats and MBS. Studies have shown that ABA and MeJA played an important role in regulating plant stress responses (Reyes and Chua, 2007; Tavallali and Karimi, 2019). ABA response elements (ABREs) and MeJA response elements (TGACG-elements and CGTCA-motifs) were obtained in the cis-acting elements of the GhKEA gene family. Moreover, qRT-PCR results showed that the GhKEA gene family responded positively to stress in the early or late stages of salt and drought treatments. When plants are subjected to salt stress, a large number of reactive oxygen species accumulate, leading to lipid peroxidation and interfering with the normal physiological process (Jithesh et al., 2006). POD and CAT are important antioxidant enzymes for scavenging reactive oxygen species in plants (Harb et al., 2010). At the same time, proline and soluble sugar, as important substances regulating plant cell osmotic potential, promote the scavenging of intracellular reactive oxygen species to some extent (Ullah et al., 2018). In this study, GhKEA4 and GhKEA12, which were sensitive to salt treatment, were selected for VIGS experiments. The results showed that the water loss rate of detached leaves, the contents of proline and soluble sugar, and the activities of POD and CAT in VIGS plants were lower than those in the blank control to varying degrees. AtKEA2 and AtKEA6, paralogs of GhKEA4 and GhKEA12, have been reported to confer tolerance to high Na+ stress in Arabidopsis (Aranda-Sicilia et al., 2012; Wang Y. et al., 2019). It has been reported that salt stress-induced production of ROS can promote K+ entry into the cytoplasm, thereby reducing the Na+/K+ ratio (Ma et al., 2012). We speculated that excessive accumulation of ROS in plants under salt stress may further promote GhKEAs to transport K+, reduce the Na+/K+ ratio, and then promote the accumulation of osmoregulatory substances to improve tolerance to abiotic stress, and the conclusion needs further verification.
Conclusion
Under salt stress, plants accumulate a large amount of Na+ and inhibit the absorption of K+, resulting in an imbalance in the ion dynamic balance. Ion transporters can maintain ion homeostasis in plant inner membrane systems. In the present study, K+ efflux transporters were identified in Gossypium spp. Then, the distribution, sequence structure and expression pattern of the KEA gene family in cotton were analyzed in detail at the whole genome level, as well as its potential function in cotton growth and development and response to abiotic stress. In addition, VIGS experiments were used to be verified that the GhKEAs could maintain a relatively stable Na/K ratio in upland cotton under high salt, high potassium and low potassium stresses, as well as play an important function in salt stress. The comprehensive analysis of KEA genes in this study lays a foundation for future functional research on cotton KEA genes.
Data Availability Statement
Publicly available datasets were analyzed in this study. This data can be found at the National Center for Biotechnology Information Search database (https://www.ncbi.nlm.nih.gov/) under accession numbers PRJNA382310, PRJNA171262, PRJNA433615, PRJNA10719, PRJNA448171, PRJNA374837, ACUP00000000, and PRJNA248163.
Author Contributions
YL: conceptualization, methodology, data curation, software, original draft, and writing – review and editing. ZF: methodology and software. HWe, SC, and PH: methodology. HWa: conceptualization, supervision, and writing – review and editing. SY: conceptualization and supervision. All authors contributed to the article and approved the submitted version.
Funding
This work was supported by the National Natural Science Foundation of China (32072112), the Agricultural Science and Technology Innovation Program of Chinese Academy of Agricultural Sciences and the China Agriculture Research System (CARS-15-06).
Conflict of Interest
The authors declare that the research was conducted in the absence of any commercial or financial relationships that could be construed as a potential conflict of interest.
Publisher’s Note
All claims expressed in this article are solely those of the authors and do not necessarily represent those of their affiliated organizations, or those of the publisher, the editors and the reviewers. Any product that may be evaluated in this article, or claim that may be made by its manufacturer, is not guaranteed or endorsed by the publisher.
Footnotes
- ^ https://www.cottongen.org/
- ^ https://phytozome-next.jgi.doe.gov/
- ^ https://www.ncbi.nlm.nih.gov/Structure/bwrpsb/bwrpsb.cgi
- ^ http://smart.embl-heidelberg.de/
- ^ https://web.expasy.org/protparam/
- ^ http://linux1.softberry.com/berry.phtml?topic=protcomppl&group=programs&subgroup=proloc
- ^ http://gsds.gao-lab.org/
- ^ http://bioinformatics.psb.ugent.be/webtools/plantcare/html/
References
Ali, M. A. (2016). A study of the role of KEA1 and KEA2 K+/H+ antiporters in chloroplast development and division in arabidopsis thaliana. dissertation/master’s thesis. Granada: Universidad de Granada.
Apse, M. P., Aharon, G. S., Snedden, W. A., and Blumwald, E. (1999). Salt tolerance conferred by overexpression of a vacuolar Na+/H+ antiport in Arabidopsis. Science 285, 1256–1258. doi: 10.1126/science.285.5431.1256
Aranda-Sicilia, M. N., Aboukila, A., Armbruster, U., Cagnac, O., Schumann, T., Kunz, H. H., et al. (2016). Envelope K+/H+ antiporters AtKEA1 and AtKEA2 function in plastid development. Plant Physiol. 172, 441–449. doi: 10.1104/pp.16.00995
Aranda-Sicilia, M. N., Cagnac, O., Chanroj, S., Sze, H., Rodriguez-Rosales, M. P., and Venema, K. (2012). Arabidopsis KEA2, a homolog of bacterial KefC, encodes a K+/H+ antiporter with a chloroplast transit peptide. Biochim. Biophys. Acta 1818, 2362–2371. doi: 10.1016/j.bbamem.2012.04.011
Artimo, P., Jonnalagedda, M., Arnold, K., Baratin, D., Csardi, G., De Castro, E., et al. (2012). ExPASy: SIB bioinformatics resource portal. Nucleic Acids Res. 40, W597–W603. doi: 10.1093/nar/gks400
Bailey, T. L., Williams, N., Misleh, C., and Li, W. W. (2006). MEME: discovering and analyzing DNA and protein sequence motifs. Nucleic Acids Res. 34, W369–W373. doi: 10.1093/nar/gkl198
Bölter, B., Mitterreiter, M. J., Schwenkert, S., Finkemeier, I., and Kunz, H.-H. (2020). The topology of plastid inner envelope potassium cation efflux antiporter KEA1 provides new insights into its regulatory features. Photosynth Res. 145, 43–54. doi: 10.1007/s11120-019-00700-2
Booth, I. R. (2003). Bacterial ion channels. Genet Eng. 25, 91–111. doi: 10.1007/978-1-4615-0073-5_5
Britto, D. T., and Kronzucker, H. J. (2008). Cellular mechanisms of potassium transport in plants. Physiol. Plant. 133, 637–650. doi: 10.1111/j.1399-3054.2008.01067.x
Cannon, S. B., Mitra, A., Baumgarten, A., Young, N. D., and May, G. (2004). The roles of segmental and tandem gene duplication in the evolution of large gene families in Arabidopsis thaliana. BMC Plant Biol. 4:10. doi: 10.1186/1471-2229-4-10
Chanroj, S., Lu, Y., Padmanaban, S., Nanatani, K., Uozumi, N., Rao, R., et al. (2011). Plant-specific cation/H+ exchanger 17 and its homologs are endomembrane K+ transporters with roles in protein sorting. J. Biol. Chem. 286, 33931–33941. doi: 10.1074/jbc.M111.252650
Chanroj, S., Wang, G., Venema, K., Zhang, M. W., Delwiche, C. F., and Sze, H. (2012). Conserved and diversified gene families of monovalent cation/h+ antiporters from algae to flowering plants. Front. Plant Sci. 3:25. doi: 10.3389/fpls.2012.00025
Chen, C., Chen, H., Zhang, Y., Thomas, H. R., Frank, M. H., He, Y., et al. (2020). TBtools: An integrative toolkit developed for interactive analyses of big biological data. Mol. Plant 13, 1194–1202. doi: 10.1016/j.molp.2020.06.009
Cuin, T. A., Miller, A. J., Laurie, S. A., and Leigh, R. A. (2003). Potassium activities in cell compartments of salt-grown barley leaves. J. Exp. Bot. 54, 657–661. doi: 10.1093/jxb/erg072
Diaz-Gomez, J. L., Ortiz-Martinez, M., Aguilar, O., Garcia-Lara, S., and Castorena-Torres, F. (2018). Antioxidant activity of zein hydrolysates from zea species and their cytotoxic effects in a hepatic Cell Culture. Molecules 23:2. doi: 10.3390/molecules23020312
Du, X., Huang, G., He, S., Yang, Z., Sun, G., Ma, X., et al. (2018). Resequencing of 243 diploid cotton accessions based on an updated A genome identifies the genetic basis of key agronomic traits. Nat. Genet. 50, 796–802. doi: 10.1038/s41588-018-0116-x
Fan, K., Mao, Z., Zheng, J., Chen, Y., Li, Z., Lin, W., et al. (2020). Molecular evolution and expansion of the KUP family in the allopolyploid cotton species Gossypium hirsutum and Gossypium barbadense. Front. Plant Sci. 11:545042. doi: 10.3389/fpls.2020.545042
Fu, X., Lu, Z., Wei, H., Zhang, J., Yang, X., Wu, A., et al. (2020). Genome-wide identification and expression analysis of the NHX (sodium/hydrogen antiporter) gene family in cotton. Front. Genet. 11:964. doi: 10.3389/fgene.2020.00964
Fujisawa, M., Ito, M., and Krulwich, T. A. (2007). Three two-component transporters with channel-like properties have monovalent cation/proton antiport activity. Proc. Natl. Acad. Sci. U S A 104, 13289–13294. doi: 10.1073/pnas.0703709104
Gao, W., Long, L., Xu, L., Lindsey, K., Zhang, X., and Zhu, L. (2016). Suppression of the homeobox gene HDTF1 enhances resistance to Verticillium dahliae and Botrytis cinerea in cotton. J. Integr. Plant Biol. 58, 503–513. doi: 10.1111/jipb.12432
Gierth, M., and Maser, P. (2007). Potassium transporters in plants - Involvement in K+ acquisition, redistribution and homeostasis. Febs Lett. 581, 2348–2356. doi: 10.1016/j.febslet.2007.03.035
Han, M., Wu, W., Wu, W. H., and Wang, Y. (2016). Potassium transporter KUP7 is involved in K+ acquisition and translocation in Arabidopsis root under K+-limited conditions. Mol. Plant 9, 437–446. doi: 10.1016/j.molp.2016.01.012
Harb, A., Krishnan, A., Ambavaram, M. M., and Pereira, A. (2010). Molecular and physiological analysis of drought stress in Arabidopsis reveals early responses leading to acclimation in plant growth. Plant Physiol. 154, 1254–1271. doi: 10.1104/pp.110.161752
Hauser, F., and Horie, T. (2010). A conserved primary salt tolerance mechanism mediated by HKT transporters: a mechanism for sodium exclusion and maintenance of high K+/Na+ ratio in leaves during salinity stress. Plant Cell Environ. 33, 552–565. doi: 10.1111/j.1365-3040.2009.02056.x
He, X., and Zhang, J. (2005). Rapid subfunctionalization accompanied by prolonged and substantial neofunctionalization in duplicate gene evolution. Genetics 169, 1157–1164. doi: 10.1534/genetics.104.037051
Hu, B., Jin, J., Guo, A. Y., Zhang, H., Luo, J., and Gao, G. (2015). GSDS 2.0: an upgraded gene feature visualization server. Bioinformatics 31, 1296–1297. doi: 10.1093/bioinformatics/btu817
Jaillon, O., Aury, J. M., Noel, B., Policriti, A., Clepet, C., Casagrande, A., et al. (2007). The grapevine genome sequence suggests ancestral hexaploidization in major angiosperm phyla. Nature 449, 463–467. doi: 10.1038/nature06148
Jithesh, M. N., Prashanth, S. R., Sivaprakash, K. R., and Parida, A. (2006). Monitoring expression profiles of antioxidant genes to salinity, iron, oxidative, light and hyperosmotic stresses in the highly salt tolerant grey mangrove, Avicennia marina (Forsk.) Vierh. by mRNA analysis. Plant Cell Rep. 25, 865–876. doi: 10.1007/s00299-006-0127-4
Krzywinski, M., Schein, J., Birol, I., Connors, J., Gascoyne, R., Horsman, D., et al. (2009). Circos: an information aesthetic for comparative genomics. Genome Res. 19, 1639–1645. doi: 10.1101/gr.092759.109
Kumar, S., Stecher, G., and Tamura, K. (2016). MEGA7: Molecular evolutionary genetics analysis version 7.0 for bigger datasets. Mol. Biol. Evol. 33, 1870–1874. doi: 10.1093/molbev/msw054
Kunz, H. H., Gierth, M., Herdean, A., Satoh-Cruz, M., Kramer, D. M., Spetea, C., et al. (2014). Plastidial transporters KEA1, -2, and -3 are essential for chloroplast osmoregulation, integrity, and pH regulation in Arabidopsis. Proc. Natl. Acad. Sci. U S A 111, 7480–7485. doi: 10.1073/pnas.1323899111
Larkin, M. A., Blackshields, G., Brown, N. P., Chenna, R., Mcgettigan, P. A., Mcwilliam, H., et al. (2007). Clustal W and Clustal X version 2.0. Bioinformatics 23, 2947–2948. doi: 10.1093/bioinformatics/btm404
Lescot, M., Dehais, P., Thijs, G., Marchal, K., Moreau, Y., Van De Peer, Y., et al. (2002). PlantCARE, a database of plant cis-acting regulatory elements and a portal to tools for in silico analysis of promoter sequences. Nucleic Acids Res. 30, 325–327. doi: 10.1093/nar/30.1.325
Letunic, I., Doerks, T., and Bork, P. (2015). SMART: recent updates, new developments and status in 2015. Nucleic Acids Res. 43, D257–D260. doi: 10.1093/nar/gku949
Li, W., Shang, H., Ge, Q., Zou, C., Cai, J., Wang, D., et al. (2016). Genome-wide identification, phylogeny, and expression analysis of pectin methylesterases reveal their major role in cotton fiber development. BMC Genomics 17:1000. doi: 10.1186/s12864-016-3365-z
Liu, J., Guo, W. Q., and Shi, D. C. (2010). Seed germination, seedling survival, and physiological response of sunflowers under saline and alkaline conditions. Photosynthetica 48, 278–286. doi: 10.1007/s11099-010-0034-3
Liu, Z., Ge, X., Yang, Z., Zhang, C., Zhao, G., Chen, E., et al. (2017). Genome-wide identification and characterization of SnRK2 gene family in cotton (Gossypium hirsutum L.). BMC Genet. 18:54. doi: 10.1186/s12863-017-0517-3
Livak, K. J., and Schmittgen, T. D. (2001). Analysis of relative gene expression data using real-time quantitative PCR and the 2–ΔΔCT Method. Methods 25, 402–408. doi: 10.1006/meth.2001.1262
Ma, L., Zhang, H., Sun, L., Jiao, Y., Zhang, G., Miao, C., et al. (2012). NADPH oxidase AtrbohD and AtrbohF function in ROS-dependent regulation of Na+/K+ homeostasis in Arabidopsis under salt stress. J. Exp. Bot. 63, 305–317. doi: 10.1093/jxb/err280
Mantyla, E., Lang, V., and Palva, E. T. (1995). Role of abscisic-acid in drought-induced freezing tolerance, cold-acclimation, and accumulation of Lt178 and Rab18 proteins in Arabidopsis-thaliana. Plant Physiol. 107, 141–148. doi: 10.1104/pp.107.1.141
Maser, P., Thomine, S., Schroeder, J. I., Ward, J. M., Hirschi, K., Sze, H., et al. (2001). Phylogenetic relationships within cation transporter families of Arabidopsis. Plant Physiol. 126, 1646–1667. doi: 10.1104/pp.126.4.1646
Mayer, K. F. X., Rogers, J., Dolezel, J., Pozniak, C., Eversole, K., Feuillet, C., et al. (2014). A chromosome-based draft sequence of the hexaploid bread wheat (Triticum aestivum) genome. Science 345:6194. doi: 10.1126/science.1251788
Miller, S., Ness, L. S., Wood, C. M., Fox, B. C., and Booth, I. R. (2000). Identification of an ancillary protein, YabF, required for activity of the KefC glutathione-gated potassium efflux system in Escherichia coli. J. Bacteriol. 182, 6536–6540. doi: 10.1128/jb.182.22.6536-6540.2000
Munns, R. (2002). Comparative physiology of salt and water stress. Plant Cell Environ. 25, 239–250. doi: 10.1046/j.0016-8025.2001.00808.x
Munns, R., and Tester, M. (2008). Mechanisms of salinity tolerance. Annu. Rev. Plant Biol. 59, 651–681. doi: 10.1146/annurev.arplant.59.032607.092911
Palusa, S. G., Golovkin, M., Shin, S. B., Richardson, D. N., and Reddy, A. S. (2007). Organ-specific, developmental, hormonal and stress regulation of expression of putative pectate lyase genes in Arabidopsis. New Phytol. 174, 537–550. doi: 10.1111/j.1469-8137.2007.02033.x
Paterson, A. H., Wendel, J. F., Gundlach, H., Guo, H., Jenkins, J., Jin, D., et al. (2012). Repeated polyploidization of Gossypium genomes and the evolution of spinnable cotton fibres. Nature 492, 423–427. doi: 10.1038/nature11798
Pichersky, E., and Gershenzon, J. (2002). The formation and function of plant volatiles: perfumes for pollinator attraction and defense. Curr. Opin. Plant Biol. 5, 237–243. doi: 10.1016/S1369-5266(02)00251-0
Qiu, Q. S., Barkla, B. J., Vera-Estrella, R., Zhu, J. K., and Schumaker, K. S. (2003). Na+/H+ exchange activity in the plasma membrane of Arabidopsis. Plant Physiol. 132, 1041–1052. doi: 10.1104/pp.102.010421
Reyes, J. L., and Chua, N. H. (2007). ABA induction of miR159 controls transcript levels of two MYB factors during Arabidopsis seed germination. Plant J. 49, 592–606. doi: 10.1111/j.1365-313X.2006.02980.x
Roosild, T. P., Castronovo, S., Healy, J., Miller, S., Pliotas, C., Rasmussen, T., et al. (2010). Mechanism of ligand-gated potassium efflux in bacterial pathogens. Proc. Natl. Acad. Sci. USA 107, 19784–19789. doi: 10.1073/pnas.1012716107
Roosild, T. P., Castronovo, S., Miller, S., Li, C., Rasmussen, T., Bartlett, W., et al. (2009). KTN (RCK) domains regulate K+ channels and transporters by controlling the dimer-hinge conformation. Structure 17, 893–903. doi: 10.1016/j.str.2009.03.018
Roosild, T. P., Miller, S., Booth, I. R., and Choe, S. (2002). A mechanism of regulating transmembrane potassium flux through a ligand-mediated conformational switch. Cell 109, 781–791. doi: 10.1016/s0092-8674(02)00768-7
Schnable, P. S., Ware, D., Fulton, R. S., Stein, J. C., Wei, F., Pasternak, S., et al. (2009). The B73 maize genome: complexity, diversity, and dynamics. Science 326, 1112–1115. doi: 10.1126/science.1178534
Sharif, I., Aleem, S., Farooq, J., Rizwan, M., Younas, A., Sarwar, G., et al. (2019). Salinity stress in cotton: effects, mechanism of tolerance and its management strategies. Physiol. Mol. Biol. Plants 25, 807–820. doi: 10.1007/s12298-019-00676-2
Sharma, H., Taneja, M., and Upadhyay, S. K. (2020). Identification, characterization and expression profiling of cation-proton antiporter superfamily in Triticum aestivum L. and functional analysis of TaNHX4-B. Genomics 112, 356–370. doi: 10.1016/j.ygeno.2019.02.015
Sheng, P., Tan, J., Jin, M., Wu, F., Zhou, K., Ma, W., et al. (2014). Albino midrib 1, encoding a putative potassium efflux antiporter, affects chloroplast development and drought tolerance in rice. Plant Cell Rep. 33, 1581–1594. doi: 10.1007/s00299-014-1639-y
Spalding, E. P., Hirsch, R. E., Lewis, D. R., Qi, Z., Sussman, M. R., and Lewis, B. D. (1999). Potassium uptake supporting plant growth in the absence of AKT1 channel activity: Inhibition by ammonium and stimulation by sodium. J. Gen. Physiol. 113, 909–918. doi: 10.1085/jgp.113.6.909
Sun, X. L., Ji, W., Ding, X. D., Bai, X., Cai, H., Yang, S. S., et al. (2013). GsVAMP72, a novel Glycine soja R-SNARE protein, is involved in regulating plant salt tolerance and ABA sensitivity. Plant Cell Tiss. Org. 113, 199–215. doi: 10.1007/s11240-012-0260-4
Sze, H., and Chanroj, S. (2018). Plant endomembrane dynamics: studies of K+/H+ antiporters provide insights on the effects of pH and ion homeostasis. Plant Physiol. 177, 875–895. doi: 10.1104/pp.18.00142
Tavallali, V., and Karimi, S. (2019). Methyl jasmonate enhances salt tolerance of almond rootstocks by regulating endogenous phytohormones, antioxidant activity and gas-exchange. J. Plant Physiol. 234-235, 98–105. doi: 10.1016/j.jplph.2019.02.001
Tsujii, M., Kera, K., Hamamoto, S., Kuromori, T., Shikanai, T., and Uozumi, N. (2019). Evidence for potassium transport activity of Arabidopsis KEA1-KEA6. Sci. Rep. 9:10040. doi: 10.1038/s41598-019-46463-7
Tuskan, G. A., Difazio, S., Jansson, S., Bohlmann, J., Grigoriev, I., Hellsten, U., et al. (2006). The genome of black cottonwood, Populus trichocarpa (Torr. & Gray). Science 313, 1596–1604. doi: 10.1126/science.1128691
Ullah, A., Sun, H., Hakim, Yang, X., and Zhang, X. (2018). A novel cotton WRKY gene, GhWRKY6-like, improves salt tolerance by activating the ABA signaling pathway and scavenging of reactive oxygen species. Physiol. Plant 162, 439–454. doi: 10.1111/ppl.12651
Voorrips, R. E. (2002). MapChart: Software for the graphical presentation of linkage maps and QTLs. J. Hered. 93, 77–78. doi: 10.1093/jhered/93.1.77
Wang, D., Zhang, Y., Zhang, Z., Zhu, J., and Yu, J. (2010). KaKs_Calculator 2.0: a toolkit incorporating gamma-series methods and sliding window strategies. GPB 8, 77–80. doi: 10.1016/S1672-0229(10)60008-3
Wang, L., Liu, Y., Feng, S., Wang, Z., Zhang, J., Zhang, J., et al. (2018). AtHKT1 gene regulating K+ state in whole plant improves salt tolerance in transgenic tobacco plants. Sci. Rep. 8:16585. doi: 10.1038/s41598-018-34660-9
Wang, M., Tu, L., Yuan, D., Zhu, Shen, C., Li, J., et al. (2019). Reference genome sequences of two cultivated allotetraploid cottons, Gossypium hirsutum and Gossypium barbadense. Nat. Genet. 51, 224–229. doi: 10.1038/s41588-018-0282-x
Wang, X., Guo, H., Wang, J., Lei, T., Liu, T., Wang, Z., et al. (2016). Comparative genomic de-convolution of the cotton genome revealed a decaploid ancestor and widespread chromosomal fractionation. New Phytol. 209, 1252–1263. doi: 10.1111/nph.13689
Wang, Y., Tang, H., Debarry, J. D., Tan, X., Li, J., Wang, X., et al. (2012). MCScanX: a toolkit for detection and evolutionary analysis of gene synteny and collinearity. Nucleic Acids Res. 40:e49. doi: 10.1093/nar/gkr1293
Wang, Y., Tang, R. J., Yang, X., Zheng, X., Shao, Q., Tang, Q. L., et al. (2019). Golgi-localized cation/proton exchangers regulate ionic homeostasis and skotomorphogenesis in Arabidopsis. Plant Cell Environ. 42, 673–687. doi: 10.1111/pce.13452
Xu, G., Guo, C., Shan, H., and Kong, H. (2012). Divergence of duplicate genes in exon-intron structure. Proc. Natl. Acad. Sci. U S A 109, 1187–1192. doi: 10.1073/pnas.1109047109
Yang, X., Zhang, J., Wu, A., Wei, H., Fu, X., Tian, M., et al. (2021). Corrigendum: Genome-wide identification and expression pattern analysis of the HAK/KUP/KT gene family of cotton in fiber development and under stresses. Front. Genet. 12:632854. doi: 10.3389/fgene.2021.632854
Yang, Y., Wu, Y., Ma, L., Yang, Z., Dong, Q., Li, Q., et al. (2019). The Ca2+ sensor SCaBP3/CBL7 modulates plasma membrane H+-ATPase activity and promotes alkali tolerance in Arabidopsis. Plant Cell 31, 1367–1384. doi: 10.1105/tpc.18.00568
Ye, C. Y., Yang, X., Xia, X., and Yin, W. (2013). Comparative analysis of cation/proton antiporter superfamily in plants. Gene 521, 245–251. doi: 10.1016/j.gene.2013.03.104
Yu, J., Jung, S., Cheng, C. H., Ficklin, S. P., Lee, T., Zheng, P., et al. (2014). CottonGen: a genomics, genetics and breeding database for cotton research. Nucleic Acids Res. 42, D1229–D1236. doi: 10.1093/nar/gkt1064
Zhang, T., Hu, Y., Jiang, W., Fang, L., Guan, X., Chen, J., et al. (2015). Sequencing of allotetraploid cotton (Gossypium hirsutum L. acc. TM-1) provides a resource for fiber improvement. Nat. Biotechnol. 33, 531–537. doi: 10.1038/nbt.3207
Zheng, S., Pan, T., Fan, L., and Qiu, Q. S. (2013). A novel AtKEA gene family, homolog of bacterial K+/H+ antiporters, plays potential roles in K+ homeostasis and osmotic adjustment in Arabidopsis. PLoS One 8:e81463. doi: 10.1371/journal.pone.0081463
Zhou, H., Qi, K., Liu, X., Yin, H., Wang, P., Chen, J., et al. (2016). Genome-wide identification and comparative analysis of the cation proton antiporters family in pear and four other Rosaceae species. Mol. Genet. Genomics 291, 1727–1742. doi: 10.1007/s00438-016-1215-y
Zhu, X., Pan, T., Zhang, X., Fan, L., Quintero, F. J., Zhao, H., et al. (2018). K+ efflux antiporters 4, 5, and 6 mediate pH and K+ homeostasis in endomembrane compartments. Plant Physiol. 178, 1657–1678. doi: 10.1104/pp.18.01053
Keywords: upland cotton, K+ efflux antiporter (KEA), salt and potassium stresses, virus-induced gene silencing, K+ transport
Citation: Li Y, Feng Z, Wei H, Cheng S, Hao P, Yu S and Wang H (2021) Silencing of GhKEA4 and GhKEA12 Revealed Their Potential Functions Under Salt and Potassium Stresses in Upland Cotton. Front. Plant Sci. 12:789775. doi: 10.3389/fpls.2021.789775
Received: 05 October 2021; Accepted: 09 November 2021;
Published: 07 December 2021.
Edited by:
Wei Hu, Institute of Tropical Bioscience and Biotechnology, Chinese Academy of Tropical Agricultural Sciences, ChinaReviewed by:
Longbiao Guo, China National Rice Research Institute, Chinese Academy of Agricultural Sciences (CAAS), ChinaQuanwei Lu, Anyang Institute of Technology, China
Copyright © 2021 Li, Feng, Wei, Cheng, Hao, Yu and Wang. This is an open-access article distributed under the terms of the Creative Commons Attribution License (CC BY). The use, distribution or reproduction in other forums is permitted, provided the original author(s) and the copyright owner(s) are credited and that the original publication in this journal is cited, in accordance with accepted academic practice. No use, distribution or reproduction is permitted which does not comply with these terms.
*Correspondence: Shuxun Yu, eXN4MTk1MzExQDE2My5jb20=; Hantao Wang, dy53YW5naGFudGFvQDE2My5jb20=