 Lihua Wang1,2
 Yanlong Liu2Li Gao2Xiaocui Yang2Xu Zhang2Shaoping Xie2Meng Chen2Yi-Hong Wang3
 Jieqin Li2*Yixin Shen1*
- 1College of Agro-Grassland Science, Nanjing Agricultural University, Nanjing, China
- 2College of Agriculture, Anhui Science and Technology University, Fengyang, China
- 3Department of Biology, University of Louisiana at Lafayette, Lafayette, LA, United States
Genetic dissection of forage yield traits is critical to the development of sorghum as a forage crop. In the present study, association mapping was performed with 85,585 SNP markers on four forage yield traits, namely plant height (PH), tiller number (TN), stem diameter (SD), and fresh weight per plant (FW) among 245 sorghum accessions evaluated in four environments. A total of 338 SNPs or quantitative trait nucleotides (QTNs) were associated with the four traits, and 21 of these QTNs were detected in at least two environments, including four QTNs for PH, ten for TN, six for SD, and one for FW. To identify candidate genes, dynamic transcriptome expression profiling was performed at four stages of sorghum development. One hundred and six differentially expressed genes (DEGs) that were enriched in hormone signal transduction pathways were found in all stages. Weighted gene correlation network analysis for PH and SD indicated that eight modules were significantly correlated with PH and that three modules were significantly correlated with SD. The blue module had the highest positive correlation with PH and SD, and the turquoise module had the highest negative correlation with PH and SD. Eight candidate genes were identified through the integration of genome-wide association studies (GWAS) and RNA sequencing. Sobic.004G143900, an indole-3-glycerol phosphate synthase gene that is involved in indoleacetic acid biosynthesis, was down-regulated as sorghum plants grew in height and was identified in the blue module, and Sobic.003G375100, an SD candidate gene, encoded a DNA repair RAD52-like protein 1 that plays a critical role in DNA repair-linked cell cycle progression. These findings demonstrate that the integrative analysis of omics data is a promising approach to identify candidate genes for complex traits.
Introduction
Sorghum is an important grain and forage crop. It is widely cultivated worldwide because of its broad adaptability and tolerance to drought, waterlogging, and salinity (Rooney et al., 2007). In addition, cultivation of forage sorghum has recently increased to meet the demand of growing domestic animal production industries, especially in arid and semi-arid regions with perennial water shortages (Huang et al., 2020). Genetic dissection of sorghum yield traits will facilitate the development of sorghum as a high-yielding forage crop that can be used for animal production.
Improvement of forage yield has been a major objective of forage sorghum breeding. Since forage yield traits are usually controlled by many genes, genome-wide association studies (GWAS), which are useful for dissecting complex traits, have been used extensively to map forage yield-related traits in sorghum. The majority of these studies have been cataloged in the Sorghum QTL Atlas (Mace et al., 2019).1 In fact, as of September 7, 2021, the database included 61 quantitative trait loci (QTLs) for total dry biomass from eight studies, 67 QTLs for fresh biomass from 10 studies, 413 QTLs for plant height from 48 studies, 168 QTLs for tiller number from 18 studies, and 37 QTLs for stem diameter from six studies. In addition, Spindel et al. (2018) reported another 213 genomic regions that are associated with sorghum biomass and/or drought tolerance, and Habyarimana et al. (2020) reported 42 single-nucleotide polymorphisms (SNPs) associated with plant height, eight with dry mass fraction of fresh material, and 17 with dry biomass yield in sorghum. Kong et al. (2020) reported six QTLs that were related to basal stem diameter, six to middle stem diameter, and five to rachis diameter explained 28.9, 26.0, and 20.0% of phenotypic variation for the corresponding traits, respectively. Dos Santos et al. (2020) used 100,435 SNP markers to identify associations between sorghum plant height and dry forage yield and reported that early season plant height could be used to select for dry forage yield. Chen et al. (2020) identified a biomass yield 1 (by1) mutant that affected sorghum biomass and grain yield through primary and secondary metabolism regulation via the shikimate pathway.
RNA sequencing (RNA-Seq) can be used to characterize or identify genes, as well as to obtain precise measurements of transcript levels (Wang et al., 2009). It is also a valuable tool for dissecting gene regulation networks (Marguerat and Bähler, 2010) via identification of differentially expressed genes (DEGs). Studies also show that the combination of RNA-Seq and GWAS can be used to narrow down candidate genes at specific QTLs. For example, Yan et al. (2020) combined GWAS and RNA-Seq to identify five candidate genes underpinning ketosis in cattle, and Zhang et al. (2021) mapped 178 peanut seed composition-associated QTLs with GWAS and used RNA-Seq analysis to identify 282 QTL-associated DEGs, including 16 candidate genes for seed fatty acid metabolism and protein synthesis.
In this study, we carried out GWAS analysis for plant height (PH), tiller number (TN), stem diameter (SD), and fresh weight per plant (FW) for 245 sorghum accessions grown across four environments (two locations × 2 years). Dynamic transcriptome expression profiling was performed at four development stages to identify QTL-related DEGs. The results of this integrated approach will improve the current understanding of the genetic mechanisms underlying forage sorghum yield.
Materials and Methods
Plant Materials and Trait Measurement
The 245 sorghum accessions were used for forage quality characters as described previously (Li et al., 2018). The sorghum accessions were grown in four environments (2 locations × 2 years), i.e., Fengyang campus of Anhui Province (Fengyang, China, 32°52′N, 177°33′E) in 2015 and 2016, and Tengqiao town of Hainan Province (Tengqiao, China, 18°24′N, 109°45′E) in 2016 and 2017. All experiments were performed using a completely randomized block design with three replicates each. Sorghum cultivar Tx430 was used to perform RNA-seq. It was grown at Fengyang campus.
The four yield traits (PH, TN, SD, and FW) were measured when all accessions were at the heading stage. The middle stem of each plant was used to measure SD, and only aerial plant parts were used to determine FW.
DNA Extraction, Sequencing, and Single-Nucleotide Polymorphism Analysis
Total DNA was extracted using a DNAsecure Plant Kit (Cat. No. DP320, Qiagen, Hilden, N.W, Germany). Library construction, restriction site-associated DNA (RAD) sequencing, and SNP analysis were performed as described previously (Li et al., 2018).
Population Structure Analysis
Linkage disequilibrium (LD) analysis was performed using PopLDdecay, with a MaxDist of 1,000 kb. All SNPs were filtered for population structure (Q), and relative kinship analysis (K) was performed using Plink v1.07 (MAF < 0.05, r2 = 0.2; Purcell et al., 2007). Number of clusters in the population (k) was set from 1 to 10, with five independent runs (Pritchard et al., 2000).
Genome-Wide Association Study
GWAS was performed using TASSEL 5.2.70 (Bradbury et al., 2007), with a mixed linear model (MLM) to calculate associations and the incorporation of Q matrix/PCA and kinship data (K; Zhao et al., 2011). The MLM was applied using default settings (P3D for variance component analysis and compression set to the optimum level). For MLM (Q + K), the significance threshold for significantly associated markers was set to p ≤ 4.06 × 10⁻⁴ or [-log10 (p) = 3.39], as described previously (Li et al., 2018).
RNA-Seq and Data Analysis
Four weeks after planting, Tx430 leaves were sampled every 2 weeks until 10 weeks after planting, representing stages 1–4, respectively. The samples were flash-frozen in liquid nitrogen and stored at –80°C before RNA extraction. Each sample had three biological replicates. Total RNA was extracted using an RNAprep Pure Plant Kit (Tiangen, Beijing, China). Gel electrophoresis and a BioDrop (Biochrom, Cambridge, London, United Kingdom) were used to measure the quality and quantity of total RNA. Libraries were constructed and sequenced at the Beijing Genomics Institute.
Raw data were initially filtered using SOAPnuk v1.5.2 (Chen et al., 2018), and then histat2 (Kim et al., 2019) was used to map clean reads to a sorghum reference genome of BTx623 version 3.1.1 (McCormick et al., 2018).2 Differential expressed genes (DEGs) were identified using R package DESeq2 with a padj < 0.05-Benjamini-Hochberg multiple test correction (FDR) and the absolute value of a log2 (FC) > 1 (Love et al., 2014). Both gene Ontology (GO) and Kyoto Encyclopedia of Genes and Genomes (KEGG) enrichment analyses were performed using the “clusterProfiler” package in R (Wu et al., 2021). The enrichment results of GO and KEGG pathways were obtained using P < 0.05 as the significance threshold. The top 5 KEGG pathways and top 5 terms of each GO domain were identified.
Weighted gene correlation network analysis (WGCNA) was performed using the R package “WGCNA” (Langfelder and Horvath, 2008). Firstly, the genes were ranked by median absolute deviation from large to small, and the top 50% genes were selected for WGCNA using the “goodSamplesGenes” function in package “WGCNA.” Subsequently, the power parameter ranging from 1 to 20 was screened out using the “pickSoftThreshold” function in package “WGCNA.” A suitable soft threshold of 8 was selected, as it met the degree of independence of 0.85 with the minimum power value. Finally, modules were obtained following dynamic branch cutting with a merging threshold of 0.25. The modules were visualized by the “plotDendroAndColors” function in package “WGCNA.” The correlation map between modules and traits was visualized using the R package “ggcor.”
Candidate Gene Mining and Data Analysis
Stable QTLs were those detected across two environments. Genes within 50kb of QTL-associated SNPs were considered for further analysis based on the LD results. The candidate genes in the QTLs were obtained according to the reference genome (Sorghum bicolor v3.1.1, McCormick et al., 2018) and annotation GFF3 file (Sorghum bicolor v3.1.1)3 using BEDTools (Quinlan and Hall, 2010).
The phenotypic mean data of PH, TN, SD, and FW were calculated with “Descriptive Statistics” pack in “Data Analysis” tool using Excel 2010. Correlation analysis and histogram construction were performed for the traits using the “PerformanceAnalytics” package in R.
Results
Phenotypic Variation Among Accessions
Extensive variation in PH, TN, SD, and FW was observed in all four environments in the 245 accessions (Table 1). The extent of variation for the traits ranged from 1.5- to 5.6-fold. PH ranged from 90.0 to 476.7 cm, with 3.3–5.3-fold variation in the different environments, whereas TN ranged from 0 to 6.3, with 3.5–5.6-fold variation, SD ranged from 5.10 to 29.55 mm, with 1.5–1.8-fold variation, and FW ranged from 0.073 to 5.830 kg, with 2.4–4.9- fold. Mean PH, SD, and FW were significantly lower at Tengqiao (Tq) than at Fengyang (Fy), but no significant difference was observed for TN. It suggests that PH, SD, and FW, but not TN, were affected by photoperiod which was shorter at Tengqiao than at Fengyang.

Table 1. Statistical descriptions of four yield-related traits in the 245 sorghum accessions evaluated in four environments.
Furthermore, PH, FW, and SD were normally distributed, whereas the distribution of TN was relatively skewed in all four environments. According to Pearson’s correlation coefficients, FW was significantly and positively correlated with PH, SD and TN in all four environments, whereas TN was significantly and negatively correlated with SD (Figure 1). It suggests that the traits are genetically linked or that the traits are affected by genes with pleiotropic effects.
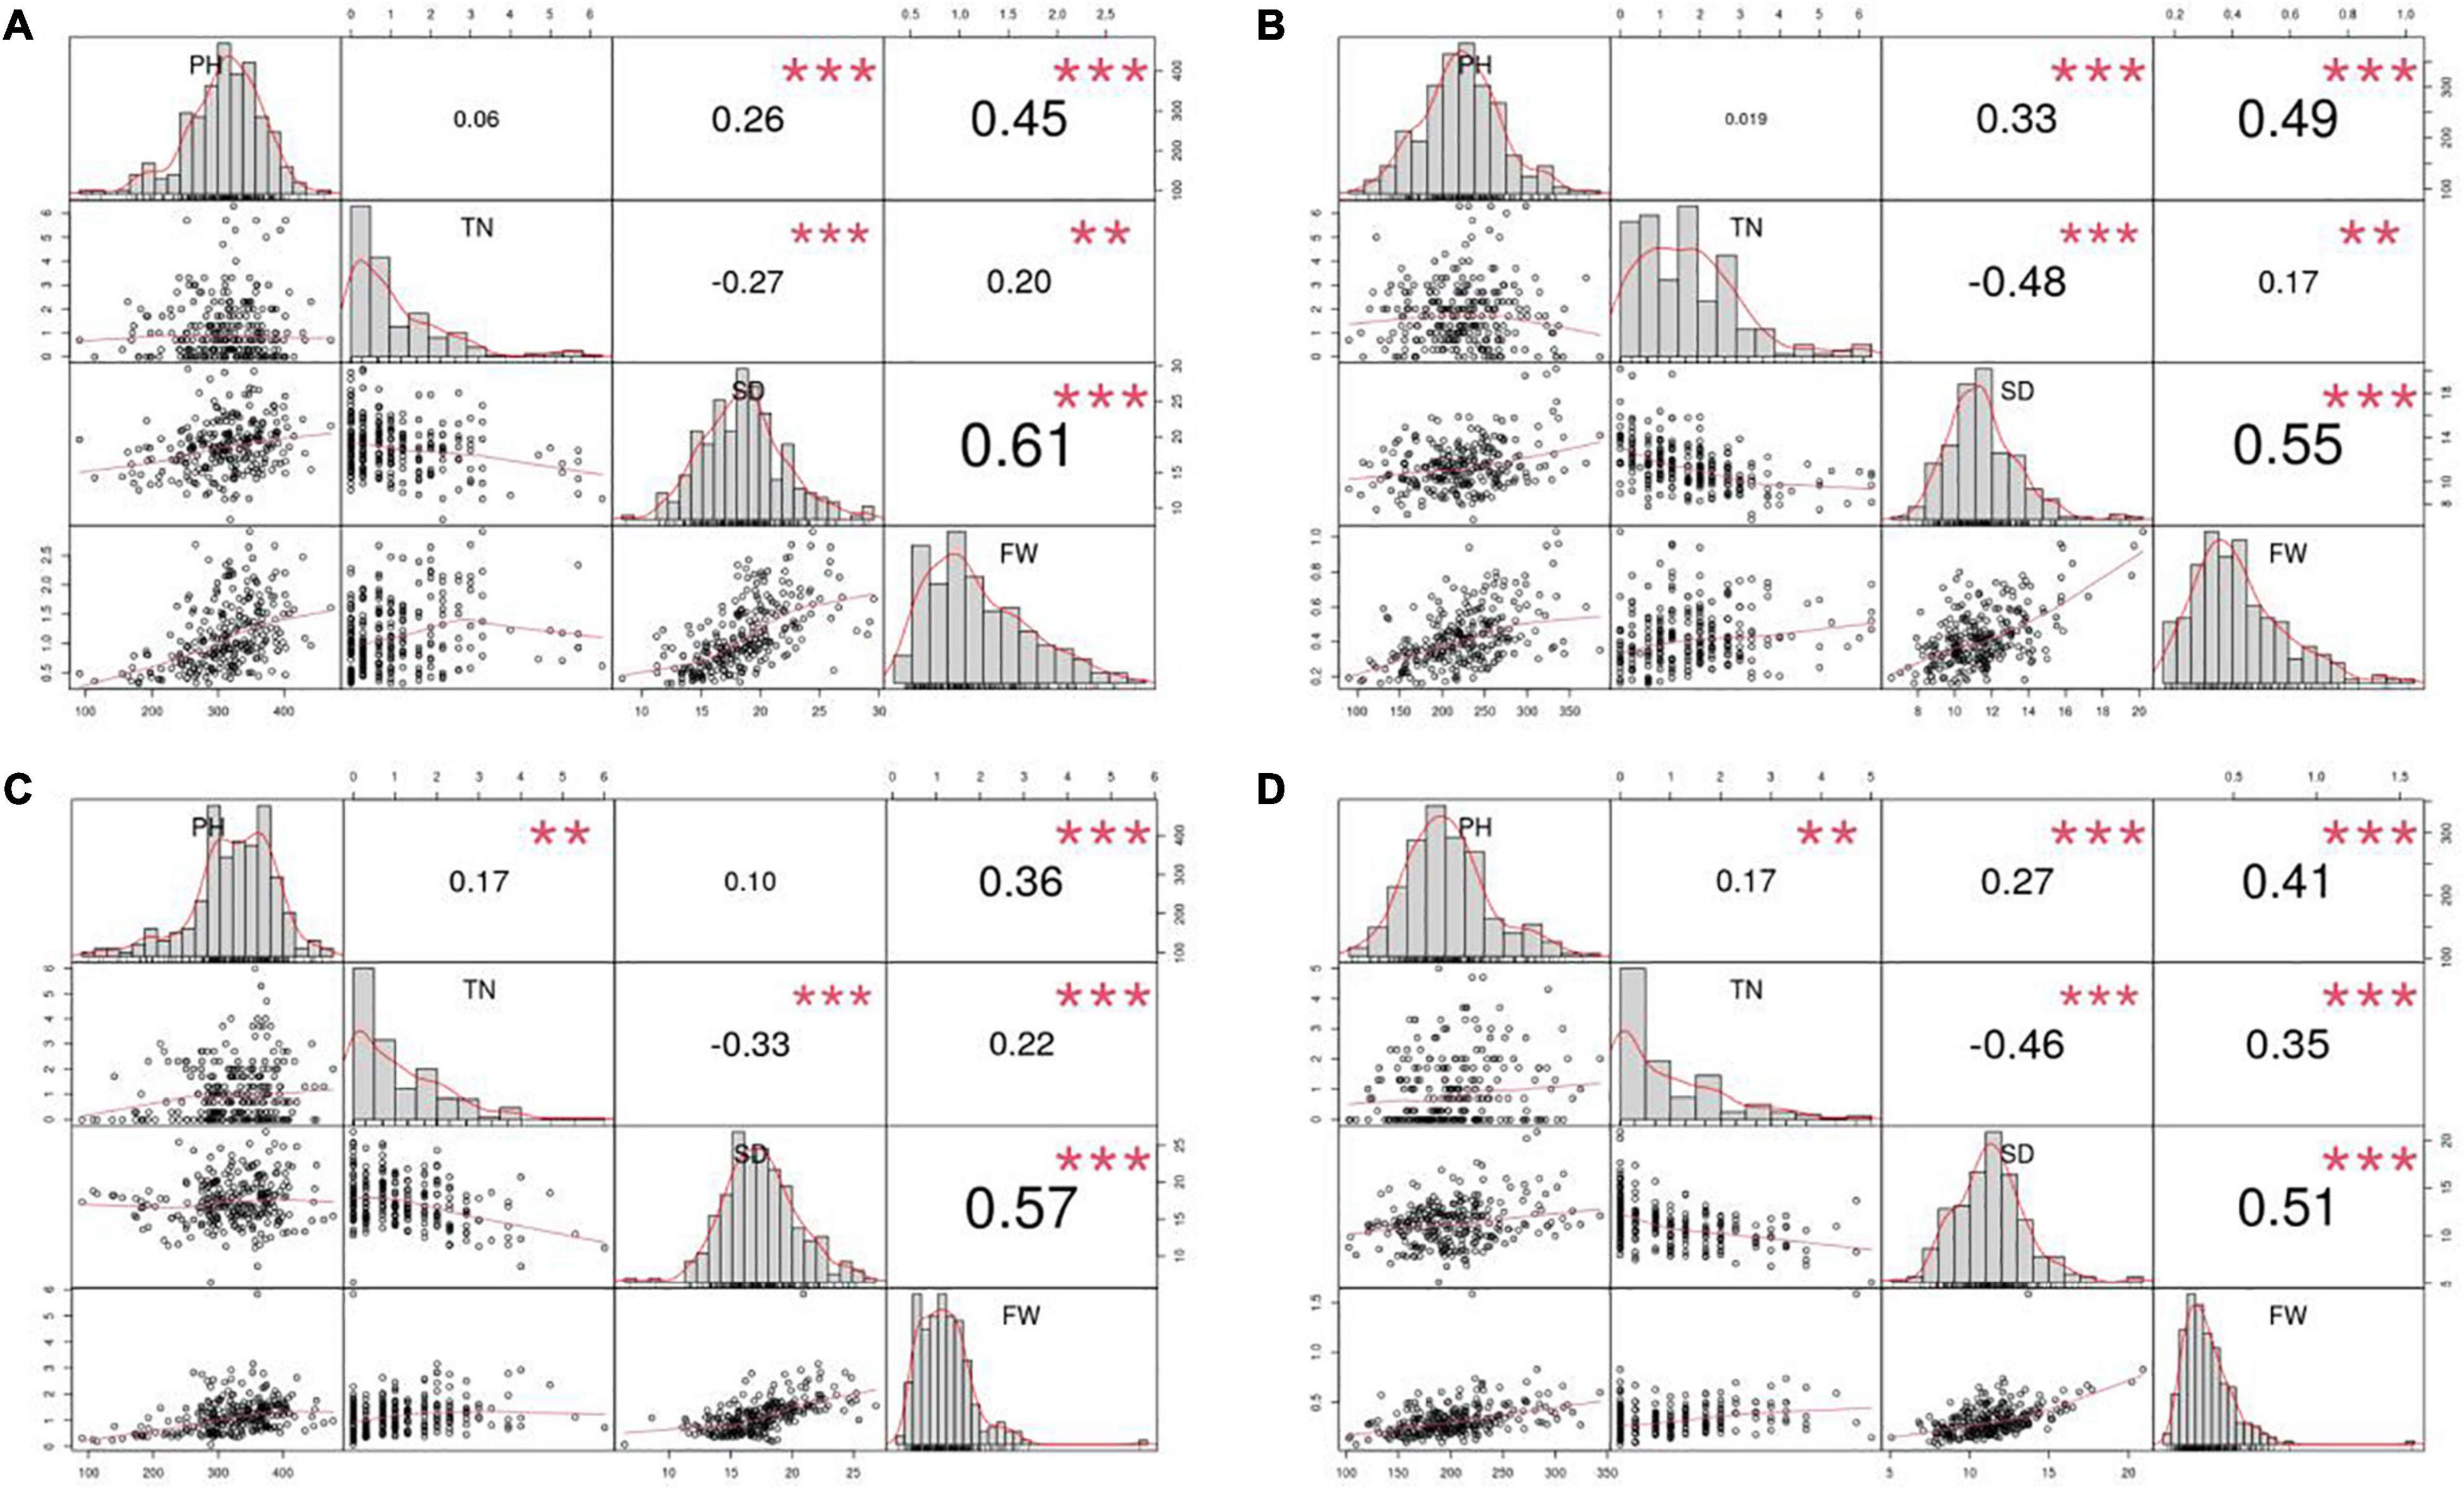
Figure 1. Pearson correlation coefficients for the four yield traits evaluated in the four environments. Four environments: (A) 2015Fy, (B) 2016Tq, (C) 2016Fy, and (D) 2017Tq. Four traits: Plant height (PH), tiller number (TN), stem diameter (SD), and fresh weight per plant (FW). ** Indicates significance level at 0.01. *** Indicates significance level at 0.001.
Linkage Disequilibrium
LD in the 245 accessions was calculated using parameter r2 with 3,026 SNPs. The LD in the 245 accessions decayed after 25 kb on average (Figure 2A), which suggests that the QTLs detected in multiple environments were less than 25 kb from the causal marker(s). The best K-value in the population structure was 7 (Figure 2B) and was used for GWAS analysis.
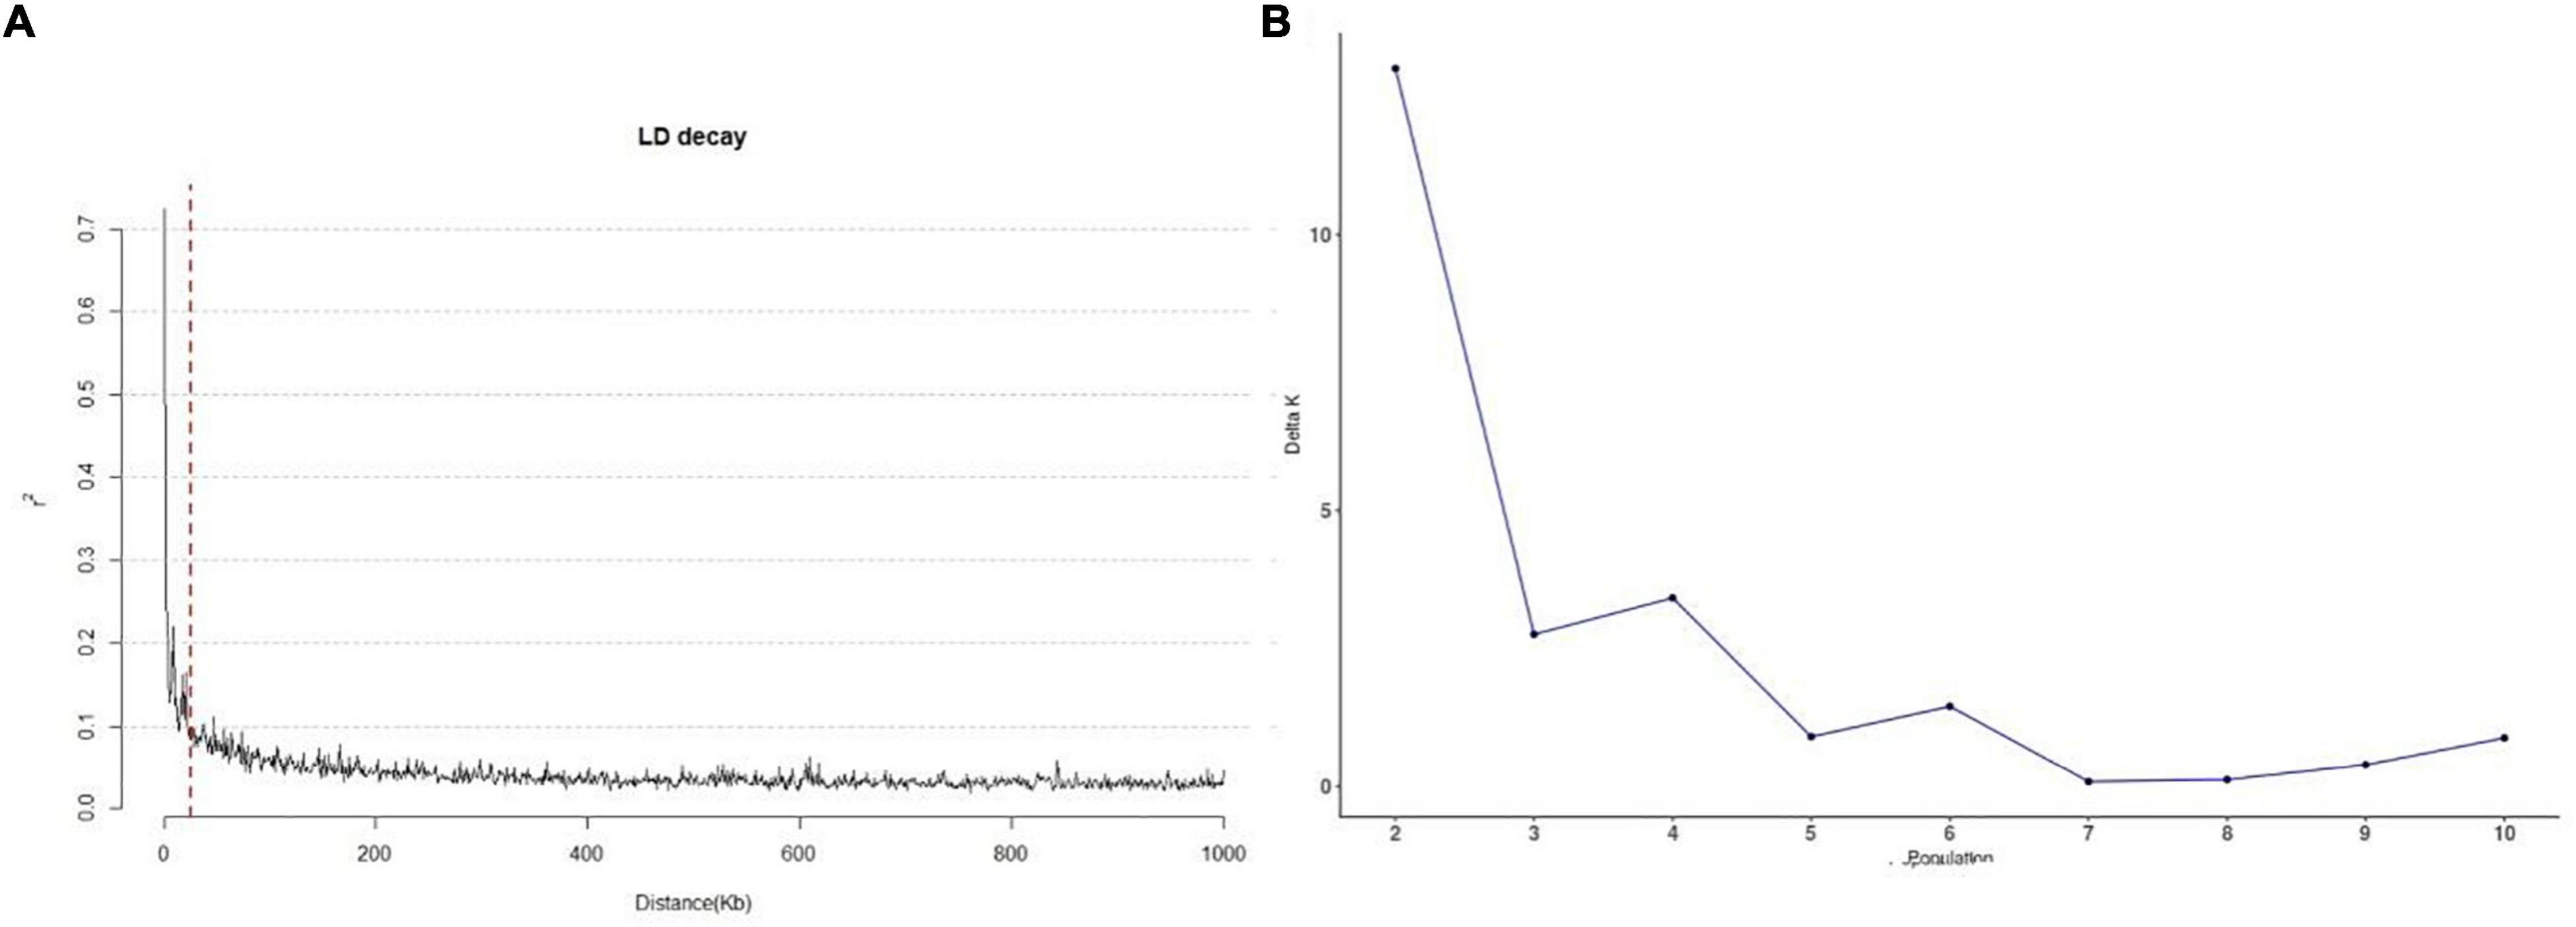
Figure 2. Linkage disequilibrium decay and the population structure of 245 sorghum accessions. (A) Genome distribution of r2-values estimated from 245 sorghum accessions. The red dotted line represents 25 kb. (B) Calculation of △K based on the value of Ln P(D) between successive K-values.
Genome-Wide Association Analysis
GWAS was performed using a MLM and 85,585 SNP markers. A total of 338 SNPs, or quantitative trait nucleotides (QTNs), were associated with the four yield traits with phenotypic variation explained (PVE) ranged from 4.1 to 57.07% (Supplementary Table 1). Seventy-four SNPs were associated with PH, and 97, 83, and 84 were associated with TN, SD and FW. The association p-values for the QTNs ranged from 9.38E-04 to 7.90E-12. The QTNs were distributed relatively evenly across the 10 chromosomes with the highest of 38 QTNs on chromosome 3 and the lowest of 29 on chromosome 6. The numbers of QTNs detected in each of the four environments were not significantly different: 90 QTNs in 2015Fy, 85 in 2016Tq, 87 in 2016Fy, and 76 QTNs in 2017Tq.
In addition, 21 stable QTNs were detected in two environments at least. Four PH QTNs were detected on chromosomes 1, 3, 4, and 8 (one each) in two environments. Ten TN QTNs were detected on chromosomes 3, 4, 5, 7, and 10 in all four environments. Six SD QTNs were detected on chromosomes 3, 7, 8, and 10. One FW QTN was detected on chromosome 8. In these stable QTNs, the PVE of eight QTNs was greater than 10% in both environments, and the PVE of S4_1261758 and S3_69018585 were greater than 20% (Table 2).
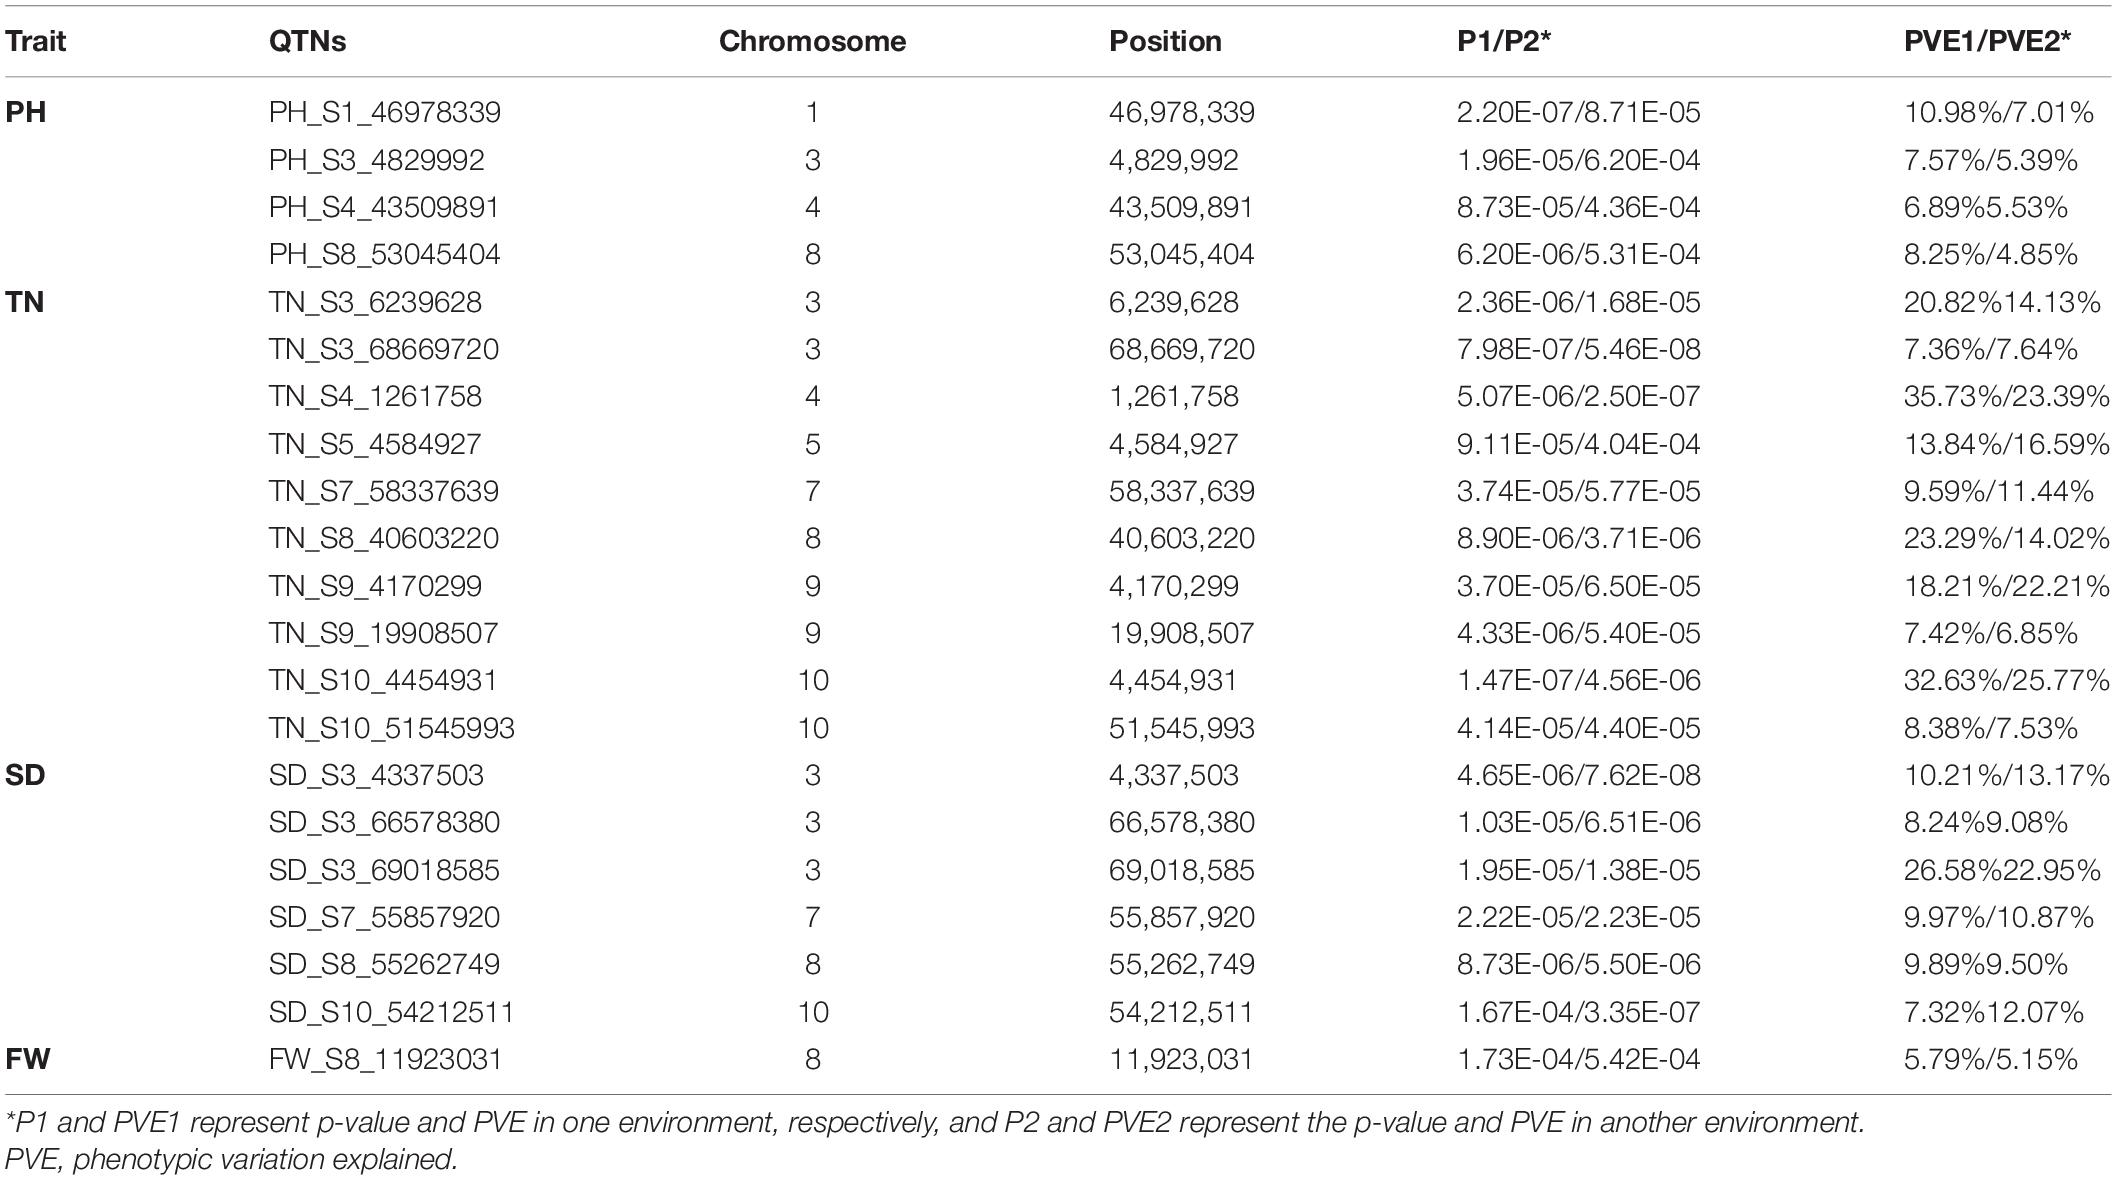
Table 2. Quantitative trait nucleotides (QTNs) associated with four forage yield traits across two or more environments.
RNA-Seq in the Four Growth Stages
Number of DEGs decreased with development stage from 5,456 (2,417 up- and 3,039 down-regulated) between stages 1 and 2 (stage1_stage2) to 1,246 (684 up- and 562 down-regulated) between stages 2 and stage 3 (stage2_stage3), and 1,379 (543 up- and 836 down-regulated) between stages 3 and stage 4 (stage3_stage4, Figure 3). In addition, the three sets of DEGs included 4,443, 573, and 711 unique DEGs, respectively. However, 106 DEGs were shared among all three-stage comparisons, which suggested that the DEGs play important roles in vegetative development.
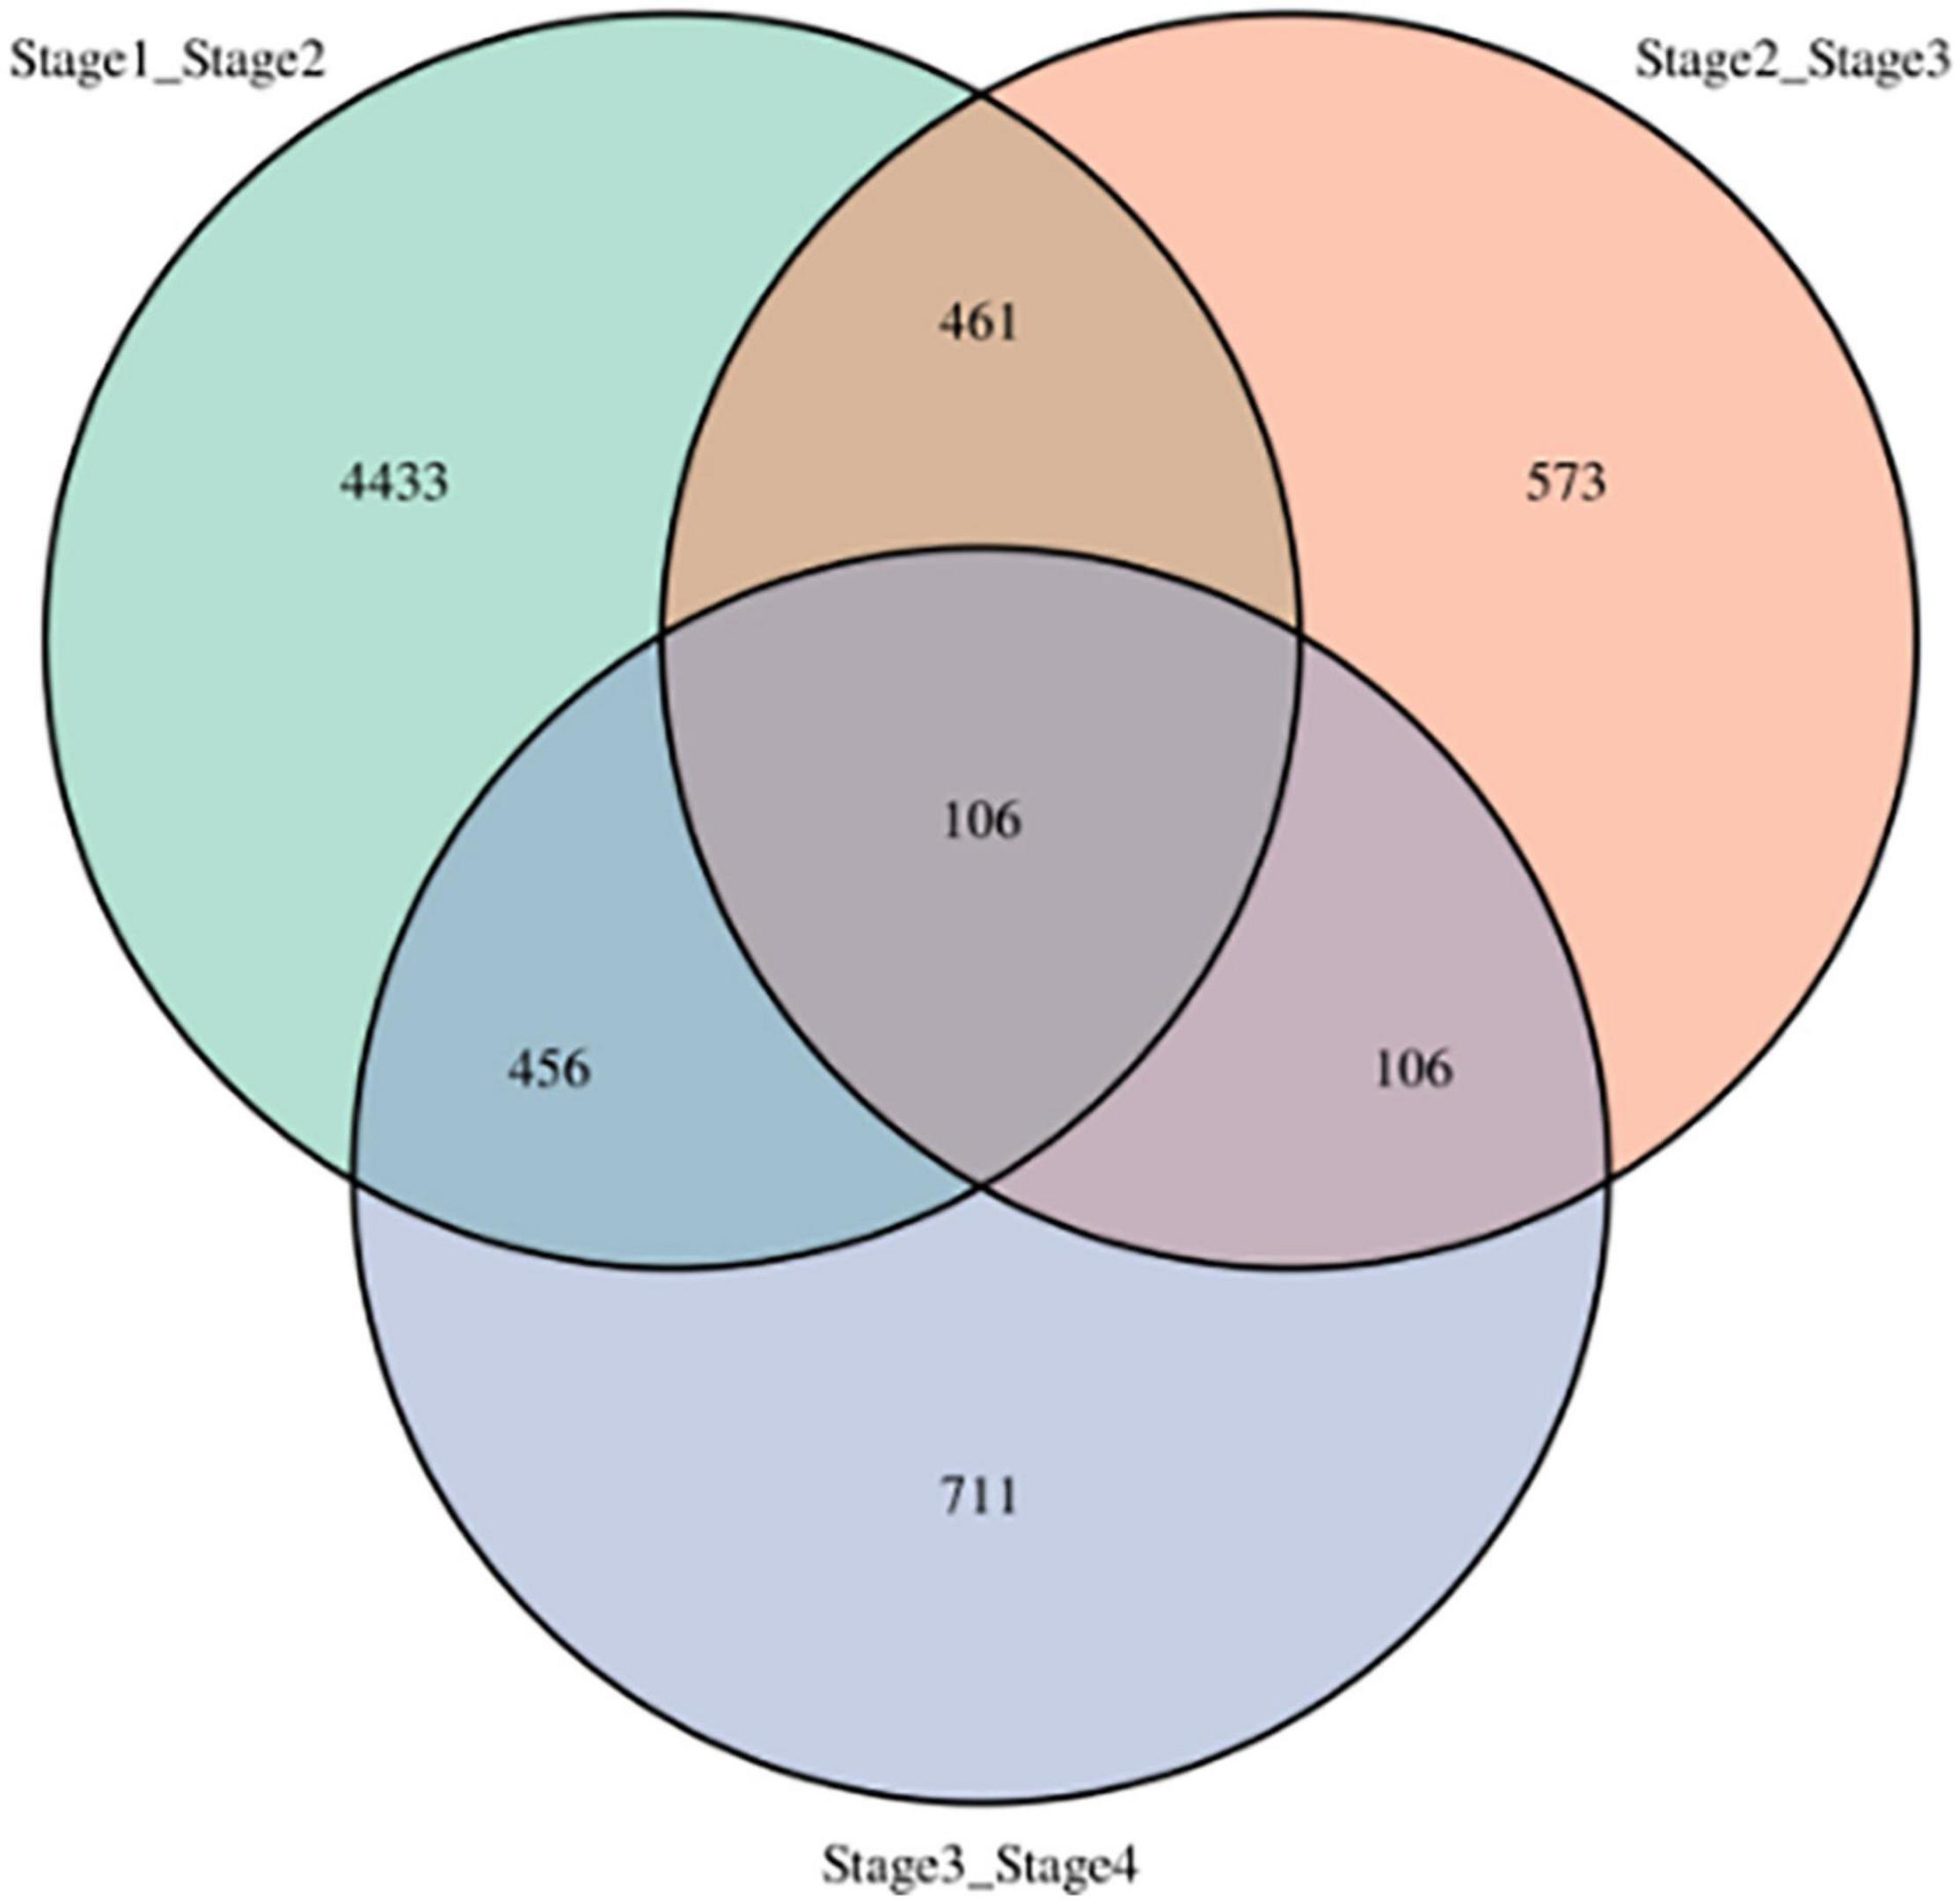
Figure 3. Differentially expressed genes at four development stages in sorghum. stage1_stage2: stages 1 and 2, stage2_stage3: stages 2 and 3, stage3_stage4: stages 3 and 4.
Furthermore, KEGG enrichment analysis indicated that the stage1_stage2, stage2_stage3, and stage3_stage4 DEGs were associated with pathways related to ribosome and amino acid biosynthesis, stress and glutathione metabolism, and circadian rhythm and photosynthesis, respectively (Figure 4). From stage3 to stage4, sorghum transitioned from vegetative to reproductive development. Four Flowering Locus T-like (FTL) genes were significantly up-regulated at stage 4, and the expression of two phytochrome biosynthesis-related genes were also affected in the stage3_stage4 DEGs (Table 3). The FTL genes may play a role in the transition between vegetative to reproductive stages. The 106 DEGs shared among the four developmental stages encoded proteins involved in plant hormone signal transduction, including three jasmonate-zim-domain proteins that were down-regulated in stage1_stage2 and stage3_stage4 but up-regulated in stage2_stage3 (Table 3). In Arabidopsis, JAZ10/JAZ11 regulates root growth (Liu et al., 2021).

Figure 4. KEGG enrichment of differentially expressed genes in the four development stages of sorghum. (A) stage1_stage2. (B) stage2_stage3. (C) stage3_stage4.
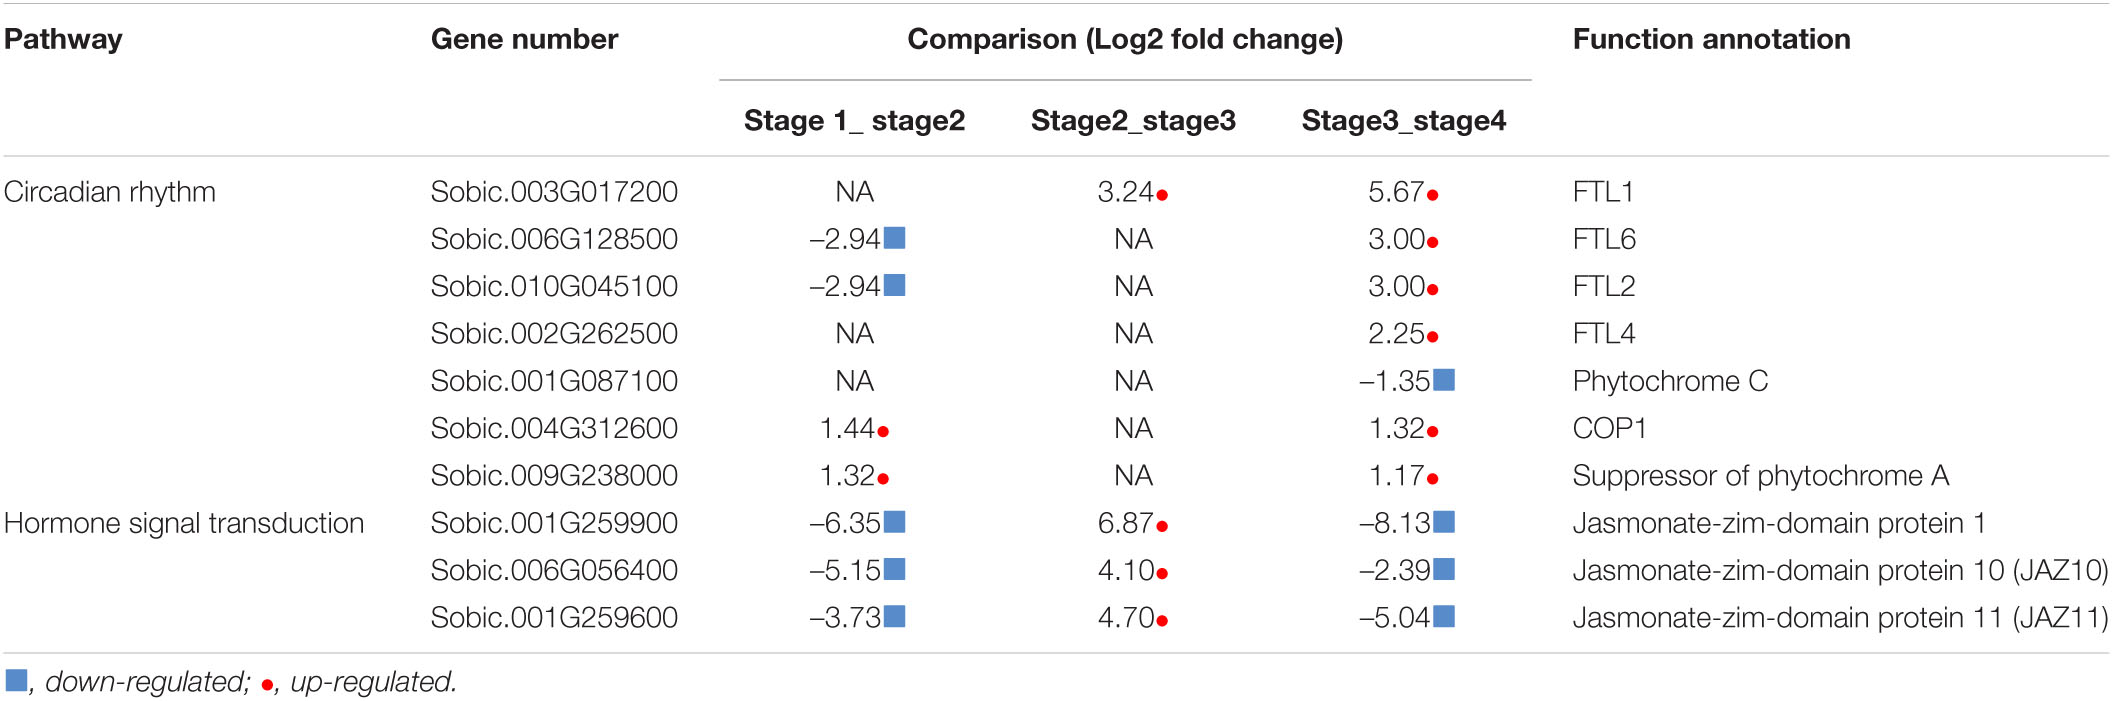
Table 3. Circadian rhythm- and hormone signal transduction-related enriched genes.
Weighted gene correlation network analysis (WGCNA) indicated that 45 separate modules were correlated with PH and SD (Figure 5A and Supplementary Table 4). Eight of the modules were significantly correlated with PH, and three with SD (p < 0.05; Figure 5B). The blue module had the highest positive correlation with PH and SD (r = 0.914 and r = 0.915, respectively), and the turquoise module had the highest negative correlation with PH and SD (r = –0.717 and r = –0.958, respectively). There were 4,733 and 8,635 genes in the blue and turquoise modules, respectively, which indicates that the development of PH and SD is complex and involves a large number of genes.
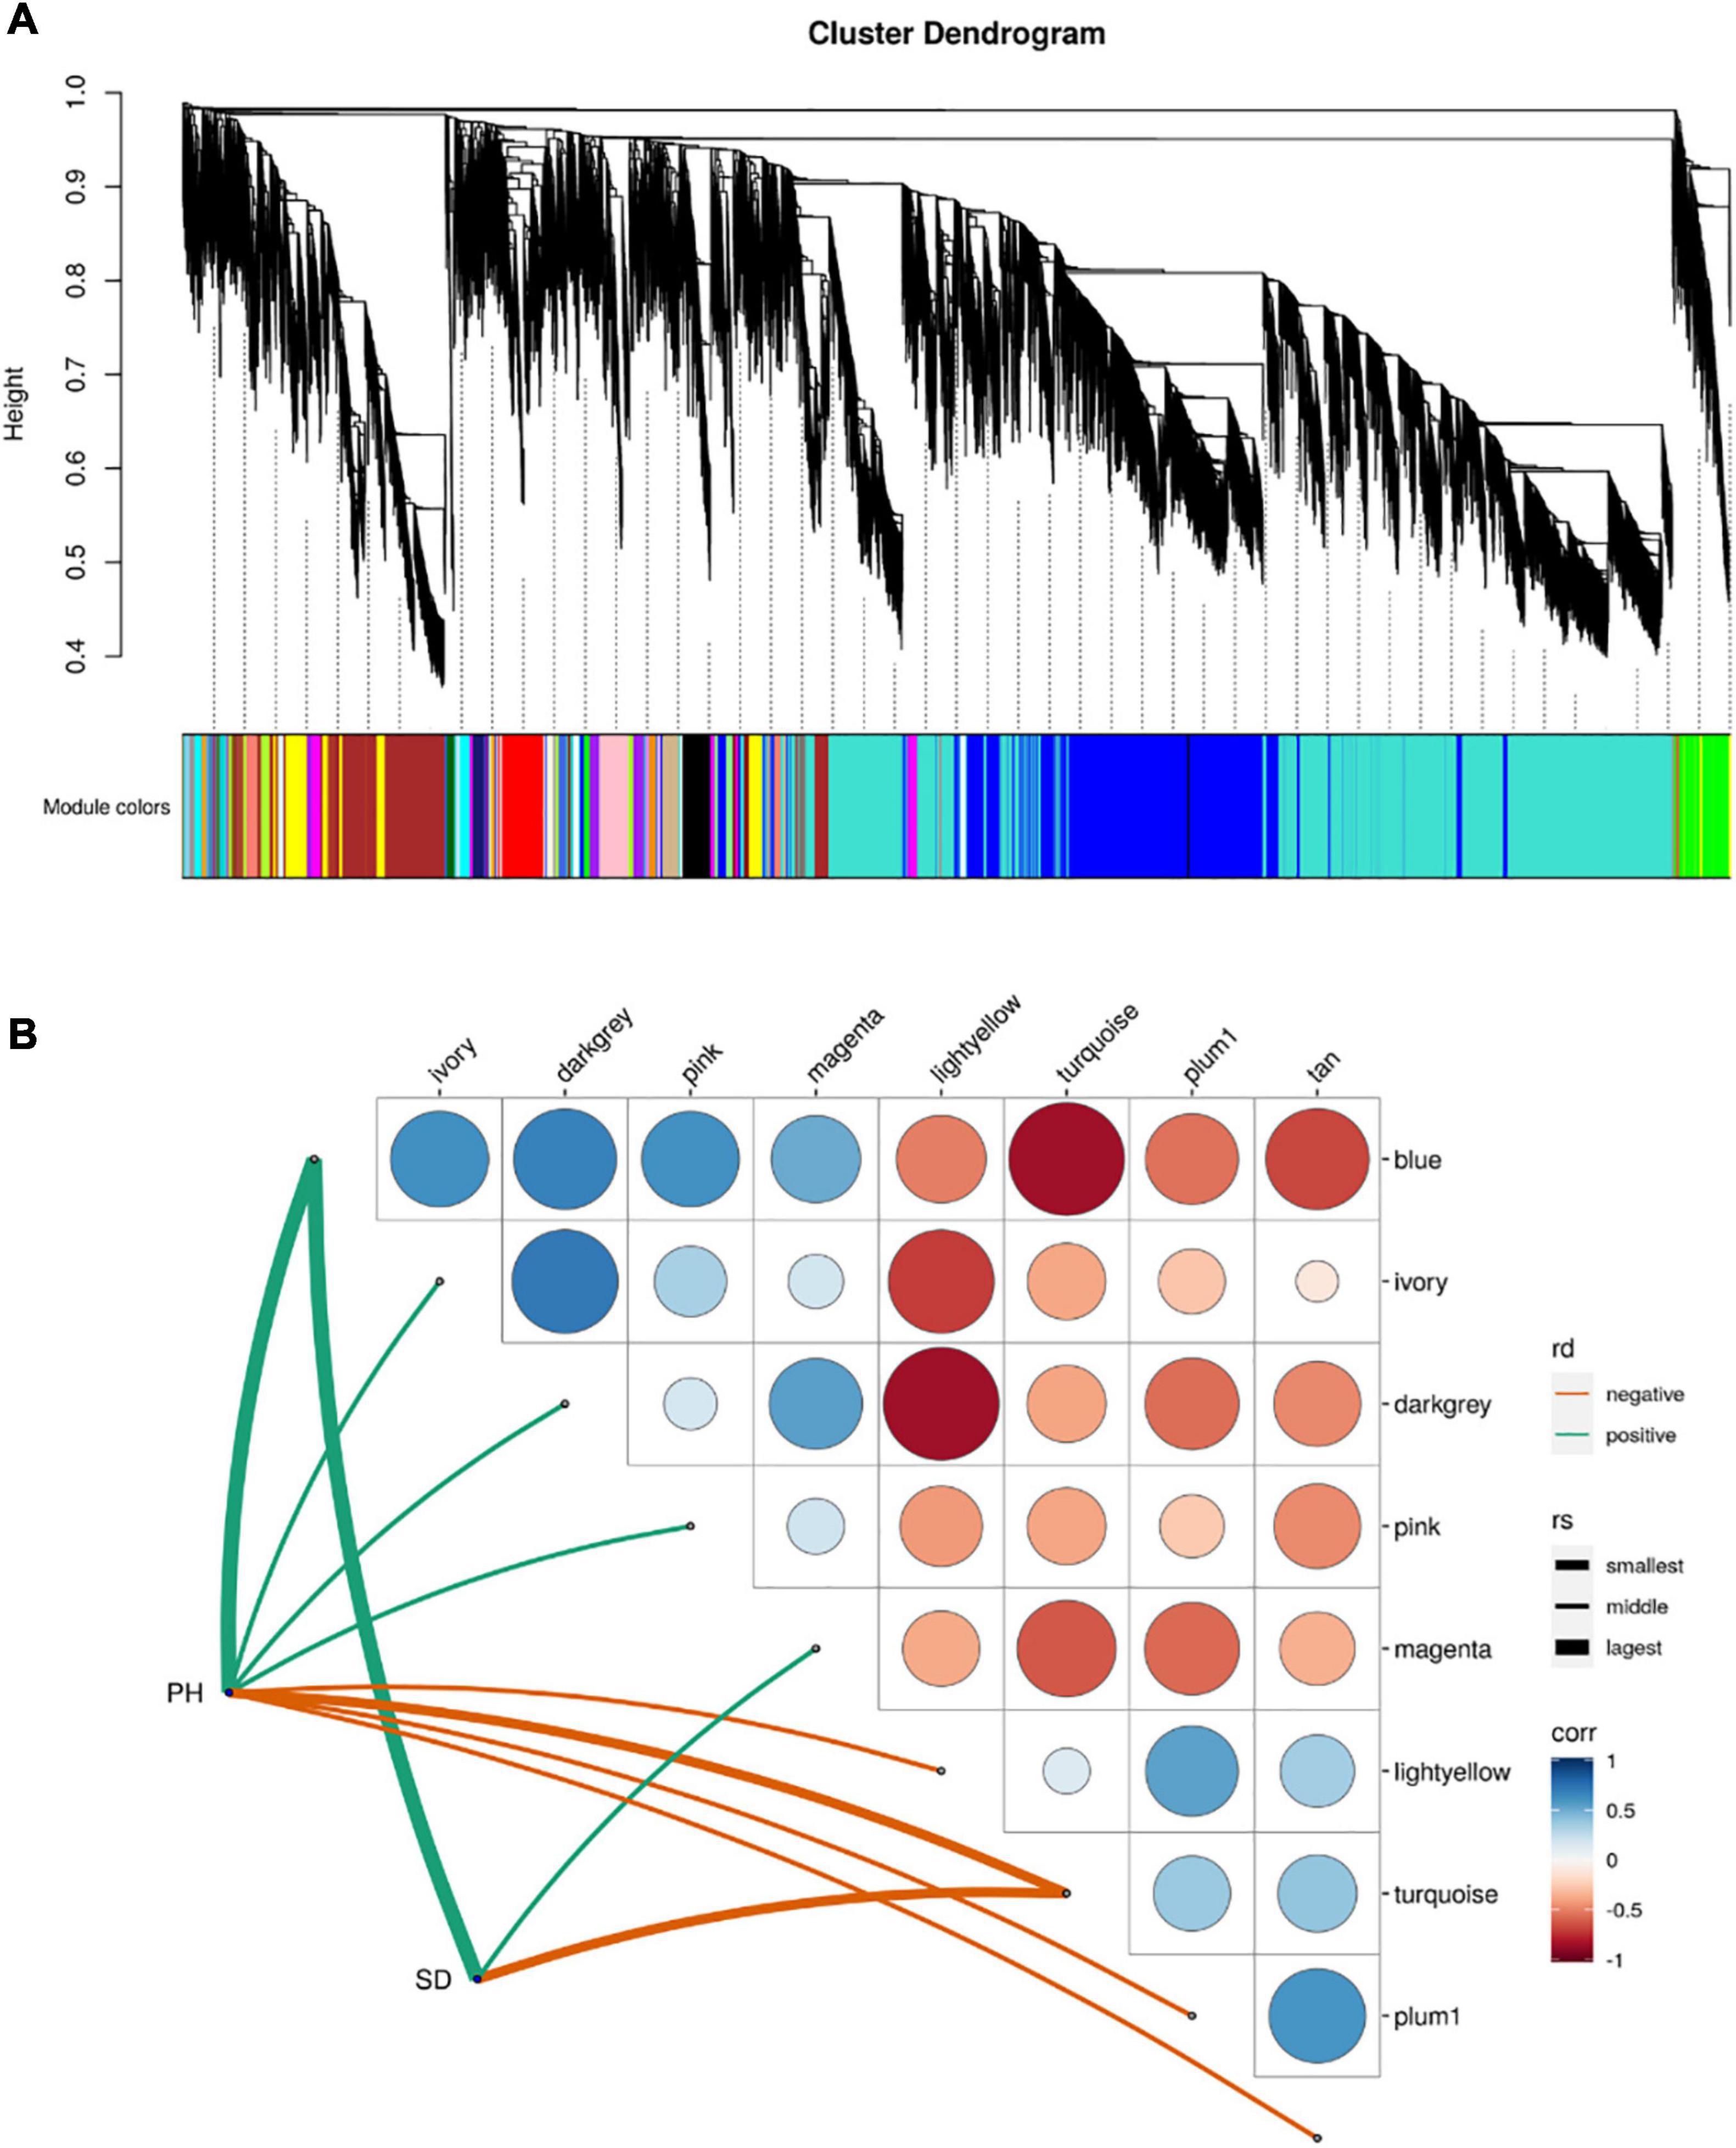
Figure 5. Module-trait relationship from weighted gene correlation network analysis. (A) Module-trait map. (B) Significant correlation map between traits and modules. rd-represents direction of correlation; rv-represents size of r-value.
The DEGs in the blue module were up-regulated in all three-stage comparisons, whereas the most of DEGs in the turquoise module were down-regulated in the stage1_stage2 and stage3_stage4 (Supplementary Table 5). KEGG enrichment analysis indicated that the genes in the blue module were mainly enriched in pathways related to spliceosome and protein processing in the endoplasmic reticulum (Supplementary Figure 1A), whereas the genes in the turquoise module were mainly enriched in ribosome and purine metabolism pathways (Supplementary Figure 1B).
Candidate Genes by Genome-Wide Association Studies and RNA-Seq
The sorghum annotation file was used to annotate genes associated with the 21 stable QTNs. Of the 86 candidate genes associated with the 21 stable QTNs (Supplementary Table 2), PH, TN, and SD were associated with 14, 40, and 32, respectively.
Further analysis reduced the number of candidate genes to eight that were associated with seven QTNs by RNA-seq (Table 4). A gene for indole-3-glycerol phosphate synthase (Zhao, 2010), which is involved in the biosynthesis of indole-3-acetic acid (IAA), was associated with PH and was down-regulated in the stage1_stage2 comparison. Of the four candidate genes associated with TN, two were up-regulated, and two were down-regulated. Of the three candidate genes associated with SD, two (Sobic.003G047700 and Sobic.003G047800) encoded cytokinin-O-glucosyltransferase 3 and both genes were up-regulated. Another (Sobic.003G375100) encoded a mitochondrial DNA repair RAD52-like protein 1, which plays a very important role in plant development, especially vegetative development (Table 4).

Table 4. Candidate yield-related genes in forage sorghum.
Discussion
GWAS represent an important approach for dissecting the genetic architecture of complex traits in plants (Aulchenko et al., 2007; Liu and Yan, 2019). However, the approach is limited by its high rate of false positives (Cortes et al., 2021). In the future, development in GWAS methodology (Zhu et al., 2008) and multi-environment analysis (Hall et al., 2010) will minimize the rate of false positives. In the present study, MLM and multiple testing environments were used to perform GWAS for four forage sorghum yield traits. Among the 338 QTNs identified, 21 were detected in at least two environments. Thus, the use of multiple testing environments significantly reduced the number of candidate QTNs.
To evaluate linkage strength, the 21 QTNs were compared to QTNs from other studies curated in the Sorghum QTL Atlas (Mace et al., 2019). The comparison identified 12 QTNs (two for PH, six for TN and four for SD) that overlapped with previously published QTLs (Supplementary Table 3). However, no overlapping QTNs were identified for the FW QTNs, probably because of the low heritability of forage yield in sorghum (Shiringani and Friedt, 2011). This observation may also explain why only a single FW QTN was detected in more than one environment. Previous studies have suggested that plant height can be used for indirect selection of forage yield (Fernandes et al., 2018; Dos Santos et al., 2020; Habyarimana et al., 2020). In the present study, 12 of 21 QTNs were identified that overlapped with QTLs from previous studies. These QTNs may provide a robust tool for gene cloning and breeding.
Plant height was also strongly correlated with forage yield in the present study. One of the candidate PH genes encodes indole-3-glycerol phosphate synthase. The gene (Sobic.004G143900) was down-regulated in the stage1_stage2 comparison during sorghum vegetative development. According to RNA-Seq data available in Phytozome 13 (Goodstein et al., 2012; McCormick et al., 2018; see text footnote 2) the expression of the gene is highest in young stems (85.252, stem 1 cm vegetative) and decreases with plant development (15.983, stem mid internode.anthesis). The phytohormone IAA plays a vital role in plant growth (Zhao, 2010) and indole-3-glycerol phosphate synthase serves as a branchpoint compound in the Trp-independent IAA de novo biosynthetic pathway (Ouyang et al., 2000). Sun et al. (2020) reported that YABBY2b controls plant height by regulating indole-3-acetic acid-amido synthetase expression in tomato and demonstrated that silencing the indole-3-acetic acid-amido synthetase gene increased plant height. As mentioned above, the indole-3-glycerol phosphate synthase gene Sobic.004G143900 was also down-regulated in the stage1_stage2 comparison.
It is intriguing that the DNA repair RAD52 gene Sobic.003G375100 was associated with SD in the present study. First, the initial growth of sorghum stem occurs primarily through an increase in cell number (Kebrom et al., 2017), which is achieved via mitosis. In Saccharomyces cerevisiae, Rad52 participates in the homologous recombination pathway for repairing double-strand DNA breaks, by seeking out and mediating the annealing of homologous DNA strands. Once double-strand DNA breaks are induced, Rad52 relocalizes from a diffuse nuclear distribution to distinct foci, almost exclusively during the S phase of mitosis, thereby demonstrating coordination between recombination repair and DNA replication (Lisby et al., 2001). In mammalian cells, RAD52 plays a similar role in DNA strand exchange and annealing during homologous recombination. In mouse bronchial epithelial cells, Rad52 blockade slows cell growth and induces senescence, whereas the overexpression of Rad52 accelerates cell proliferation (Lieberman et al., 2016). Therefore, whether this gene drives SD in sorghum needs further investigation.
RNA-Seq is an important tool for studying gene expression in the whole genome (Tai et al., 2016). However, it is difficult to identify potentially key genes because RNA-Seq usually yields a large number of DEGs (Zhang et al., 2020). In the present study, the blue and turquoise modules had strong correlations with PH and SD, respectively, even though the two modules contained thousands of genes. These indicate that the development of PH and SD are complex and that the large number of genes also hinders the identification of candidate genes for traits of interest.
Even though the application of GWAS to identify candidate genes for important traits is hindered by the high rate of false positives (Xie et al., 2019), the approach can be improved through integration with RNA-Seq. Recent studies have demonstrated the feasibility of this integrated approach in both animals and plants (Xie et al., 2019; Yan et al., 2020). In the present study, the integration of GWAS with RNA-Seq significantly reduced the number of candidate genes responsible for PH, TN, and SD. Further investigation of two of the candidate genes, Sobic.004G143900 and Sobic.003G375100, may provide valuable insight into the molecular mechanisms underlying PH and SD in sorghum. The present study demonstrates the usefulness of the integrative analysis of omics data for identifying candidate genes that underlie complex traits as well as genes for future transgenic studies.
Data Availability Statement
The datasets presented in this study can be found in online repositories. The names of the repository/repositories and accession number(s) can be found below: NCBI SRA BioProject, accession no: PRJNA780207.
Author Contributions
LW, YL, LG, XY, XZ, SX, and MC phenotyped plant height (PH), tiller number (TN), stem diameter (SD), and fresh weight for per plant (FW) in the four environments at Fengyang and Tengqiao. LW analyzed GWAS results. JL performed GWAS and LD analysis. JL and Y-HW analyzed RNA-seq results and revised the manuscript. YS took part in the planning of the experiments and revised the manuscript. All authors have read and approved the manuscript for publication.
Funding
This study was supported by the National Natural Science Foundation of China (31971993), the Anhui Provincial Natural Science Fund (2008085MC73), the Anhui Provincial Key R&D Programs (202004b11020003), and the Key Project of Natural Science Research of Anhui provincial education department (KJ2019A0811).
Conflict of Interest
The authors declare that the research was conducted in the absence of any commercial or financial relationships that could be construed as a potential conflict of interest.
Publisher’s Note
All claims expressed in this article are solely those of the authors and do not necessarily represent those of their affiliated organizations, or those of the publisher, the editors and the reviewers. Any product that may be evaluated in this article, or claim that may be made by its manufacturer, is not guaranteed or endorsed by the publisher.
Supplementary Material
The Supplementary Material for this article can be found online at: https://www.frontiersin.org/articles/10.3389/fpls.2021.788433/full#supplementary-material
Supplementary Figure 1 | The KEEG enrichment for genes in blue module and turquois module. (A) The KEEG enrichment for genes in blue module. (B) The KEEG enrichment for genes in turquois module.
Footnotes
- ^ https://aussorgm.org.au/sorghum-qtl-atlas/
- ^ https://phytozome-next.jgi.doe.gov/info/Sbicolor_v3_1_1
- ^ https://data.jgi.doe.gov/refine-download/phytozome?q=Sorghum+bicolor&expanded=Phytozome-454
References
Aulchenko, Y. S., de Koning, D.-J., and Haley, C. (2007). Genomewide rapid association using mixed model and regression: a fast and simple method for genomewide pedigree-based quantitative trait loci association analysis. Genetics 177, 577–585. doi: 10.1534/genetics.107.075614
Bradbury, P. J., Zhang, Z., Kroon, D. E., Casstevens, T. M., Ramdoss, Y., and Buckler, E. S. (2007). TASSEL: software for association mapping of complex traits in diverse samples. Bioinformatics 23, 2633–2635. doi: 10.1093/bioinformatics/btm308
Chen, J., Zhu, M., Liu, R., Zhang, M., Lv, Y., Liu, Y., et al. (2020). BIOMASS YIELD 1 regulates sorghum biomass and grain yield via the shikimate pathway. J. Exp. Bot. 71, 5506–5520. doi: 10.1093/jxb/eraa275
Chen, Y., Chen, Y., Shi, C., Huang, Z., Zhang, Y., Li, S., et al. (2018). SOAPnuke: a MapReduce acceleration-supported software for integrated quality control and preprocessing of high-throughput sequencing data. Gigascience 7, 1–6. doi: 10.1093/gigascience/gix120
Cortes, L. T., Zhang, Z., and Yu, J. (2021). Status and prospects of genome-wide association studies in plants. Plant Genome 14:e20077. doi: 10.1002/tpg2.20077
Dos Santos, J. P. R., Fernandes, S. B., McCoy, S., Lozano, R., Brown, P. J., Leakey, A. D. B., et al. (2020). Novel bayesian networks for genomic prediction of developmental traits in biomass sorghum. G3 10, 769–781. doi: 10.1534/g3.119.400759
Fernandes, S. B., Dias, K. O. G., Ferreira, D. F., and Brown, P. J. (2018). Efficiency of multi-trait, indirect, and trait-assisted genomic selection for improvement of biomass sorghum. Theor. Appl. Genet. 131, 747–755. doi: 10.1007/s00122-017-3033-y
Goodstein, D. M., Shu, S., Howson, R., Neupane, R., Hayes, R. D., Fazo, J., et al. (2012). Phytozome: a comparative platform for green plant genomics. Nucleic Acids Res. 40, D1178–D1186. doi: 10.1093/nar/gkr944
Habyarimana, E., De Franceschi, P., Ercisli, S., Baloch, F. S., and Dall’Agata, M. (2020). Genome-wide association study for biomass related traits in a panel of sorghum bicolor and s. bicolor × s. halepense populations. Front. Plant Sci. 11:1796. doi: 10.3389/fpls.2020.551305
Hall, D., Tegström, C., and Ingvarsson, P. K. (2010). Using association mapping to dissect the genetic basis of complex traits in plants. Brief. Funct. Genomics 9, 157–165. doi: 10.1093/bfgp.elp048
Huang, Z., Dunkerley, D., López-Vicente, M., and Wu, G.-L. (2020). Trade-offs of dryland forage production and soil water consumption in a semi-arid area. Agric. Water Manag. 241:106349. doi: 10.1016/j.agwat.2020.106349
Kebrom, T. H., McKinley, B., and Mullet, J. E. (2017). Dynamics of gene expression during development and expansion of vegetative stem internodes of bioenergy sorghum. Biotechnol. Biofuels 10:159. doi: 10.1186/s13068-017-0848-3
Kim, D., Paggi, J. M., Park, C., Bennett, C., and Salzberg, S. L. (2019). Graph-based genome alignment and genotyping with HISAT2 and HISAT-genotype. Nat. Biotechnol. 37, 907–915. doi: 10.1038/s41587-019-0201-4
Kong, W., Jin, H., Goff, V. H., Auckland, S. A., Rainville, L. K., and Paterson, A. H. (2020). Genetic Analysis of Stem Diameter and Water Contents To Improve Sorghum Bioenergy Efficiency. G3 10, 3991–4000. doi: 10.1534/g3.120.401608
Langfelder, P., and Horvath, S. (2008). WGCNA: an R package for weighted correlation network analysis. BMC Bioinform. 9:559. doi: 10.1186/1471-2105-9-559
Li, J., Tang, W., Zhang, Y.-W., Chen, K.-N., Wang, C., Liu, Y., et al. (2018). Genome-wide association studies for five forage quality-related traits in sorghum (Sorghum bicolor L.). Front. Plant Sci. 9:1146. doi: 10.3389/fpls.2018.01146
Lieberman, R., Xiong, D., James, M., Han, Y., Amos, C. I., Wang, L., et al. (2016). Functional characterization of RAD52 as a lung cancer susceptibility gene in the 12p13. 33 locus. Mol. Carcinog. 55, 953–963. doi: 10.1002/mc.22334
Lisby, M., Rothstein, R., and Mortensen, U. H. (2001). Rad52 forms DNA repair and recombination centers during S phase. Proc. Natl. Acad. Sci. U.S.A. 98, 8276–8282. doi: 10.1073/pnas.121006298
Liu, B., Seong, K., Pang, S., Song, J., Gao, H., Wang, C., et al. (2021). Functional specificity, diversity, and redundancy of Arabidopsis JAZ family repressors in jasmonate and COI1-regulated growth, development, and defense. New Phytol. 231, 1525–1545. doi: 10.1111/nph.17477
Liu, H.-J., and Yan, J. (2019). Crop genome-wide association study: a harvest of biological relevance. Plant J. 97, 8–18. doi: 10.1111/tpj.14139
Love, M. I., Huber, W., and Anders, S. (2014). Moderated estimation of fold change and dispersion for RNA-seq data with DESeq2. Genome Biol. 15:550. doi: 10.1186/s13059-014-0550-8
Mace, E., Innes, D., Hunt, C., Wang, X., Tao, Y., Baxter, J., et al. (2019). The sorghum QTL atlas: a powerful tool for trait dissection, comparative genomics and crop improvement. Theor. Appl. Genet. 132, 751–766. doi: 10.1007/s00122-018-3212-5
Marguerat, S., and Bähler, J. (2010). RNA-seq: from technology to biology. Cell. Mol. Life Sci. 67, 569–579. doi: 10.1007/s00018-009-0180-6
McCormick, R. F., Truong, S. K., Sreedasyam, A., Jenkins, J., Shu, S., Sims, D., et al. (2018). The Sorghum bicolor reference genome: improved assembly, gene annotations, a transcriptome atlas, and signatures of genome organization. Plant J. 93, 338–354. doi: 10.1111/tpj.13781
Ouyang, J., Shao, X., and Li, J. (2000). Indole-3-glycerol phosphate, a branchpoint of indole-3-acetic acid biosynthesis from the tryptophan biosynthetic pathway in Arabidopsis thaliana: Arabidopsis IAA biosynthesis. Plant J. 24, 327–334. doi: 10.1046/j.1365-313x.2000.00883.x
Pritchard, J. K., Stephens, M., and Donnelly, P. (2000). Inference of population structure using multilocus genotype data. Genetics 155, 945–959. doi: 10.1093/genetics/155.2.945
Purcell, S., Neale, B., Todd-Brown, K., Thomas, L., Ferreira, M. A. R., Bender, D., et al. (2007). PLINK: a tool set for whole-genome association and population-based linkage analyses. Am. J. Hum. Genet. 81, 559–575. doi: 10.1086/519795
Quinlan, A. R., and Hall, I. M. (2010). BEDTools: a flexible suite of utilities for comparing genomic features. Bioinformatics 26, 841–842. doi: 10.1093/bioinformatics/btq033
Rooney, W. L., Blumenthal, J., Bean, B., and Mullet, J. E. (2007). Designing sorghum as a dedicated bioenergy feedstock. Biofuel. Bioprod. Biorefin. 1, 147–157. doi: 10.1002/bbb.15
Shiringani, A. L., and Friedt, W. (2011). QTL for fibre-related traits in grain × sweet sorghum as a tool for the enhancement of sorghum as a biomass crop. Theor. Appl. Genet. 123, 999–1011. doi: 10.1007/s00122-011-1642-4
Spindel, J. E., Dahlberg, J., Colgan, M., Hollingsworth, J., Sievert, J., Staggenborg, S. H., et al. (2018). Association mapping by aerial drone reveals 213 genetic associations for Sorghum bicolor biomass traits under drought. BMC Genom. 19:679. doi: 10.1186/s12864-018-5055-5
Sun, M., Li, H., Li, Y., Xiang, H., Liu, Y., He, Y., et al. (2020). Tomato YABBY2b controls plant height through regulating indole-3-acetic acid-amido synthetase (GH3.8) expression. Plant Sci. 297:110530. doi: 10.1016/j.plantsci.2020.110530
Tai, H., Lu, X., Opitz, N., Marcon, C., Paschold, A., Lithio, A., et al. (2016). Transcriptomic and anatomical complexity of primary, seminal, and crown roots highlight root type-specific functional diversity in maize (Zea mays L.). J. Exp. Bot. 67, 1123–1135. doi: 10.1093/jxb/erv513
Wang, Z., Gerstein, M., and Snyder, M. (2009). RNA-Seq: a revolutionary tool for transcriptomics. Nat. Rev. Genet. 10, 57–63. doi: 10.1038/nrg2484
Wu, T., Hu, E., Xu, S., Chen, M., Guo, P., Dai, Z., et al. (2021). ClusterProfiler 4.0: a universal enrichment tool for interpreting omics data. Innovation 2:100141. doi: 10.1016/j.xinn.2021.100141
Xie, D., Dai, Z., Yang, Z., Tang, Q., Deng, C., Xu, Y., et al. (2019). Combined genome-wide association analysis and transcriptome sequencing to identify candidate genes for flax seed fatty acid metabolism. Plant Sci. 286, 98–107. doi: 10.1016/j.plantsci.2019.06.004
Yan, Z., Huang, H., Freebern, E., Santos, D. J. A., Dai, D., Si, J., et al. (2020). Integrating RNA-Seq with GWAS reveals novel insights into the molecular mechanism underpinning ketosis in cattle. BMC Genomics 21:489. doi: 10.1186/s12864-020-06909-z
Zhang, H., Li Wang, M., Dang, P., Jiang, T., Zhao, S., Lamb, M., et al. (2021). Identification of potential QTLs and genes associated with seed composition traits in peanut (Arachis hypogaea L.) using GWAS and RNA-Seq analysis. Gene 769:145215. doi: 10.1016/j.gene.2020.145215
Zhang, H., Zhang, J., Xu, Q., Wang, D., Di, H., Huang, J., et al. (2020). Identification of candidate tolerance genes to low-temperature during maize germination by GWAS and RNA-seq approaches. BMC Plant Biol. 20:333. doi: 10.1186/s12870-020-02543-9
Zhao, K., Tung, C.-W., Eizenga, G. C., Wright, M. H., Ali, M. L., Price, A. H., et al. (2011). Genome-wide association mapping reveals a rich genetic architecture of complex traits in Oryza sativa. Nat. Commun. 2:467. doi: 10.1038/ncomms1467
Zhao, Y. (2010). Auxin biosynthesis and its role in plant development. Annu. Rev. Plant Biol. 61, 49–64. doi: 10.1146/annurev-arplant-042809-112308
Keywords: sorghum, forage yield trait, genome-wide association study, RNA-seq, candidate gene
Citation: Wang L, Liu Y, Gao L, Yang X, Zhang X, Xie S, Chen M, Wang Y-H, Li J and Shen Y (2022) Identification of Candidate Forage Yield Genes in Sorghum (Sorghum bicolor L.) Using Integrated Genome-Wide Association Studies and RNA-Seq. Front. Plant Sci. 12:788433. doi: 10.3389/fpls.2021.788433
Received: 02 October 2021; Accepted: 06 December 2021;
Published: 11 January 2022.
Edited by:
Frédéric Marsolais, Agriculture and Agri-Food Canada (AAFC), CanadaReviewed by:
Margaret Woodhouse, Agricultural Research Service, United States Department of Agriculture (USDA), United StatesDawei Xin, Northeast Agricultural University, China
Copyright © 2022 Wang, Liu, Gao, Yang, Zhang, Xie, Chen, Wang, Li and Shen. This is an open-access article distributed under the terms of the Creative Commons Attribution License (CC BY). The use, distribution or reproduction in other forums is permitted, provided the original author(s) and the copyright owner(s) are credited and that the original publication in this journal is cited, in accordance with accepted academic practice. No use, distribution or reproduction is permitted which does not comply with these terms.
*Correspondence: Jieqin Li, d2xobGpxQDE2My5jb20=; Yixin Shen, eXhzaGVuQG5qYXUuZWR1LmNu