- 1College of Agronomy, Jilin Agricultural University, Changchun, China
- 2Institute of Crop Science, Chinese Academy of Agricultural Sciences (CAAS)/National Key Facility for Crop Gene Resources and Genetic Improvement, Key Laboratory of Biology and Genetic Improvement of Triticeae Crops, Ministry of Agriculture, Beijing, China
- 3Soybean Research Institute, Jilin Academy of Agricultural Sciences/National Engineering Research Center for Soybean, Changchun, China
- 4Crop Resources Institute of Heilongjiang Academy of Agricultural Sciences, Harbin, China
- 5College of Modern Agriculture, Changchun Vocational Institute of Technology, Changchun, China
Abiotic stresses induce the accumulation of reactive oxygen species (ROS) and significantly affect plant growth. Protein phosphatase 2A (PP2A) plays an important role in controlling intracellular and extracellular ROS signals. However, the interaction between PP2A, ROS, and stress tolerance remains largely unclear. In this study, we found that the B′′ subunit of PP2A (PP2A-B′′) can be significantly induced and was analyzed using drought- and salt-induced soybean transcriptome data. Eighty-three soybean PP2A-B′′ genes were identified from the soybean genome via homologous sequence alignment, which was distributed across 20 soybean chromosomes. Among soybean PP2A-B′′ family genes, 26 GmPP2A-B′′ members were found to be responsive to drought and salt stresses in soybean transcriptome data. Quantitative PCR (qPCR) analysis demonstrated that GmPP2A-B′′71 had the highest expression levels under salt and drought stresses. Functional analysis demonstrated that overexpression of GmPP2A-B′′71 in soybeans can improve plant tolerance to drought and salt stresses; however, the interference of GmPP2A-B′′71 in soybean increased the sensibility to drought and salt stresses. Further analysis demonstrated that overexpression of GmPP2A-B′′71 in soybean could enhance the expression levels of stress-responsive genes, particularly genes associated with ROS elimination. These results indicate that PP2A-B′′ can promote plant stress tolerance by regulating the ROS signaling, which will contribute to improving the drought resistance of crops.
Introduction
Soybean [Glycine max (L.) Merr.] is one of the main plant proteins and lipid resources and plays an important role in our national agricultural production; its planting area ranks first among the four oil crops. However, climate change continues to threaten soybean growth, which has resulted in serious losses in yield, especially abiotic stresses such as drought, soil salinization, and high temperatures (Zhu, 2016). During plant evolution, this changing environment causes plants to develop a variety of sophisticated strategies to resist abiotic stresses. Among plant defense systems, the removal of reactive oxygen species (ROS) is important to improving plant tolerance. Research has revealed that abiotic stress can induce a high level of ROS in plants, which can cause plant cell damage (Alam et al., 2021) and reduce plant tolerance. Protein phosphatase 2A (PP2A) is involved in the ROS pathway to accurately regulate cell death and control metabolic changes (Rahikainen et al., 2016).
Protein phosphatase 2A consists of a structural/scaffold subunit (A), a well-conserved catalytic (C) subunit, and a regulatory (B) subunit (Durian et al., 2020). The B subunit interacts with both the C subunit and the A subunit (Xu et al., 2006). The B subunit determines the specificity of the PP2A enzyme and substrate and mediates the role of PP2A in signal transduction (Bheri and Pandey, 2019). Our research demonstrated that the B subunit contains four subfamilies, and which were named B55 (B), B56 (B′, PR61), PR72 (B′′), and PR93 (B′′′), while further analysis shows that these four subfamilies have different primary sequences and tertiary structures (Liu et al., 2014). Motifs analyses demonstrated that the B′′ subunit protein contains EF-hand motifs which are Ca2+-binding domain (Leivar et al., 2011; Uhrig et al., 2013), and further study found that the B′′ subunit protein contains at least two or more EF-hand repeat domains and that each motif contains 12 granulated loops flanked on both sides by a 12 residue alpha-helical domain. The binding of calcium ions promotes the conformational change of the EF-hand motif, leading to the activation or inactivation of its target protein activity (Skelton et al., 1994; Ikura, 1996; Yap et al., 1999). This indicates that GmPP2A-B′′ could be involved in the calcium signaling pathway. Calcium ions promote the connection between PP2A-B′′ and the A subunit, while the B′′ family related with dephosphorylation of VirE2-INTERACTING PROTEIN 1 (VIP1) in vitro. AtVIP1 protein was transferred from cytoplasm to nucleus under hypotonic conditions and depends on the calcium signaling pathway (Tsugama et al., 2012, 2019). This indicates that PP2A-B′′ plays important roles in maintaining Arabidopsis growth under hypo-osmotic conditions (Takeo and Ito, 2017; Tsugama et al., 2018, 2019; Yoon et al., 2021). It was reported that TaPP2AbB′′-α, a novel regulatory subunit B, was responsive to NaCl, polyethylene glycol 6000 (PEG6000), cold, and abscisic acid (ABA) at the transcriptional level, and overexpression of TaPP2AbB′′-α in transgenic Arabidopsis had more lateral roots under mannitol or NaCl treatment. These results indicated that TaPP2AbB′′-α involved in various stress responses and promoted lateral root growth under osmotic conditions (Liu et al., 2014). Our research indicates that PP2A participates in multiple signaling pathways.
Protein phosphatase 2A is involved in regulating the multi-node signal network in eukaryotes (Durian et al., 2016). This study demonstrated that PP2A was necessary for the dephosphorylation and activation of brassinazole-resistant 1 (BZR1) in Arabidopsis, which mediated regulation of the cascade reaction of brassinolide (BR) signal from cell surface receptor kinase to gene regulation in the nucleus (Tang et al., 2011). Under salt and osmotic stress conditions, ABA binds to PYR/PYL/RCAR (PYLs) and inhibits PP2A activity, which leads to increased PIN-FORMED (PIN) phosphorylation and consequently modulates directional auxin transport, subsequently adapting the root architecture (Li et al., 2020; Yu et al., 2021). Genetic studies in rice (Yu et al., 2005), proteomic, and metabolomic studies (Gabriele Siegll, 1990; Sabine et al., 1993) in plants demonstrated that PP2A controls metabolic changes and cell death elicited by intracellular and extracellular ROS signals, which contributes to the transcriptional and post-translational regulation of pro-oxidant and antioxidant enzymes in plants. However, the relationships between PP2A, ROS, and stress tolerance in soybean remain largely unclear. In this study, we systematically analyzed soybean PP2A-B′′ subunit family members and found that GmPP2A-B′′71 could improve drought and salt tolerance in transgenic soybeans by activating genes associated with the ROS elimination pathway. Our study provides a theoretical basis on the PP2A-mediated regulation ROS signaling to improve plant stress tolerance in soybean plants.
Materials and Methods
Identification of PP2A-B′′ Family Genes in the Soybean Genome
We did a protein BLAST search of the soybean genome in the Phytozome database1 to obtain 83 soybean PP2A-B′′ sequences. ExPASy ProtParam2 was used to analyze the isoelectric point (pI) of each PP2A-B′′ family member amino acid sequence and their molecular weights.
Chromosomal Distribution, Phylogenetic Analysis, and Multiple Sequence Alignment
Through the Phytozome database, we found that the 83 identified GmPP2A-B′′ genes were distributed across 20 soybean chromosomes; the distribution map of the 83 GmPP2A-B′′ family genes on the chromosomes was made by Map Gene 2 Chromosome v2 (MG2C) software.3 Eighty-three GmPP2A-B′′s and 43 AtPP2A-B′′s were used for multiple sequence alignment analysis to construct a phylogenetic tree using the maximum likelihood (ML) method. The phylogenetic tree was constructed using MEGA-X with 1000 Bootstrap replicates.
Gene Structure, Motif Composition, Cis-Acting Elements, and Tissue-Specific Expression Patterns
Gene Structure Display Server 2.0 (GSDS 2.0) software4 was used to determine the structures of the 83 GmPP2A-B′′ genes (Hu et al., 2015). Motif analysis of the 83 genes was performed using Multiple Em for Motif Elicitation (MEME)5 software (Bailey et al., 2009). We selected 1500 bp upstream of the ATG start codon of GmPP2A-B′′12/33/36/46/56/68/69/71/82 to screen for cis-acting elements using PlantCARE [PlantCARE, a database of plant promoters and their cis-acting regulatory elements (ugent.be)] (Magali Lescot et al., 2002). Cis-acting element diagrams were generated using GSDS 2.0. We used Soybase6 to identify the expression patterns of the 83 GmPP2A-B′′ genes in different tissues (Du et al., 2018), and the heat map was made using TBtools. The transcriptome data (PRJNA694374) for the various abiotic stressors was obtained in our previous study (Wang et al., 2021).
RNA Extraction and Quantitative PCR Analysis
Soybean variety “Williams 82” was used for quantitative PCR (qPCR) analysis. Soybean seeds were sown into flowerpots and after 2 weeks of growth, soybean seedlings were irrigated with 200 mM NaCl and 250 mM mannitol, respectively. A total of 0.1 g of soybean leaf blade tissue was collected at 0, 2, 4, 6, 8, 10, and 12 h after the 200 mM NaCl induced salt stress and 250 mM mannitol induced drought stress treatments, and total RNA was extracted using an RNA extraction kit (ZOMANBIO, ZP405, China). Double stranded cDNA was obtained using a cDNA synthesis kit (TIANGEN, KR118, China) (Le et al., 2011). qPCR reactions were performed on the ABI Prism 7500 real-time PCR system (Applied Biosystems, Foster City, CA, United States); the Actin (100500082) gene was used as the internal control (Jian et al., 2008). The expression levels of nine GmPP2A-B′′ genes were determined using the 2–Δ Δ CT method. All primers are listed in Supplementary Table 2.
Subcellular Localization Analysis
The full length coding sequence (CDS) of GmPP2A-B′′71 was cloned into vector 16318h-GFP, containing a green fluorescent protein (GFP) reporter gene, and the recombinant vector was transformed into the Top10 strain of Escherichia coli. After sequencing, the GmPP2A-B′′71-GFP recombinant plasmid and mCherry vectors (the signals of mCherry proteins were located in the nucleus) harboring nuclear-localized proteins were co-transformed into Arabidopsis protoplasts by the PEG4000-mediated method (Yoo et al., 2007). GFP signals of protoplasts were observed using a laser confocal microscope (Carl Zeiss LSM 700, Germany) after 16 h of dark induction at room temperature.
Transformation of Arabidopsis and Propagation of Positive Seedlings
The CDS of GmPP2A-B′′71 was cloned into vector pCAMBIA1302 to construct recombinant vector pCAMBIA1302-GmPP2A-B′′71. After sequencing, the recombinant vector was transformed into Agrobacterium tumefaciens strain GV3101 by the freeze-thaw method. Agrobacterium-mediated inflorescence impregnation was used to generate transgenic Arabidopsis plants. Arabidopsis plants (ecotype Col-0) were grown under normal conditions (16:8 h light/dark photoperiod; 23°C; 50% relative humidity) until flowering. A. tumefaciens carrying the recombinant vector was cultivated in 50 mL of LB liquid culture medium with antibiotics (rifampicin and kanamycin). When the optical density (OD) of the culture reached 0.6–0.8, the culture was spun down and re-suspended in 1/2 MS liquid medium to generate the Agrobacterium impregnation solution to be used for Arabidopsis transformation, according to the methods described by Yu et al. (2018).
The T0 generation of transgenic Arabidopsis plants were screened on 1/2 MS solid medium supplemented with hygromycin (30 mg/L). After screening for 14 days, positive transgenic Arabidopsis seedlings were transferred into soil for growth. The T3 generation of transgenic Arabidopsis plants were used for qPCR analysis to determine the expression level of GmPP2A-B′′71. After identification, the T4 positive generation of transgenic Arabidopsis seedlings were used in experiments.
Salt and Drought Tolerance of Transgenic Arabidopsis Plants
The seeds of three homozygous GmPP2A-B′′71 transgenic Arabidopsis lines and wild-type (WT) plants were sown into flowerpots. Three weeks old of GmPP2A-B′′71 transgenic Arabidopsis and WT plants were used for stress tolerance analysis. For salt tolerance experiments, the 3 week old plants were irrigated with a 250 mM NaCl solution. After 5 days of salt treatment, leaf samples were collected for measurement of relative electrolyte leakage. After 7 days of salt treatment, phenotypes were observed and survival rates were calculated. In addition, we used different concentrations of NaCl (100 and 125 mM) for salt stimulation to observe the root system of GmPP2A-B′′71 transgenic and WT Arabidopsis seedlings. The seeds of GmPP2A-B′′71 transgenic and WT Arabidopsis plants were disinfected by sodium hypochlorite (0.9%), transferred to 1/2 MS solid medium for 3 days of low temperature treatment (4–8°C), then transferred to normal growth conditions. After 7 days of growth, the seedlings of GmPP2A-B′′71 transgenic and WT Arabidopsis plants were transferred onto 1/2 MS solid medium supplemented with different concentrations of NaCl (100 and 125 mM) for salt stress treatment. After 7 days of treatment, the fresh weight and root lengths were measured.
For drought experiments, watering was withheld from 3 week old GmPP2A-B′′71 for 10 days, after which leaf samples were taken for measurement of relative electrolyte leakage. After 14 days of drought treatment, phenotypes were observed and the soil water content of each flowerpot was measured; the resulting data is presented in Supplementary Table 3. Survival rates were also calculated. The seeds of GmPP2A-B′′71 transgenic and WT Arabidopsis plants were disinfected with sodium hypochlorite (0.9%), transferred to 1/2 MS solid medium for 3 days of low temperature treatment (4–8°C), then transferred to normal growth conditions. After 7 days of growth, the seedlings of GmPP2A-B′′71 transgenic and WT Arabidopsis plants were transferred to 1/2 MS solid medium supplemented with different concentrations of PEG6000 (4 and 6% PEG6000) to simulate drought stress. After 7 days of treatment, the fresh weight and root lengths were measured. Experiments were repeated three times. Each experimental repetition included 5 groups, and each group contained 10 each of GmPP2A-B′′71-OE1, GmPP2A-B′′71-OE2, GmPP2A-B′′71-OE3, and WT (Col-0) plants. All plants of were cultured at 25°C under a 16:8 h light/dark photoperiod in a greenhouse.
Agrobacterium rhizogenes Mediated Transformation of Hairy Root Soybean
Seeds of soybean variety “Williams 82” were sown into flowerpots. The CDS of GmPP2A-B′′71 was cloned into the pCAMBIA3301 vector by homologous recombination to create the OE construct. To create the GmPP2A-B′′71 RNA interference (RNAi) construct, 200 bp of the GmPP2A-B′′71 CDS containing a hairpin structure was selected as the inducer sequence, artificially synthesized (BGI China), and cloned into the pCAMBIA3301 vector. The overexpressing-, interfering-, and empty-vector (EV-control) were transformed into Agrobacterium rhizogenes strain K599. The resulting A. rhizogenes strains were cultured for 3 days in a 28°C incubator, then used to transform soybean plants using the methods described by Kereszt et al. (2007). In brief, A. rhizogenes carrying the respective recombinant vectors were injected into 7 day old soybean plants, 1–2 mm below the cotyledonary node. After injection, soybean seedlings were kept in darkness for 12 h of induction, then grown under normal conditions (25°C; 16:8 h light/dark) for 3 weeks to encourage hairy root growth; after 3 weeks hairy roots grew up to about 5 cm. The part 1 cm below the inoculation site was removed, and soybean seedlings with hairy roots were transferred into new flowerpots to generate mature soybean plants with GmPP2A-B′′71 transgenic hairy roots.
Analysis of Salt and Drought Tolerance of Transgenic Soybean Plants
In salt tolerance experiments, EV-control and GmPP2A-B′′71 transgenic soybean plants with hairy roots were irrigated with a 250 mM NaCl solution. After 3 days of salt treatment, 0.1 g of hairy root samples were collected. The malondialdehyde (MDA) and proline (Pro) contents of samples were measured using the MDA and Pro Assay kits (Solarbio, China), and the catalase (CAT) and peroxidase (POD) activities of the samples were measured using the Micro Catalase (CAT) and Micro Peroxidase assay kits (Solarbio, China), respectively, following the manufacturers protocols. After 1 week of salt stress induction, phenotypes were observed and chlorophyll content was measured.
In drought tolerance experiments, water was withheld from EV-control and GmPP2A-B′′71 transgenic soybean plants with hairy roots for 10 days of drought treatment, after which hairy root samples were collected and the MDA and Pro contents, and CAT and POD activities were measured as described. After 14 days of drought treatment, phenotypes were observed and chlorophyll and soil water contents were measured. Soil water content data is presented in Supplementary Table 3. Experiments were repeated five times. Each experimental repetition included three groups, with each group containing five each of GmPP2A-B′′71-RNAi, EV-control, and GmPP2A-B′′71-OE soybean plants. All soybean plants were cultured at 25°C under a 16:8 h light/dark photoperiod in a greenhouse.
Measurement of Soil Water Content
For drought tolerance experiments, soybean plants were grown in 15 cm diameter flowerpots containing 315.16 ± 0.1 g of soil (1:1 ratio of soil to vermiculite) and watered with 300 mL of water. To determine the soil water content of soil under normal growth conditions, soil samples were collected after 3 days of growth and the weight was recorded (W1), after which the samples were baked at 150°C until completely dry, and the weight was again recorded (W2); the soil water content was calculated using the following formula: (W1–W2) × 100/W1. After 14 days of no watering, soil samples were taken again to determine soil water content under drought conditions, as described for the samples taken under normal growth conditions.
Nitro Blue Tetrazolium Staining
To assess the degree of ROS accumulation of GmPP2A-B′′71-RNAi, EV-control, and GmPP2A-B′′71-OE soybean plants under salt and drought treatments, root tips and leaves of stress-induced plants were collected and soaked in Nitro Blue Tetrazolium (NBT) solution for 30 min and overnight, respectively. After 30 min of staining, the stress-induced root tips were observed under the microscope (LEICA M165 FC, Germany). Leaves were transferred to a 7:3 (v/v) acetone/glycerol decolorization solution and boiled (100°C) for 1 h then observed under the integrated microscope.
Measurement of Chlorophyll Content and Relative Electrolyte Leakage
To measure the chlorophyll content in transgenic soybean leaves, 0.1 g of leaf tissue was sampled from each transgenic soybean line (GmPP2A-B′′71-OE, EV-control, and GmPP2A-B′′71-RNAi), pulverized with a mortar and pestle, then incubated in 1 mL of 80% acetone solution for 12 h in darkness. The chlorophyll content of the samples was then measured using a Varioskan LUX enzyme-labeling measuring instrument (Thermo Fisher Scientific, United States) at wavelengths of 665 and 649 nm; the acetone solution alone was used as a blank control. Measurements were taken from three biological replicates.
A total of 0.1 g of hairy root samples were collected from the three soybean lines, cultivated under natural growth conditions and under drought and salt treatments, into a test tube containing 20 mL of distilled water, and then vacuumized for 30 min. The sample tubes were then stand for 2 h to measure the initial electric conductance (S1) (25°C). The hairy root samples were then heated at 100°C for 30 min, then allowed to cool to room temperature (25°C) to determine the final electric conductance (S2). The relative electrolyte leakage was evaluated as: REC = S1 × 100/S2.
Statistical Analysis
SPSS 19.0 software (IBM Corp., Armonk, NY, United States) was used to compare the means of each treatment group using one-way ANOVA and t-tests. Differences were considered significant when at p < 0.05. Results are expressed as the mean ± standard deviation (SD).
Results
Identification of Soybean PP2A-B′′ Family Members
We identified 83 GmPP2A-B′′ members (Supplementary Table 1) and named GmPP2A-B′′01 to GmPP2A-B′′83 according to their chromosomal positions and Pfam databases (Figure 1). A total of 83 GmPP2A-B′′ genes were distributed in 20 chromosomes of soybean, and chromosome 4 contained the largest number with 8 GmPP2A-B′′ genes.
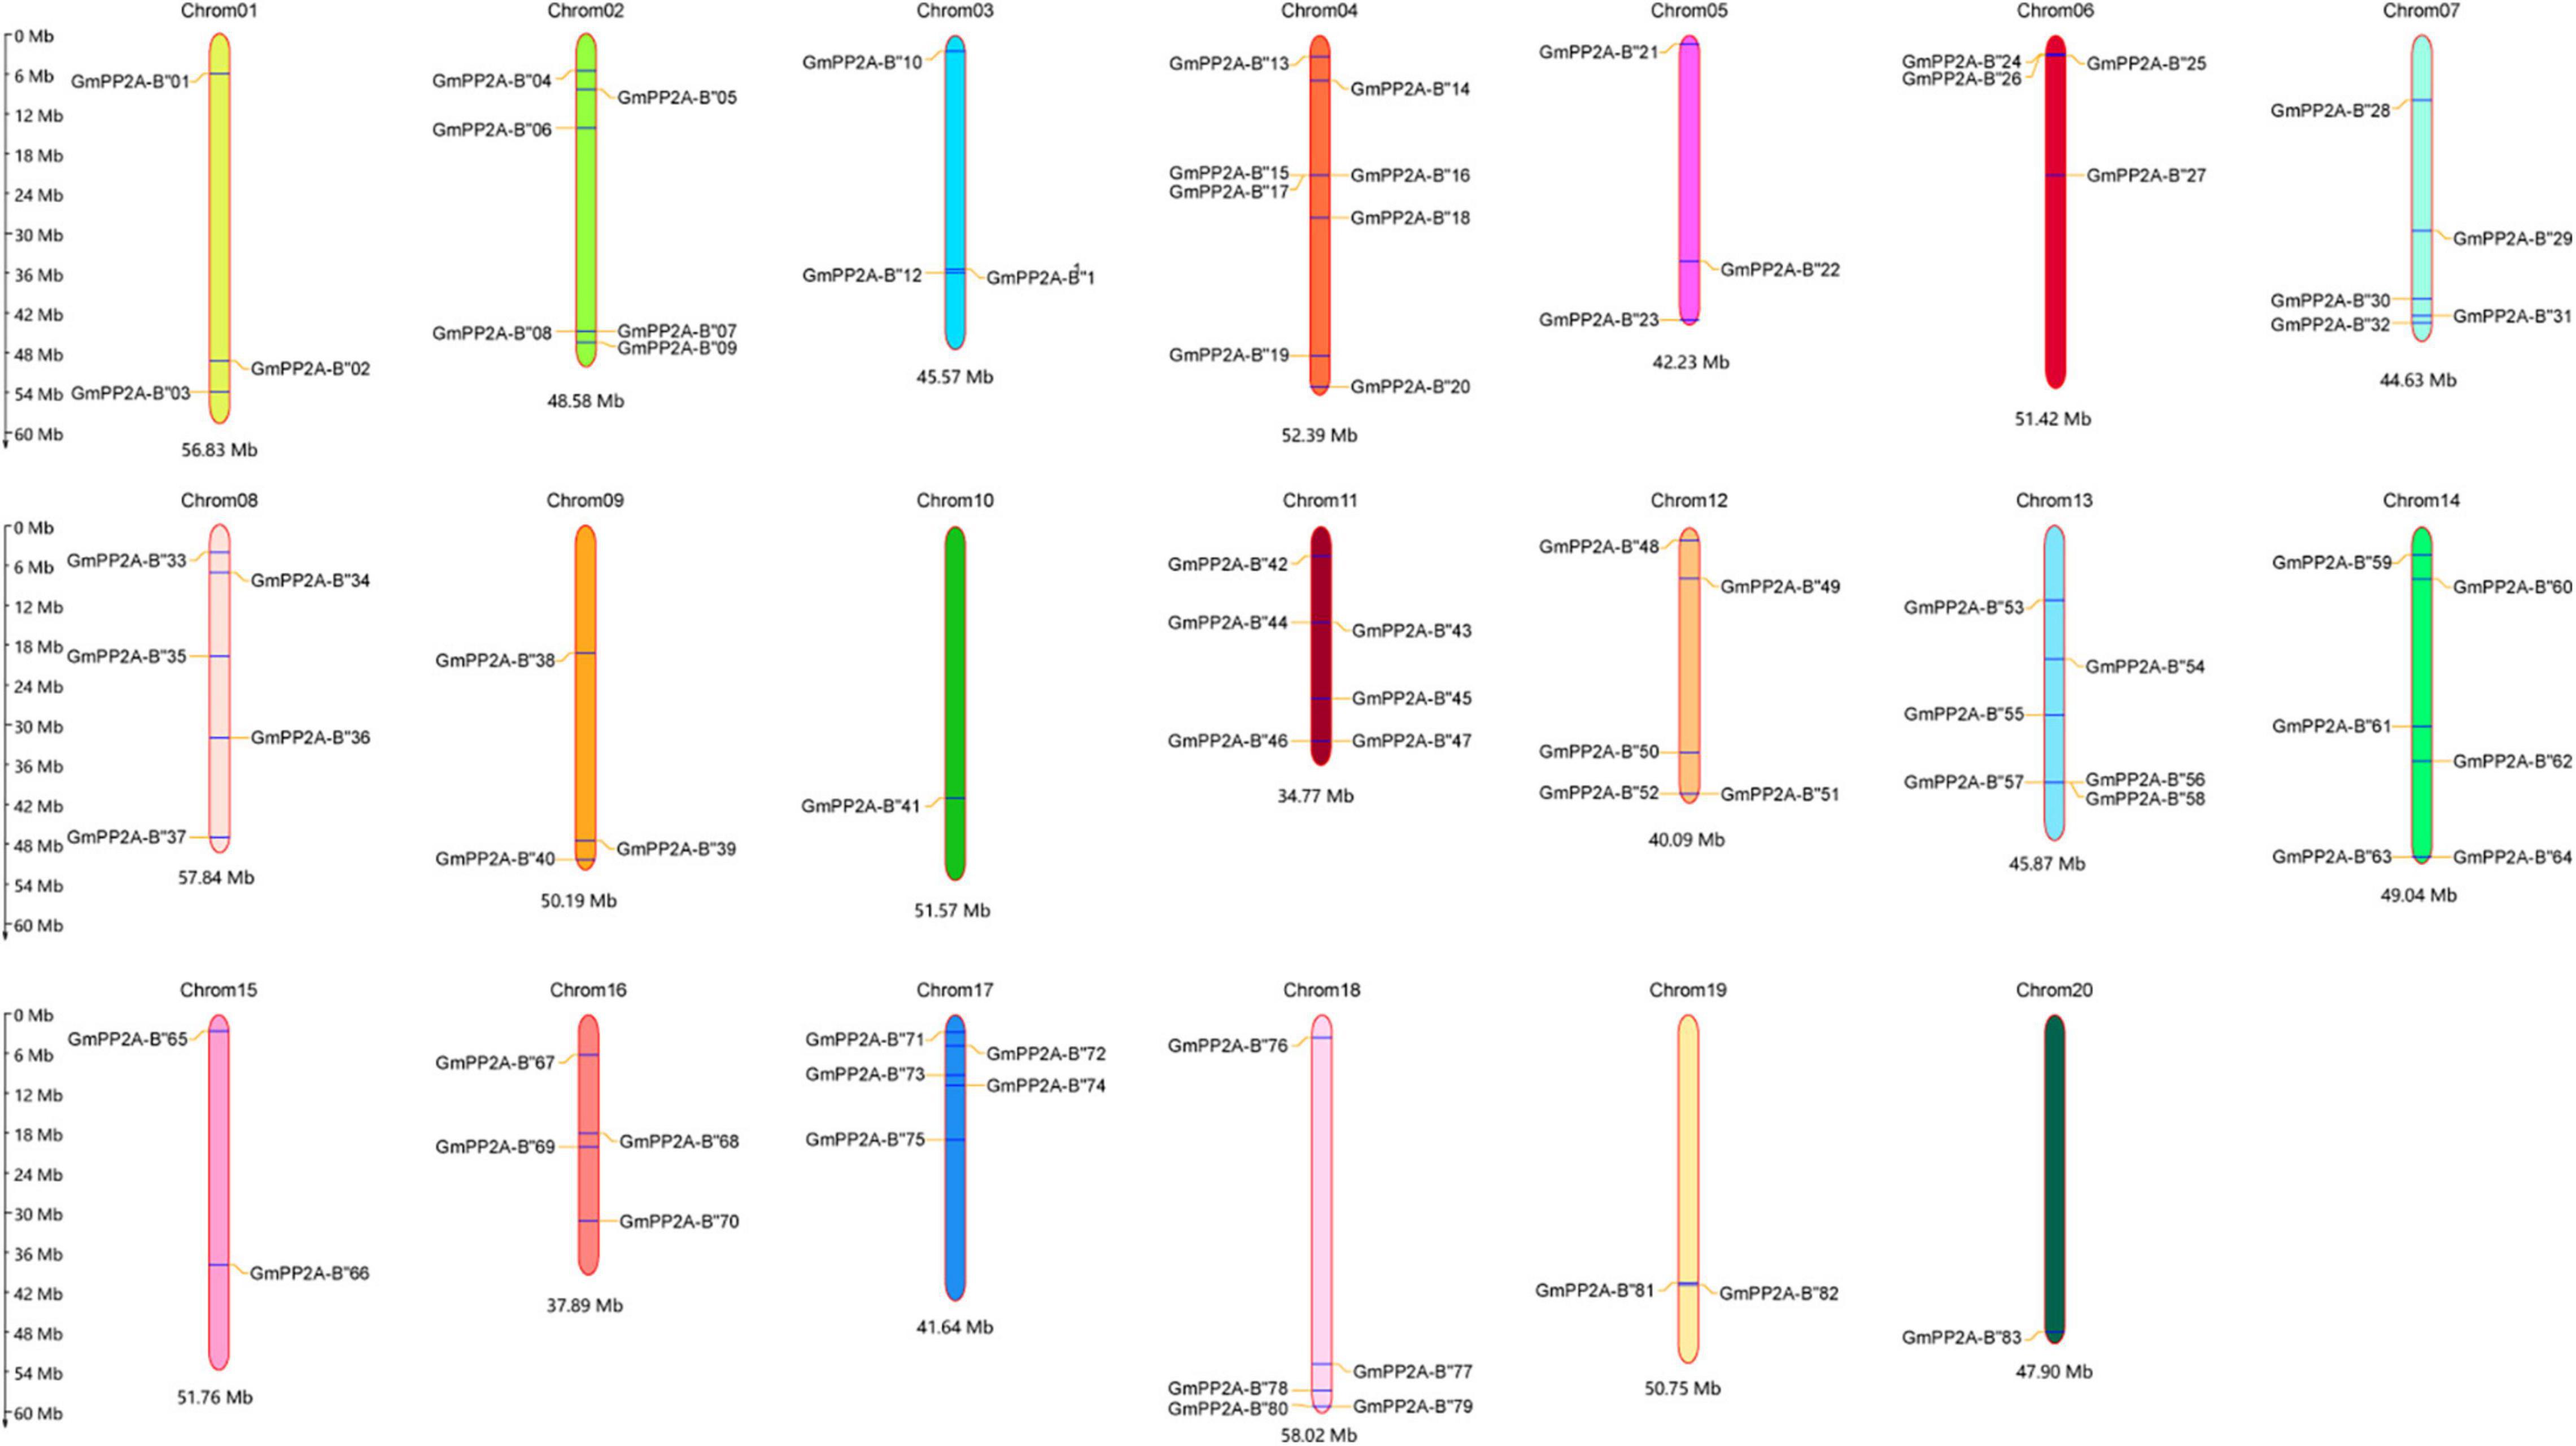
Figure 1. The location of 83 GmPP2A-B′′ genes on the soybean chromosome. The scale bar on the left indicates the size of the chromosomes.
Forty-three AtPP2A-B′′ genes were identified in Arabidopsis, and PP2A-B′′ family genes from soybean and Arabidopsis were used to construct a phylogenetic tree using the ML method with MEGA-X software. Our results showed that soybean PP2A-B′′ family members were divided into 10 subgroups (I–X) (Figure 2). Group X contained the largest number of PP2A-B′′ member genes than other subgroups, including 13 GmPP2A-B′′ genes and 7 AtPP2A-B′′ genes. Group V had the least number of PP2A-B′′ member genes; it contained two GmPP2A-B′′ genes and two AtPP2A-B′′ genes (Figure 2).
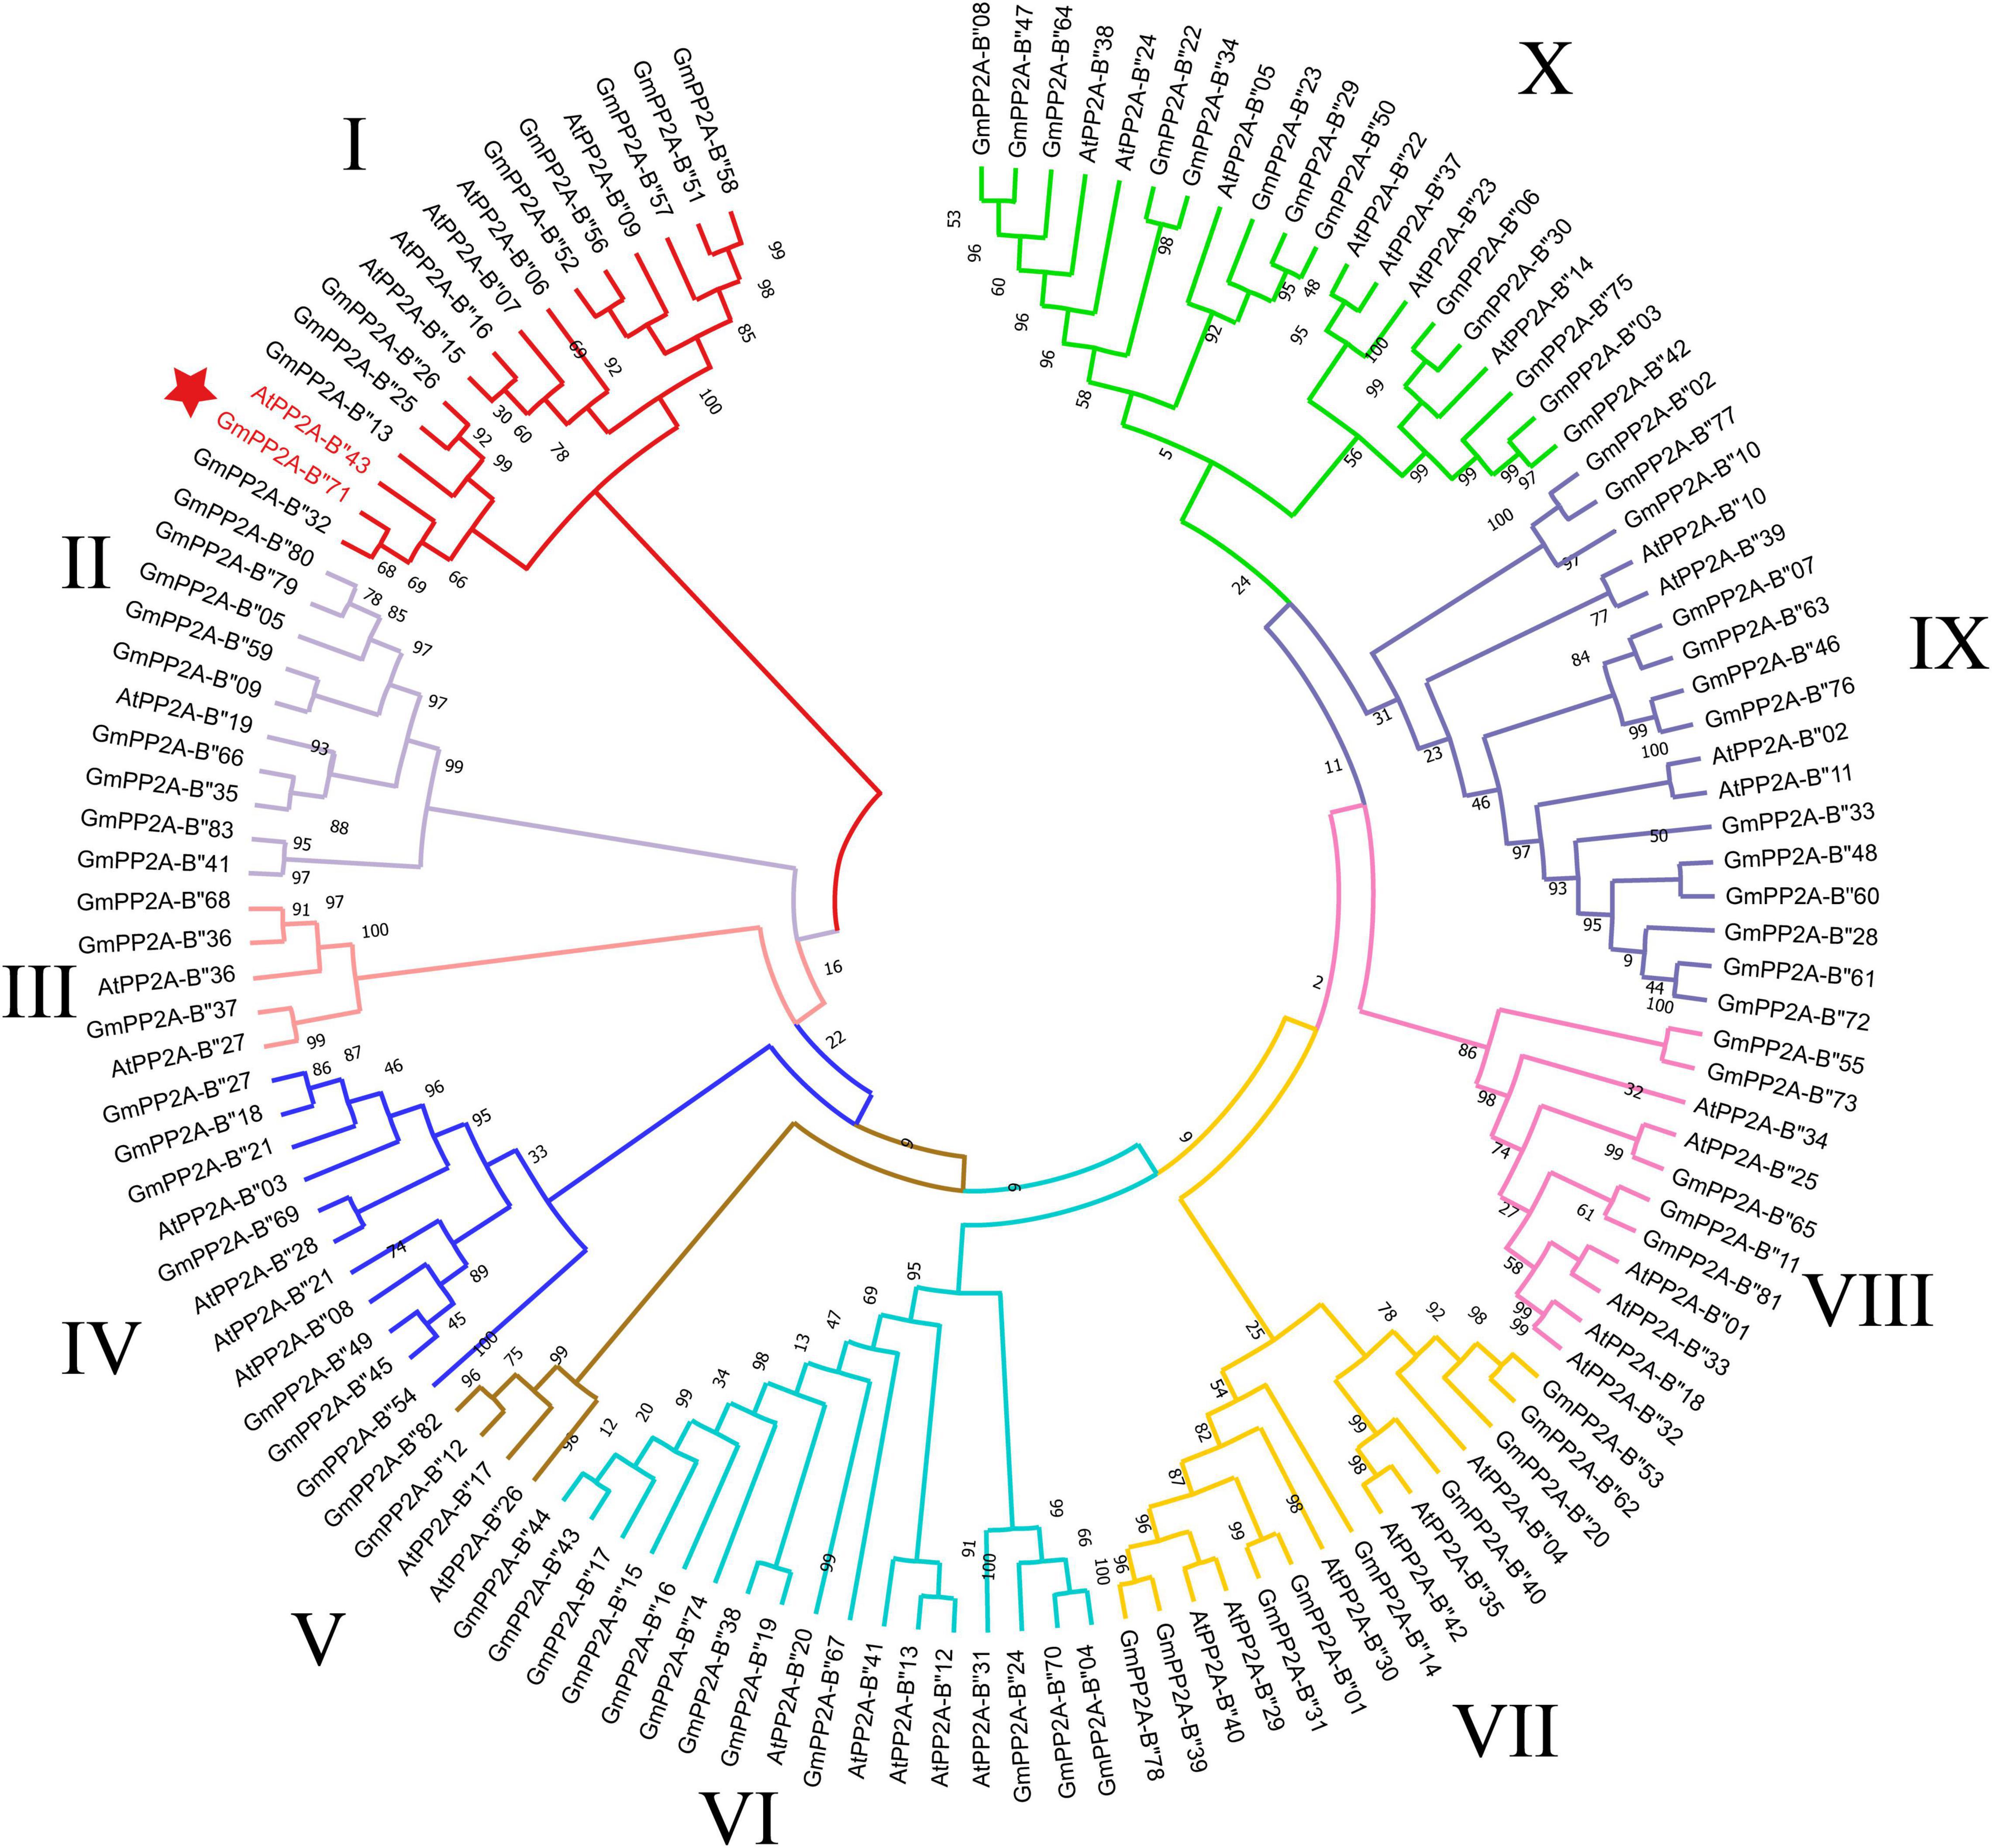
Figure 2. A total of 83 GmPP2A-B′′s and 43 AtPP2A-B′′s were used for multiple sequence alignment analysis to construct a phylogenetic tree with the method of ML. The 10 groups are represented by different colors.
The gene structures showed that 12 GmPP2A-B′′ members contained introns including GmPP2A-B′′31/36/37/48/50/51/52/56/57/58/61/68 (Figure 3). We identified 10 motifs in 83 GmPP2A-B′′ family members, 11 GmPP2A-B′′ members contained 2 motifs (the least number of motifs), and GmPP2A-B′′57 contained the most motifs with 8 (Figure 4).
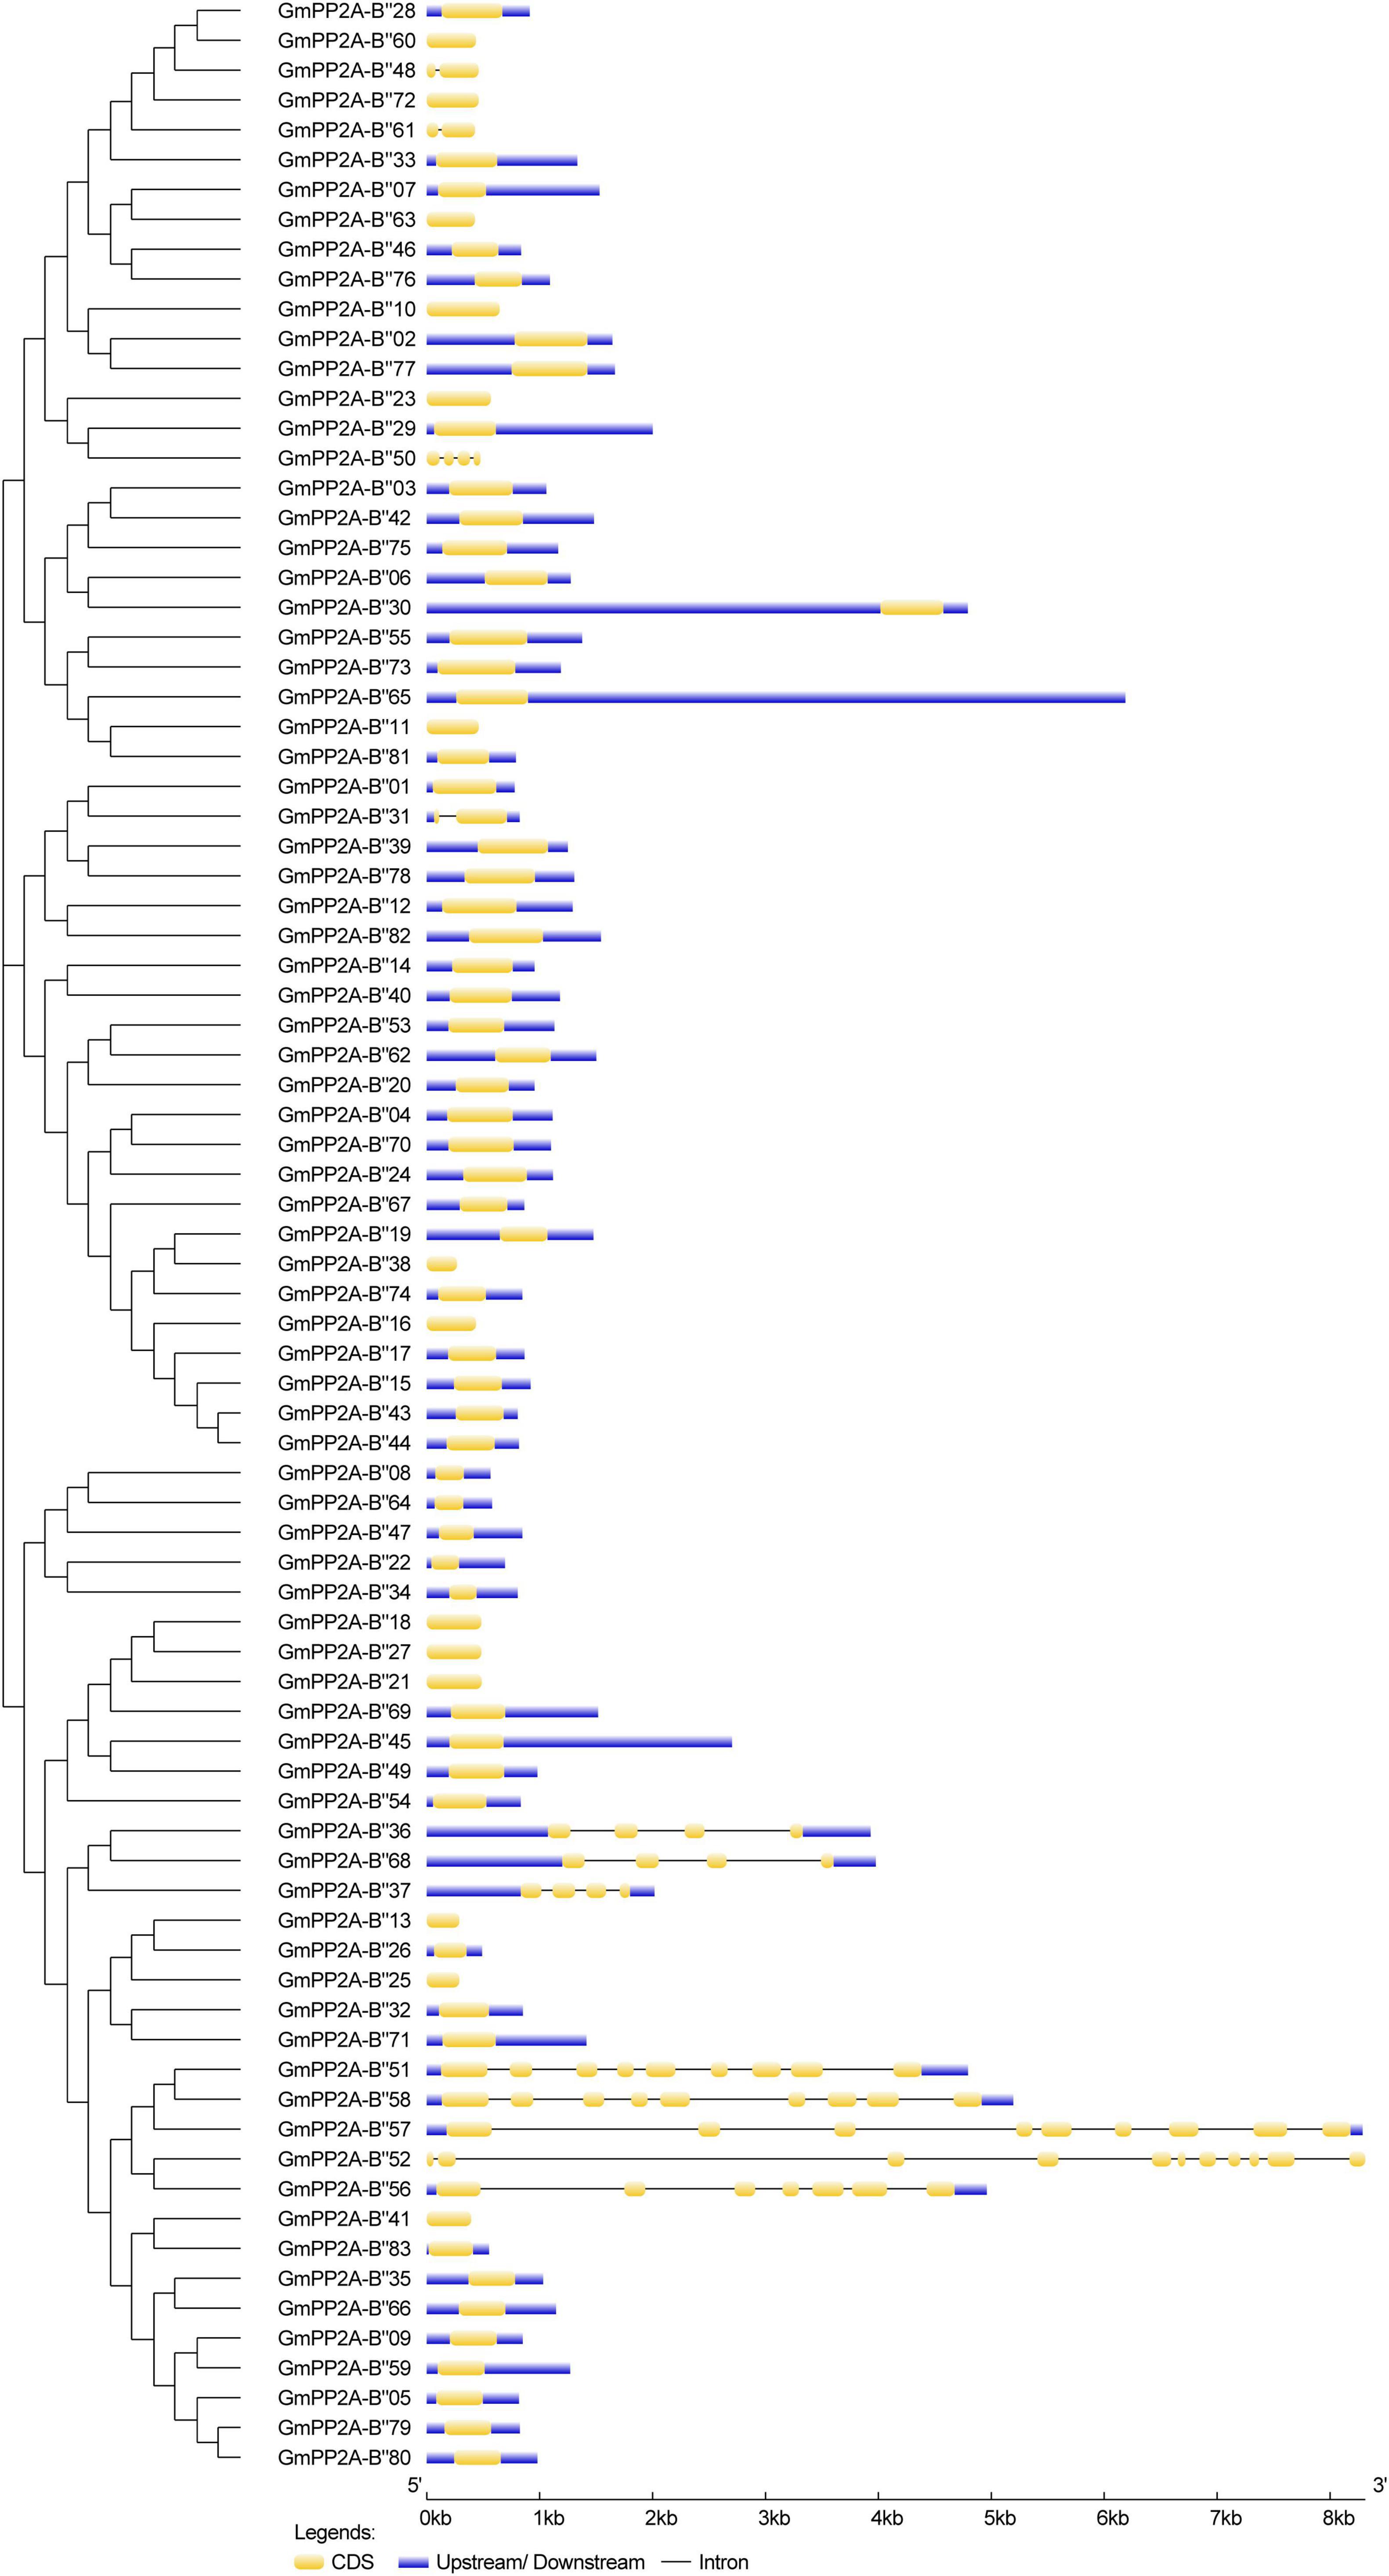
Figure 3. The gene structures of 83 GmPP2A-B′′ family genes. The schematic diagram indicates the gene structure. Introns are indicated by black lines, exons are indicated by yellow boxes, and upstream/downstream are indicated by blue boxes. The lengths of introns and exons of each gene are displayed proportionally.
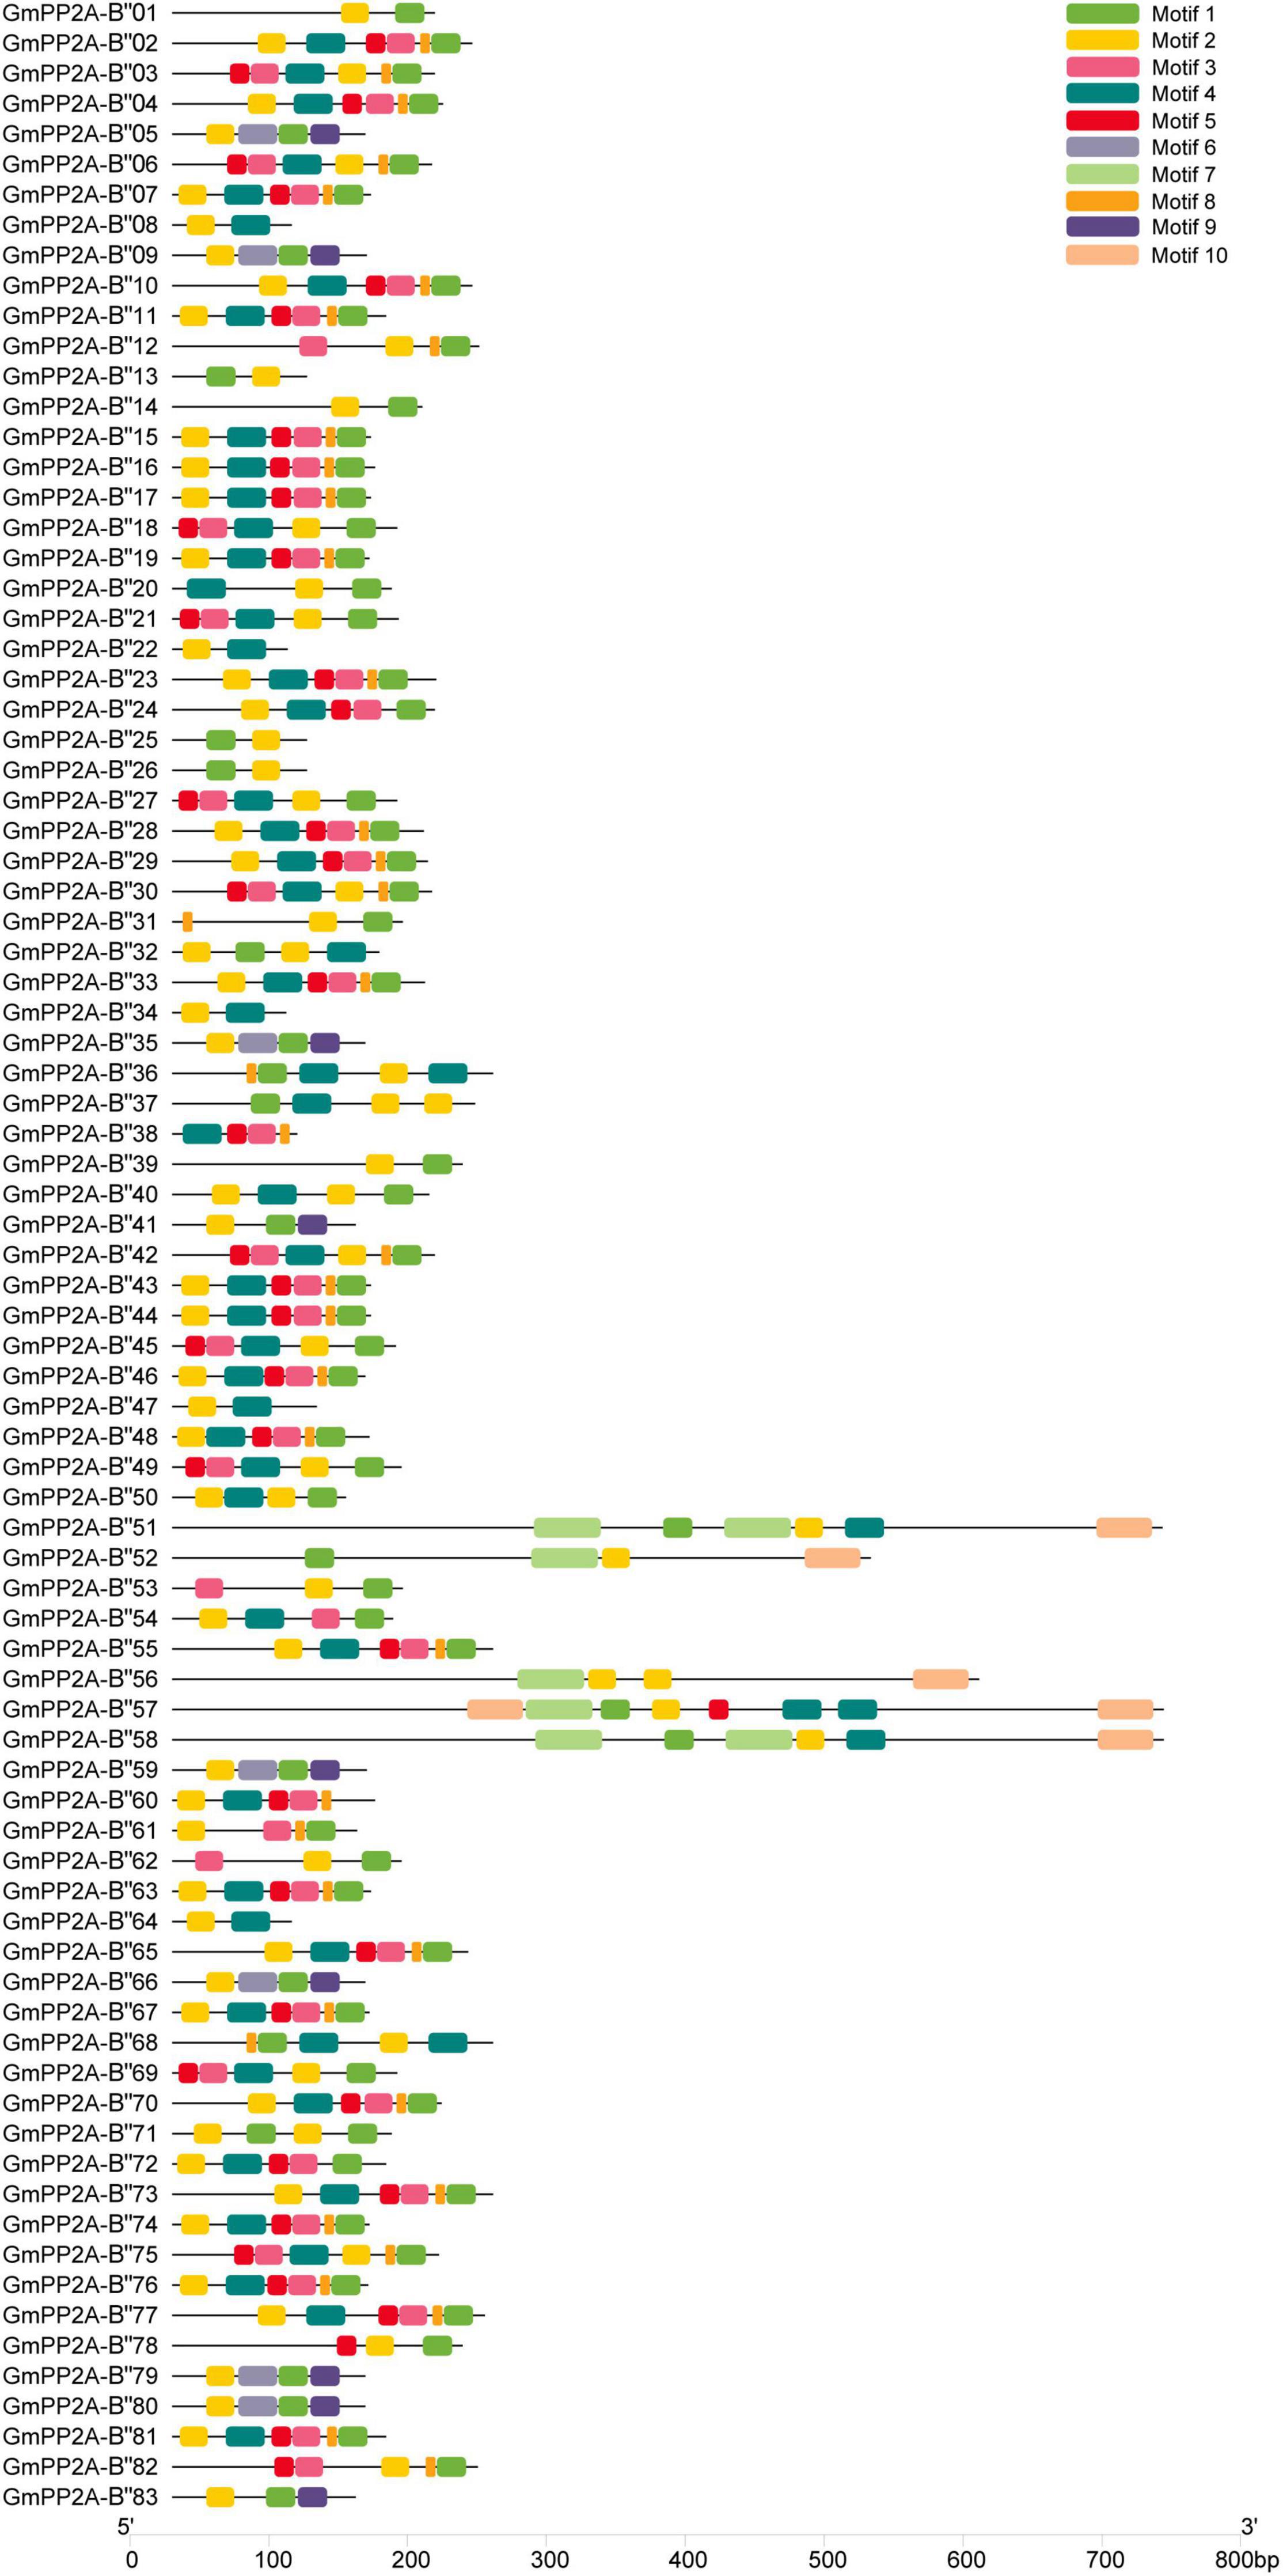
Figure 4. Putative motifs in each GmPP2A-B′′ protein. The phylogenetic tree was constructed using MEGA-X software. Conserved motifs were identified using MEME. Ten boxes of different colors represent different putative motifs. The scale at the bottom estimates the length of each protein.
Tissue-Specific Expression Patterns of GmPP2A-B′′ Genes
To analyze the function of GmPP2A-B′′ genes in plant stress tolerance, we performed RNA-seq analysis on soybean plants which were treated with drought, salt, or full irrigation conditions. RNA-seq analysis demonstrated 26 GmPP2A-B′′ genes with significantly up-regulated expression under salt and drought stresses, respectively (Figure 5). These results indicated that 26 GmPP2A-B′′ could be involved in response to abiotic stress. The expression levels of these 26 genes in different tissues were downloaded from the Phytozome website and the heat map was constructed by TBtools. Our results demonstrated that the expression levels of GmPP2A-B′′71 in soybean roots and leaves were significantly higher than in other 25 GmPP2A-B′′ genes. GmPP2A-B′′82 had a higher expression level in flowers than the other 25 GmPP2A-B′′ genes, and it also had high expression levels in the hairy roots, leaves, nodules, and shoots. Of these 26 GmPP2A-B′′ genes, GmPP2A-B′′36 had the highest expression in the seed, while GmPP2A-B′′56 had higher expression levels in the pods, flowers, roots, hairy roots, and shoots than other tissues (Figure 6). GmPP2A-B′′12 was highly expressed in the leaves, nodules, pods, and shoots. GmPP2A-B′′33/46/68/69 were highly expressed in the leaves, pods, flowers, and leaves, respectively (Figure 6). As such, these GmPP2A-B′′ genes were selected for further study.
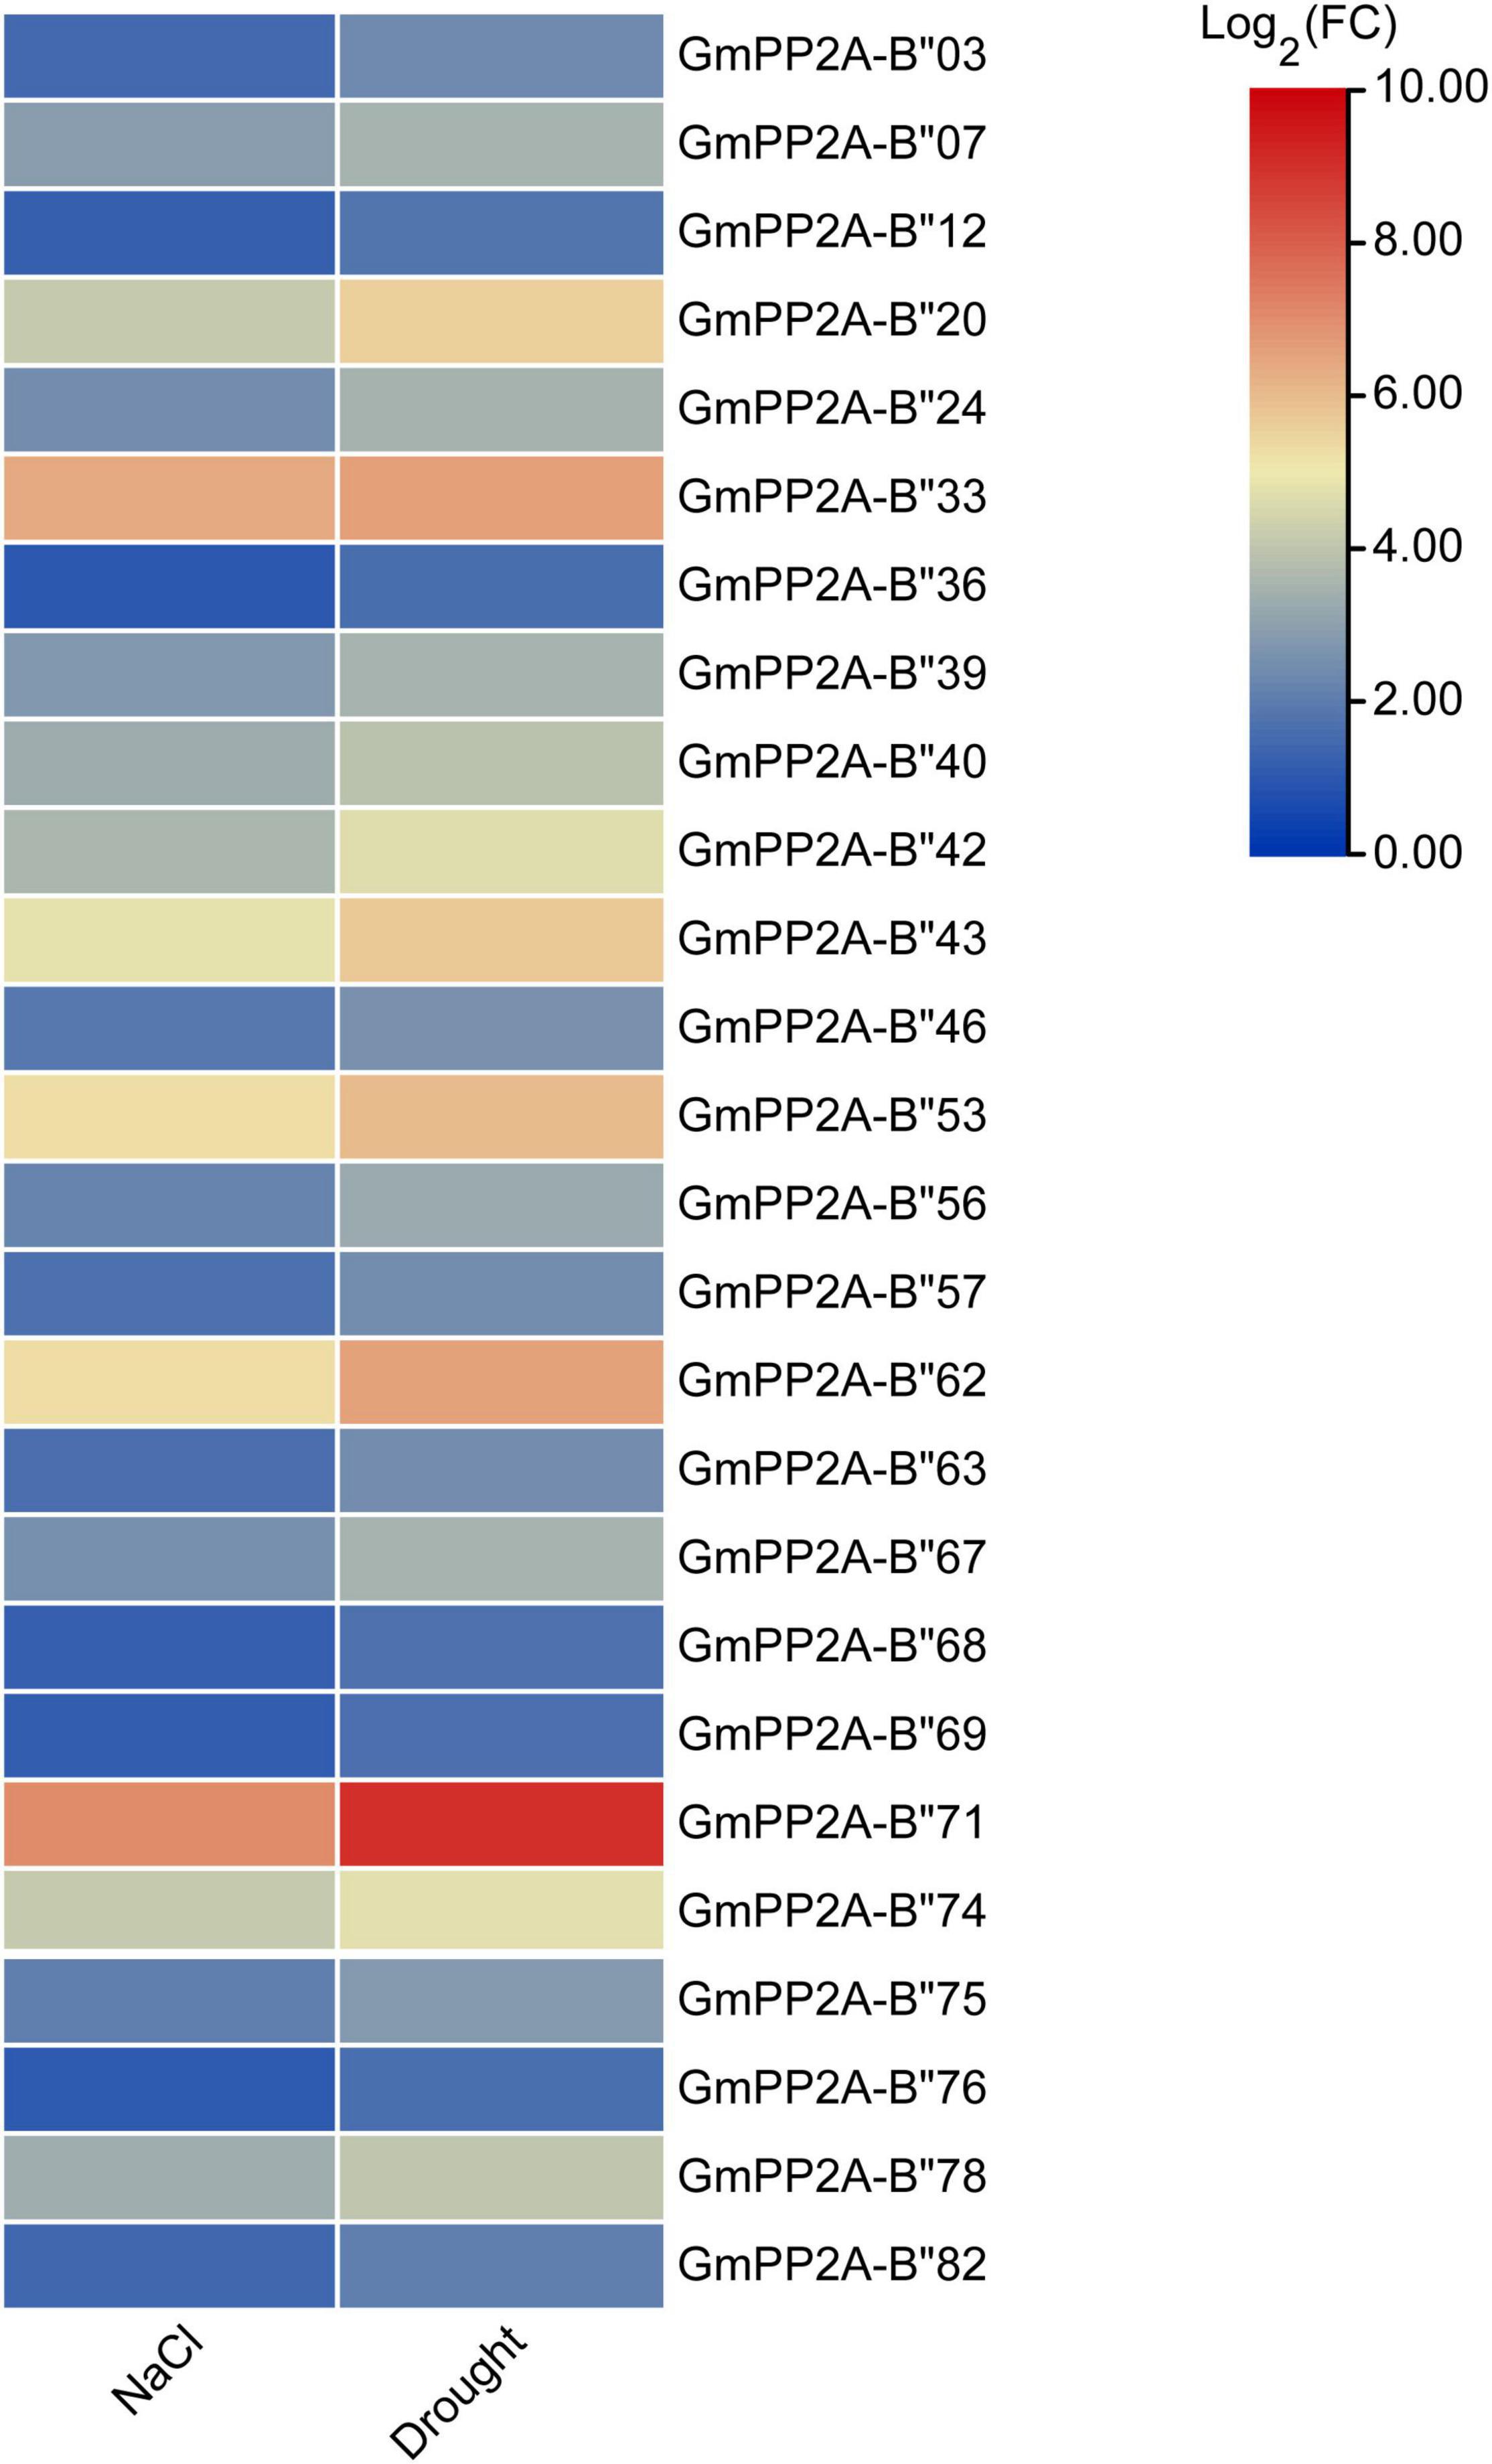
Figure 5. Heat map of the expression abundances (in log2-based transcriptome data) of 26 GmPP2A-B′′ genes under drought and salt stress conditions. The expressions were represented by the different colors. Red means higher expression; blue means lower expression.
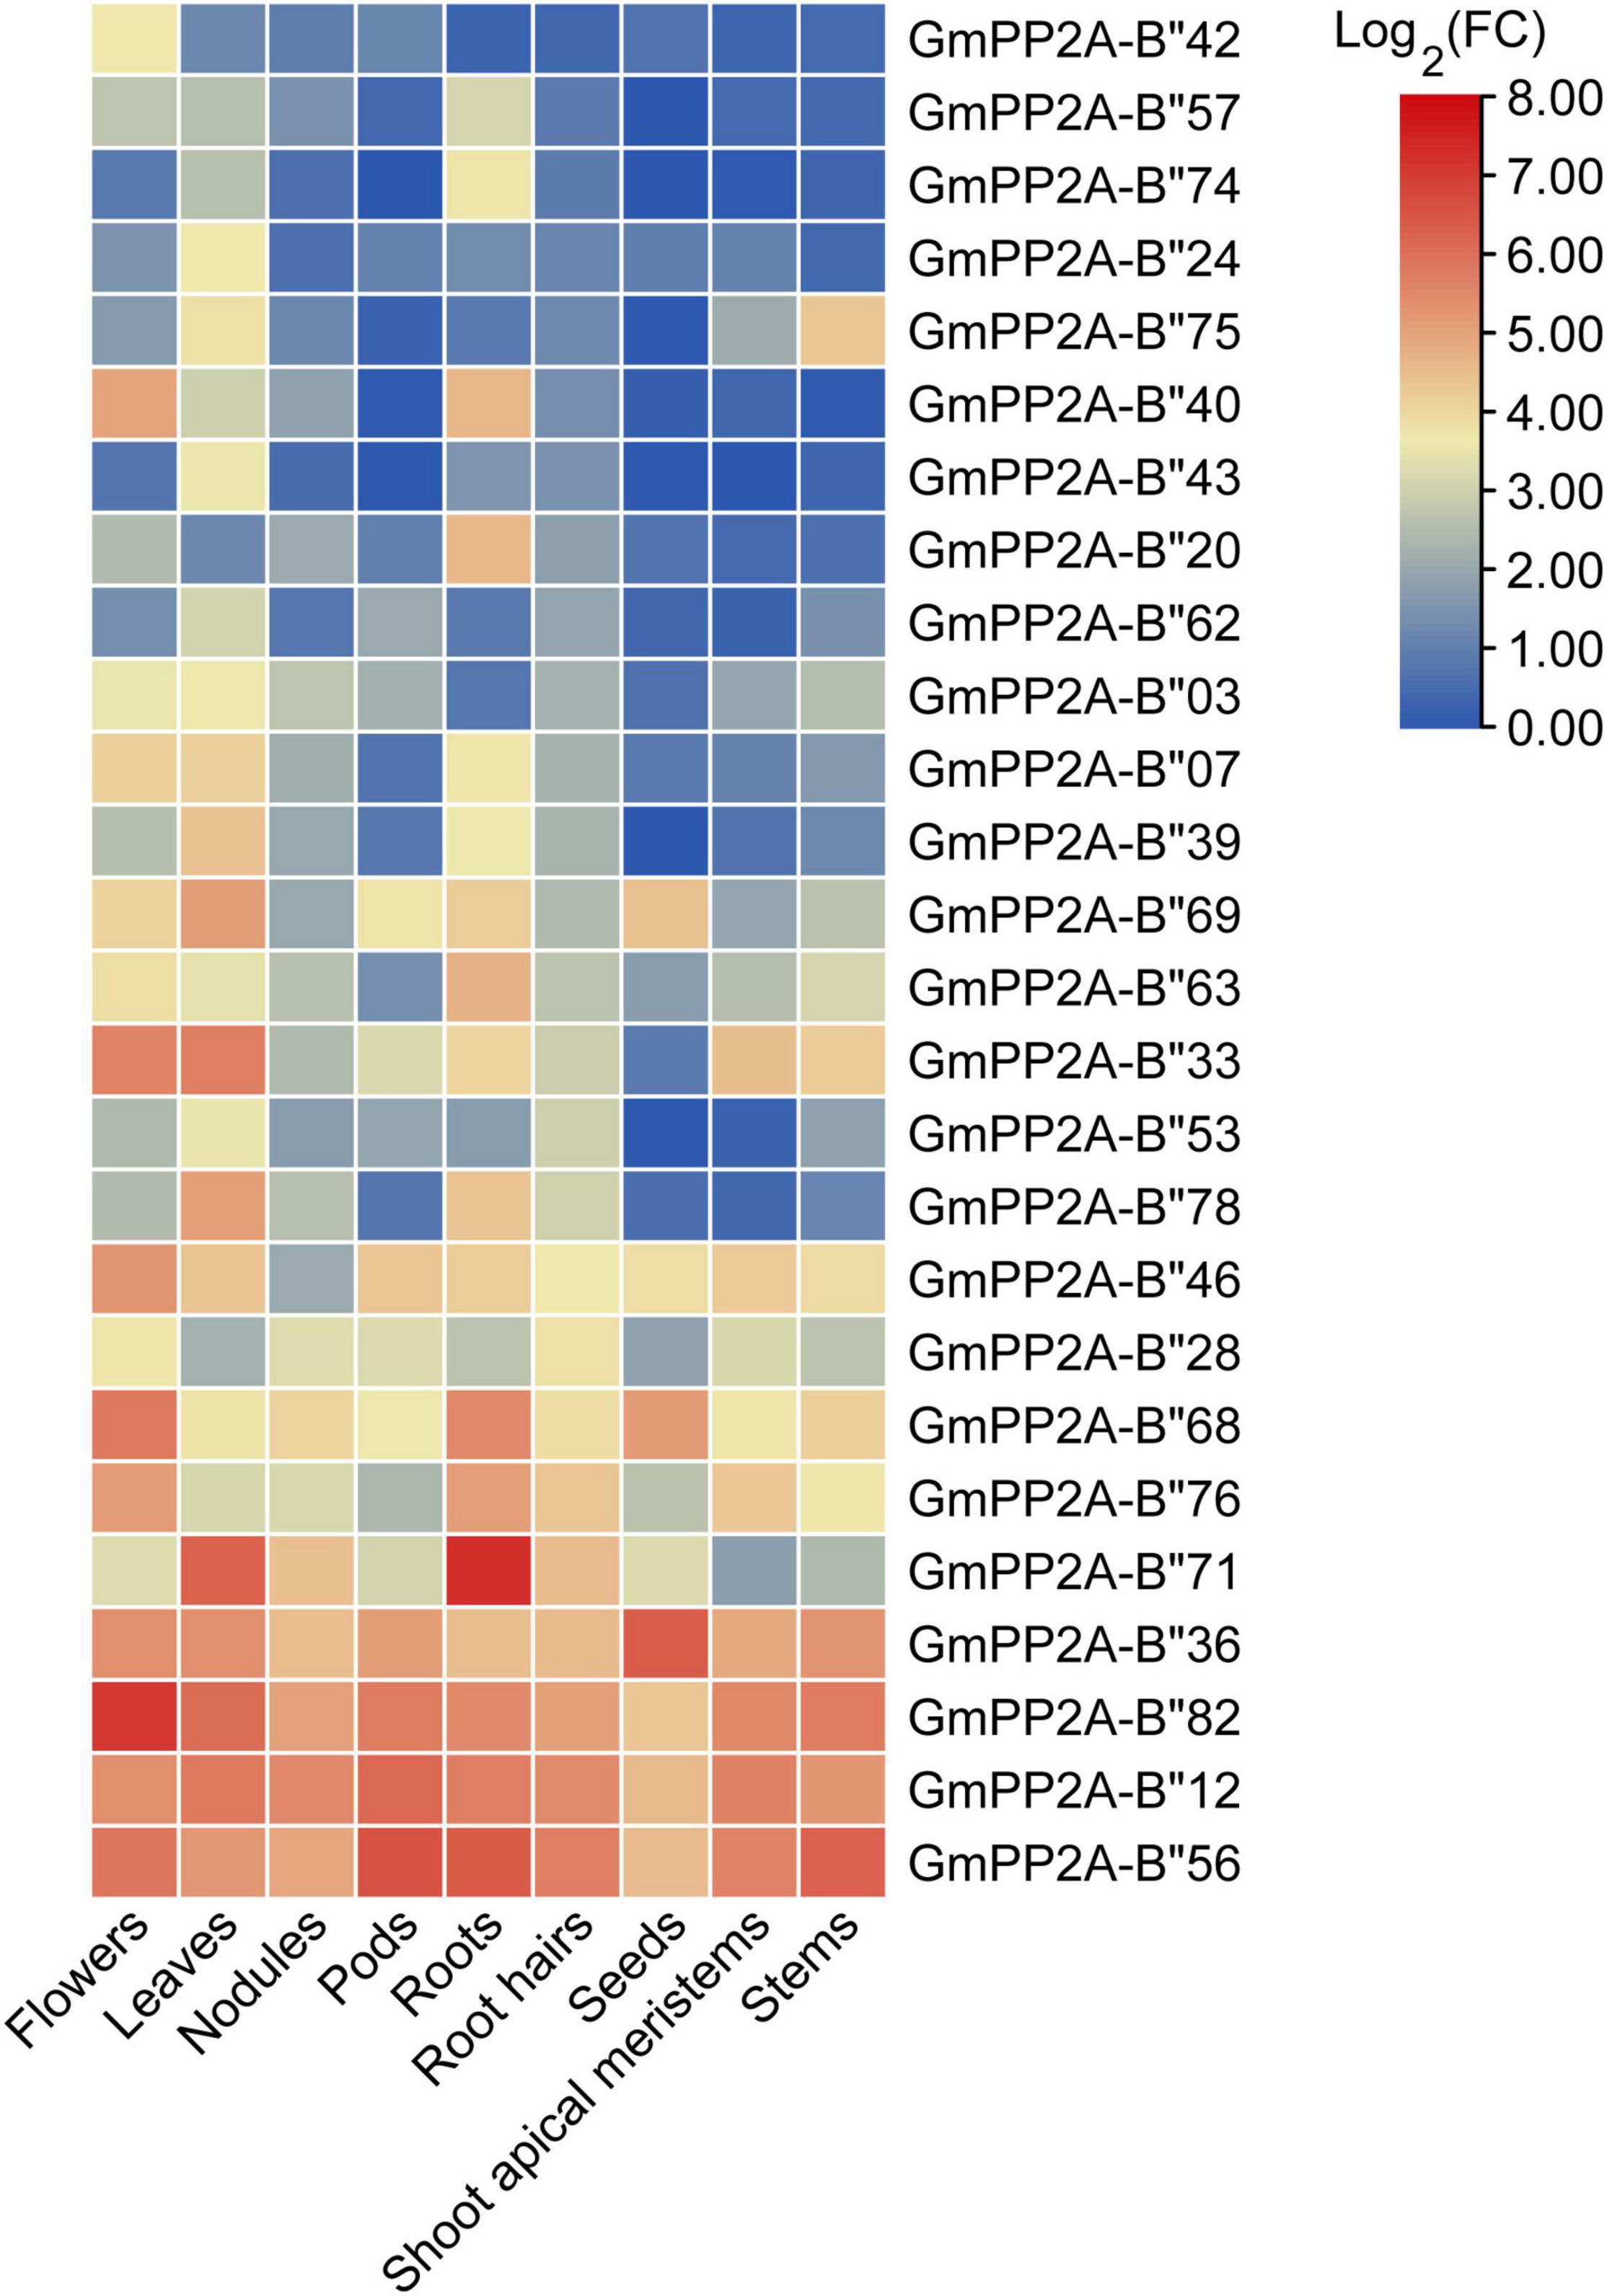
Figure 6. Heat map of the expression profiles of 26 GmPP2A-B′′ genes in different soybean tissues. The expression data of 26 GmPP2A-B′′ genes in different tissues were obtained from Phytozome. Expression levels in nine different tissues are shown: flowers, leaves, nodules, pods, roots, root hairs, seeds, shoot apical meristems, and stems.
Cis-Acting Element Analysis of Nine GmPP2A-B′′ Genes
To further analyze the relationships between these nine GmPP2A-B′′ genes and abiotic stress responses, we analyzed 1500 bp upstream of the start codon in promoters of nine GmPP2A-B′′ genes using PlantCARE. Our results indicated that some cis-acting elements, such as MYC, MYB, MBS, TC-rich, TCA, CGTCA-motif, and ABRE, are related to stress responses by analyzing their promoter sequence (Figure 7). Further analysis demonstrated that GmPP2A-B′′12/33/46/56/68/71/82 all contained MYC cis-acting elements. Of the nine genes, GmPP2A-B′′12/33/46/56/68/69/82 contained MYB-cis-acting elements, while GmPP2A-B′′33/56/68/69 contained MBS cis-acting elements. GmPP2A-B′′12/33/56/71/69 contained ABRE cis-acting elements. GmPP2A-B′′36 and GmPP2A-B′′71 had TCA cis-acting elements, and GmPP2A-B′′12, GmPP2A-B′′69, and GmPP2A-B′′71 had CGTCA-motif elements (Figure 7). These results further indicate that these nine genes are related to abiotic stress responses.

Figure 7. Distribution of cis-acting elements in the promoters of soybean GmPP2A-B′′ genes. Promoters are indicated by yellow boxes and nine different-colored boxes represented nine different cis-acting elements. The scale at the bottom estimates the length of each protein.
Expression Pattern Analysis of Nine GmPP2A-B′′ Genes
In order to confirm whether the function of GmPP2A-B′′ was related to stress resistance of soybean, the expression patterns of these GmPP2A-B′′ genes were analyzed via qPCR. Our results demonstrated that these GmPP2A-B′′ genes were differentially induced under drought and salt stress conditions. For example, drought can induce these GmPP2A-B′′ genes to up-regulate expression. Under drought stress, GmPP2A-B′′12, GmPP2A-B′′33, GmPP2A-B′′36, and GmPP2A-B′′68 were induced, while the expression levels of GmPP2A-B′′56 reached a peak after 2 h of drought treatment. GmPP2A-B′′46 and GmPP2A-B′′82 could be significantly induced after 10 h of drought treatment. Moreover, the expression levels of GmPP2A-B′′69 and GmPP2A-B′′71 reached peaks at 12 h of drought treatment (Figure 8). Similarly, salt can significantly induce nine GmPP2A-B′′ genes to up-regulate their expression. GmPP2A-B′′12 and GmPP2A-B′′36 can be significantly induced by salt at 4 h and reached their peaks at the same time (Figure 9). The expression levels of GmPP2A-B′′33 and GmPP2A-B′′56 peaked after 6 h of salt treatment, and the expression levels of GmPP2A-B′′46 and GmPP2A-B′′68 significantly increased after 8 h of salt treatment (Figure 9). In addition, the expression levels of GmPP2A-B′′69, GmPP2A-B′′71, and GmPP2A-B′′82 were significantly induced under salt stress conditions and peaked after 10 h of salt treatment (Figure 9). Of these nine genes, GmPP2A-B′′71 was significantly induced under both drought and salt treatments, leading us to select GmPP2A-B′′71 genes for further study.
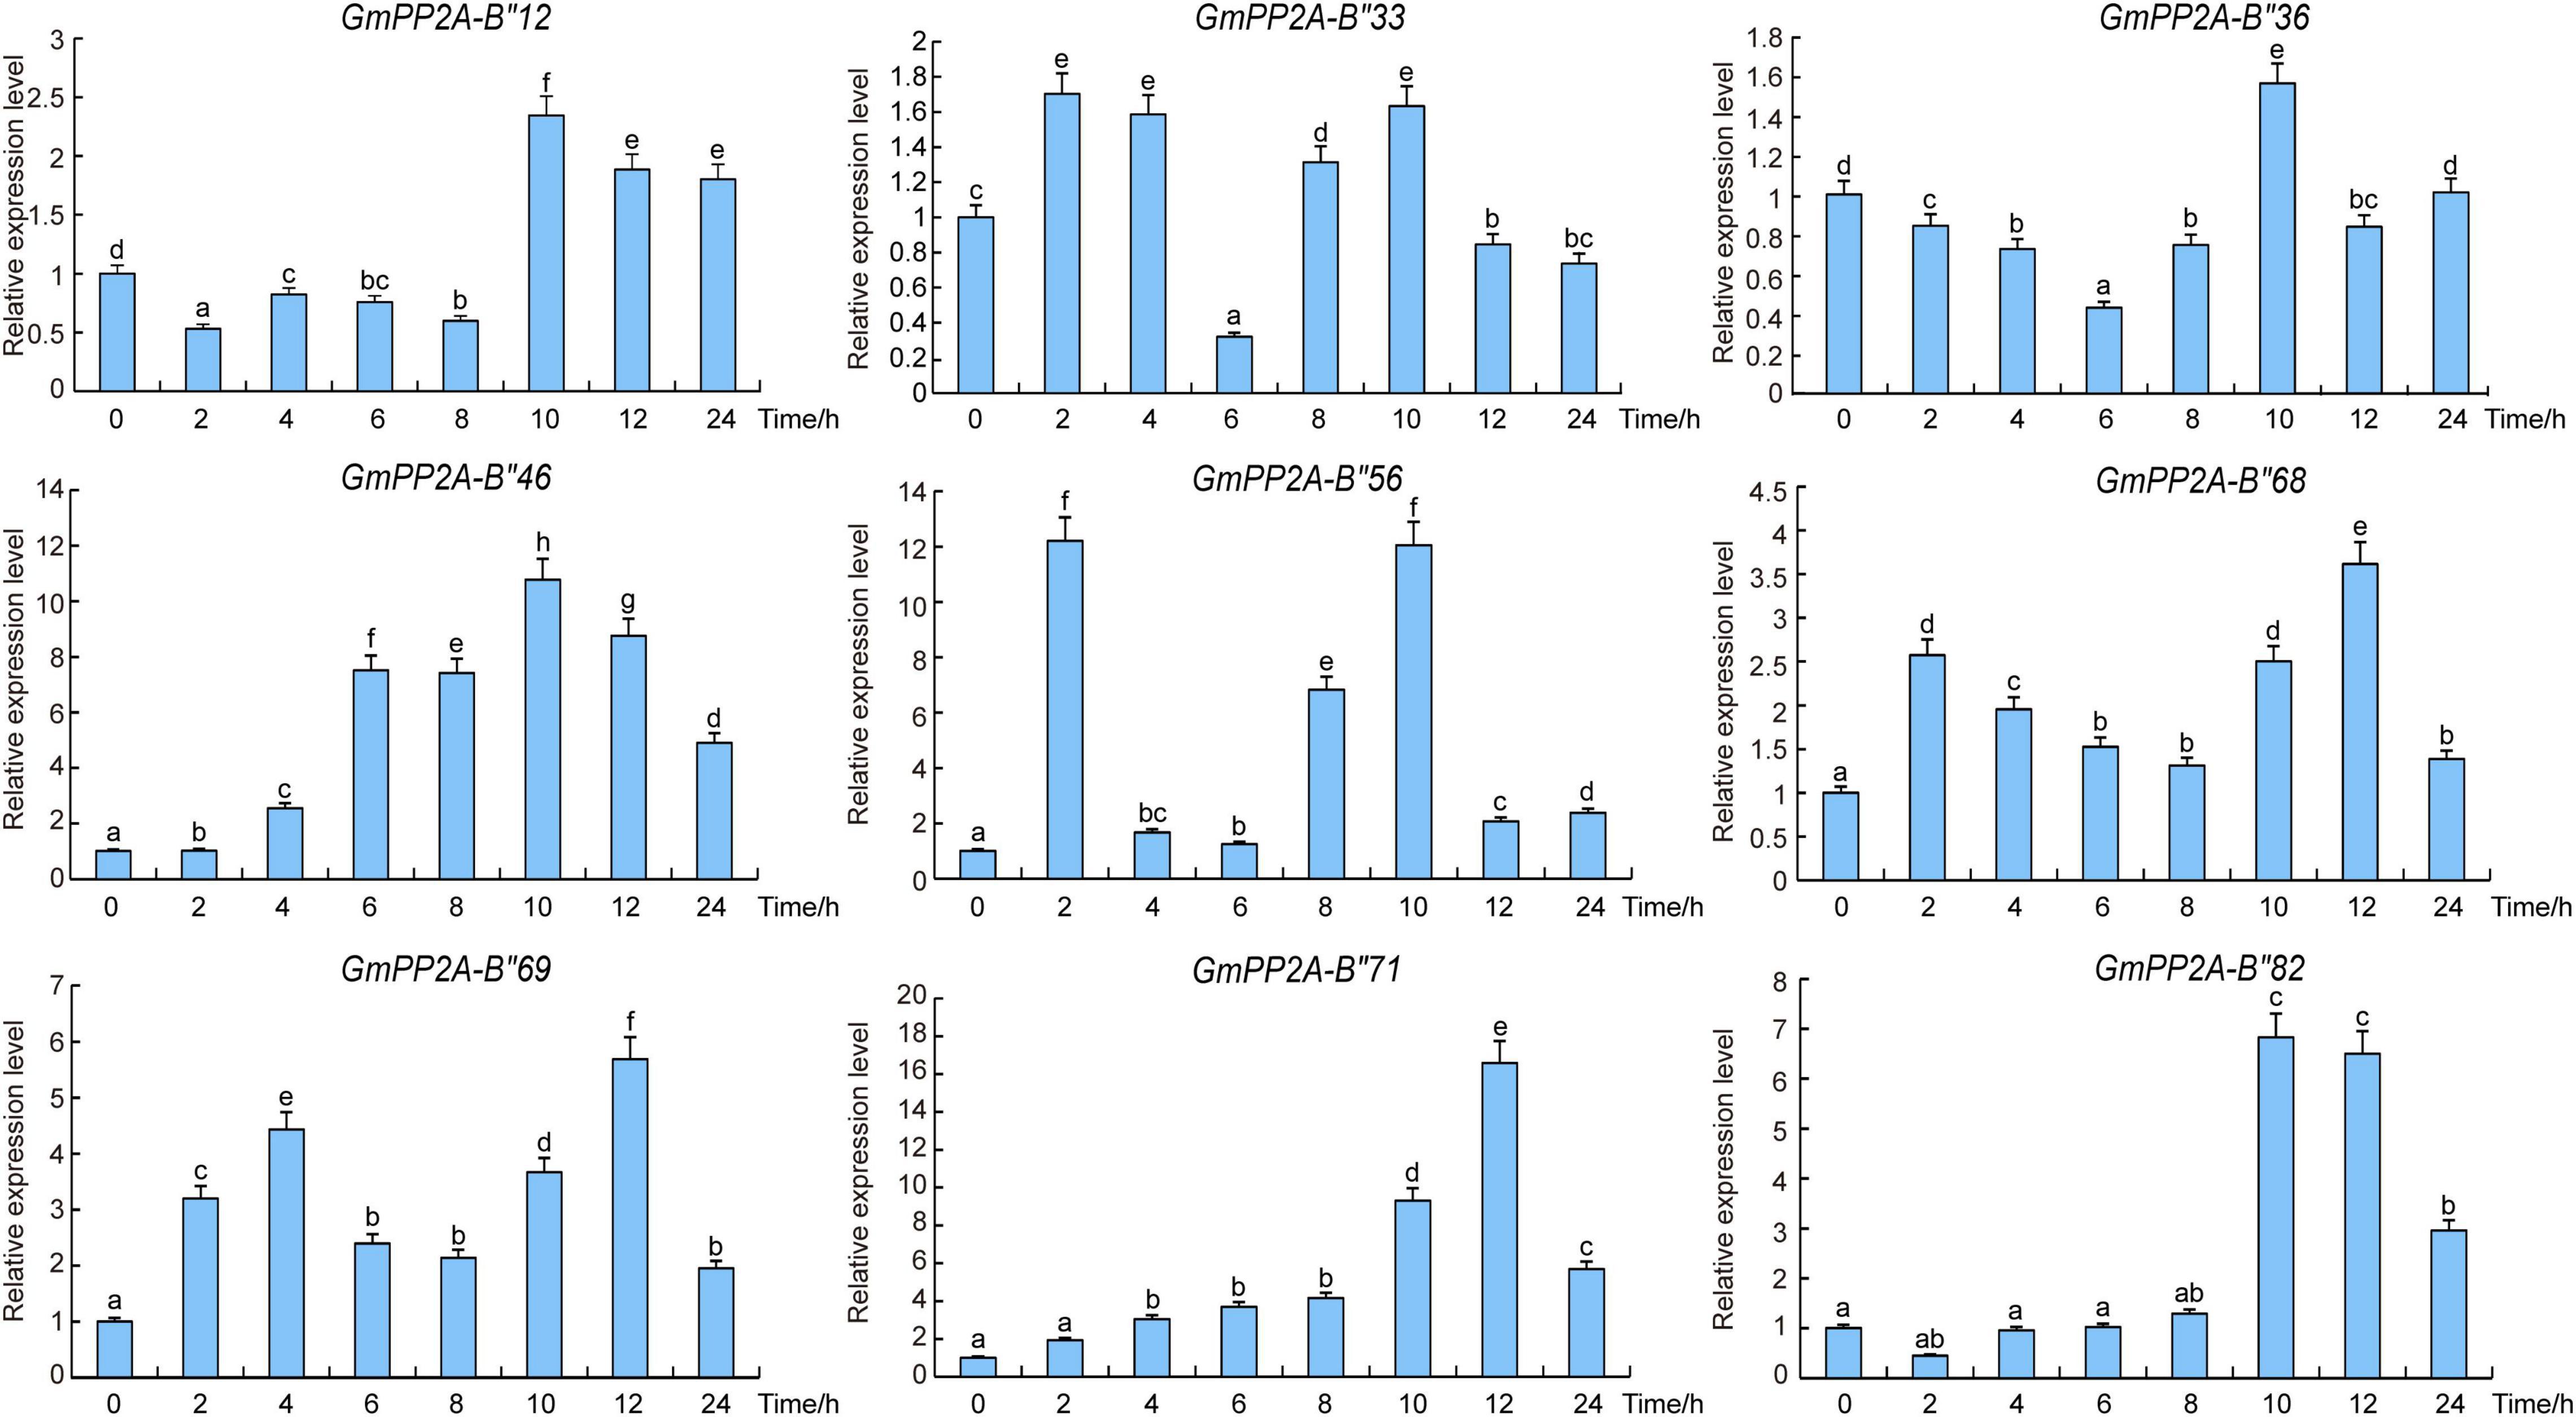
Figure 8. Expression patterns of GmPP2A-B′′ genes under salt stress conditions. Expression levels of nine GmPP2A-B′′ genes were measured using qPCR at different times of NaCl treatment and the expression levels were determined using the 2–Δ Δ CT method. qPCR data were normalized using control Actin (100500082) as the reference gene and were displayed relative to 0 h. The x-axes show the duration of treatment and the y-axes depict relative expression levels (error bars indicate SD). The data are shown as the means of three biological replicates ± SD. Different letters indicate significant differences at p < 0.05 according to two-way ANOVA (Duncan’s multiple range test). Different letters indicate significant differences at p < 0.05 according to two-way ANOVA (Duncan’s multiple range test).
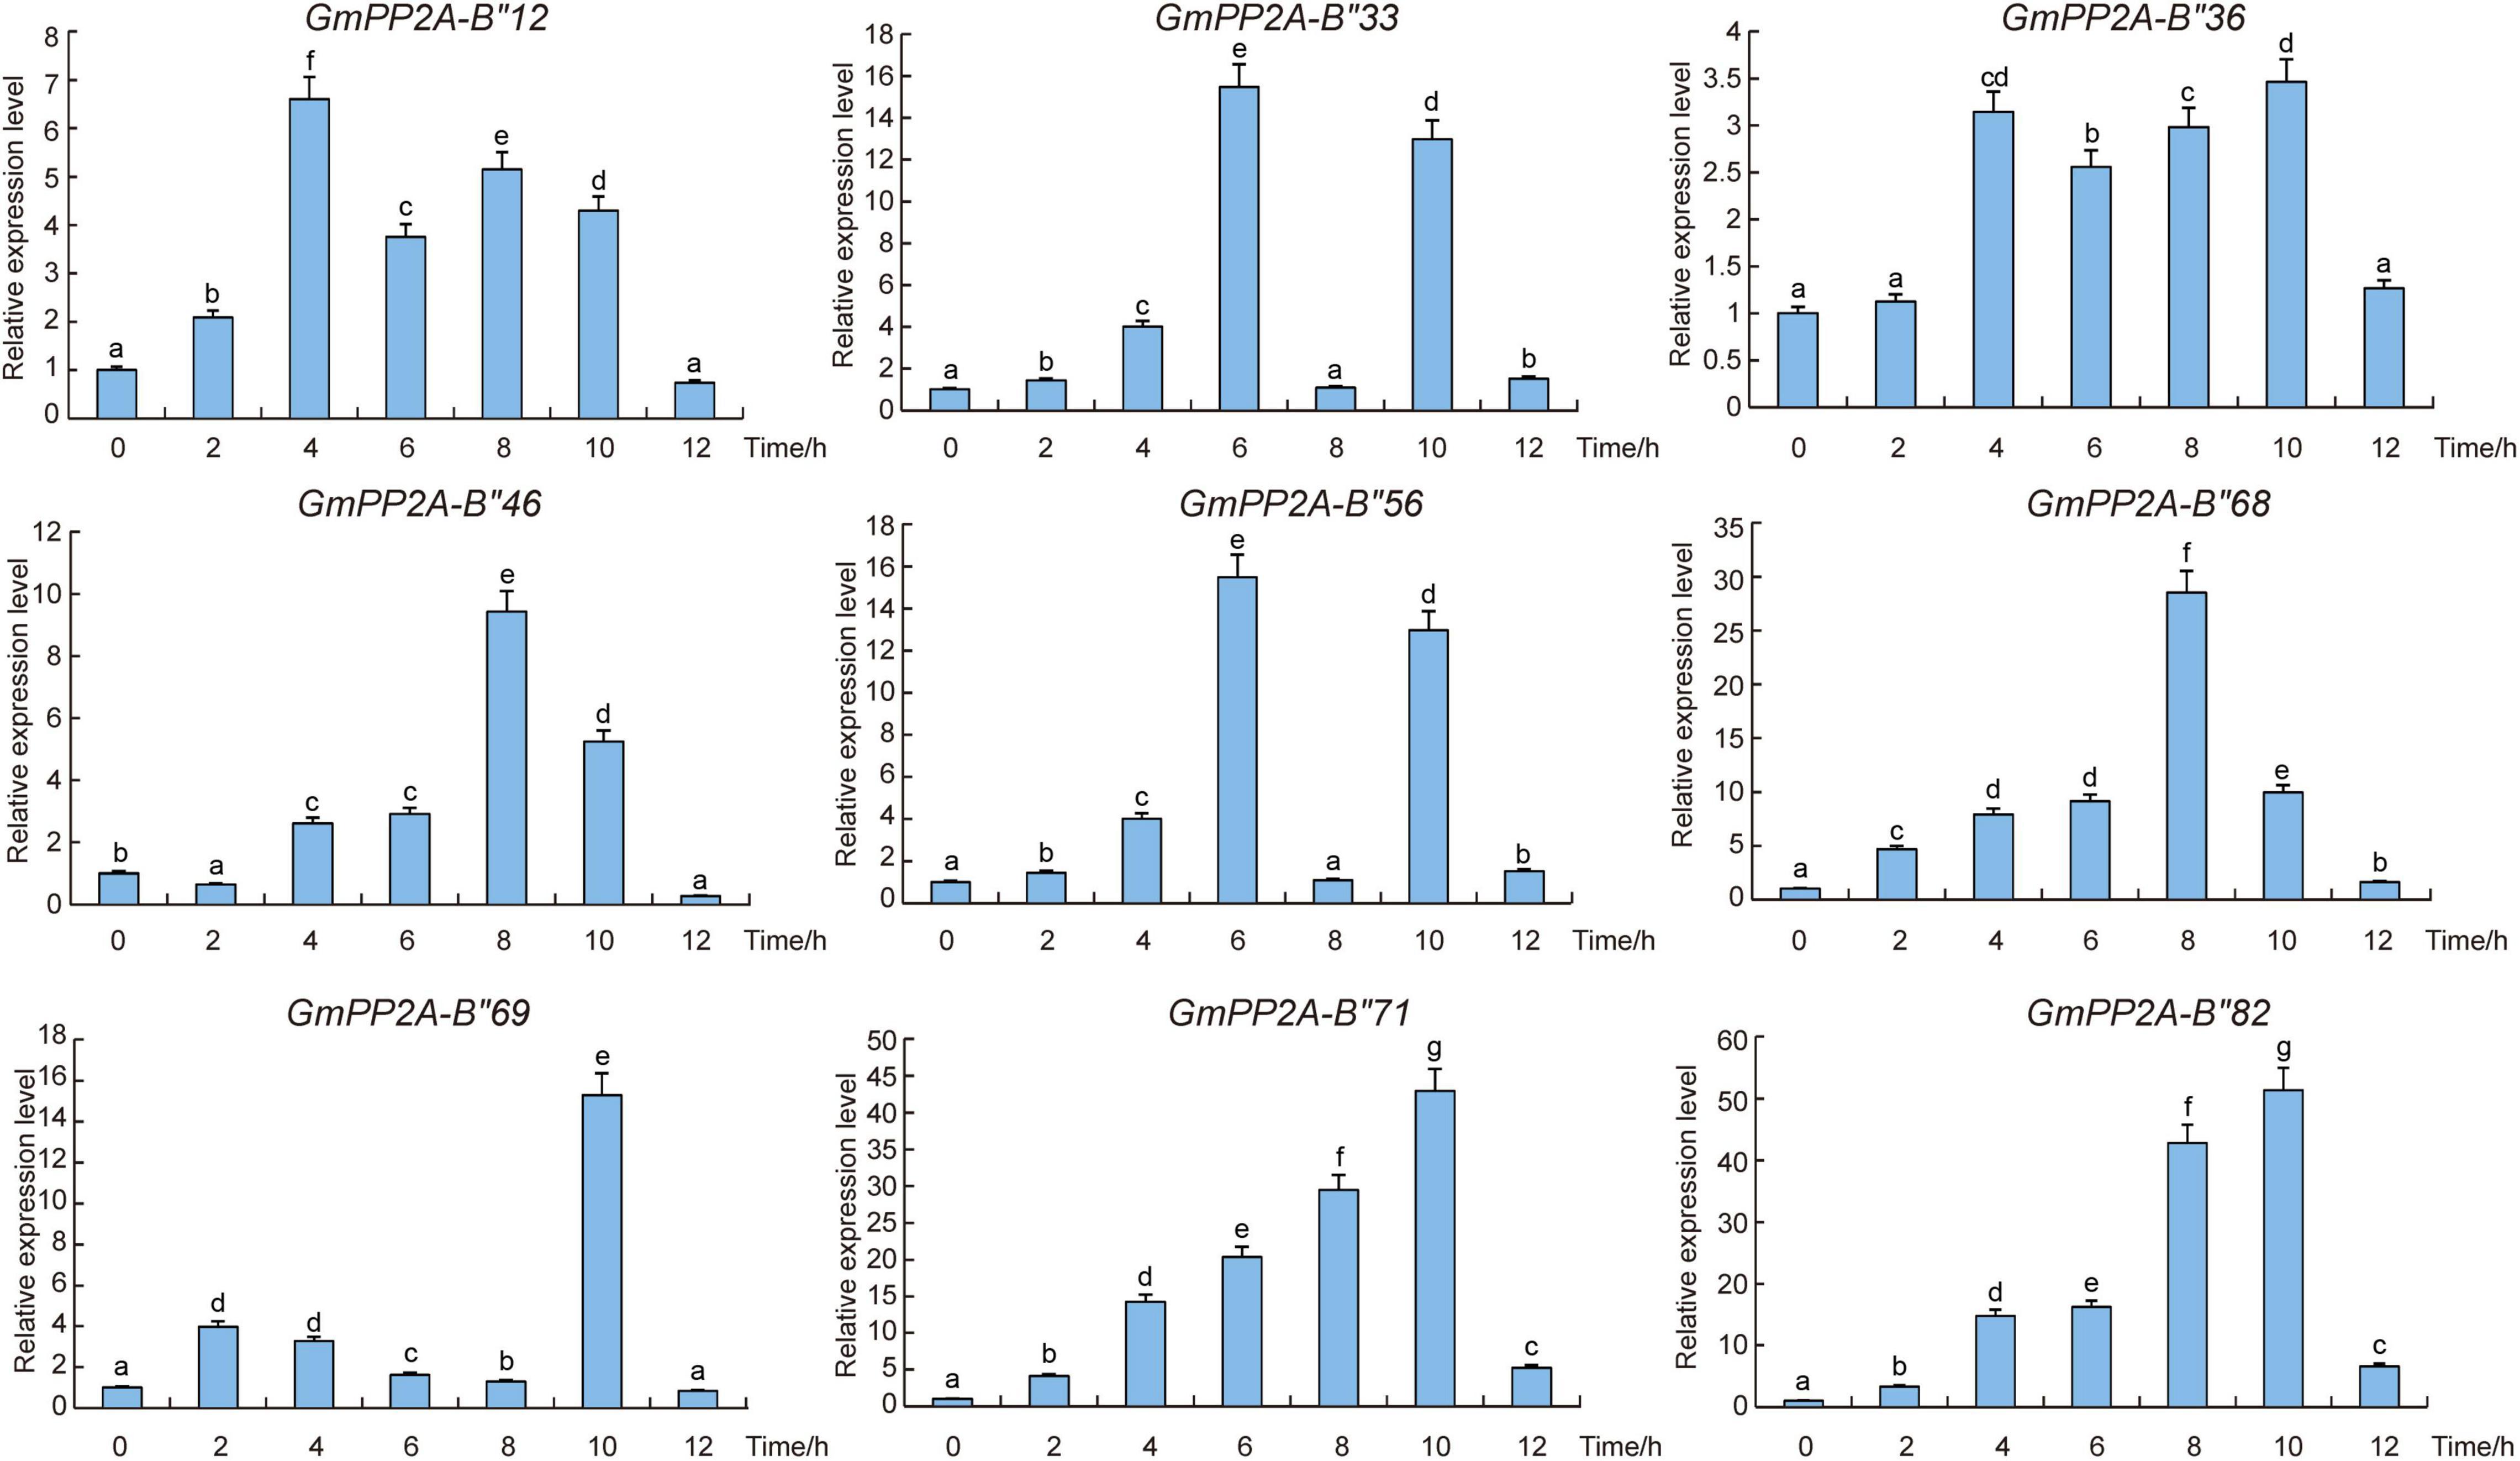
Figure 9. Expression patterns of GmPP2A-B′′ genes under drought stress. Expression levels of nine GmPP2A-B′′ genes were measured using qPCR at different times of drought treatment and the expression levels were determined using the 2–Δ Δ CT method. qPCR data were normalized using control Actin (100500082) as the reference gene and were displayed relative to 0 h. The x-axes show the duration of treatment and the y-axes depict relative expression level (error bars indicate SD). The data are shown as the means of three biological replicates ± SD. Different letters indicate significant differences at p < 0.05 according to two-way ANOVA (Duncan’s multiple range test).
GmPP2A-B′′71 Protein Was Located in the Nucleus and Cytoplasm
To analyze the molecular characteristics of the GmPP2A-B′′71 protein, we cloned the coding sequence length (CDS) sequence of GmPP2A-B′′71 and fused it into the GFP to form a GmPP2A-B′′71-GFP recombinant vector. The recombinant vector was then transferred into Arabidopsis leaf protoplast cells using the PEG4000-mediated method. Our results demonstrated that GmPP2A-B′′71-GFP was located in the nucleus and cytoplasm (Figure 10), which similar to GFP.
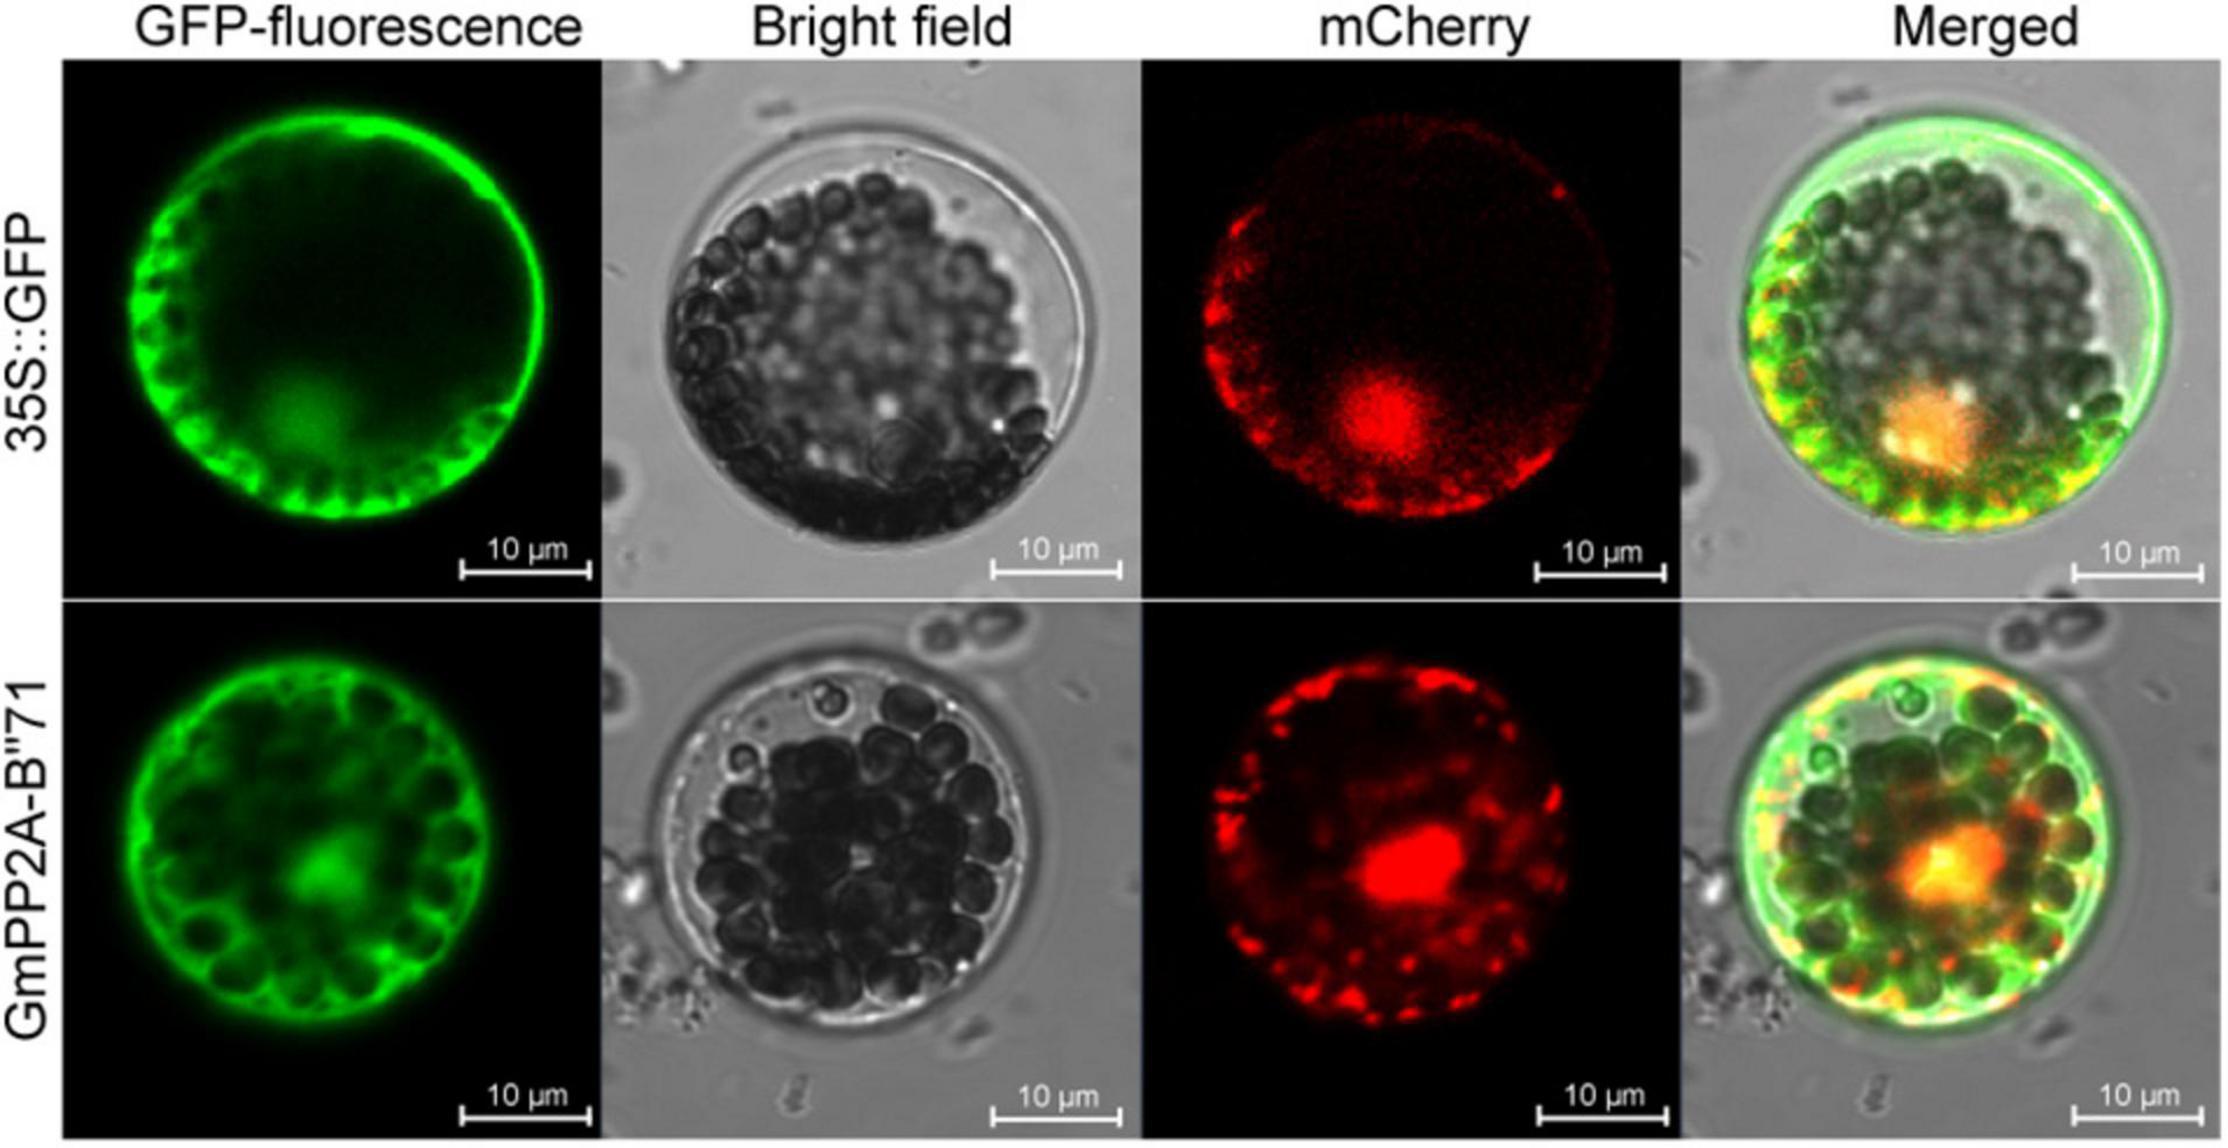
Figure 10. Subcellular localization of GmPP2A-B′′71-GFP fusion protein. 35S:GFP was used as a control. The scale bar of 35S:GFP and GmPP2A-B′′71-GFP indicate 10 μm.
GmPP2A-B′′71 Can Improve Drought and Salt Tolerance in Transgenic Arabidopsis
To investigate whether GmPP2A-B′′71 can improve the tolerance of transgenic plants, GmPP2A-B′′71 was inserted into the Arabidopsis genome via A. rhizogenes-mediated transformation, which resulted in three independent transgenic lines, including GmPP2A-B′′71-OE1, -OE2, and -OE3. Transgenic Arabidopsis seeds of T4 generation were selected for subsequent experiments. We found that under 4 and 6% PEG the total root length and fresh weight of transgenic Arabidopsis lines were significantly higher than WT (Figures 11A–F). Under normal conditions, the total root length and fresh weight of three transgenic Arabidopsis lines did not differ from WT plants (Supplementary Figure 4). Under drought conditions, we found that the survival rate and relative electrolyte leakage of the three transgenic Arabidopsis lines were significantly higher than WT (Figures 11M–O), while there was no significant difference between transgenic Arabidopsis lines and WT plants under normal conditions (Supplementary Figure 5). These results indicate that transgenic Arabidopsis have higher drought tolerance than WT plants (Figure 11).
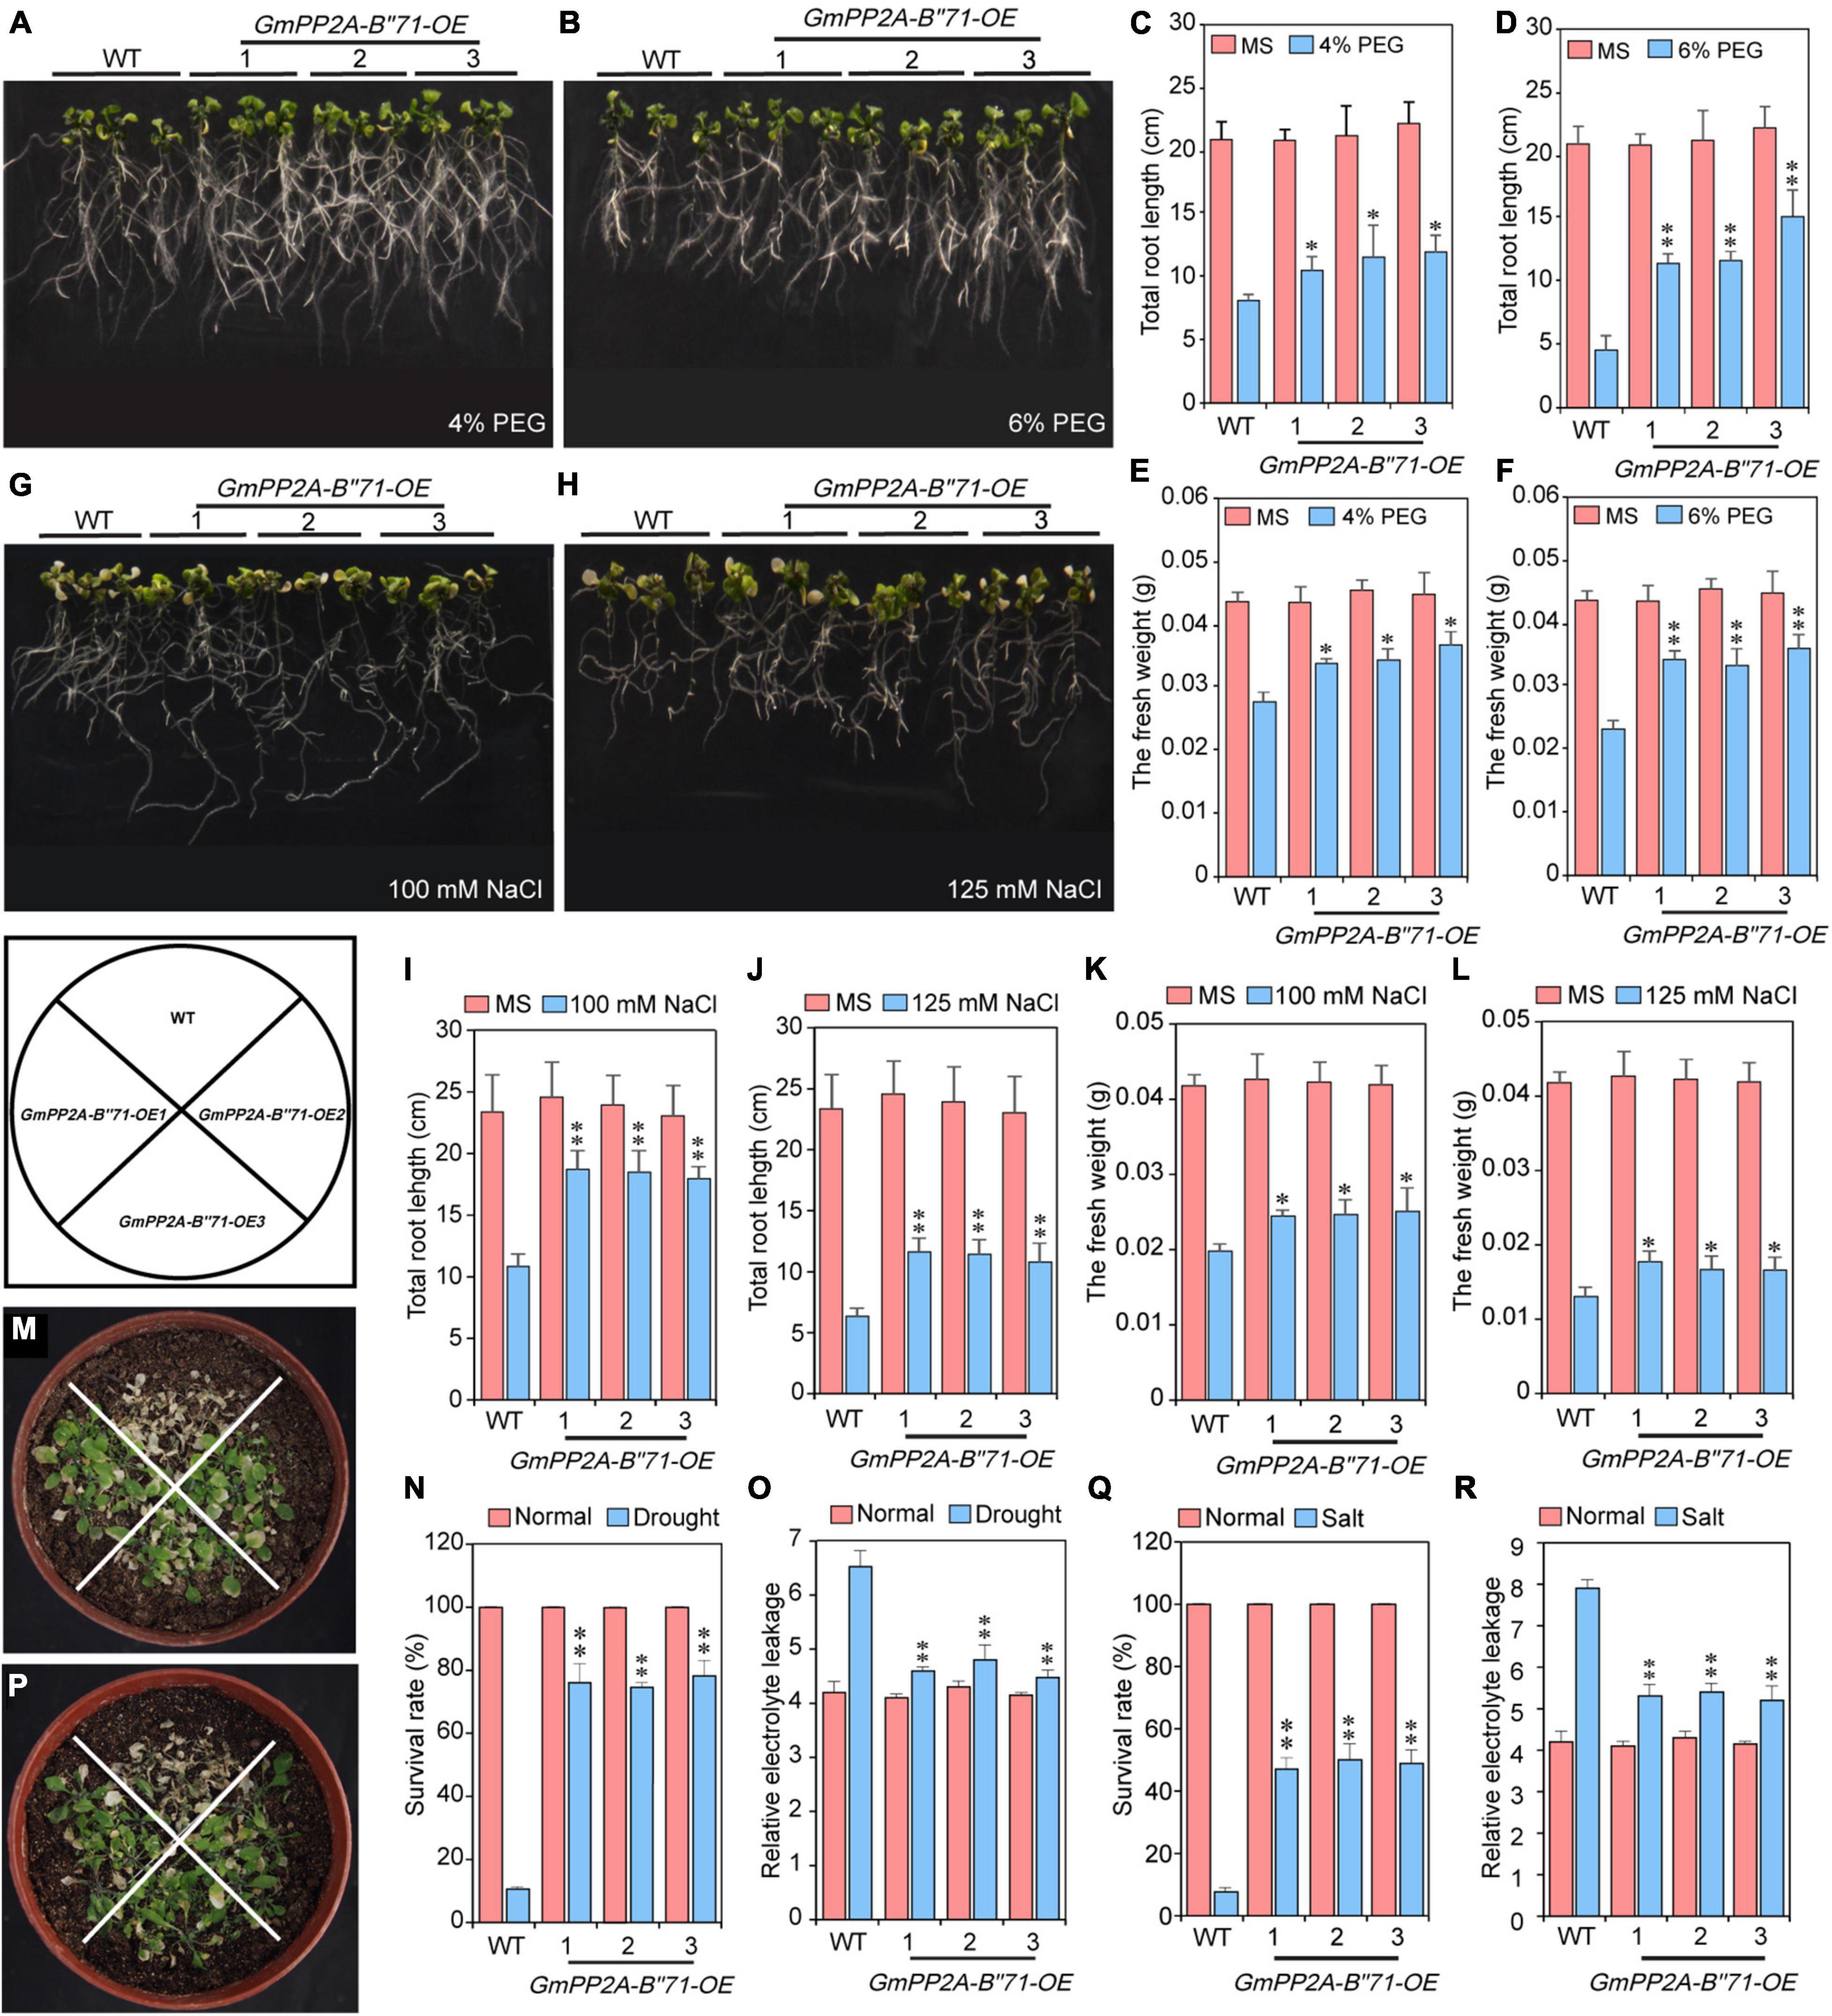
Figure 11. Analysis of GmPP2A-B′′71 functions in Arabidopsis under normal and different concentrations of PEG and NaCl stress conditions. (A,B) Phenotypic analysis of the GmPP2A-B′′71 transgenic Arabidopsis lines and WT plants under different concentrations of PEG treatment. (C,D) Total root length analysis of the GmPP2A-B′′71 transgenic Arabidopsis lines and WT plants under normal and different concentrations of PEG treatment. (E,F) The fresh weight of GmPP2A-B′′71 transgenic Arabidopsis lines and WT plants under different concentrations of PEG conditions. (G,H) Phenotypic analysis of the GmPP2A-B′′71 transgenic Arabidopsis lines and WT plants under different concentrations of NaCl treatment. (I,J) Total root length analysis of the GmPP2A-B′′71 transgenic Arabidopsis lines and WT plants under normal and different concentrations of NaCl treatment. (K,L) The fresh weight of GmPP2A-B′′71 transgenic Arabidopsis lines and WT plants under normal and different concentrations of NaCl conditions. (M) Phenotypes of transgenic Arabidopsis lines and WT plants under drought conditions. (N) The survival rates of transgenic Arabidopsis lines and WT plants under normal and drought stress conditions. (O) Relative electrolyte leakage of transgenic Arabidopsis and WT under drought normal and stress conditions. (P) Phenotypes of transgenic Arabidopsis lines and WT plants under salt conditions. (Q) The survival rates of transgenic Arabidopsis lines and WT plants under normal and salt stress conditions. (R) Relative electrolyte leakage of transgenic Arabidopsis and WT under normal and salt stress conditions. *p < 0.05 and **p < 0.01.
We also used NaCl to treat transgenic Arabidopsis lines and WT plants. Similarly, total root length and the fresh weight of WT and transgenic Arabidopsis under salt stress were measured. Our results demonstrated that under 100 mM and 125 mM NaCl conditions, the total root length of transgenic Arabidopsis was significantly longer than WT, and the fresh weight of transgenic Arabidopsis was also significantly higher than WT, while under normal conditions, there was no significant difference between WT and transgenic Arabidopsis lines in root length and fresh weight (Figures 11G–L). We also calculated the survival rate and relative electrolyte leakage of WT and transgenic Arabidopsis lines under salt stress. We found that under 100 and 125 mM NaCl conditions, the survival rate and relative electrolyte leakage of transgenic Arabidopsis lines were significantly higher than WT (Figures 11P–R). These results indicate that transgenic Arabidopsis lines had higher salt tolerance than WT plants (Figure 11).
Overexpression of GmPP2A-B′′71 in Soybean Hairy Roots Can Improve Drought Tolerance in Soybean Plants
To further analyze the relationship between GmPP2A-B′′71 and plant drought tolerance, we used the A. rhizogenes-mediated transformation method to generate the transgenic GmPP2A-B′′71 soybean hairy root composite plants. We obtained three different types of transgenic soybean hairy root composite plants, and named them GmPP2A-B′′71-RNAi, EV-control, and GmPP2A-B′′71-OE composite plants. We used composite plant materials from these three different kinds of transgenic soybean hairy roots to analyze how the GmPP2A-B′′71 genes respond to plant drought tolerance. For drought tolerance analysis, the GmPP2A-B′′71-RNAi, EV-control, and GmPP2A-B′′71-OE soybean plants that were cultured under normal conditions were transferred to drought conditions for 2 weeks. After 14 days of drought treatment, the leaves of most GmPP2A-B′′71-RNAi plants turned yellow and severely wilted, which indicates severe dehydration, while the EV-control lines displayed moderate wilting. However, the growth activity of GmPP2A-B′′71-RNAi plants declined, while GmPP2A-B′′71-OE plants were still upright, and the leaves of GmPP2A-B′′71-OE plants were green and displayed stronger growth activity compared to the GmPP2A-B′′71-RNAi and EV-control plants. This indicates that overexpression of GmPP2A-B′′71 could improve plant tolerance to drought stress.
Abiotic stress can induce a high level of ROS (Mhamdi and Van Breusegem, 2018). To verify the relationship between plant tolerance, ROS, and GmPP2A-B′′71, we performed Nitro Blue Tetrazolium (NBT) staining analysis to observe the ROS levels of the GmPP2A-B′′71-RNAi, EV-control, and GmPP2A-B′′71-OE soybean plants under drought treatment. Our results demonstrated that the leaves and root tips of GmPP2A-B′′71-OE plants had lower ROS levels with a lighter color of NBT staining than EV-control plants, indicating that GmPP2A-B′′71 overexpressed soybeans had stronger ROS-scavenging ability than EV-control plants under drought conditions. GmPP2A-B′′71-RNAi plants presented the opposite phenotype, with higher ROS levels than EV-control plants. We further measured the chlorophyll content in the leaves and the Pro, MDA, POD, and CAT contents in the roots of GmPP2A-B′′71-RNAi, EV-control, and GmPP2A-B′′71-OE soybean plants under drought conditions. Our results demonstrated that Pro, chlorophyll, POD, and CAT contents in GmPP2A-B′′71-OE soybean plants were higher than in EV-control plants, while the MDA content in GmPP2A-B′′71-OE soybean plants was lower than in EV-control plants. However, GmPP2A-B′′71-RNAi plants had lower Pro, chlorophyll, POD, and CAT contents and higher MDA contents than EV-control plants (Figure 12). These results further confirmed our hypothesis that overexpression of GmPP2A-B′′71 in soybean hairy roots can enhance plant tolerance to drought stress conditions.
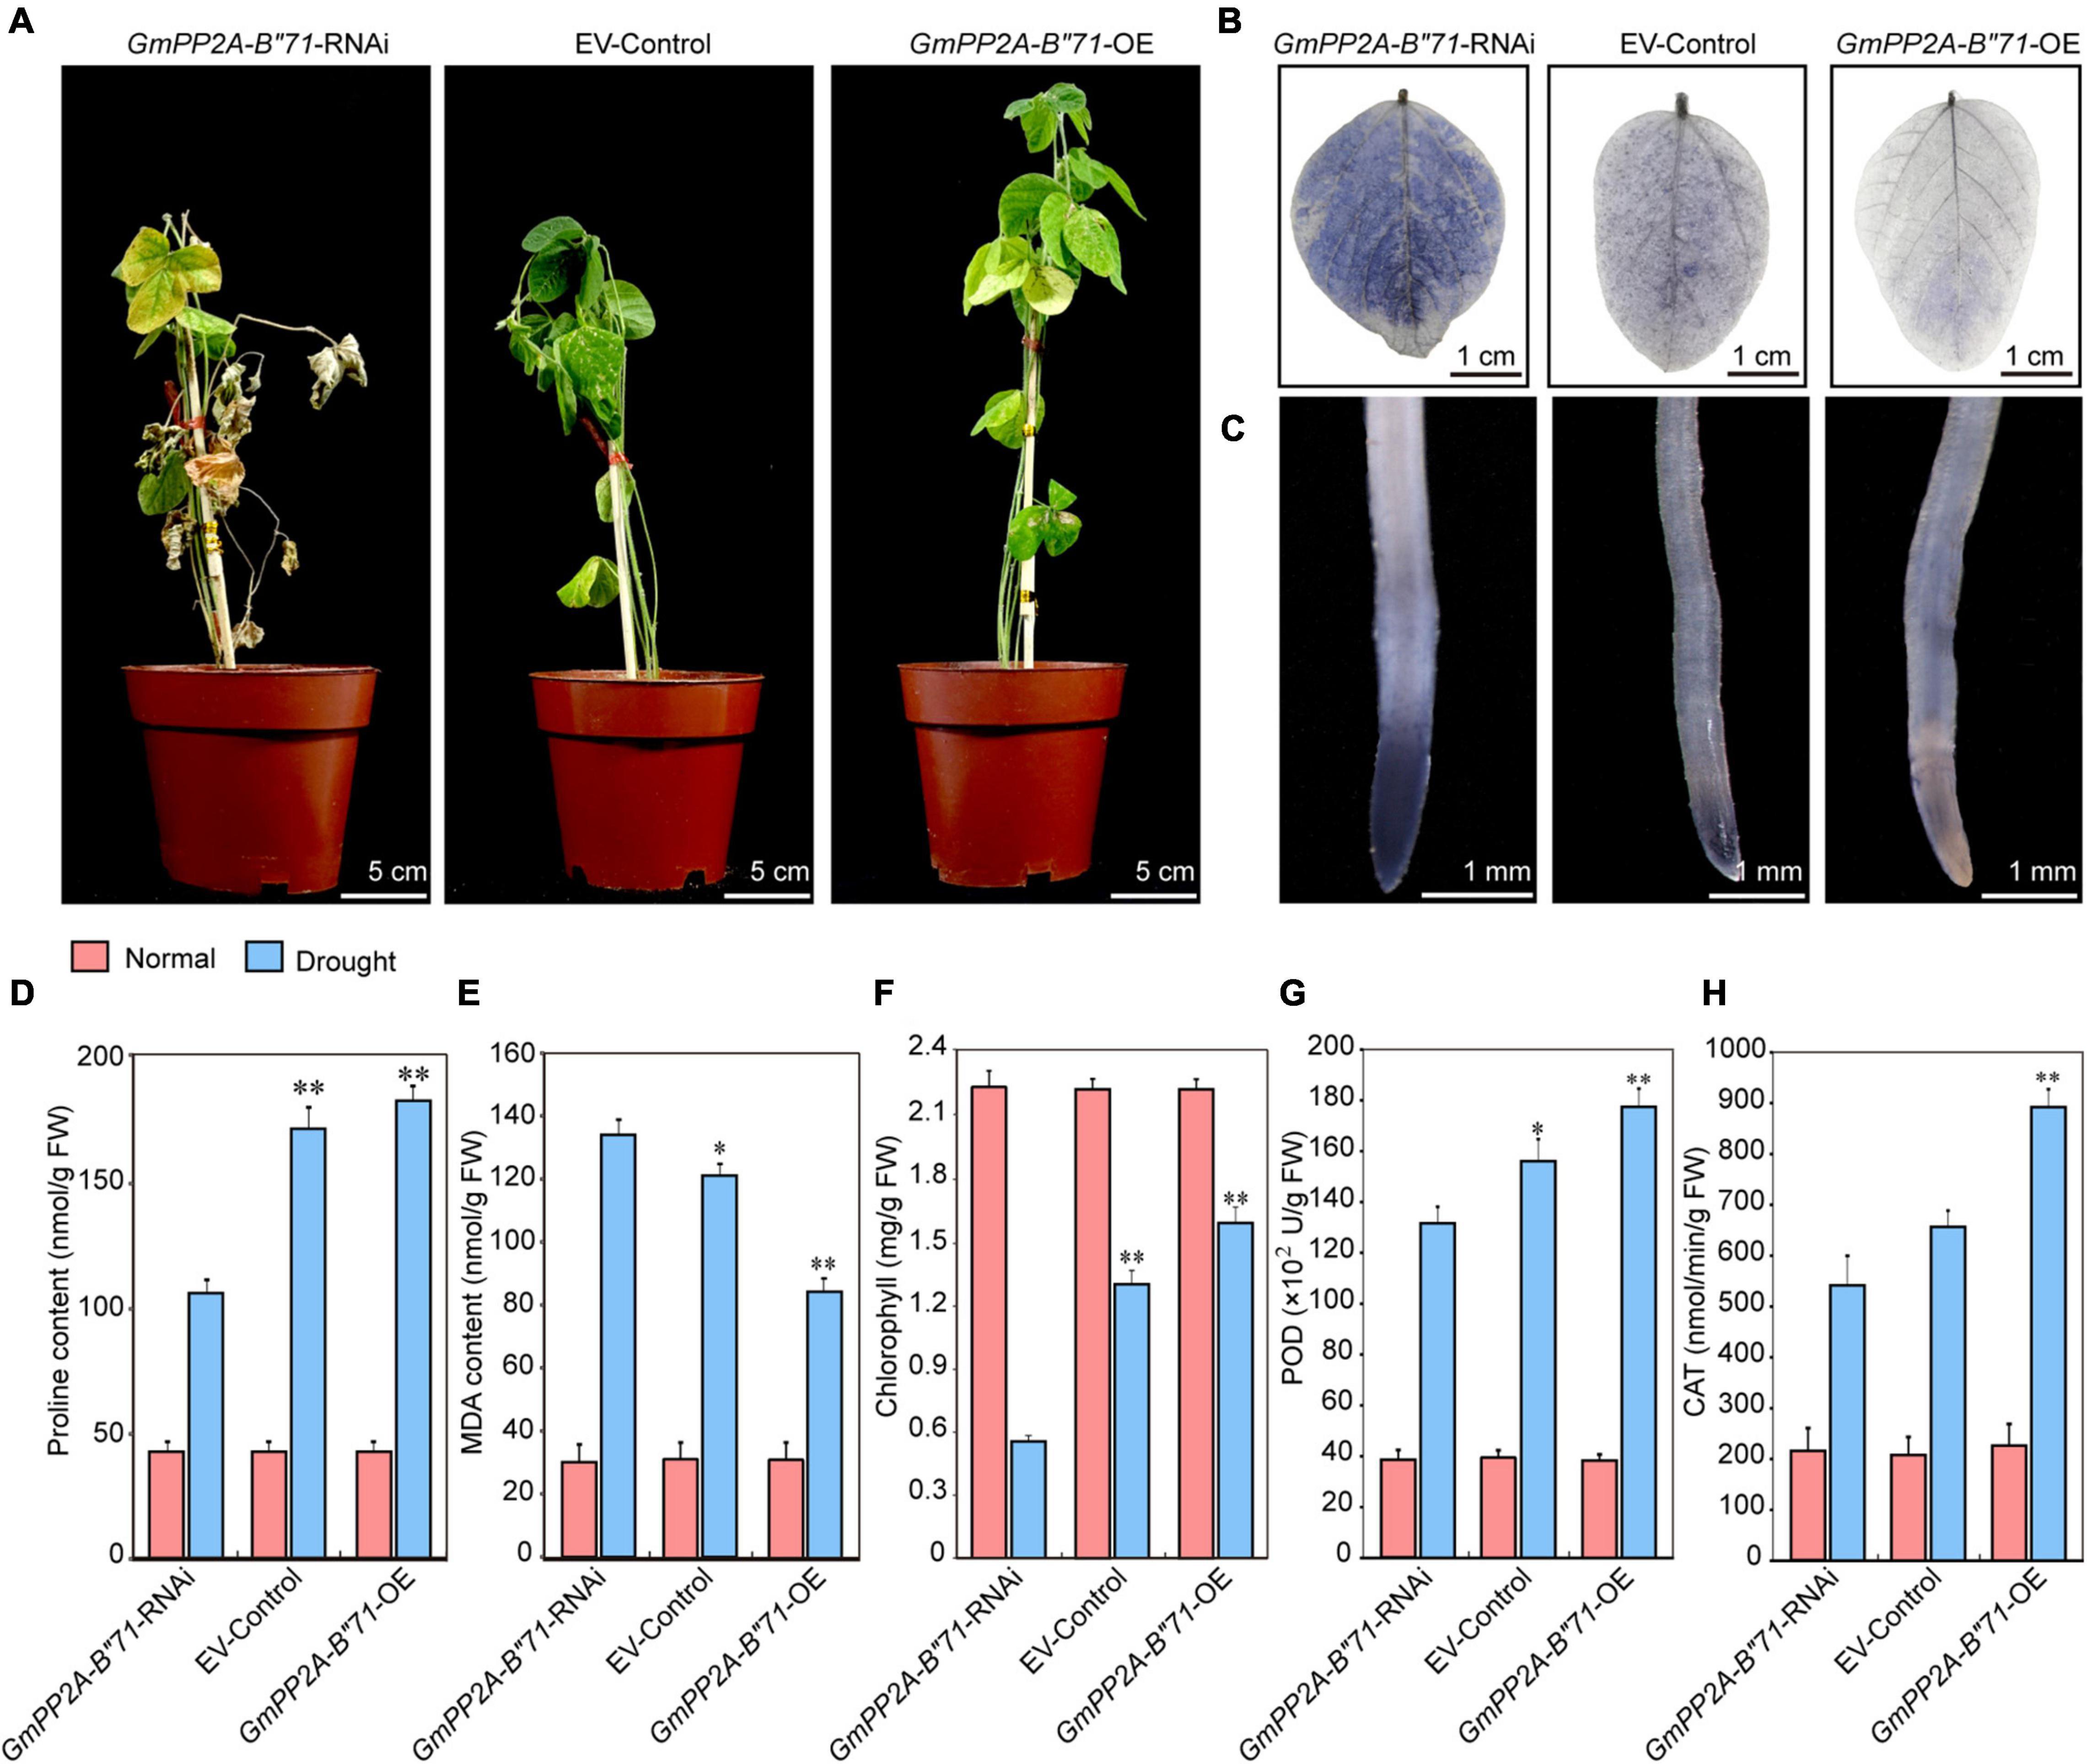
Figure 12. Analysis of the function of soybean GmPP2A-B′′71 under drought stresses. (A) Phenotype analysis of GmPP2A-B′′71-RNAi, EV-Control, and GmPP2A-B′′71-OE plants under drought stress conditions. The scale bar indicates 5 cm. (B) NBT staining of GmPP2A-B′′71-RNAi, EV-Control, and GmPP2A-B′′71-OE plant leaves under drought stress conditions. The scale bar indicates 1 cm. (C) NBT staining of GmPP2A-B′′71-RNAi, EV-Control, and GmPP2A-B′′71-OE plant root tips under drought stress conditions. The scale bar indicates 1 mm. (D–H) The proline (D), MDA (E), chlorophyll (F), POD (G), and CAT (H) contents of GmPP2A-B′′71-RNAi, EV-Control, and GmPP2A-B′′71-OE plants under drought stress conditions. *p < 0.05 and **p < 0.01.
Overexpression of GmPP2A-B′′71 in Soybean Hairy Roots Improve Salt Tolerance in Soybean
To further verify the relationships among plant stress tolerance, ROS, and GmPP2A-B′′71, we applied salt treatment for the GmPP2A-B′′71-RNAi, EV-control, and GmPP2A-B′′71-OE soybean plants by administering 250 mM NaCl. After 1 week of treatment, the leaves of the GmPP2A-B′′71-OE plants were still green and more unfurled than the EV-control plants, while the leaves of GmPP2A-B′′71-RNAi plants turned yellow and were more wilted than the EV-control plants. NBT staining results demonstrated that the degree of leaf staining area of GmPP2A-B′′71-OE plants was smaller and lighter than the EV-control plants, however, the GmPP2A-B′′71-RNAi plants had the opposite phenotype with severe wilting compared with EV-control plants. Similarly, the root tip staining results demonstrated that GmPP2A-B′′71-OE plants had lower ROS levels and a lighter color of NBT staining than EV-control plants, however, GmPP2A-B′′71-RNAi plants had the stronger colors of NBT staining with higher ROS levels than EV-control plants. This indicates that the overexpression of GmPP2A-B′′71 in soybean plants can improve its salt tolerance. To further verify our conclusion, we measured the chlorophyll content of GmPP2A-B′′71-RNAi, EV-control, and GmPP2A-B′′71-OE soybean plant leaves and the contents of Pro, MDA, POD, and CAT in soybean hairy roots under salt treatment. Our results demonstrated that the contents of Pro, chlorophyll, POD, and CAT in GmPP2A-B′′71-OE soybean plants were higher than in EV-control and GmPP2A-B′′71-RNAi plants and that the MDA content in GmPP2A-B′′71-OE soybean plants was lower than in GmPP2A-B′′71-RNAi and EV-control plants (Figure 13). These results indicate that GmPP2A-B′′71 contributes to salt stress tolerance in soybean plants.
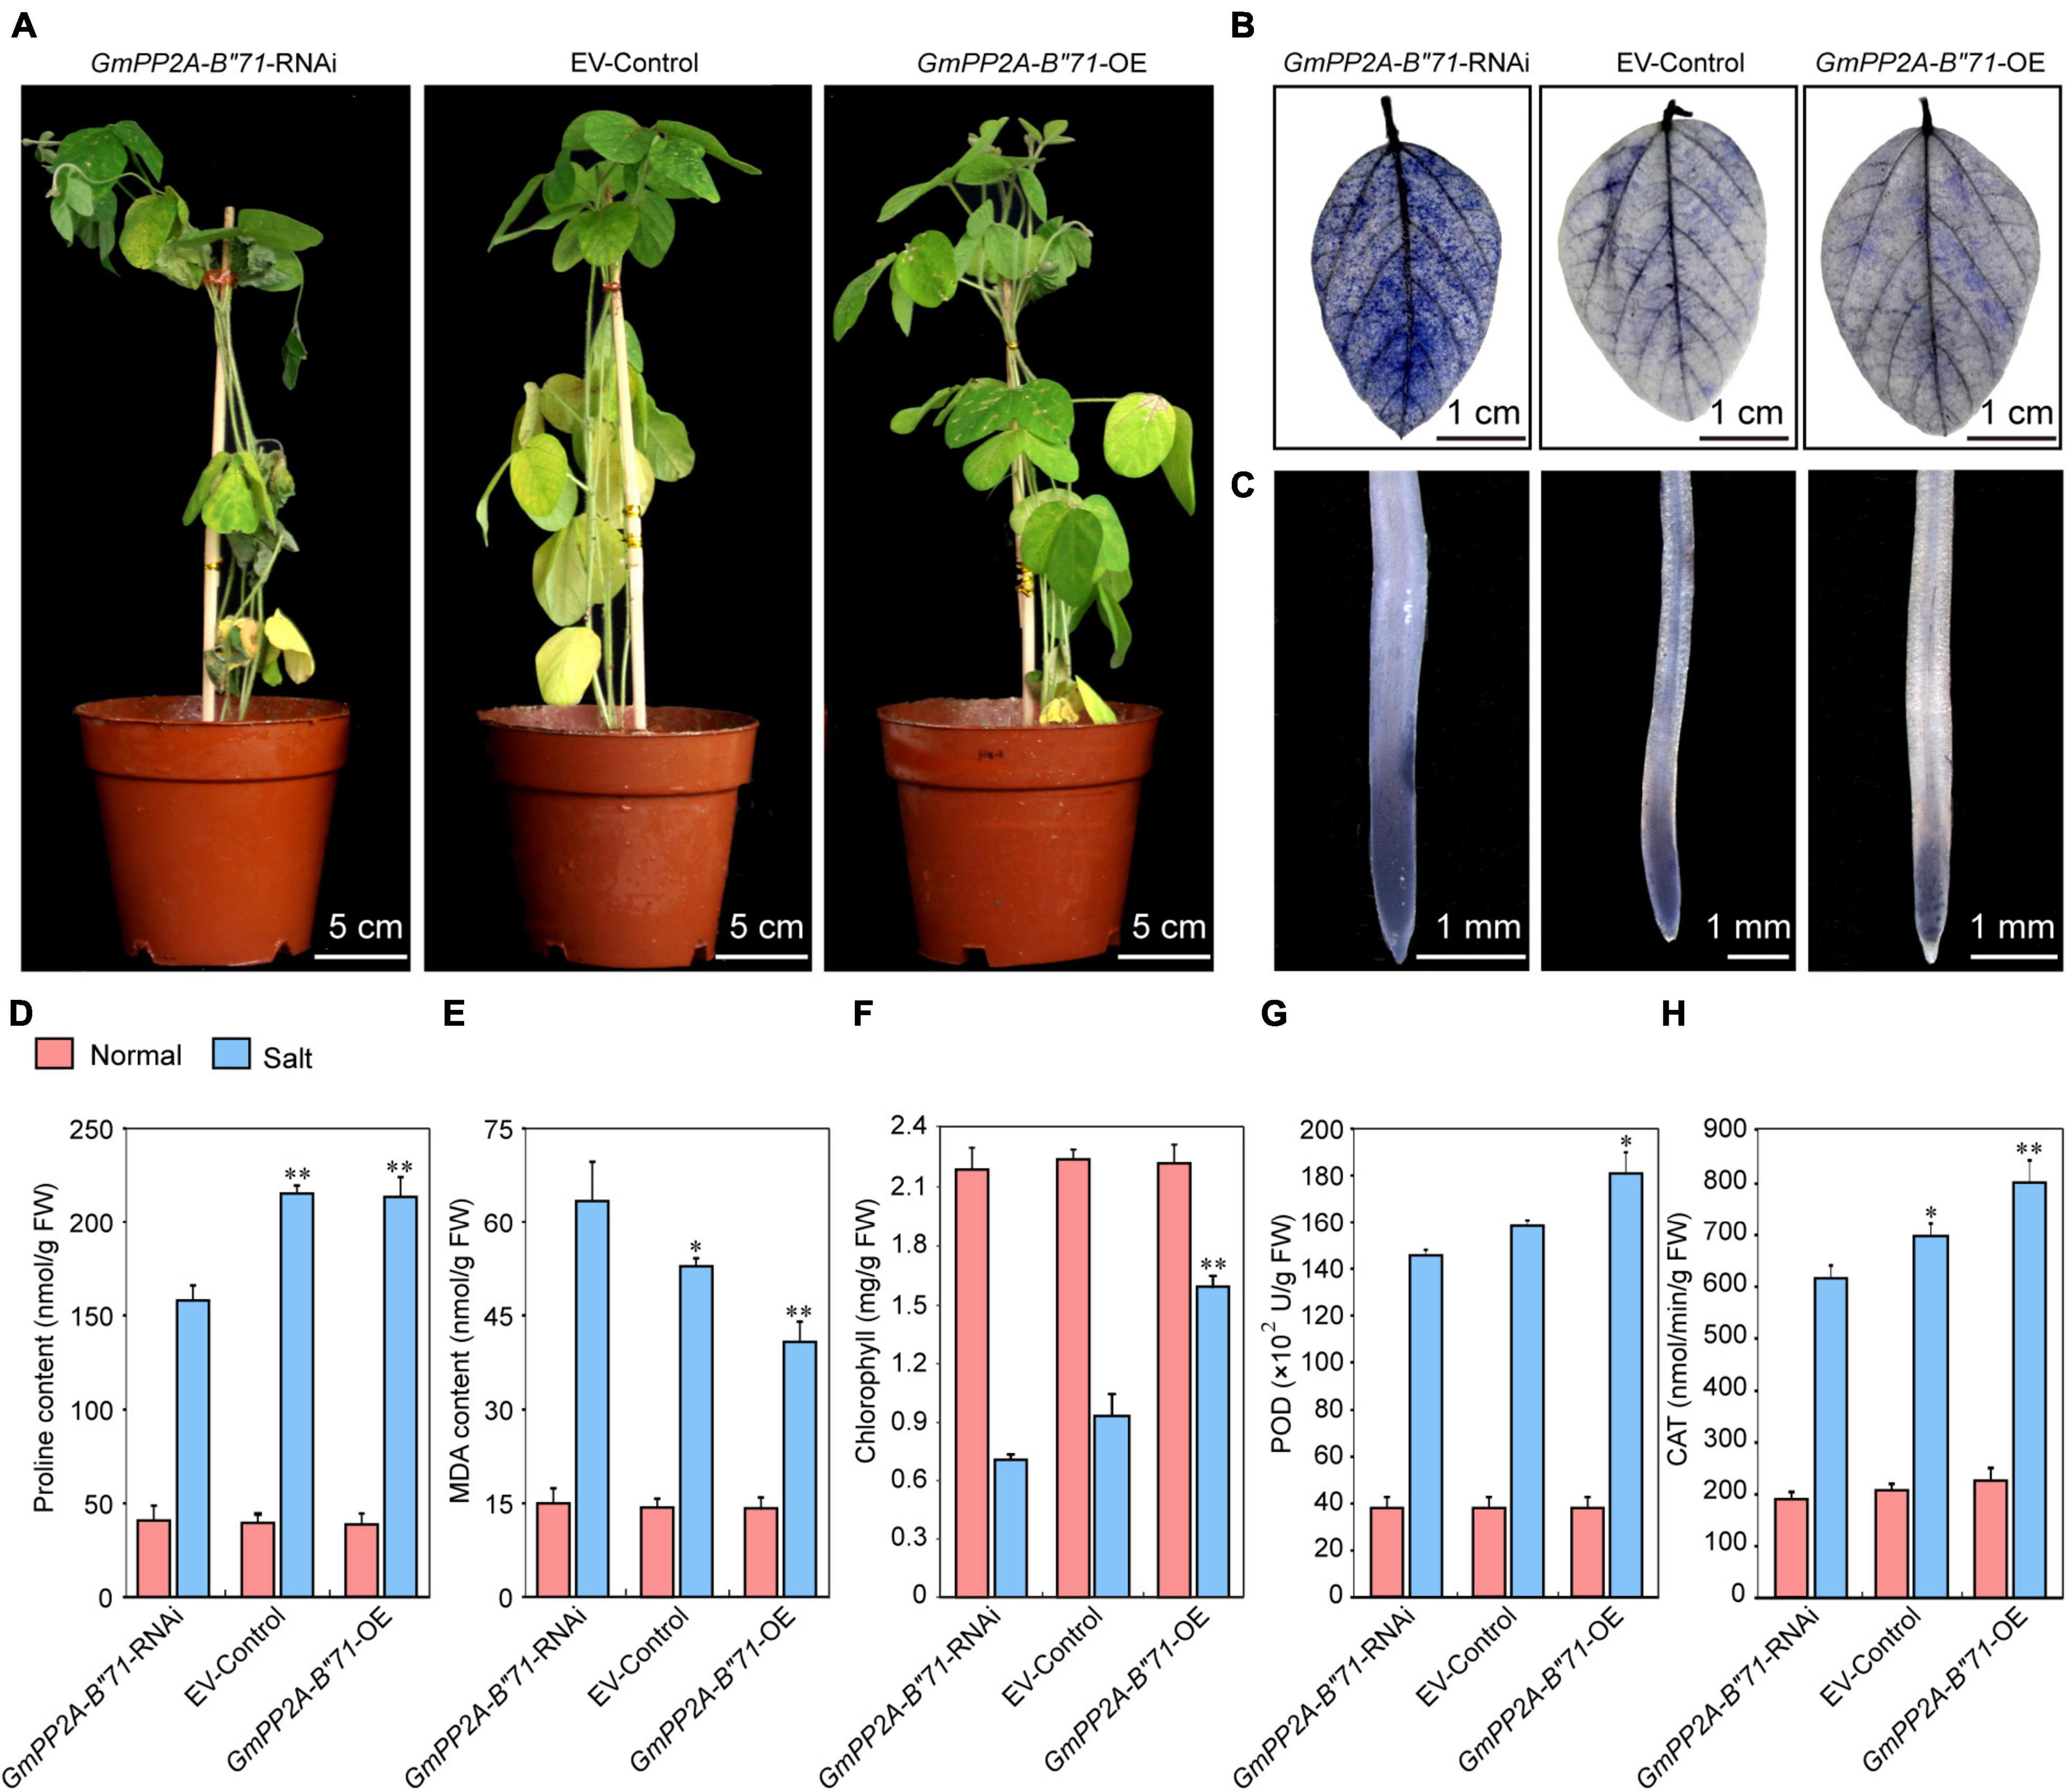
Figure 13. Analysis of the function of soybean GmPP2A-B′′71 under salt stress conditions. (A) Phenotype analysis of GmPP2A-B′′71-RNAi, EV-Control, and GmPP2A-B′′71-OE plants under salt stress conditions. The scale bar indicates 5 cm. (B) NBT staining of the leaves of GmPP2A-B′′71-RNAi, EV-Control, and GmPP2A-B′′71-OE plants under salt treatment. The scale bar indicates 1 cm. (C) NBT staining of the root tips of GmPP2A-B′′71-RNAi, EV-Control, and GmPP2A-B′′71-OE plants under salt stress conditions. The scale bar indicates 1 mm. (D–H) The proline (D), MDA (E), chlorophyll (F), POD (G), and CAT (H) content of GmPP2A-B′′71-RNAi, EV-Control, and GmPP2A-B′′71-OE plants under salt stress conditions. *p < 0.05 and **p < 0.01.
Overexpression of GmPP2A-B′′71 Enhances Expression Levels of Stress-Responsive Genes
According to our NBT staining analysis, we found that GmPP2A-B′′71-OE plants had lower ROS levels than GmPP2A-B′′71-RNAi and EV-control plants and thus speculated that GmPP2A-B′′71-OE plants likely improve plant stress tolerance through the scavenging of ROS. To verify our hypothesis, we measured the expression levels of scavenging of ROS-related genes in GmPP2A-B′′71-RNAi, EV-control, and GmPP2A-B′′71-OE soybean plants using qPCR. Our results demonstrated that GmCAT1, GmCAT2, and GmPOD genes were significantly up-regulated in GmPP2A-B′′71-OE soybean plants and significantly down-regulated in GmPP2A-B′′71-RNAi plants. This indicates that GmPP2A-B′′71 could regulate the ROS scavenging pathway. Additionally, some genes related to stress response, such as GmLEA15 and GmERF115, were also significantly up-regulated in GmPP2A-B′′71-OE soybean plants (Figure 14). These results indicate that overexpression of GmPP2A-B′′71 can increase the expression of stress response genes to improve plant stress tolerance.
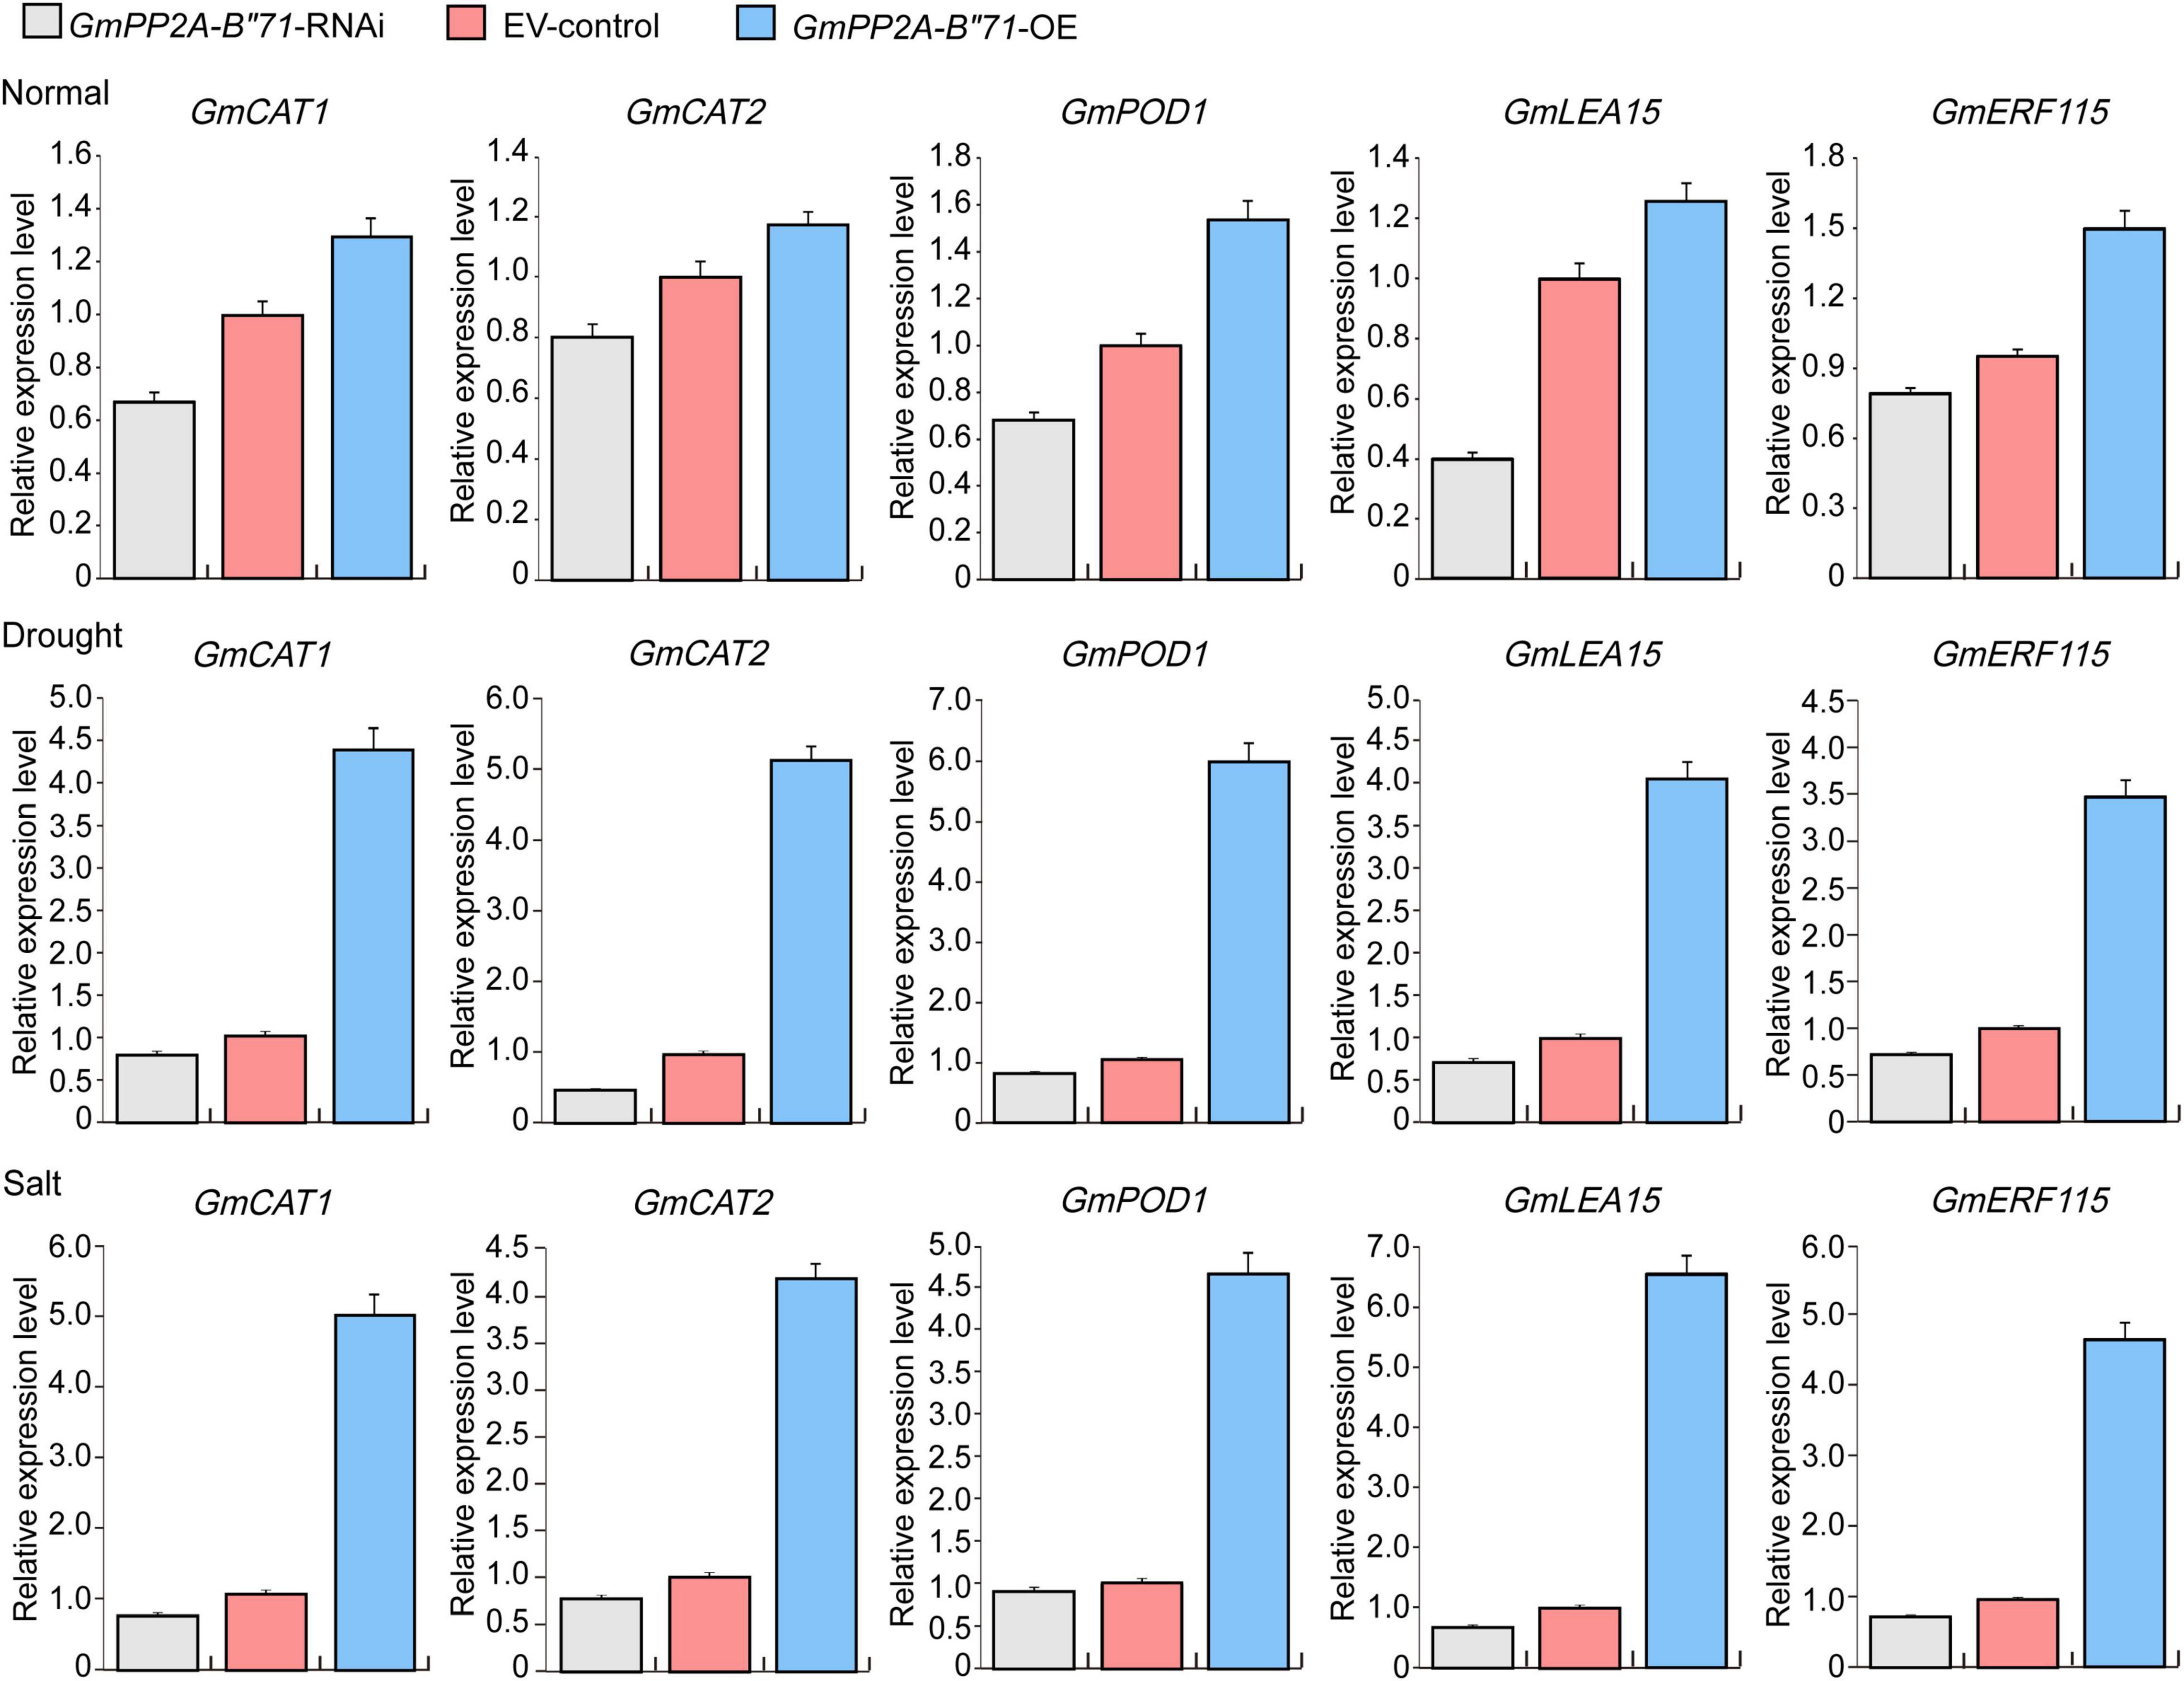
Figure 14. The expression levels of ROS scavenging- and stress-related genes in GmPP2A-B′′71-RNAi, EV-control, and GmPP2A-B′′71-OE soybean plants. Gray bar indicates GmPP2A-B′′71-RNAi; red bar indicates EV-control; blue bar indicates GmPP2A-B′′71-OE.
Discussion
Major plant serine/threonine protein phosphatases belong to the phosphoprotein phosphatase (PPP) family (Uhrig et al., 2013). PP2A, a rich iso-trimeric serine/threonine phosphatase (Tompa et al., 2014; Kataya et al., 2015; Qureshi et al., 2015), likes other PPPs, and the conserved domain short linear motifs (SLiMs) are located in its intrinsically disordered region (IDR) (Tompa et al., 2014; Wang et al., 2016). In our study, 83 PP2A-B′′ genes were distributed on 20 chromosomes in soybean and divided into 10 subfamilies (Figure 2). Gene structure analysis demonstrated that GmPP2A-B′′48 and GmPP2A-B′′61 had similar intron structures and were divided into Group IX, while similar gene structure characteristics were discovered among GmPP2A-B′′36, GmPP2A-B′′68, GmPP2A-B′′51, and GmPP2A-B′′58 (Figures 2, 3). Motif analysis showed GmPP2A-B′′ family members contained the same Motifs in the amino acid structure were divided into the same groups. For example, GmPP2A-B′′15, GmPP2A-B′′16, and GmPP2A-B′′17 had a similar Motif structure and were classified as Group VI (Figure 4). These results indicate that gene structure and protein modification might be important indicators for phylogenetic analysis. Further analysis demonstrated 26 GmPP2A-B′′ genes were significantly induced in our drought- and salt-induced soybean transcriptome data (Figure 5). Of these 26 GmPP2A-B′′ genes, we screened 9 GmPP2A-B′′ genes for qPCR analysis based on tissue-specific expression analysis. Among these nine GmPP2A-B′′ genes, GmPP2A-B′′12, GmPP2A-B′′33, GmPP2A-B′′56, GmPP2A-B′′69, and GmPP2A-B′′71 had ABRE-cis-acting elements that reportedly play an important role in the ABA pathway (Yang et al., 2020) and have high expression levels under drought and salt stresses (Figures 7–9). These results indicate that these five GmPP2A-B′′ genes could be associated with the ABA pathway and stress response. Additionally, we found that GmPP2A-B′′36 and GmPP2A-B′′68 had high homology and classified as Group III, they can all be induced by drought and salt stress. Similarly, both GmPP2A-B′′56 and GmPP2A-B′′71 were significantly induced under stress conditions and classified into Group I with the high homology (Figures 2, 8, 9), which suggested that they had conservation in the function to plant abiotic stress response.
As the climate changes, salt and drought stress will be the primary factors affecting soybean yield (Cui et al., 2019; Gao et al., 2020). Plants can respond to environmental stress through a series of signal regulation networks (Rasool et al., 2014), and the plant mevalonate (MVA) pathway plays an important role in plant stress tolerance. The HMG-CoA reductase (HMGR) gene is a key regulator in the MVA pathway, which is regulated by several endogenous signals and external stimuli (Chappell, 1995). Under normal conditions, PP2A-B′′β inhibits HMGR transcription, though PP2A-B′′α can regulate the transcription, translation, and activity levels of HMGR during plant response to salt stress (Leivar et al., 2011). These results indicate that the PP2A family participates in plant response to abiotic stress response. A novel Ca2+-binding protein, named AtCP1 (AtPP2A-B′′43) has a high degree of amino acid sequence homology to the Ca2+-binding loops of the EF-hands of calmodulin, and the expression levels of the AtPP2A-B′′ genes can be induced by NaCl treatment (Jang et al., 1998). Our results demonstrated that GmPP2A-B′′71 has high homology with AtPP2A-B′′43 (Supplementary Figure 2) and can be induced by salt stress. These results further indicate that GmPP2A-B′′71 participated in plant response to salt stress. In addition, some studies have demonstrated the key role of redox homeostasis in plant development, ROS production, and ROS-related signals on the growth of various plant tissues (Mhamdi and Van Breusegem, 2018). Abiotic stress can induce high ROS levels (Mhamdi et al., 2010). Recent research demonstrated that PP2A proteins are involved in salt tolerance and plant oxidative stress (Mathe et al., 2019, 2021). However, the relationship between PP2A proteins, ROS, and plant stress response was still unclear. Our study revealed that GmPP2A-B′′71-OE plants had lower ROS levels than EV-control plants under drought and salt stresses and that GmPP2A-B′′71-RNAi plants had higher ROS levels compared with EV-control plants (Figure 11). This indicates that GmPP2A-B′′71 could be involved in the ROS regulation pathway and help to improve plant stress tolerance.
Reactive oxygen species pathways in plants can be divided into ROS synthesis pathways and ROS scavenging pathways. However, the most important way to improve plant stress tolerance is to improve ROS scavenging capacity (Baxter et al., 2014). Certain key genes play important roles in ROS scavenging capacity and plant stress tolerance. For example, CAT is an important enzyme involved in H2O2-metabolizing in plants (Mhamdi et al., 2010). The deficient function of CAT contributes to increased levels of peroxide (H2O2), which gives rise to an imbalance in ROS homeostasis. Overexpression of CAT removes the excess H2O2, which can maintain a steady pattern of ROS to mediate plant growth regulation (Vandenabeele et al., 2004). Harsh environmental conditions such as salt, drought, and heat can induce high ROS levels, while CAT can be induced in plants to improve stress tolerance by removing ROS (Mhamdi et al., 2010). POD is another important plant enzyme and can catalyze H2O2 to reduce its oxidative activity, maintaining plant growth homeostasis. The study demonstrates that stress-induced high POD expression levels contribute to the protection of a plant’s callus cells (Zhang et al., 2019). These results revealed that CAT and POD plants are critical to maintaining ROS homeostasis under stress conditions. The late embryogenesis abundant (LEA) protein is an important protein family and was highly enriched during late seed development. Research showed that the LEA protein is related to plant drought tolerance, and can be induced by high temperatures, salt, and cold temperatures (Poonia et al., 2020). When plants were exposed to abiotic stress conditions, resulting in the decreased cellular water content (Morales et al., 2003), LEA proteins were induced to protect the cell water content and prevent the intercellular dehydration caused by protein denaturation (Kovacs et al., 2008). Additionally, some study demonstrated that overexpression of LEAs in different plants can enhance transgenic plant stress tolerance. The overexpression of NtLEA7-3 in Arabidopsis promotes drought and salt stress tolerance of transgenic Arabidopsis (Gai et al., 2011). A recent study showed that LEA proteins were associated with antioxidant activity and involved in the ROS pathway in plants (Poonia et al., 2020). These results indicate the importance of LEA in plant tolerance to abiotic stress. Plant transcription factors are regulators that play important roles in plant response to abiotic stresses. Of these plant transcription factors, the AP2/ERF transcription factor family regulates plant developmental processes and various kinds of environmental stress responses (Xu et al., 2011). A recent study found that the AP2/ERF transcription factor gene AtERF115 can mediate the ROS signaling and maintain the root stem and root growth through phytosulfokine (PSK) peptide incorporation (Kong et al., 2018). This indicates the relationship between AP2/ERF transcription factors and the ROS signaling. The research revealed that LEA, CAT, POD, and ERF family gene were crucial in inhibiting accumulation of ROS under stress conditions. In addition, our study showed that under salt and drought stresses, GmPP2A-B′′71-OE plants presented higher stress tolerance and lower ROS levels than EV-control plants, and the qPCR results demonstrated that the expression levels of GmLEA15, GmCAT1, GmPOD, and GmERF115 genes in GmPP2A-B′′71-OE plants were significantly enhanced compared with those in EV-control plants, while the expression levels of these genes decreased in GmPP2A-B′′71-RNAi plants. These results imply that GmPP2A-B′′71 gene maybe affect the expression of transcriptional regulation factor which was related with ROS signaling, such as GmERF115, to mediate regulation of critical gene transcription that was involved in ROS scavenging. Together, these results indicate that GmPP2A-B′′71 can enhance plant stress tolerance by regulating the ROS scavenging pathway, making it a candidate gene for plant tolerance to stress.
Data Availability Statement
The original contributions presented in the study are included in the article/Supplementary Material, further inquiries can be directed to the corresponding authors.
Author Contributions
Z-SX coordinated the project, conceived and designed the experiments, and edited the manuscript. YX performed the experiments and wrote the first draft. X-HF, QW, Z-GY, and X-WS generated and analyzed the data. Y-ZM and JM reviewed and contributed valuable discussions. Y-ZM coordinated the project. All authors have read and approved the final manuscript.
Funding
This research was financially supported by the Central Public-Interest Scientific Institution Basal Research Fund (S2021ZD02), the Agricultural Science and Technology Innovation Program (CAAS-ZDRW202109 and CAAS-ZDRW202002), and identification of NFY gene in soybean stress-tolerant breeding (0201-202020492).
Conflict of Interest
The authors declare that the research was conducted in the absence of any commercial or financial relationships that could be construed as a potential conflict of interest.
Publisher’s Note
All claims expressed in this article are solely those of the authors and do not necessarily represent those of their affiliated organizations, or those of the publisher, the editors and the reviewers. Any product that may be evaluated in this article, or claim that may be made by its manufacturer, is not guaranteed or endorsed by the publisher.
Acknowledgments
We thank Tai-Fei Yu of the Institute of Crop Science, CAAS for his advices in revising the manuscript.
Supplementary Material
The Supplementary Material for this article can be found online at: https://www.frontiersin.org/articles/10.3389/fpls.2021.784038/full#supplementary-material
Footnotes
- ^ https://phytozome.jgi.doe.gov/pz/portal.html
- ^ https://web.expasy.org/protparam/
- ^ http://mg2c.iask.in/mg2c_v2.0/
- ^ http://gsds.cbi.pku.edu.cn/
- ^ http://meme-suite.org/tools/meme
- ^ https://www.soybase.org/
References
Alam, H., Khattak, J. Z. K., Ksiksi, T. S., Saleem, M. H., Fahad, S., Sohail, H., et al. (2021). Negative impact of long-term exposure of salinity and drought stress on native Tetraena mandavillei L. Physiol. Plant 172, 1336–1351. doi: 10.1111/ppl.13273
Bailey, T. L., Boden, M., Buske, F. A., Frith, M., Grant, C. E., Clementi, L., et al. (2009). MEME SUITE: tools for motif discovery and searching. Nucleic Acids Res. 37, W202–W208. doi: 10.1093/nar/gkp335
Baxter, A., Mittler, R., and Suzuki, N. (2014). ROS as key players in plant stress signalling. J. Exp. Bot. 65, 1229–1240. doi: 10.1093/jxb/ert375
Bheri, M., and Pandey, G. K. (2019). PP2A Phosphatases Take a Giant Leap in the Post-Genomics Era. Curr. Genomics 20, 154–171. doi: 10.2174/1389202920666190517110605
Chappell, J. (1995). Biochemistry and molecular biology of the isoprenoid biosynthetic pathway in plants. Plant Physiol. Plant Mol. Biol 46, 521–547. doi: 10.1146/annurev.pp.46.060195.002513
Cui, X. Y., Gao, Y., Guo, J., Yu, T. F., Zheng, W. J., Liu, Y. W., et al. (2019). BES/BZR Transcription Factor TaBZR2 Positively Regulates Drought Responses by Activation of TaGST1. Plant Physiol. 180, 605–620. doi: 10.1104/pp.19.00100
Du, Y. T., Zhao, M. J., Wang, C. T., Gao, Y., Wang, Y. X., Liu, Y. W., et al. (2018). Identification and characterization of GmMYB118 responses to drought and salt stress. BMC Plant Biol. 18:320. doi: 10.1186/s12870-018-1551-7
Durian, G., Jeschke, V., Rahikainen, M., Vuorinen, K., Gollan, P. J., Brosche, M., et al. (2020). PROTEIN PHOSPHATASE 2A-B’gamma Controls Botrytis cinerea Resistance and Developmental Leaf Senescence. Plant Physiol. 182, 1161–1181. doi: 10.1104/pp.19.00893
Durian, G., Rahikainen, M., Alegre, S., Brosche, M., and Kangasjarvi, S. (2016). Protein Phosphatase 2A in the Regulatory Network Underlying Biotic Stress Resistance in Plants. Front. Plant Sci. 7:812. doi: 10.3389/fpls.2016.00812
Gabriele Siegll, C. M. A. M. S. (1990). Sucrose-phosphate synthase is dephosphorylated by protein phoshatase 2A in spinach leaves. FEBS Lett. 270, 198–202. doi: 10.1016/0014-5793(90)81267-r
Gai, X.-L. J., Wei, L. Xue-Juan, H. Guo-Dong, Y. Cheng-Chao, Z. (2011). A novel late embryogenesis abundant like protein associated with chilling stress in Nicotiana tabacum cv. bright yellow-2 cell suspension culture. Mol. Cell. Proteomics 10:M111.010363. doi: 10.1074/mcp.M111.010363
Gao, X.-B., Guo, C., Li, F.-M., Li, M., and He, J. (2020). High Soybean Yield and Drought Adaptation Being Associated with Canopy Architecture, Water Uptake, and Root Traits. Agronomy 10:608. doi: 10.3390/agronomy10040608
Hu, B., Jin, J., Guo, A. Y., Zhang, H., Luo, J., and Gao, G. (2015). GSDS 2.0: an upgraded gene feature visualization server. Bioinformatics 31, 1296–1297. doi: 10.1093/bioinformatics/btu817
Jang, H. J., Pih, K. T., Kang, S. G., Lim, J. H., Jin, J. B., and Piao, H. L. (1998). Molecular cloning of a novel Ca2+-binding protein that is induced by NaCl stress. Plant Mol. Biol. 37, 839–847. doi: 10.1023/a:1006043006211
Ikura, M. (1996). Calcium binding and conformational response in EF-hand proteins. Trends Biochem. Sci. 21, 14–17. doi: 10.1016/s0968-0004(06)80021-6
Jian, B., Liu, B., Bi, Y., Hou, W., Wu, C., and Han, T. (2008). Validation of internal control for gene expression study in soybean by quantitative real-time PCR. BMC Mol. Biol. 9:59. doi: 10.1186/1471-2199-9-59
Kataya, A. R., Heidari, B., Hagen, L., Kommedal, R., Slupphaug, G., and Lillo, C. (2015). Protein phosphatase 2A holoenzyme is targeted to peroxisomes by piggybacking and positively affects peroxisomal beta-oxidation. Plant Physiol. 167, 493–506. doi: 10.1104/pp.114.254409
Kereszt, A., Li, D., Indrasumunar, A., Nguyen, C. D., Nontachaiyapoom, S., Kinkema, M., et al. (2007). Agrobacterium rhizogenes-mediated transformation of soybean to study root biology. Nat. Protoc. 2, 948–952. doi: 10.1038/nprot.2007.141
Kong, X., Tian, H., Yu, Q., Zhang, F., Wang, R., Gao, S., et al. (2018). PHB3 Maintains Root Stem Cell Niche Identity through ROS-Responsive AP2/ERF Transcription Factors in Arabidopsis. Cell Rep. 22, 1350–1363. doi: 10.1016/j.celrep.2017.12.105
Kovacs, D., Kalmar, E., Torok, Z., and Tompa, P. (2008). Chaperone activity of ERD10 and ERD14, two disordered stress-related plant proteins. Plant Physiol. 147, 381–390. doi: 10.1104/pp.108.118208
Le, D. T., Nishiyama, R., Watanabe, Y., Mochida, K., Yamaguchi-Shinozaki, K., Shinozaki, K., et al. (2011). Genome-wide expression profiling of soybean two-component system genes in soybean root and shoot tissues under dehydration stress. DNA Res. 18, 17–29. doi: 10.1093/dnares/dsq032
Leivar, P., Antolin-Llovera, M., Ferrero, S., Closa, M., Arro, M., Ferrer, A., et al. (2011). Multilevel control of Arabidopsis 3-hydroxy-3-methylglutaryl coenzyme A reductase by protein phosphatase 2A. Plant Cell. 23, 1494–1511. doi: 10.1105/tpc.110.074278
Li, Y., Wang, Y., Tan, S., Li, Z., Yuan, Z., Glanc, M., et al. (2020). Root Growth Adaptation is Mediated by PYLs ABA Receptor-PP2A Protein Phosphatase Complex. Adv. Sci. 7:1901455. doi: 10.1002/advs.201901455
Liu, D., Li, A., Mao, X., and Jing, R. (2014). Cloning and characterization of TaPP2AbB”-alpha, a member of the PP2A regulatory subunit in wheat. PLoS One 9:e94430. doi: 10.1371/journal.pone.0094430
Magali Lescot, M., Déhais, P., Thijs, G., Marchal, K., Moreau, Y., and Van de Peer, Y. et al. (2002). PlantCARE, a database of plant cis-acting regulatory elements and a portal to tools for in silico analysis of promoter sequences. Nucleic Acids Res. 30, 325–7. doi: 10.1093/nar/30.1.325
Mathe, C., Garda, T., Freytag, C., and M-Hamvas, M. (2019). The Role of Serine-Threonine Protein Phosphatase PP2A in Plant Oxidative Stress Signaling-Facts and Hypotheses. Int. J. Mol. Sci. 20:3028. doi: 10.3390/ijms20123028
Mathe, C., M-Hamvas, M., Freytag, C., and Garda, T. (2021). The Protein Phosphatase PP2A Plays Multiple Roles in Plant Development by Regulation of Vesicle Traffic-Facts and Questions. Int. J. Mol. Sci. 22:975. doi: 10.3390/ijms22020975
Mhamdi, A., Queval, G., Chaouch, S., Vanderauwera, S., Van Breusegem, F., and Noctor, G. (2010). Catalase function in plants: a focus on Arabidopsis mutants as stress-mimic models. J. Exp. Bot. 61, 4197–4220. doi: 10.1093/jxb/erq282
Mhamdi, A., and Van Breusegem, F. (2018). Reactive oxygen species in plant development. Development 145:dev164376. doi: 10.1242/dev.164376
Morales, D. Rodríguez, P. Dell’Amico, J. Nicolás, E., and Torrecillas, A.Sánchez-Blanco, M. J. (2003). High-temperature preconditioning and thermal shock imposition affects water relations, gas exchange and root hydraulic conductivity in tomato. Biol. Plantarum 46, 203–208. doi: 10.1023/B:BIOP.0000022252.70836.fc
Poonia, A. K., Mishra, S. K., Sirohi, P., Chaudhary, R., Kanwar, M., Germain, H., et al. (2020). Overexpression of wheat transcription factor (TaHsfA6b) provides thermotolerance in barley. Planta 252:53. doi: 10.1007/s00425-020-03457-4
Qureshi, O., Cho, H., Choudhary, M., and Seeling, J. M. (2015). A Nonsynonymous/Synonymous Substitution Analysis of the B56 Gene Family Aids in Understanding B56 Isoform Diversity. PLoS One 10:e0145529. doi: 10.1371/journal.pone.0145529
Rahikainen, M., Pascual, J., Alegre, S., Durian, G., and Kangasjarvi, S. (2016). PP2A Phosphatase as a Regulator of ROS Signaling in Plants. Antioxidants 5:8. doi: 10.3390/antiox5010008
Rasool, B., Karpinska, B., Konert, G., Durian, G., Denessiouk, K., and Kangasjärvi, S. (2014). Effects of light and the regulatory b-subunit composition of protein phosphatase 2A on the susceptibility of Arabidopsis thaliana to Aphid. Front. Plant Sci. 5:405. doi: 10.3389/fpls.2014.00405
Sabine, J., Rundle, M. E. N., June, B., and Nasrallah. (1993). Effects of Inhibitors of Protein Serine/Threonine Phosphatases on Pollination in Brassica. Plant Physiol. 103, 1165–1171. doi: 10.1104/pp.103.4.1165
Skelton, N. J., Kördel, J., Akke, M., Forsén, S., and Chazin, W. J. (1994). Signal transduction versus buffering activity in Ca2+-binding proteins. Nat. Struct. Biol. 1, 239–245. doi: 10.1038/nsb0494-239
Takeo, K., and Ito, T. (2017). Subcellular localization of VIP1 is regulated by phosphorylation and 14-3-3 proteins. FEBS Lett. 591, 1972–1981. doi: 10.1002/1873-3468.12686
Tang, W., Yuan, M., Wang, R., Yang, Y., Wang, C., Oses-Prieto, J. A., et al. (2011). PP2A activates brassinosteroid-responsive gene expression and plant growth by dephosphorylating BZR1. Nat. Cell. Biol. 13, 124–131. doi: 10.1038/ncb2151
Tompa, P., Davey, N. E., Gibson, T. J., and Babu, M. M. (2014). A million peptide motifs for the molecular biologist. Mol. Cell. 55, 161–169. doi: 10.1016/j.molcel.2014.05.032
Tsugama, D., Liu, S., Fujino, K., and Takano, T. (2018). Calcium signalling regulates the functions of the bZIP protein VIP1 in touch responses in Arabidopsis thaliana. Ann. Bot. 122, 1219–1229. doi: 10.1093/aob/mcy125
Tsugama, D., Liu, S., and Takano, T. (2012). A bZIP protein, VIP1, is a regulator of osmosensory signaling in Arabidopsis. Plant Physiol. 159, 144–155. doi: 10.1104/pp.112.197020
Tsugama, D., Yoon, H. S., Fujino, K., Liu, S., and Takano, T. (2019). Protein phosphatase 2A regulates the nuclear accumulation of the Arabidopsis bZIP protein VIP1 under hypo-osmotic stress. J. Exp. Bot. 70, 6101–6112. doi: 10.1093/jxb/erz384
Uhrig, R. G., Labandera, A. M., and Moorhead, G. B. (2013). Arabidopsis PPP family of serine/threonine protein phosphatases: many targets but few engines. Trends Plant Sci. 18, 505–513. doi: 10.1016/j.tplants.2013.05.004
Vandenabeele, S., Vanderauwera, S., Vuylsteke, M., Rombauts, S., Langebartels, C., Seidlitz, H. K., et al. (2004). Catalase deficiency drastically affects gene expression induced by high light in Arabidopsis thaliana. Plant J. 39, 45–58. doi: 10.1111/j.1365-313X.2004.02105.x
Wang, X., Bajaj, R., Bollen, M., Peti, W., and Page, R. (2016). Expanding the PP2A Interactome by Defining a B56-Specific SLiM. Structure 24, 2174–2181. doi: 10.1016/j.str.2016.09.010
Wang, Z. Q., Yu, T. F., Sun, G. Z., Zheng, J. C., Chen, J., Zhou, Y. B., et al. (2021). Genome-Wide Analysis of the Catharanthus roseus RLK1-Like in Soybean and GmCrRLK1L20 Responds to Drought and Salt Stresses. Front. Plant. Sci. 12:614909. doi: 10.3389/fpls.2021.614909
Xu, Y., Xing, Y., Chen, Y., Chao, Y., Lin, Z., Fan, E., et al. (2006). Structure of the protein phosphatase 2A holoenzyme. Cell 127, 1239–1251. doi: 10.1016/j.cell.2006.11.033
Xu, Z. S., Chen, M., Li, L. C., and Ma, Y. Z. (2011). Functions and application of the AP2/ERF transcription factor family in crop improvement. J. Integr. Plant. Biol. 53, 570–585. doi: 10.1111/j.1744-7909.2011.01062.x
Yang, Q., Yang, B., Li, J., Wang, Y., Tao, R., Yang, F., et al. (2020). ABA-responsive ABRE-BINDING FACTOR3 activates DAM3 expression to promote bud dormancy in Asian pear. Plant Cell. Environ. 43, 1360–1375. doi: 10.1111/pce.13744
Yap, K. L., Ames, J. B., Swindells, M. B., and Ikura, M. (1999). Diversity of conformational states and changes within the EF-hand protein superfamily. Proteins 37, 499–507. doi: 10.1002/(sici)1097-0134(19991115)37:3<499::aid-prot17>3.0.co;2-y
Yoo, S. D., Cho, Y. H., and Sheen, J. (2007). Arabidopsis mesophyll protoplasts: a versatile cell system for transient gene expression analysis. Nat. Protoc. 2, 1565–1572. doi: 10.1038/nprot.2007.199
Yoon, H. S., Fujino, K., Liu, S., Takano, T., and Tsugama, D. (2021). The B”-family subunits of protein phosphatase 2A are necessary for in-vitro dephosphorylation of the Arabidopsis mechanosensory transcription factor VIP1. Biochem. Biophys. Res. Commun. 534, 353–358. doi: 10.1016/j.bbrc.2020.11.078
Yu, R. M., Wong, M. M., Jack, R. W., and Kong, R. Y. (2005). Structure, evolution and expression of a second subfamily of protein phosphatase 2A catalytic subunit genes in the rice plant (Oryza sativa L.). Planta 222, 757–768. doi: 10.1007/s00425-005-0018-x
Yu, T. F., Liu, Y., Fu, J. D., Ma, J., Fang, Z. W., Chen, J., et al. (2021). The NF-Y-PYR module integrates the abscisic acid signal pathway to regulate plant stress tolerance. Plant Biotechnol. J. 19, 2589–2605. doi: 10.1111/pbi.13684
Yu, T. F., Zhao, W. Y., Fu, J. D., Liu, Y. W., Chen, M., Zhou, Y. B., et al. (2018). Genome-wide analysis of CDPK family in foxtail millet and determination of SiCDPK24 functions in drought stress. Front. Plant Sci. 9:651. doi: 10.3389/fpls.2018.00651
Zhang, Y., Zhang, Y., Yu, J., Zhang, H., Wang, L., Wang, S., et al. (2019). NaCl-responsive ROS scavenging and energy supply in alkaligrass callus revealed from proteomic analysis. BMC Genomics 20:990. doi: 10.1186/s12864-019-6325-6
Keywords: protein phosphatase 2A-B′′, genomic analysis, soybean, drought, salt
Citation: Xiong Y, Fan X-H, Wang Q, Yin Z-G, Sheng X-W, Chen J, Zhou Y-B, Chen M, Ma Y-Z, Ma J and Xu Z-S (2022) Genomic Analysis of Soybean PP2A-B′′ Family and Its Effects on Drought and Salt Tolerance. Front. Plant Sci. 12:784038. doi: 10.3389/fpls.2021.784038
Received: 27 September 2021; Accepted: 30 December 2021;
Published: 02 February 2022.
Edited by:
Yin-Gang Hu, Northwest A&F University, ChinaReviewed by:
Tomas Takac, Palacký University Olomouc, CzechiaJian Yan, South China Agricultural University, China
Copyright © 2022 Xiong, Fan, Wang, Yin, Sheng, Chen, Zhou, Chen, Ma, Ma and Xu. This is an open-access article distributed under the terms of the Creative Commons Attribution License (CC BY). The use, distribution or reproduction in other forums is permitted, provided the original author(s) and the copyright owner(s) are credited and that the original publication in this journal is cited, in accordance with accepted academic practice. No use, distribution or reproduction is permitted which does not comply with these terms.
*Correspondence: Jian Ma, bWFqaWFuMTk3OTE2QGpsYXUuZWR1LmNu; Zhao-Shi Xu, eHV6aGFvc2hpQGNhYXMuY24=
†These authors have contributed equally to this work
 Yang Xiong
 Xu-Hong Fan3†
 Jun Chen
 Ming Chen
 You-Zhi Ma
 Zhao-Shi Xu