 Sayantan Sarkar
 Avat Shekoofa
 Angela McClure1
 Jason D. Gillman
95% of researchers rate our articles as excellent or good
Learn more about the work of our research integrity team to safeguard the quality of each article we publish.
Find out more
ORIGINAL RESEARCH article
Front. Plant Sci. , 20 January 2022
Sec. Plant Abiotic Stress
Volume 12 - 2021 | https://doi.org/10.3389/fpls.2021.779834
Soybean is most often grown under rainfed conditions and negatively impacted by drought stress in the upper mid-south of the United States. Therefore, identification of drought-tolerance traits and their corresponding genetic components are required to minimize drought impacts on productivity. Limited transpiration (TRlim) under high vapor pressure deficit (VPD) is one trait that can help conserve soybean water-use during late-season drought. The main research objective was to evaluate a recombinant inbred line (RIL) population, from crossing two mid-south soybean lines (“Jackson” × “KS4895”), using a high-throughput technique with an aquaporin inhibitor, AgNO3, for the TRlim trait. A secondary objective was to undertake a genetic marker/quantitative trait locus (QTL) genetic analysis using the AgNO3 phenotyping results. A set of 122 soybean genotypes (120-RILs and parents) were grown in controlled environments (32/25-d/n °C). The transpiration rate (TR) responses of derooted soybean shoots before and after application of AgNO3 were measured under 37°C and >3.0 kPa VPD. Then, the decrease in transpiration rate (DTR) for each genotype was determined. Based on DTR rate, a diverse group (slow, moderate, and high wilting) of 26 RILs were selected and tested for the whole plant TRs under varying levels of VPD (0.0–4.0 kPa) at 32 and 37°C. The phenotyping results showed that 88% of slow, 50% of moderate, and 11% of high wilting genotypes expressed the TRlim trait at 32°C and 43, 10, and 0% at 37°C, respectively. Genetic mapping with the phenotypic data we collected revealed three QTL across two chromosomes, two associated with TRlim traits and one associated with leaf temperature. Analysis of Gene Ontologies of genes within QTL regions identified several intriguing candidate genes, including one gene that when overexpressed had previously been shown to confer enhanced tolerance to abiotic stress. Collectively these results will inform and guide ongoing efforts to understand how to deploy genetic tolerance for drought stress.
Plant photosynthesis and transpirational rates are highly coupled (Sinclair, 2017). Most of the water lost by plants under stress is due to transpiration, which is linked to stomatal opening to allow CO2 diffusion (Devi and Reddy, 2018a; Shekoofa and Sinclair, 2020). Hence, water loss due to transpiration is linked to plant biomass growth and yield (Tanner and Sinclair, 1983; Blum, 2009). Low water availability reduces assimilate partitioning to reproductive sinks, and on a cellular level impairs cell growth and division (Blum, 2011; Sarkar, 2020; Bennett et al., 2021; Sarkar et al., 2021a). Water related stresses, such as direct drought stress and associated factors including high temperature and evaporative demand, reduce both transpiration and photosynthesis, resulting in reduced crop yield (Sinclair, 2017; Balota et al., 2021).
However, it is suggested that under extreme drought or high atmospheric vapor pressure deficit (VPD) conditions, restriction of stomatal conductance might increase photosynthetic return per unit of transpiration (Sinclair et al., 2005, 2010; Devi et al., 2009; Gholipoor et al., 2010; Carpentieri-Pipolo et al., 2012; Gaffney et al., 2015; Shekoofa et al., 2020). These traits result in restricted TR under high vapor pressure conditions, such that water is conserved in the soil and is available during subsequent drought periods. Thus, plants resort to drought avoidance mechanism such as limited transpiration (TRlim) and minimizing stomatal conductance (Kooyers, 2015; Basu et al., 2016; Devi et al., 2016). These studies also suggested that reduced TR and stomatal conductance are controlled by gene expression. Such mechanisms have been successfully studied in crop species, including: maize (Zea Mays L.) (Fletcher et al., 2007; Shekoofa et al., 2016), peanut (Arachis hypogaea L.) (Devi et al., 2009; Shekoofa et al., 2013, 2017), cotton (Gossypium hirsutum L.) (Devi and Reddy, 2018b; Shekoofa et al., 2020), sorghum (Sorghum bicolor L.) (Gholipoor et al., 2010; Choudhary et al., 2013), and soybean [Glycine max (L.) Merr.] (Bunce, 1981; Devi et al., 2014; Sarkar et al., 2021b). Of particular interest, soybean showed a decrease in stomatal conductance between VPD of 1.0 and 2.5 kPa, differing within genotypes (Bunce, 1981).
Decreases in transpiration rate and stomatal conductance are affected by leaf temperature (LT) (Gates, 1964; Blum, 2011). Gates (1964) argued convincingly that increase in LT can be lethal for plants and that transpiration is required to cool the leaves. The study also argues that even a slow rate of transpiration can dissipate enough heat from leaves to have a huge impact on photosynthesis and growth of plants. This implies that plants with slower rate of transpiration (with subsequently warmer leaves than plants with higher rates of transpiration) could be better drought-tolerant by conserving moisture during low water stress, which would be available later in the season when evaporative demand is higher. Under field conditions, drought-tolerant peanut genotypes (with partial stomata closure trait) displayed a downward LT slope with an increase in VPD during midday (1100 to 1400 EST) (Balota and Sarkar, 2020). Bai and Purcell (2018) observed an interaction between LT and slow and fast-wilting soyabean genotypes, where slow-wilting genotypes had a lower LT during water-deficit stress.
It is essential that any putative water saving trait should result in monetarily relevant yield benefit and should have genetic variability within the target crop species (Sadok and Sinclair, 2011). In fact, soybean genotype PI 416937 has been identified as expressing the TRlim trait (i.e., slow-wilting) phenotype in the field under high VPD (>2.5 kPa), and this has been traced to low leaf hydraulic conductance (Sinclair et al., 2008). Sadok and Sinclair (2012) suggested that the low leaf hydraulic conductance in PI 416937 might be related to a unique population of aquaporins (AQPs) in its leaves. Further studies have shown that soybean genotypes expressing TRlim trait are insensitive to aquaporin inhibitors, such as silver and zinc ions (Sadok and Sinclair, 2010, 2012; Devi et al., 2016).
In plants, AQPs occur in multiple isoforms in both plasmalemma and tonoplast membranes resulting in regulation of water flow in and out of cells. Physiological and molecular studies have identified AQPs as playing key roles in regulating hydraulic conductance in leaves and roots (Beaudette et al., 2007; Shekoofa and Sinclair, 2018; Sung et al., 2021). Therefore, the high-throughput phenotyping of structured soybean populations, along with molecular genotyping is needed for marker development. This type of research is essential for making the soybean genome sequence useful for breeding purposes, in particular for screening drought-tolerant soybean lines based on their sensitivity to aquaporin inhibitors.
In this work, we used a two-tiered screening method to identify soybean genotypes with the TRlim trait. Our method is similar to the three-tiered approach by Sinclair et al. (2000). Direct measures of the transpiration response rate to increasing VPD are low-throughput, tedious, and require specialized equipment. Furthermore, the number of genotypes that can be directly phenotyped for the TRlim trait is very limited. Thus, an indirect measurement of TR that may be less accurate but can allow characterization of a large number of genotypes would be helpful in breeding for the TRlim trait (Choudhary and Sinclair, 2014). Choudhary and Sinclair (2014) suggested that one possibility is that the response in TR to feeding of chemical inhibitors to leaves or roots of plants might allow discrimination among genotypes under varying VPD levels. Appropriate parents have to be chosen for crossing when it comes to screening for drought tolerance traits. Previous studies have reported that soybean genotypes “KS4895” and “Jackson” differ in drought tolerance traits such as delayed wilting, ureide, and nitrogen concentration (Sinclair et al., 2007; Charlson et al., 2009; Hwang et al., 2013, 2015a,b; King et al., 2014). Therefore, the objectives of this study were to (a) evaluate 120 recombinant inbred lines (RILs; F3 and F5 derived from “KS4895” × “Jackson”) through a high-throughput phenotyping technique while measuring the RILs transpiration sensitivity rate to aquaporin inhibitor (AgNO3) under high VPD condition (initial/indirect screening for TRlim) (b) directly measure the TR of 26 selected RILs from objective “a” and categorize them for the TRlim trait under high VPD and temperature (direct screening for TRlim), and finally (c) undertake genetics/quantitative trait loci (QTLs) analysis for the RIL population in objective “a” and associate the potential QTLs with the drought tolerance trait, i.e., TRlim.
The experiments were conducted at the University of Tennessee West Tennessee Research and Education Center (WTREC), in Jackson, TN between 2018 and 2020. A group of 122 soybean genotypes including 120 RILs and their parents “Jackson” and “KS4895” that were tested during the study (Table 1) were provided by Dr. Larry Purcell (Hwang et al., 2015a). Genotype “KS4895” (PI 595081) is a maturity group (MG) IV developed in Kansas (Schapaugh and Dille, 1998), and “Jackson” (PI 548657) is an MG VII genotype developed by the USDA-ARS in North Carolina (Johnson, 1958). Due to greenhouse space limitations, and to increase the accuracy during data collection since a large number of bottles were involved in each weighing process, only a subset of genotypes was tested with the silver nitrate test. Thus, the RILs were grown in six sets under controlled environments in a greenhouse at 33–35°C and 35–50% humidity during day, and 20–22°C and 45–60% humidity during the night. Each set was grown for 4 weeks and included both parents.
Five soybean seeds were planted in 3-L pots filled with soil (commercially available Miracle-Gro potting mix) and inoculated with Bradyrhizobium japonicum (Verdesian Life Sciences, Cary, NC, United States). They were thinned to three plants per pot after 1 week in three-pot replicates per genotype. Plants were maintained in a well-watered condition, in 250 mL pots (i.e., pot capacity) during the initial growth pretreatment period. After approximately 4 weeks, the plants were ready for AgNO3 test. For the measurement of TR response to AQPs inhibitor, AgNO3, the technique explained by Sadok and Sinclair (2010), Shekoofa et al. (2013), and Devi et al. (2016) was followed.
The evening before the application of AgNO3, three replicate plants per soybean genotype were removed from the soil and derooted by cutting the base of the plant stem underwater using a sharp blade (Table 1). Then derooted soybean shoots were immediately placed in 150-mL Erlenmeyer flasks filled with deionized water. The shoots were kept in a dark laboratory room overnight for about 14 to 15 h with temperature maintained at 24°C. The following morning, the derooted shoots were transferred to another 150-mL Erlenmeyer flask containing fresh deionized water and sealed with Parafilm-“M” (Pechiney Plastic Packaging, Chicago, IL, United States) to avoid direct water evaporation from the flask. Then, in each set of experiment, the derooted shoots were moved to a greenhouse in which both temperature and VPD were high (Table 1).
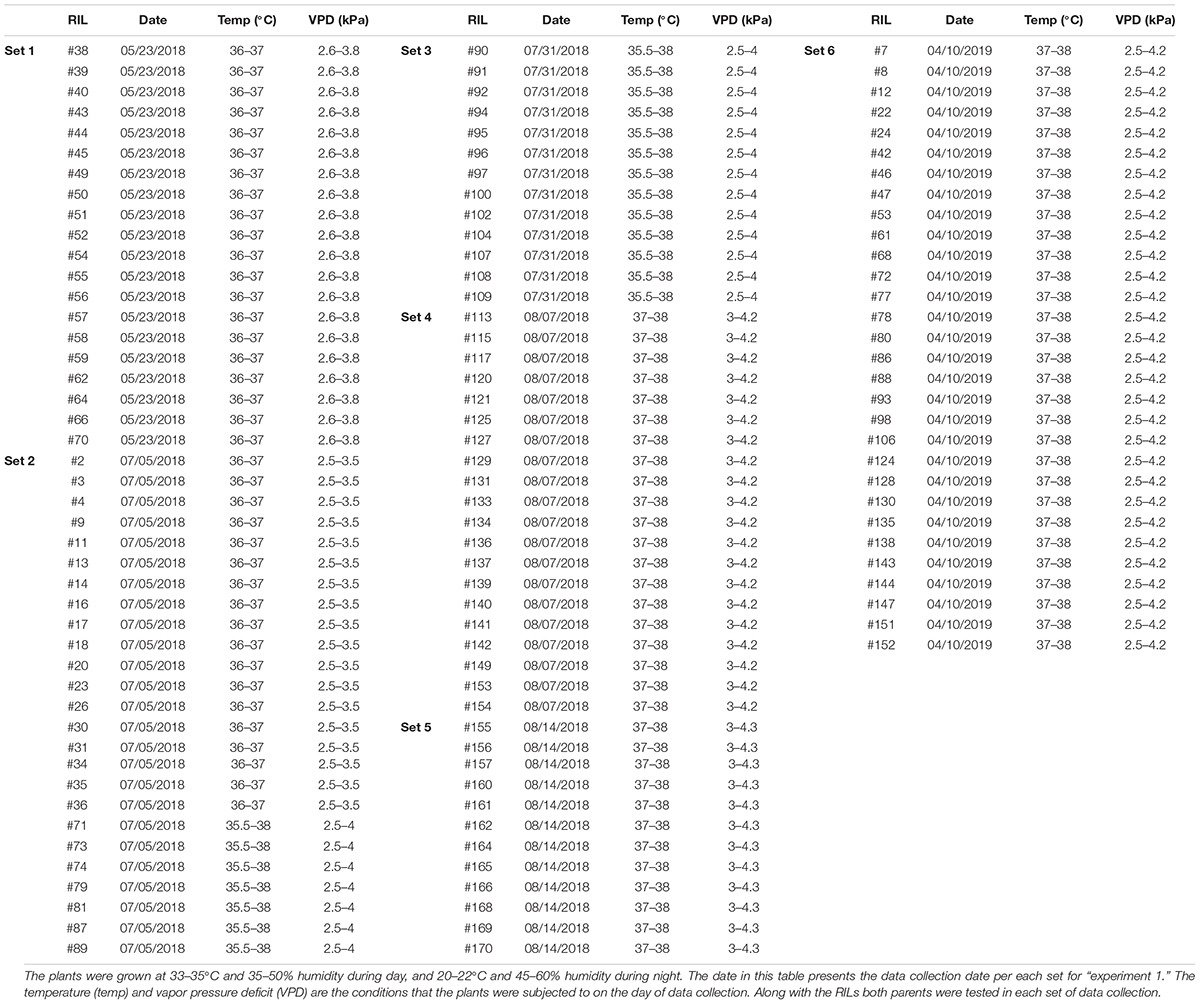
Table 1. Soybean recombinant inbred lines (RILs) from crossing “Jackson” and “KS4895” evaluated in this study.
Water-cooled lamps provided the photosynthetic photon flux density, which was 600 μmol m–2 s–1 at plant level (Mullen and Koller, 1988; Devi et al., 2016). The derooted shoots were allowed to acclimatize for 60 min and then the flasks plus derooted shoots were weighed (TR H2O initial). After another 60 min, the flasks plus derooted shoots were reweighed (TR H2O final), and the difference between the two weights divided by the time interval was used to calculate the TR in water (TRH2O). Following the second weighing of the derooted shoots in water, the individual shoots were quickly transferred to dark-brown, 30-mL glass bottles for exposure to the solution of 200 μM, AgNO3 aquaporin inhibitor (Sadok and Sinclair, 2010). The AgNO3 solution was freshly prepared on the day before each set of experiment. The AgNO3 solution concentration of 200 μM was selected because this concentration was the lowest concentration resulting in maximum transpiration decrease (Sadok and Sinclair, 2010). The derooted shoots were allowed to take up the AgNO3 solution for 60 min by which time TR of the shoots had again reached a constant value (Sadok and Sinclair, 2010).
After the 60 min period, all bottles were weighed to get an initial weight for the transpiration measurement following exposure to AgNO3 (TR AgNO3 initial). After 180 min, each bottle was again weighed (TR AgNO3 final). Measurements of TR for each shoot were generally completed in about 240 min after AgNO3 treatment. The TR following exposure to silver (TRAgNO3) was calculated based on the difference between these two weights divided by the time interval. The difference between TRH2O and TRAgNO3 were used to quantify decrease in TR using various arithmetic combinations (Table 2).
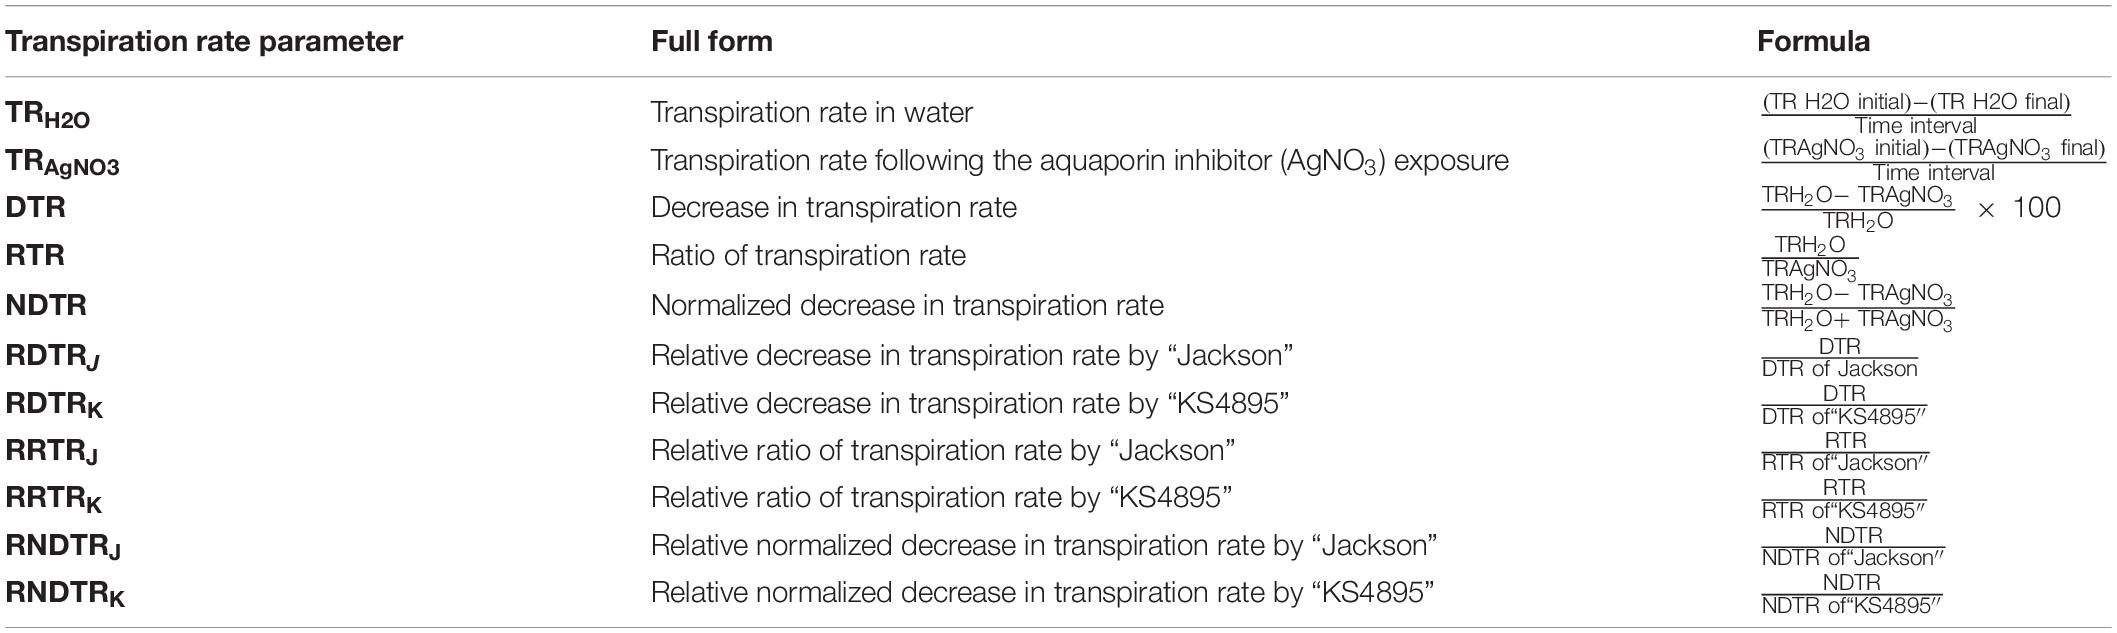
Table 2. Various transpiration rate parameters and its derivatives used for evaluation of soybean genotypes, “experiment 1.”
In each set, LT was measured for all tested derooted shoots using a FLIR C3 Thermal Camera with WiFi (Teledyne FLIR LLC, Wilsonville, OR, United States) between 1300 and 1500 CST. In each set of experiment, the corresponding thermal images were taken 1 m above the plant at a resolution of 0.9 cm per pixel for three replications of derooted shoots. The temperature at the central point of a fully expanded trifoliate leaf was obtained for each of the three plants from a thermal image using the camera software. The thermal data were collected after the last stage of exposure to AgNO3 when the final weighing was done. These data sets were used for calculating the average LT for each genotype.
A mixed linear model was applied to TR response data using the Fit Model function of JMP 14 (SAS Institute) using an input of 120 RIL lines (and two parental lines), for which we had both genotypic and phenotypic information. For mixed linear models, three factors were included: (1) genotype; (2) experiment; and (3) replication within each experiment. Only genotype was considered fixed, whereas other factors were considered random, and replication was nested within experiment. Principle component analysis (PCA) was run to create a PCA biplot of phenotypic measurements. Pearson’s correlation matrix was used to measure correlation among phenotypes. Polynomial regression was used to explain the variation of relative decrease in TR due to LT.
Broad sense heritability (H2) of all traits was calculated as the ratio of genotypic variance ( by phenotypic variance () (Phansak et al., 2016). Variance was calculated as the ratio of total sum of squares (TSS) to population size (n). The heritability data have been included in Supplementary File 1.
where ; R, number of replications.
Twenty-six soybean genotypes (24 RILs and both parents), based on RDTRK and RNDTRK (from the indirect measurement of transpiration, “Experiment I”), were selected to be tested for the direct TR measurement under varying levels of VPD (0.5 to 4.0 kPa). Soybean genotypes that had RDTRK and RNDTRK values from 0.00 to 0.50 were considered slow wilting, 0.51 to 1.00 were considered moderate wilting, and above 1.00 were considered as fast wilting. The plants were grown in pots constructed from polyvinyl chloride pipe (100-mm diameter and 200-mm long). The bottom of each pot was fitted with a flat end cap, in which a small hole was drilled to allow drainage of excess water. A toilet flange was attached to the top of the pot to allow easy attachment of a VPD chamber during measurements (Fletcher et al., 2007; Shekoofa et al., 2013). The pots were filled with commercially available Miracle-Gro potting mix. Five seeds per pot were sown and inoculated with B. japonicum (Verdesian Life Sciences, Cary, NC, United States). After 1 week, the plants were thinned to one plant per pot. Plants were fertilized with 200 mL of 0.075% V/V liquid fertilizer (0-10-10, N-P2O5-K2O, GH Inc., Sebastopol, CA, United States) at planting and again at 14 and 24 days after planting (DAP). Plants were grown for 28 days under well-watered conditions, with greenhouse temperatures regulated at 33°C day/26°C night. After approximately 4 weeks, four replicate plants of each genotype were selected and moved into a walk-in growth chamber and enclosed in individual humidity-regulated chambers (21 L). As there were 12 individual chambers, this meant that the genotypes had to be measured in batches that included three genotypes in each batch.
Measurements of transpiration response to VPD were carried out at 32 and 37°C. Each individual VPD chamber (21 L) was fitted with a 12-V, 80-mm-diameter cooling fan (Masscool) to continuously stir the air inside the chamber. Stirring of the air helped to maintain plant temperature near ambient air temperature within the VPD chamber. A humidity/temperature data logger (Lascar Electronics) was mounted through the sidewall of each container to monitor the environmental conditions of the chamber. The plants were subjected to three VPD levels: low (0–1.5 kPa), medium (1.5–2.5 kPa), and high (2.5–4 kPa), on two consecutive days for each temperature (i.e., 32 and 37°C). The humidity in the VPD chambers was obtained by adjusting the airflow rate through each chamber; in the case of the highest VPD treatment (2.5–4 kPa), the air was also initially flowed through a column of silica gel to dry the input air (Fletcher et al., 2007).
The observations of all plants for each genotype were combined for a two-segment linear regression analysis (Prism 8.0, GraphPad, Software Inc., San Diego, CA, United States) of TR versus varying VPD at both levels 32 and 37°C temperatures.
The outputs of a successful regression fit to the two-segment model were the coefficients defining two intersecting linear regressions and the VPD value at the breakpoint (BP) between the two linear segments:
The slopes of the two linear regressions (Slopes 1 and 2) were statistically compared to determine whether they differed significantly (p < 0.05). If the slopes differed, the double-linear regression was retained. When the slopes were not significantly different, a simple linear regression was applied to all the data (Devi et al., 2010; Shekoofa et al., 2020).
DNA was isolated from lyophilized leaf tissue for 118 out of 120 RIL lines, as well as the parental lines “KS4895” and “Jackson” using a Promega AS1600 kit (Promega, Madison, WI, United States) using a Maxwell RSC instrument (Promega). Two genotypes did not germinate and the leaf tissue could not be collected. Genotypes for genetic map creation and QTL detection were obtained using the SoySNP6k iSelect BeadChip (Song et al., 2020), an Illumina Infinium® HD array. Genotypes were called using the iScan and Genome Studio software (Illumina, San Diego, CA, United States) by Dr. Qijian Song and Chuck Quigley of the USDA-ARS. Genotypic results were imported into TASSEL 5 (Bradbury et al., 2007), where nonsegregating markers were removed, missing genotypes were imputed using LinkImpute (Money et al., 2015), functionality incorporated into TASSEL 5 (settings = 30 High LD sites, 10 nearest, 10,000,000 maximum distance), and imputed genotypes converted to ABH format (AA = “Jackson” allele homozygote, AB = heterozygote, BB = “KS4895” allele homozygote) using the ABH Genotype add-in. Data were then error-corrected using the R package ABHGenotypeR (Reuscher and Furuta, 2016) with settings maxHapLength = 5 used throughout. This resulted in 2,184 total genetic markers in the final genetic map. Genotypic data were then merged with phenotypic information and imported in the QTL package in R (Broman and Sen, 2009). Distance between genetic markers was estimated using the est.map function with settings typical of an F3 population (error.prob = 0.01, overall genotypes ratios were AA = 33.0%, AB = 33.8%, and BB = 33.3%). Markers which introduced large gaps or increased genetic map length were identified using the droponemarker1 command and manually removed if they reduced the size of the overall genetic mapping significantly.
Summary information on the genetic map is located Supplementary File 2 and the complete R/QTL file containing both genotypic and least square means (LSM) phenotypic data is located in Supplementary File 3.
Genetic mapping was performed within the R/QTL program (Broman and Sen, 2009) using two different QTL detection methods: standard interval mapping (SIM) and composite interval mapping (CIM) using the computer package R/QTL (Broman and Sen, 2009). Lod thresholds were determined from 1,000 permutation testing for each trait. Allelic effects were estimated after using “sim.geno” function (16 draws and an error probability of 0.01). QTL were used to build an additive model, which was fitted, refined, and then refitted using the functions “makeqtl,” “refineqtl,” and “fitqtl.” Results were extremely concordant between SIM and CIM; for brevity and clarity only CIM results are presented in this study.
Genes present in QTL regions were examined to identify potential candidate genes for the TRlim traits using the G. max genome assembly version Glyma.Wm82.a2.1 (Schmutz et al., 2010). Annotations were downloaded.2
We examined three detected QTL windows (Supplementary Table 1) to investigate Gene Ontologies (GOs) terms for biological process, cellular component, and molecular function. Genes were termed as candidates if they had biological process GO terms associated with: abscisic acid, water transport, root development, leaf senescence, jasmonic acid, heat acclimation, stomata, and/or salicylic acid (Schulze, 1986; Jackson et al., 2000; Schmutz et al., 2010; Khan et al., 2012; Jarzyniak and Jasinski, 2014; Sah et al., 2016).
Three primary traits (TRH2O, TRAgNO3, and LT) and nine secondary traits (DTR, RTR, NDTR, RDTRJ, RDTRK, RRTRJ, RRTRK, RNDTRJ, and RNDTRK) were phenotyped in the experiment for all tested genotypes (Table 2). Phenotypic values for the three primary traits followed a normal distribution for LT and an approximately normal distribution for TRH2O and TRAgNO3 (Table 3). Mean, upper 95% mean, and lower 95% mean of TRH2O were higher than TRAgNO3 (1.32, 0.1.43, 1.21 for TRH2O compared with 0.88, 0.95, 0.81 for TRAgNO3) (Table 3 and Figure 1). Across RILs genotypes, #162, #89, #97, #74, #16, #31, #161, #30, #168, #71, #26, and #137 had very low DTR (0–5%) and NDTR (0–0.02) whereas genotypes #52, #64, #17, #157, #91, #23, #34, #136, #73, #45, and #57 had low DTR (5–10%) and NDTR (0.03–0.05) (Supplementary Figure 1). However, the LT had better correlation with RDTRK (r = 0.52, p < 0.0001) and RNDTRK (r = 0.49, p < 0.0001) as compared with DTR (r = 0.39, p < 0.0001) and NDTR (r = 0.38, p < 0.0001) (Table 4 and Figure 2). Furthermore, the analysis of data by a polynomial regression showed that the variation in RDTRK and RNDTRK could be explained by LT (R2 = 0.54 and 0.56) (Figure 3). Therefore, RDTRK and RNDTRK were used to select a diversity of genotypes for further screening.
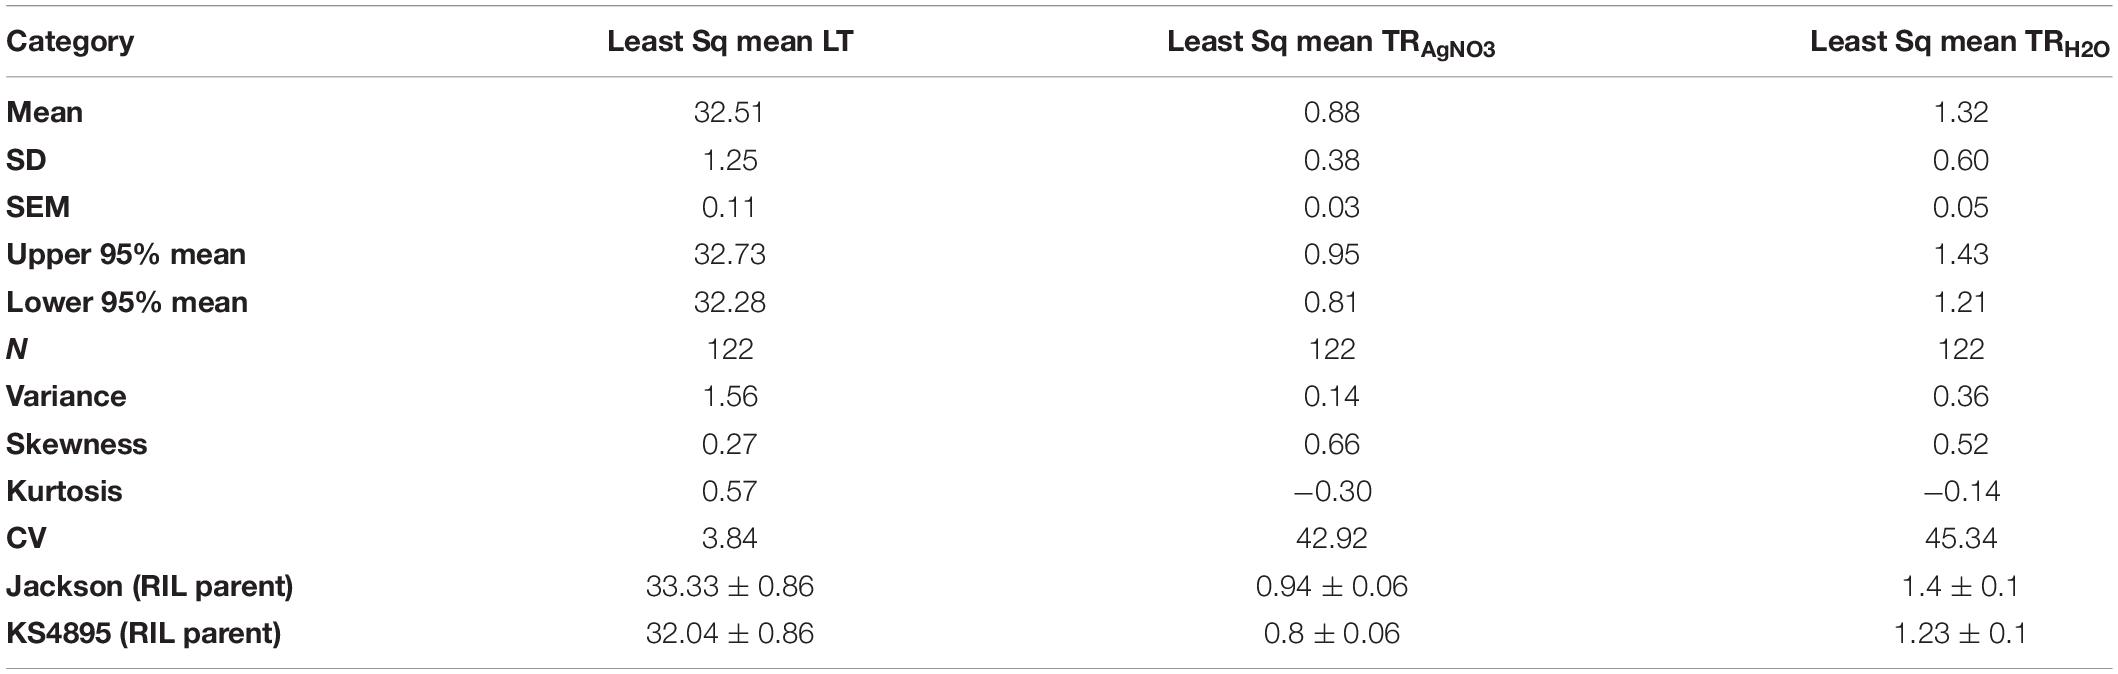
Table 3. Summary of the phenotypic values distribution for greenhouse “experiment 1.”
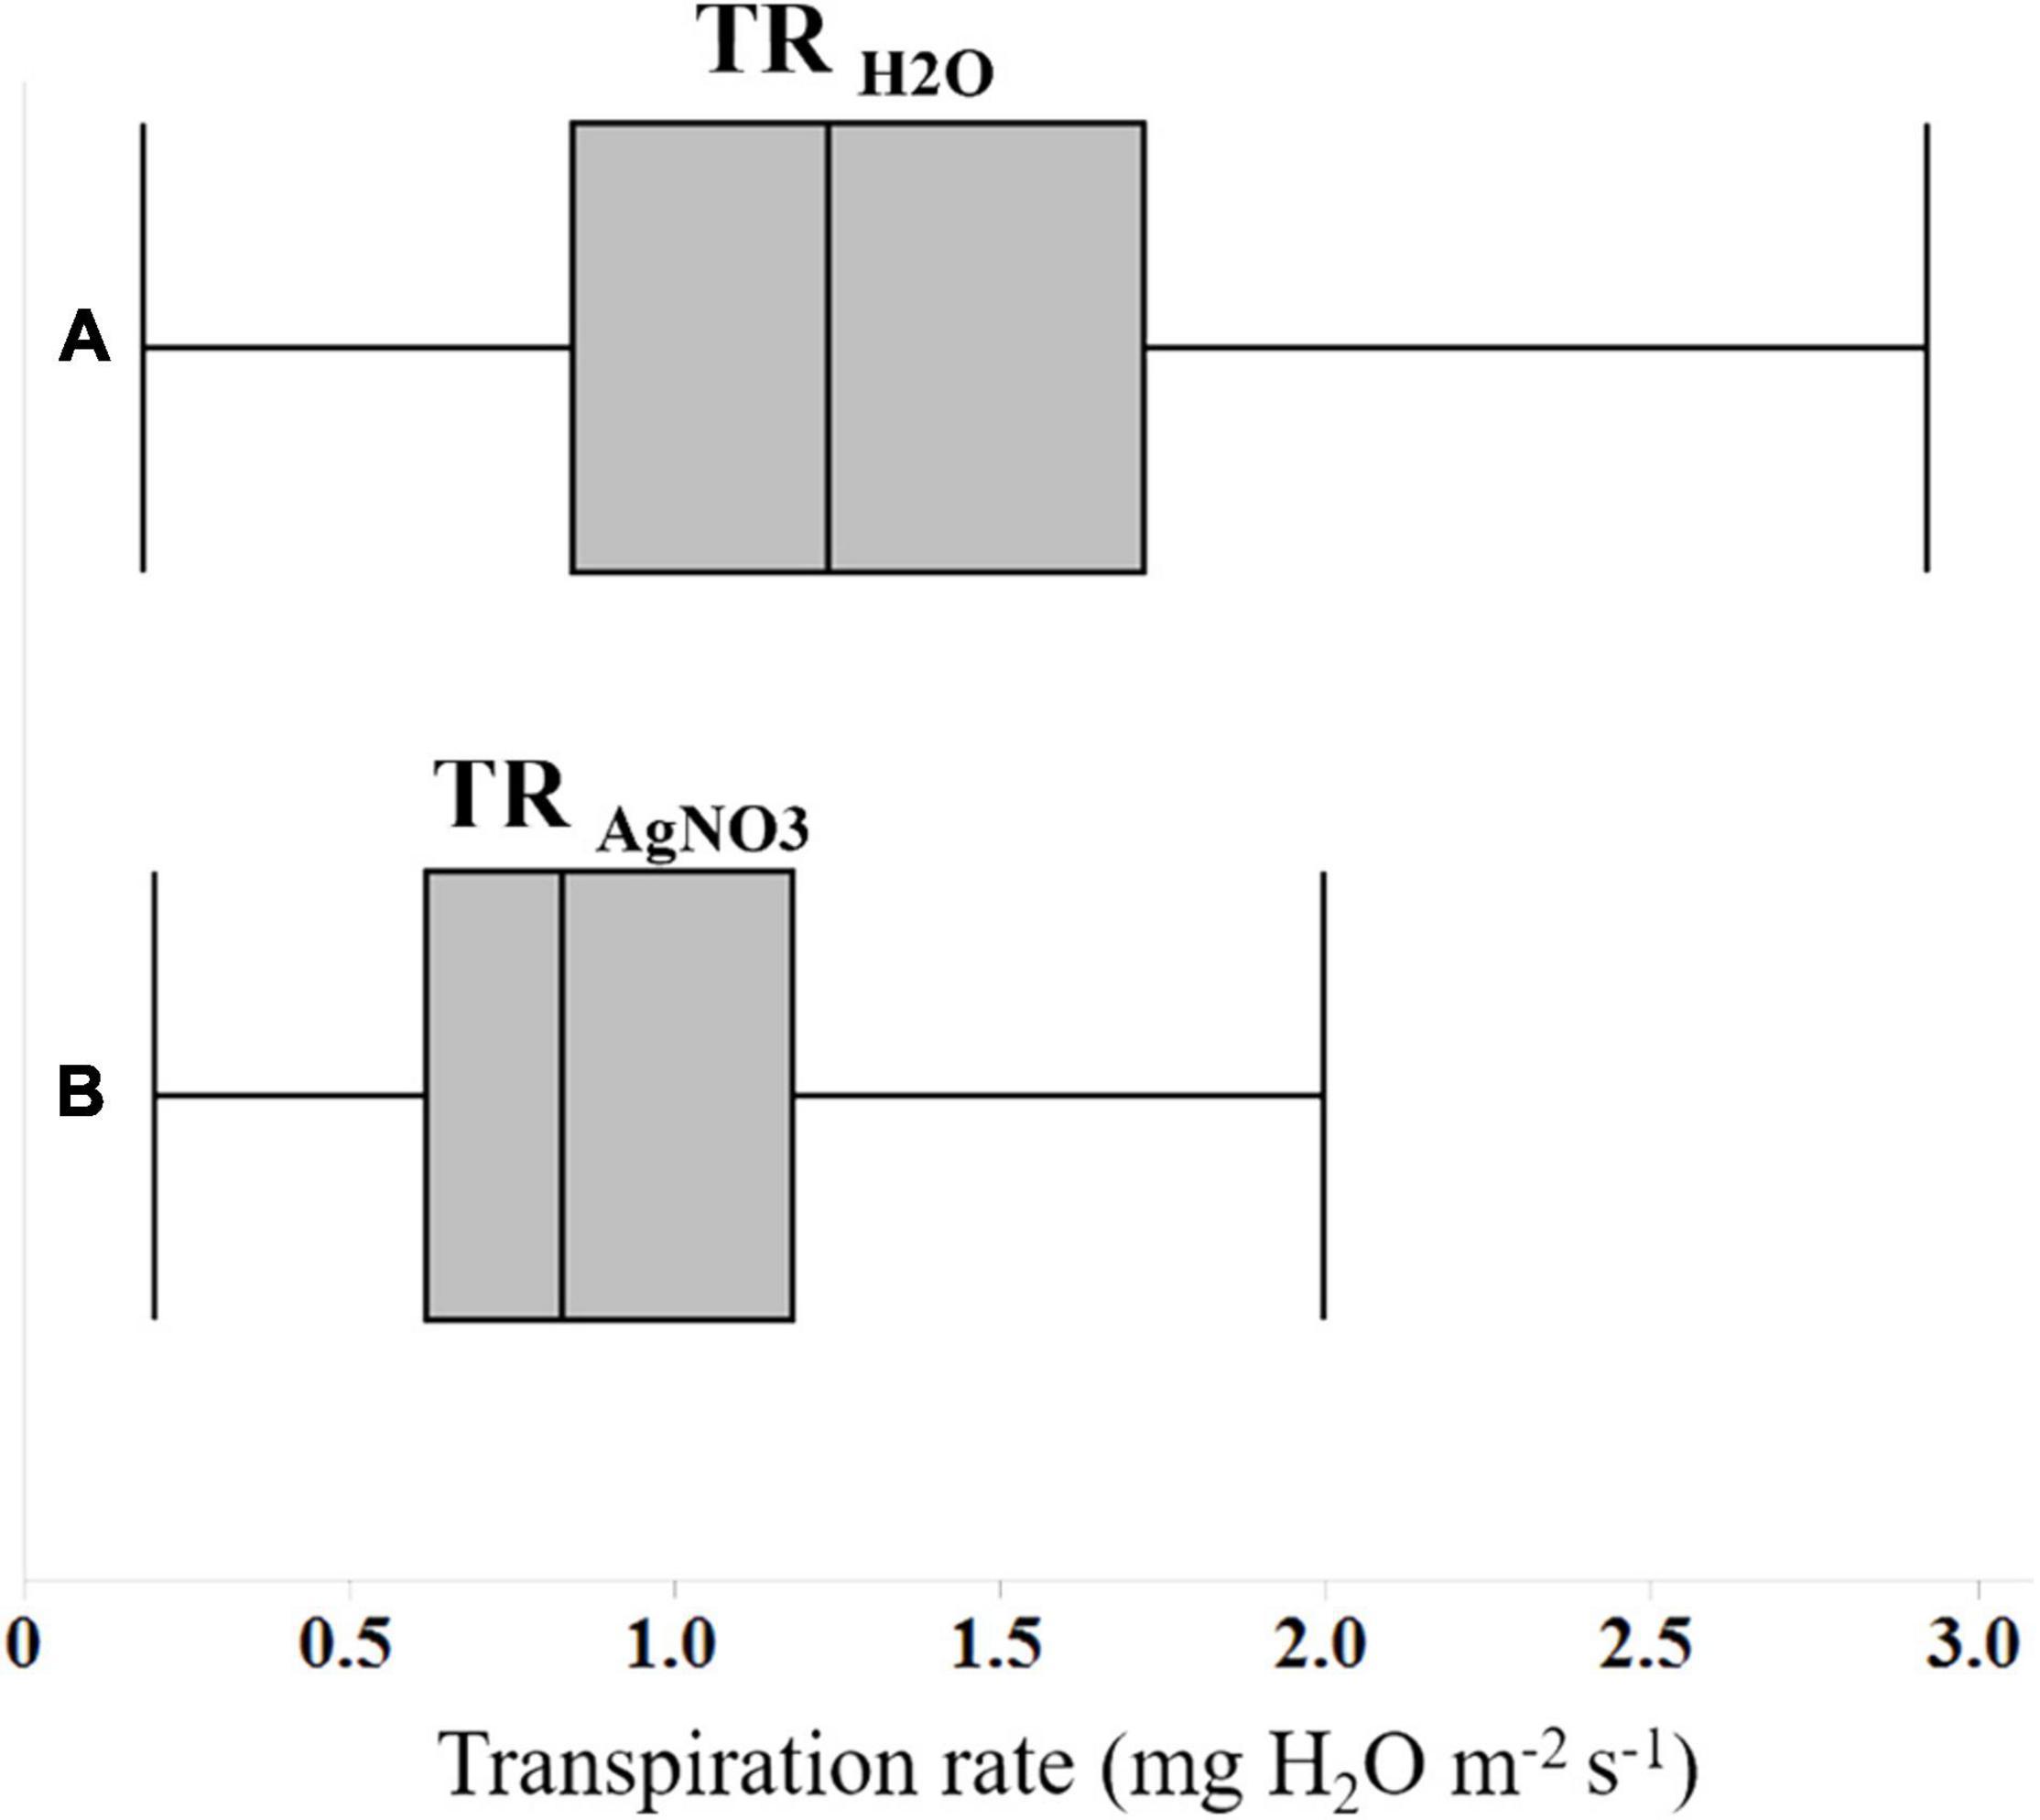
Figure 1. Box and whisker plots showing the differences in transpiration rates of 122 soybean genotypes (A) in water, and (B) following the exposure to an aquaporin inhibitor (AgNO3).
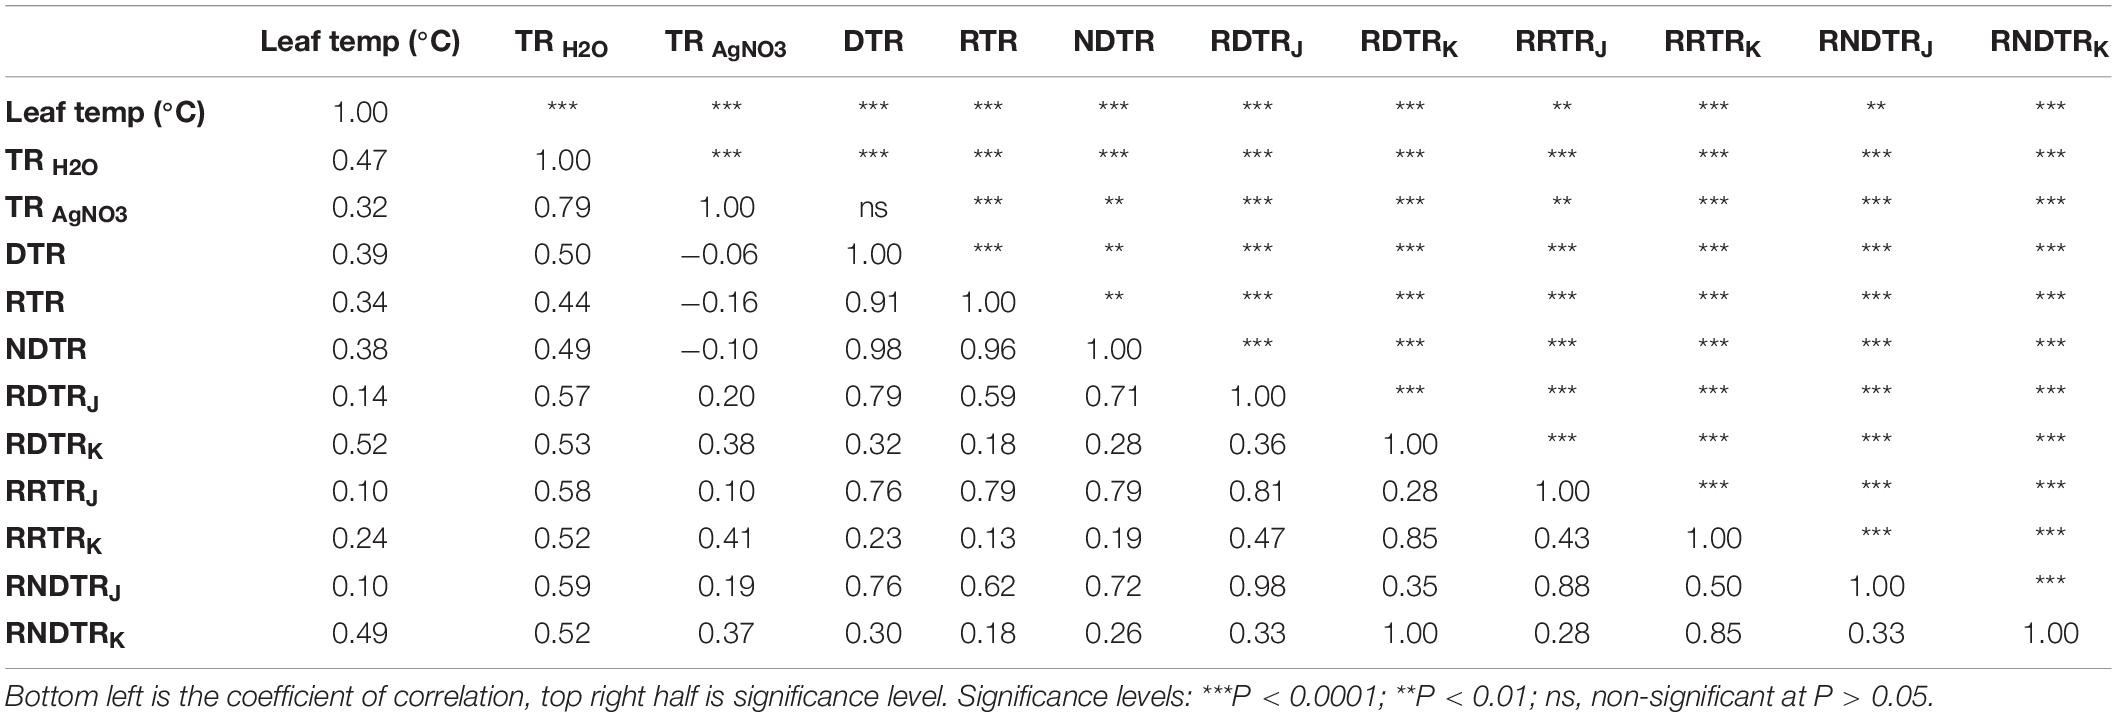
Table 4. Pearson’s correlation matrix of all direct and traits measured in this study.
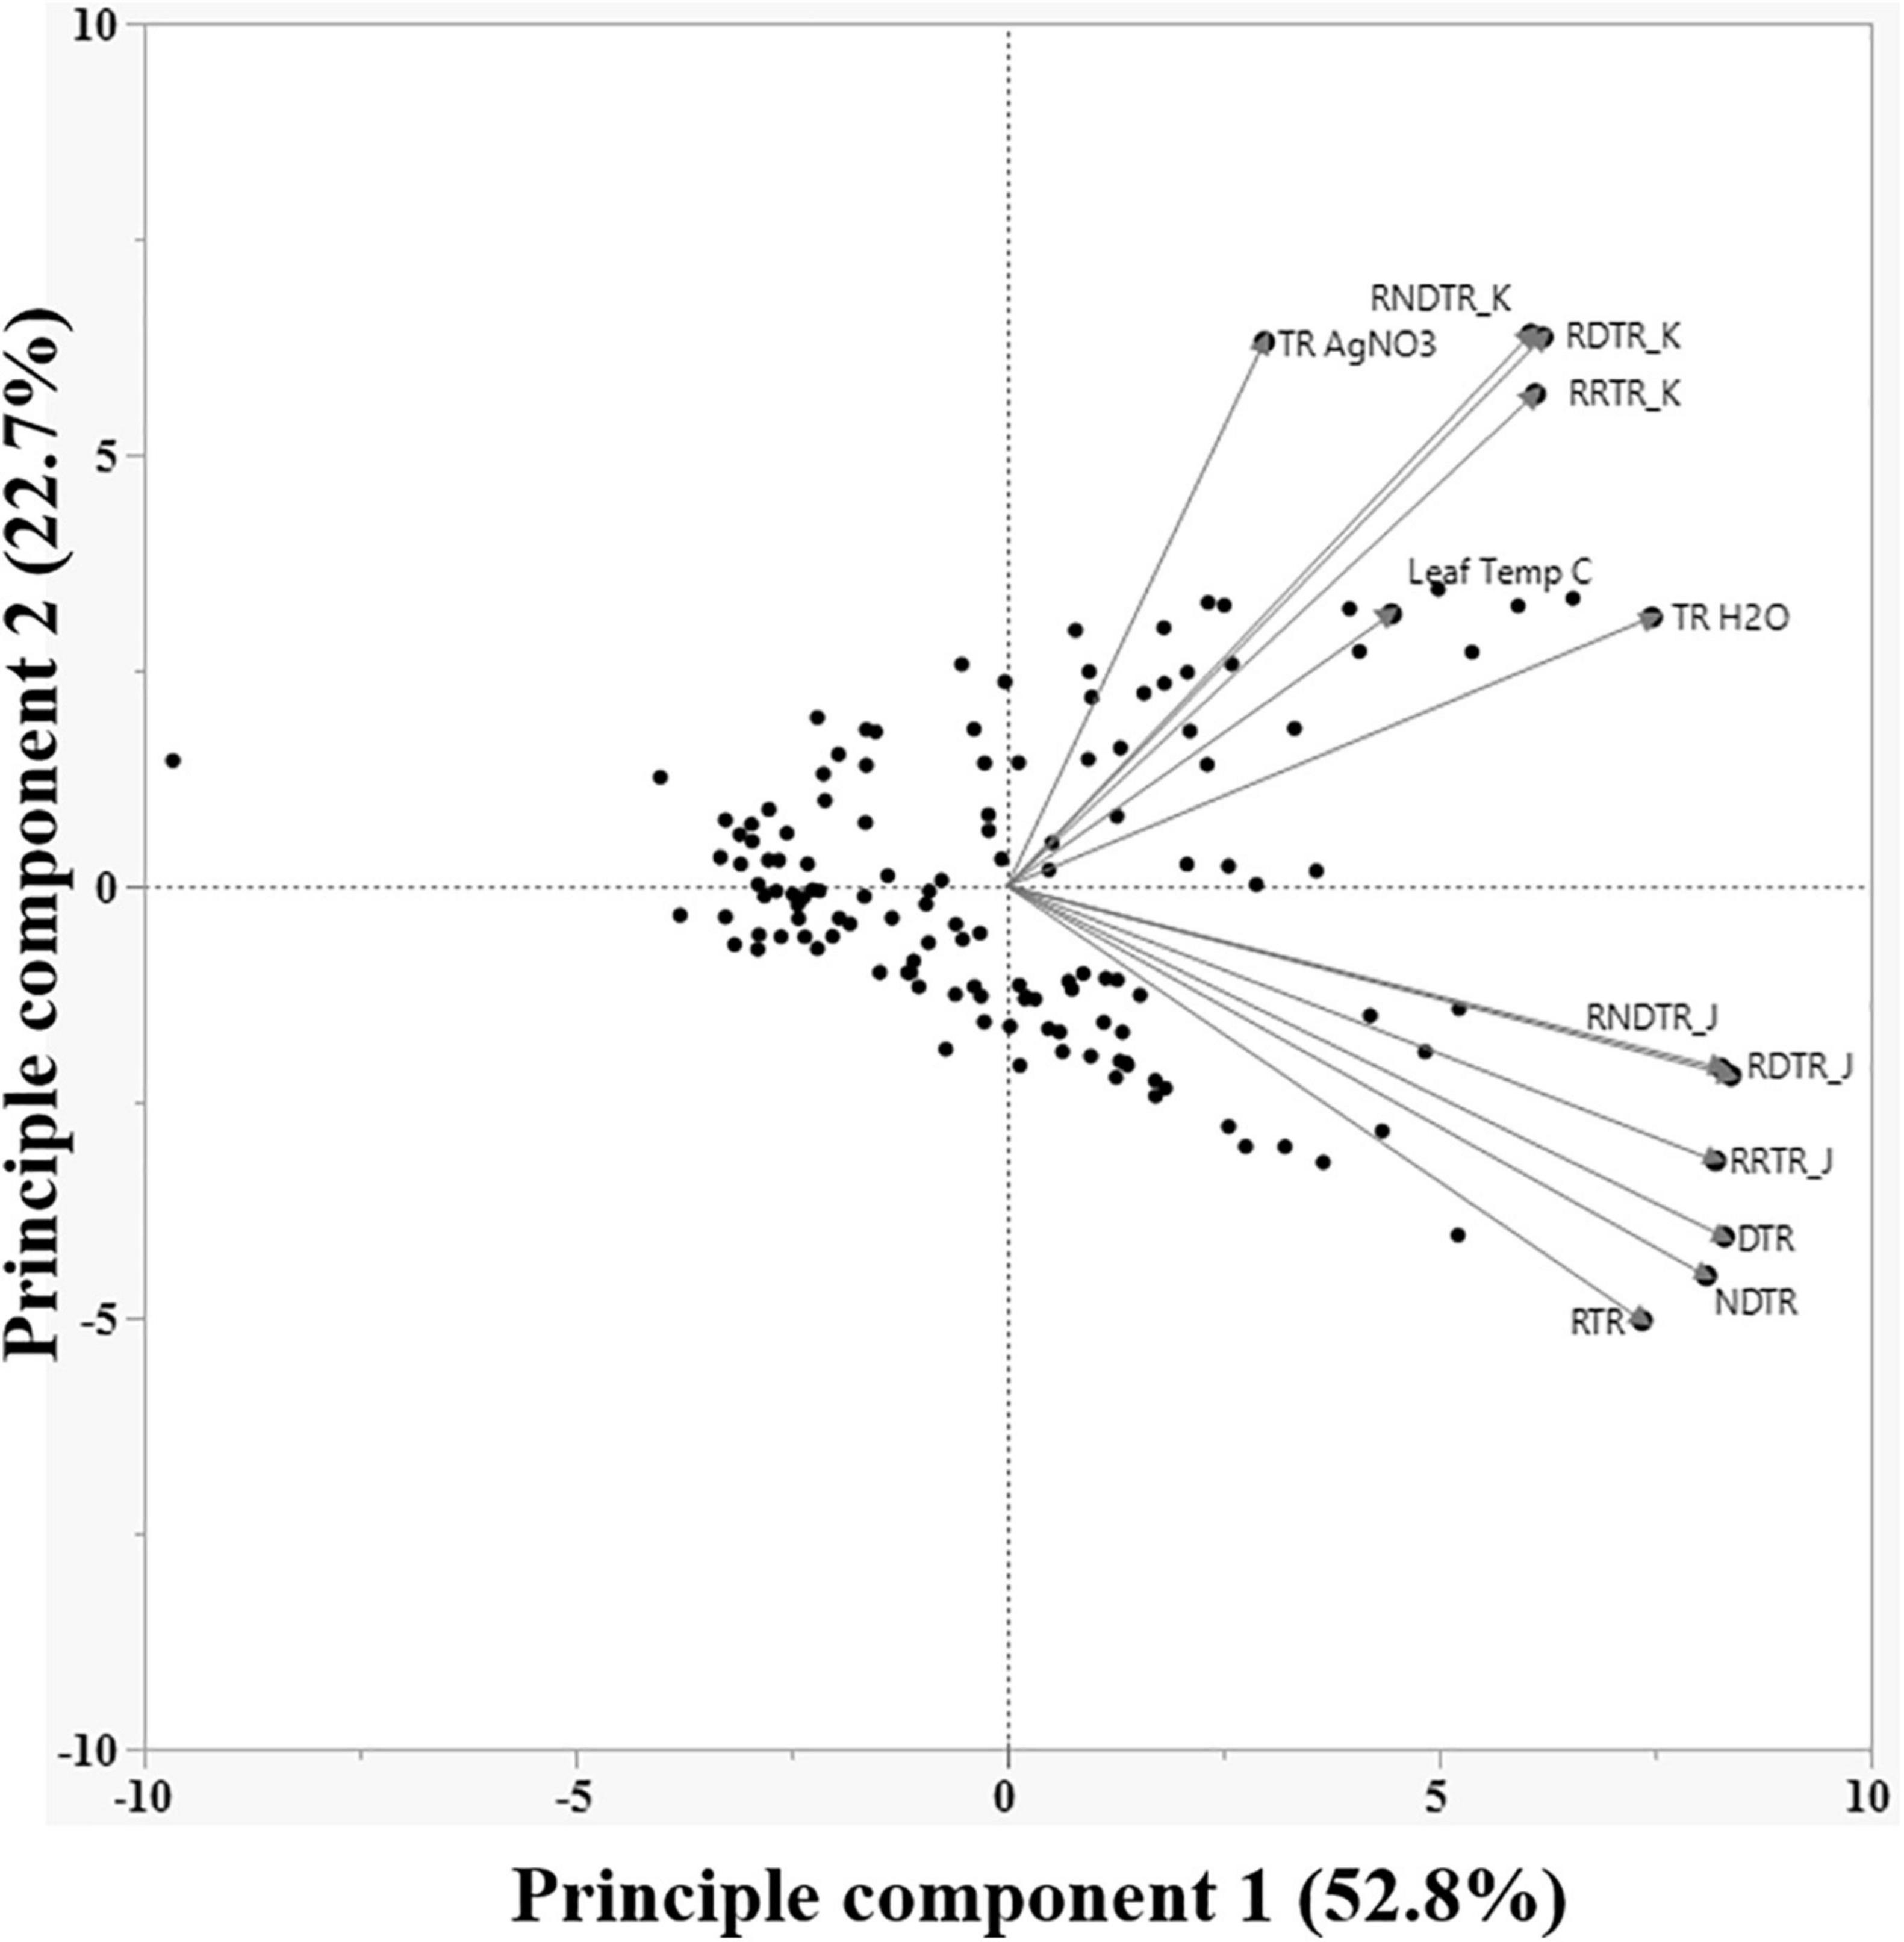
Figure 2. Principle component biplot of various phenotypic traits of all 122 soybean genotypes evaluated in this work. Traits farther from the center have higher variance, and higher the angle between traits lower the correlation.
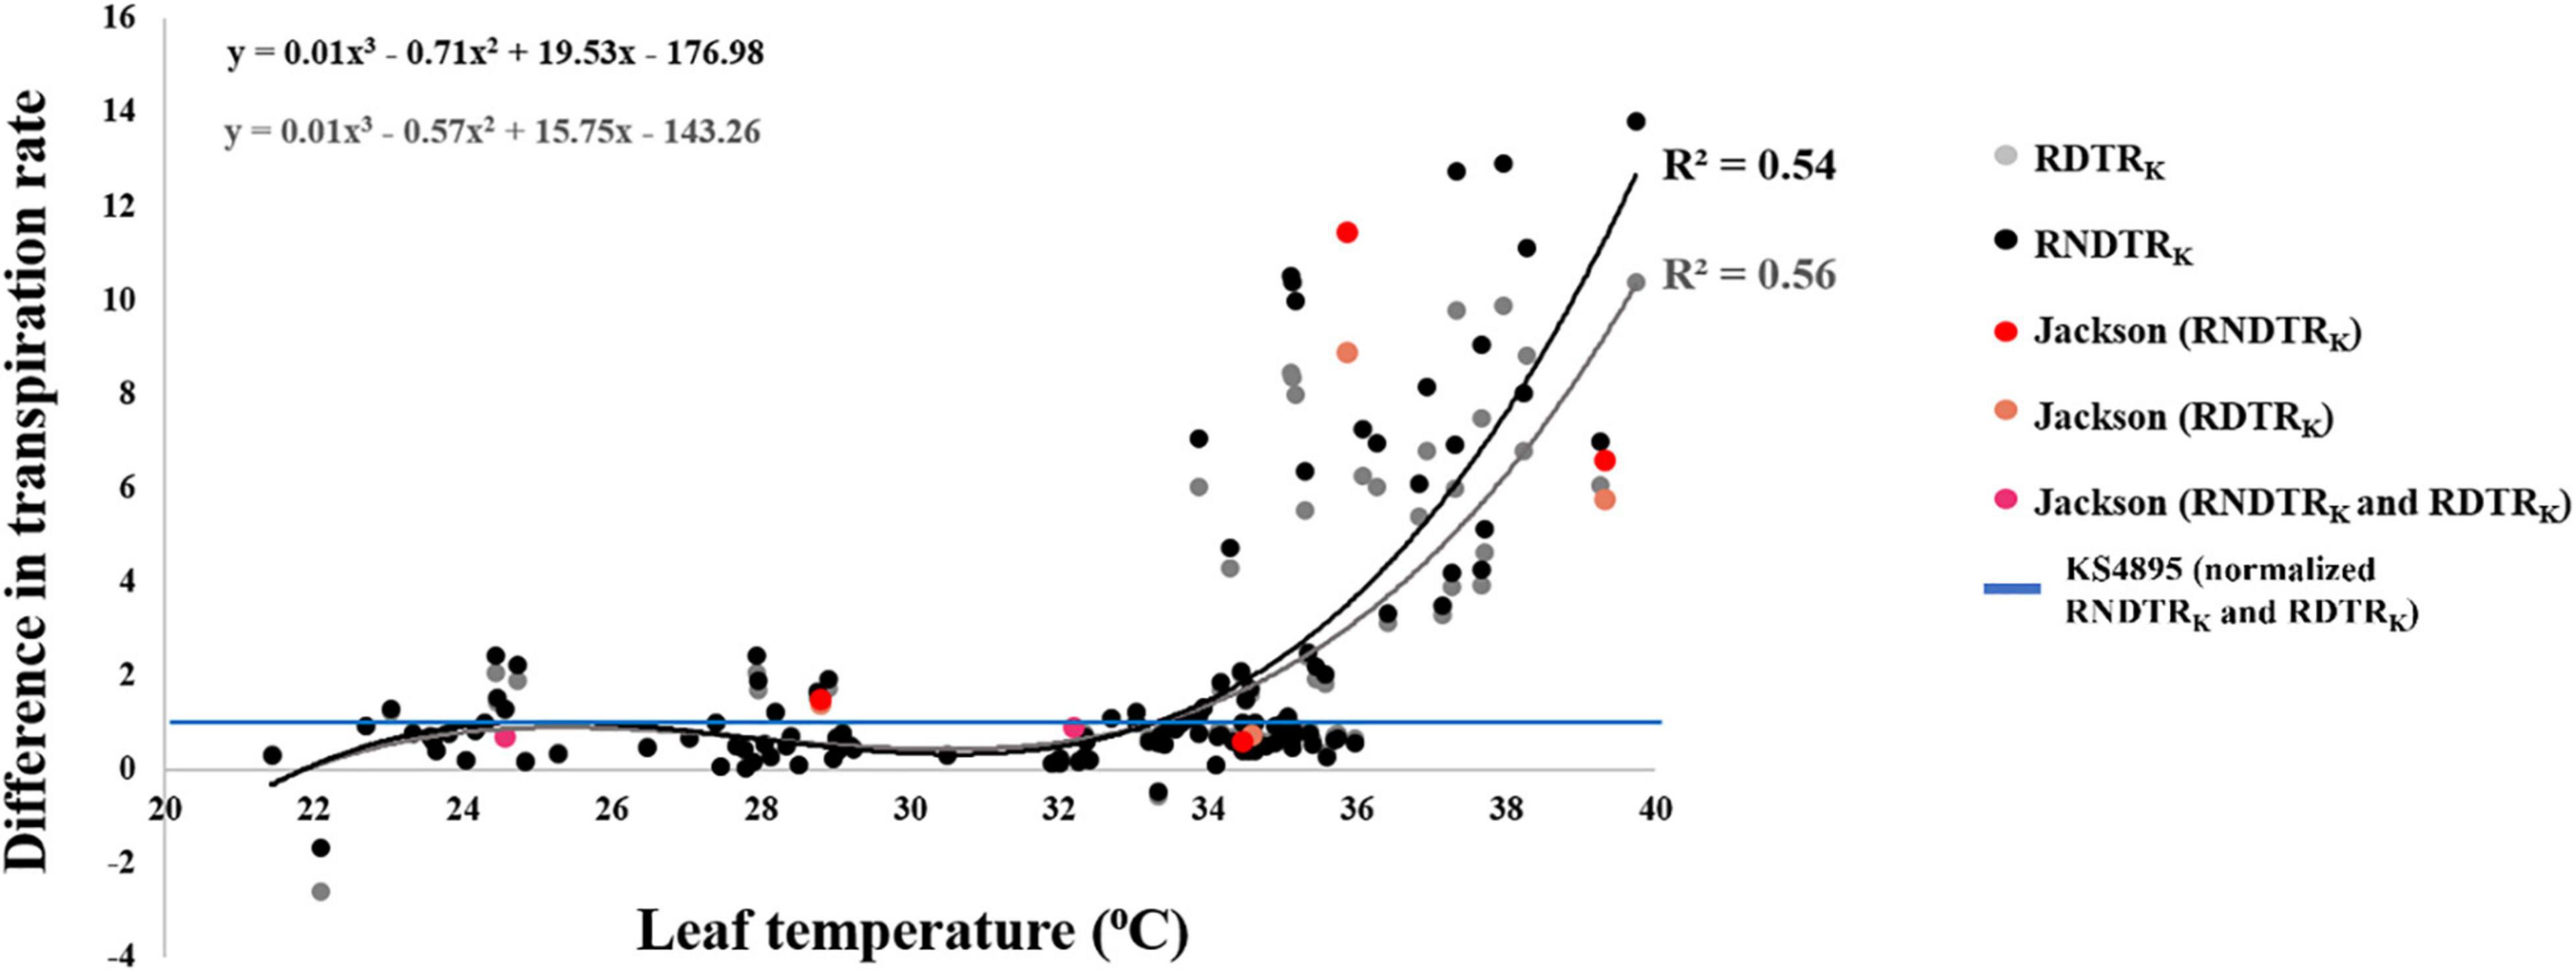
Figure 3. Regression curves of relative difference in transpiration rate response by “KS4895” (RDTRK) and relative normalized difference in transpiration rate by “KS4895” (RNDTRK) over the leaf temperature for 122 soybean genotypes.
Based on RDTRK and RNDTRK values, 26 soybean genotypes were divided into three levels. Values from 0.00 to 0.50 were considered as “slow wilting,” 0.51 to 1.00 as “moderate wilting,” and above 1.00 “fast wilting.” Genotypes exhibited a decrease in TR slope over increasing VPD, indicating the expression of the TRlim trait, and those with constant linear slope exhibited no decrease in TR under high VPD, indicating the lack of the TRlim trait. For example, between two parents “KS4895” expressed the TRlim trait and “Jackson” did not (Figure 4). For those genotypes that expressed the TRlim trait, the point on x-axis where the slope changed was considered as the VPD breakpoint. Within slow wilting genotypes, 6 out of 7 were found to express the TRlim trait (i.e., VPD breakpoint) at high VPD under 32°C (Table 5). Among genotypes in moderate wilting category, 5 out of 10, and in high wilting only 1 out of 9 expressed the TRlim trait at 32°C. Whereas, at 37°C, the expression of TRlim trait was found to be limited only to 3 out of 7 in slow wilting, 1 out of 10 in moderate wilting, and none among fast wilting genotypes.
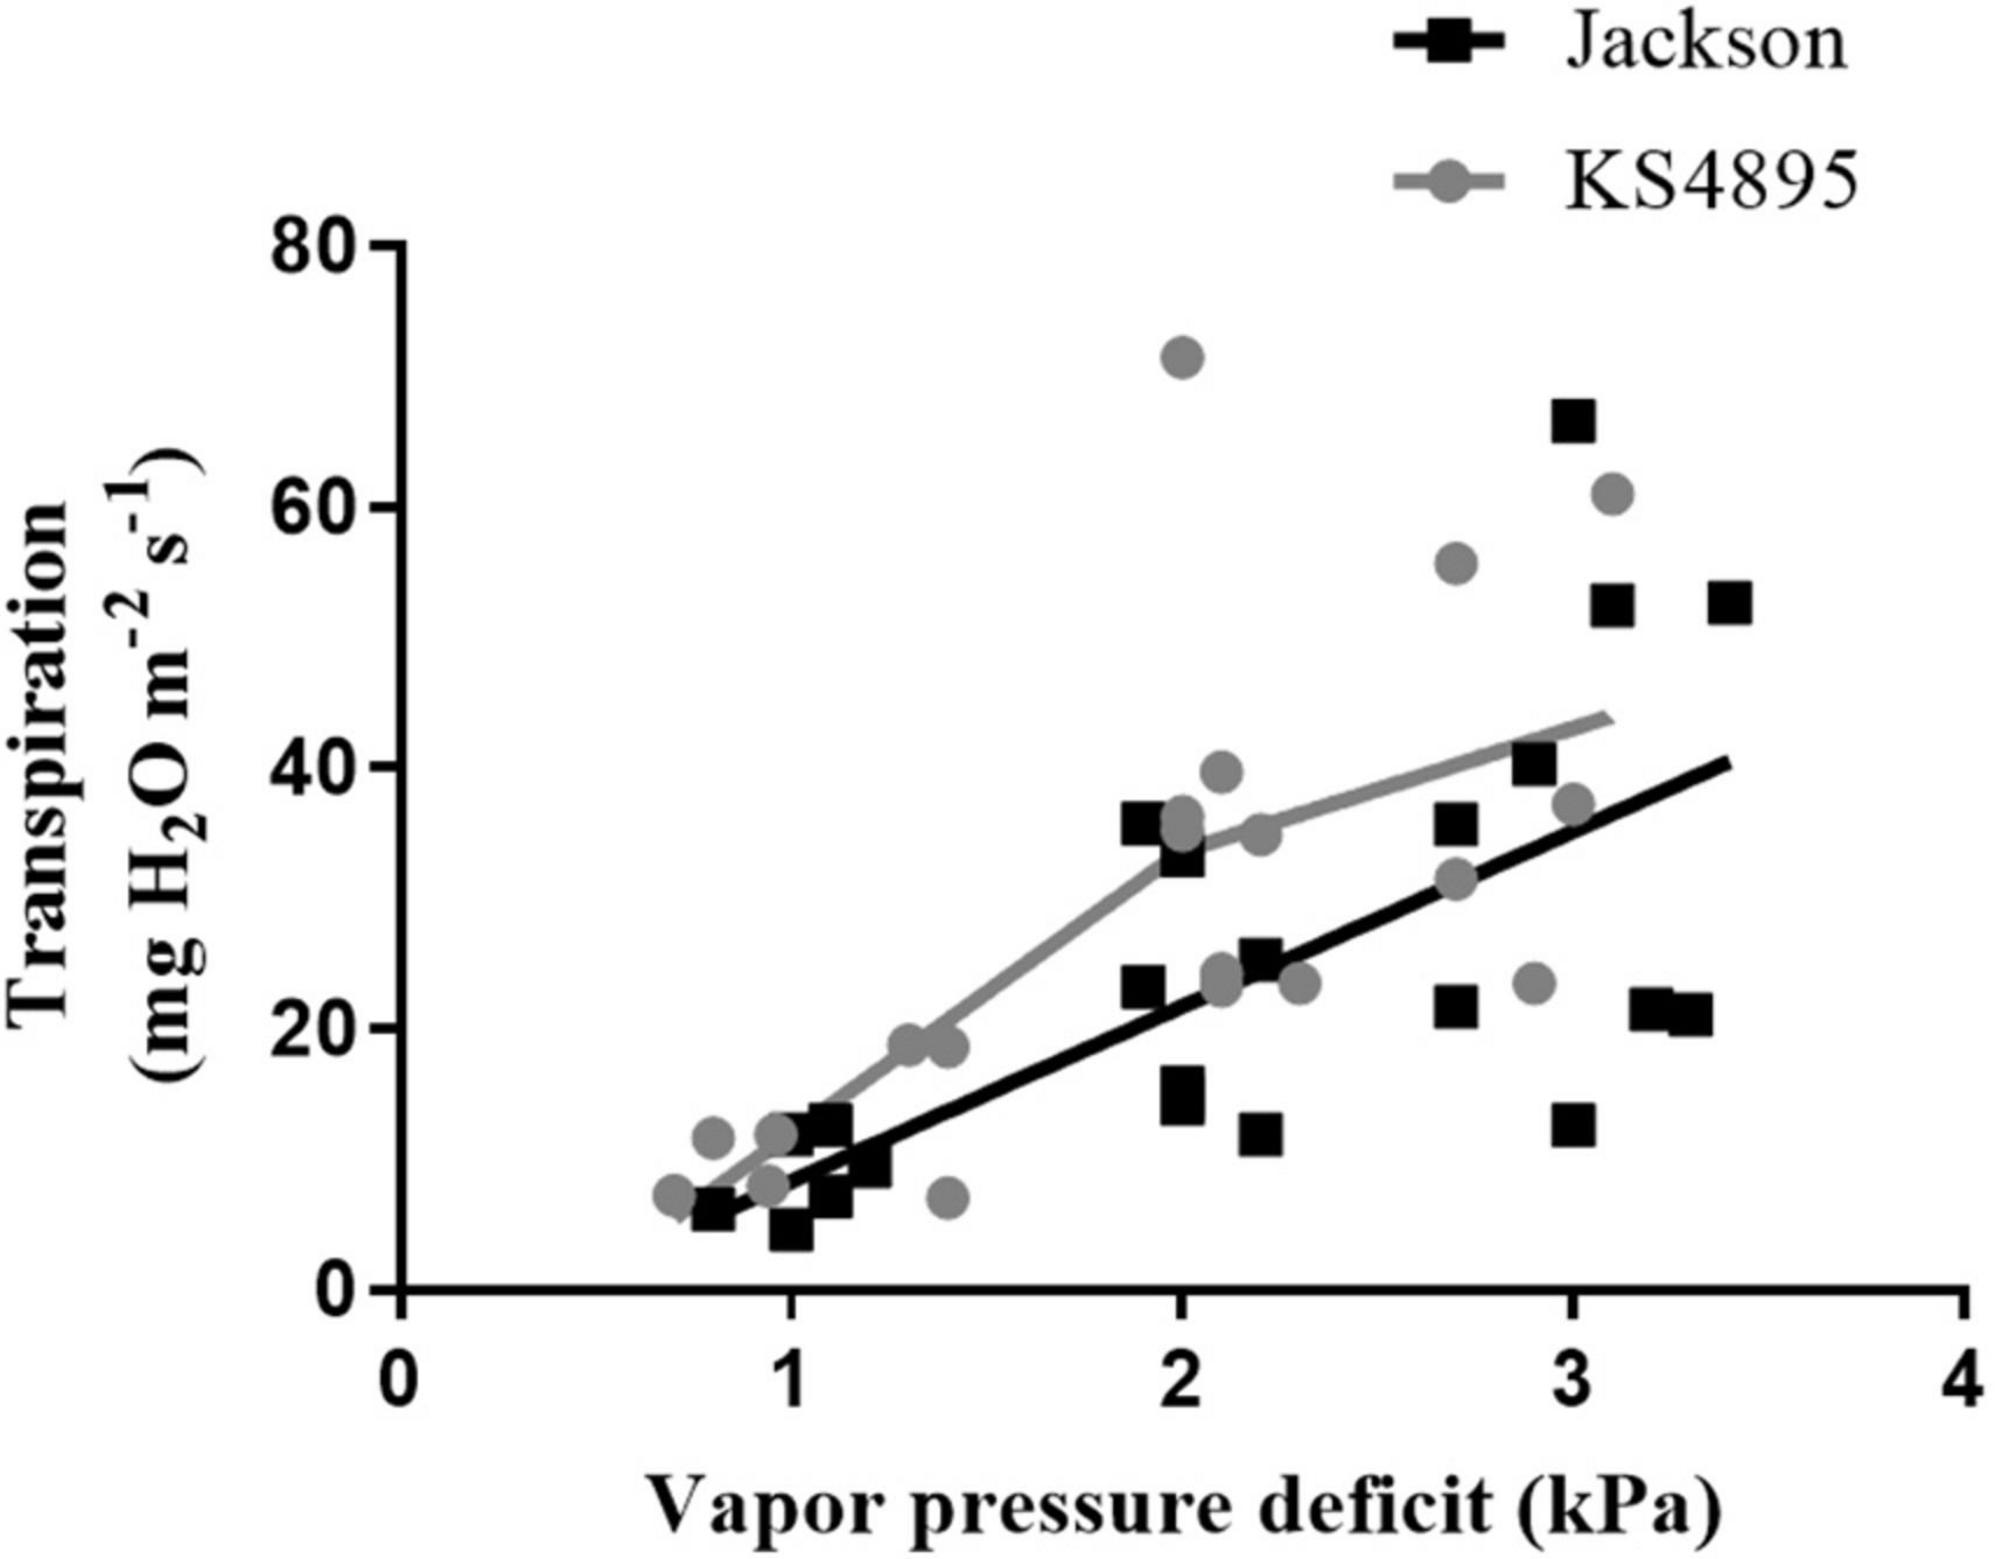
Figure 4. Transpiration rate response of two soybean genotypes (“Jackson” and “KS4895”) over different levels of vapor pressure deficit at 32°C.
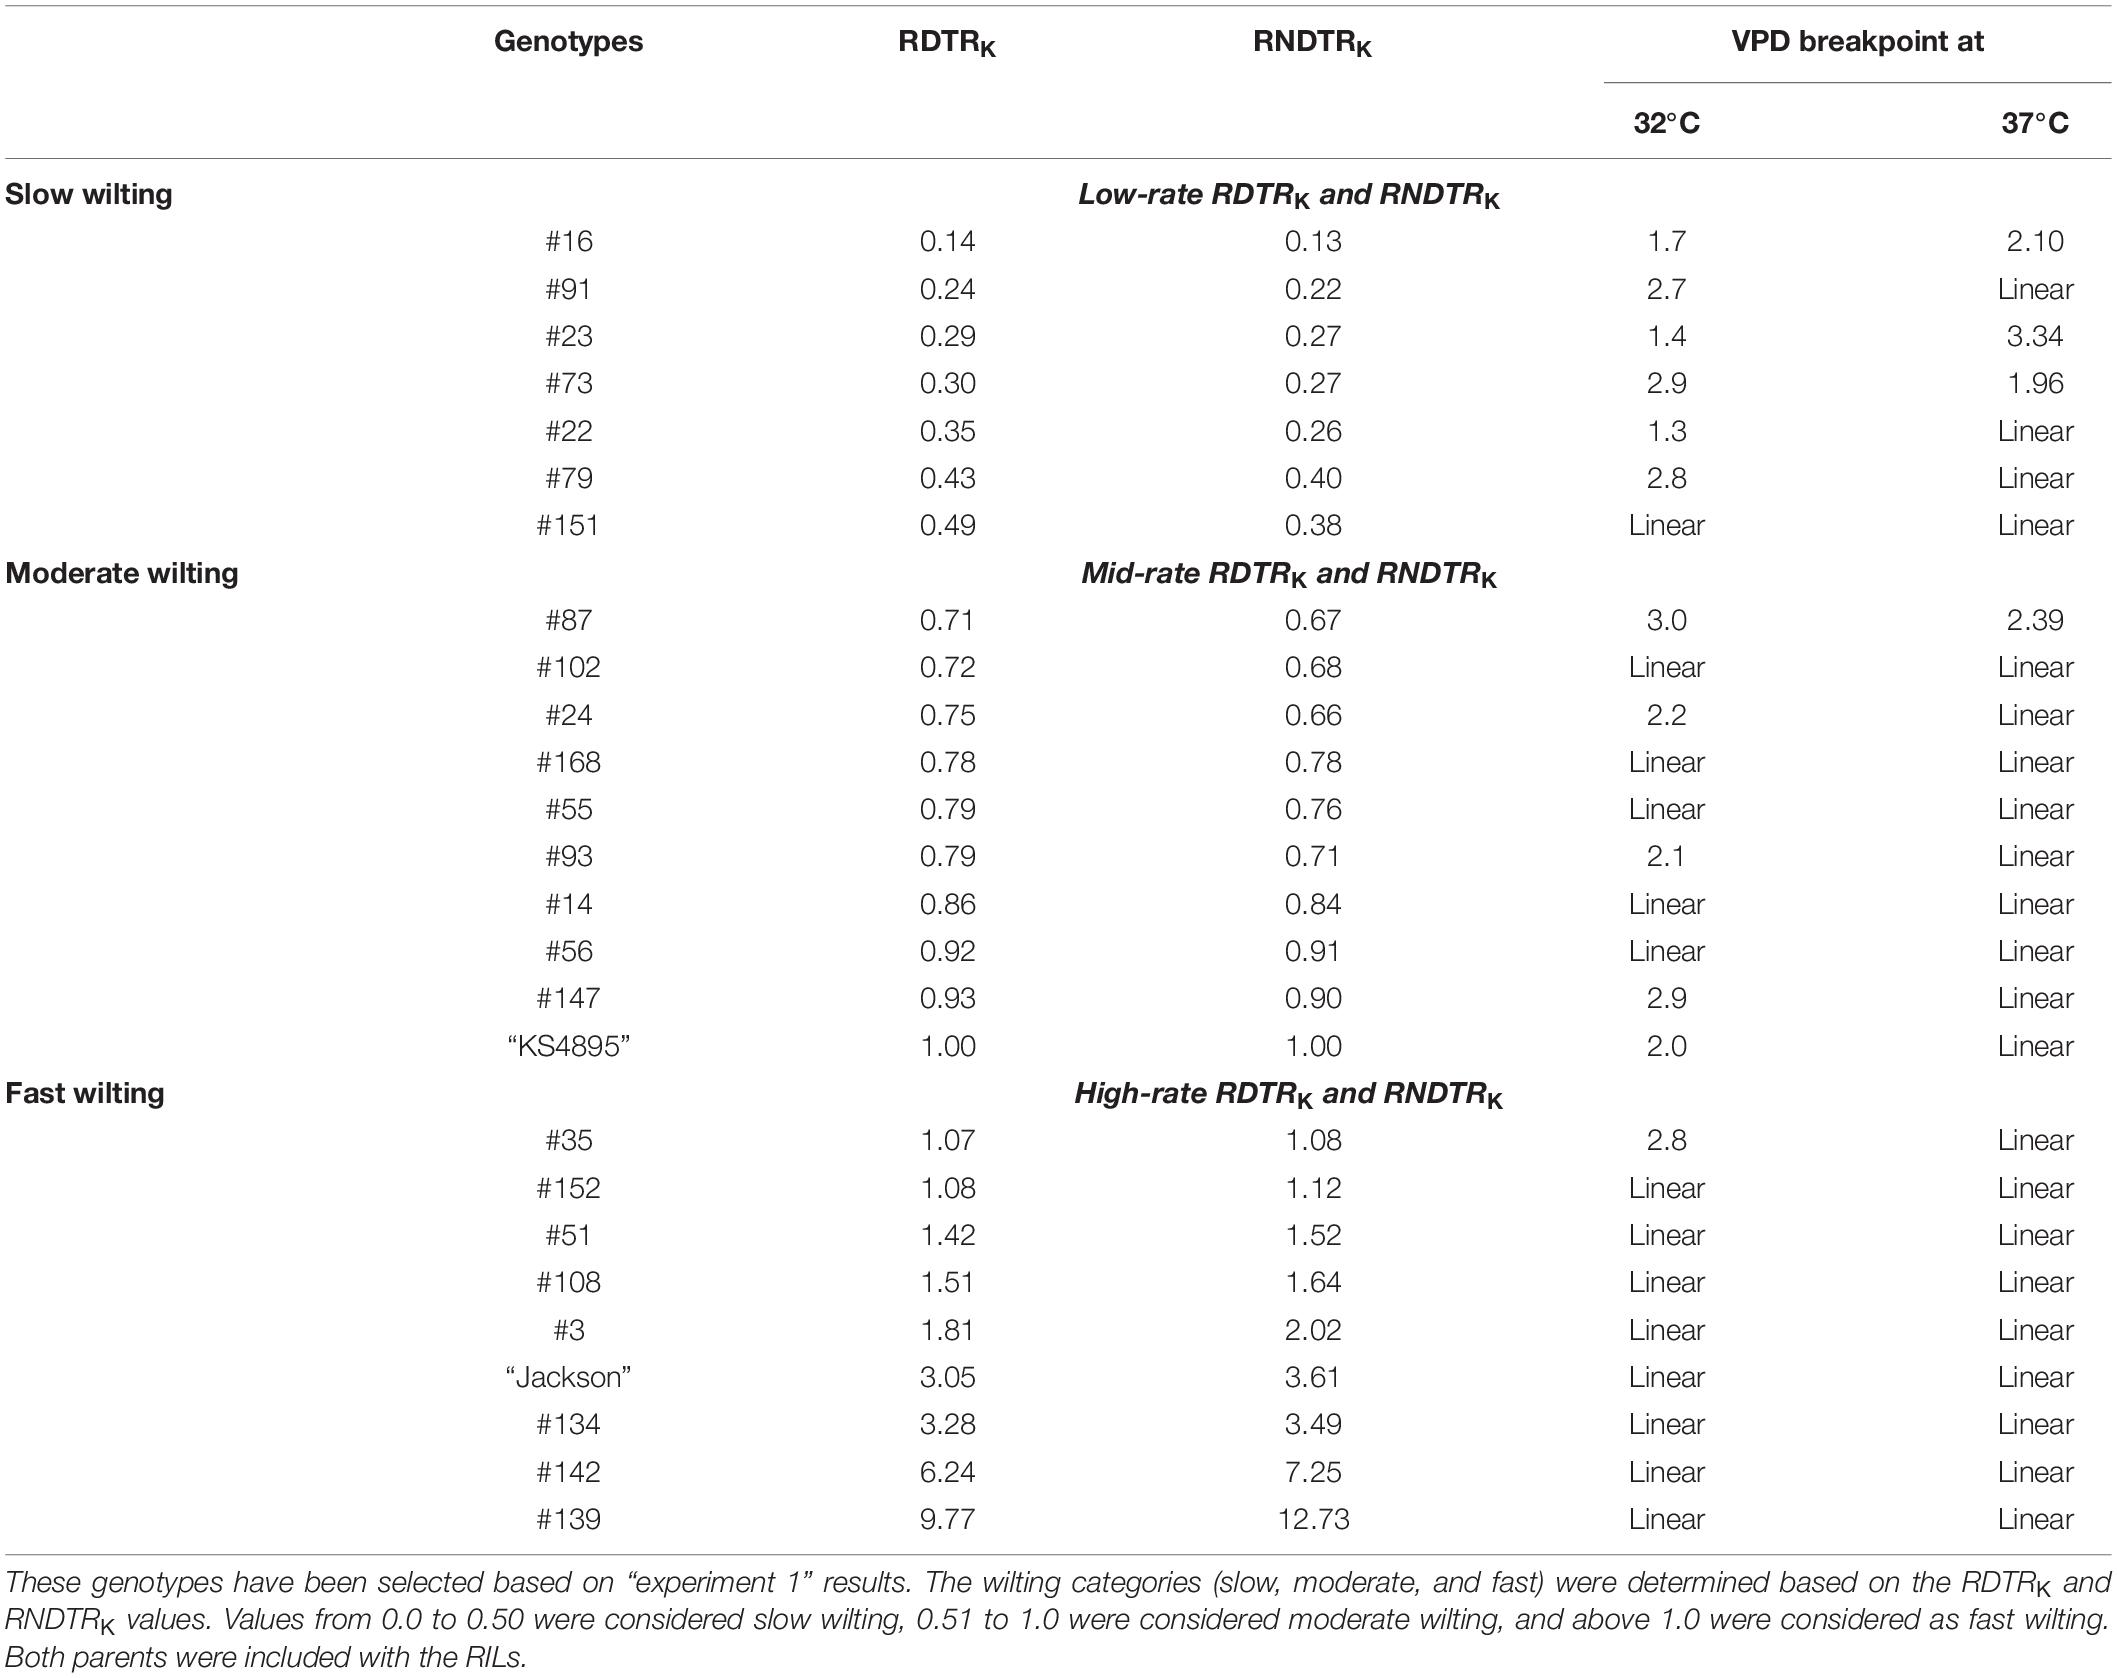
Table 5. Vapor pressure deficit (VPD) breakpoints of 26 soybean genotypes at 32 and 37°C.
A genetic map was created from genotypic data obtained using the SoySNP6K Illumina array (Akond et al., 2013). The final genetic map was composed of 2,181 genetic markers (average 109/chromosome) encompassing a total of 2,856.4 cm (each chromosome was 142.8 cm on average) (Supplementary File 2).
Quantitative trait locus analysis was performed for four drought-related traits using LSM calculated from phenotypic measurements taken during our greenhouse experiments (Table 6). Three QTLs were identified in total (Tables 6, 7), two QTLs for the TR traits (qTR_Gm10_1 and qTR_Gm12_1), and one associated with LT (qLT_Gm12_1) (Figure 5).

Table 6. Quantitative trait locus mapping results.

Table 7. Candidate gene summary for three QTL regions.
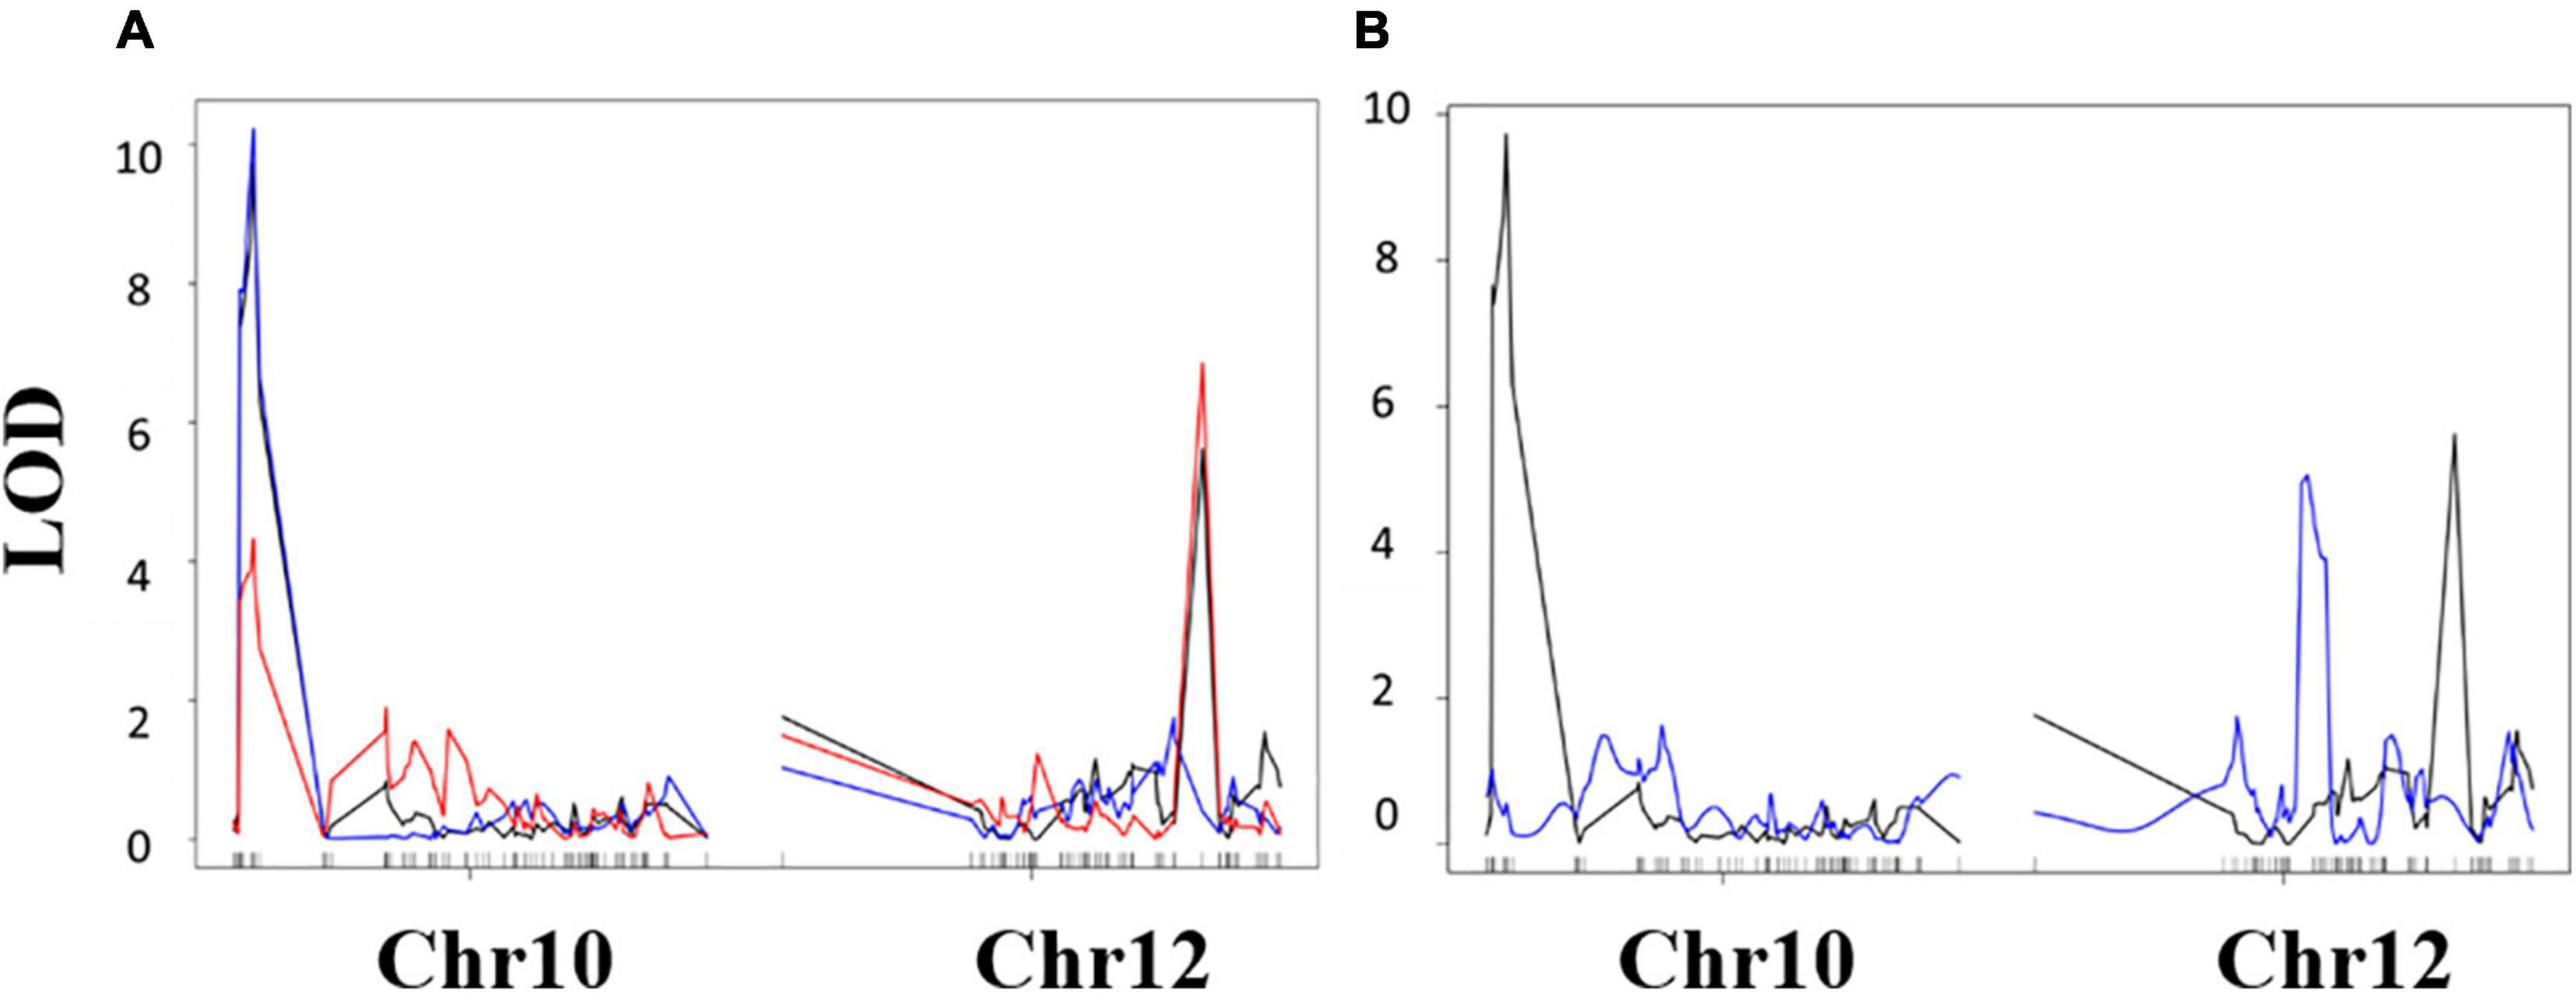
Figure 5. Composite interval mapping results. (A) Transpiration rate response (mg H2O m–2 s–1) QTL mapping results. Black indicates TRH2O, blue indicates TRAgNO3, and red indicates TRH2O – TRAgNO3. (B) Leaf temperature (LT) QTL mapping results, black indicates TRH2O results, and blue indicates LT results. Vertical axis is logarithm of odds (LOD) score. Horizontal axis is markers along chromosomes 10 and 12, ascending in genetic position from left to right.
Furthermore, the effect of each QTL was estimated (Table 6). Alleles from “KS4895” for the qTR_Gm10_1 QTL were associated with reduced transpiration relative to “Jackson” (−0.63 mg H2O m2–1 s–1). In contrast, alleles from “Jackson” for the qTR_Gm12_1 QTL were associated with reduced transpiration relative to “KS4895” (−0.27 mg H2O m2–1s–1). The lowest TR (and presumably most water saving) lines had a combination of QTL from two different parents: qTR_Gm10_1 for “KS4895” allele and qTR_Gm12_1 for the “Jackson” allele (Table 7). Lines which inherited alleles from “KS4895” for qLT_Gm12_1, which was distinct from the TR QTL, had lower leaf temperatures (0.84°C lower on average).
For genes within three detected QTL windows in this work (Table 6) using the “Williams 82” genome assembly 2 (Glyma.W82.a2.1), we examined gene ontologies (biological process, cellular component, and molecular function). Genes were termed as candidate genes (Table 7 and Supplementary Table 1) for the TRlim traits if they had biological process GO terms associated with any of the following terms: abscisic acid, water transport, root development, leaf senescence, jasmonic acid, heat acclimation, stomata, and/or salicylic acid. It should be noted that very few genes in soybean have direct experimental or empirical evidence for gene function, and in large part gene annotations are inferred from homologs identified by BLAST searches using genomic assemblies from other species (typically Arabidopsis).
Within the qTR_Gm10_1 region (Gm10:116991–1903082; Table 7), we identified eight candidate genes (Table 7 and Supplementary Table 1). These included three ubiquitin signaling associated genes (Glyma.10G018800, Glyma.10G019000, Glyma.10G019500, and Glyma.10G021500), a glycoside hydrolase/polygalacturonase gene (Glyma.10G016100), an abiotic stress-associated transcription factor (Glyma.10G016500) and two genes of unknown function annotated as involved in root hair cell differentiation (Glyma.10G016600 and Glyma.10G016700). One very intriguing candidate gene is Glyma.10G016600 (UniRef100_E0A235), which is annotated as a “drought resistance protein” and was initially identified via transcriptomic studies in response to drought stress, and the researchers confirmed this gene’s role in abiotic stress tolerance via transgenic overexpression, which conferred increased tolerance for several abiotic stresses (Song et al., 2013).
Within the qTR_Gm12_1 QTL region (Gm12:35946078-36388059; Table 7 and Supplementary Table 1), we identified eight candidate genes based on GO annotation (Supplementary Table 1). Unfortunately, none of the candidate genes has any direct evidence for gene function, with all annotations inferred based on BLAST identification of presumably homologous genes from other species. Four of the candidate genes in this region are putative transcription factors (Glyma.12G199100, Glyma.12G199200, Glyma.12G199600, and Glyma.12G203100) whose annotations are associated with abiotic stress responses. Another interesting candidate gene is a homolog of a stomatal patterning gene (Glyma.12G202700). The qTR_Gm12_1 QTL displayed significant allelic differences for TR using H2O (Table 6), but no significant differences between parental alleles in the presence of the aquaporin inhibitor (TRAgNO3). Although, no obvious aquaporin gene is present within the region identified in the “Williams 82” reference genome, it remains possible that a nonobvious aquaporin-encoding gene (but not identified as such either due to problems with the assembly or diverged between “Williams 82” and the parental lines) is present within the qTR_Gm12_1 QTL region, which was affected by the silver inhibitor and forms the underlying genetic basis for qTR_Gm12_1 QTL.
Within the qLT_Gm12_1 QTL region associated with differential LT (Gm12:6971475.11867391, Table 7 and Supplementary Table 1), we identified a total of 312 genes, of which 29 were termed candidate genes based on GO term and KOG annotations. Only one gene was noted to have any functional characterization; Glyma.12G104800 was identified through RNA-Seq/RT-PCR analysis as associated with response to salt stress (Sun et al., 2019). Other potential candidate genes for the QTL include an aquaporin (Glyma.12G097800); eight genes are involved in abscisic acid biosynthesis/signaling (Glyma.12G087200, Glyma.12G089200, Glyma.12G094800, Glyma.12G096100, Glyma.12G098900, Glyma.12G103100, Glyma.12G106400, and Glyma.12G108900), and a there were large number of transcription factors with annotations, which suggest involvement in abiotic stress responses (Glyma.12G087000, Glyma.12G094500, Glyma.12G094800, Glyma.12G096100, Glyma.12G098800, Glyma.12G100100, Glyma.12G100600, Glyma.12G103100, Glyma.12G104500, Glyma.12G104600, Glyma.12G104800, Glyma.12G105400, Glyma.12G105600, Glyma.12G106400, and Glyma.12G110400).
Treating the soybean plants with AgNO3, aquaporin inhibitor reduced the TR responses (Table 3 and Figure 1). Silver inhibition has been linked to the sulfhydryl group of cysteine residue of AQPs resulting in blockage of the pore for water passage (Niemietz and Tyerman, 2002). A couple of studies using aquaporin inhibitor, silver nitrate on derooted, and intact soybean plants indicated that most soybean genotypes were quite sensitive to the treatment with silver nitrate (Sadok and Sinclair, 2010; Devi et al., 2015). However, they reported a varying range of DTRs across genotypes. In the current research, the DTR amount varied across genotypes, ranging from 0.46 to 74.6% (Supplementary Figure 1). Twelve RILs had very low DTR (#162, #89, #97, #74, #16, #31, #161, #30, #168, #71, #26, and #137) ranging from 0–5%, whereas the other eleven genotypes had DTR ranging from 5–10% (#52, #64, #17, #157, #91, #23, #34, #136, #73, #45, and #57) (Supplementary Figure 1). These genotypes were almost insensitive to AgNO3 exposure and can be categorized as slow wilting (Sadok and Sinclair, 2010).
The results also indicated that AgNO3 could be an effective way for high-throughput screening of drought tolerant soybean genotypes. Previous studies have suggested that silver nitrate (AgNO3) may be an effective initial screen for the expression of the TRlim trait in a multitier screening system (Sadok and Sinclair, 2010; Choudhary and Sinclair, 2014; Shekoofa and Sinclair, 2018). In this work, the second tier (first being AgNO3 treatment) would involve selection of fewer genotypes for intensive and direct phenotyping for the TR response under increasing VPD conditions. Therefore, it allowed for considering not only the DTR trait, but also several other secondary traits to represent the reduction in TR response. A simple but less accurate screen that allows a large number of genotypes to be examined is a first-tier screen, followed by tiers of more sophisticated screens of decreasing numbers of genotypes (Sinclair, 2011).
Of all primary and secondary traits, those subjected to PCA, RDTRK, and RNDTRK had the best correlation with LT (Figure 2). The regression curve of RDTRK and RNDTRK with the LT shows that the slope is negligible for temperature rates below 32°C, but it drastically changes with increasing the temperature above 32°C (Figure 3). At optimum LT (24–32°C), the TR response was almost constant. These findings were confirmed through the direct measurement of TR responses under high VPD conditions at 32 and 37°C (i.e., the second-tier screening). Almost 88% of slow wilting genotypes (i.e., the least sensitive genotypes to AgNO3 exposure), 50% of moderate wilting genotypes, and 11% of high wilting genotypes (i.e., highly sensitive genotypes to AgNO3 exposure) expressed the TRlim trait at 32°C. This was consistent with our hypothesis and previous studies done on other legume crops (Devi et al., 2010; Shekoofa et al., 2017). The genotypes with low sensitivity to aquaporin inhibitor, AgNO3, had the TRlim trait with VPD breakpoint (BP) at about 1.3–2.9 kPa (Table 5). The TRlim at lower VPD rates (i.e., 1.3–2.9 kPa) allows those genotypes to conserve moisture so that there would be more water available in the soil during late-season drought to sustain soybeans physiological activities and complete seed fill. The plants with TRlim trait have also shown to delay wilting under rainfed conditions (Devi et al., 2010; Shekoofa et al., 2020).
Although the TR response results observed at 37°C (i.e., Experiment II) show that observations of the TRlim trait at 32°C do not necessarily predict expression of the trait at higher temperatures, the expression of TRlim trait reduced to about 43, 10, and 0% for slow, moderate, and high wilting genotypes from Experiment I, respectively. This could be because the rest of genotypes which expressed the TRlim (i.e., VPD BP) at 32°C started to increase TR under 37°C to disperse excess temperature and heat. Shekoofa et al. (2016) reported that if very high temperatures are frequent, even to the point of being high enough to threaten plants with heat stress, it may be advantageous to consider corn hybrids that lose the TRlim trait at 38°C rather than at 32°C or other temperatures below 38°C. However, soybean genotypes #16, #23, #73, and #87 allowed full expression of the TRlim trait under both temperatures (i.e., 32 and 37°C) and displayed the maximum water conservation, no matter what the temperature regime was and performed better than both parents. Further evaluation of these genotypes should be done in field by simulating drought conditions.
Quantitative trait loci analysis for the RILs population was done to associate the potential QTLs with the drought tolerance traits. Two QTLs (qTR_Gm10_1 and qTR_Gm12_1; Table 6) overlapped with two previously identified QTLs (qSV_Gm10 and qSV_Gm12) associated with drought responses from PI 416937 (Carpentieri-Pipolo et al., 2012). QTL conditioning the sensitivity of plants to silver nitrate were located in the same chromosomal regions reported by Carpentieri-Pipolo et al. (2012). Although, from investigations of pedigrees, it does not appear that the population (“Jackson” × “KS4895”) studied in the current research has any direct pedigree connection to the previously studied PI416937, but these QTL may be evidence that variation in the same underlying genes is causative.
Furthermore, it has been hypothesized that insensitivity to AgNO3 could be related to QTLs and the trait could be heritable (Devi et al., 2016). Our study also found that all primary and secondary traits had high broad sense heritability (H2 from 0.68 to 0.90) (Table 8). Therefore, these drought-tolerant traits can be used for phenotypic selection of soybean genotypes in future breeding efforts.
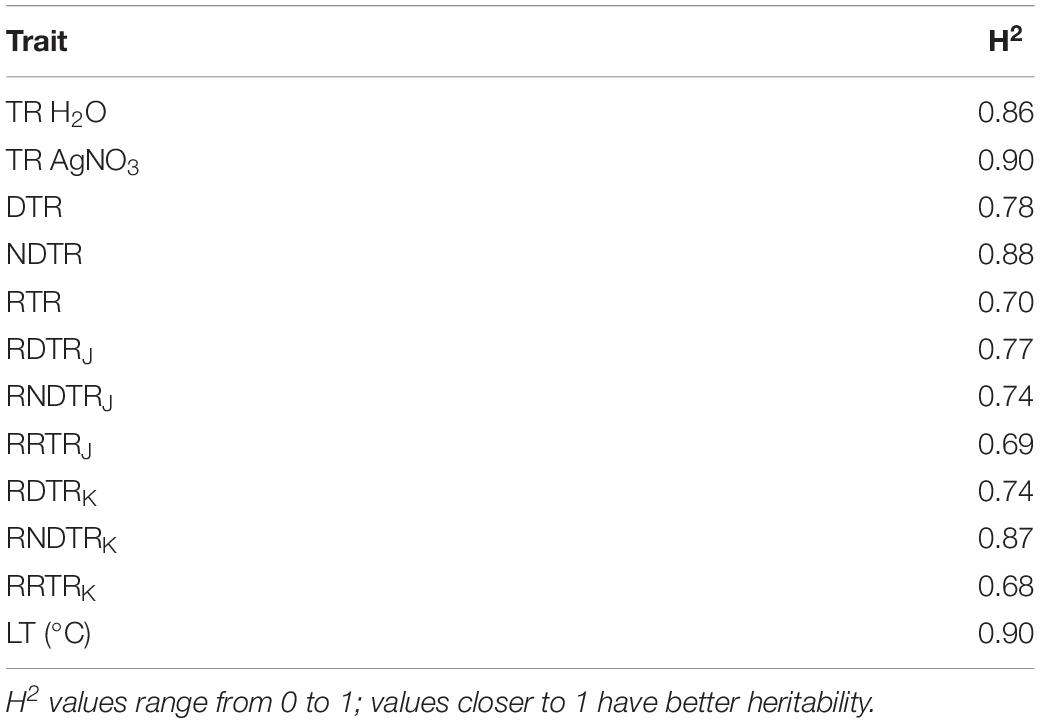
Table 8. Broad sense heritability (H2) values of all direct and indirect traits measured in this study.
The “KS4895” allele of the qTR_Gm10_1 QTL was associated with lower TR (Table 6). This was true for the H2O treatment (−0.63 mg H2O m2–1 s–1) and the AgNO3 treatment (−0.35 mg H2O m2–1 s–1) as well as the differential trait (TR H2O – AgNO3; −0.28 mg H2O m2–1 s–1). In contrast, the “KS4895” allele of the qTR_Gm12_1 QTL had higher TR under the H2O treatment (+0.27 mg H2O m2–1 s–1), and the differential trait (+0.25 mg H2O m2–1 s–1), but not with the AgNO3 treatment alone (Table 6).
We identified a relatively small number of candidate genes from within detected QTL regions (8, 8, and 29 for qTR_Gm10_1, qTR_Gm12_1, and qLT_Gm12_1, respectively) based on GO terms associated with abscisic acid, water transport, root development, leaf senescence, jasmonic acid, stomata, and/or salicylic acid. These candidate genes will be useful for future efforts to determine the causative genetic basis for the three QTLs we identified.
Although one of the RIL parental lines (‘‘Jackson’’) has resequencing data publicly available,3 the other parental line (“KS4895”) to our knowledge has not been resequenced. Moreover, no resources for fine-level genetic mapping (e.g., near-isogenic lines) have previously been developed for detected QTL regions identified for the TRlim traits. As such, fine-mapping, identification of gene polymorphisms, correlation of polymorphisms with water use efficiency, and TRlim traits, and the ultimate cloning of causative polymorphisms from within QTL regions remains to future work.
Nevertheless, our results strongly suggest that advanced mapping populations can reveal QTLs for drought-tolerance traits under complicated genetic control to enhance the TRlim trait (i.e., ability to tolerate late-season drought) in a RIL soybean population from crossing “KS4895” × “Jackson.” Validation of identified QTLs will be useful in molecular breeding of these favorable and informative QTL alleles for a superior cultivar with the ability to produce stable yield under water limiting conditions. It will be an interesting approach to associate these alleles with other agronomic traits, which are tightly linked to desirable drought tolerance traits to increase soybean yield and production under dryland conditions.
The datasets presented in this study can be found in online repositories. The names of the repository/repositories and accession number(s) can be found in the article/Supplementary Material.
AS and SS: conceptualization and writing – original draft preparation. AS, SS, and JG: methodology and data curation. AS: investigation, resources, visualization, supervision, and funding acquisition. AS, SS, JG, and AM: writing – review and editing. All authors have read and agreed to the published version of the manuscript.
The authors declare that the research was conducted in the absence of any commercial or financial relationships that could be construed as a potential conflict of interest.
All claims expressed in this article are solely those of the authors and do not necessarily represent those of their affiliated organizations, or those of the publisher, the editors and the reviewers. Any product that may be evaluated in this article, or claim that may be made by its manufacturer, is not guaranteed or endorsed by the publisher.
We would like to thank the United Soybean Board (USB) and the University of Tennessee, Plant Sciences Department for sponsoring this research. We would like to thank Qijian Song and Chuck Quigley of the USDA-ARS for running SoySNP6K arrays on their instrument, and recognize the superb technical contribution of USDA-ARS technician Jeremy Mullis who was responsible for DNA isolation and quality control. Also, we thank Larry Purcell and Andy King at the University of Arkansas for providing the seeds for this research. We would furthermore like to thank Kendall Sheldon and Sara Safikhan for their assistance during data collection.
The Supplementary Material for this article can be found online at: https://www.frontiersin.org/articles/10.3389/fpls.2021.779834/full#supplementary-material
Supplementary Figure 1 | Variation of decrease in transpiration rate (DTR) and normalized decrease in transpiration rate (NDTR) among 122 soybean genotypes.
Supplementary Figure 2 | Diagram of a two-tiered screening method to identify soybean genotypes with the TRlim trait.
Supplementary Table 1 | Candidate genes from GO term analysis from within QTL regions identified in this study.
Supplementary File 1 | Heritability analysis and values of all direct and indirect traits.
Supplementary File 2 | Details on genetic map and marker distribution.
Supplementary File 3 | R/QTL package file containing genotypic and phenotypic data used for genetic mapping.
TRlim, limited transpiration; VPD, vapor pressure deficit; RIL, recombinant inbred line; QTL, quantitative trait locus; TR, transpiration rate; DTR, decrease in transpiration rate; LT, leaf temperature; AQPs, aquaporins; TRH2O, transpiration in water; TRAgNO3, transpiration rate following exposure to silver nitrate; PCA, principle component analysis; H2, broad sense heritability; DAP, days after planting; BP, breakpoint.
Akond, M., Liu, S., Schoener, L., Anderson, J. A., Kantartzi, S. K., Meksem, K., et al. (2013). A SNP-based genetic linkage map of soybean using the SoyS – NP6K illumina infinium beadchip genotyping array. Plant Genet. Genomics Biotechnol. 1, 80–89. doi: 10.5147/jpgs.2013.0090
Bai, H., and Purcell, L. (2018). Aerial canopy temperature differences between fast-and slow-wilting soya bean genotypes. J. Agron. Crop Sci. 204, 243–251.
Balota, M., and Sarkar, S. (2020). “Transpiration of peanut in the field under rainfed production,” in Proceedings of the American Peanut Research and Education Society Annual Meeting.
Balota, M., Sarkar, S., Cazenave, A., and Kumar, N. (2021). “Plant characteristics with significant contribution to peanut yield under extreme weather conditions in virginia, USA,” in Proceedings of the ASA, CSSA, SSSA International Annual Meeting 2021, Salt Lake City, UT.
Basu, S., Ramegowda, V., Kumar, A., and Pereira, A. (2016). Plant adaptation to drought stress. F1000Research doi: 10.12688/f1000research.7678.1
Beaudette, P. C., Chlup, M., Yee, J., and Emery, R. J. (2007). Relationships of root conductivity and aquaporin gene expression in Pisum sativum: diurnal patterns and the response to HgCl2 and ABA. J. Exp. Bot. 58, 1291–1300. doi: 10.1093/jxb/erl289
Bennett, R. S., Chamberlin, K., Morningweg, D., Wang, N., Sarkar, S., Balota, M., et al. (2021). “Response to drought stress in a subset of the U.S. peanut mini-core evaluated in three states,” in Proceedings of the American Peanut Research and Education Society Annual Meeting, Salt Lake City, UT.
Blum, A. (2009). Effective use of water (EUW) and not water-use efficiency (WUE) is the target of crop yield improvement under drought stress. Field Crops Res. 112, 119–123. doi: 10.1016/j.fcr.2009.03.009
Blum, A. (ed.). (2011). “Plant water relations, plant stress and plant production,” in Plant Breeding For Water-Limited Environments (New York, NY: Springer), 11–52.
Bradbury, P. J., Zhang, Z., Kroon, D. E., Casstevens, T. M., Ramdoss, Y., and Buckler, E. S. (2007). TASSEL: software for association mapping of complex traits in diverse samples. Bioinformatics 23, 2633–2635. doi: 10.1093/bioinformatics/btm308
Bunce, J. A. (1981). Comparative responses of leaf conductance to humidity in single attached leaves. J. Exp. Bot. 32, 629–634. doi: 10.1093/jxb/32.3.629
Carpentieri-Pipolo, V., Pipolo, A. E., Abdel-Haleem, H., Boerma, H. R., and Sinclair, T. R. (2012). Identification of QTLs associated with limited leaf hydraulic conductance in soybean. Euphytica 186, 679–686. doi: 10.1007/s10681-011-0535-6
Charlson, D. V., Bhatnagar, S., King, C. A., Ray, J. D., Sneller, C. H., Carter, T. E. Jr. et al. (2009). Polygenic inheritance of canopy wilting in soybean [Glycine max (L.) Merr.]. Theor. Appl. Genet. 119, 587–594. doi: 10.1007/s00122-009-1068-4
Choudhary, S., and Sinclair, T. R. (2014). Chemical screen for limited-transpiration-rate trait among sorghum genotypes. J. Crop Improv. 28, 377–389. doi: 10.1080/15427528.2014.893942
Choudhary, S., Sinclair, T. R., and Prasad, P. V. V. (2013). Hydraulic conductance of intact plants of two contrasting sorghum lines, SC15 and SC1205. Funct. Plant Biol. 40, 730–738. doi: 10.1071/FP12338
Devi, J. M., Sinclair, T. R., Chen, P., and Carter, T. E. (2014). Evaluation of elite southern maturity soybean breeding lines for drought-tolerant traits. Agron. J. 106, 1947–1954. doi: 10.2134/agronj14.0242
Devi, J. M., Sinclair, T. R., Vadez, V., and Krishnamurthy, L. (2009). Peanut genotypic variation in transpiration efficiency and decreased transpiration during progressive soil drying. Field Crops Res. 114, 280–285.
Devi, M. J., and Reddy, V. R. (2018a). Effect of temperature under different evaporative demand conditions on maize leaf expansion. Environ. Exp. Bot. 155, 509–517. doi: 10.1093/jexbot/51.350.1505
Devi, M. J., and Reddy, V. R. (2018b). Transpiration response of cotton to vapor pressure deficit and its relationship with stomatal traits. Front. Plant Sci. 9:1572. doi: 10.3389/fpls.2018.01572
Devi, M. J., Sinclair, T. R., and Taliercio, E. (2015). Comparisons of the effects of elevated vapor pressure deficit on gene expression in leaves among two fast-wilting and a slow-wilting soybean. PLoS One 10:e0139134. doi: 10.1371/journal.pone.0139134
Devi, M. J., Sinclair, T. R., and Taliercio, E. (2016). Silver and zinc inhibitors influence transpiration rate and aquaporin transcript abundance in intact soybean plants. Environ. Exp. Bot. 122, 168–175. doi: 10.1016/j.envexpbot.2015.10.006
Devi, M. J., Sinclair, T. R., and Vadez, V. (2010). Genotypic variation in peanut for transpiration response to vapor pressure deficit. Crop Sci. 50, 191–196. doi: 10.2135/cropsci2009.04.0220
Fletcher, A. L., Sinclair, T. R., and Allen, L. H. (2007). Transpiration responses to vapor pressure deficit in well watered ‘slow-wilting’ and commercial soybean. Environ. Exp. Bot. 61, 145–151. doi: 10.1016/j.envexpbot.2007.05.004
Gaffney, J., Schussler, J., Löffler, C., Cai, W., Paszkiewicz, S., Messina, C., et al. (2015). Industry-scale evaluation of maize hybrids selected for increased yield in drought-stress conditions of the US corn belt. Crop Sci. 55, 1608–1618. doi: 10.2135/cropsci2014.09.0654
Gates, D. M. (1964). Leaf temperature and transpiration 1. Agron. J. 56, 273–277. doi: 10.2134/agronj1964.00021962005600030007x
Gholipoor, M., Prasad, P. V. V., Mutava, R. N., and Sinclair, T. R. (2010). Genetic variability of transpiration response to vapor pressure deficit among sorghum genotypes. Field Crops Res. 119, 85–90. doi: 10.1016/j.fcr.2010.06.018
Hwang, S., King, C. A., Davies, M. K., Charlson, D. V., Ray, J. D., Cregan, P. B., et al. (2015a). Registration of the KS4895× Jackson soybean mapping population, AR93705. J. Plant Regist. 9, 266–271. doi: 10.3198/jpr2014.05.0034crmp
Hwang, S., King, C. A., Davies, M. K., Ray, J. D., Cregan, P. B., and Purcell, L. C. (2013). QTL analysis of shoot ureide and nitrogen concentrations in soybean [Glycine max (L.) Merr.]. Crop Sci. 53, 2421–2433. doi: 10.2135/cropsci2012.11.0641
Hwang, S., King, C. A., Ray, J. D., Cregan, P. B., Chen, P., Carter, T. E. Jr., etal. (2015b). Confirmation of delayed canopy wilting QTLs from multiple soybean mapping populations. Theor. Appl. Genet. 128, 2047–2065. doi: 10.1007/s00122-015-2566-1
Jackson, R. B., Sperry, J. S., and Dawson, T. E. (2000). Root water uptake and transport: using physiological processes in global predictions. Trends Plant Sci. 5, 482–488. doi: 10.1016/S1360-1385(00)01766-0
Jarzyniak, K. M., and Jasinski, M. (2014). Membrane transporters and drought resistance – a complex issue. Front. Plant Sci. 5:687. doi: 10.3389/fpls.2014.00687
Johnson, H. W. (1958). Registration of soybean varieties, VI 1. Agron. J. 50, 690–691. doi: 10.2134/agronj1958.00021962005000110016x
Khan, N. A., Nazar, R., Iqbal, N., and Anjum, N. A. (2012). Phytohormones and Abiotic Stress Tolerance in Plants. Dordrecht: Springer Science and Business Media. doi: 10.1007/978-3-642-25829-9_3
King, C. A., Purcell, L. C., Bolton, A., and Specht, J. E. (2014). A possible relationship between shoot n concentration and the sensitivity of N2 fixation to drought in soybean. Crop Sci. 54, 746–756. doi: 10.2135/cropsci2013.04.0271
Kooyers, N. J. (2015). The evolution of drought escape and avoidance in natural herbaceous populations. Plant Sci. 234, 155–162. doi: 10.1016/j.plantsci.2015.02.012
Money, D., Gardner, K., Migicovsky, Z., Schwaninger, H., Zhong, G. Y., and Myles, S. (2015). LinkImpute: fast and accurate genotype imputation for nonmodel organisms. G3 (Bethesda) 5, 2383–2390. doi: 10.1534/g3.115.021667
Mullen, J. A., and Koller, H. R. (1988). Daytime and nighttime carbon balance and assimilate export in soybean leaves at different photon flux densities. Plant Physiol. 86, 880–884. doi: 10.1104/pp.86.3.880
Niemietz, C. M., and Tyerman, S. D. (2002). New potent inhibitors of aquaporins: silver and gold compounds inhibit aquaporins of plant and human origin. FEBS Lett. 531, 443–447. doi: 10.1016/s0014-5793(02)03581-0
Phansak, P., Soonsuwon, W., Hyten, D. L., Song, Q., Cregan, P. B., Graef, G. L., et al. (2016). Multi-population selective genotyping to identify soybean [Glycine max (L.) Merr.] seed protein and oil QTLs. G3 (Bethesda) 6, 1635–1648. doi: 10.1534/g3.116.027656
Reuscher, S., and Furuta, T. (2016). ABHgenotypeR: Easy Visualization of ABH Genotypes. R Package Version 1. Available online at: http://github.com/StefanReuscher/ABHgenotypeR
Sadok, W., and Sinclair, T. R. (2010). Transpiration response of ‘slow-wilting’ and commercial soybean (Glycine max (L.) Merr.) genotypes to three aquaporin inhibitors. J. Exp. Bot. 61, 821–829. doi: 10.1093/jxb/erp350
Sadok, W., and Sinclair, T. R. (2011). Crops yield increase under water-limited conditions: review of recent physiological advances for soybean genetic improvement. Adv. Agron. 113, v–vii.
Sadok, W., and Sinclair, T. R. (2012). Zinc treatment results in transpiration rate decreases that vary among soybean genotypes. J. Plant Nutr. 35, 1866–1877. doi: 10.1080/01904167.2012.706683
Sah, S. K., Reddy, K. R., and Li, J. (2016). Abscisic acid and abiotic stress tolerance in crop plants. Front. Plant Sci. 7:571. doi: 10.3389/fpls.2016.00571
Sarkar, S. (2020). Development of High-Throughput Phenotyping Methods and Evaluation of Morphological and Physiological Characteristics of Peanut in a Sub-Humid Environment. Ph.D. thesis. Blacksburg, VA: Virginia Polytechnic Institute and State University.
Sarkar, S., Ramsey, A. F., Cazenave, A.-B., and Balota, M. (2021a). Peanut leaf wilting estimation from RGB color indices and logistic models. Front. Plant Sci. 12:713. doi: 10.3389/fpls.2021.658621
Sarkar, S., Shekoofa, A., Mcclure, A., and Gillman, J. D. (2021b). “Phenotyping and QTLs analysis for the limited transpiration trait in soybean RILs population ‘Jackson’ X ‘KS4895’: high throughput screening,” in Proceedings of the ASA, CSSA, SSSA International Annual Meeting 2021, Salt Lake City, UT.
Schapaugh, W., and Dille, R. (1998). Registration of ‘KS4895’soybean. Crop Sci. 38, 892–892. doi: 10.2135/cropsci1998.0011183x003800030065x
Schmutz, J., Cannon, S. B., Schlueter, J., Ma, J., Mitros, T., Nelson, W., et al. (2010). Genome sequence of the palaeopolyploid soybean. Nature 463, 178–183.
Schulze, E. D. (1986). Carbon dioxide and water vapour exchange in response to drought in the atmosphere and in the soil. Annu. Rev. Plant Physiol. 37, 247–274.
Shekoofa, A., and Sinclair, T. R. (2018). Aquaporin activity to improve crop drought tolerance. Cells 7:123. doi: 10.3390/cells7090123
Shekoofa, A., and Sinclair, T. R. (2020). Abscisic acid and sulfate offer a possible explanation for differences in physiological drought response of two maize near-isolines. Plants (Basel) 9:1713. doi: 10.3390/plants9121713
Shekoofa, A., Devi, J. M., Sinclair, T. R., Holbrook, C. C., and Isleib, T. G. (2013). Divergence in drought-resistance traits among parents of recombinant peanut inbred lines. Crop Sci. 53, 2569–2576. doi: 10.2135/cropsci2013.03.0153
Shekoofa, A., Safikhan, S., Snider, J. L., Raper, T. B., and Bourland, F. M. (2020). Variation in stomatal conductance responses of cotton cultivars to high vapour pressure deficit under controlled and rainfed environments. J. Agron. Crop Sci. 207, 332–343. doi: 10.1111/jac.12440
Shekoofa, A., Sinclair, T. R., Messina, C. D., and Cooper, M. (2016). Variation among maize hybrids in response to high vapor pressure deficit at high temperatures. Crop Sci. 56, 392–396.
Shekoofa, A., Sinclair, T., Aninbon, C., Holbrook, C., Isleib, T., Ozias-Akins, P., et al. (2017). Expression of the limited-transpiration trait under high vapour pressure deficit in peanut populations: runner and virginia types. J. Agron. Crop Sci. 203, 295–300.
Sinclair, T. R. (2011). Challenges in breeding for yield increase for drought. Trends Plant Sci. 16, 289–293. doi: 10.1016/j.tplants.2011.02.008
Sinclair, T. R. (2017). “Limited-transpiration rate under elevated atmospheric vapor pressure deficit,” in Water-Conservation Traits to Increase Crop Yields in Water-deficit Environments, ed. T. R. Sinclair (Cham: Springer), 11–16.
Sinclair, T. R., Hammer, G. L., and Van Oosterom, E. J. (2005). Potential yield and water-use efficiency benefits in sorghum from limited maximum transpiration rate. Funct. Plant Biol. 32, 945–952. doi: 10.1071/FP05047
Sinclair, T. R., Messina, C. D., Beatty, A., and Samples, M. (2010). Assessment across the United States of the benefits of altered soybean drought traits. Agron. J. 102, 475–482. doi: 10.2134/agronj2009.0195
Sinclair, T. R., Purcell, L. C., King, C. A., Sneller, C. H., Chen, P., and Vadez, V. (2007). Drought tolerance and yield increase of soybean resulting from improved symbiotic N2 fixation. Field Crops Res. 101, 68–71.
Sinclair, T. R., Zwieniecki, M. A., and Holbrook, N. M. (2008). Low leaf hydraulic conductance associated with drought tolerance in soybean. Physiol. Plant 132, 446–451. doi: 10.1111/j.1399-3054.2007.01028.x
Sinclair, T., Purcell, L., Vadez, V., Serraj, R., King, C. A., and Nelson, R. (2000). Identification of soybean genotypes with N2 fixation tolerance to water deficits. Crop Sci. 40, 1803–1809.
Song, Q., Yan, L., Quigley, C., Fickus, E., Wei, H., Chen, L., et al. (2020). Soybean BARCSoySNP6K: an assay for soybean genetics and breeding research. Plant J. 104, 800–811. doi: 10.1111/tpj.14960
Song, W. W., Duan, F. M., Li, W. B., Lin, Q., Zhou, H. X., Han, X., et al. (2013). GmPOI gene encoding a Pollen Ole_e_I conserved domain is involved in response of soybean to various stresses. Biol. Plant 57, 85–90. doi: 10.1007/s10535-012-0258-0
Sun, L., Song, G., Guo, W., Wang, W., Zhao, H., Gao, T., et al. (2019). Dynamic changes in genome-wide histone3 lysine27 trimethylation and gene expression of soybean roots in response to salt stress. Front. Plant Sci. 10:1031. doi: 10.3389/fpls.2019.01031
Sung, C., Balota, M., Sarkar, S., Bennett, R., Chamberlin, K., Wang, N., et al. (2021). “Genome-wide association study on peanut water deficit stress tolerance using the u.s. minicore to develop improvement for breeding,” in Proceedings of the American Peanut Research and Education Society Annual Meeting.
Keywords: AgNO3, aquaporin inhibitor, genotyping, high throughput phenotyping, water conservation trait
Citation: Sarkar S, Shekoofa A, McClure A and Gillman JD (2022) Phenotyping and Quantitative Trait Locus Analysis for the Limited Transpiration Trait in an Upper-Mid South Soybean Recombinant Inbred Line Population (“Jackson” × “KS4895”): High Throughput Aquaporin Inhibitor Screening. Front. Plant Sci. 12:779834. doi: 10.3389/fpls.2021.779834
Received: 19 September 2021; Accepted: 09 December 2021;
Published: 20 January 2022.
Edited by:
Dejan Dodig, Maize Research Institute Zemun Polje, SerbiaReviewed by:
Giriraj Kumawat, ICAR-Indian Institute of Soybean Research, IndiaCopyright © 2022 Sarkar, Shekoofa, McClure and Gillman. This is an open-access article distributed under the terms of the Creative Commons Attribution License (CC BY). The use, distribution or reproduction in other forums is permitted, provided the original author(s) and the copyright owner(s) are credited and that the original publication in this journal is cited, in accordance with accepted academic practice. No use, distribution or reproduction is permitted which does not comply with these terms.
*Correspondence: Avat Shekoofa, YXNoZWtvb2ZAdXRrLmVkdQ==
Disclaimer: All claims expressed in this article are solely those of the authors and do not necessarily represent those of their affiliated organizations, or those of the publisher, the editors and the reviewers. Any product that may be evaluated in this article or claim that may be made by its manufacturer is not guaranteed or endorsed by the publisher.
Research integrity at Frontiers
Learn more about the work of our research integrity team to safeguard the quality of each article we publish.