 Federico H. Larrosa
 Lucas Borrás
- 1KWS Group, Balcarce, Argentina
- 2Facultad de Ciencias Agrarias, Universidad Nacional de Rosario, Rosario, Argentina
Altered stand density affects maize yields by producing changes in both numerical yield components, kernel number per plant (KNP), and kernel weight (KW). Kernel number is determined by the accumulation of ear biomass during the flowering period, whereas KW is determined by the sink potential established during flowering and the capacity of the plant to fulfill this potential during effective grain filling. Here, we tested if different short shading treatments during different stages around flowering can help discriminate genotypic differences in eco-physiological parameters relevant for maize stand density yield response and associated yield components. Our specific objectives were to: (i) identify hybrids with differential shading stress response, (ii) explore shading effects over eco-physiological parameters mechanistically related to KNP and KW, and (iii) test if shading stress can be used for detecting differential genotypic yield responses to stand density. The objectives were tested using four commercial maize hybrids. Results indicated that KNP was the yield component most related to yield changes across the different shading treatments, and that the specific shading imposed soon after anthesis generated the highest yield reductions. Hybrids less sensitive to shading stress were those that reduced their plant growth rate the least and the ones that accumulated more ear biomass during flowering. Genotype susceptibility to shading stress around flowering was correlated to stand density responses. This indicated that specific shading stress treatments are a useful tool to phenotype for differential stand density responses of commercial hybrids.
Introduction
Commercial maize breeding programs have been successful in making continuous genetic improvements in maize grain yields (Duvick et al., 2004; Echarte et al., 2004; Luque et al., 2006; Di Matteo et al., 2016; Borrás and Vitantonio-Mazzini, 2018). Hybrid selections are done using multienvironmental trials, where a group of hybrids are grown across several experiments during the years to provide information covering the performance of genotypes in a target population of environments (Delacy et al., 1996). This methodology responds to the requirement of exploring a range of possible environments, with contrasting yield potential and stress conditions. This testing represents a large cost for the production of commercial hybrids. Public and private breeding programs are commonly interested in finding alternative selection methods that allow reducing the number of trials/years during the selection process. Manipulating environmental factors within field experiments can help breeding programs improve genotype selection and agronomic management recommendations, reducing testing costs (Blum and Pnuel, 1990) or increasing their efficiency (Campos et al., 2004).
Environmental conditions, like water (Andrade et al., 2002), nutrient (Caviglia et al., 2014), and radiation levels (Andrade et al., 1999, 2002; Cerrudo et al., 2013) affect maize crop growth and grain yield. Physiological and numeric yield components can help predict crop yield variability associated with different environmental conditions (Rotundo et al., 2012; Di Mauro et al., 2019). Environmental conditions affect maize yields due to changes on kernel number per plant (KNP) or individual kernel weight (KW; Claassen and Shaw, 1970b; Hall et al., 1981). KNP is commonly associated with ear biomass (EB) accumulation around flowering (Echarte et al., 2004; Severini et al., 2011; Borrás and Vitantonio-Mazzini, 2018), and is also associated with plant growth rate (PGR) during this period (Andrade et al., 1999).
Changes in KNP are associated with maize yield variability, and this variability is closely related to changes in PGR around flowering (Fischer and Palmer, 1984; Andrade et al., 1999). Previous studies to determine maize yield susceptibility across the flowering period showed mixed results. Some studies indicated that the close postanthesis period is the most sensitive period for kernel setting and yield (Kiniry and Ritchie, 1985). Other authors, however, indicated that maize yield is most sensitive to changes in canopy growth during 2 weeks bracketing flowering (Hawkins and Cooper, 1981; Cirilo and Andrade, 1994). Otegui and Bonhomme (1998) described the most sensitive period starts −227 Cd (growing degree days) before flowering and ends 100 Cd after flowering, and a recent study found that this period is from −300 to 780 Cd around flowering (Cerrudo et al., 2013).
Several treatments have been used to generate crop stress and reduce canopy growth to test for the crop responses. Yield reductions can be managed using water deficit conditions (Claassen and Shaw, 1970a,b; Hall et al., 1981; Kiniry and Ritchie, 1985; Andrade et al., 2002; Campos et al., 2004), inadequate nutrition (Uhart and Andrade, 1995; Andrade et al., 2002; D’Andrea et al., 2008; Caviglia et al., 2014), increased plant density (Otegui, 1997; Andrade et al., 1999, 2002; Echarte et al., 2000; Sarlangue et al., 2007; Tokatlidis et al., 2011; Hernández et al., 2014), or reductions in radiation levels (Fischer and Palmer, 1984; Kiniry and Ritchie, 1985; Reed et al., 1988; Andrade et al., 1999, 2002). Among all these manipulative stress treatments, artificial shading has practical advantages. The most important is associated with its flexibility for regulating stress timing, intensity, and duration, as shown in the recent study by Cerrudo et al. (2013). Additionally, because canopy growth reductions can be achieved through a number of these treatments, the responses are not specific to the type of stress (Knight and Knight, 2001). In the present manuscript, we tested if genotype differential responses to manipulative shading treatments can be extrapolated to other conditions that reduce canopy growth, like stand density.
Our specific objectives were to: (i) identify tolerant hybrids to shading stress, (ii) explore shading responses using yield numerical and physiological components approaches, and (iii) test if shading stress can be used for detecting differential genotypic yield responses to stand density. We hypothesized that the genotypes with more shading tolerance are the ones with higher optimum stand densities (they tolerate higher stand densities). To test this hypothesis, four maize hybrids were evaluated across different shading and stand density treatments.
Materials and Methods
Genotypes
We tested four maize hybrids (H1–H4) with relative maturity between 118 and 125. Genotypes are the result of a single cross between a common female of one heterotic pool and four males with different backgrounds of a second heterotic pool of KWS Group breeding program. Genotype H1 is commercially known as KM3800 (relative maturity 118), H2 is KM4200 (relative maturity 122), H3 is KM4321 (relative maturity 123), and H4 is KM4500 (relative maturity 125).
Field Experiments With Shading Treatments
Field experiments were conducted in the year 2014 in Zavalla, Santa Fe, Argentina (33° 2′ 24.75″ S, 60° 53′ 11.76″ W). Plots were eight rows with 6 m long and 0.52 m row spacing. Plots were kept free of weeds, insects, and diseases. Weeds were controlled using standard agronomic practices and manually removed whenever necessary. Soil was Vertic Argiudoll, Roldan series. One shading experiment was conducted at Campo Experimental Villarino, Facultad de Ciencias Agrarias, Universidad Nacional de Rosario (named Env 1). Sowing date was September 27 and was conducted under no till and rainfed conditions. All plots were oversown and hand-thinned at V2 (Ritchie and Hanway, 1982) to 8 plants m–2. A second shading experiment was conducted at KWS Experimental Station (named Env 2). Sowing date was December 20 and was managed under tillage and rainfed conditions. Plots were hand-planted at three seeds per hill and hand-thinned to one plant per hill at V2 (Ritchie and Hanway, 1982), resulting in a final stand density of 5.5 plants m–2.
In both experiments, all the hybrids were shaded during periods of 7 days with 80% reduction of incident photosynthetic active radiation. Five shading treatments were centered around the flowering period. Shading treatments went from 14 to 7 days previous to anthesis (named S−7), from 7 days preanthesis to anthesis (named S0), from anthesis to 7 days after anthesis (named S + 7), and from 7 days after anthesis to 14 after anthesis (named S + 14). A control treatment without shading (named T0) was also evaluated, and in Env 1 an additional treatment starting 21 days before anthesis and ending 14 days before anthesis was also tested (named S−14). The experimental design of both shading experiments was a randomized complete block with three replicates. Shading cloth blocked 80% natural light intensity and was suspended above canopy.
Field Experiments With Stand Density Treatments
Three additional field experiments testing hybrid response to stand density were conducted at KWS Experimental Station. The three experiments were sown on September 23, October 20, and November 20, 2014, and named Env 3, Env 4, and Env 5, respectively. They included the same four hybrids used in Env 1 and Env 2. Experiments were managed under tillage and rainfed conditions. Plots were four rows with 6 m long and 0.52 m row spacing. Hybrids H1–H4 were tested at four stand densities (5, 7, 9, and 11 plants m–2). Plots were oversown and hand-thinned to the desired stand density at V2 (Ritchie and Hanway, 1982). Experiments were fertilized with 40 kg N ha–1 before sowing plus an additional 120 kg N ha–1 at V6. Plots were kept free of weeds, insects, and diseases. Each stand density experiment had a randomized complete block design of hybrids and stand densities with three replicates.
Phenotypic Measurements in Shading Experiments
In both shading experiments, yield was calculated from harvesting all ears of two central rows per plot at harvest maturity. Individual kernel weight (KW) was determined after weighting 400 kernels per plot, and KNP was calculated using yield and stand density. Yield and individual KW are reported with 145 g kg–1 moisture. Relative yield (RY) was calculated as the ratio between the yield of any shade treatment and the control plot from the same genotype and block.
In the shading experiment of Campo Experimental Villarino, 15 consecutive plants per plot were tagged at V8 in center rows. These plants were used for describing plant growth and kernel number differences across treatments.
At the pre- and postflowering stages, non-destructive allometric models were used to estimate shoot biomass and partitioning at the individual plant level (Vega et al., 2000; Echarte et al., 2004; Gambín et al., 2008). The preflowering model was based on the linear regression between shoot biomass and stem volume (Vega et al., 2001; Gambín et al., 2008). Stem volume was calculated from plant height (ground level up to the uppermost leaf collar) and stem diameter at the base of the stalk. The preflowering biomass sample was done 15 days before 50% anthesis, and the postflowering one was done 15 days after anthesis. In each plot, two plants from border rows were used to develop the allometric preflowering and postflowering models (Vega et al., 2001). All plant samples were determined after cutting plants and drying them in a forced-air oven at 65°C for at least 7 days. The r2 values for the preflowering model ranged from 0.79 to 0.91 (p < 0.01; n = 27) across hybrids.
The postflowering biomass sample was done using a multiple linear regression model with stem volume and maximum ear diameter from all ears having extruded visible silks (Vega et al., 2001; Gambín et al., 2008). The r2 values for this model ranged from 0.81 to 0.98 (p < 0.01; n = 27) across hybrids. In the postflowering biomass sample, we also estimated the ear biomass 15 days after anthesis by fitting a linear regression between ear biomass and the square of ear diameter (similar to Hernández et al., 2014).
Plant growth rate around flowering (mg plant–1°C d–1) was calculated as the ratio between the plant biomass (mg plant–1) difference and the thermal time accumulated from pre- to postflowering samples in each specific plot. Daily thermal time values were calculated using a base temperature of 8°C. PGR was determined for each tagged plant and the values were presented as an average individual PGR, and its plant-to-plant variability was expressed as the coefficient of variation of PGR (CVPGR) for each genotype × treatment combination.
Barrenness was calculated as the percentage of barren plants per plot. Plants with less than 10 kernels at harvest maturity were considered barren (Tollenaar et al., 1992). For each individual plot, we also calculated the partition efficiency (PEF) as the ratio between EB and the total plant biomass 15 days after anthesis, and the seed set efficiency (SSEF) as the ratio between KNP and the accumulated EB.
For comparing hybrids, we fitted the relationship between KNP and EB 15 days after anthesis, and between EB and PGR around flowering, similar to Hernández et al. (2014). Both relationships were described by a hyperbolic function with their specific parameters [Figure 1; Eqs. (1–4)]. Descriptive parameters of the models are PGRb, ISEB, CEB, EBb, ISKN, and CKN (Figure 1). Models were fit to each genotype × replicate combination and included in the same curve the five shading treatments utilized within each replicate; so the parameters were estimated for genotype × replicate combinations. Replicates were used for an ANOVA test, and r2 values ranged from 0.41 to 0.92 (p < 0.01).
where in Eq. (2) ISEB is the initial slope of the relationship between EB and PGR, PGRb is the base PGR for ear growth, and CEB is the curvilinearity of the hyperbolic function (curvature) of the relationship between EB and PGR. In Eq. (4) ISKN is the initial slope of the relationship between KNP and EB, EBb is the base ear biomass for initial kernel set, and CKN is the curvilinearity of the hyperbolic function (curvature) of the relationship between KNP and EB. All these parameters are considered genotypic coefficients. Applying these coefficients uniformly to all the plants is supported by several studies that show a consistent relationship between ear growth and PGR around flowering across environments (Andrade et al., 1999; Vega et al., 2001; Borrás et al., 2007). All curves were fitted using the GraphPad Prism version 5.0 (Raduschev, 2007) iterative optimization technique.
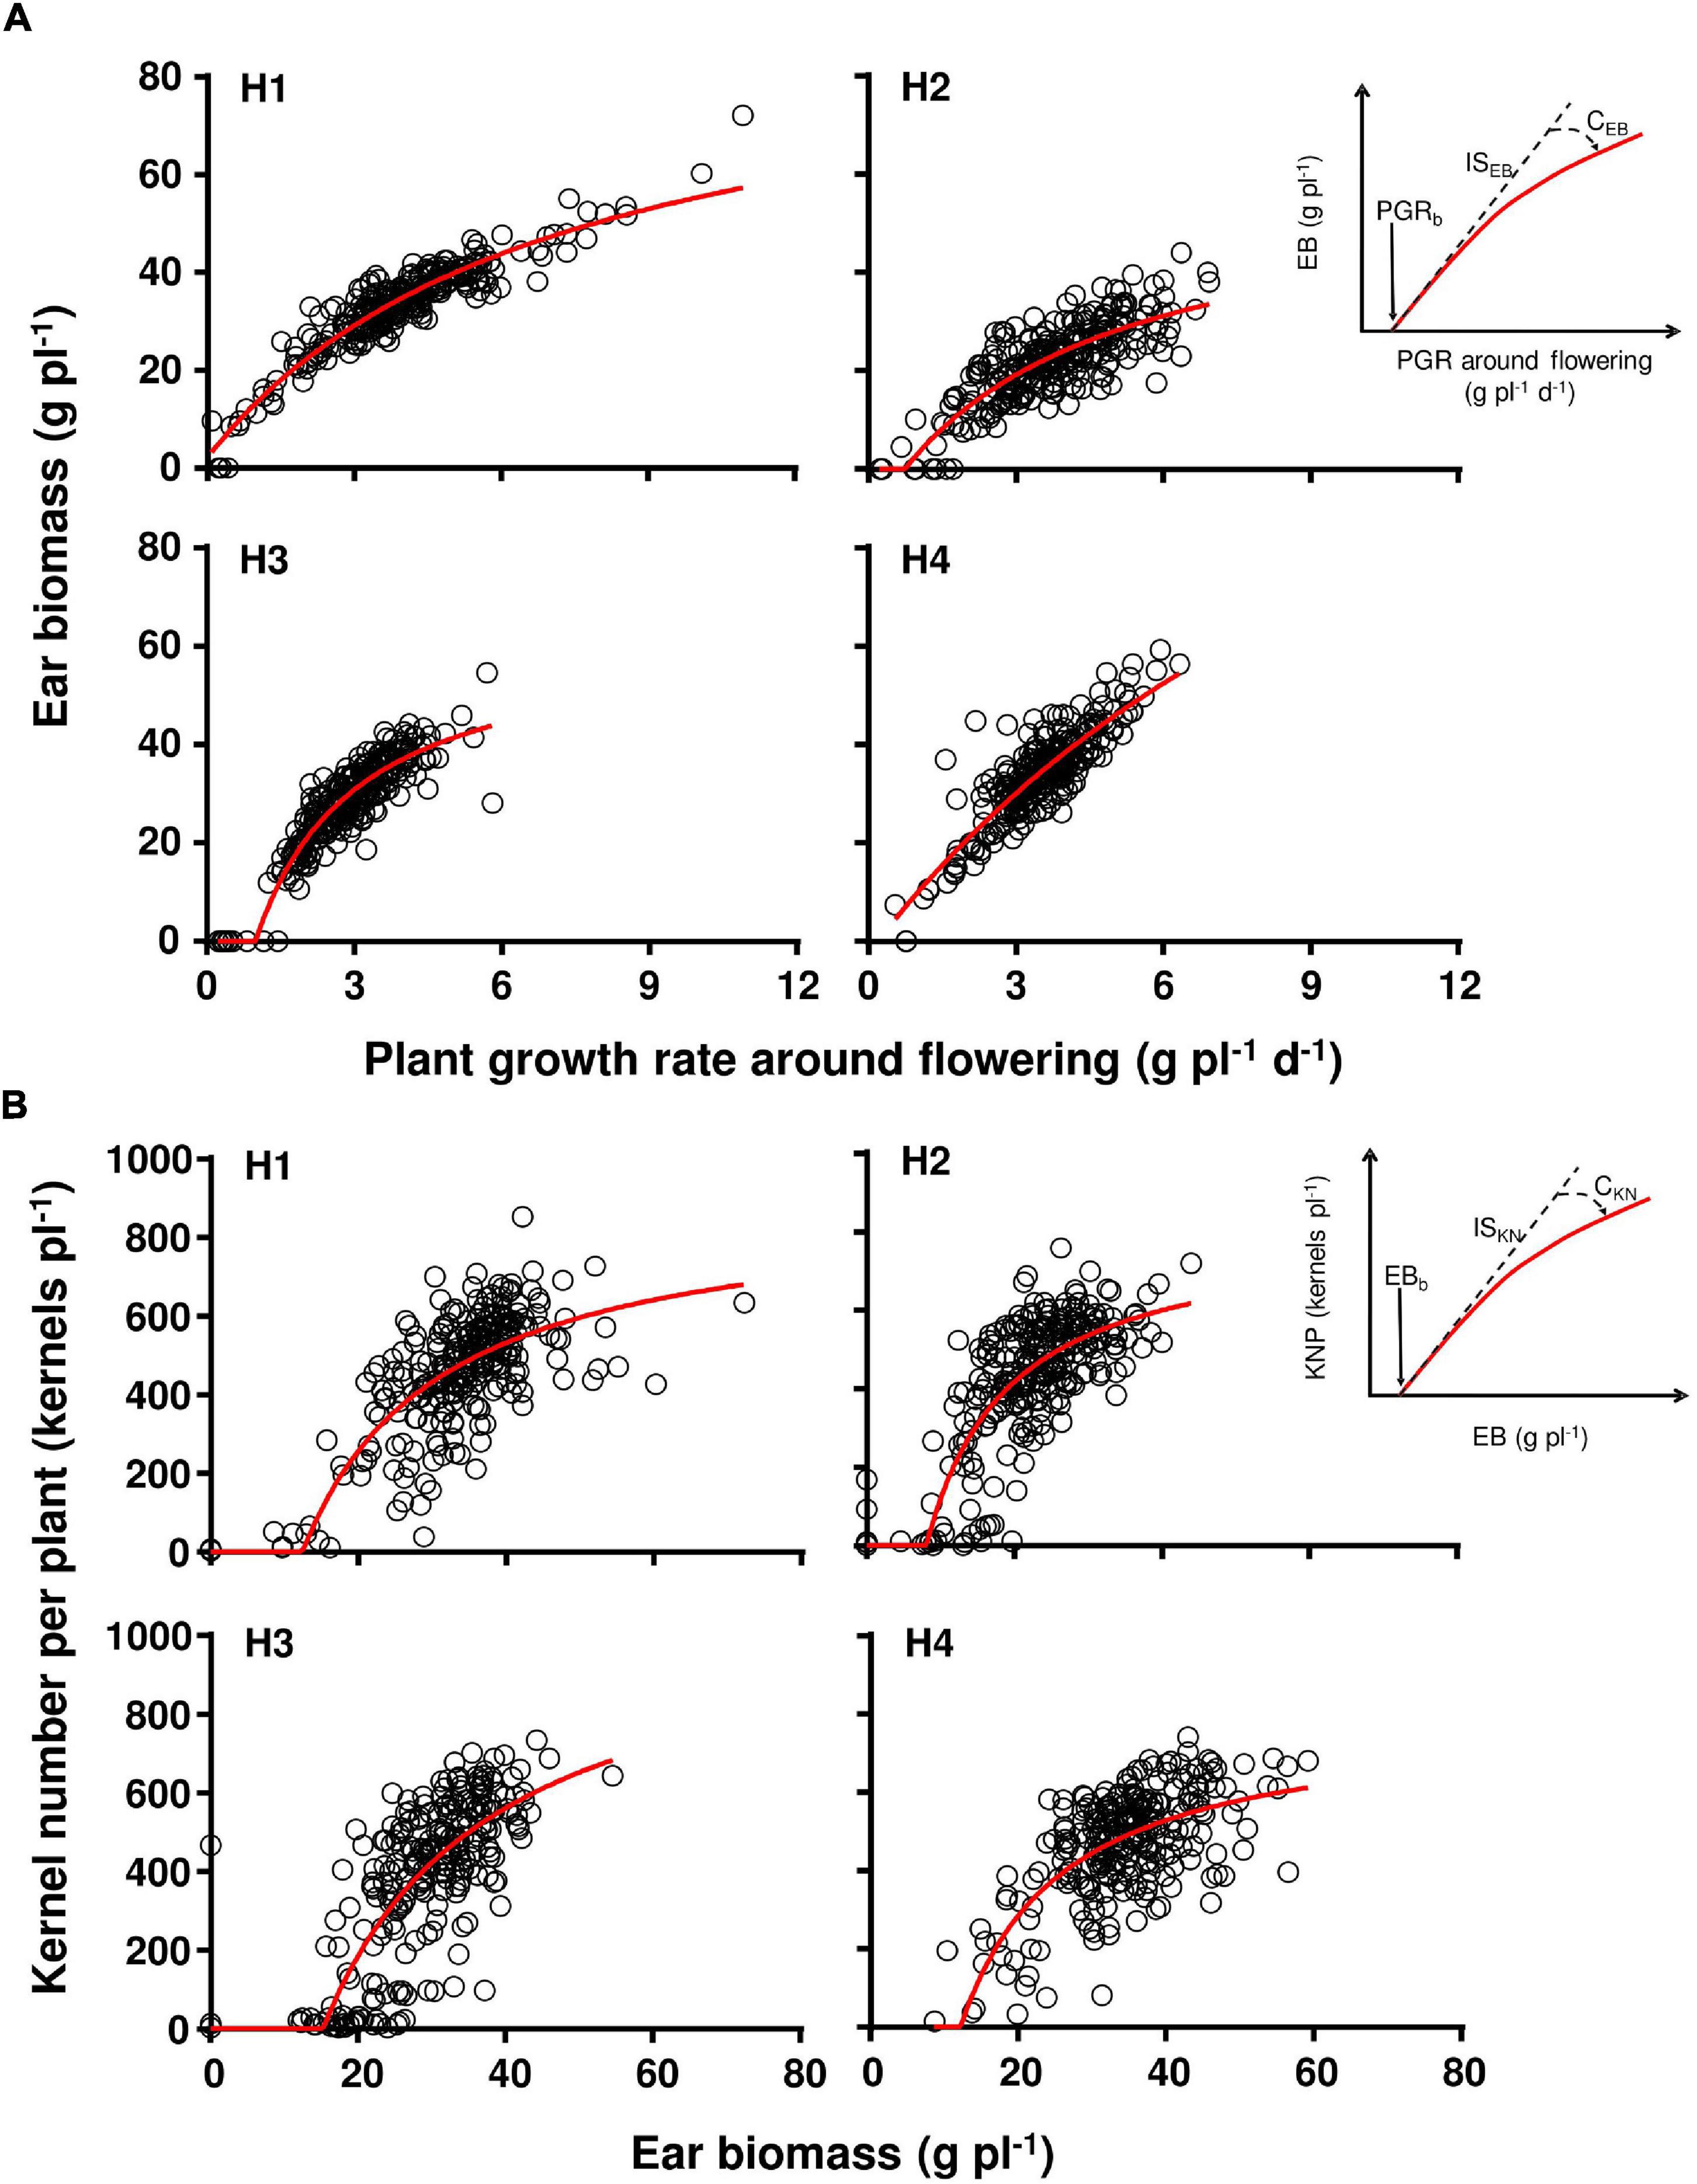
Figure 1. Ear biomass as a function of plant growth rate (A), and kernel number as a function of ear biomass (B) for the four evaluated genotypes (H1, H2, H3, and H4). The left inset in (A,B) describe the parameters for each relationship, fully described in Table 3. All correlations were significant [(A) H1 had n = 263, r2 = 0.54; H2 had n = 261, r2 = 0.59; H3 had n = 252, r2 = 0.55; H4 had n = 259, r2 = 0.45; in (B) H1 had n = 265, r2 = 0.88; H2 had n = 270, r2 = 0.65; H3 had n = 269, r2 = 0.84; H4 had n = 268, r2 = 0.75]. Red lines describe the fitted curves.
Phenotypic Measurements in Stand Density Experiments
Yield was calculated after harvesting all ears from 3 m2 in central rows at harvest maturity in all genotype × stand density × environment combinations. Yield is reported with 145 g kg–1 moisture.
Statistical Analysis
Data were analyzed separately for each experiment (shading or stand density) in R software (R Core Team, 2020). We used a randomized complete block design with three replications in all the trials. Sources of variation were environment (sowing date), hybrids, treatment (shading or stand density), and blocks. Main or interaction effects were tested with ANOVA. Treatment marginal means were estimated with “emmeans” function from EMMEANS R package (Russell, 2021). Tukey test was done for pairwise comparisons of estimated means.
Results
Shading Stress Effects on Maize Yields and Critical Period
Environments, hybrids, and shading treatments all showed significant yield differences (p < 0.001; Table 1). A hybrid × shading × environment treatment interaction (p < 0.001; Table 1) was also significant, showing that shading stress responses were different among hybrids and environments (p < 0.001; Table 1). In both environments, the effects of shading treatments S−14, S + 7, and S + 14 on yield did not differ across hybrids, but large hybrid yield differences were observed in the treatments closer to anthesis (S−7 and S0 treatments; Supplementary Table 1). In Env 1 the S−7 treatment hybrids H1, H2, H3, and H4 yielded 13.0, 11.9, 8.7, and 14.2 Mg ha–1, respectively (Supplementary Table 1), and in the S0 treatment genotypes H1, H2, H3, and H4 yielded 11.6, 4.6, 8.2, and 12.7 Mg ha–1, respectively (Supplementary Table 1). These genotype differential yield responses were even more evident in Env 2.
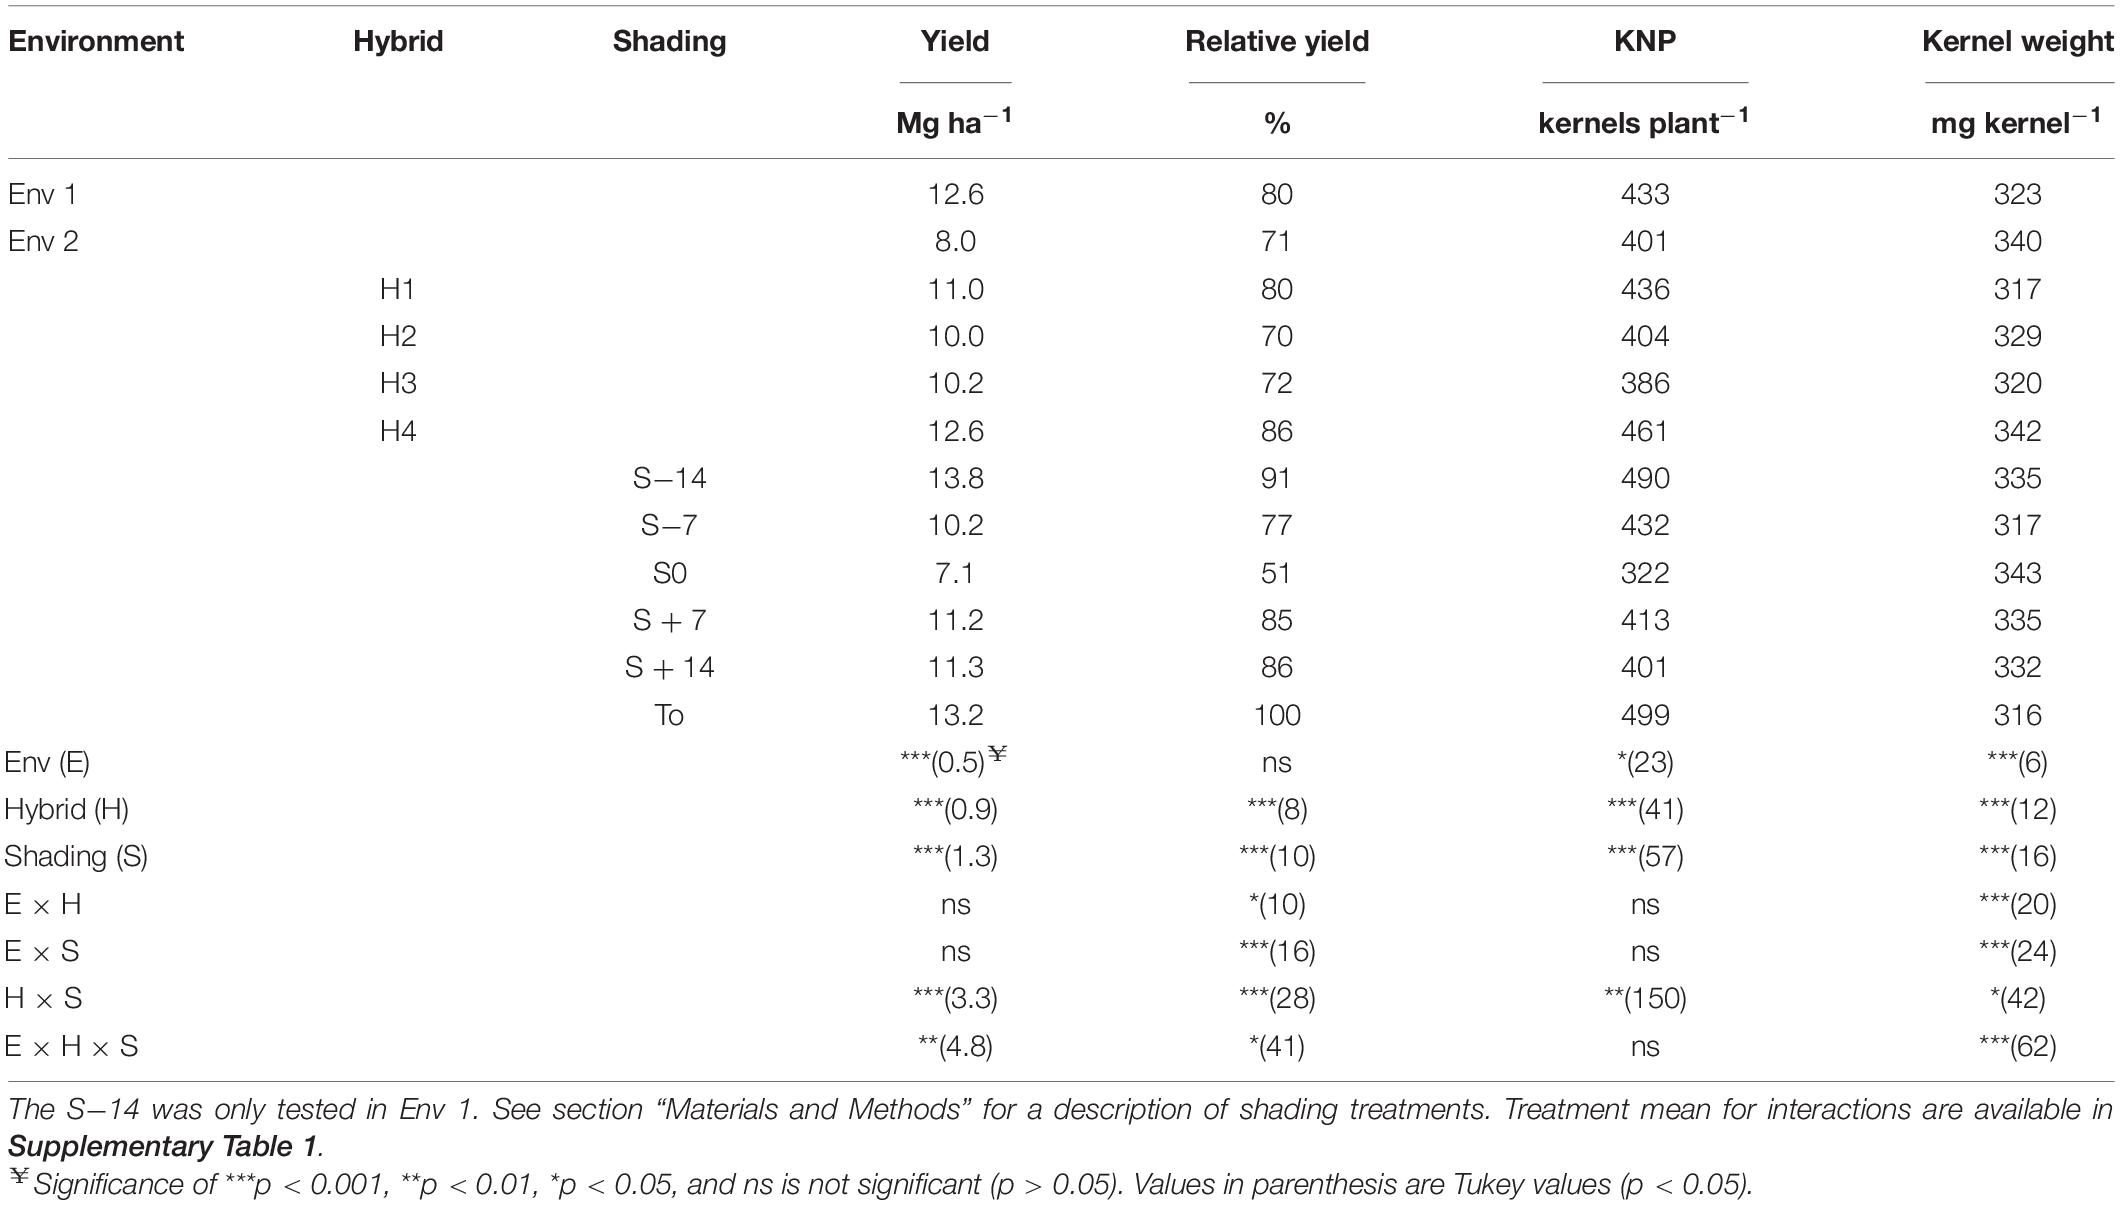
Table 1. Yield, relative yield (yield relative to the T0 control treatment), kernel number per plant (KNP), and individual kernel weight (KW) for four genotypes tested at six reduced radiation treatments (S−14, S−7, S0, S + 7, S + 14, and T0) in two different environments (Env 1 and Env 2).
When analyzed in relative terms (here called relative yield), the interaction environment × hybrid × shading treatment was significant (p < 0.05; Table 1), illustrating that yield reductions associated with shading treatments were different depending on the particular hybrid and environment. For example, the relative yield of H1 and H4 in Env 1 did not differ among shading treatments, but the shading treatment finishing at anthesis (S0) applied to H1 had a 26% relative yield, whereas it did not reduce H4 relative yields in Env 2 (Supplementary Table 1, contrast p < 0.001). Likewise, hybrids H2 and H3 showed significant relative yield reductions when the shading treatment S0 was applied to both the environments (Supplementary Table 1).
Shading Effects on Yield Physiological Components
Kernel Number per Plant
Kernel number per plant was affected by environment (p < 0.05), hybrids (p < 0.001), shading (p < 0.001), and hybrid × shading treatment interactions (Table 1). This showed that KNP was different according to hybrid and shading treatments (Supplementary Table 1). Hybrid H4 presented the highest KNP values (p < 0.001), and when comparing shading treatments S−7, S0, S + 7, and S + 14 significantly lower KNP values were generated in comparison to T0 (p < 0.001). Averaged across hybrids, the treatment S0 had the lowest KNP value (322 kernels plant–1), in agreement with the described yield response and the known relevance of KNP for yield determination.
Changes in KNP can be described as a function of changes in EB accumulated 15 days after flowering. Significant differences for accumulated EB among hybrids (p < 0.001) and shading treatment (p < 0.001) were observed. Genotype maximum and minimum EB were 33.7 and 22.1 g ear–1, corresponding to H4 and H2, respectively (Table 2). Shading treatments showed maximum values for T0 (32.9 g ear–1), and minimum values for S0 (25 g ear–1, Table 2).
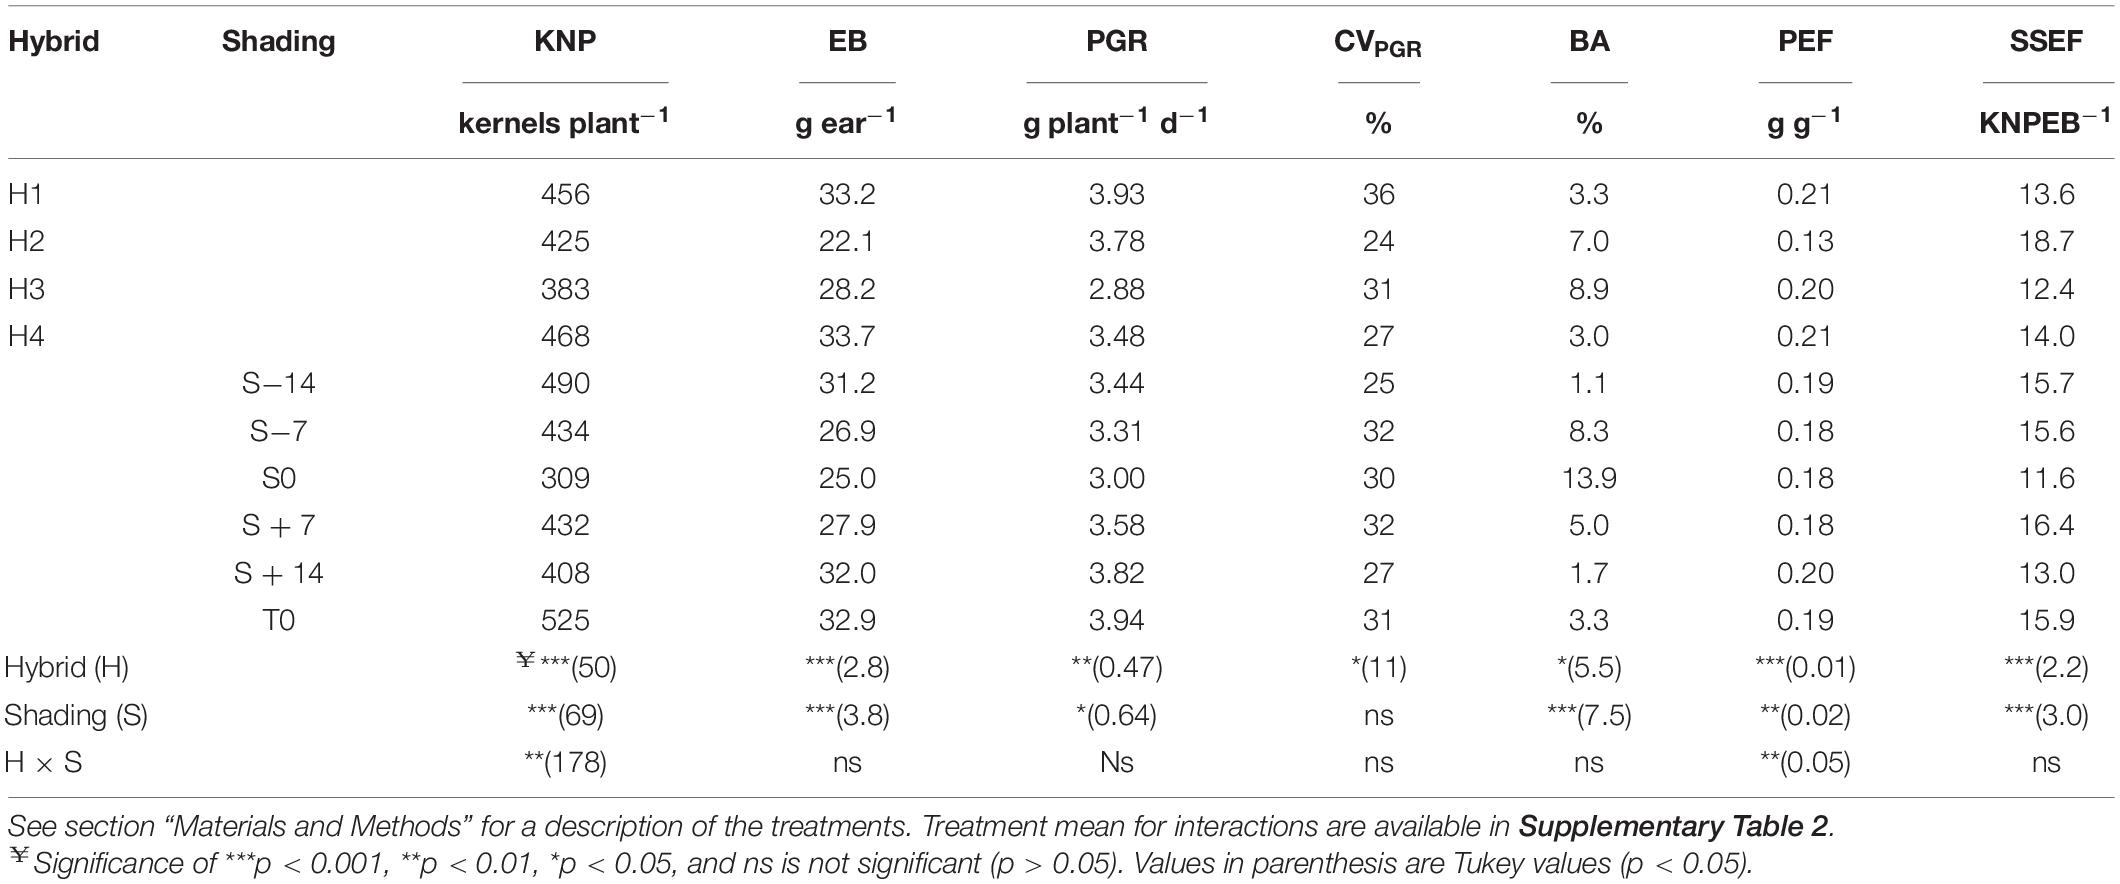
Table 2. Kernel number per plant (KNP), accumulated ear biomass 15 days after anthesis (EB), individual plant growth rate around flowering (PGR) and their coefficient of variation (CVPGR), barrenness (BA), partition efficiency (PEF), and seed set efficiency (SSEF) for the four genotypes (H1, H2, H3, and H4) tested at six shading treatments (S−14, S−7, S0, S + 7, S + 14, and T0).
The proportion of barren plants within the canopy was well correlated to changes in accumulated EB 15 days after anthesis across hybrids and shading treatments, with the S0 treatment being the one with higher barrenness values (Table 2). This was particularly evident in the genotypes H2 and H3 that showed the largest yield and KNP decline in this specific shading treatment, S0 (Supplementary Table 2).
Plant growth rate also showed significant differences for hybrids (p < 0.01) and shading treatments (p < 0.05; Table 2), and the non-significant hybrid × shading interaction (p > 0.05) showed that all the genotypes reduced their growth to a similar extent across shading treatments. Pant growth rate of H1 and H4 was significantly different from H3 (3.93 and 3.48 vs. 2.88 g plant–1 day–1, respectively; Table 2; contrast p < 0.001 and p < 0.05, respectively). PGR was significantly reduced for S−14, S−7, and S0 regarding to T0 (Table 2).
Variations in CVPGR only showed significant differences among hybrids (p < 0.05, Table 2). H2 was the most uniform genotype, whereas H1 was the most variable one in terms of plant-to-plant growth variability.
Plant biomass partitioning to the ear during the flowering period (called partitioning efficiency, PEF) showed a significant hybrid × shading treatment interaction (p < 0.01, Supplementary Table 2). Lowest PEF values were observed for H2, and were especially lower in the shading treatment S0, the one that reduced yield, KNP, and ear biomass accumulation the most.
Also, hybrids (p < 0.001) and shading treatments (p < 0.01) showed significant differences for their seed set efficiency per unit of accumulated ear biomass (SSEF; Table 2), but no differential hybrid responses were evident for this trait (no significant hybrid × shading interaction, p > 0.05; Table 2). The lowest efficiency was observed in the treatment having the highest yield detrimental effect (S0; Table 2).
Figure 1A describes the relationship between ear biomass accumulation and PGR around flowering for each hybrid, and Figure 1B shows the relationship between KNP and ear biomass accumulation for each hybrid. Table 3 describes the parameters of the adjusted models describing the differential response patterns shown by each hybrid. In brief, hybrids showed different response patterns. Parameter PGRb was significantly lower for H1 than H3 (p < 0.05, Table 4). When compared with ISEB, H3 showed the highest magnitude (31.6 g EB g plant–1 d–1; p < 0.01; Table 4) but was also the genotype with the highest curvature value (CEB for H3 was 0.52 g plant–1 d–1; Table 3). EBb presented significant differences between hybrids (p < 0.05), ranging from 9.2 to 16.5 g (Table 3), and the lowest value was observed in H2. As such, genotypes differed in the parameters that described how much of the total plant biomass is partitioned to the growing ear around flowering, and in how is accumulated ear biomass turned into kernels per plant. The poor plant biomass partitioning described in H2 in Table 2 is also evident in Figure 1 and is coincident with the hybrid susceptibility to shading.
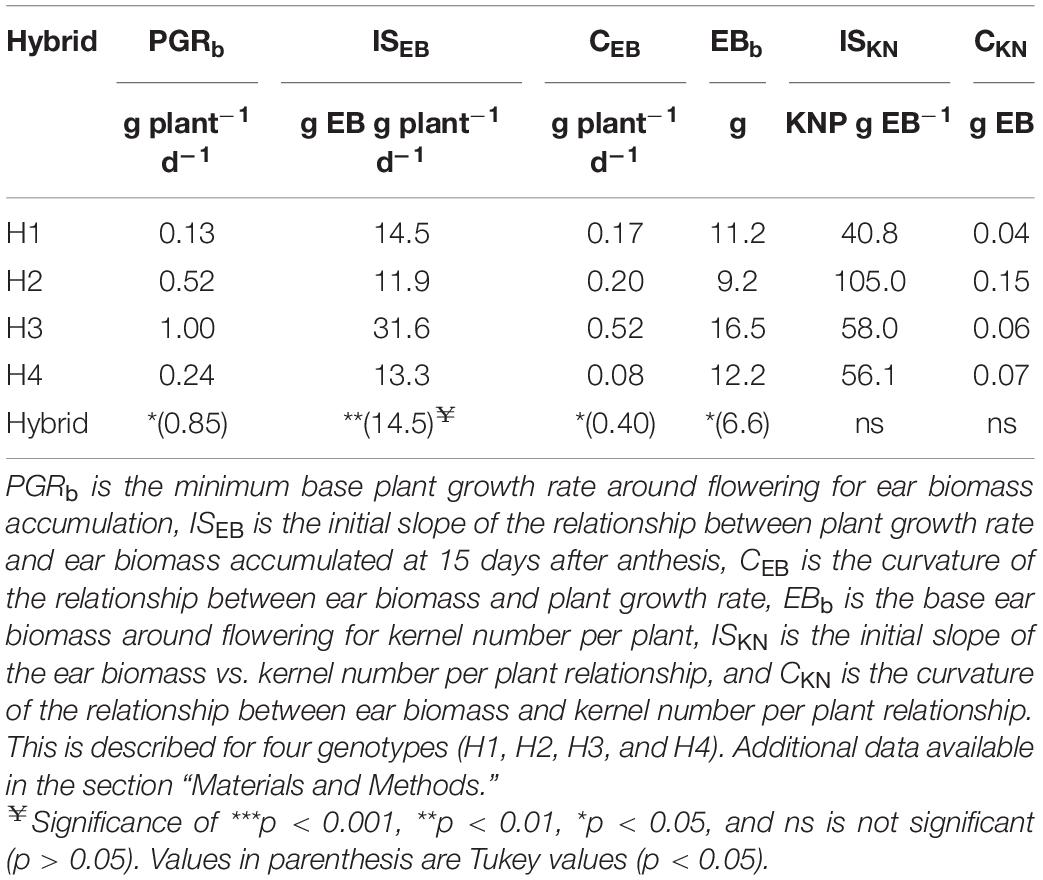
Table 3. Descriptive parameters of model relating kernel number per plant (KNP) with ear biomass accumulated 15 days after anthesis (EB), and EB as a function of plant growth rate (PGR) around flowering.
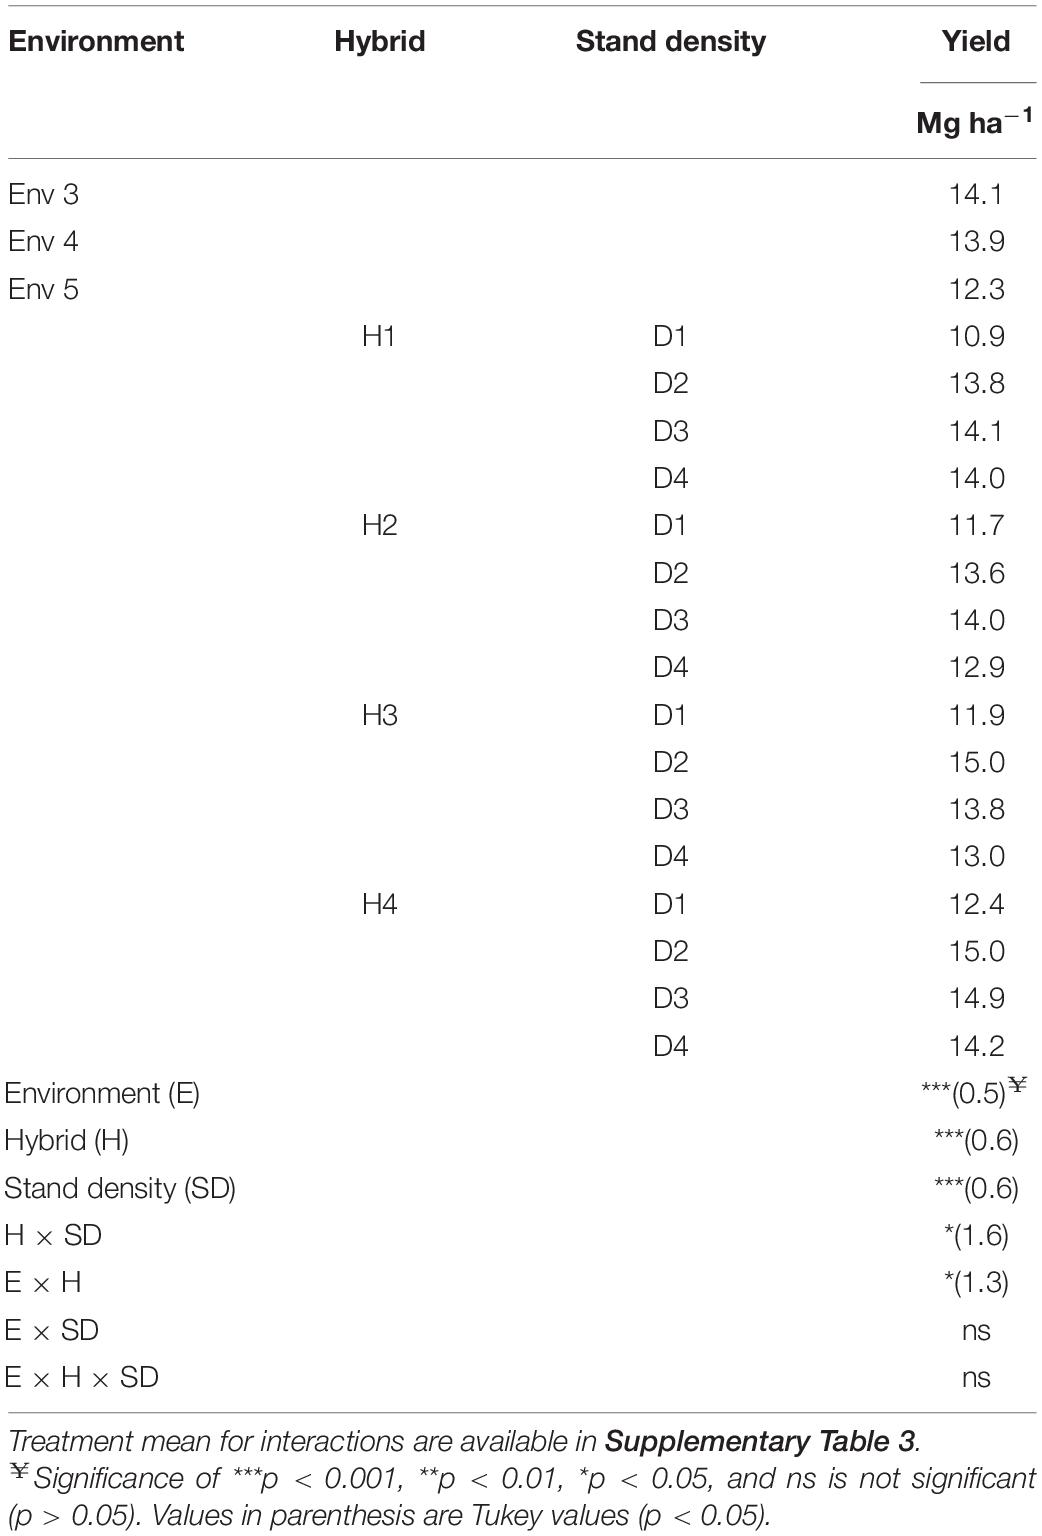
Table 4. Yield of four genotypes (H1, H2, H3, and H4) tested at three environments (Env 3, Env 4, and Env 5), and four stands density treatments (D1, D2, D3, and D4 were 5, 7, 9, and 11 plants m–2).
Hybrid Differential Yield Response to Stand Density
In a second round of experiments, we tested how these same hybrids responded to stand density changes, and a stand density × hybrid experiment was repeated across three environments.
Yield results showed that all three main effects (hybrids, stand densities, and environments) were highly significant (p < 0.001), and that the interactions hybrid × stand density and hybrid × environment were also statistically significant for yield (p < 0.05; Table 4). The significant interaction hybrid × stand density showed that hybrids responded differently to changes in stand density.
Analyzing hybrids across densities, H4 produced highest yields in all densities, yielding 12.4, 15.0, 14.9, and 14.2 Mg ha–1 for stand densities 5, 7, 9, and 11 plants m–2, respectively. Hybrid H1 also presented its highest yields in the highest stand densities, with 14.1 and 14.0 Mg ha–1, at 9 and 11 plants m–2, respectively (Table 4). Contrary to this response, hybrids H2 and H3 did not maximize their yields at the highest densities and showed a significant decline in their yields at the highest stand density of 11 plants m–2. Hybrids H2 and H3 showed that the maximum yields were achieved at the lower stand densities of 9 and 5 plants m–2, respectively (Table 4). This differential yield response to stand the density of hybrids H2 and H3 compared to H1 and H4 was more evident in the lowest yield environment Env 5 (Supplementary Table 3).
Discussion
Differences among commercial maize hybrids in their yield response to water availability (Campos et al., 2004; Messina et al., 2019), stand density (Sarlangue et al., 2007; Tokatlidis et al., 2011; Hernández et al., 2014; Mylonas et al., 2020), and N availability (Gambin et al., 2016) are known. Crop managers are seeking information about hybrid × stand density interactions, and many seed companies are currently providing hybrid-specific recommendations for stand density management. The generation of this information comes with a large effort, in which commercial and precommercial hybrids are tested at a range of stand densities and environments to provide accurate recommendations (Lacasa et al., 2020).
In the present manuscript, we tested the hypothesis that hybrid response to shading treatments around flowering can help predict hybrid differential responses to stand density. This hypothesis is based on the concept that all these stressful environmental scenarios (lack of water, of radiation, of N) have common responses affecting kernel set though changes in PGR around the flowering period (Andrade et al., 1999). We do realize that our study tested a limited number of hybrids, locations, and stand densities, but results have large implications for phenotyping hybrid responses to management changes. Our results testing a number of commercial genotypes support the use of specific shading treatments to predict hybrid stand density performance.
We tested five different short shading moments to identify if there was any specific timing that helped discriminate hybrids in their response to shading. Results indicated that the shading ending at anthesis (S0) was the most powerful one to discriminate differential hybrid responses to shading stress. The treatments that were more distanced in time from anthesis (starting 14 days before or after anthesis, treatments S−14 and S + 14, respectively) were the ones showing minor yield effects. This is coincident with the early articles about the maize yield critical period around flowering (Fischer and Palmer, 1984; Otegui and Bonhomme, 1998), and contradicts the results from Cerrudo et al. (2013) that predicted a similar effect for a large period around flowering. We hypothesize that differences with this later study might be a consequence of testing a single genotype, our hybrid × shading significant interaction for yield (Table 1) shows that not all genotypes have similar yield responses.
Maize grain yield response to stand density changes is usually dissected into two components, potential yield per plant, and tolerance to crowding stress. Although evidence is available that both components have changed with breeding for yield, the latter component has been more successfully increased by breeding and is responsible for the most yield improvements (Tollenaar and Wu, 1999; Duvick et al., 2004; Tokatlidis and Koutroubas, 2004; Egli, 2015; Assefa et al., 2018). In the present manuscript, we described that a direct specific shading treatment around flowering can help predict hybrid performance to higher stand densities, as shown by the differential response of the commercial evaluated hybrids.
Amelong et al. (2017) reported that hybrid yield response to stand density can be predicted from parental inbred line information. In the present study, we used four genotypes that only differed in one parental line. This will allow us to track the genotypic basis for the differential shading, and stand density described yield responses.
Conclusion
Evaluated hybrids differ in their yield and relative yield response to changes in shading stress. The treatments that exposed hybrid differences the most were those specifically centered around the flowering period.
Yield responses to shading stress were related to known physiological determinants of kernel set, namely plant growth and biomass partitioning to the ear during flowering. These physiological traits helped understand commercial hybrid differences in their yield sensitivity to shading stress.
Hybrid differences in their yield response to high stand density were correlated to their yield response to shading stress, indicating that shading treatments can be used to effectively test hybrid yield performance to crowing tolerance.
Data Availability Statement
The raw data supporting the conclusions of this article will be made available by the authors, without undue reservation.
Author Contributions
Both authors listed have made a substantial, direct and intellectual contribution to the work, and approved it for publication.
Conflict of Interest
FL was employed by company KWS Group.
The remaining authors declare that the research was conducted in the absence of any commercial or financial relationships that could be construed as a potential conflict of interest.
Publisher’s Note
All claims expressed in this article are solely those of the authors and do not necessarily represent those of their affiliated organizations, or those of the publisher, the editors and the reviewers. Any product that may be evaluated in this article, or claim that may be made by its manufacturer, is not guaranteed or endorsed by the publisher.
Acknowledgments
The authors want to thank Alberto Vignolo, Florencia Genovese, Nicolas Fassio, and Vicente Colombo for help with field experiments.
Supplementary Material
The Supplementary Material for this article can be found online at: https://www.frontiersin.org/articles/10.3389/fpls.2021.771739/full#supplementary-material
Abbreviations
EB, ear biomass; PGR, plant growth rate; KNP, kernel number per plant; KW, kernel weight; RY, relative yield; CVPGR, coefficient of variation of plant growth rate; BA, barrenness; PEF, partition efficiency; SSEF, seed set efficiency; ISEB, initial slope for ear biomass accumulation; PGRb, base plant growth rate for ear biomass accumulation; CEB, curvilinearity of the relationship between ear biomass accumulation and plant growth rate; ISKN, initial slope for kernel number per plant; EBb, base ear biomass for kernel set; CKN, curvilinearity of the relationship between kernel number per plant and accumulated ear biomass; Env, environment; H, hybrids; S, shading; SD, stand density.
References
Amelong, A., Hernández, F., Novoa, A. D., and Borrás, L. (2017). Maize stand density yield response of parental inbred lines and derived hybrids. Crop Sci. 57, 32–39. doi: 10.2135/cropsci2016.02.0083
Andrade, F. H., Echarte, L., Rizzalli, R., Della Maggiora, A., and Casanovas, M. (2002). Kernel number prediction in maize under nitrogen or water stress. Crop Sci. 42, 1173–1179. doi: 10.2135/cropsci2002.1173
Andrade, F. H., Vega, C., Uhart, S., Cirilo, A., Cantarero, M., and Valentinuz, O. (1999). Kernel number determination in maize. Crop Sci. 39, 453–459.
Assefa, Y., Carter, P., Hinds, M., Bhalla, G., Schon, R., Jeschke, M., et al. (2018). Analysis of long term study indicates both agronomic optimal plant density and increase maize yield per plant contributed to yield gains. Sci. Rep. 8:4937. doi: 10.1038/s41598-018-23362-x
Blum, A., and Pnuel, Y. (1990). Physiological attributes associated with drought resistance of wheat cultivars in a Mediterranean environment. Aust. J. Agric. Res. 41, 799–810. doi: 10.1071/AR9900799
Borrás, L., and Vitantonio-Mazzini, L. N. (2018). Maize reproductive development and kernel set under limited plant growth environments. J. Exp. Bot. 69, 3235–3243. doi: 10.1093/jxb/erx452
Borrás, L., Westgate, M. E., Astini, J. P., and Echarte, L. (2007). Coupling time to silking with plant growth rate in maize. Field Crops Res. 102, 73–85. doi: 10.1016/j.fcr.2007.02.003
Campos, H., Cooper, M., Habben, J. E., Edmeades, G. O., and Schussler, J. R. (2004). Improving drought tolerance in maize: a view from industry. Field Crops Res. 90, 19–34. doi: 10.1016/j.fcr.2004.07.003
Caviglia, O. P., Melchiori, R. J. M., and Sadras, V. O. (2014). Nitrogen utilization efficiency in maize as affected by hybrid and N rate in late-sown crops. Field Crops Res. 168, 27–37. doi: 10.1016/j.fcr.2014.08.005
Cerrudo, A., Di Matteo, J., Fernandez, E., Robles, M., Pico, L. O., and Andrade, F. H. (2013). Yield components of maize as affected by short shading periods and thinning. Crop Past. Sci. 64, 580–587. doi: 10.1071/CP13201
Cirilo, A. G., and Andrade, F. H. (1994). Sowing date and maize productivity: II. Kernel number determination. Crop Sci. 34, 1044–1046.
Claassen, M. M., and Shaw, R. H. (1970a). Water deficit effects on corn. I. Vegetative components. Agron. J. 62, 649–652.
Claassen, M. M., and Shaw, R. H. (1970b). Water deficit effects on corn. II. Grain components. Agron. J. 62, 652–655.
D’Andrea, K. E., Otegui, M. E., and Cirilo, A. G. (2008). Kernel number determination differs among maize hybrids in response to nitrogen. Field Crops Res. 105, 228–239.
Delacy, I. H., Basford, K. E., Cooper, M., Bull, J. K., and Mclaren, C. G. (1996). “Analysis of multi-environment trials–an historical perspective” in Plant Adaptation and Crop Improvement. Eds M. Cooper. and G. L. Hammer. (UK: CABI). 39124.
Di Matteo, J. A., Ferreyra, J. M., Cerrudo, A. A., Echarte, L., and Andrade, F. H. (2016). Yield potential and yield stability of Argentine maize hybrids over 45 years of breeding. Field Crops Res. 197, 107–116. doi: 10.1016/j.fcr.2016.07.023
Di Mauro, G., Borrás, L., Rugeroni, P., and Rotundo, J. L. (2019). Exploring soybean management options for environments with contrasting water availability. J. Agron. Crop Sci. 205, 274–282. doi: 10.1111/jac.12321
Duvick, D. N., Smith, J. S. C., and Cooper, M. (2004). Long-term selection in a commercial hybrid maize breeding program. Plant Breed. Rev. 24, 109–152.
Echarte, L., Andrade, F. H., Vega, C. R. C., and Tollenaar, M. (2004). Kernel number determination in argentinean maize hybrids released between 1965 and 1993. Crop Sci. 44, 1654–1661. doi: 10.2135/cropsci2004.1654
Echarte, L., Luque, S., Andrade, F. H., Sadras, V. O., Cirilo, A., Otegui, M. E., et al. (2000). Response of maize kernel number to plant density in Argentinean hybrids released between 1965 and 1993. Field Crops Res. 68, 1–8. doi: 10.1016/S0378-4290(00)00101-5
Egli, D. B. (2015). Is there a role for sink size in understanding maize population-yield relationships? Crop Sci. 55, 2453–2462. doi: 10.2135/cropsci2015.04.0227
Fischer, K. S., and Palmer, F. E. (1984). “Tropical maize” in ‘The physiology of tropical field crops’. eds P. R. Goldsworthy and N. M. Fisher (New York: Wiley). 213–248.
Gambín, B. L., Borrás, L., and Otegui, M. E. (2008). Kernel weight dependence upon plant growth at different stages of grain filling. Aust. J. Agric. Res. 59, 280–290. doi: 10.1071/AR07275
Gambin, B. L., Coyos, T., Di Mauro, G., Borrás, L., and Garibaldi, L. A. (2016). Exploring genotype, management, and environmental variables influencing grain yield of late-sown maize in central Argentina. Agric. Syst. 146, 11–19. doi: 10.1016/j.agsy.2016.03.011
Hall, A. J., Lemcoff, J. H., and Trápani, N. (1981). Water stress before and during flowering in maize and its effects on yield, its components, and their determinants. Maydica 26, 19–38.
Hawkins, R. C., and Cooper, P. J. M. (1981). Growth, development and grain yield of maize. Exp. Agric. 17, 203–207.
Hernández, F., Amelong, A., and Borrás, L. (2014). Genotypic differences among Argentinean maize hybrids in yield response to stand density. Agron. J. 106, 2316–2324. doi: 10.2134/agronj14.0183
Kiniry, J. R., and Ritchie, J. T. (1985). Shade-sensitive interval of kernel number in maize. Agron. J. 77, 711–715.
Knight, H., and Knight, M. R. (2001). Abiotic stress signalling pathways: specificity and cross-talk. Trends Plant Sci. 6, 262–267. doi: 10.1016/S1360-1385(01)01946-X
Lacasa, J., Gaspar, A., Hinds, M., Jayasinghege Don, S., Berning, D., and Ciampitti, I. A. (2020). Bayesian approach for maize yield response to plant density from both agronomic and economic viewpoints in North America. Sci. Rep. 10:15948. doi: 10.1038/s41598-020-72693-1
Luque, S. F., Cirilo, A. G., and Otegui, M. E. (2006). Genetic gains in grain yield and related physiological attributes in Argentine maize hybrids. Field Crops Res. 95, 383–397. doi: 10.1016/j.fcr.2005.04.007
Messina, C. D., Hammer, G. L., Mclean, G., Cooper, M., Van Oosterom, E. J., Tardieu, F., et al. (2019). On the dynamic determinants of reproductive failure under drought in maize. Silico Plants 1:diz003. doi: 10.1093/insilicoplants/diz003
Mylonas, I., Sinapidou, E., Remountakis, E., Sistanis, I., Pankou, C., Ninou, E., et al. (2020). Improved plant yield efficiency alleviates the erratic optimum density in maize. Agron. J. 112, 1690–1701. doi: 10.1002/agj2.20187
Otegui, M. E. (1997). Kernel set and flower synchrony within the ear of maize: II. Plant population effects. Crop Sci. 37, 448–455. doi: 10.2135/cropsci1997.0011183X003700020024x
Otegui, M. E., and Bonhomme, R. (1998). Grain yield components in maize: I. Ear growth and kernel set. Field Crops Res. 56, 247–256. doi: 10.1016/S0378-4290(97)00093-2
R Core Team. (2020). R: a Language and Environment for Statistical Computing. Vienna: R Foundation for Statistical Computing.
Reed, A. J., Singletary, G. W., Schussler, J. R., Williamson, D. R., and Christy, A. L. (1988). Shading effects on dry matter and nitrogen partitioning, kernel number, and yield of maize. Crop Sci. 28, 819–825.
Ritchie, S. W., and Hanway, J. J. (1982). “How a corn plant develops” in Special Report. (Iowa: Iowa State University of Science and Technology). 48.
Rotundo, J. L., Borrás, L., De Bruin, J., and Pedersen, P. (2012). Physiological strategies for seed number determination in soybean: biomass accumulation, partitioning and seed set efficiency. Field Crops Res. 135, 58–66. doi: 10.1016/j.fcr.2012.06.012
Russell, V. L. (2021). emmeans: estimated Marginal Means, aka Least-Squares Means. R package version 1.6.3. Available online at: https://CRAN.R-project.org/package=emmeans (accessed October 2021).
Sarlangue, T., Andrade, F. H., Calviño, P. A., and Purcell, L. C. (2007). Why do maize hybrids respond differently to variations in plant density? Agron. J. 99, 984–991. doi: 10.2134/agronj2006.0205
Severini, A. D., Borrás, L., Westgate, M. E., and Cirilo, A. G. (2011). Kernel number and kernel weight determination in dent and popcorn maize. Field Crops Res. 120, 360–369. doi: 10.1016/j.fcr.2010.11.013
Tokatlidis, I. S., Has, V., Melidis, V., Has, I., Mylonas, I., Evgenidis, G., et al. (2011). Maize hybrids less dependent on high plant densities improve resource-use efficiency in rainfed and irrigated conditions. Field Crops Res. 120, 345–351. doi: 10.1016/j.fcr.2010.11.006
Tokatlidis, I. S., and Koutroubas, S. D. (2004). A review of maize hybrids’ dependence on high plant populations and its implications for crop yield stability. Field Crops Res. 88, 103–114. doi: 10.1016/j.fcr.2003.11.013
Tollenaar, M., Dwyer, L. M., and Stewart, D. W. (1992). Ear and kernel formation in maize hybrids representing three decades of grain yield improvement in Ontario. Crop Sci. 32, 432–438. doi: 10.2135/cropsci1992.0011183X003200020030x
Tollenaar, M., and Wu, J. (1999). Yield improvement in temperate maize is attributable to greater stress tolerance. Crop. Sci. 39, 1597–1604. doi: 10.2135/cropsci1999.3961597x
Uhart, S. A., and Andrade, F. H. (1995). Nitrogen deficiency in maize: I. Effects on crop growth, development, dry matter partitioning, and kernel set. Crop Sci. 35, 1376–1383. doi: 10.2135/cropsci1995.0011183X003500050020x
Vega, C. R. C., Andrade, F. H., Sadras, V. O., Uhart, S. A., and Valentinuz, O. R. (2001). Seed number as a function of growth. A comparative study in soybean, sunflower, and maize. Crop Sci. 41, 870–878. doi: 10.2135/cropsci2001.413748x
Keywords: corn, stand density, shading treatments, plant population (densities), shading stress
Citation: Larrosa FH and Borrás L (2022) Differential Maize Yield Hybrid Responses to Stand Density Are Correlated to Their Response to Radiation Reductions Around Flowering. Front. Plant Sci. 12:771739. doi: 10.3389/fpls.2021.771739
Received: 07 September 2021; Accepted: 17 December 2021;
Published: 17 January 2022.
Edited by:
Yared Assefa, Kansas State University, United StatesReviewed by:
Paul R. H. Robson, Aberystwyth University, United KingdomIoannis Tokatlidis, Democritus University of Thrace, Greece
Copyright © 2022 Larrosa and Borrás. This is an open-access article distributed under the terms of the Creative Commons Attribution License (CC BY). The use, distribution or reproduction in other forums is permitted, provided the original author(s) and the copyright owner(s) are credited and that the original publication in this journal is cited, in accordance with accepted academic practice. No use, distribution or reproduction is permitted which does not comply with these terms.
*Correspondence: Federico Larrosa, RmVkZXJpY28uTGFycm9zYUBrd3MuY29t