
95% of researchers rate our articles as excellent or good
Learn more about the work of our research integrity team to safeguard the quality of each article we publish.
Find out more
ORIGINAL RESEARCH article
Front. Plant Sci. , 27 October 2021
Sec. Plant Breeding
Volume 12 - 2021 | https://doi.org/10.3389/fpls.2021.763016
This article is part of the Research Topic Trends in Cotton Breeding: Meeting the Challenges of the 21st Century View all 22 articles
 Wenfeng Pei1,2,3†
 Jikun Song1,2†
 Wenkui Wang2
 Jianjiang Ma2Bing Jia1,2Luyao Wu2
 Man Wu2Quanjia Chen1Qin Qin4Haiyong Zhu4Chengcheng Hu4Hai Lei5Xuefei Gao6Haijun Hu6Yu Zhang6Jinfa Zhang7*
 Jiwen Yu1,2,3*Yanying Qu1*
Cotton is the most important fiber crop and provides indispensable natural fibers for the textile industry. Micronaire (MIC) is determined by fiber fineness and maturity and is an important component of fiber quality. Gossypium barbadense L. possesses long, strong and fine fibers, while upland cotton (Gossypium hirsutum L.) is high yielding with high MIC and widely cultivated worldwide. To identify quantitative trait loci (QTLs) and candidate genes for MIC in G. barbadense, a population of 250 backcross inbred lines (BILs), developed from an interspecific cross of upland cotton CRI36 × Egyptian cotton (G. barbadense) Hai7124, was evaluated in 9 replicated field tests. Based on a high-density genetic map with 7709 genotyping-by-sequencing (GBS)-based single-nucleotide polymorphism (SNP) markers, 25 MIC QTLs were identified, including 12 previously described QTLs and 13 new QTLs. Importantly, two stable MIC QTLs (qMIC-D03-2 on D03 and qMIC-D08-1 on D08) were identified. Of a total of 338 genes identified within the two QTL regions, eight candidate genes with differential expression between TM-1 and Hai7124 were identified. Our research provides valuable information for improving MIC in cotton breeding.
Cotton (Gossypium spp.) is an important cash crop species worldwide, providing an essential natural resource for the textile industry. Due to its high yield and wide adaptation, upland cotton (Gossypium hirsutum L.) accounts for more than 95% of global cotton production (Lacape et al., 2003; Li X. M. et al., 2016). However, extra-long staple, Pima, Egyptian, or Sea Island cotton (Gossypium barbadense L.) have excellent fiber quality with long, strong and fine fibers, but their low yield and requirements for warm and dry weather conditions limit their cultivation area (Zhang et al., 2014; Said J. I. et al., 2015). In recent years, the goal of cotton breeding in China has shifted to improving fiber quality (including fiber length, strength, and micronaire (MIC)], in addition to high yield (Fang et al., 2017). To date, there have been an increasing number of studies on improving cotton fiber quality traits through interspecific hybridization, especially G. hirsutum × G. barbadense (Zhang et al., 2014; Wang et al., 2020).
Cotton fibers are the longest and fastest growing cells of cotton plants. Each cotton fiber consists of a single cell that grows on the surface of the ovule. The fiber development process includes four main stages: fiber initiation, elongation, secondary wall thickening and maturation (Pang et al., 2010). Cotton fiber quality is a quantitative trait affected by multiple genes (genotype), environmental factors and genotype × environment interactions during fiber development. MIC is mainly determined by the formation characteristics of fiber secondary walls (Wu et al., 2020). Its value is determined by measuring the airflow resistance of a certain weight of cotton fiber plug (i.e., μg per inch of single fiber). Textile processing companies and scientific research organizations have adopted MIC as a key parameter of fiber maturity and fineness (Bradow and Davidonis, 2000). MIC is a comprehensive index of fiber fineness and maturity for fiber quality and plays an important role in the fiber spinning process. Because immature fibers have thin cell walls and therefore low MIC (below 3.4), they tend to become weaker and easily break during the spinning process, making low grade yarns. However, mature fibers have thick cell walls and produce a thick yarn. So mature cotton fibers are preferred in spinning (Kim et al., 2013). For mature fibers, MIC reflects the fineness of the fibers in that the higher the MIC, the coarser the mature fibers. Mature fibers with MIC readings between 3.70 and 4.20 are considered premium. However, micronaire readings of 3.4- and -under or 5.0- and -higher will receive discount in pricing. Therefore, it is of great theoretical and applied value to analyze and identify candidate genes regulating MIC at the quantitative trait locus (QTL) level for fiber quality molecular breeding and elucidate the genetic mechanism underlying cotton fiber development.
Quantitative trait locus mapping uses molecular marker technology as a tool based on genetic linkage maps and uses the linkage between linked molecular markers and QTLs to determine the position of candidate genes that control quantitative traits throughout the genome. At present, two commonly used methods include composite interval mapping (CIM) and inclusive composite interval mapping (ICIM) (Meng et al., 2015). Software used for these two methods include WinQTLCart 2.5 for CIM and QTL IciMapping 4.2 for ICIM. Most researchers have used these two software programs separately to carry out QTL mapping research on important cotton traits. For example, CIM was used by Li C. et al. (2016), Zhang et al. (2016) and Liu et al. (2018), and ICIM was used by Liu et al. (2017, 2019) and Ma et al. (2017). However, these two mapping methods can be simultaneously used for locating QTLs to perform a more accurate and comprehensive genetic analysis of traits.
Using one of the two methods, studies have also reported QTLs for MIC. Ali et al. (2018) identified 22 MIC-related QTLs in a RIL population of 180 lines in upland cotton, among which 13 QTLs were detected in two or more environments. Wang B. H. et al. (2017) detected 27 MIC-related QTLs using BC3F2, BC3F2:3, and BC3F2:4 populations of an interspecific G. hirsutum × Gossypium mustelinum cross, among which 11 QTLs were located near the same marker in different populations or near linked markers in the same population. In addition, Fan et al. (2018) identified four MIC-related QTLs using a population of 143 RILs of an intra-G. barbadense cross. With the rapid development of genome sequencing technology, genome-wide association study (GWAS) has been successfully applied in the genetic analysis of fiber quality traits, including fiber MIC. Using genome resequencing, Wang M. J. et al. (2017) identified 3 significant single-nucleotide polymorphisms (SNPs) for fiber MIC in a group of 362 diverse upland cotton accessions, and Ma et al. (2018) identified 533 significant SNPs for fiber MIC in a panel of 419 upland cotton accessions. In addition, Huang et al. (2017) used the cotton Illumina 63K SNP array to genotype a collection of 503 upland cotton lines and identified 3 stable QTLs associated with MIC. Through a meta-analysis of numerous QTL reports, Said J. et al. (2015) compiled a total of 395 QTLs related to MIC in a QTL database for cotton.1 Xu et al. (2020) recently performed a meta-analysis and identified a total of 15 meta-QTLs for MIC. These studies provide references for locations of QTLs for MIC.
Although G. barbadense has much longer, stronger and finer fibers than G. hirsutum, whether there exist major QTLs for MIC when crossing with G. hirsutum is currently not well understood. In this study, we used a population of 250 backcross inbred lines (BILs) from a G. barbadense × G. hirsutum cross (Ma J. et al., 2019) and identify QTLs for MIC based on a high-quality genetic map using two QTL mapping methods. The identified QTLs were then subjected to an integrated analysis to identify BILs with low MIC (i.e., fine fibers) and candidate genes for MIC. The results will lay the foundation for subsequent fine mapping of MIC-related genes and molecular marker-assisted selection (MAS) to improve MIC in upland cotton.
An interspecific BIL population comprising 250 BC1F7 lines was developed from a cross between Egyptian cotton (G. barbadense) Hai7124 and Chinese G. hirsutum CRI36. The parents and 250 BC1F7 lines were planted in accordance with a randomized complete block design in nine environments at five locations, including the South Farm (nc) and the East Farm (dc) at the Institute of Cotton Research, Chinese Academy of Agricultural Sciences (CRI-CAAS), Anyang, Henan, China (Aync, 2015, 2016, 2017, and Aydc, 2017); Weixian, Hebei (Hbwx, 2016); Sanya, Hainan (Hnsy, 2016); and Alar, south Xinjiang (Xjal, 2016, 2017); and Shihezi, Northern Xinjiang (Xjsh, 2017). Crop management practices followed local recommendations for cotton production. The use of two major cotton production regions (the Yellow River Valley and Northwestern Inland Valley) allowed the detection of consistent QTLs for MIC between the two regions. The specific length amplified fragment sequencing (SLAF-seq) strategy was followed for genotyping the BILs using a G. hirsutum reference genome with updates (Zhang et al., 2015; Hu et al., 2019). The details of a genetic linkage map consisting of 7709 markers were described previously by Ma J. et al. (2019).
Twenty normally mature (opened) bolls from the first and second nodes of middle fruiting branches were sampled in September each year. All seedcotton samples were ginned by a roller gin in the South Farm at CRI-CAAS, Anyang, Henan. Fiber samples were then tested by an HVI 1000 instrument at the Cotton Quality Inspection and Supervision Center of the Ministry of Agriculture, CRI-CAAS, Anyang, Henan. The R software package lme4 was used to estimate the best linear unbiased predictions (BLUPs) and broad-sense heritability (H2) for MIC across the nine environments (Bates et al., 2014). The R software was also used for other statistical analyses including analysis of variance (ANOVA) and principal component analysis (PCA) of MIC for the BIL population across different environments.
Micronaire values in each of the nine testing environments and their BLUPs across the tests were used for QTL analysis using the ICIM of ADDitive QTL (ICIM-ADD) method in QTL IciMapping 4.2 (Meng et al., 2015) and the CIM method in WinQTLCart 2.5 (Wang et al., 2007). The parameters were set to a mapping step of 1 cM, a p value of 0.05 for type I error, and a PIN of 0.01, and 1000 permutations were taken to calculate the logarithm of odds (LODs) threshold. QTLs at the same location in two or more environments with a LOD threshold of >2.5 were considered significant QTLs (Shang et al., 2015). The QTL confidence interval (95%) was set as a mapping distance interval corresponding to a decrease of 1 LOD on either side of the peak (Yu et al., 2012a; Liu et al., 2019). MIC QTLs detected in three or more environments were considered stable QTLs when their confidence intervals overlapped (Yu et al., 2012b; Ma J. et al., 2019). A set of consensus QTLs for MIC was inferred by integrating the information of QTLs detected via the two methods. QTLs were named according to the method of Sun et al. (2013), with a prefix of W, I, and C for a QTL identified by CIM, ICIM and both methods, respectively. MapChart 2.2 was used to visualize the genetic map and QTL bars.
To identify new QTLs in this study, QTLs from our results were compared with previously reported QTLs. Previous MIC QTLs were retrieved from CottonGen (Yu et al., 2014) and Cotton QTLdb Release 2.3 (January 24, 2018, see text footnote 1) (Said J. et al., 2015) and from recent reports by Majeed et al. (2019) and Xu et al. (2020). In addition, MIC QTL data from previous GWAS reports were also obtained. A co-localizing marker or a neighboring marker for a MIC QTL was identified, and then the marker location on the TM-1 genome was determined (Zhang et al., 2015; Hu et al., 2019). The physical intervals of all QTLs were queried via BLAST against the TM-1 genome, and QTLs were co-localized together with the previously identified MIC-related QTLs.
After the physical intervals of stable QTLs were queried via BLAST against the TM-1 genome (Hu et al., 2019), potential candidate genes were determined on the basis of the physical interval for a QTL. The homologous genes of candidate genes from Arabidopsis and the annotations of gene functions were determined from the TM-1 genome. The general pattern of expression of the candidate genes and their SNPs including insertion/deletion (InDel) of TM-1 and Hai7124 were also obtained from Hu et al. (2019) and then analyzed by SnpEff to predict variant impact (Cingolani, 2012). Gene Ontology (GO) enrichment of candidate genes was performed using the micStudio tools.2 Homologous genes of candidate genes from Arabidopsis were used to determine enriched ontology clusters by Metascape (Zhou et al., 2019). Candidate genes were further used to predict the micro-RNA (miRNA) target genes by psRNATarget3 (Dai et al., 2018), and the miRNA expression data of fibers at 14 days post-anthesis (DPA) were obtained from the Cotton Omics Database.4
Across the nine environments, MIC of the BILs ranged from 2.10 to 6.17, with an average of 4.14, and the mean MIC of the Upland CIR36 and Egyptian Hai7124 parents were 3.59 and 4.06, respectively (Table 1). The MIC of CIR36 was significantly (P < 0.01) greater than that of Hai7124. The values of skewness and kurtosis in each environment showed that MIC followed a normal distribution in the BIL population (Supplementary Figure 1 and Table 1). Furthermore, there was a transgressive segregation of MIC within the BIL population compared with the Hai7124 and CRI36 parents. The ANOVA detected significant variations in MIC (P < 0.01) due to environment and genotype in the BIL population (Supplementary Table 1). However, the H2 estimate for MIC (i.e., the percentage of the total phenotypic variance accounted for by the genotypic variance) was 93.44%, suggesting that MIC was highly heritable in this BIL population (Supplementary Table 1).
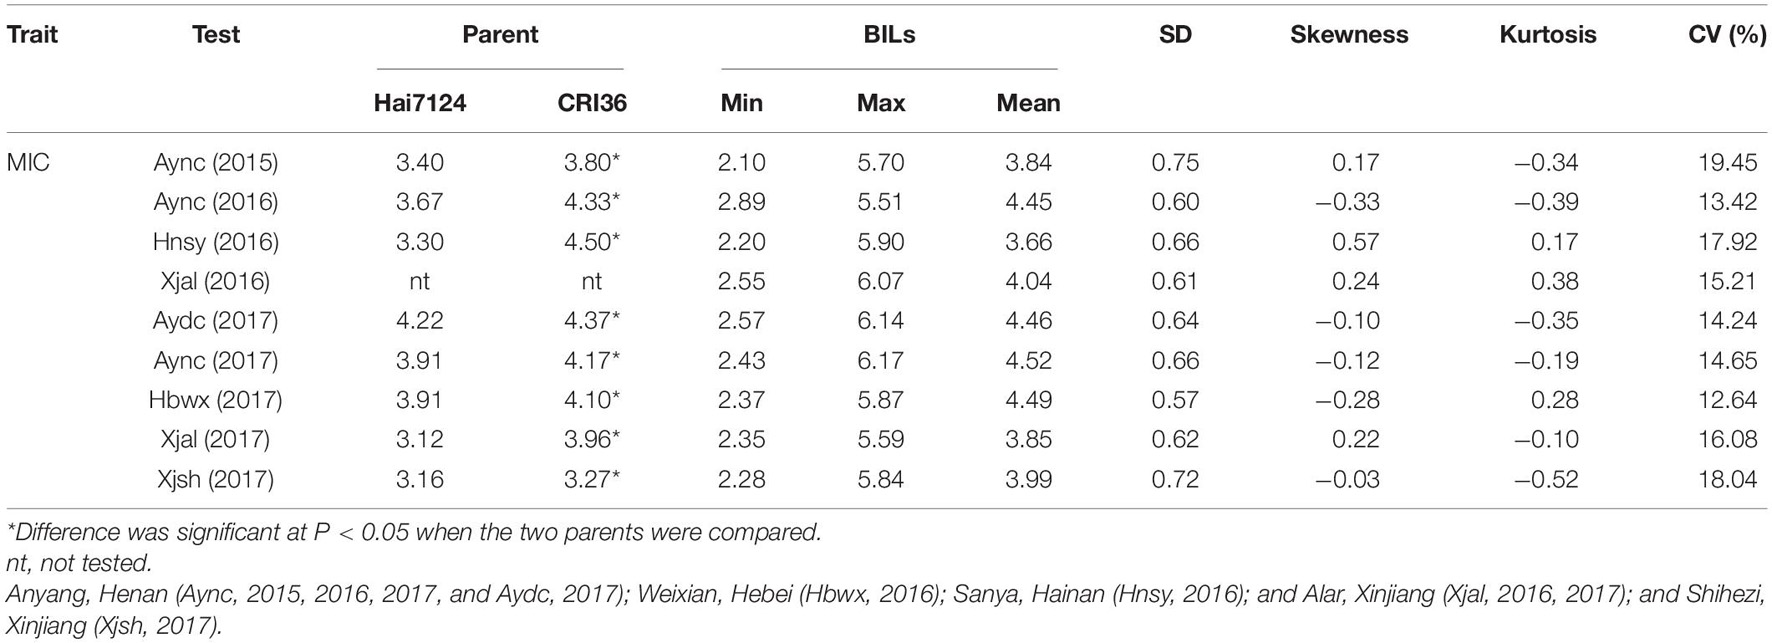
Table 1. Performance of backcross inbred lines (BILs) of Hai7124 × CRI36 hybrids and their parents.
Principal component analysis of the MIC value in this set of BILs showed that the nine environments could be classified into two regions: Region 1 (Northwestern Inland Valley) and Region 2 (Yellow River Valley) (Figure 1), mostly consistent with the official ecological classification of the cotton production regions in China, except for two tests-Anyang, Henan, 2015 (15Aync) and Sanya, Hainan, 2016 (16Hnsy) which were grouped with Region 1. Therefore, the testing environments of the two regions were separately estimated using BLUPs as BLUP-region 1 and BLUP-region 2.
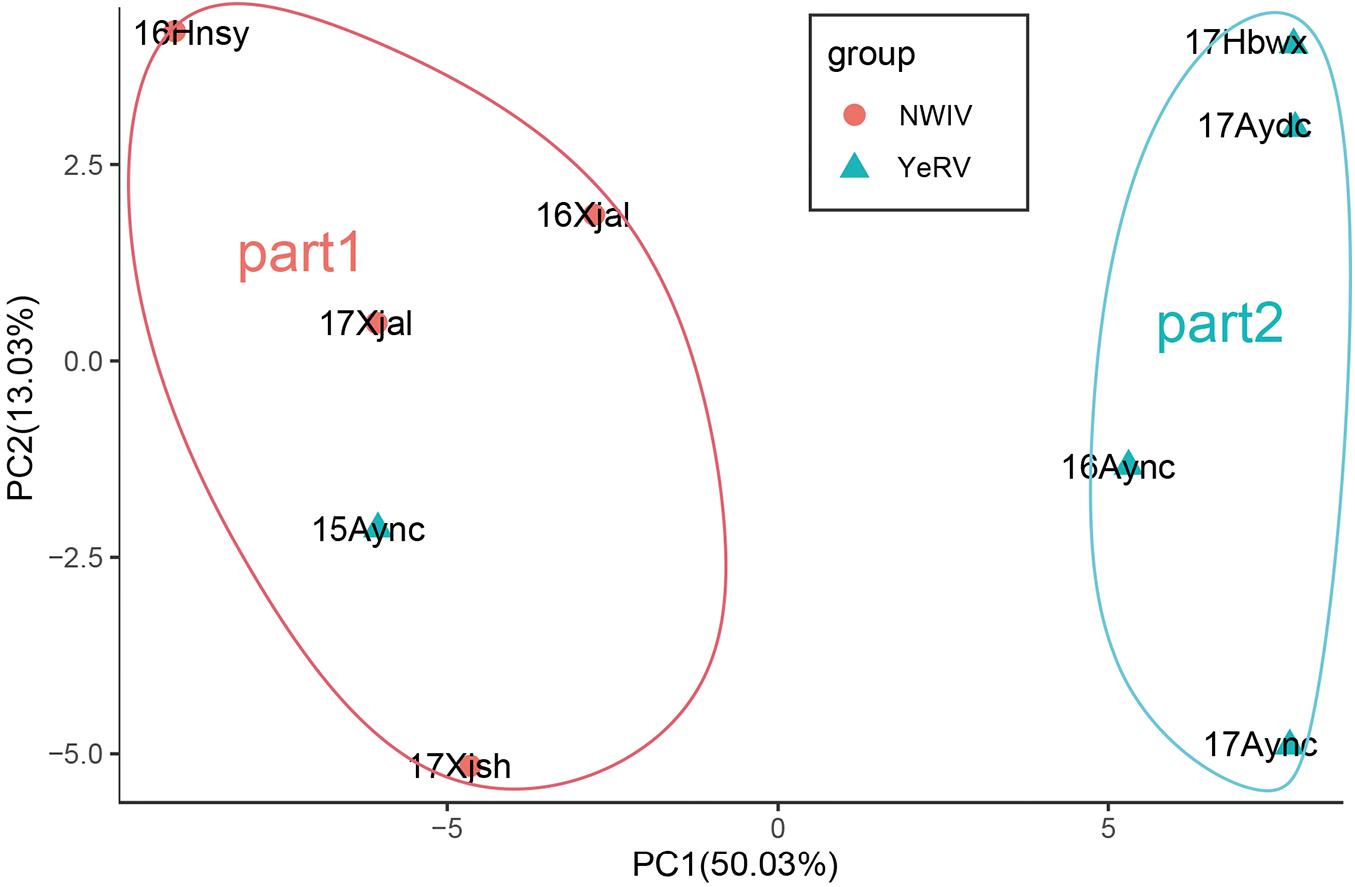
Figure 1. Principal component analysis (PCA) analysis of MIC from 250 BILs in nine environments. 16Aync, 17Aync, 17Aydc, and 17Hbwx environment were classed as region2 by PCA which represented to the Yellow River Valley (YeRV) cotton growing regions. 16Xjal, 17Xjal, and 17Xjsh environment with 15Aync and 16Hnsy were classed as region1 by PCA which nearly represented to the Northwest Inland Valley (NWIV) cotton growing regions.
The nine testing environments and three BLUPs including BLUP across the nine environments, BLUP region 1 and BLUP region 2 were used for a total of 12 QTL analyses (or tests). In total, 21 QTLs (9 on the A subgenome and 12 on the D subgenome) for MIC were detected on 9 chromosomes by CIM (Figure 2 and Supplementary Table 2), and each QTL explained 5.08–16.56% of the phenotypic variation with LOD scores varying from 3.65 to 10.17. Six QTL alleles from Hai7124 (WqMIC-At2-1, WqMIC-Dt8-1, WqMIC-Dt8-2, WqMIC-Dt11-3, WqMIC-Dt12-1, and WqMIC-Dt12-2) had positive additive effects on MIC (i.e., increasing MIC), while other 15 QTL alleles from Hai7124 (WqMIC-At3-1, WqMIC-At3-2, WqMIC-At5-1, WqMIC-At5-2, WqMIC-At11-1, WqMIC-At11-2, WqMIC-At11-3, WqMIC-At11-4, WqMIC-Dt3-1, WqMIC-Dt3-2, WqMIC-Dt10-1, WqMIC-Dt10-2, WqMIC-Dt10-3, WqMIC-Dt11-1, and WqMIC-Dt11-2) had negative additive effects on MIC (i.e., decreasing MIC). Importantly, three QTLs (WqMIC-Dt3-1, WqMIC-Dt3-2, and WqMIC-Dt8-1) were consistently identified in at least three tests and were declared stable QTLs; and other 18 QTLs were detected in one or two tests.
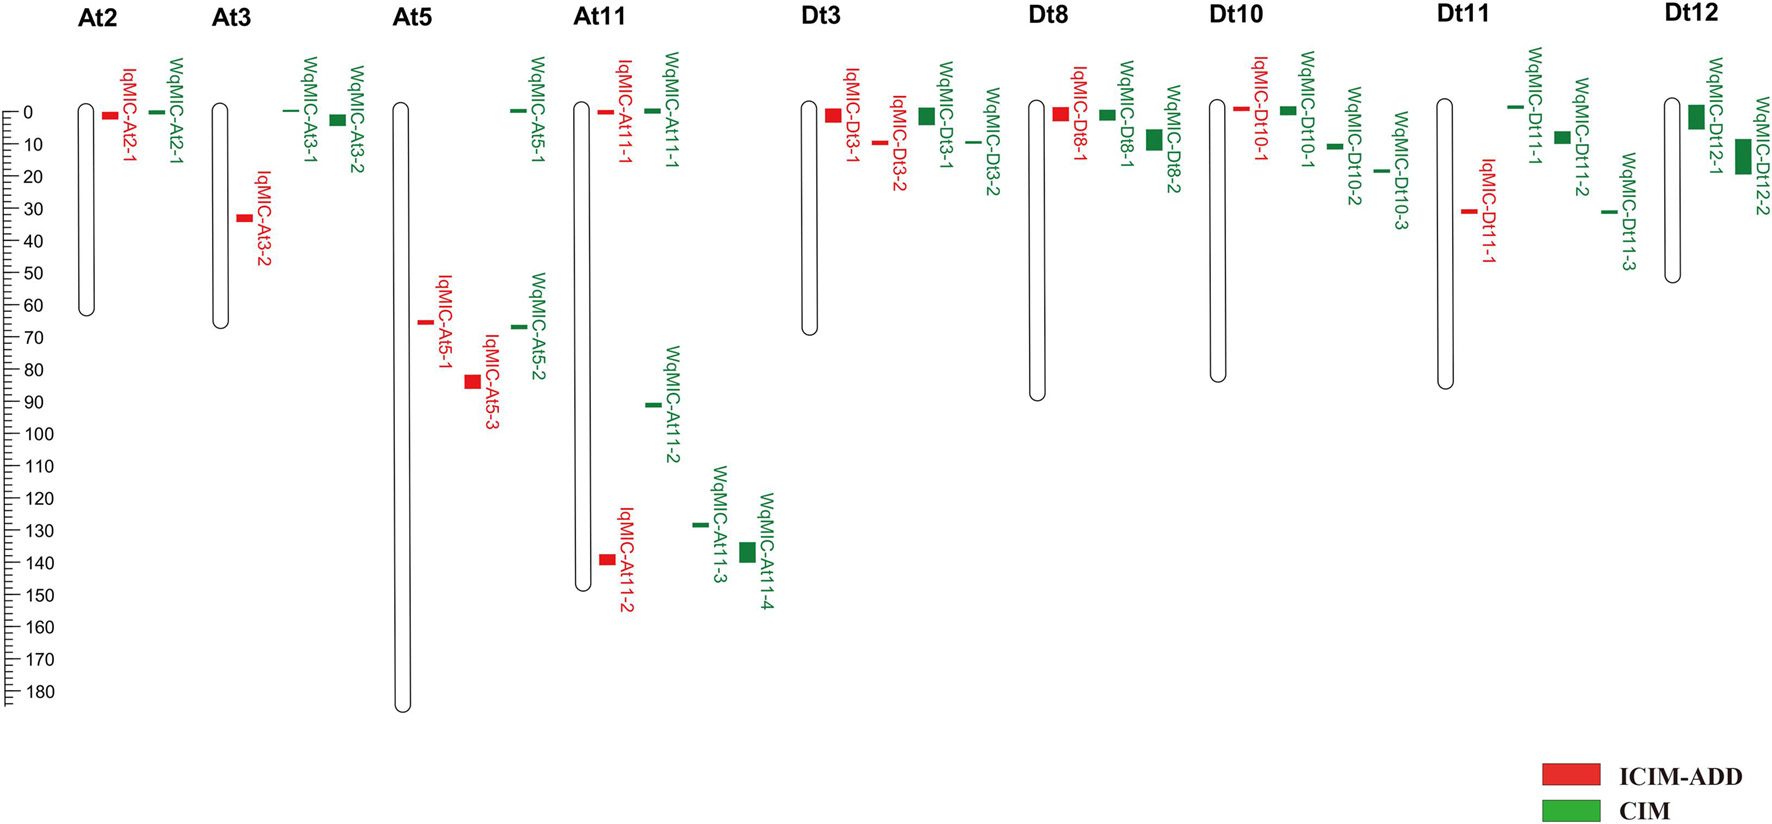
Figure 2. The chromosome-wise distribution of QTL for MIC by ICIM and CIM.
In total, 12 QTLs for MIC were detected on 8 chromosomes across 12 tests by ICIM-ADD (Figure 2 and Supplementary Table 3), each of which explained 3.20–12.56% of the phenotypic variation with LOD scores between 2.62 and 10.32. Among the 12 QTLs, 7 and 5 QTLs were identified on the A subgenome and D subgenome, respectively. Six QTL alleles from Hai7124 (IqMIC-At2-1, IqMIC-At3-2, IqMIC-At5-2, IqMIC-Dt8-1, and IqMIC-Dt11-1) had positive additive effects on MIC, while other six QTL alleles from Hai7124 (IqMIC-At3-1, IqMIC-At5-1, IqMIC-At11-1, IqMIC-At11-2, IqMIC-Dt3-1, IqMIC-Dt3-2, and IqMIC-Dt10-1) had negative additive effects on MIC. Importantly, four QTLs (IqMIC-At5-2, IqMIC-At11-1, IqMIC-Dt3-2, and IqMIC-Dt8-1) were consistently identified in at least three tests and were declared stable QTLs; and other eight QTLs were detected in one or two tests.
Between 21 MIC QTLs detected by CIM and 12 MIC QTL detected by ICIM, eight QTLs (CqMIC-At2-1, CqMIC-At11-1, CqMIC-At11-4, CqMIC-Dt3-1, CqMIC-Dt3-2, CqMIC-Dt8-1, CqMIC-Dt10-1, and CqMIC-Dt11-1) were commonly identified by both QTL mapping methods, because they shared overlapping confidence intervals. The 2 stable QTLs- CqMIC-Dt3-2 and CqMIC-Dt8-1 mapped by both methods were simplified as qMIC-Dt3-2 and qMIC-Dt8-1, respectively, in the following analysis. Both methods detected MIC QTLs on eight common chromosomes (At02, At03, At05, At11, Dt03, Dt08, Dt10, and Dt11), in addition to two QTLs on Dt12 detected by CIM. On these common chromosomes with QTLs detected by both methods, most of them (8/12) detected by ICIM were also detected by CIM, and a few of them (4/12) had different mapping positions than these detected by CIM. However, CIM detected more QTLs on these chromosomes. The results suggest that both methods can detect unique QTLs, but CIM may detect more QTLs than that ICIM. Overall, a total of 25 QTLs were detected by the combined use of the two QTL mapping methods (Table 2 and Figure 2). A total of 12 and 13 MIC QTLs were distributed on the At and Dt subgenomes, respectively. Interestingly, 13 QTLs were detected on two pairs of homeologous chromosomes (4 on At03 vs. 2 on Dt03, and 4 on At11 vs. 3 on Dt11). It appears that they were not distributed on homeologous chromosome regions.
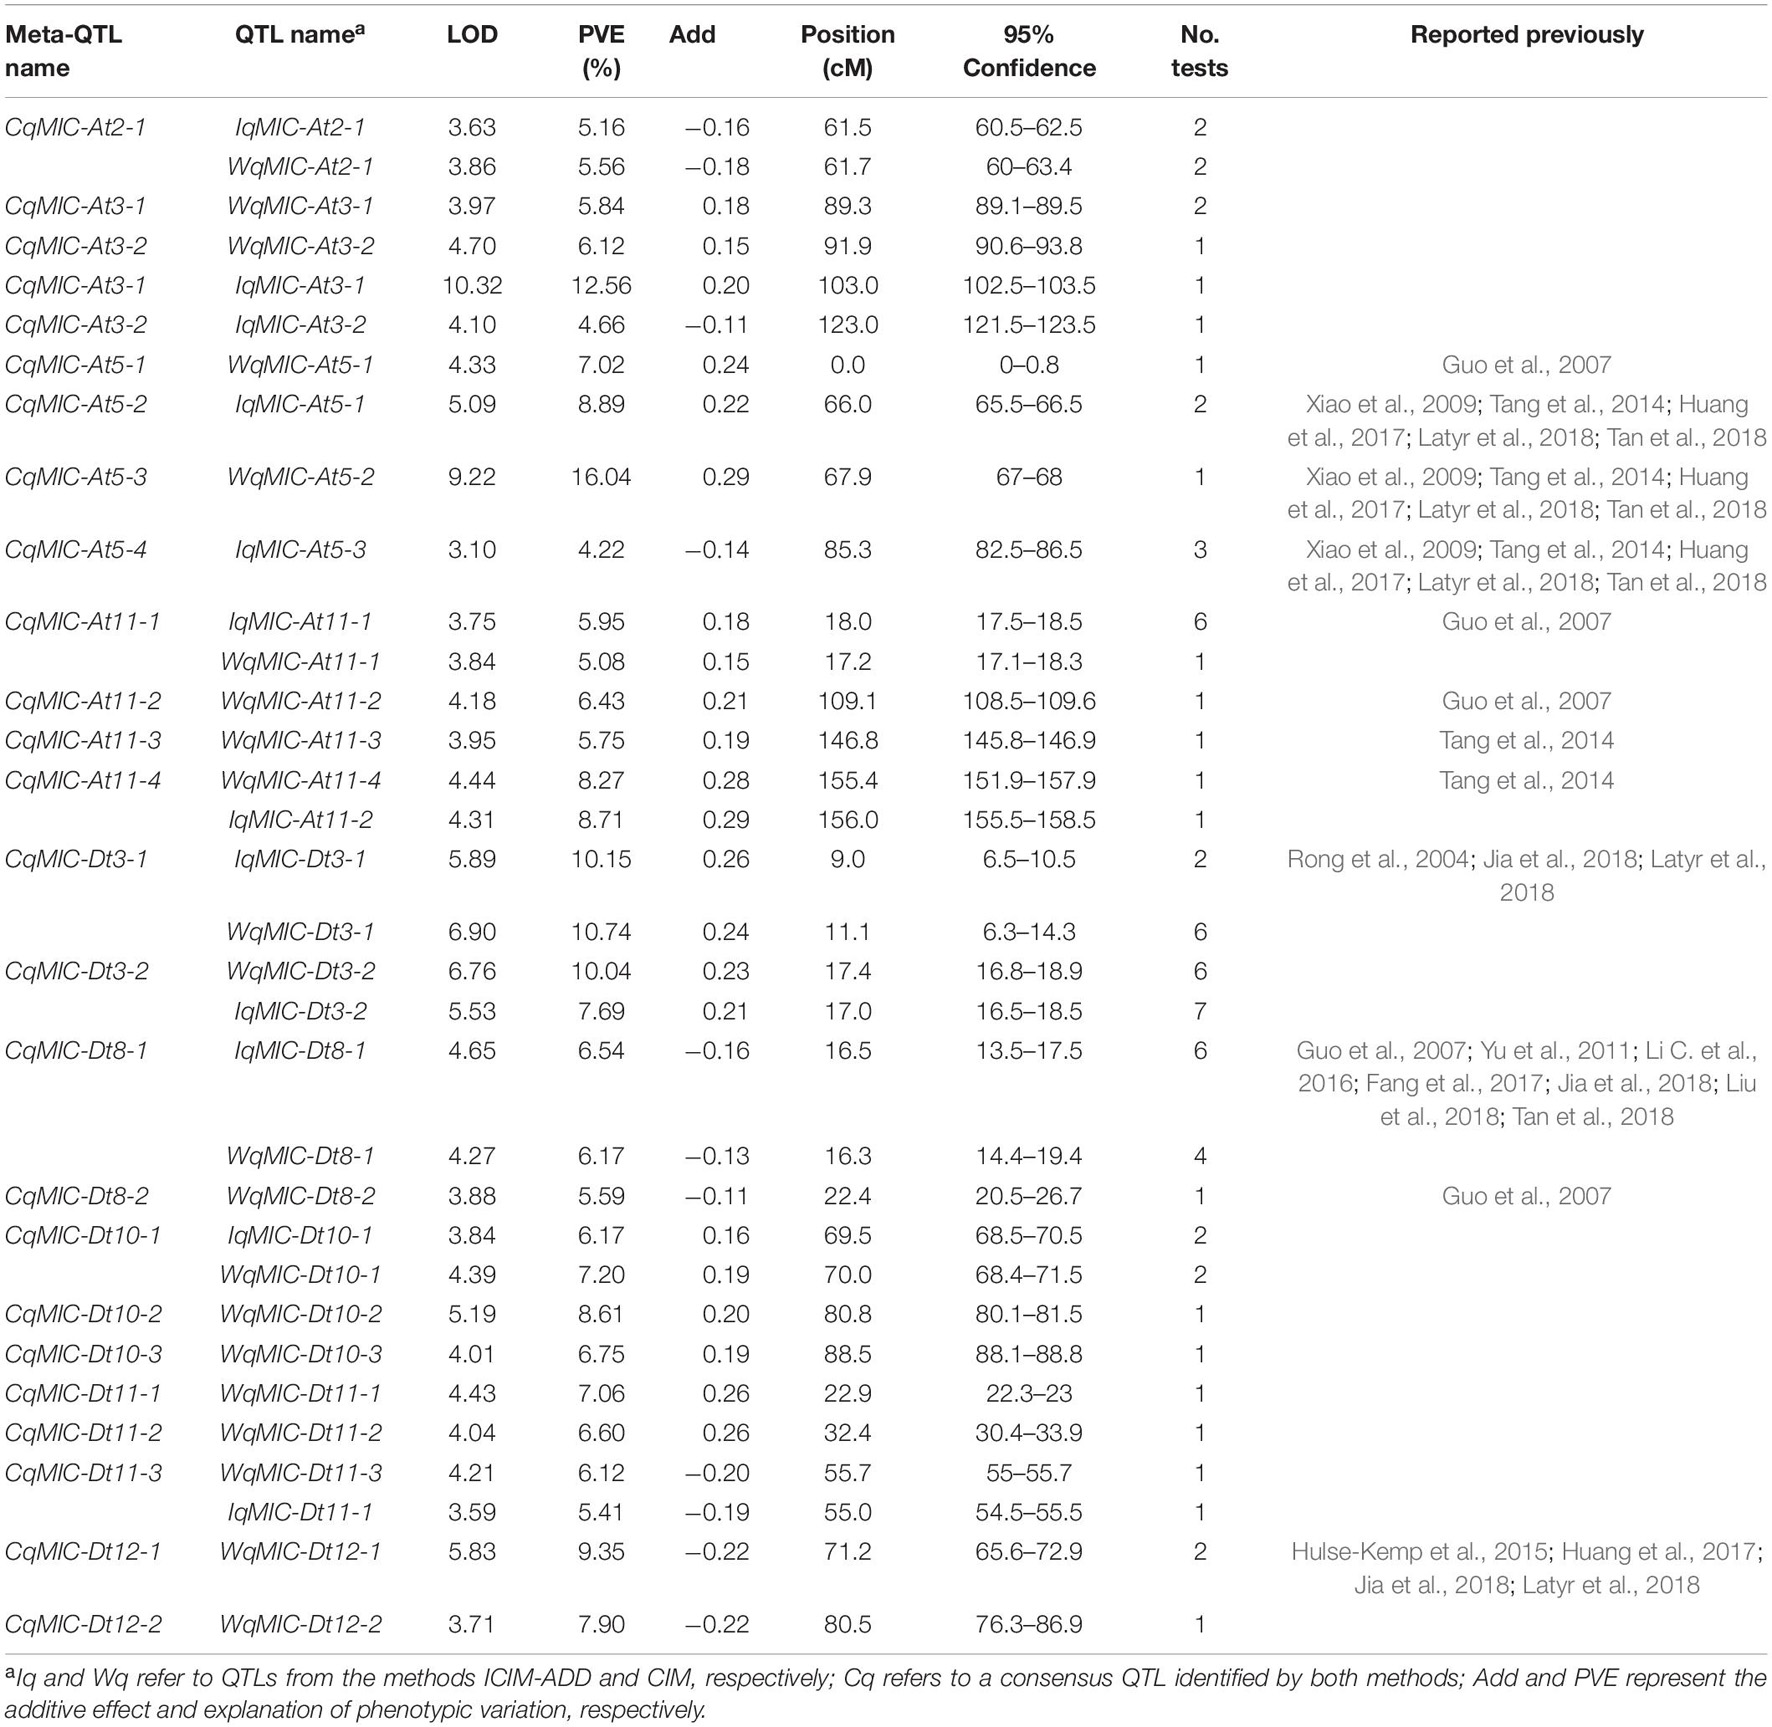
Table 2. Summary of micronaire (MIC) QTLs identified in different environments by ICIM-ADD and CIM.
Ten of the 21 MIC QTLs by CIM shared overlapping confidence intervals with those reported in previous studies, including four QTLs that shared overlapping confidence intervals with those in at least three reported studies (Supplementary Table 2). Seven of 12 QTLs identified via ICIM shared overlapping confidence intervals with those reported previously, four of which shared overlapping confidence intervals with those in at least three studies (Supplementary Table 3). Taking together, of the 25 MIC QTLs detected in this study, 13 were new and 12 were previously reported. The results indicate both the reliability and novelty of the current study.
Because the two commonly detected stable QTL (qMIC-D03-2 on D03 and qMIC-D08-1 on D08) were also reported in previously studies, their chromosomal regions were identified at 34758451–36484185 bp for qMIC-D03-2 and at 57060908–61064240 bp for qMIC-D08-1 based on Zhang et al. (2015). However, to better understand the genes in the two regions, qMIC-D03-2 were mapped at 42175014–43988973 bp and qMIC-D08-1 at 60300565–63949530 bp on the two chromosomes based on the updated TM-1 genome sequence (Hu et al., 2019), which were used for the subsequent analysis.
Within the chromosomal regions of the two MIC QTLs (qMIC-D03-2 on D03 and qMIC-D08-1 of D08), there were 338 predicted genes, and 218 of them had GO annotations (Supplementary Table 4). Based on the GO analysis on the 218 genes, 161 genes were associated with the biological process category, 34 genes were associated with the cellular component category, and 23 genes were associated with the molecular function category. In these three categories, the oxidation-reduction process, integral component of membrane and ATP binding were the most enriched subcategories (Figure 3A). Remarkably, negative regulation of catalytic activity was the most significantly enriched process according to the GO functional enrichment analysis (Figure 3B). For 306 of the 338 putative genes with homologous in Arabidopsis, gene silencing, glutathione metabolism, plant epidermis development and root morphogenesis were found to be the main ontology clusters (Figure 3C). These four significant clusters were selected and converted into three network layouts (Figure 3D). It was found that root morphogenesis and plant epidermis development cluster identities were linked. Tissue development, root system development and root development were the main terms and were more proportional to the 306 genes. Negative regulation of macromolecule metabolism and negative regulation of both gene expression and of metabolic process terms were the main terms associated with the gene silencing clusters.
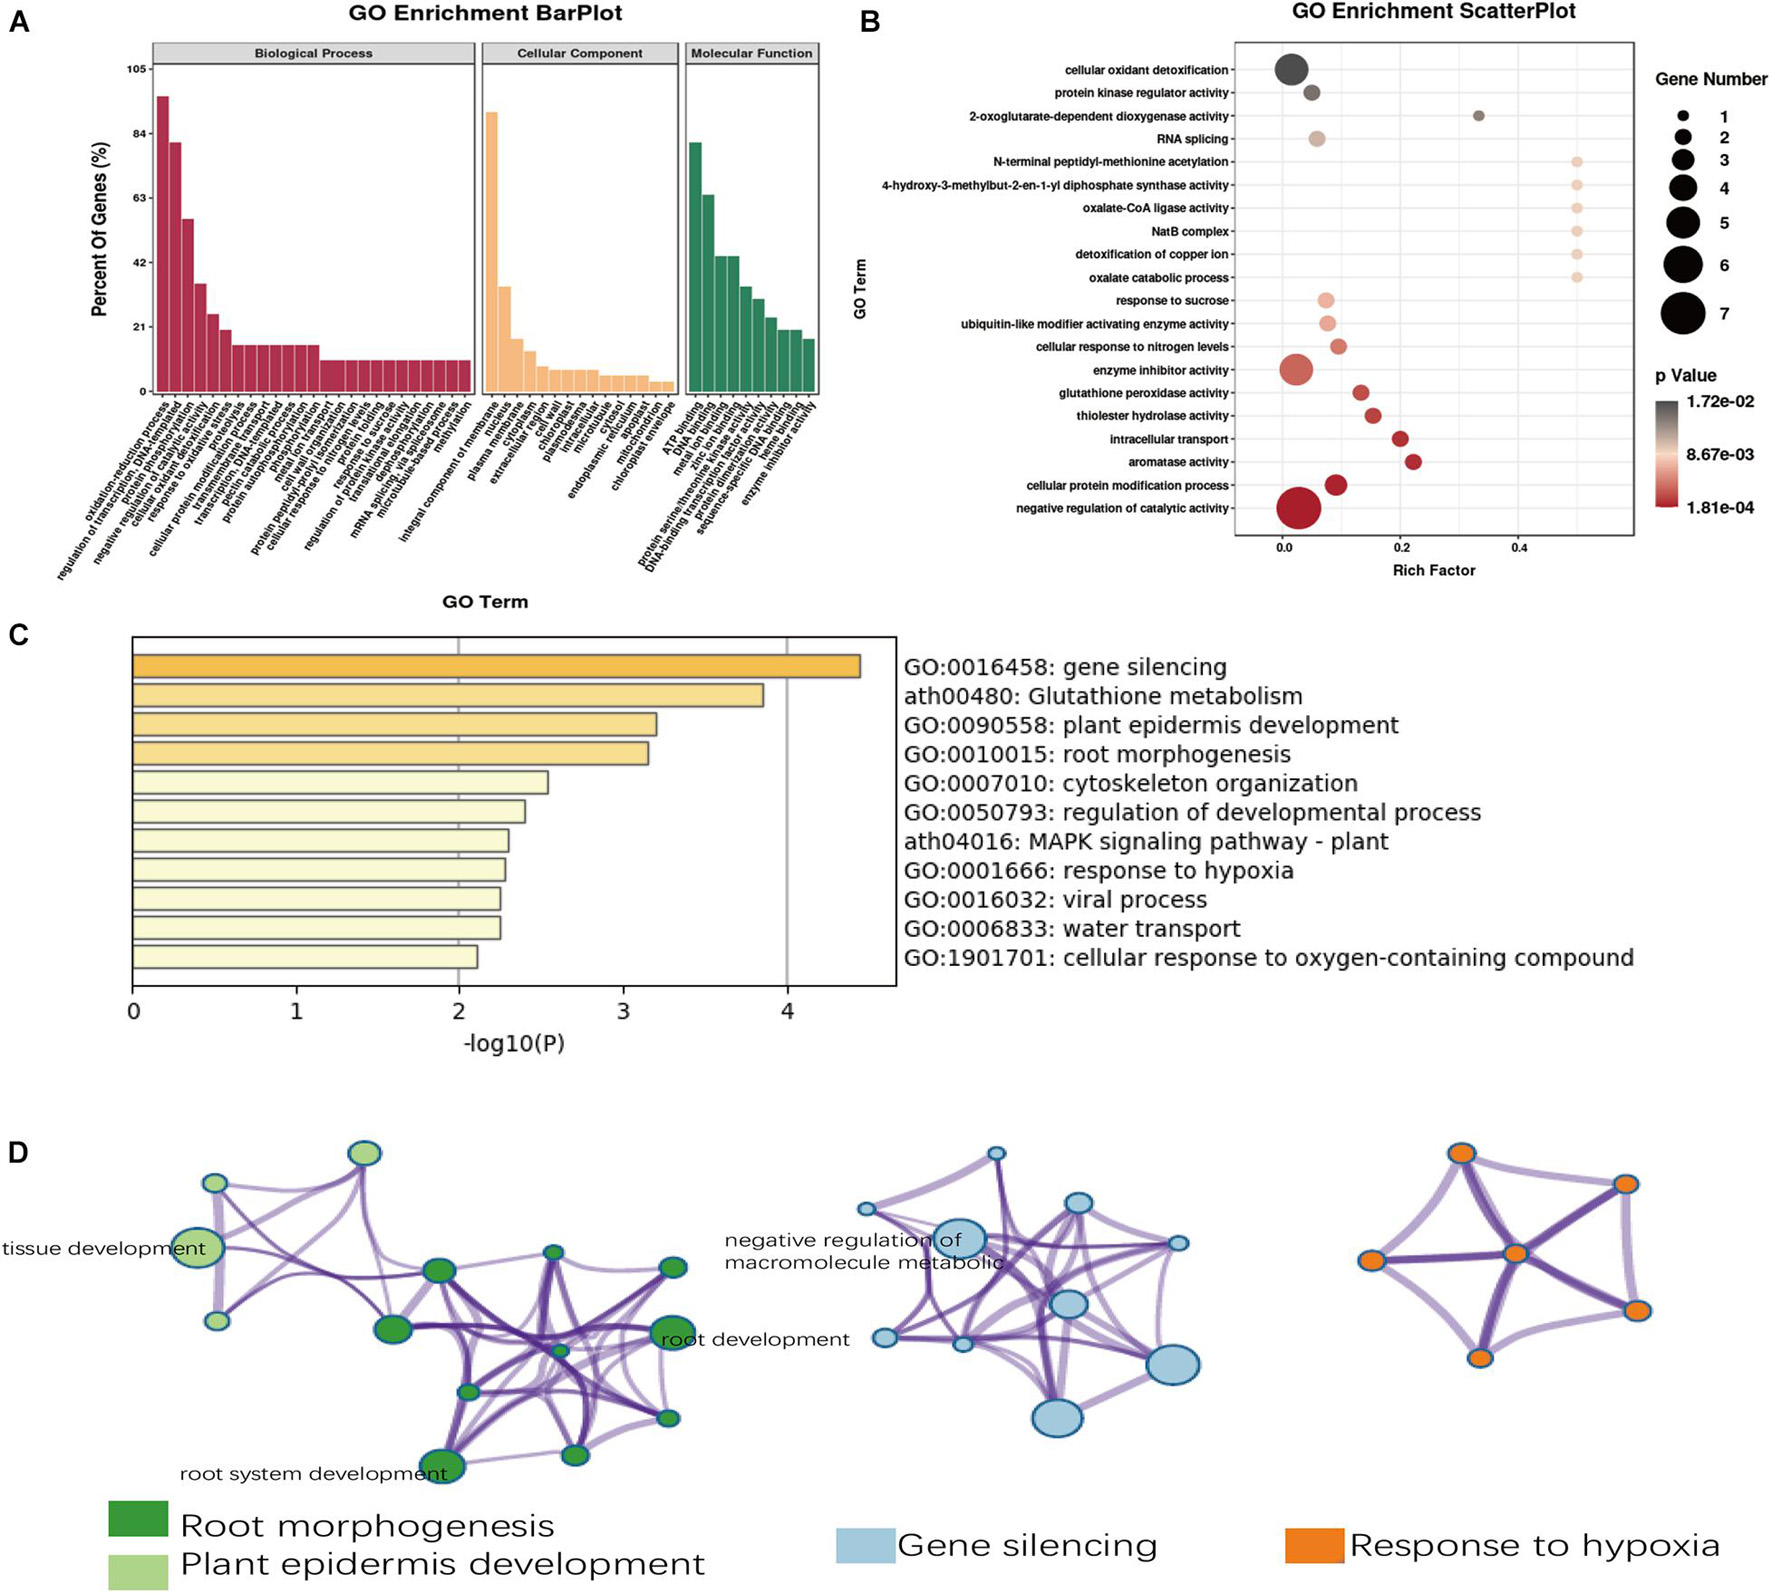
Figure 3. Gene Ontology (GO) analysis of candidate genes of fiber micronaire. (A) The annotation of the candidate genes in the two QTLs through GO analysis. (B) Top 20 GO terms enrichment in the molecular function category. (C) Enriched ontology clusters of fiber micronaire by Metascope. (D) The network layout of four significant clusters by Metascope.
Because both the G. hirsutum TM-1 and G. barbadense Hai7124 genomes were sequenced and CRI35 is a typical upland cotton cultivar, The expression levels of the 338 genes from TM-1 and Hai7124 in the two QTL regions were determined based on existing RNA sequencing (RNA-seq) data (the National Genomics Data Center: https://bigd.big.ac.cn/bioproject/; accession number: PRJNA490626) (Hu et al., 2019). The fold change in candidate gene expression was set to 2 as the threshold for significant differential expression between TM-1 and Hai7124 in corresponding tissues including embryos (0, 1, 3, and 5 DPA) and fibers (10, 20, and 25 DPA). As a result, eight candidate genes (three genes for qMIC-D03-2 and five genes for qMIC-D08-1) were found to be differentially expressed between TM-1 and Hai7124 (Figure 4). The following is a detailed in silico analysis of those eight genes.
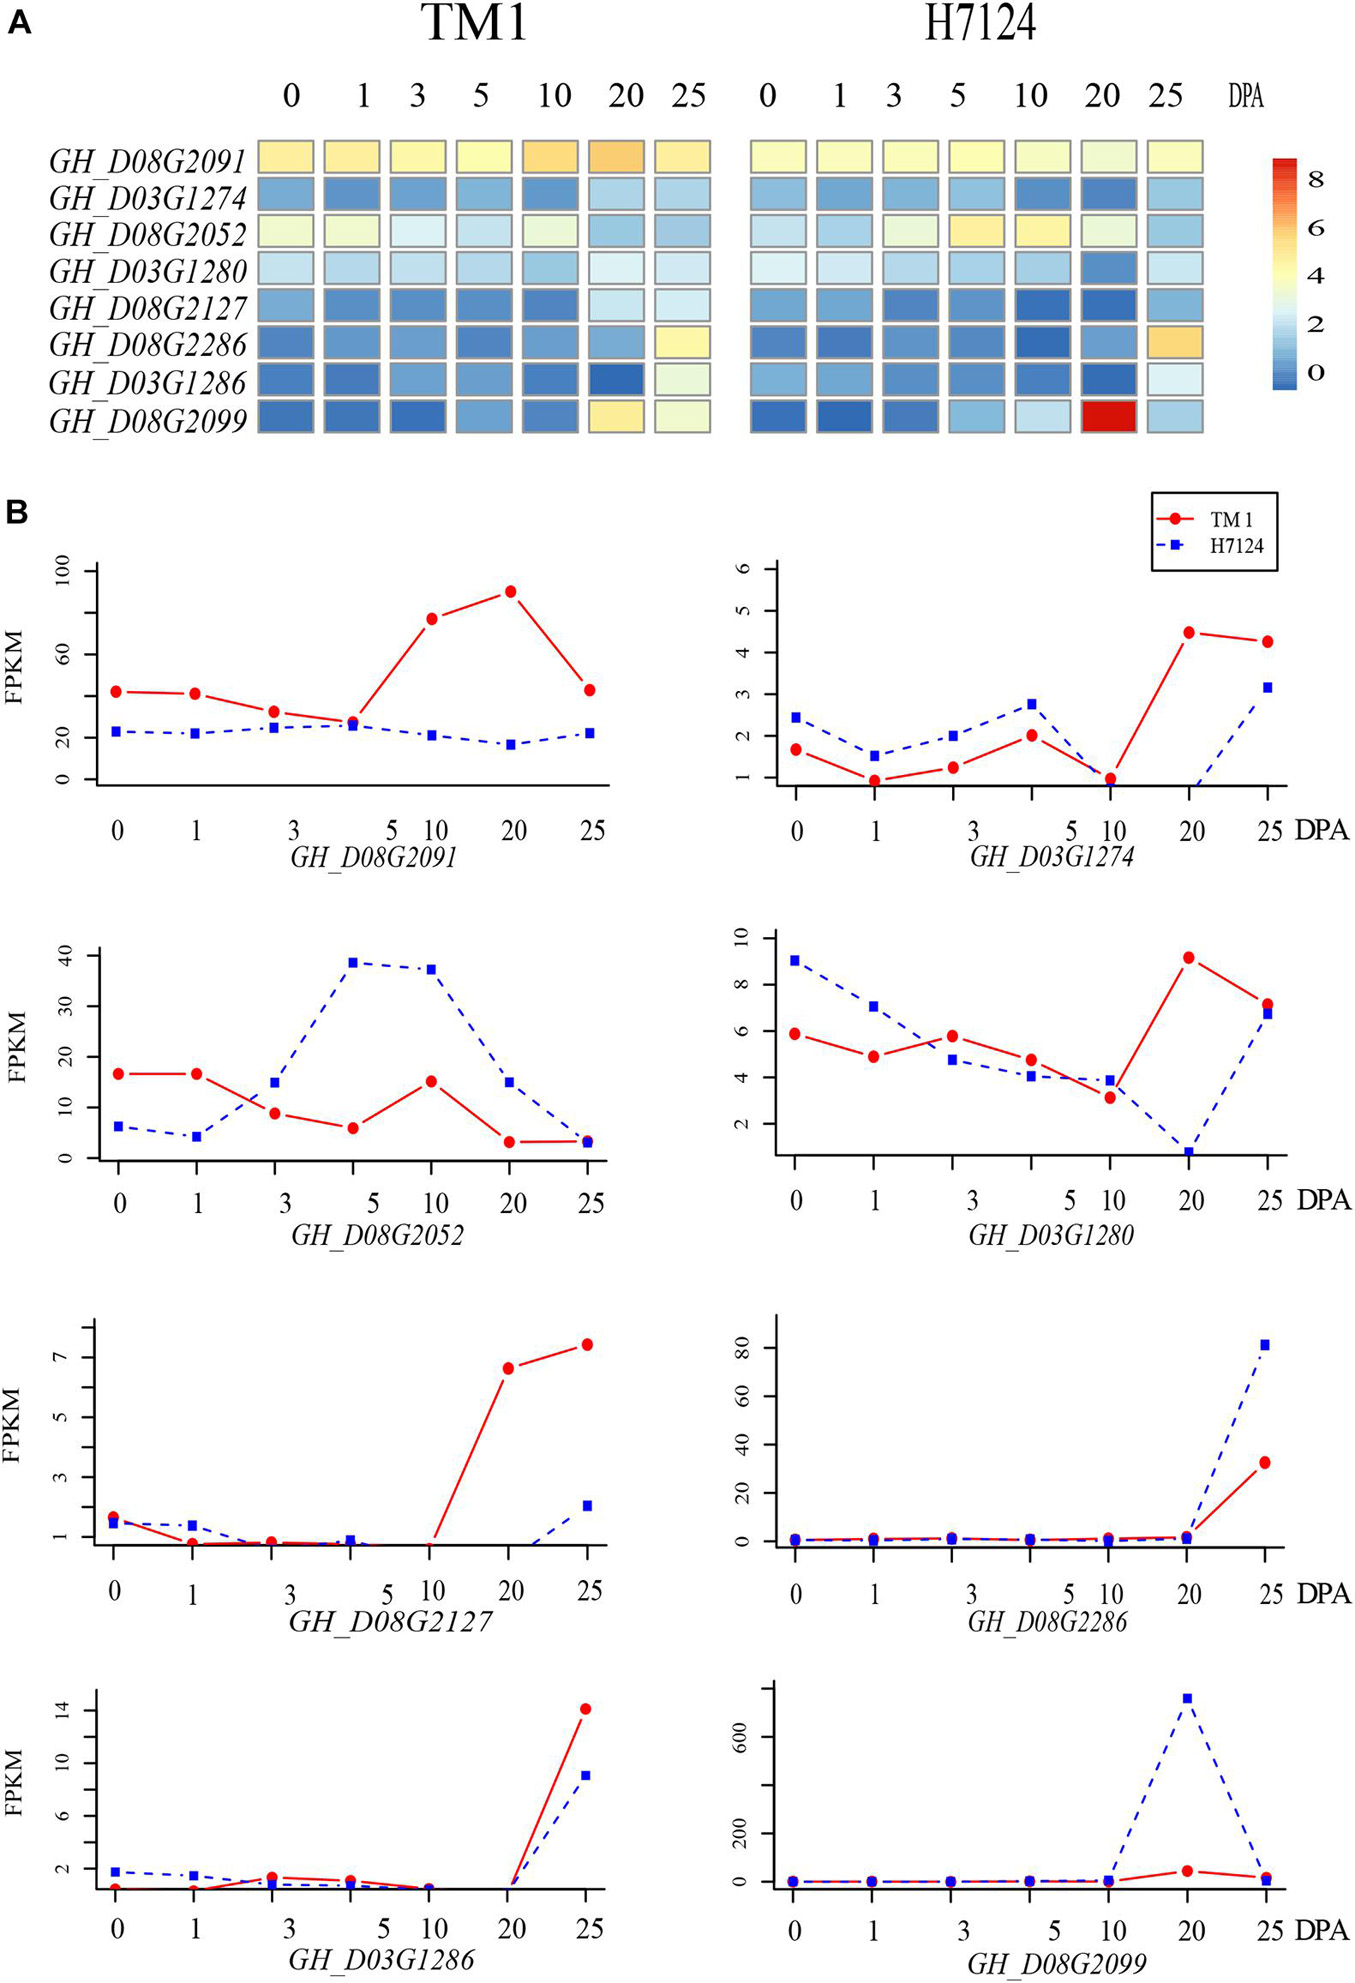
Figure 4. Heat map and trend plot of the expression of candidate genes detected within two stable QTLs related to MIC. (A) Heatmap of the RNA-seq data (log2(1 + RPKM)) of eight candidate genes during fiber development. (B) Line charts of genes listed in the left heatmap from top to bottom.
For the three candidate genes on chromosome D03, GH_D03G1280 and GH_D03G1274 encode a kinase superfamily protein and the NADPH/respiratory burst oxidase protein D, and the expression levels of both genes in TM-1 were higher than that in Hai7124 at 20 DPA. GH_D03G1280 had SNP variants including frameshift variants and synonymous variants between TM-1 and Hai7124. Calcium-dependent NADPH oxidase generates superoxide molecules, a reactive oxygen species (ROS). The third gene, GH_D03G1286 encodes a transducin/WD40 repeat-like superfamily protein and its expression in both TM-1 and Hai7124 during the early stages of fiber development was low until 20 or 25 DPA. This gene had SNP variants between TM-1 and Hai7124 including loss/gain of a stop codon and splice region variants and GAA frameshift variants which might be involved in the change in fiber secondary cell wall synthesis.
GH_D08G2052 encodes a TCP family transcription factor, and its expression was significantly higher in Hai7124 than in TM-1 during fiber elongation from 5 to 20 DPA. Three SNP variants (frameshift variant, loss of a stop codon, and splice region types) were found between TM-1 and Hai7124, which might be involved in the change in fiber elongation. GH_D08G2091 encodes a glutathione S-transferase THETA 1 enzyme and is a homolog of AT5G41210 in Arabidopsis, and its expression was significantly higher in TM-1 than in Hai7124 during fiber development from 10 to 25 DPA, when fast elongation and secondary cell wall synthesis occurred. GH_D08G2127 encodes a receptor-like kinase in flowers and is a homolog of AT2G48010 in Arabidopsis, and the expression level in TM-1 was higher than that in Hai7124 at 20 and 25 DPA. Similar to GH_D03G1274, the protein encoded by the gene is involved in protein phosphorylation.
GH_D08G2099 and GH_D08G2286 encode beta-6 tubulin protein and xyloglucan endo-transglycosylase-related 8, respectively. The expression of these two genes was very low in the early stage of fiber development in both TM-1 and Hai7124 until 20 or 25 DPA. The expression levels of GH_D08G2099 (17 times higher) and GH_D08G2286 in Hai7124 fibers were higher than those in TM-1 fibers at 20 and 25 DPA, respectively. The upstream region of GH_D08G2286 lacked a 3126 bp fragment at −5393 bp in Hai7124 but not in TM-1. A detailed description of sequence variation for all the eight genes is listed in Supplementary Table 5.
Based on predictions of miRNA target genes by psRNATarget, GH_D08G2286 was the target gene of ghr-miR156a, ghr-miR156b, and ghr-miR156d, and the average expression level of these three miRNAs was 289.11 FPKM. GH_D03G1286 was the target gene of ghr-miR164, and the expression level of ghr-miR164 was 2114 FPKM.
Stable MIC QTLs are important loci shaping MIC, and the closed linked markers are valuable for MAS. For the two stable MIC QTLs, qMIC-D03-2 and qMIC-D08-1, Markers 150834 and 175863 were the nearest SNPs, respectively (Supplementary Figure 2A). For marker 150834 for qMIC-D03-2, the BILs with the SNP allele genotype (AA) from CRI36 averaged a significantly greater MIC value than did those with the SNP allele genotype (TT) from Hai7124 (4.30 vs. 3.89, P < 0.05). However, for marker 175863 for qMIC-D08-1, the BILs with the SNP allele genotype (AA) from CRI36 averaged a significantly lower MIC value than did those with the SNP allele genotype (GG) from Hai7124 (3.95 vs. 4.25, P < 0.05). The QTL allele for qMIC-D03-2 had a greater additive effect (−0.21) than that from qMIC-D08-1 (−0.15), consistent with the early QTL analysis (Table 2). MIC for the desirable QTL genotype for D03 without the desirable genotype for D08 (i.e., Q3Q3q8q8) was 4.06, vs. 4.16 for the desirable QTL genotype for D08 without the desirable genotype for D03 (i.e., q3q3Q8Q8). When the desirable alleles from the two QTLs were combined into the same genotype (Q3Q3Q8Q8, i.e., TT for qMIC-D03-2 with AA for qMIC-D08-1), MIC was further reduced to 3.73 (significantly lower than that from q3q3Q8Q8 but not from Q3Q3q8q8), as compared to 4.44 for the genotype without any desirable allele (i.e., q3q3q8q8). The effects from the two QTLs were additive and there appeared no interaction between them (Supplementary Figure 2D). Furthermore, the two homozygous genotypes for each of the two SNP markers (150834 and 175863) had similar fiber length and strength (Supplementary Figures 2B,C), indicating that these two QTLs did not affect fiber length and strength. Therefore, these two SNPs could be used to design portable markers for MAS to improve MIC without affecting fiber length and strength.
Micronaire is measured as the air permeability of a compressed lint sample of known mass and is essentially the fiber weight per unit length (μg inch–1) for a single fiber. Therefore, lint yield improvement through breeding has been accompanied by the increase of MIC (Zhang et al., 2019). Therefore, it is not surprising that the MIC of new cultivars has been increased, because of the positive correlation between lint yield and MIC. Sun et al. (2019) showed that a global collection of 719 upland cotton germplasm accessions only had very low percentage of lines with the premium MIC (i.e., 3.70–4.20). As lint with MIC higher than 5.0 will suffer price discounts, breeding for low fiber MIC is becoming increasingly important.
In the nine testing environments, Hai7124 and CRI36 had MIC ranges of 3.12–4.22 and 3.27–4.50, respectively. Both parents had low MIC and were considered degree A MIC in China according to the national standards. The results indicated that both upland cotton CRI36 and Egyptian cotton Hai7124 possessed genomic regions that could decrease MIC. However, the upland parent still had significantly higher MIC. Therefore, it was still valid to carry out the current QTL analysis in the BIL population developed from the two parents. The results further showed that the two parents of different species possessed different genetic loci involved in MIC formation in that both parents had QTL alleles decreasing MIC (8 QTLs in CRI36 vs. 17 QTLs in Hai7124), consistent with many previous QTL studies in cotton (Lacape et al., 2010; Zhang et al., 2014, 2020; Zhu et al., 2020). As such, transgressive segregation in MIC was observed in that the BILs developed from the two parents had MIC ranging from 2.10 to 6.17, with an average BLUP of 4.18. Moreover, a very large proportion of the BIL population (35.6% of the BILs) had a degree A MIC. These lines with QTL introgression for low MIC and the desirable QTL alleles and their linked markers should be useful in MAS for breeding cotton with a premium fiber quality.
In this study, results showed that different ecological environments had a great influence on MIC. The MIC of the BILs grown in the Northwestern Inland Valley averaged 0.5 lower than these grown in the Yellow River Valley. Hence, the BLUPs of the PCA cluster, which represented the two different ecological environments, could be used to identify QTLs associated with specific ecological environments. These QTLs may be useful in MAS of low MIC for a particular ecological environment. Interestingly, QTL CqMIC-At11-1 was identified in blup region one test and in six individual tests. This indicated that it was necessary to analyze QTLs with BLUPs associated with different ecological environments and that the results were reliable. Therefore, when there is a genotype × environment interaction for a trait of interest in a multi-location experiment, testing environments can be grouped for a BLUP analysis for each group instead of using overall means in QTL mapping, in addition to a separate analysis for each environment. In this study, grouping based on PCA did not completely reflect geographical regions of tests because one test in Anyang, Henan, 2015, of Yellow River Valley and another test in Sanya, Hainan, 2016 were grouped with the Northwestern Inland Valley (i.e., Xinjiang). In addition to soil type, soil fertility and moisture (Hearn, 1994), and crop management practices, it is known that MIC is greatly influenced by weather conditions including daily temperature (especially night temperature) and relative humidity (Gipson and Joham, 1968; Wanjura and Barker, 1985; Liakatas et al., 1998; Reddy et al., 1999; Bange et al., 2010). We speculate that the dry periods with low temperatures during the boll development stage in the two tests were likely the major cause for decreased MIC, as frequently observed in Xinjiang.
In this study, 13 and 4 specific QTLs were identified by CIM and ICIM, respectively. However, eight common QTLs were identified via both QTL mapping software programs. Both methods can identify common chromosomes with QTLs, and most of the QTLs (67.7%) of the MIC QTLs detected by ICIM were also detected by CIM, while the remaining unique QTLs detected by ICIM differed in mapping positions from these detected by CIM on the same chromosomes. CIM can detect more QTLs on the same chromosomes and may be more QTLs on additional chromosomes. Therefore, CIM is more powerful in detecting QTL, as proposed by Zeng (1993, 1994) when the CIM method was developed. The results demonstrate that both mapping methods are useful and are complementary to one another to detect additional QTL loci. Common QTLs detected by the two methods provide some levels of confidence in mapping results. Therefore, we suggest that the two QTL mapping methods be simultaneously used. Of course, common QTLs especially these with major effects should be focused in further studies.
Another important aspect is if some of the MIC QTLs detected in this study were also overlapped with QTLs for lint yield and fiber length and strength, leading to MIC’s correlation with lint yield, fiber length and strength. Overlapped QTL regions for these traits are likely due to linked genes or pleiotropic effects of genes for the traits, which would explain the correlations of MIC with the three traits. A subsequent QTL analysis will be performed to address these questions.
In this study, two methods were used to perform GO analysis of putative genes with the two common QTL regions (qMIC-D03-2 and qMIC-D08-1). The results showed that the oxidation-reduction process, integral component of membranes and ATP binding were the most populated subcategories. Root morphogenesis, plant epidermis development, gene silencing and response to hypoxia were the main clusters according to Metascape. The results of the two methods coincided and showed that the following hypothesis governing MIC by the two QTLs: During fiber elongation, fiber cells are hypoxic, giving rise to a response to hypoxia that negatively regulates enzymatic catalytic activities to induce fiber morphogenesis. This was followed by secondary cell wall synthesis and changes in membrane components, eventually leading to a change in MIC. This hypothesis was supported by the finding that immature fiber mutants had reduced ROS levels and reduced energy production in developing fibers compared with mature fibers (Kim et al., 2013).
In this study, eight candidate genes were identified for the two QTL regions. Xyloglucan might negatively affect fiber elongation according to comparisons of xyloglucan contents between G. barbadense and G. hirsutum (Li et al., 2013). GH_D08G2286 encodes xyloglucan endo-transglycosylase-related 8 (GhXTR8) and has a function similar to that xyloglucan endo-transglycosylase/hydrolase (XTH) proteins, which, when overexpressed in cotton plants, result in 15–20% longer fiber compared with that of wild-type cotton (Lee et al., 2010). GH_D03G1298 encodes a glucuronoxylan 4-O-methyltransferase-like protein (DUF579) that is involved in xyloglucan metabolism and that is located within the qMIC-D03-2 region. The expression of the genes encoding both of these proteins in Hai7124 was higher than that in TM-1 at 25 DPA. DUF579 was also determined to be involved in xylan biosynthesis according to phylogenetic analysis (Chen et al., 2020). IRX15 and IRX15-L are homologous genes of DUF579 in Arabidopsis; and characterization of a double knockout line revealed irregular secondary cell wall margins of fiber cells and a lower degree of xylan polymerization compared with that of the wild-type line (Jensen et al., 2011).
GH_D03G1280 (a protein kinase superfamily gene) was also reported to participate in fiber elongation (Li C. et al., 2016). The protein coded by GH_D03G1286 belongs to a WD40 protein superfamily and mainly regulates the formation of trichomes via the R3 MYB-bHLH-WD40 transcriptional complex in Arabidopsis (Gan et al., 2011), but a divergent WD40 protein (GhWDR) interacts with GhMML4_D12 in a process similar to but different from that of the MBW transcriptional complex involved in trichome development (Tian et al., 2020). The protein coded by GH_D08G2052 is a TCP family transcription factor, and GhTCP4 plays an important role in balancing cotton fiber elongation and cell wall synthesis together with miR319 (Cao et al., 2020). GH_D08G2099 encodes a beta-6 tubulin protein that is involved in fiber development. Nineteen beta-tubulin cDNAs were detected in developing cotton ovules and were found to be highly expressed in elongating fiber cells (He et al., 2008). Beta-tubulin was also identified by QTL analysis and was found to control fiber quality (Guo et al., 2021). GH_D03G1274 encodes NADPH/respiratory burst oxidase protein D (RBOHC), and AtRBOHC influences the development of root hairs via the activation of Ca2+ and K+ osmotic pathways in plant root cells (Bai et al., 2014). RBOHC may mediate the progression of ABA-regulated primary root growth by producing ROS in the roots (Ma X. et al., 2019). GH_D08G2091, which encodes a glutathione transferase, also regulates the production of ROS. The products of both GH_D03G1274 and GH_D08G2091 participate in ROS metabolic pathways, and ROS can act as developmental signaling molecules in the process of secondary cell wall differentiation in cotton fibers (Li et al., 2007; Guo et al., 2016). GH_D03G1262 encodes an ARF-GAP domain 1 protein (AGD1), which regulates root hair polarity by coordinating cytoskeleton and membrane trafficking (Yoo and Blancaflor, 2013). To determine which of these 8 genes contribute to MIC within the two QTL regions, further studies are needed.
It is recognized that only one specific candidate gene in each of the two MIC QTL regions will be the one determining a proportion of the genetic differences in MIC between the two parents. Functions of other genes within the two QTL regions are most unlikely associated with MIC and should not be overstated. Although other molecular aspects including quantitative RT-PCR between parents and BILs with contrasting MIC and virus-induced gene silencing can be performed for those 8 genes, further high resolution mapping using a larger interspecific genetic population is required. In addition, the desirable effect (reducing MIC) for qMIC-D03-2 was from the allele contributed from the Egyptian Hai7124 cotton. Therefore, the two QTLs may be specific to interspecific hybrid populations between the two species. A panel of upland cotton germplasm lines would not be useful in validating the QTL effect. Near-isogenic lines will be developed for the two QTL regions for a more in-depth analysis in the future.
In summary, an interspecific BIL population of 250 lines from G. hirsutum × G. barbadense was employed to detect MIC QTLs in nine replicated field tests. Based on a high-density genetic map with 7709 genotyping-by-sequencing (GBS)-based SNP markers, 25 MIC QTLs were identified, including 12 previously described QTLs and 13 new QTLs. Importantly, eight candidate genes within two stable MIC QTL regions were identified with differential expression between upland TM-1 and Egyptian Hai7124. This study provides valuable information for improving MIC in cotton breeding.
The datasets presented in this study can be found in online repositories. The names of the repository/repositories and accession number(s) can be found in the article/Supplementary Material.
WP analyzed and summed all the data and wrote the manuscript. JS performed the gene expression and wrote introduction of the manuscript. WW, MW, QC, QQ, CH, HL, XG, HH, and YZ managed and collected the phenotype data. JM, BJ, and LW involved in the analysis of SNP markers. YQ and JY directed the experiments. JZ revised the manuscript. All authors read and approved the final manuscript.
The present study was funded by the Natural Science Foundation of Xinjiang Uygur Autonomous Region of China (Grant Nos. 2020D01A135 and 2021D01B113), the National Natural Science Foundation of China (Grant No. 31621005), and Agricultural Science and Technology Innovation Program of Chinese Academy of Agricultural Sciences.
XG, HH, and YZ are employed by Join Hope Seed Co., Ltd., Changji, China.
The remaining authors declare that the research was conducted in the absence of any commercial or financial relationships that could be construed as a potential conflict of interest.
All claims expressed in this article are solely those of the authors and do not necessarily represent those of their affiliated organizations, or those of the publisher, the editors and the reviewers. Any product that may be evaluated in this article, or claim that may be made by its manufacturer, is not guaranteed or endorsed by the publisher.
The Supplementary Material for this article can be found online at: https://www.frontiersin.org/articles/10.3389/fpls.2021.763016/full#supplementary-material
Supplementary Figure 1 | Frequency distribution of fiber micronaire of 250 BILs in different environments. 15Aync, 16Aync, and 17Aync represent the environment of Anyang south farm in 2015, 2016, and 2017, respectively; 16Xjal and 17Xjal represent the environment of Alaer, Xinjiang in 2016 and 2017, respectively; 17Aydc,17Hbwx, and 17Xjsh represent the environment of east farm, Anyang, Henan, Weixian, Hebei, and Shihezi, Xinjiang in 2017; 16Hnsy represent the environment of Sanya, Hainan in 2016.
Supplementary Figure 2 | The QTL allele effect for the qMIC-D03-2 and qMIC-D08-1 related to MIC, FL, and FS. (A) Box plots for the qMIC-D03-2 and qMIC-D08-1 related to MIC. (B) Box plots for the qMIC-D03-2 and qMIC-D08-1 related to FL. (C) Box plots for the qMIC-D03-2 and qMIC-D08-1 related to FS. (D) The QTL allele effect for qMIC-D03-2 and qMIC-D08-1 related to MIC.
Ali, I., Teng, Z., Bai, Y., Yang, Q., Hao, Y., Hou, J., et al. (2018). A high density SLAF-SNP genetic map and QTL detection for fibre quality traits in Gossypium hirsutum. BMC Genomics 19:879. doi: 10.1186/s12864-018-5294-5
Bai, L., Ma, X., Zhang, G., Song, S., Zhou, Y., Gao, L., et al. (2014). A receptor-like kinase mediates ammonium homeostasis and is important for the polar growth of root hairs in Arabidopsis. Plant Cell 26, 1497–1511. doi: 10.1105/tpc.114.124586
Bange, M. P., Constable, G. A., Johnston, D. B., and Kelly, D. (2010). A method to estimate the effects of temperature on cotton micronaire. J. Cotton Sci. 14, 162–172.
Bates, D., Mächler, M., Bolker, B., and Walker, S. (2014). Fitting linear mixed-effects models using lme4. ArXiv [Preprint]. doi: 10.18637/jss.v067.i01
Bradow, J. M., and Davidonis, G. H. (2000). Quantitation of fiber quality and the cotton production-processing interface: a physiologist’s perspective. J. Cotton Sci. 4, 34–64.
Cao, J. F., Zhao, B., Huang, C. C., Chen, Z. W., Zhao, T., Liu, H. R., et al. (2020). The miR319-targeted GhTCP4 promotes the transition from cell elongation to wall thickening in cotton fiber. Mol. Plant 13, 1067–1070. doi: 10.1016/j.molp.2020.05.006
Chen, F., Guo, Y., Chen, L., Gan, X., Liu, M., Li, J., et al. (2020). Global identification of genes associated with xylan biosynthesis in cotton fiber. J. Cotton Res. 3:25. doi: 10.1186/s42397-020-00063-3
Cingolani, P. (2012). A program for annotating and predicting the effects of single nucleotide polymorphisms, snpeff: SNPs in the genome of drosophila melanogaster strain w1118; iso-2; iso-3. Fly 6, 80–92.
Dai, X., Zhuang, Z., and Zhao, P. X. (2018). psRNATarget: a plant small RNA target analysis server (2017 release). Nucleic Acids Res. 46, W49–W54. doi: 10.1093/nar/gky316
Fan, L. P., Wang, L. P., Wang, X. Y., Zhang, H. Y., Zhu, Y. F., Guo, J. Y., et al. (2018). A high-density genetic map of extra-long staple cotton (Gossypium barbadense) constructed using genotyping-by-sequencing based single nucleotide polymorphic markers and identification of fiber traits-related QTL in a recombinant inbred line population. BMC Genomics 19:489. doi: 10.1186/s12864-018-4890-8
Fang, L., Wang, Q., Hu, Y., Jia, Y., Chen, J., Liu, B., et al. (2017). Genomic analyses in cotton identify signatures of selection and loci associated with fiber quality and yield traits. Nat. Genet. 49, 1089–1098. doi: 10.1038/ng.3887
Gan, L., Xia, K., Chen, J., and Wang, S. C. (2011). Functional characterization of TRICHOMELESS2, a new single-repeat R3 MYB transcription factor in the regulation of trichome patterning in Arabidopsis. BMC Plant Biol. 11:176. doi: 10.1186/1471-2229-11-176
Gipson, J. R., and Joham, H. E. (1968). Influence of night temperature on growth and development of cotton (Gossypium hirisutum L.). II. Fiber properties. Agron. J. 60, 296–298.
Guo, A. H., Su, Y., Huang, Y., Wang, Y. M., Nie, H. S., Zhao, N., et al. (2021). QTL controlling fiber quality traits under salt stress in upland cotton (Gossypium hirsutum L.). Theor. Appl. Genet. 134, 661–685. doi: 10.1007/s00122-020-03721-x
Guo, K., Du, X., Tu, L., Tang, W., Wang, P., Wang, M., et al. (2016). Fibre elongation requires normal redox homeostasis modulated by cytosolic ascorbate peroxidase in cotton (Gossypium hirsutum). J. Exp. Bot. 67, 3289–3301. doi: 10.1093/jxb/erw146
Guo, W., Cai, C., Wang, C., Han, Z., Song, X., Wang, K., et al. (2007). A microsatellite-based, gene-rich linkage map reveals genome structure, function and evolution in Gossypium. Genetics 176, 527–541. doi: 10.1534/genetics.107.070375
He, X.-C., Qin, Y.-M., Xu, Y., Hu, C.-Y., and Zhu, Y.-X. (2008). Molecular cloning, expression profiling, and yeast complementation of 19 β-tubulin cDNAs from developing cotton ovules. J. Exp. Bot. 59, 2687–2695. doi: 10.1093/jxb/ern127
Hearn, A. B. (1994). “The principles of water relations and their application in management,” in Proceedings of the World Cotton Research Conference Brisbane, Qld, Aust. 14-17 Feb. 1994, eds G. A. Constable and N. W. Forrester (Canberra: CSIRO).
Hu, Y., Chen, J., Fang, L., Zhang, Z., Ma, W., Niu, Y., et al. (2019). Gossypium barbadense and Gossypium hirsutum genomes provide insights into the origin and evolution of allotetraploid cotton. Nat. Genet. 51, 739–748. doi: 10.1038/s41588-019-0371-5
Huang, C., Nie, X., Shen, C., You, C., Li, W., Zhao, W., et al. (2017). Population structure and genetic basis of the agronomic traits of upland cotton in China revealed by a genome-wide association study using high-density SNPs. Plant Biotechnol. J. 15, 1374–1386. doi: 10.1111/pbi.12722
Hulse-Kemp, A. M., Lemm, J., Plieske, J., Ashrafi, H., Buyyarapu, R., Fang, D. D., et al. (2015). Development of a 63K snp array for cotton and high-density mapping of intraspecific and interspecific populations of Gossypium spp. G3 5, 1187–1209. doi: 10.1534/g3.115.018416
Jensen, J. K., Kim, H., Cocuron, J. C., Orler, R., Ralph, J., and Wilkerson, C. G. (2011). The DUF579 domain containing proteins IRX15 and IRX15-L affect xylan synthesis in Arabidopsis. Plant J. 66, 387–400. doi: 10.1111/j.1365-313X.2010.04475.x
Jia, X., Wang, H., Pang, C., Ma, Q., Su, J., Wei, H., et al. (2018). QTL delineation for five fiber quality traits based on an intra-specific Gossypium hirsutum L. recombinant inbred line population. Mol. Genet. Genomics 293, 831–843. doi: 10.1007/s00438-018-1424-7
Kim, H. J., Tang, Y., Moon, H. S., Delhom, C. D., and Fang, D. D. (2013). Functional analyses of cotton (Gossypium hirsutum L.) immature fiber (im) mutant infer that fiber cell wall development is associated with stress responses. BMC Genomics 14:889. doi: 10.1186/1471-2164-14-889
Lacape, J. M., Llewellyn, D., Jacobs, J., Arioli, T., Becker, D., Calhoun, S., et al. (2010). Meta-analysis of cotton fiber quality QTLs across diverse environments in a Gossypium hirsutum x G. barbadense RIL population. BMC Plant Biol. 10:132. doi: 10.1186/1471-2229-10-132
Lacape, J. M., Nguyen, T. B., Thibivilliers, S., Bojinov, B., Courtois, B., Cantrell, R. G., et al. (2003). A combined RFLP-SSR-AFLP map of tetraploid cotton based on a Gossypium hirsutum× Gossypium barbadense backcross population. Genome 46, 612–626. doi: 10.1139/g03-050
Latyr, D., Richard, M., Wenfang, G., Shoupu, H., Zhaoe, P., Yin, J., et al. (2018). QTL mapping of fiber quality and yield-related traits in an intra-specific upland cotton using genotype by sequencing (GBS). Int. J. Mol. Sci. 19:441. doi: 10.3390/ijms19020441
Lee, J., Burns, T. H., Light, G., Sun, Y., Fokar, M., Kasukabe, Y., et al. (2010). Xyloglucan endotransglycosylase/hydrolase genes in cotton and their role in fiber elongation. Planta 232, 1191–1205. doi: 10.1007/s00425-010-1246-2
Li, A., Xia, T., Xu, W., Chen, T., Li, X., Fan, J., et al. (2013). An integrative analysis of four CESA isoforms specific for fiber cellulose production between Gossypium hirsutum and Gossypium barbadense. Planta 237, 1585–1597. doi: 10.1007/s00425-013-1868-2
Li, C., Dong, Y., Zhao, T., Li, L., Li, C., Yu, E., et al. (2016). Genome-wide snp linkage mapping and QTL analysis for fiber quality and yield traits in the upland cotton recombinant inbred lines population. Front. Plant Sci. 7:1356. doi: 10.3389/fpls.2016.01356
Li, H. B., Qin, Y. M., Pang, Y., Song, W. Q., Mei, W. Q., and Zhu, Y. X. (2007). A cotton ascorbate peroxidase is involved in hydrogen peroxide homeostasis during fibre cell development. New Phytol. 175, 462–471. doi: 10.1111/j.1469-8137.2007.02120.x
Li, X. M., Jin, X., Wang, H. T., Zhang, X. L., and Lin, Z. X. (2016). Structure, evolution, and comparative genomics of tetraploid cotton based on a high-density genetic linkage map. DNA Res. 23, 283–293. doi: 10.1093/dnares/dsw016
Liakatas, A., Roussopoulos, D., and Whittington, W. J. (1998). Controlled-temperature effects on cotton yield and fibre properties. J. Agric. Sci. 130, 463–471.
Liu, G., Pei, W., Li, D., Ma, J., Cui, Y., Wang, N., et al. (2019). A targeted QTL analysis for fiber length using a genetic population between two introgressed backcrossed inbred lines in upland cotton (Gossypium hirsutum). Crop J. 7, 273–282. doi: 10.1016/j.cj.2018.11.005
Liu, R., Gong, J., Xiao, X., Zhang, Z., Li, J., Liu, A., et al. (2018). GWAS analysis and QTL identification of fiber quality traits and yield components in upland cotton using enriched high-density SNP markers. Front. Plant Sci. 9:1067. doi: 10.3389/fpls.2018.01067
Liu, X. Y., Teng, Z. H., Wang, J. X., Wu, T. T., Zhang, Z. Q., Deng, X. P., et al. (2017). Enriching an intraspecific genetic map and identifying QTL for fiber quality and yield component traits across multiple environments in Upland cotton (Gossypium hirsutum L.). Mol. Genet. Genomics 292, 1281–1306. doi: 10.1007/s00438-017-1347-8
Ma, J., Pei, W., Ma, Q., Geng, Y., Liu, G., Liu, J., et al. (2019). QTL analysis and candidate gene identification for plant height in cotton based on an interspecific backcross inbred line population of Gossypium hirsutum × Gossypium barbadense. Theor. Appl. Genet. 132, 2663–2676. doi: 10.1007/s00122-019-03380-7
Ma, L. L., Zhao, Y. P., Wang, Y. M., Shang, L. G., and Hua, J. P. (2017). QTLs analysis and validation for fiber quality traits using maternal backcross population in upland cotton. Front. Plant Sci. 8:2168. doi: 10.3389/fpls.2017.02168
Ma, X., Zhang, X., Yang, L., Tang, M., Wang, K., Wang, L., et al. (2019). Hydrogen peroxide plays an important role in PERK4-mediated abscisic acid-regulated root growth in Arabidopsis. Funct. Plant Biol. 46, 165–174. doi: 10.1071/fp18219
Ma, Z. Y., He, S. P., Wang, X. F., Sun, J. L., Zhang, Y., Zhang, G. Y., et al. (2018). Resequencing a core collection of upland cotton identifies genomic variation and loci influencing fiber quality and yield. Nat. Genet. 50, 803–813. doi: 10.1038/s41588-018-0119-7
Majeed, S., Rana, I. A., Atif, R. M., Ali, Z., Hinze, L., and Azhar, M. T. (2019). Role of SNPs in determining QTLs for major traits in cotton. J. Cotton Res. 2:5. doi: 10.1186/s42397-019-0022-5
Meng, L., Li, H. H., Zhang, L. Y., and Wang, J. K. (2015). QTL IciMapping: integrated software for genetic linkage map construction and quantitative trait locus mapping in biparental populations. Crop J. 3, 269–283. doi: 10.1016/j.cj.2015.01.001
Pang, C. Y., Wang, H., Pang, Y., Xu, C., Jiao, Y., Qin, Y. M., et al. (2010). Comparative proteomics indicates that biosynthesis of pectic precursors is important for cotton fiber and arabidopsis root hair elongation. Mol. Cell. Proteomics 9, 2019–2033. doi: 10.1074/mcp.M110.000349
Reddy, K. R., Davidonis, G. H., Johnson, A. S., and Vinyard, B. T. (1999). Temperature regime and carbon dioxide enrichment alter cotton boll development and fiber properties. Agron. J. 91, 851–858.
Rong, J., Abbey, C., Bowers, J. E., Brubaker, C. L., Chang, C., Chee, P. W., et al. (2004). A 3347-locus genetic recombination map of sequence-tagged sites reveals features of genome organization, transmission and evolution of cotton (Gossypium). Genetics 166, 389–417. doi: 10.1534/genetics.166.1.389
Said, J., Knapka, J., Song, M., and Zhang, J. (2015). Cotton QTLdb: a cotton QTL database for QTL analysis, visualization, and comparison between Gossypium hirsutum and G. hirsutum × G. barbadense populations. Mol. Genet. Genomics 290, 1615–1625. doi: 10.1007/s00438-015-1021-y
Said, J. I., Song, M. Z., Wang, H. T., Lin, Z. X., Zhang, X. L., Fang, D. D., et al. (2015). A comparative meta-analysis of QTL between intraspecific Gossypium hirsutum and interspecific G. hirsutum × G. barbadense populations. Mol. Genet. Genomics 290, 1003–1025. doi: 10.1007/s00438-014-0963-9
Shang, L., Liang, Q., Wang, Y., Wang, X., Wang, K., Abduweli, A., et al. (2015). Identification of stable QTLs controlling fiber traits properties in multi-environment using recombinant inbred lines in Upland cotton (Gossypium hirsutum L.). Euphytica 205, 877–888. doi: 10.1007/s10681-015-1434-z
Sun, X., Liu, D., Zhang, X., Li, W., Liu, H., Hong, W., et al. (2013). SLAF-seq: an efficient method of large-scale de novo SNP discovery and genotyping using high-throughput sequencing. PLoS One 8:e58700. doi: 10.1371/journal.pone.0058700
Sun, Z., Wang, X., Liu, Z., Gu, Q., Zhang, Y., Li, Z., et al. (2019). Evaluation of the genetic diversity of fibre quality traits in upland cotton (Gossypium hirsutum L.) inferred from phenotypic variations. J. Cotton Res. 2:22. doi: 10.1186/s42397-019-0041-2
Tan, Z., Zhang, Z., Sun, X., Li, Q., Sun, Y., Yang, P., et al. (2018). Genetic map construction and fiber quality QTL mapping using the CottonSNP80K array in upland cotton. Front. Plant Sci. 9:225. doi: 10.3389/fpls.2018.00225
Tang, S., Teng, Z., Zhai, T., Fang, X., Liu, F., Liu, D., et al. (2014). Construction of genetic map and QTL analysis of fiber quality traits for Upland cotton (Gossypium hirsutum L.). Euphytica 201, 195–213. doi: 10.1007/s10681-014-1189-y
Tian, Y., Du, J., Wu, H., Guan, X., Chen, W., Hu, Y., et al. (2020). The transcription factor MML4_D12 regulates fiber development through interplay with the WD40-repeat protein WDR in cotton. J. Exp. Bot. 71, 3499–3511. doi: 10.1093/jxb/eraa104
Wang, B. H., Zhuang, Z. M., Zhang, Z. S., Draye, X., Shuang, L. S., Shehzad, T., et al. (2017). Advanced backcross QTL analysis of fiber strength and fineness in a cross between Gossypium hirsutum and G. mustelinum. Front. Plant Sci. 8:1848. doi: 10.3389/fpls.2017.01848
Wang, F. R., Zhang, J. X., Chen, Y., Zhang, C. Y., Gong, J. W., Song, Z. Q., et al. (2020). Identification of candidate genes for key fibre-related QTLs and derivation of favourable alleles in Gossypium hirsutum recombinant inbred lines with G. barbadense introgressions. Plant Biotechnol. J. 18, 707–720. doi: 10.1111/pbi.13237
Wang, M. J., Tu, L. L., Lin, M., Lin, Z. X., Wang, P. C., Yang, Q. Y., et al. (2017). Asymmetric subgenome selection and cis-regulatory divergence during cotton domestication. Nat. Genet. 49, 579–587. doi: 10.1038/ng.3807
Wang, S., Basten, C., Gaffney, P., and Zeng, Z. (2007). Windows QTL Cartographer 2.0. Raleigh, NC: North Carolina State University.
Wanjura, D. F., and Barker, G. L. (1985). Cotton lint yield accumulation rate and quality development. Field Crops Res. 10, 205–218.
Wu, M., Li, L. Y., Pei, W. F., Zhang, J. F., and Yu, J. W. (2020). Identification of differentially expressed genes in developing cotton fibers between two groups of backcross inbred lines differing in fiber micronaire. Cotton Sci. 32, 52–62.
Xiao, J., Wu, K., Fang, D. D., Stelly, D. M., Cantrell, R. G., and Yu, J. (2009). New SSR markers for use in cotton (Gossypium spp.) improvement. J. Cotton Sci. 13, 75–157.
Xu, S., Pan, Z., Yin, F., Yang, Q., Lin, Z., Wen, T., et al. (2020). Identification of candidate genes controlling fiber quality traits in upland cotton through integration of meta-QTL, significant SNP and transcriptomic data. J. Cotton Res. 3:34. doi: 10.1186/s42397-020-00075-z
Yoo, C. M., and Blancaflor, E. B. (2013). Overlapping and divergent signaling pathways for ARK1 and AGD1 in the control of root hair polarity in Arabidopsis thaliana. Front Plant Sci. 4:528. doi: 10.3389/fpls.2013.00528
Yu, J., Jung, S., Cheng, C.-H., Ficklin, S. P., Lee, T., Zheng, P., et al. (2014). CottonGen: a genomics, genetics and breeding database for cotton research. Nucl. Acids Res. 42, D1229–D1236. doi: 10.1093/nar/gkt1064
Yu, J., Yu, S., Fan, S., Song, M., Zhai, H., Li, X., et al. (2012a). Mapping quantitative trait loci for cottonseed oil, protein and gossypol content in a Gossypium hirsutum × Gossypium barbadense backcross inbred line population. Euphytica 187, 191–201. doi: 10.1007/s10681-012-0630-3
Yu, J., Zhang, K., Li, S., Yu, S., Zhai, H., Wu, M., et al. (2012b). Mapping quantitative trait loci for lint yield and fiber quality across environments in a Gossypium hirsutum × Gossypium barbadense backcross inbred line population. Theor. Appl. Genet. 126, 275–287. doi: 10.1007/s00122-012-1980-x
Yu, Y., Yuan, D., Liang, S., Li, X., Wang, X., Lin, Z., et al. (2011). Genome structure of cotton revealed by a genome-wide SSR genetic map constructed from a BC1 population between Gossypium hirsutum and G. barbadense. BMC Genomics 12:15. doi: 10.1186/1471-2164-12-15
Zeng, Z.-B. (1993). Theoretical basis of separation of multiple linked gene effects on mapping quantitative trait loci. Proc. Natl. Acad. Sci. U. S. A. 90, 10972–10976.
Zhang, J. F., Abdelraheem, A., and Flynn, R. (2019). Genetic gains of Acala 1517 cotton since 1926. Crop Sci. 59, 1052–1061. doi: 10.2135/cropsci2018.11.0686
Zhang, J. F., Percy, R. G., and McCarty, J. C. Jr. (2014). Introgression genetics and breeding between Upland and Pima cotton- a review. Euphytica 198, 1–12. doi: 10.1007/s10681-014-1094-4
Zhang, T., Hu, Y., Jiang, W., Fang, L., Guan, X., Chen, J., et al. (2015). Sequencing of allotetraploid cotton (Gossypium hirsutum L. acc. TM-1) provides a resource for fiber improvement. Nat. Biotechnol. 33, 531–537. doi: 10.1038/nbt.3207
Zhang, Z., Li, J., Jamshed, M., Shi, Y., Liu, A., Gong, J., et al. (2020). Genome-wide quantitative trait loci reveal the genetic basis of cotton fibre quality and yield-related traits in a Gossypium hirsutum recombinant inbred line population. Plant Biotechnol. J. 18, 239–253. doi: 10.1111/pbi.13191
Zhang, Z., Shang, H. H., Shi, Y. Z., Huang, L., Li, J. W., Ge, Q., et al. (2016). Construction of a high-density genetic map by specific locus amplified fragment sequencing (SLAF-seq) and its application to Quantitative Trait Loci (QTL) analysis for boll weight in upland cotton (Gossypium hirsutum.). BMC Plant Biol. 16:79. doi: 10.1186/s12870-016-0741-4
Zhou, Y., Zhou, B., Pache, L., Chang, M., Khodabakhshi, A. H., Tanaseichuk, O., et al. (2019). Metascape provides a biologist-oriented resource for the analysis of systems-level datasets. Nat. Commun. 10:1523. doi: 10.1038/s41467-019-09234-6
Keywords: Gossypium hirsutum, Gossypium barbadense, backcross inbred lines, micronaire, quantitative trait locus
Citation: Pei W, Song J, Wang W, Ma J, Jia B, Wu L, Wu M, Chen Q, Qin Q, Zhu H, Hu C, Lei H, Gao X, Hu H, Zhang Y, Zhang J, Yu J and Qu Y (2021) Quantitative Trait Locus Analysis and Identification of Candidate Genes for Micronaire in an Interspecific Backcross Inbred Line Population of Gossypium hirsutum × Gossypium barbadense. Front. Plant Sci. 12:763016. doi: 10.3389/fpls.2021.763016
Received: 23 August 2021; Accepted: 22 September 2021;
Published: 27 October 2021.
Edited by:
Linghe Zeng, USDA-ARS Crop Genetics Research Unit, United StatesReviewed by:
Zhongxu Lin, Huazhong Agricultural University, ChinaCopyright © 2021 Pei, Song, Wang, Ma, Jia, Wu, Wu, Chen, Qin, Zhu, Hu, Lei, Gao, Hu, Zhang, Zhang, Yu and Qu. This is an open-access article distributed under the terms of the Creative Commons Attribution License (CC BY). The use, distribution or reproduction in other forums is permitted, provided the original author(s) and the copyright owner(s) are credited and that the original publication in this journal is cited, in accordance with accepted academic practice. No use, distribution or reproduction is permitted which does not comply with these terms.
*Correspondence: Jiwen Yu, eXVqdzY2NkBob3RtYWlsLmNvbQ==; Jinfa Zhang, amluemhhbmdAbm1zdS5lZHU=; Yanying Qu, eGp5eXE1MzIyQDEyNi5jb20=
†These authors have contributed equally to this work
Disclaimer: All claims expressed in this article are solely those of the authors and do not necessarily represent those of their affiliated organizations, or those of the publisher, the editors and the reviewers. Any product that may be evaluated in this article or claim that may be made by its manufacturer is not guaranteed or endorsed by the publisher.
Research integrity at Frontiers
Learn more about the work of our research integrity team to safeguard the quality of each article we publish.