- 1Oil Crops Research Institute, Chinese Academy of Agricultural Sciences, Key Laboratory of Biology and Genetic Improvement of Oil Crops, Ministry of Agriculture and Rural Affairs, Wuhan, China
- 2Hainan Key Laboratory of Tropical Oil Crops Biology/Coconut Research Institute, Chinese Academy of Tropical Agricultural Sciences, Wenchang, China
- 3Hainan Key Laboratory for Biosafety Monitoring and Molecular Breeding in Off-Season Reproduction Regions/SanYa Research Institute, Chinese Academy of Tropical Agricultural Sciences, Sanya, China
Abscisic acid plays an important role in fruit development. However, the effect of ABA on fatty acid biosynthesis in oil palm is still unknown. In this study, ABA treatments (CK, A1–A4) were applied to oil palm fruit at 16 WAP (weeks after pollination), and fatty acids in the mesocarp at 24 WAP were analyzed by GC-MS. Results showed that linoleic acid content under treatment A2 (20 μM ABA) was significantly higher (slightly increased by 8.33%) than the control. Therefore, mesocarp samples of A2, and the control at 16, 20, and 24 WAP was sampled for RNA-Seq. KEGG pathway enrichment analysis showed that 43 genes were differentially expressed in the fatty acid biosynthesis pathway, of which expression of EgFAD2 (unigene 105050201) under 20 μM ABA treatment was 1.84-fold higher than in the control at 20 WAP. Further sequence analysis found that unigene 105050201 had more ABA-responsive elements (ABRE), complete conserved domains, and a C-terminal signaling motif among two FAD2 copies. Furthermore, WGCNA and correlation analysis showed co-expression of EgFAD2 (unigene 105050201) with transcription factors (TFs) (WRI1, AP2-EREBP, bZIP, bHLH, C2C2-Dof, MYB, NAC, and WRKY), ABA signaling genes (PYR, PP2C, SnRK, and ABI5), and other genes involved in fatty acid biosynthesis (FATA, FATB, LACS, SAD, Oleosins, and so on). These results indicated that ABA treatment promoted the expression of FAD2 and other genes involved in fatty acid biosynthesis, which possibly resulted in the accumulation of linoleic acid. This study will be helpful for understanding the possible mechanisms through which ABA affects fatty acid biosynthesis and their accumulation in the mesocarp of oil palm.
Introduction
Oil palm (Elaeis guineensis) is a valuable tropical oil crop, providing approximately 36% of edible oils globally (Zhou et al., 2020). Its ability to produce high oil yields has led to its cultivation in tropical regions throughout the world. The fruit oil content of oil palm is high (about 50%), while unsaturated fatty acid content (about 50%) is lower than for other oil crops, such as rapeseed and soybean. As unsaturated fatty acids have many health benefits, increasing the unsaturated fatty acid content of the mesocarp has important implications for improving palm oil quality.
The mesocarp is the most prolific oil production tissue in oil palm fruit; it mainly contains palmitic and oleic acids, and the fatty acid biosynthesis pathway and related genes have been already characterized (Dussert et al., 2013). Previous reports have shown that fatty acid biosynthesis is mainly involved in carbon chain extension and desaturation. Carbon chain extension takes place within plastids. In this process, fatty acids are synthesized from pyruvate, while pyruvate dehydrogenase complex (PDH), acetyl-CoA carboxylase (ACCase), malonyl-CoA (MAT), acyl carrier protein (ACP), ketoacyl-ACP synthase (KASI, KASII, and KASIII), ketoacyl-ACP reductase (KAR), hydroxyacyl-ACP dehydrase (HAD), enoyl-ACP reductase (EAR), stearate desaturase (SAD), and acyl-ACP thioesterase (FATA, FATB) participate in the process. Subsequently, 8:0–18:1 CoA are released to the endoplasmic reticulum by long-chain acyl-CoA synthetase (LACS). The 8:0–18:1 CoA is desaturated further by ω-6 desaturase (FAD2) and ω-3 desaturase FAD3 to concurrently synthesize triacylglycerol (TAG) with glycerol-3-phosphate (Glycerol-3-P). The enzymes glycerol-3-phosphate acyltransferase (GPAT), lysophosphatidic acid acyltransferase (LPAAT), phosphatidate phosphatase (PAP), diacylglycerol cholinephosphotransferase (CPT), phospholipid diacylglycerol acyltransferase (PDAT), 1-acylglycerol-3-phosphocholine acyltransferase (LPCAT), and diacylglycerol acyltransferase (DGAT) participate in this process. Finally, TAG accumulates in the cytoplasm with the oil formed by caleosin and oleosins proteins.
A few studies have investigated the effects of abscisic acid (ABA) on fatty acid biosynthesis in other organisms. Exogenous ABA increases levels of palmitic (C16:0) and stearic (C18:0) acids but decreases linoleic (C18:2) and α-linolenic (C18:3n3) acids in Chlorella vulgaris (Norlina et al., 2020). Exogenous ABA can enhance oleic (C18:1) and linoleic acid (C18:2) accumulation in developing Siberian apricot (Prunus sibirica) seeds, and ABI3, SAD6, FAD2, and KCS1-like showed upregulated expressions in ABA treatment compared with control (Huo et al., 2020); it can also enhance the linoleic acid and elaidic acid content in Cabernet Sauvignon (Vitis vinifera L.) grape berries (Ju et al., 2016). While studies on other plant species show that exogenous ABA influences linoleic acid biosynthesis, this process is still not well understood in oil palm. During mesocarp development, ABA remains at low levels at 12–14 weeks after pollination (WAP), while increasing sharply at 16–18 WAP and, thereafter, maintains a high level (Teh et al., 2014). Palmitic and oleic acid increased gradually from 10 to 23 WAP (weeks after pollination) in the mesocarp, while linoleic acid decreased gradually during these stages, with a sharp decline observed at 17 WAP. While ABA content increased, linoleic acid content declined simultaneously, suggesting that exogenous ABA plays an important role in fatty acid accumulation in oil palm mesocarp (Dussert et al., 2013). In order to confirm effects of exogenous ABA on fatty acid accumulation in oil palm mesocarp, we designed experiment of exogenous ABA treatment on oil palm fruit. Moreover, RNA-seq was also conducted to reveal a transcriptional mechanism that exogenous ABA regulated fatty acid accumulation.
Materials and Methods
Field Conditions and Materials
Five fruit bunches (according to one control and four ABA treatments, respectively) aged 16 WAP from a 6-year-old oil palm tree (fruit form: Tenera) were selected from the oil palm germplasm nursery in the Coconut Research Institute, Chinese Academy of Tropical Agricultural Sciences, Wenchang, China (19°31′50″N, 110°45′58″E) during April 2020. Oil palms were spaced at 8 m × 8 m and drip irrigated. Four ABA [S-(+)-ABA, Yuanye Bio-Technology Co., Ltd, Shanghai, China] concentrations (10, 20, 50, and 200 μM) and a control (CK; with double-distilled water treatment) were prepared (Table 1). At 9:00 h with calm wind, at 26–33°C, ABA treatments were applied by spraying on the surface of fruits for 3 days in a row in the field. Mesocarps from three oil palm fruits were collected randomly at 1 day before treatment (CK_1, A1_1, A2_1, A3_1, and A4_1), 4 weeks later (CK_3, A1_3, A2_3, A3_3, and A4_3), and 8 weeks later (CK_5, A1_5, A2_5, A3_5, and A4_5). Each sample was collected in three biological replicates and immediately frozen in liquid nitrogen. Thereafter, they were kept in a freezer at −80°C for further analyses (Table 1).
Fatty Acid Analysis by GC-MS
Standard product configuration: 52 types of mixed standard solutions of fatty acid methyl ester were prepared with n-hexane to 0.5, 1, 5, 10, 25, 50, 100, 250, 500, 1,000, and 2,000 μg/ml concentration gradients. The concentration is the total concentration of each component.
Sample Pretreatment
Approximately 50 mg samples were mixed with 1 ml chloroform methanol (2:1) solution. The mixture was grounded in a high-throughput tissue grinder by shaking at 60 Hz for 1 min, and the process was repeated two times; subsequently, the mixture was subjected to ultrasound for 30 min at room temperature. Thereafter, the samples were centrifuged at 12,000 rpm at 4°C for 5 min. The supernatants were collected and mixed with 2 ml 1% sulfuric acid methanol, and vortexed for 1 min, and then followed by esterification in a water bath at 80°C for 30 min. After removal from the water bath, samples were allowed to cool and were then mixed thoroughly with 1 ml n-hexane and kept in room temperature for 5 min. To this mixture, 5 ml of ddH2O (4°C) was added, and centrifugation took place at 12,000 rpm at 4°C for 10 min. The supernatant (700 μl) was collected and mixed thoroughly with 100 mg anhydrous sodium sulfate powder to remove excess water and centrifuged at 12,000 rpm for 5 min. Then, 10 μl of supernatant was collected and mixed with 490 μl n-hexane. Thereafter, 300 μl of diluent was collected. A total of 15 μl l,500 ppm methyl salicylate, which was used as an internal standard, was mixed with the collected diluents, and 250 μl of supernatant was collected for GC-MS analysis.
GC-MS Analysis
GC-MS analysis was performed using a Thermo TG-FAME capillary column (50 m *0.25 mm ID *0.20 μm). The injection volume was 1 μl, and the split ratio was 8:1. The injection port temperature was 250°C, the ion source temperature was 230°C, the transmission line temperature was 250°C, and the quadrupole temperature was 150°C. The initial level of the programmed temperature was 80°C for 1 min; this subsequently rose to 160°C at 20°/min for 1.5 min; and 3°/min to 196° for 8.5 min. Finally, the temperature was raised to 250° at 20°/min for 3 min. Fatty acids were separated using helium as the carrier gas with a flow rate of 0.63 ml/min. The mass spectrometer was operated in the electron impact ionization (EI) mode at 70 eV.
RNA Extraction and Transcriptome Sequencing
Ethanol precipitation protocol and CTAB-pBIOZOL reagent were used for the purification of total RNA from the plant tissue according to the manual instructions. Grind about 80 mg samples into powder with liquid nitrogen and transfer the powder into 1.5 ml preheated 65°C CTAB-pBIOZOL reagents. The samples were incubated by a Thermo mixer for 15 min at 65°C to permit the complete dissociation of nucleoprotein complexes. After centrifuging at 12,000 × g for 5 min at 4°C, the supernatant was added 400 μl of chloroform per 1.5 ml of CTAB-pBIOZOL reagent and was centrifuged at 12,000 × g for 10 min at 4°C. The supernatant was transferred to a new 2 ml tube that added 700 μl acidic phenol and 200 μl chloroform, followed by centrifuging 12,000 × g for 10 min at 4°C. The aqueous phase was added equal volume of an aqueous phase of chloroform and centrifuged at 12,000 × g for 10 min at 4°C. The supernatant was added equal volume of supernatant of isopropyl alcohol and placed at −20°C for 2 h for precipitation. After that, the mix was centrifuged at 12,000 × g for 20 min at 4°C and then removed the supernatant. After washing with 1 ml of 75% ethanol, the RNA pellet was air-dried in the biosafety cabinet and was dissolved by adding 50 μl of DEPC-treated water. Subsequently, total RNA was qualified and quantified using a Nano Drop and Agilent 2100 bioanalyzer (Thermo Fisher Scientific, MA, United States).
Oligo (dT)-attached magnetic beads were used to purified mRNA. Purified mRNA was fragmented into small pieces with a fragment buffer at appropriate temperature. Then, first-strand cDNA was generated using random hexamer-primed reverse transcription, followed by a second-strand cDNA synthesis. Afterward, A-Tailing Mix and RNA Index Adapters were added by incubating to end repair. The cDNA fragments obtained from a previous step were amplified by PCR, and products were purified by Ampure XP Beads, and then dissolved in EB solution. The products were validated on the Agilent Technologies 2100 bioanalyzer for quality control. The double-stranded PCR products from a previous step were heated, denatured, and circularized by the splint oligo sequence to get the final library. The single-strand circle DNA (ssCir DNA) was formatted as the final library. The final library was amplified with phi29 to make DNA nanoball (DNB), which had more than 300 copies of one molecular, DNBs were loaded into the patterned nanoarray, and single-end 50 bases reads were generated on a MGISEQ500 platform (BGI-Shenzhen, China).
Transcriptome Data Processing, Reference Genome Selection, Differential Expression, and Functional Enrichment Analysis
The sequencing data were filtered with SOAPnuke v.1.4.0 and Trimmomatic v.0.36 (Li et al., 2008) by (1) removing reads containing a sequencing adapter; (2) removing reads whose the low-quality base ratio (base quality≤5) was>20%; (3) removing reads whose the unknown base (“N” base) ratio was>5%; afterward, clean reads were obtained and stored in a FASTQ format. The clean reads were mapped to the African oil palm genome1 using HISAT2 v.2.1.0 (Kim et al., 2015). Bowtie2 v.2.2.5 (Langmead and Salzberg, 2012) was used to align the clean reads with the reference-coding gene set, and then the expression levels of genes were calculated using RSEM v.1.2.8 (Li and Dewey, 2011). The heatmap was drawn using the “pheatmap” tool of the R package according to gene expression in different samples. Essentially, differential expression analysis was performed using the DESeq2 v.1.4.5 (Love et al., 2014) with Q ≤ 0.05. GO, and KEGG enrichment analysis of annotated differentially expressed genes was performed using the R function “Phyper” based on the hypergeometric test. The significant levels of terms and pathways were corrected using Q-value with a rigorous threshold (Q ≤ 0.05) according to Bonferroni.
Statistical Analysis and Heatmap Drawing
Statistical analysis was performed to identify fatty acid compositions that were significant between treatments, using Fisher LSD in one-way ANOVA, at p < 0.05 or < 0.01. Correlation analysis was conducted using Origin 9.1. R package “pheatmap” was used for heatmap drawing.
Network Construction and Performance
R package “WGCNA” was used to construct a WGCNA network, correlation coefficients were calculated using Origin 9.1, and Cytoscape 3.8 was used to perform networking using WGCNA and the correlation network file.
Cis-Acting Element Prediction, Phylogenetic Tree Construction, and Protein Sequence Analysis
Promoter sequences used for cis-acting element prediction were downloaded from NCBI,2 and then the FASTA format of promoter sequences was submitted to the PlantCARE website3 for cis-acting element prediction. A phylogenetic tree was conducted in MEGA X using a maximum likelihood tree (Kumar et al., 2018). An alignment view of protein sequences was performed using GeneDoc software.
Results
Effects of Exogenous Abscisic Acid on Fatty Acid Composition in the Mesocarps of Oil Palm
To determine fatty acid content and composition, mesocarps of the five treatments at 24 WAP were measured by GC-MS (Table 1). No significant differences were observed on oil content between ABA-treated samples (A2 and A4) and the control (Figure 1 and Supplementary Table 1). The content of myristic acid, stearic acid, 10-transnonadecenoate, linoleic acid, arachidonic acid, behenic acid, and lignoceric acid increased significantly in A2 compared to CK, while content of main fatty acids components, such as palmitic acid and oleic acid, had no significant changes (Figure 1 and Supplementary Table 1). Among those fatty acids, linoleic acid increased by 8.33% in A2 compared to CK. Although the standard deviation of linoleic acid in CK_5 was big, linoleic acid was selected for the object of in-depth analysis because its content was highest in those fatty acids, and it could possess higher application value.
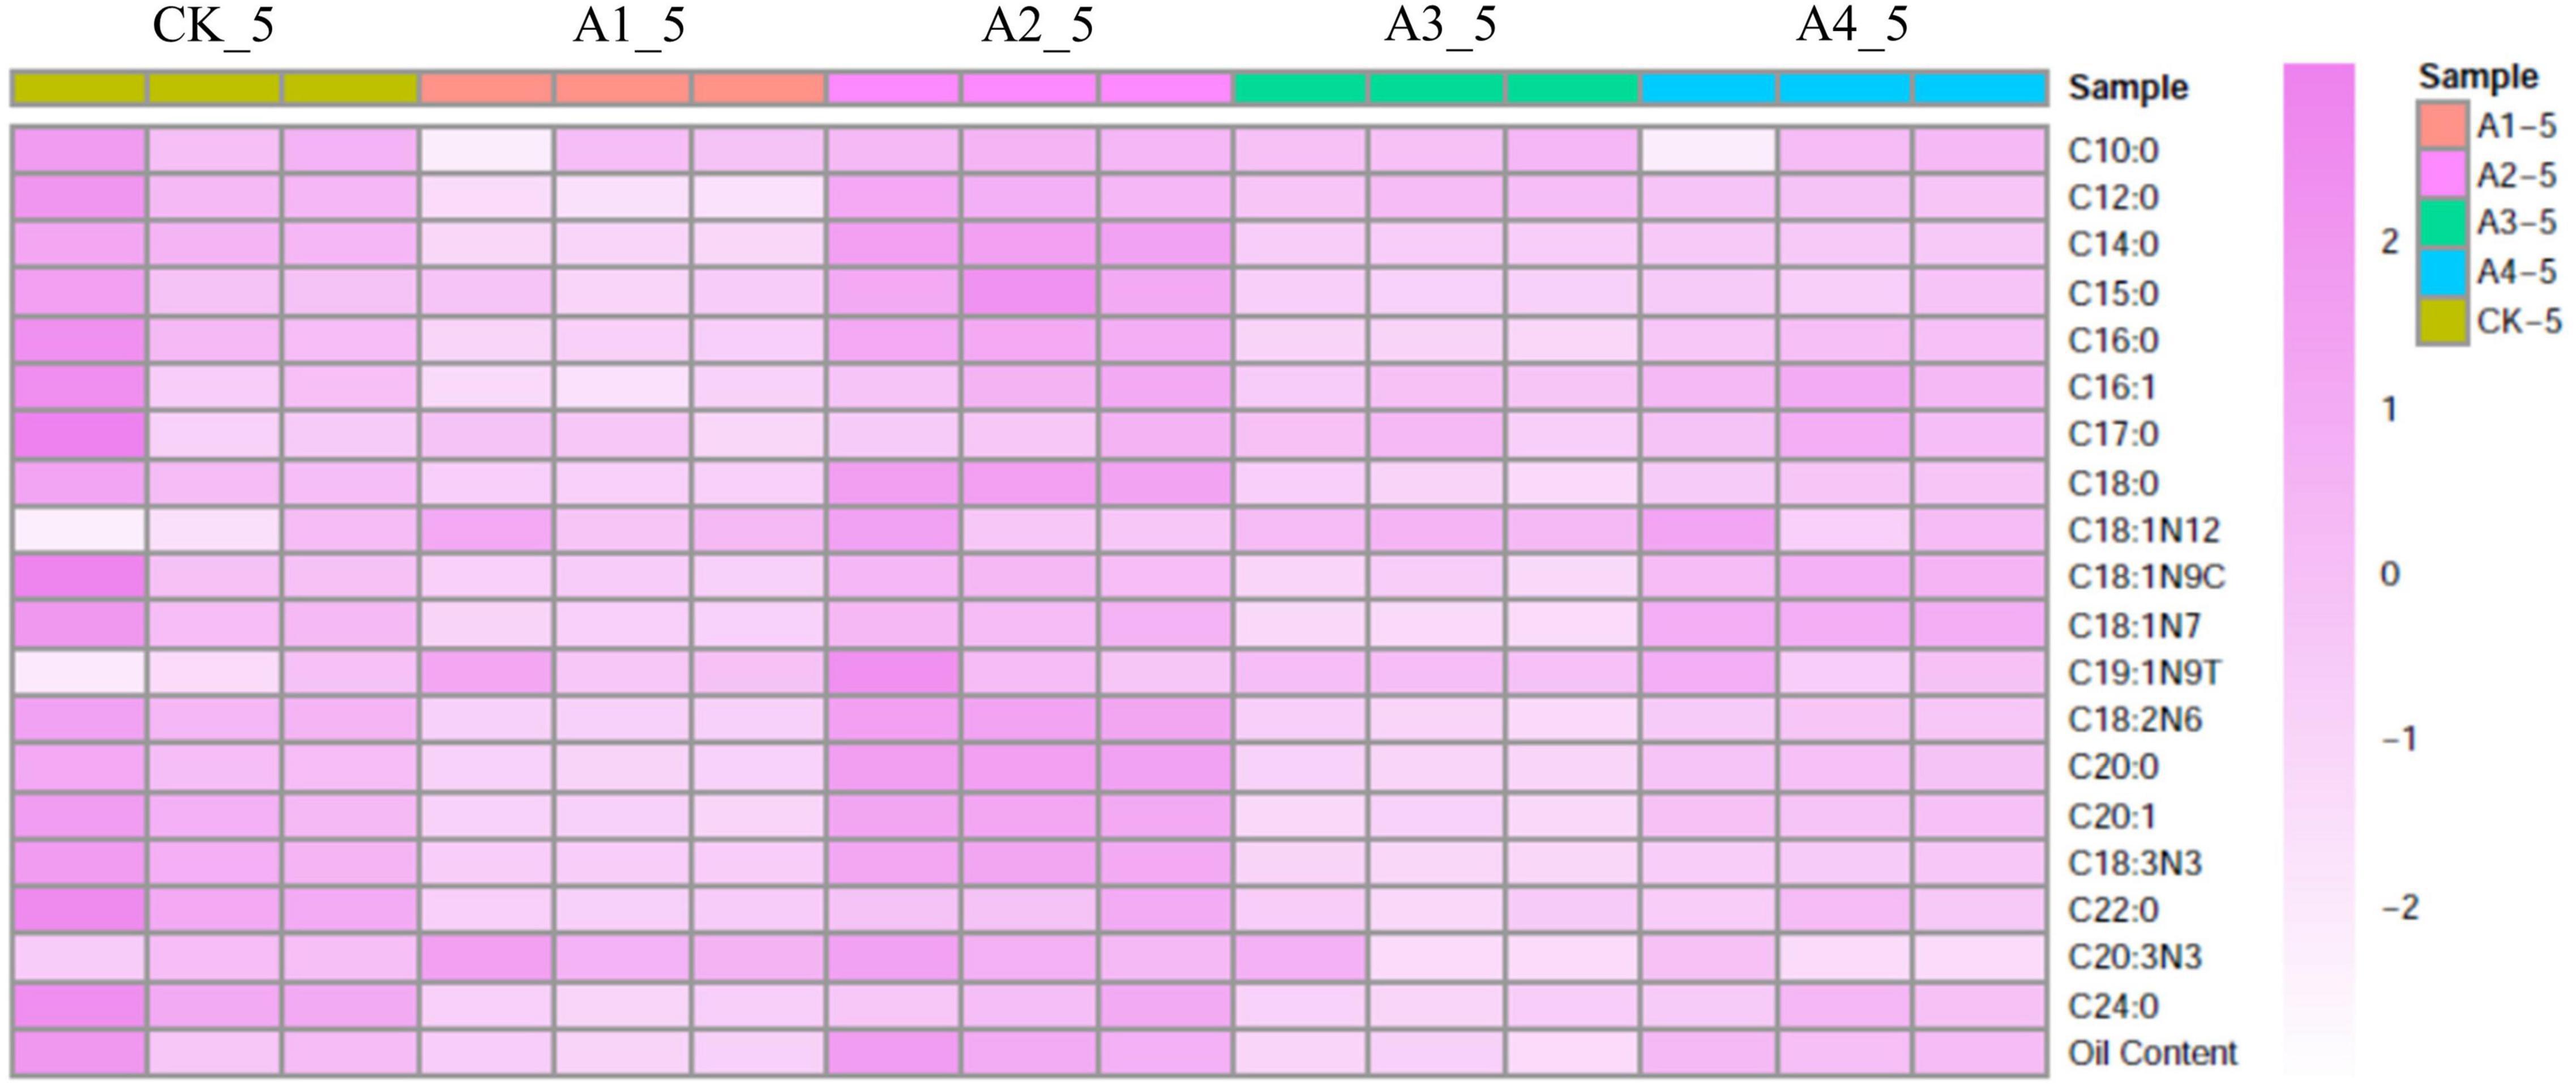
Figure 1. Heat map of fatty acid composition content after different exogenous ABA treatments. CK, treatment with 0 μM ABA; A1, treatment with 10 μM ABA; A2, treatment with 20 μM ABA; A3, treatment with 50 μM ABA; A4, treatment with 200 μM ABA. Each colored cell on the map corresponds to a concentration value.
Transcriptome Sequencing
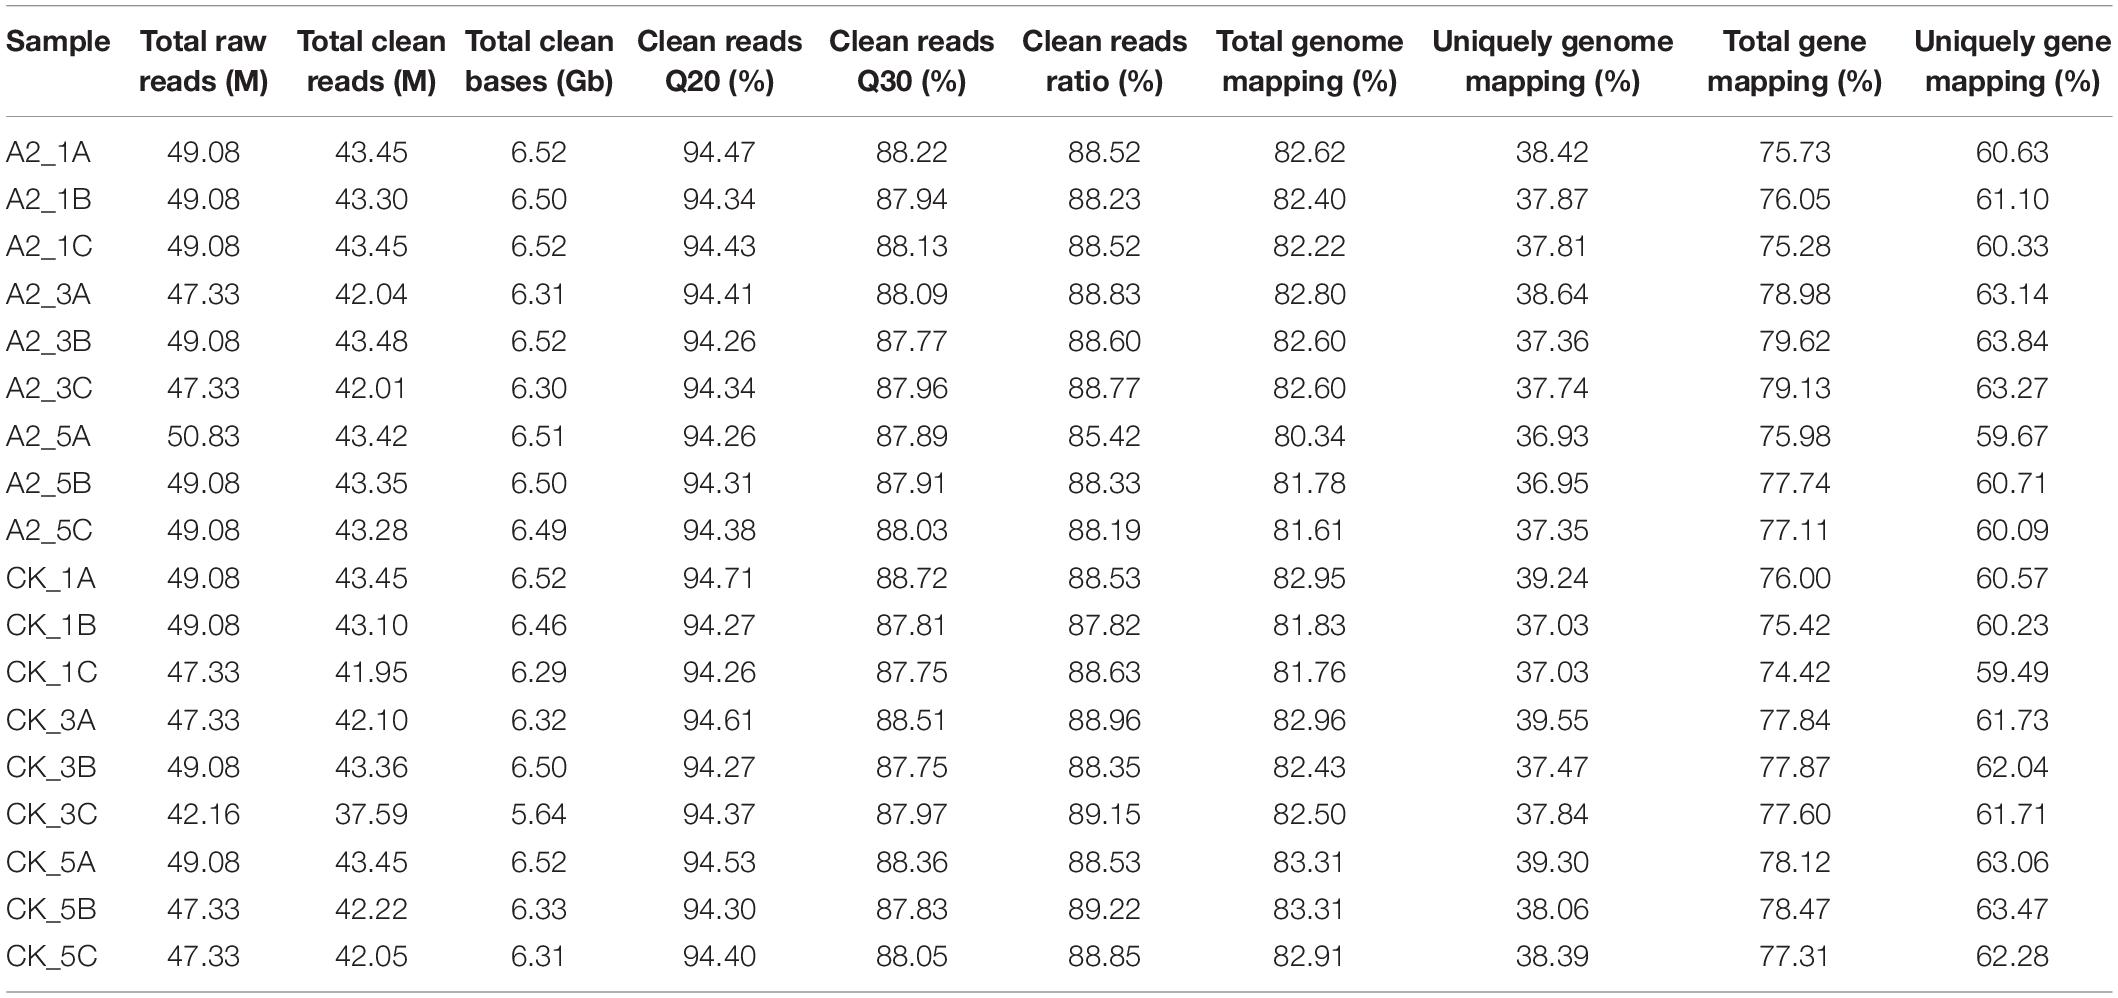
Linoleic acid is reported to be an important unsaturated fatty acid in the oil palm mesocarp (Dussert et al., 2013). Therefore, A2 and CK samples at 16, 20, and 24 WAP were collected for RNA-seq analysis (Table 1). A total of 18 libraries were generated from the mesocarp of CK and A2 samples at 16, 20, and 24 WAP, with three biological replicates and produced 47.33–50.83 million raw reads (Table 2). After removing reads-containing adapters or poly-N and low-quality reads, the total number of clean reads per library was in the range of 41.95–43.48 million. Hierarchical indexing for spliced alignment of transcripts (HISAT) was used to compare clean reads to the reference genome4 using Bowite2. Among the short clean reads, 80.34–83.31% were aligned against the reference genome.
Principal Component Analysis (PCA) showed that three biological replicates of each sample were well clustered. Two groups (CK_1 and A2_1) were clustered together, while the other four groups (CK_3, CK_5, A2_3, and A2_5) were distinguished from each other; in particular, A2_5 was found to be clearly distinguished from the remaining five groups (Figure 2A). To analyze the correlation of the samples, Pearson’s correlation coefficient was calculated based on gene expression levels. Results showed that CK_1 was highly correlated with A2_1, and CK_3 was highly correlated with A2_3. Meanwhile A2_5 was clearly separated from other samples (Figure 2B), which was consistent with the PCA analysis.
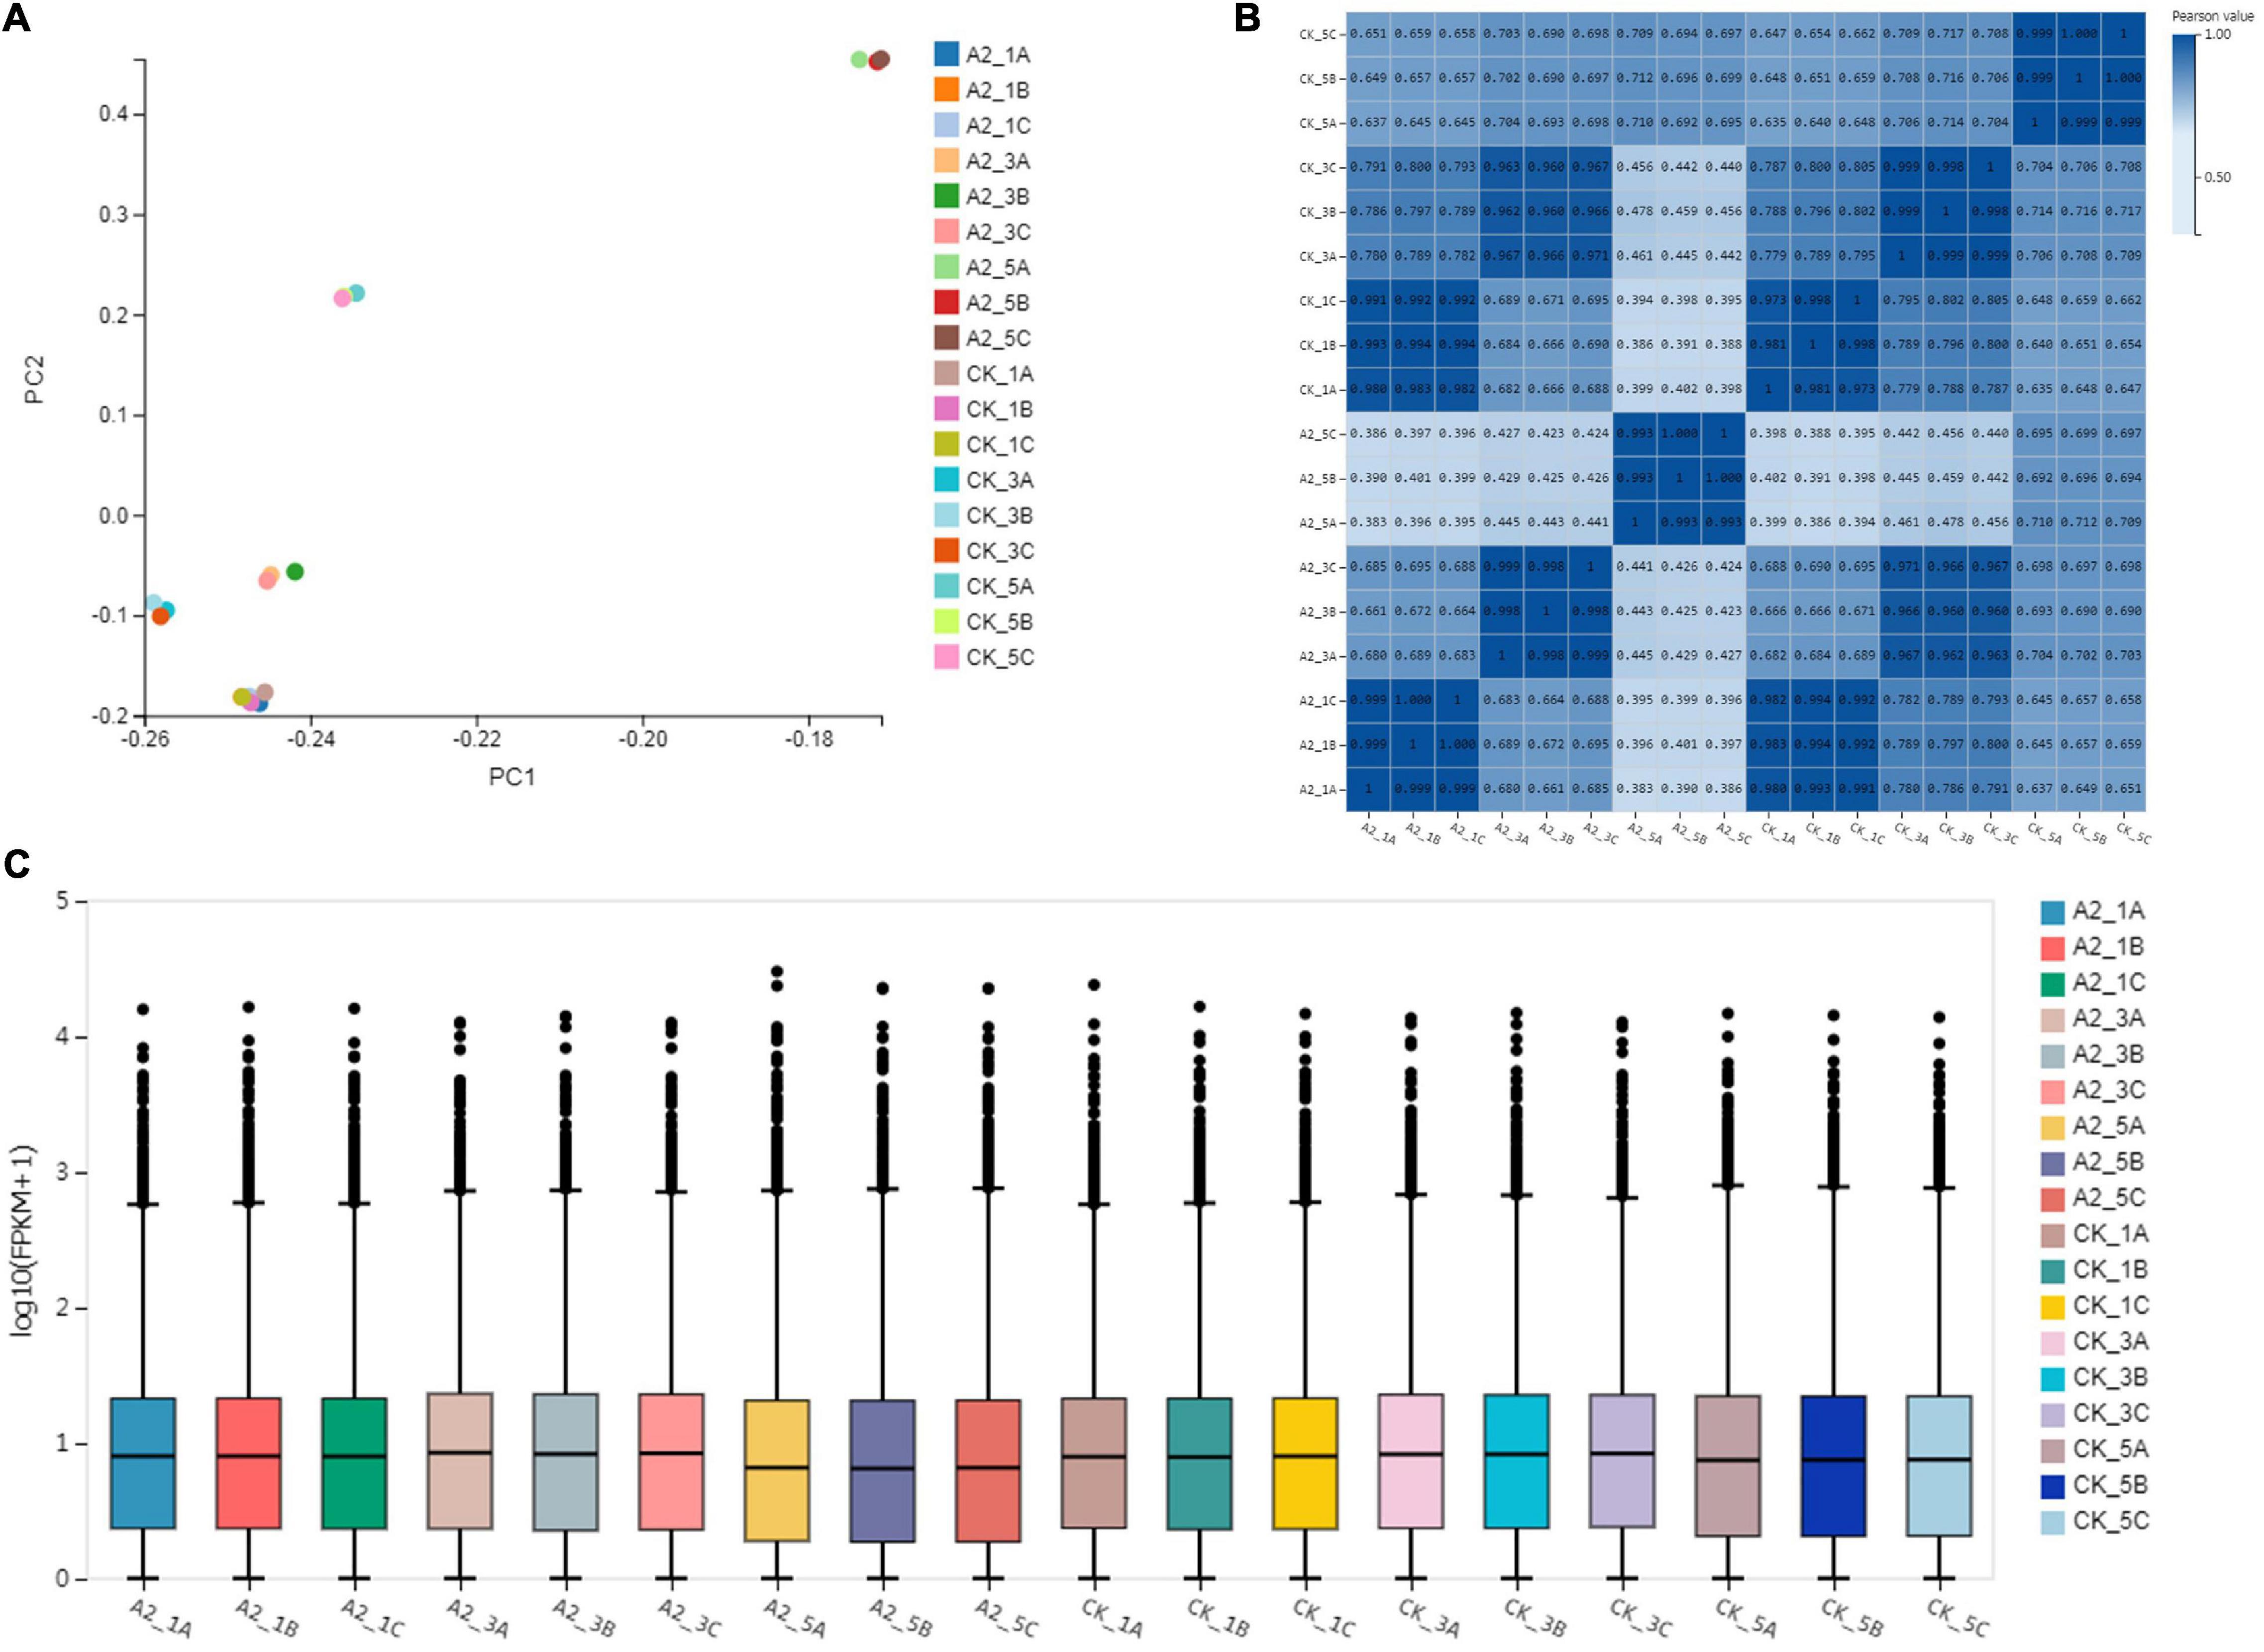
Figure 2. Transcriptome at 0, 4, and 8 weeks after treatment with 0 and 20 μM ABA. (A) Principal component analysis of six samples. (B) Pearson correlation coefficient of gene expression levels between samples. (C) Distribution of gene expression levels in each sample. The x-axis shows the sample name, and the y-axis shows log10 [FPKM (fragments per kilobase of exon model per million mapped reads) + 1]. The box plot for each region corresponds to five statistics (upper to lower, upper quartile, median, and lower quartile, lower limit, where the upper and lower limits do not take outliers into account).
The distribution of gene expression levels in each sample was then performed, and the degree of dispersion of the data distribution was observed (Figure 2C). The median values of genes expression under A2_5 were significantly lower (p < 0.01) than A2_1 and A2_3, and the same to CK_5 (p < 0.01).
Analysis of Differentially Expressed Genes
A total of 193 DEGs were detected in CK_1 vs. A2_1, of which 98 DEGs were upregulated and 95 DEGs were downregulated. In total, 5,807 DEGs were identified in CK_3 vs. A2-3, of which 2,930 DEGs were upregulated and 2,877 DEGs were downregulated. In CK_5 vs. A2_5, a total of 9,699 genes were identified as DEGs, of which 4,898 DEGs were upregulated and 4,801 DEGs were downregulated. A total of 118 DEGs overlapped among the groups (Figures 3A,B). The lowest number of DEGs (193) was identified in CK_1 vs. A2_1, which was sampled before ABA treatment, while the number of DEGs identified in CK_3 vs. A2_3 and CK_5 vs. A2_5 was sharply increased. These results indicated that ABA treatment had a great impact on transcriptional changes in oil palm mesocarps.
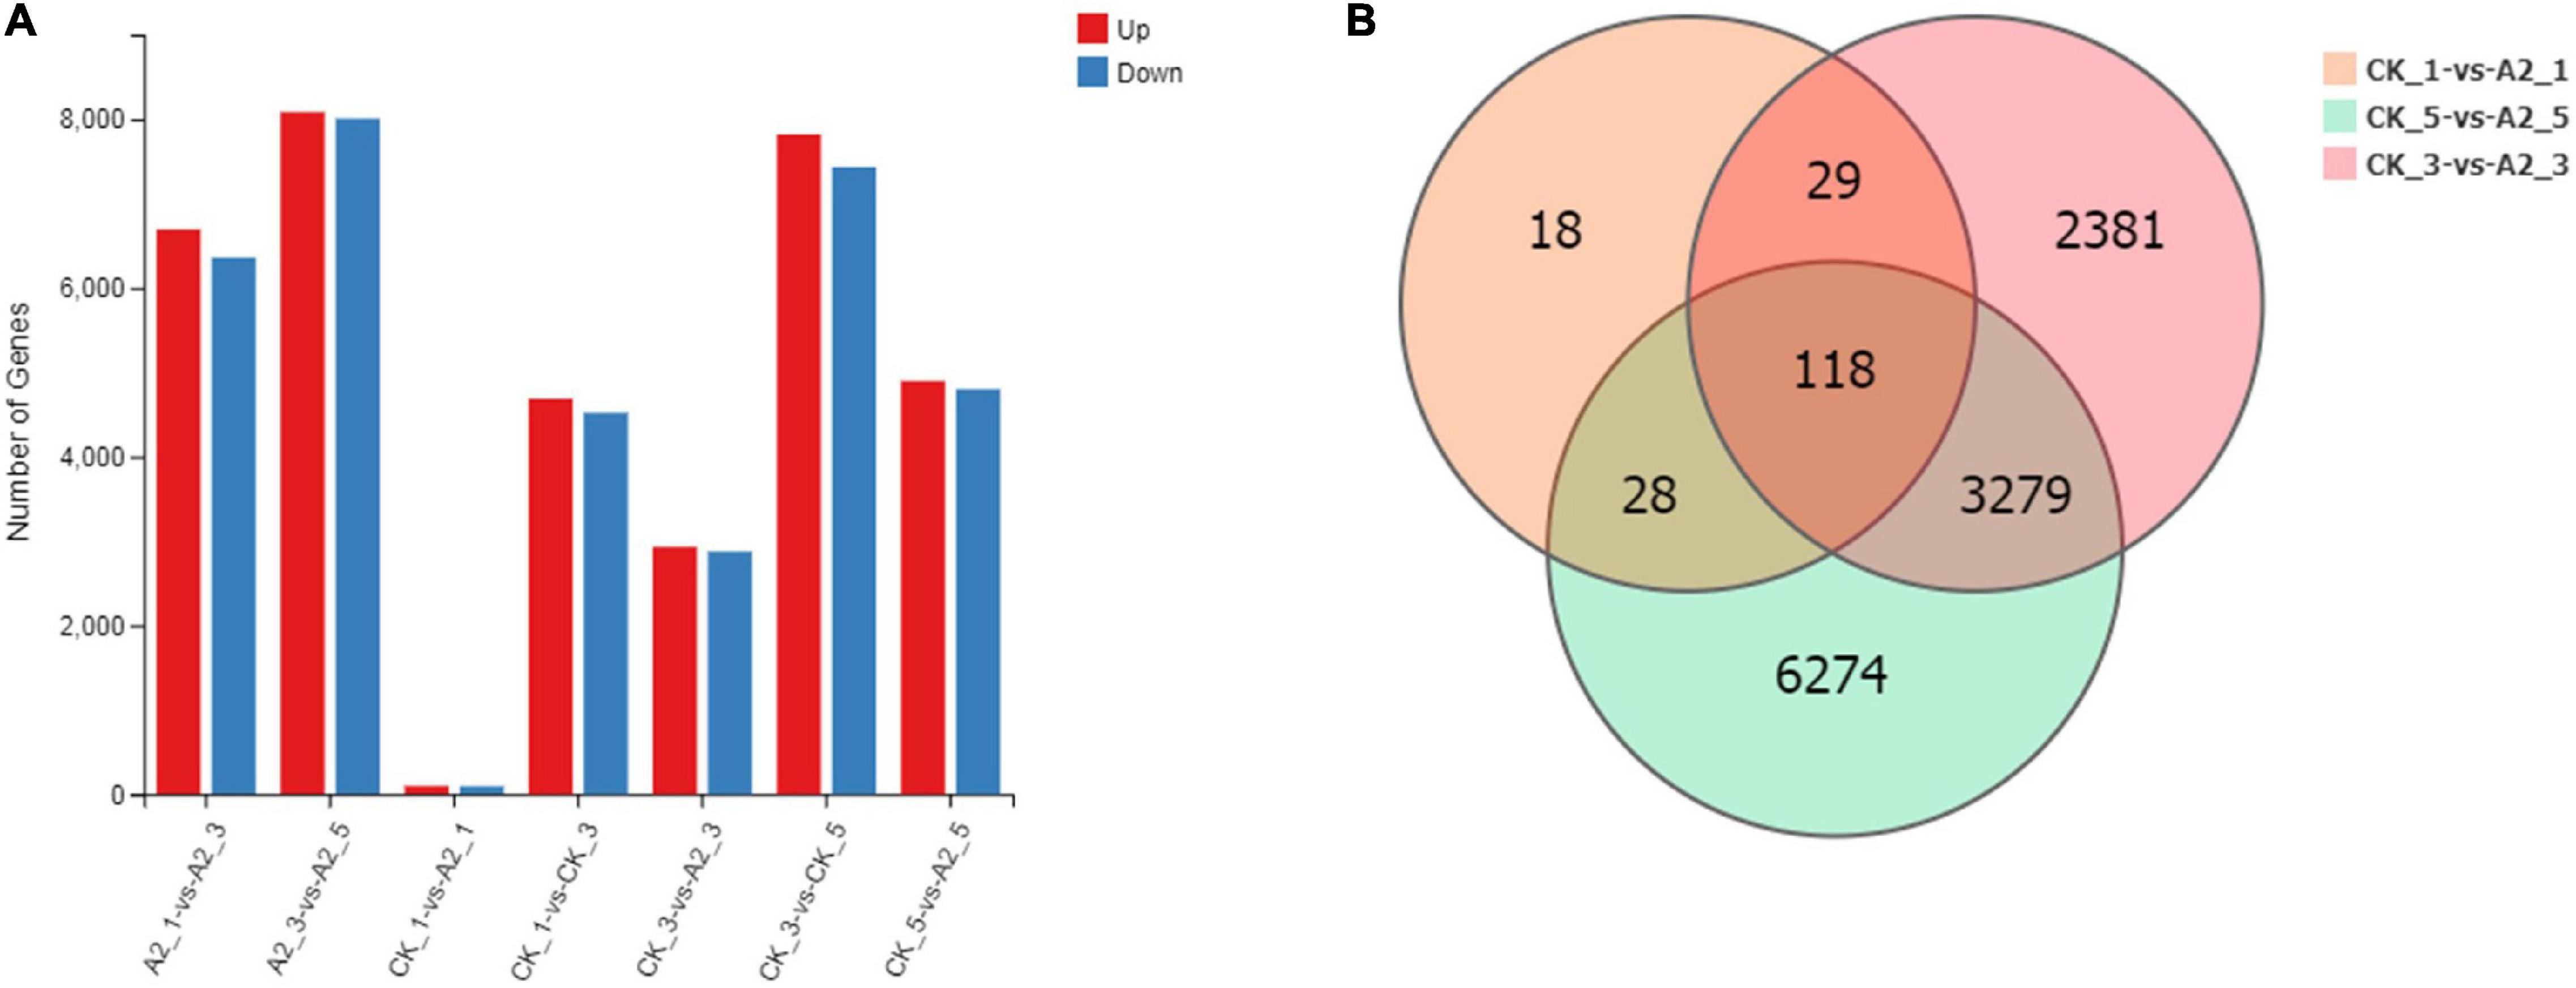
Figure 3. A summary of DEGs between CK and A2. (A) Number of DEGs. (B) The Venn diagram of DEGs between CK and A2.
DEGs were subjected to Gene Ontology (GO) analysis to further understand their functions. Among 5,807 DEGs in CK_3 vs. A2_3, 4,361 were classified into three main GO categories: biological process, cellular component, and molecular function. The main biological processes represented were cellular process (1,309), metabolic process (1,144), and biological regulation (415). Major cellular component included membrane (1,386), cell (1,332), and membrane part (1,322). The main molecular functions were binding (2,246), catalytic activity (2,133), and transporter activity (260) (Supplementary Figure 1A and Supplementary Table 2). The top 20 GO enrichments were further analyzed, and results showed that the fatty acid biosynthetic process under the biological process was observed in these GO terms (Supplementary Figure 1B and Supplementary Table 3).
To identify significantly enriched pathways in CK_3 vs. A2_3, pathway annotation was conducted via the Kyoto Encyclopedia of Genes and Genomes (KEGG). In total, 2,763 DEGs were annotated in KEGG pathways; of which, 303, 263, and 271 DEGs were enriched in signal transduction, transcription, and lipid metabolism, respectively (Supplementary Figure 1C and Supplementary Table 4). We further analyzed the top 20 enriched pathways and observed that fatty acid biosynthesis and fatty acid metabolism were represented (Supplementary Figure 1D and Supplementary Table 4). Several pathways related to fatty acids were annotated: pyruvate metabolism (75), fatty acid metabolism (55), and fatty acid biosynthesis (43).
In CK_5 vs. A2_5, 7,227 of 9,699 DEGs were annotated in GO categories (Supplementary Figure 2A and Supplementary Table 5): Cellular process (2,122), metabolic process (1,842), and biological regulation (673) were represented as major categories under the biological process. Under the cellular component, membrane (2,354), membrane part (2,239), and cell (2,161) were the most highly represented categories. Major categories in molecular function were catalytic activity (3,536), binding (3,529), and transporter activity (432). When the top 20 GO categories were further analyzed, it was observed that cytoplasm (1,097), cytoplasmic part (882), and small molecule metabolic process (488) were the most highly represented categories (Supplementary Figure 2B and Supplementary Table 6). Significantly enriched KEGG pathways in CK_5 vs. A2_5 were further analyzed. In total, 4,453 DEGs were enriched in KEGG pathways (Supplementary Figure 2C and Supplementary Table 7). Similar to CK_3 vs. A2_3, fatty acid metabolism (73) and fatty acid biosynthesis (50) were represented as the top 20 KEGG pathways (Supplementary Figure 2D and Supplementary Table 7).
EgFAD2 Upregulation Possibly Results in Increase of Linoleic Acid Biosynthesis
As exogenous ABA has a distinct impact on fatty acid accumulation, we further focused on the genes involved in lipid biosynthesis and ABA signaling pathways to identify possible mechanisms. A total of 14, 31, 520, 190 unigenes were, respectively, identified as ABA biosynthesis and metabolism, ABA signal transduction, TFs that could be related with ABA and fatty acid biosynthesis, and fatty acid biosynthesis in these transcriptome data (Supplementary Table 10). Among these unigenes, genes, such as KAR, FAD2, and SAD, were highly expressed with>1,000 FPKM value, suggesting that these genes may play an important role in fatty acid synthesis. Most upregulated genes in the fatty acid biosynthesis pathway were expressed in A2_3 compared with CK_3, such as PDH(E1α), PDH(E1β), PDH(E2), ACC(CTb), ACC(BC), ACC(BCCP), MAT, KASIII, HAD, EAR, KAR, KASII, FATA, FATB, LACS, GPAT, FAD2, FAD3, DGAT2, PDAT, and Oleosins (Figure 4). Meanwhile some genes were upregulated in A2_5 compared with CK_5, such as PDH(E2), KASIII, KAR, KASII, FATB, GPAT, PAP, CPT, DGAT1, and Oleosins (Figure 4). In addition, several genes involved in ABA signal transduction and TFs were also differentially expressed in A2_3_vs. CK_3 and A2_5_vs. CK_5, such as PYR, PP2C, SnRK, ABI5, AP2-EREBP, bZIP, C2C2-Dof, and MYB (Supplementary Table 8). In addition, exogenous ABA also affected the expression level of genes involved in ABA biosynthesis and metabolism (Supplementary Table 8). The expression level of some genes involved in ABA biosynthesis reduced after exogenous ABA treatment, such as DXS, DXR, and ZEP, while PSY, PDS, and NCED rose. Especially, the expression level of gene (CYP707A) involved in ABA metabolism was significantly (p-value < 0.01) higher in A2_5 than CK_5.
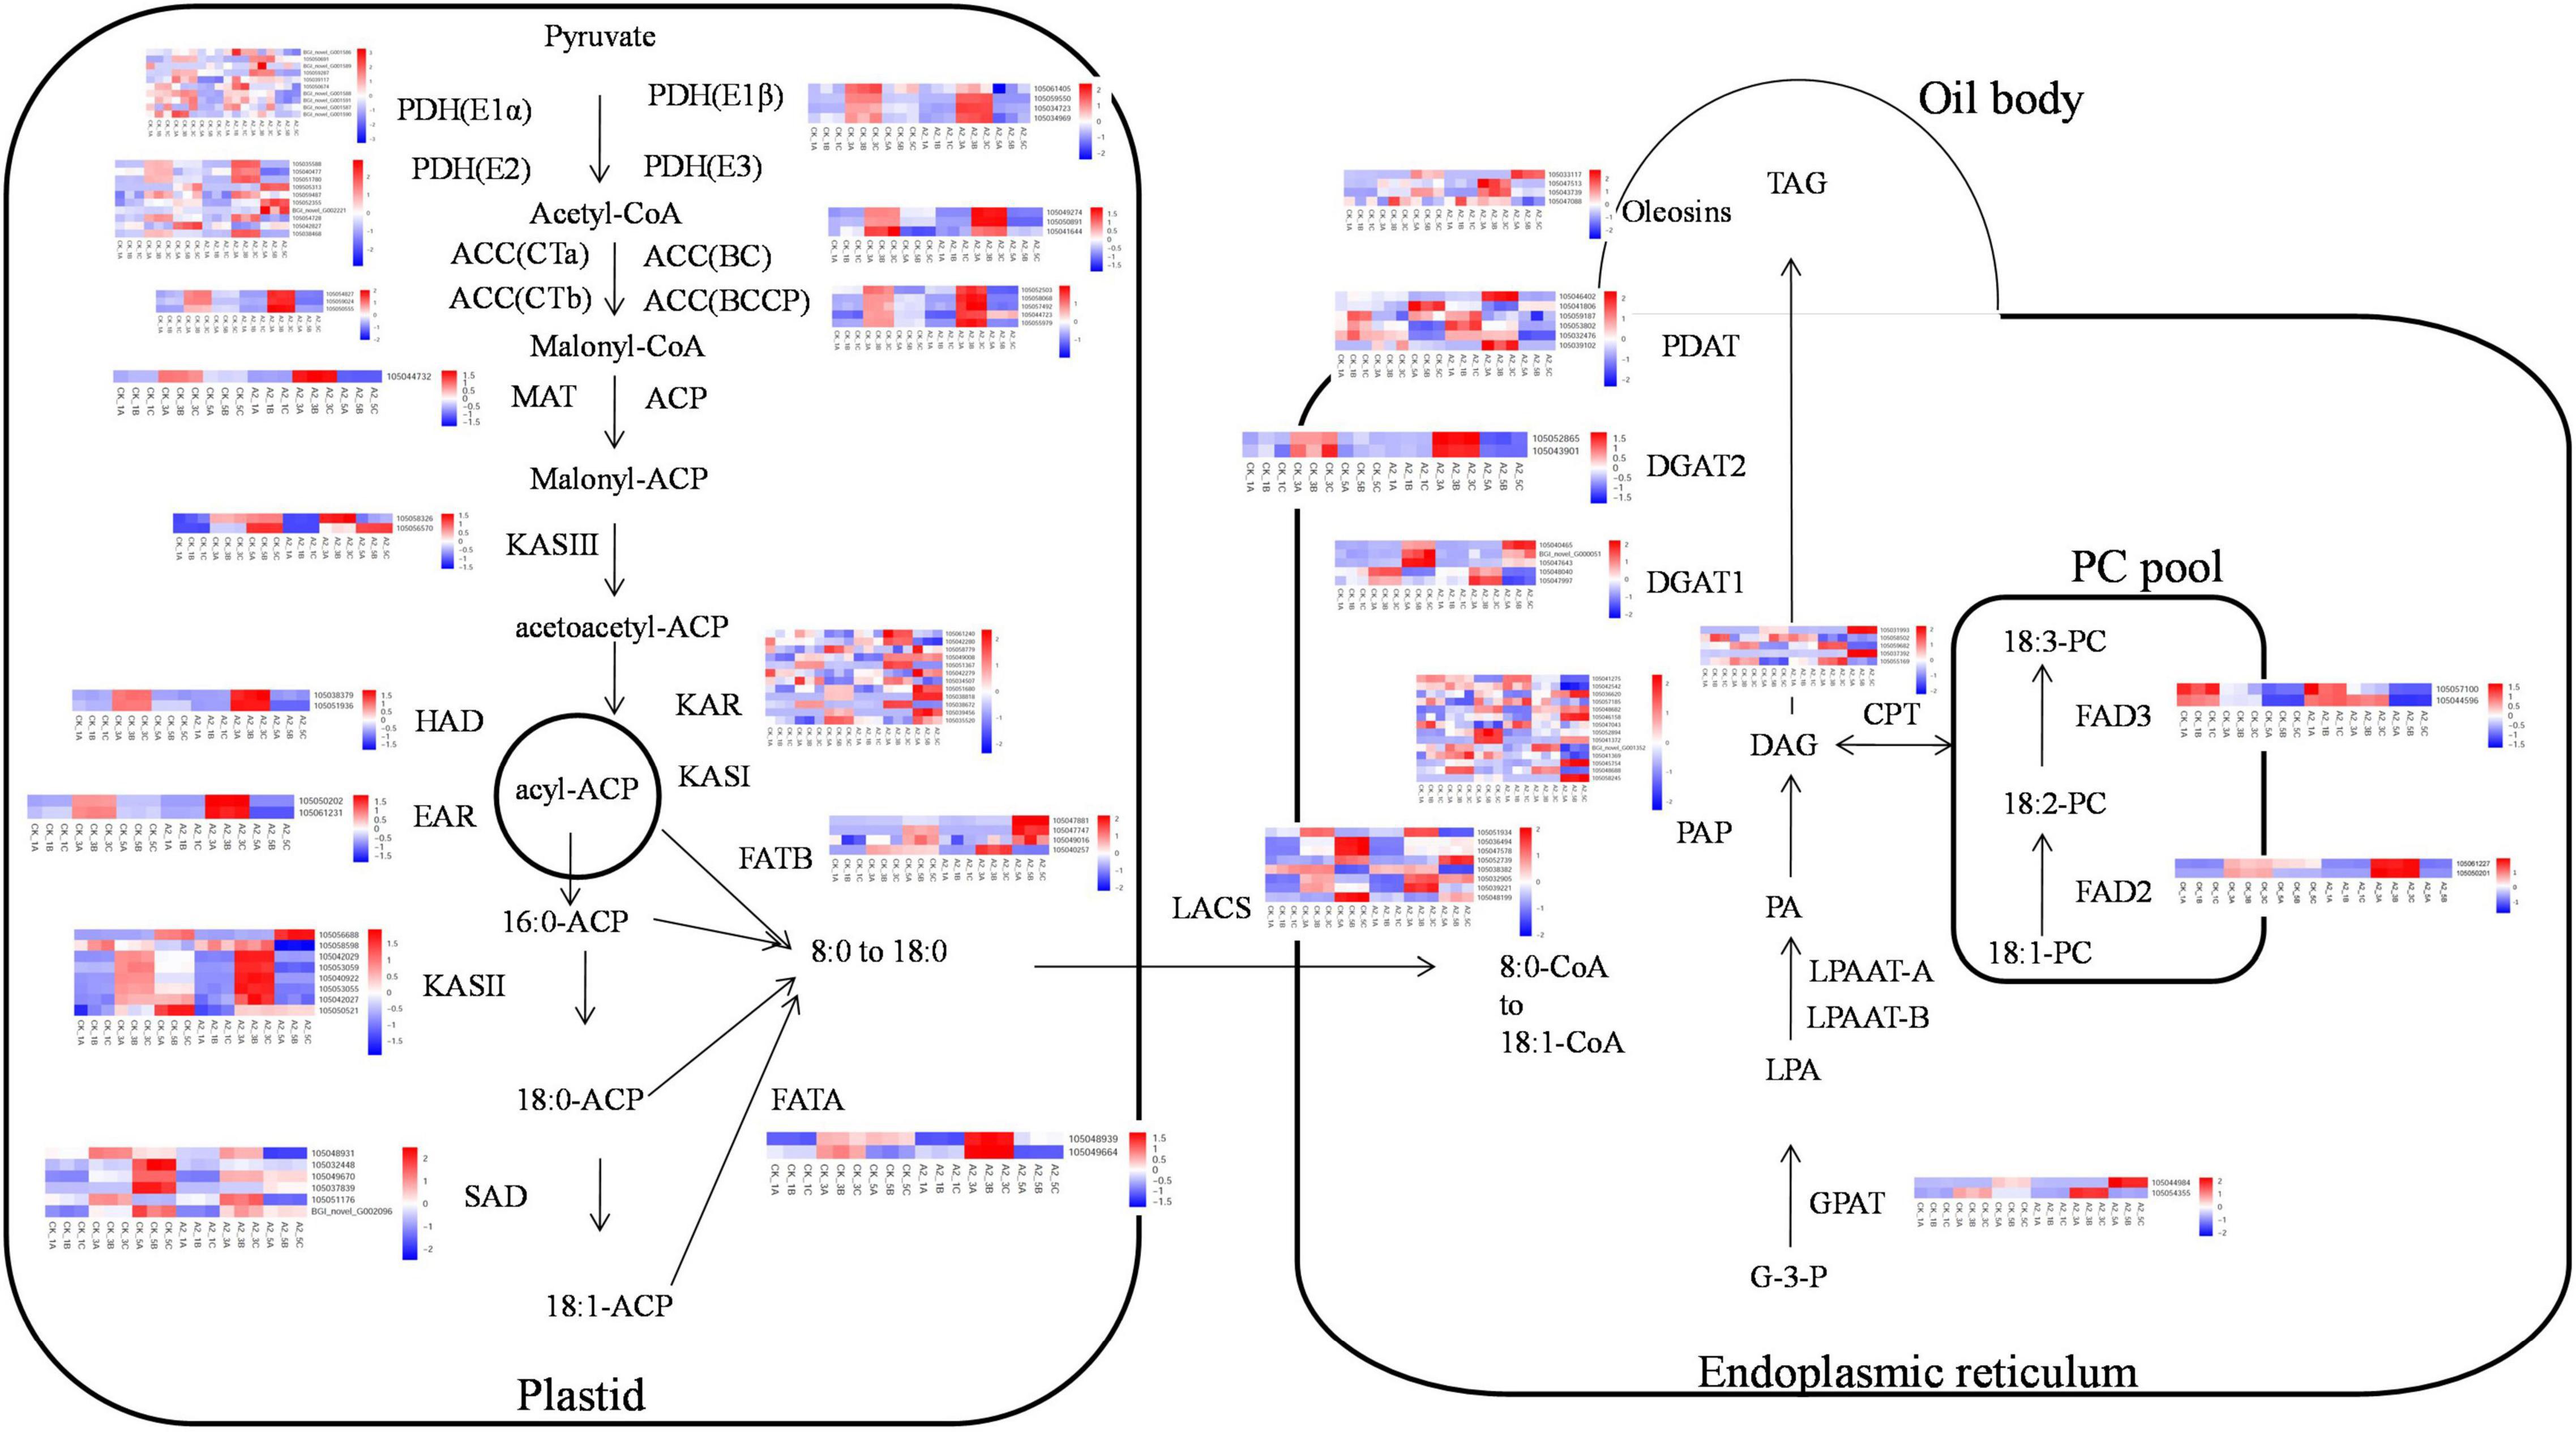
Figure 4. The transcriptional model of fatty acid biosynthesis in developing oil palm mesocarp. The 18 squares in each horizontal row correspond to three replicates of three stages (16 WAP, 20 WAP, and 24 WAP) in CK and A2. G-3-P, glycerol-3-phosphate; LPA, 1-acylglycerol-3P; PA, phosphatidic acid; DAG, 1,2-diacylglycerol; and TAG, triacylglycerol.
Moreover, the content of other major fatty acid components did not increase significantly instead of linoleic acid, so we focused on linoleic acid (Supplementary Table 1). In the fatty acid biosynthesis pathway (Figure 4), FAD2 is the key gene-catalyzing oleic acid (C18:1) to linoleic acid (C18:2) (Dussert et al., 2013). In this study, two genes encoding FAD2 (gene ID:105061227, 105050201) were differentially expressed, of which the expression level of unigene 105050201 under A2_3 was significantly higher than for CK_3, the same to A2_5 vs. CK_5 (Figure 5), suggesting that exogenous ABA treatment can lead to the increased expression of FAD2. This result indicated the FAD2 expression level was raised by exogenous ABA.
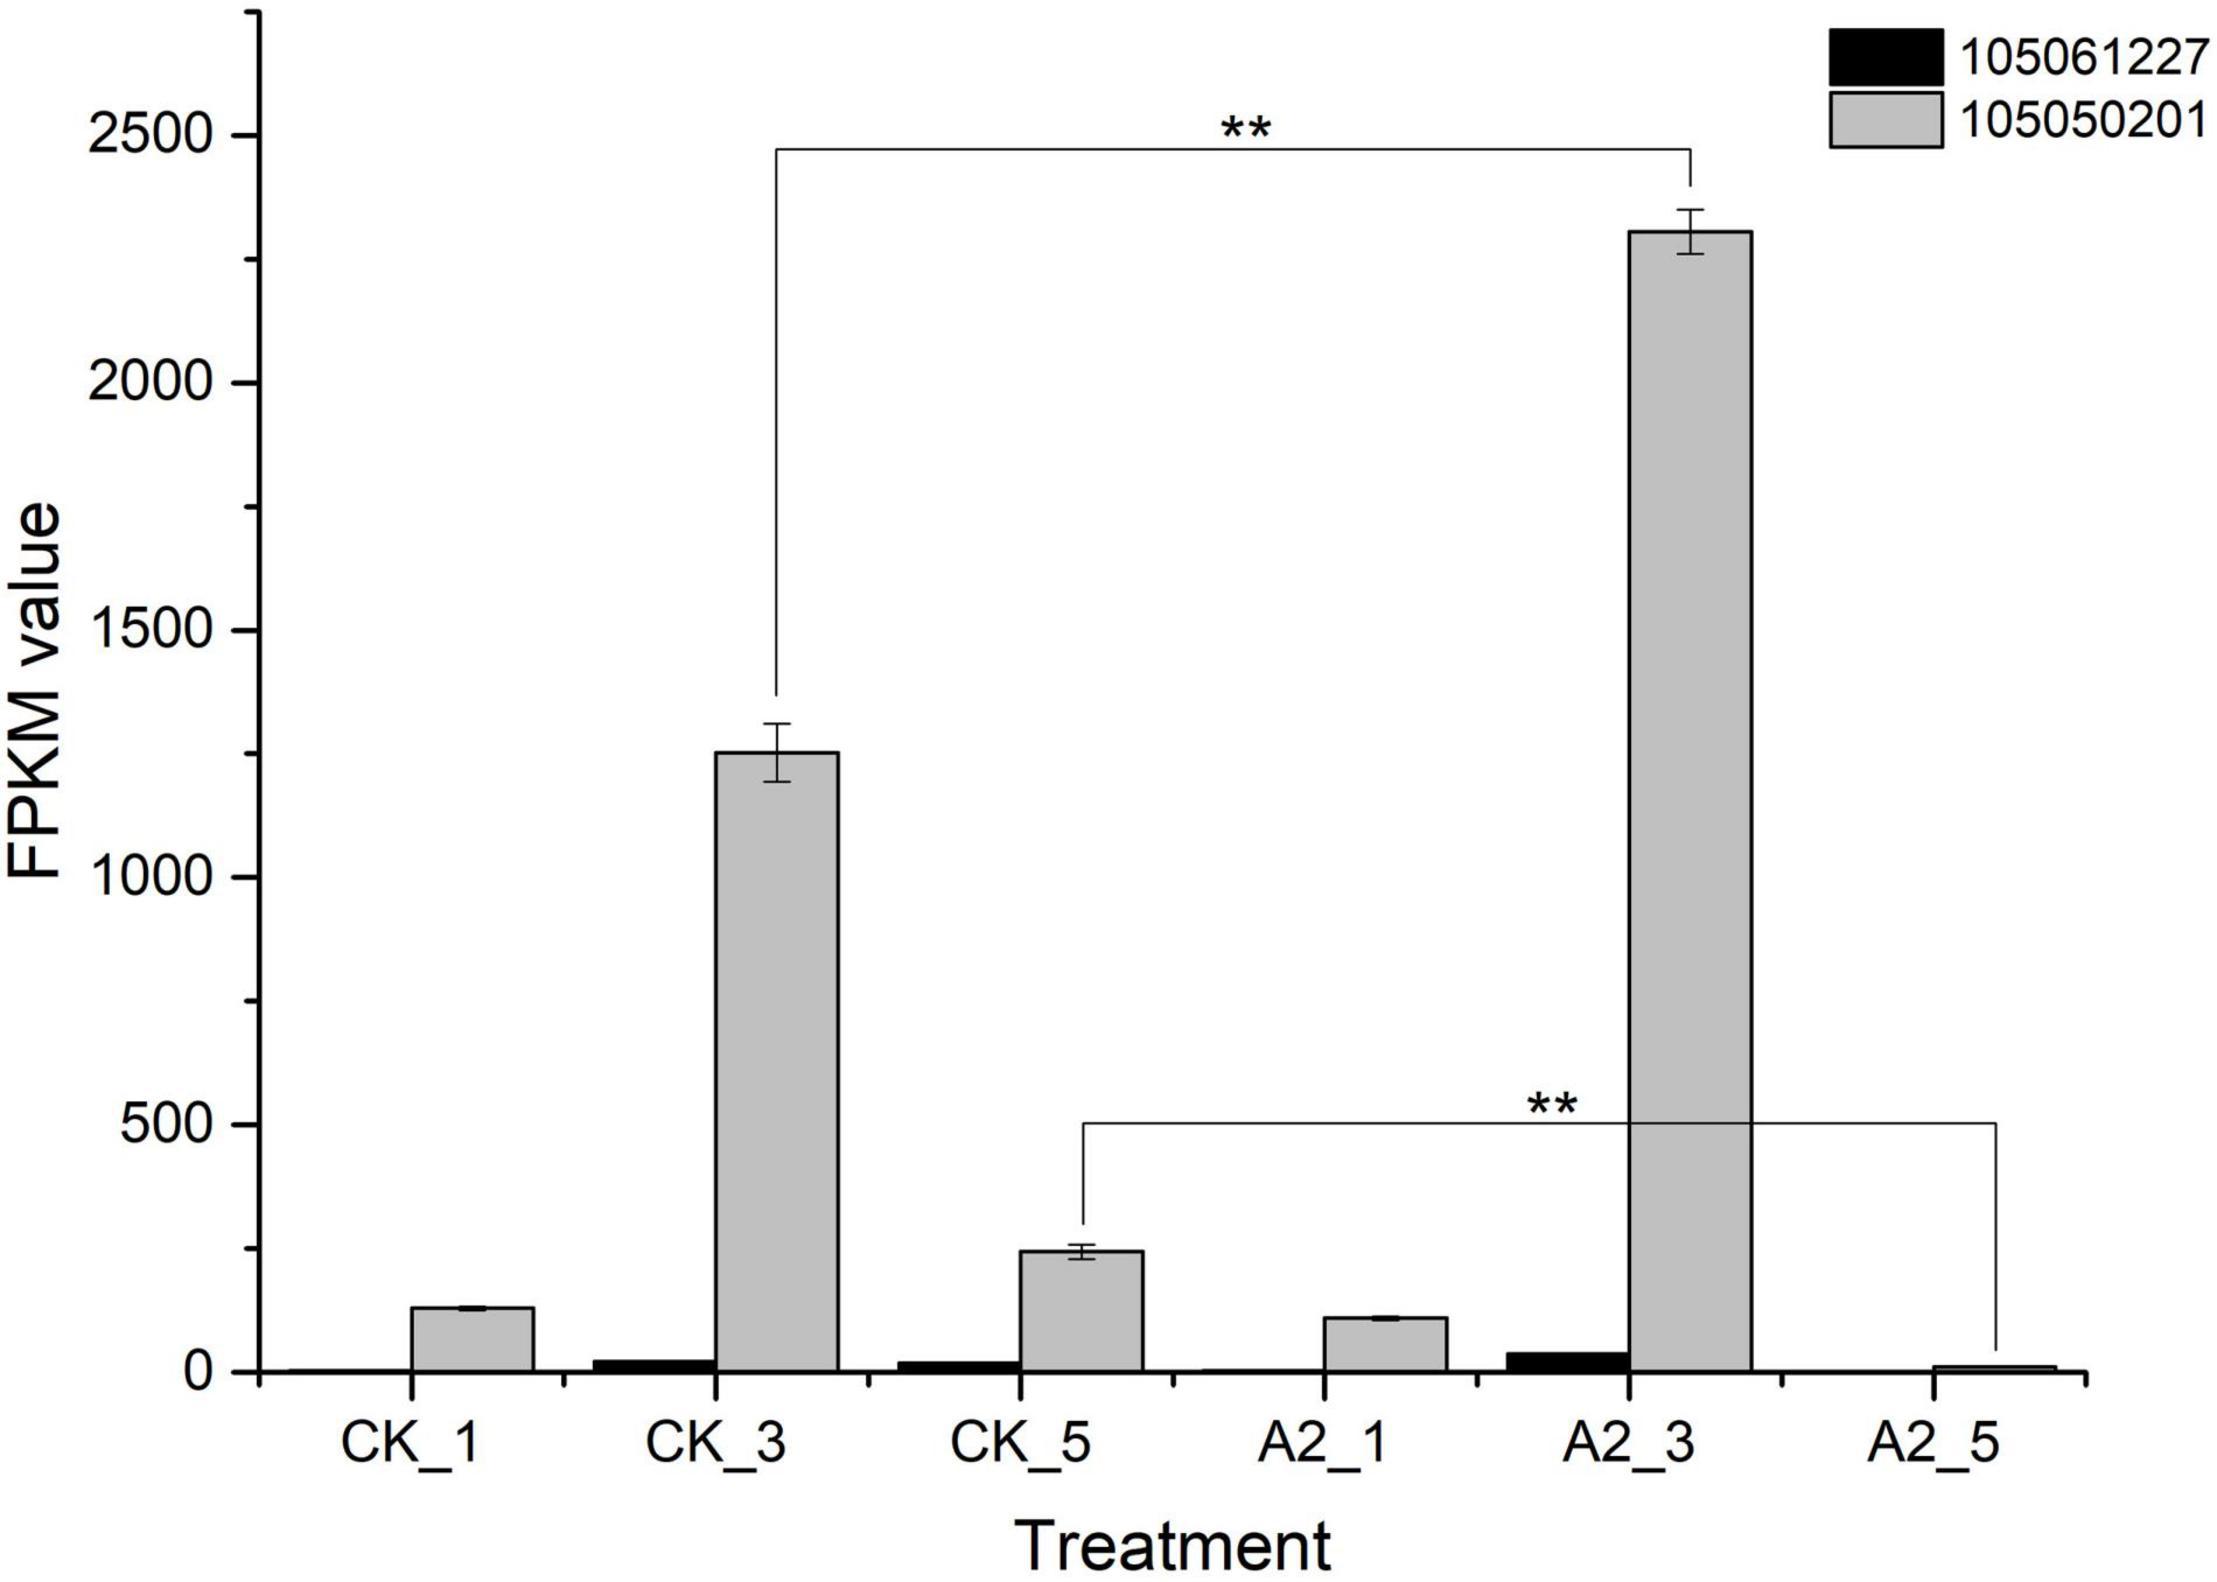
Figure 5. FAD2 expression in CK and A2. **Represents significance at p < 0.01. CK_1: 16 WAP with 0 μM ABA; CK_3: 20 WAP with 0 μM ABA; CK_5: 24 WAP with 0 μM ABA; A2_1: 16 WAP with 20 μM ABA; A2_3: 20 WAP with 20 μM ABA; A2_5: 24 WAP with 20 μM ABA.
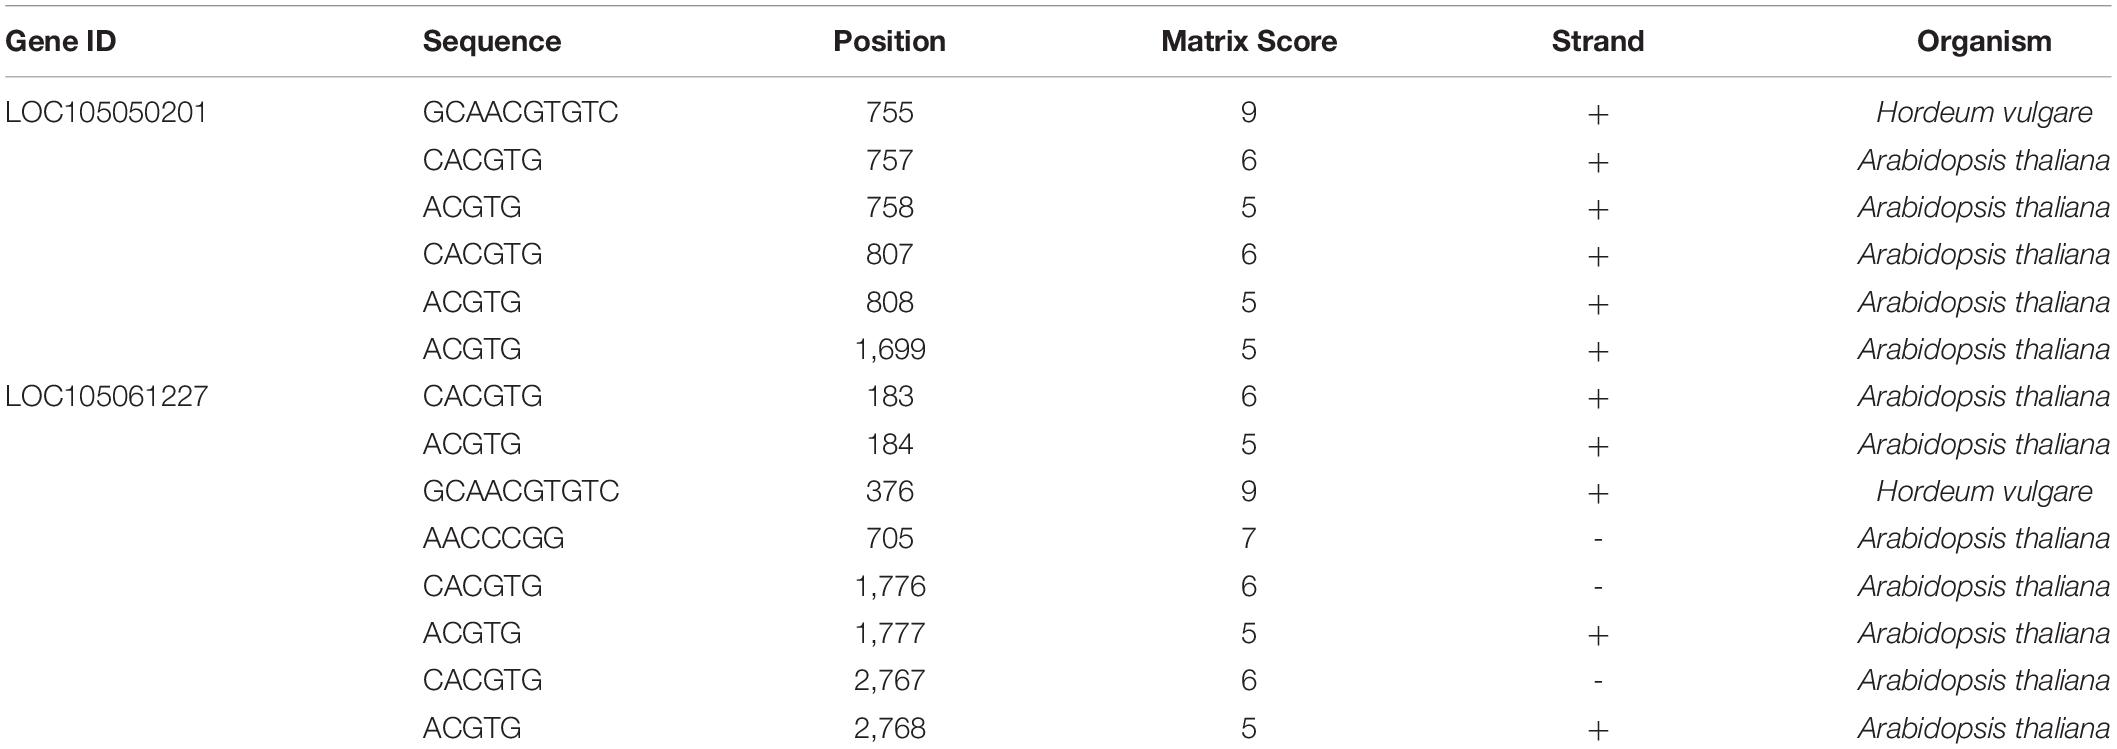
In order to investigate whether FAD2 could respond to an ABA signal, the abscisic acid responsiveness element (ABRE) was predicted using a promoter and the PlantCARE online tool. Results showed that the promoter of FAD2 had an ABRE cis-acting element. Unigene 105050201 had the highest expression level and had six ABRE motifs of the type “ACGTG” (Table 3). Similarly, unigene 105061227 had eight ABRE motifs.
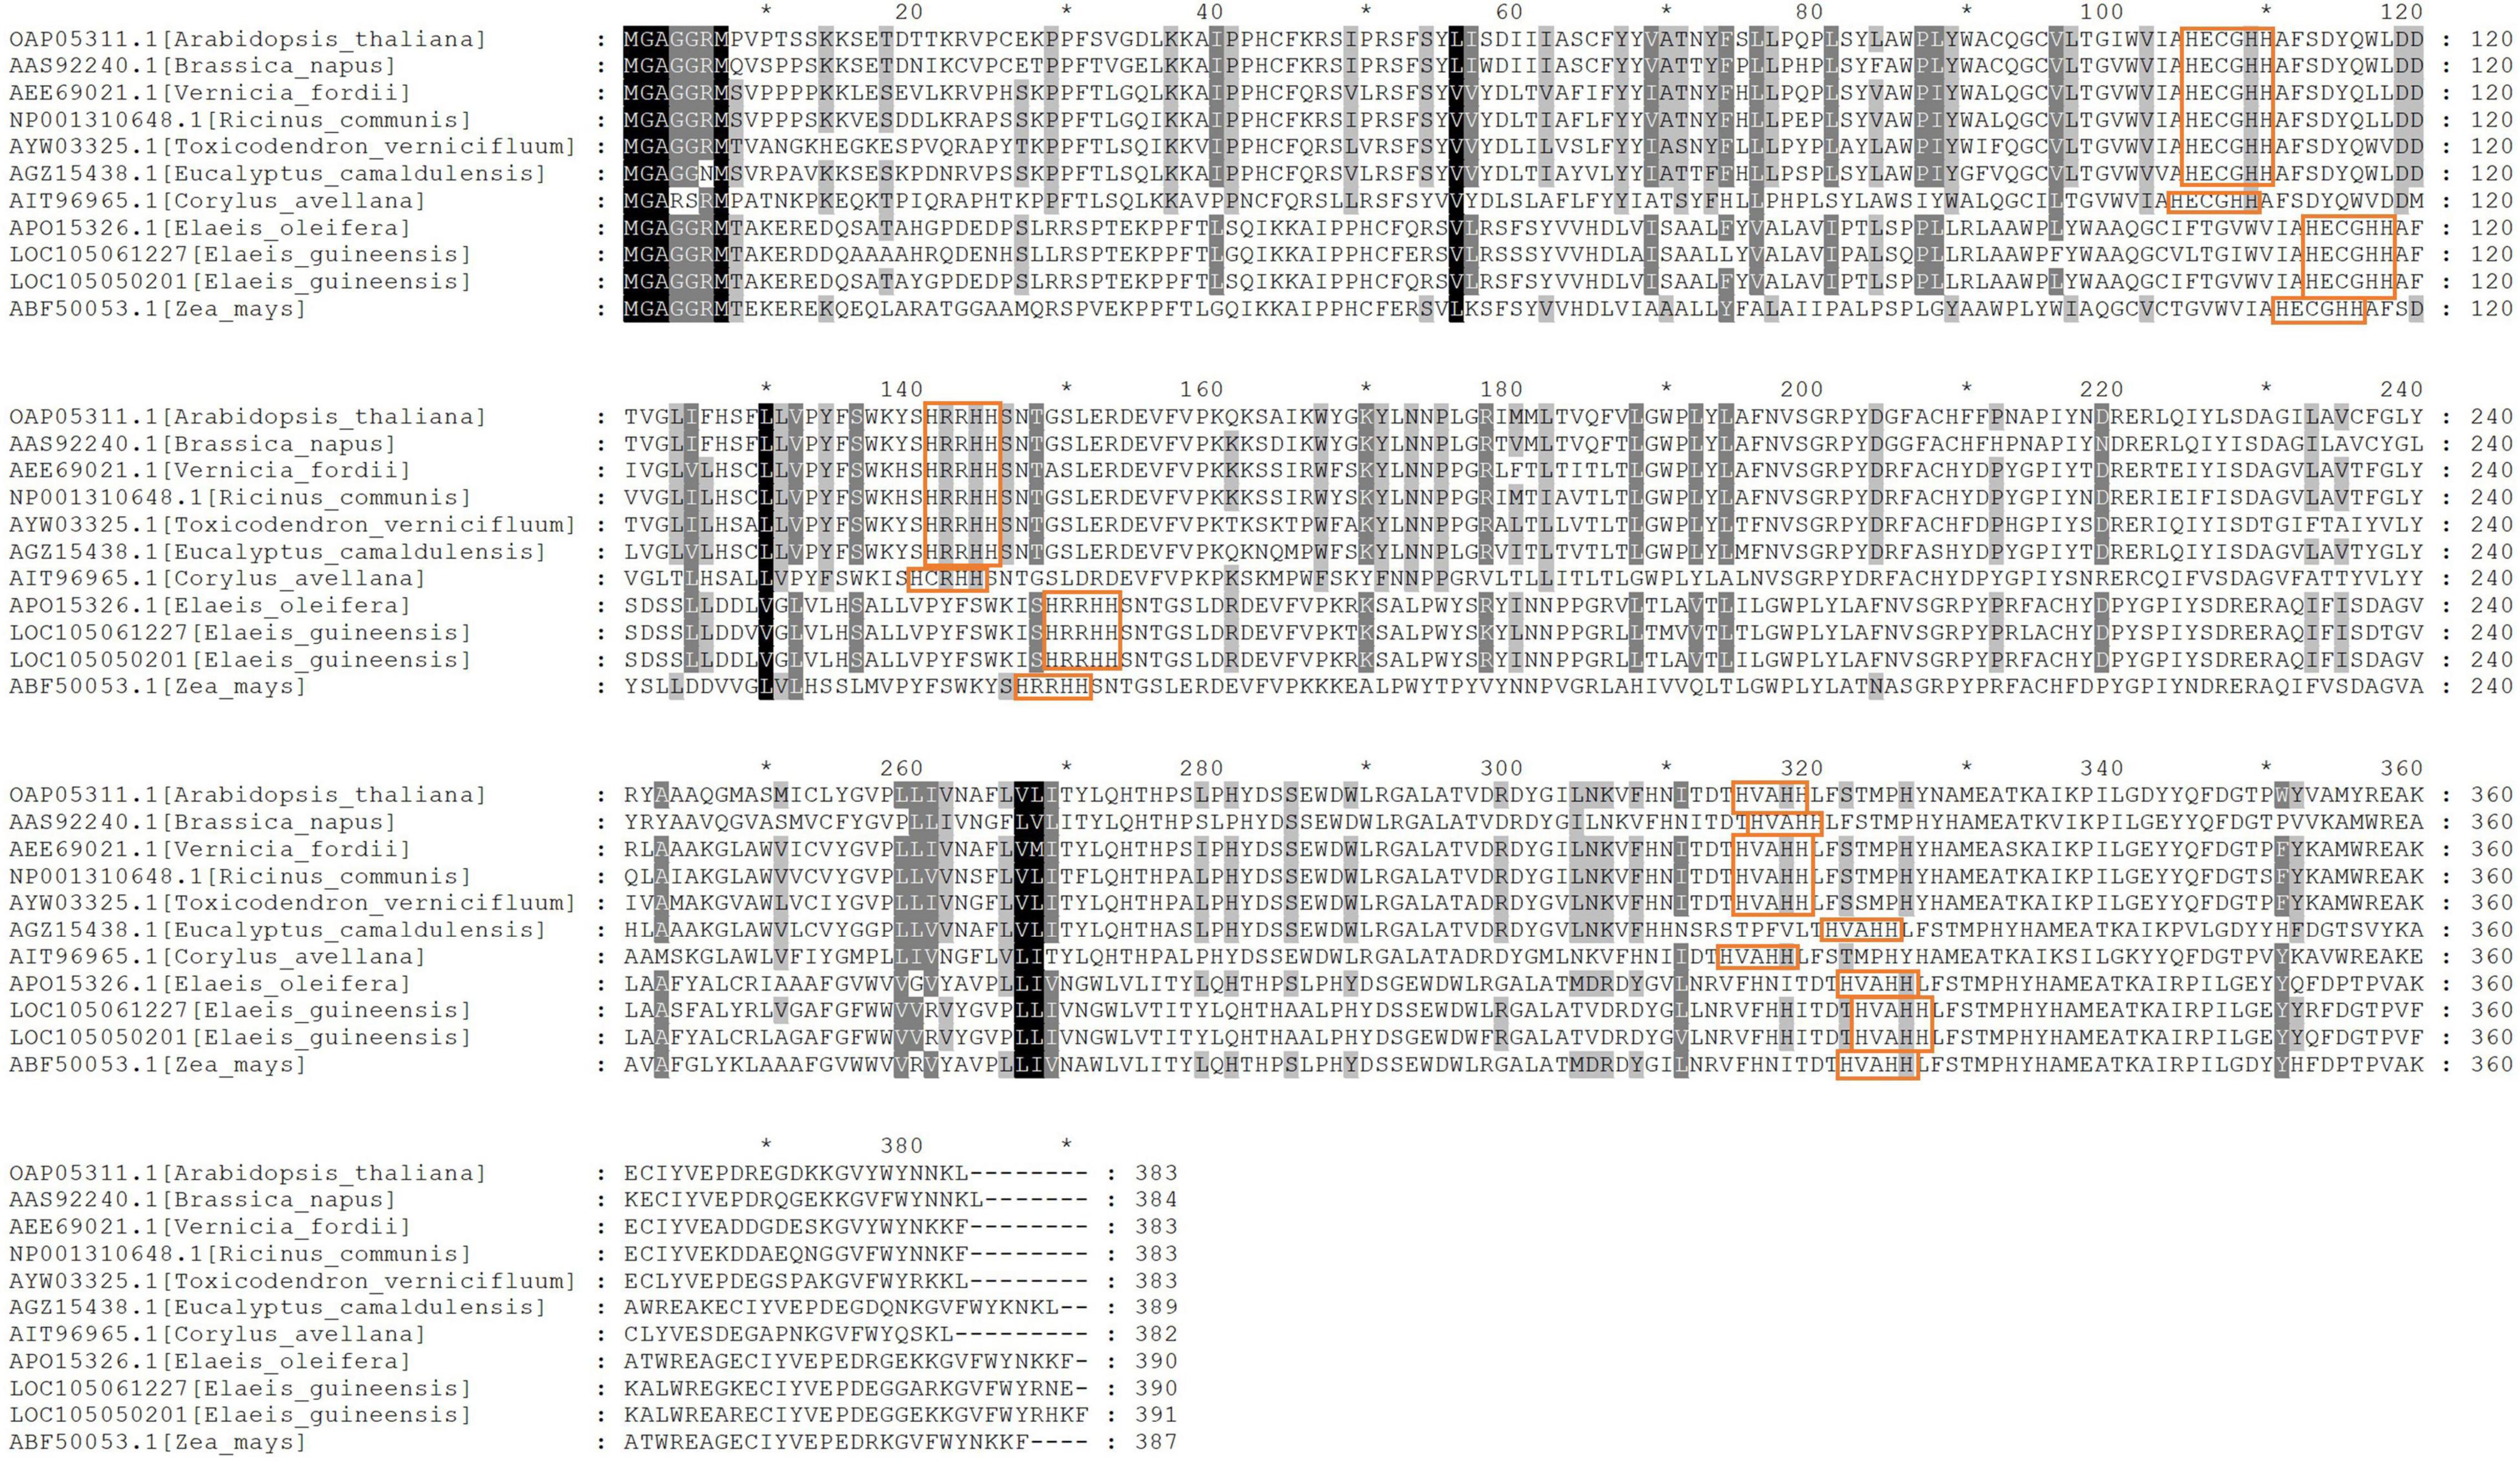
The sequence alignment analysis showed that AtFAD2 had 383 amino acid residues, and unigenes 105050201 and 105061227 had 390 and 391 residues, respectively (Figure 6). Three highly conserved histidine-rich motifs at EgFAD2 were included (HECGHH, HRRHH, and HVAHH). Meanwhile, unigenes 105050201 and 105061227 had complete histidine-rich motifs, and the lengths of protein sequences were similar to those of other species. The AtFAD2 protein can bind to endoplasmic reticulum because of the C-terminal signaling motif (YNNKL). Results showed that the C-terminal of unigene 105050201 was “YRHKF,” and, for unigene 105061227, it was “YRNE,” indicating that unigene 105050201 may also bind to endoplasmic reticulum.
In addition, the phylogenetic tree showed that unigenes 105061227 and 105050201 clustered together with American oil palm and maize FAD2. Results indicated that unigenes 105061227 and 105050201 had similar protein sequences (Supplementary Figure 3).
In conclusion, the promoter of unigene 105061227 had many ABRE motifs, and the protein sequence contained a complete histidine-rich domain, but the C-terminal lacked one resident compared to other organisms. A large number of ABRE motifs were found in the promoter region of unigene 105050201, and protein sequences contained complete histidine-rich domains, suggesting that expression of unigene 105050201 was upregulated in response to the ABA signal and thereby promoted linoleic acid synthesis.
Correlation Analysis Among FAD2, Transcription Factors, and Genes Involved in Fatty Acid Biosynthesis
To obtain a comprehensive understanding of genes that possibly play an important role in linoleic acid biosynthesis in oil palm during ABA treatments, weighted gene co-expression network analysis (WGCNA) was performed. After filtering the genes with a low expression (FPKM < 0.05), 1,348 genes were selected for WGCNA. Co-expression networks were constructed based on pairwise correlations of gene expression across all samples.
This analysis identified 11 distinct modules (Supplementary Figure 4A). The 11 modules were correlated with distinct samples according to sample-specific expression profiles. A total of 28 genes involved in fatty acid biosynthesis and ABA signal transduction were found in the WGCNA network (Supplementary Figure 4B). A total of 47 genes, including TFs, such as MYB, bZIP, and bHLH, were significantly correlated with PYR (Supplementary Figure 4C and Supplementary Table 9). These TFs were reported to play a role in response to ABA signaling (Cutler et al., 2010). WRI1 and FAD2 were in a small network (Supplementary Figure 4D). Moreover, promoters of PYR, PP2C, SnRK, ABI5, WRI1, AP2-EREBP, bZIP, C2C2-Dof, MYB, and NAC were also found to possess ABRE motifs (Supplementary File 1 and Supplementary Table 10).
In order to clarify the relationship between FAD2 and genes involved in fatty acid biosynthesis, ABA signaling transduction, and TFs, a total of 29 genes involved in fatty acid biosynthesis, ABA signaling transduction, and eight TFs were selected according to FPKM value > 10 for correlation analysis. The pairs significantly correlated (p < 0.05) were included in the network. FAD2 (unigene 105050201) was found to be significantly correlated with SnRK, ABI5, C2C2-Dof, and WRI1; and 19 genes were involved in fatty acid biosynthesis (Figure 7).
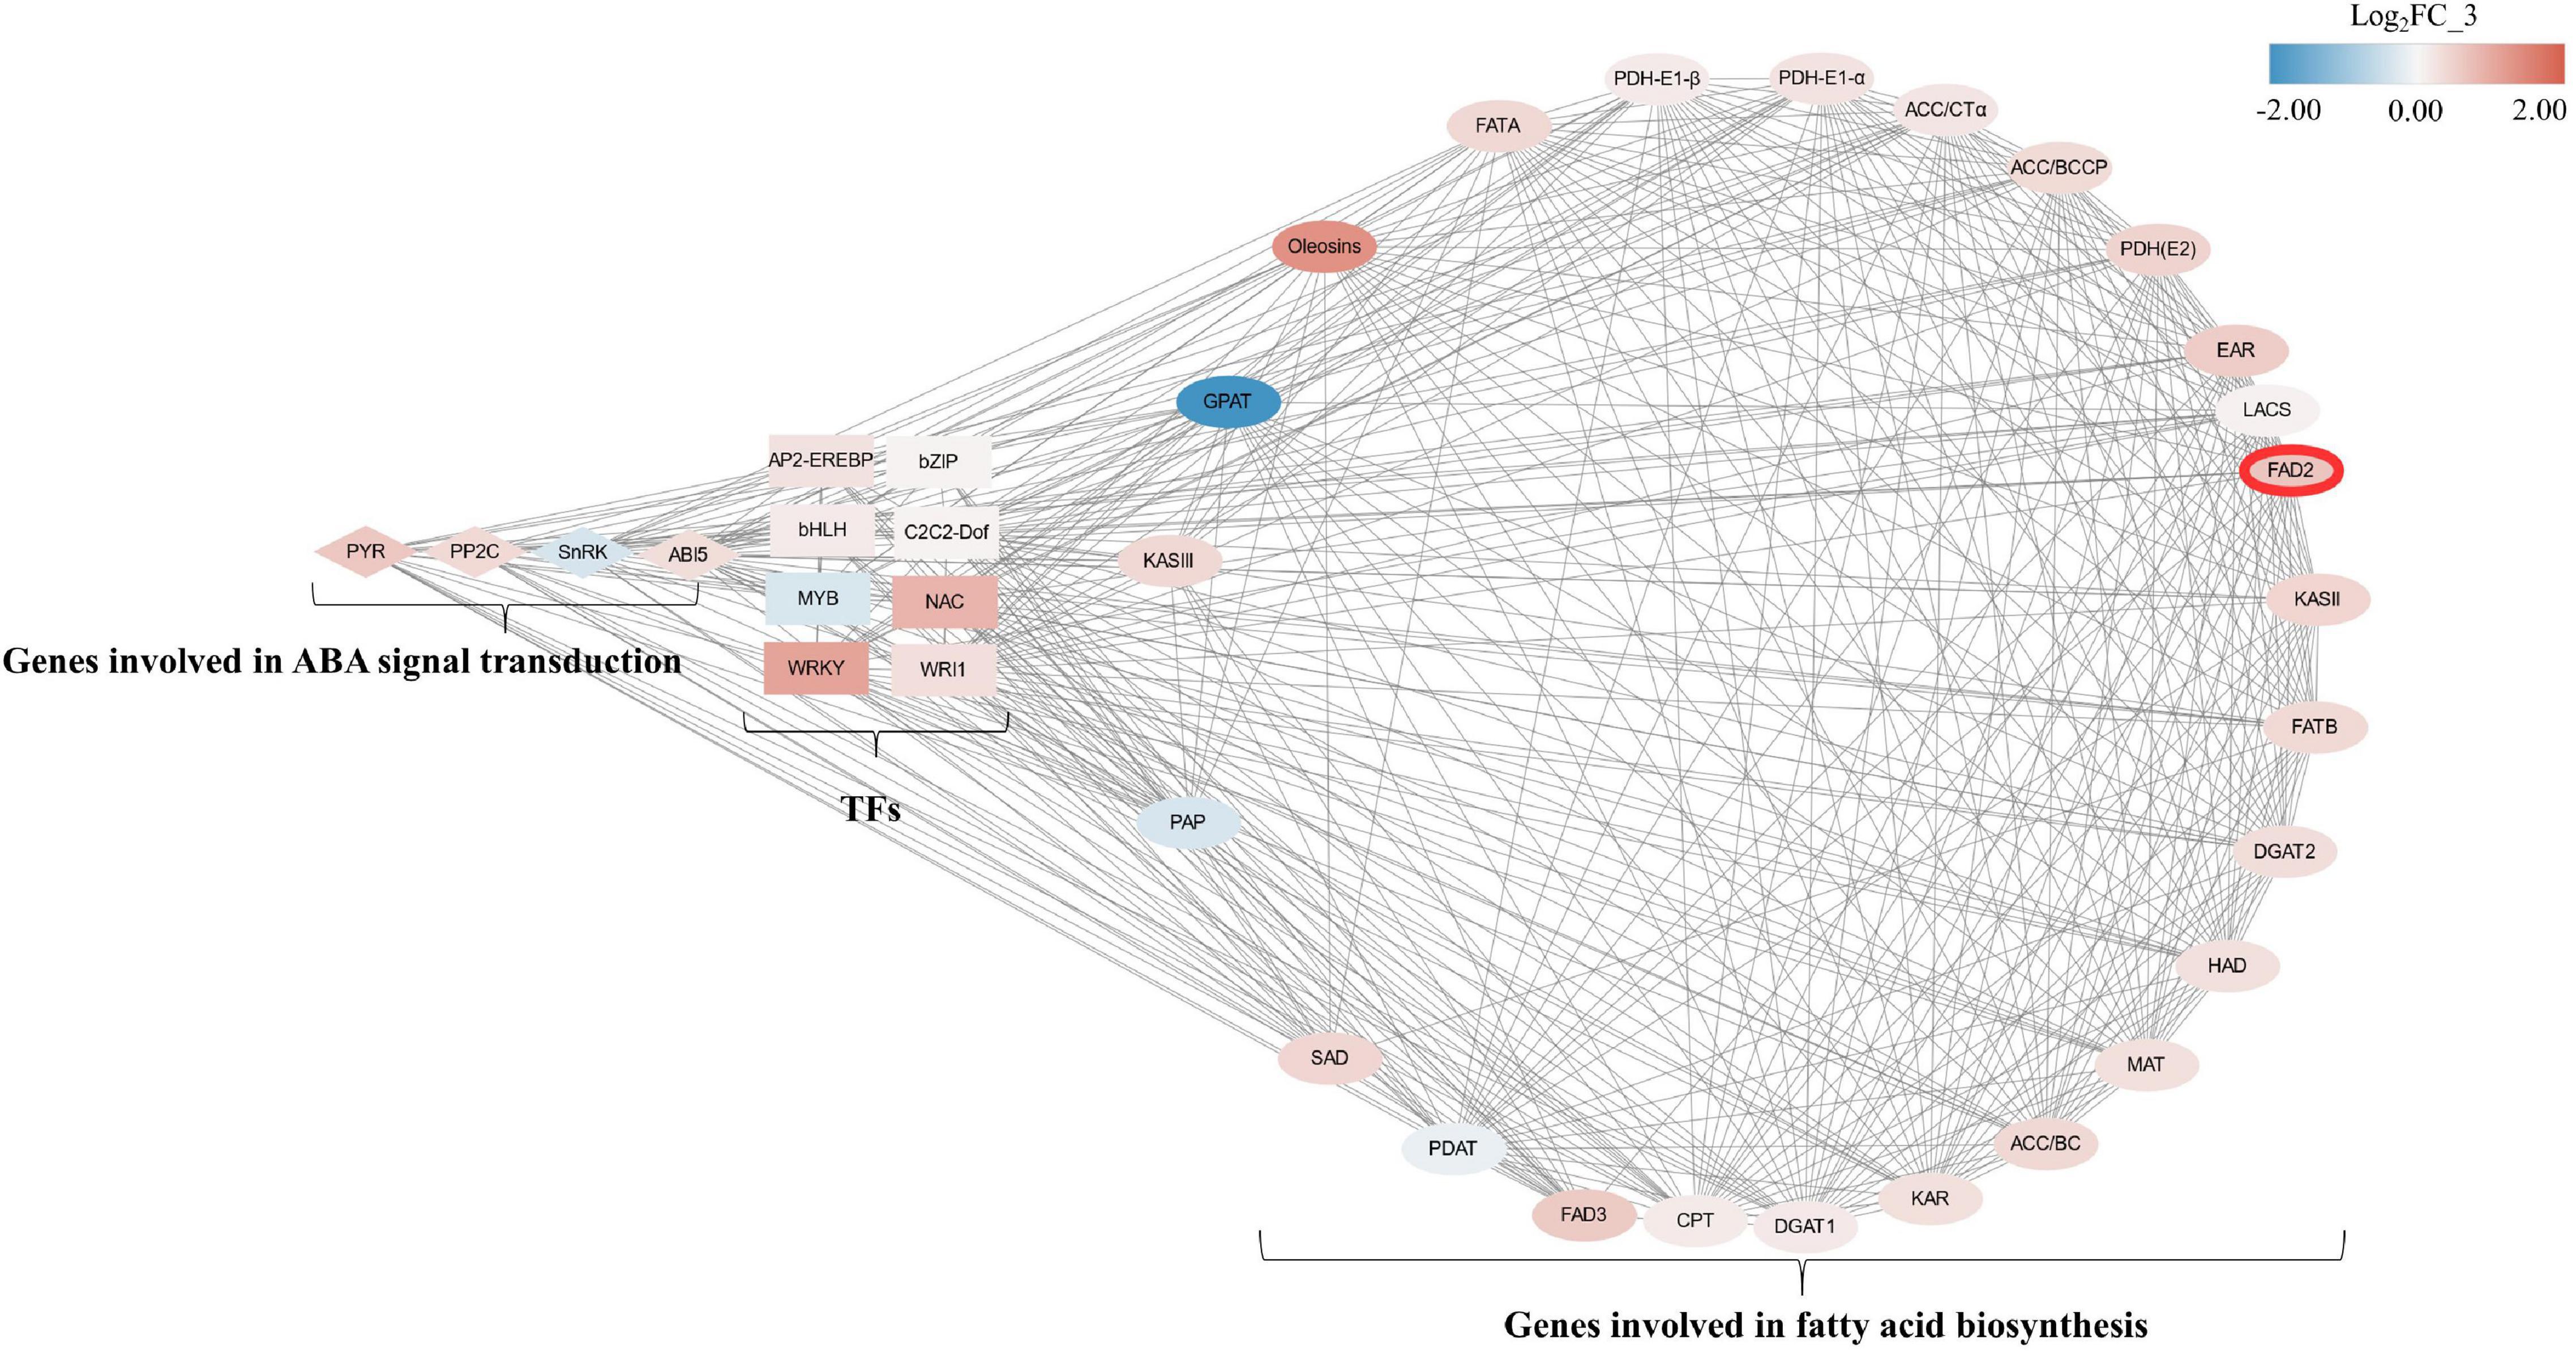
Figure 7. Correlation network of genes involving fatty acid biosynthesis, ABA-signaling transduction, and transcriptional factors between CK and A2 during mesocarp development. Ellipses, diamonds, and rectangles, respectively, represent genes involving fatty acid biosynthesis, ABA-signaling transduction, and transcriptional factors. Node fill color is according to log2FC of FPKM value in CK_3 vs. A2_3 from blue to red; TFs, transcriptional factors; PYR, pyrabactin resistance; PP2C, type 2C protein phosphatases; SnRK, Snf1-related protein kinase; ABI5, ABA insensitive 5; AP2-EREBP, APETALA2-ethylene responsive element-binding protein; bZIP, basic leucine zipper; bHLH, basic helix loop helix; C2C2-Dof, downstream of FGFR; MYB, myeloblastosis; NAC, nascent polypeptide-associated complex; WRKY, WRKY transcriptional factor; WRI1, WRINKLED1; KASIII, 3-ketoacyl-ACP synthase III; GPAT, glycerol-3-phosphate acyltransferase; FATA, fatty acid acyl-ACP thioesterase A; PDH-E1-β, subunit b of E1 component of PDH complex; PDH-E1-α, subunit α of E1 component of PDH complex; ACC/CTα, carboxyltransferase a-subunit of heteromeric ACCase; ACC/BCCP, biotin carboxyl-carrier protein of heteromeric ACCase; PDH(E2), E2 component of PDH complex; EAR, enoyl-ACP reductase; LACS, long-chain acyl-CoA synthetase; FAD2, ω-6 desaturase; KASII, 3-ketoacyl-ACP synthase II; FATB, fatty acid acyl-ACP thioesterase B; DGAT2, diacylglycerol acyltransferase 2, HAD, 3-hydroxyacyl-ACP dehydratase; MAT, malonyl-CoA: ACP transacylase; ACC/BC, biotin carboxylase subunit of heteromeric acetyl-CoA carboxylase; KAR, 3-ketoacyl-ACP reductase; DGAT1, diacylglycerol acyltransferase 1; CPT, CDP-choline: DAG cholinephosphotransferase; FAD3, ω-3 desaturase; PDAT, phospholipid: diacylglycerol acyltransferase; SAD, stearoyl-ACP desaturase; PAP, phosphatic acid phosphohydrolase.
Discussion
Polyunsaturated fatty acids are essential for human health but cannot be synthesized by the human body; however, they can be supplied via edible vegetable oils. Palm oil plants produce the largest supply of edible vegetable oil in the world. It would, therefore, be of great benefit to improve the unsaturated fatty acid content in oil palm mesocarps, which composes around 50%. Research shows that palmitic acid content is around 44% in the mesocarp, with oleic acid at 40% and linoleic acid at 10% (Barcelos et al., 2015). So, there is a large potential for increasing linoleic acid levels. While previous studies on other plant species show that ABA could enhance the accumulation of linoleic acid (Ju et al., 2016; Huo et al., 2020; Norlina et al., 2020), the effect of ABA on oil palm mesocarp is still unknown. Results in this study showed 20 μM ABA was found to significantly promote linoleic acid content in mesocarp compared to an untreated control. A similar effect was also observed in Cabernet Sauvignon (Vitis vinifera L.) grape skins when 200 and 600 mg⋅L–1 ABA was applied to the surface of grape berries (Ju et al., 2016). In order to investigate transcriptional changes between control and ABA-treated samples, RNA-Seq analysis was conducted.
Compared with CK_1 vs. A2_1, abundant DEGs were, respectively, identified in CK_3 vs. A2_3 and CK_5 vs. A2_5. Results indicated that the spraying of ABA altered the transcriptional levels of a large number of genes in oil palm mesocarps. Moreover, DEGs analysis showed that many genes involved in ABA signal transduction, TFs, and fatty acid biosynthesis were differentially expressed in CK_3 vs. A2_3 and CK_5 vs. A2_5, such as PYR, PP2C, SnRK, ABI5, AP2-EREBP, bZIP, C2C2-Dof, MYB, WRI1, FATA, FATB, LACS, GPAT, FAD2, DGAT2, PDAT, and Oleosins. At the same time, the expression level of genes involved in ABA biosynthesis and metabolism was also affected by exogenous ABA. The expression level of some genes involved in ABA biosynthesis was up and down, but the expression level of gene involved in ABA metabolism was up. It indicated that exogenous ABA could affect ABA biosynthesis and promote endogenous ABA metabolism in mesocarp. There was no obvious change pattern for genes involved in ABA biosynthesis, possibly because of a large number of endogenous ABA synthesis during development and ripening of fruits (Teh et al., 2014).
The content of linoleic acid increased significantly after exogenous ABA treatment, while other major fatty acid components almost unchanged. It indicated that linoleic acid biosynthesis was affected by exogenous ABA, so genes involved in linoleic acid biosynthesis were emphatically analyzed. FAD2 is reported as a key enzyme-controlling linoleic acid biosynthesis (Dussert et al., 2013; He et al., 2020; Wang et al., 2021); thus, two unigenes annotated as FAD2 were analyzed further. Of these two unigenes, expression levels of unigene 105050201 under A2_3 and A2_5 were significantly higher than CK_3 and CK_5, respectively, while unigene 105061227 still kept a low expression level. These results indicated that unigene 105050201 could respond to exogenous ABA. ABRE is an important element response to the ABA signal; ABA-responsive elements motif “ACGTC” was detected in the FAD2 promoter region, and FAD2 expression is known to be regulated by ABA (Kim et al., 2006; Xiao et al., 2014; Dar et al., 2017). Genes encoding the FAD2 enzyme contain eight conserved histidine residues in three clusters (HXXXH, HXXHH, and HXXHH) (Okuley et al., 1994). In the current study, similar ABRE motifs and histidine-rich motifs were found in unigene 105050201. Moreover, only unigene 105050201 had similar residents in the C-terminal as found in other organisms (Dehghan and Yarizade, 2014), indicating that unigene 105050201 may play a major role in promoting linoleic acid accumulation via response to the ABA signal.
In order to understand the possible mechanism of ABA-regulating linoleic acid biosynthesis, genes involved in ABA signal transduction and related TFs were further analyzed. Previous study found that ABA-signaling genes, such as PYR, PP2C, SnRK, and ABI5, could activate some TFs (bZIP, MYB, MYC, AP2, NAC, WRKY, and bHLH); these TFs subsequently activate the expression of downstream protein-coding genes (Kim et al., 2007; Cutler et al., 2010; Aleman et al., 2016). Our results showed many genes included in fatty acid biosynthesis and ABA signaling, such as PYR, ABI5, and WRI1 were increased significantly after ABA treatment, indicating their response to ABA (Supplementary Table 10).
A previous study shows that fatty acid biosynthesis is subjected to phytohormones, such as ABA, auxin, and jasmonic acid (JA) (Shahid et al., 2019). Linoleic acid, one of the most common unsaturated fatty acids, acts as a precursor of jasmonates and a regulator of stress signaling (He and Ding, 2020). Moreover, jasmonic acid also crosstalks with the ABA signaling pathway (Aleman et al., 2016; Yu et al., 2021). Previous research found that TFs play an important role in regulating fatty acid biosynthesis. For example, NF-YA3, NF-YC2, and ABI5 directly activate WRI1 and regulate fatty acid biosynthesis (Yeap et al., 2017). Furthermore, ABI5 is a bZIP type of TF involved in ABA signal transduction. As a member of AP2-EREBP, WRI1 also plays a key regulatory role in fatty acid biosynthesis within the oil palm mesocarp. In the current study, ABI5 and WRI1 were upregulated after ABA treatment. Moreover, ABRE motifs were detected in promoters of ABI5, WRI1, and FAD2, suggesting that these genes could respond to the ABA signal.
FAD2 expression has a high correlation with transcriptional factors, such as WRI1, Dof, and ABI5 (Deng et al., 2019; He and Ding, 2020). WGCNA is an effective tool for exploring relationships across genes involved in fatty acid biosynthesis (Niu et al., 2020; Ma et al., 2021). Correlation analysis also showed that EgFAD2 is co-expressed with these TFs, with several genes being involved in ABA signal transduction and fatty acid biosynthesis. These results suggested that the expression of EgFAD2 was upregulated as a response to ABA signaling, possibly resulting in increased accumulation of linoleic acid.
Under exogenous ABA treatment, content of linoleic acid increased and expression of ABA-signaling genes, TFs, and fatty acids biosynthesis genes upregulated. Therefore, we speculated that ABA activated TFs through ABA signal transduction (PYR, PP2C, SnRK, and ABI5), and then promoted expression levels of FAD2 or/and other fatty acids biosynthesis genes, resulting in increased accumulation of linoleic acid (Figure 8). Needless to say, further research is still required regarding the molecular mechanism by which ABA regulates linoleic acid biosynthesis; this can be extended from the current findings. Further experiments should be conducted to identify the upstream regulation factors of FAD2 or other fatty acids biosynthesis genes, such as electrophoretic mobility shift assays, yeast one-hybrid and yeast two-hybrid assays, and ChIP-seq.
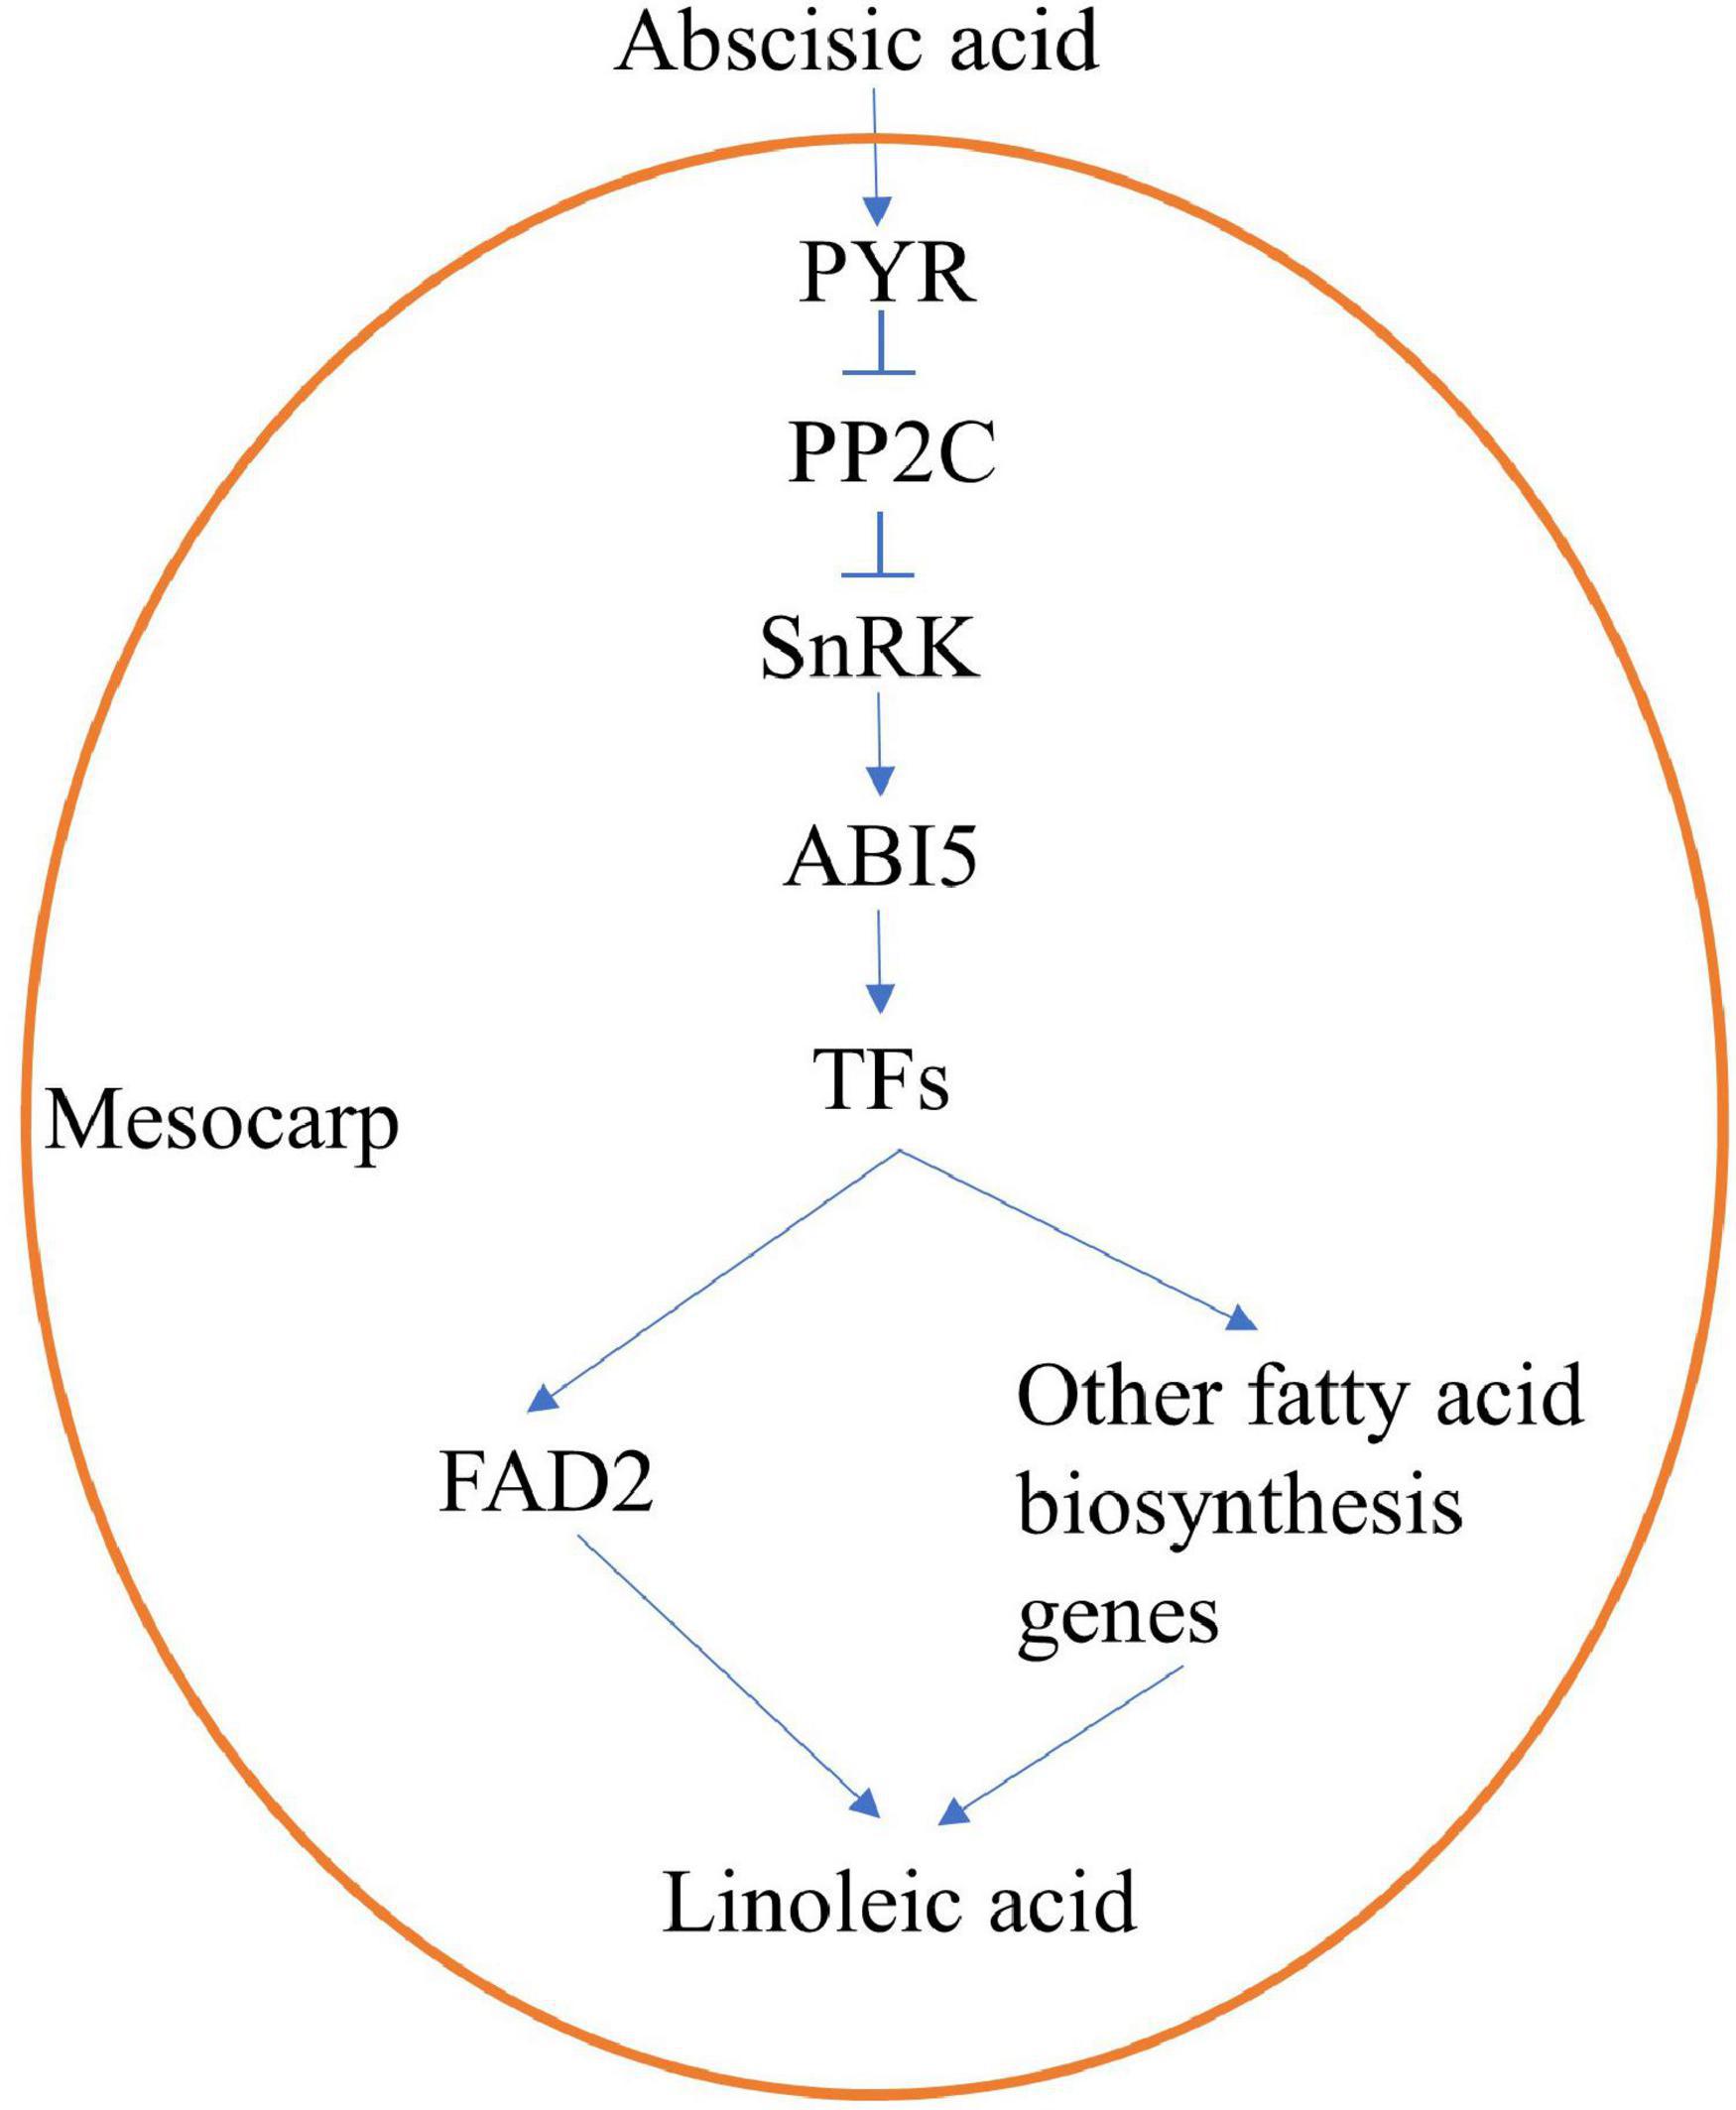
Figure 8. An speculative regulation mechanism of ABA-promoting linoleic acid biosynthesis in oil palm mesocarp.
Data Availability Statement
The datasets presented in this study can be found in online repositories. The names of the repository/repositories and accession number(s) can be found at: https://www.ncbi.nlm.nih.gov/, PRJNA719677.
Author Contributions
PS and WH directed the project and wrote the manuscript. DZ and YH performed data analysis and revised the manuscript. YW and JL supervised this work and revised the manuscript. All authors read and approved the final manuscript.
Funding
This work was supported by the Open Project of Key Laboratory of Biology and Genetic Improvement of Oil Crops, Ministry of Agriculture and Rural Affairs, P.R. China (KF2019007), the Natural Science Foundation Project of Hainan Province (319QN323), and the Central Public-interest Scientific Institution Basal Research Fund for Chinese Academy of Tropical Agricultural Sciences (17CXTD-13).
Conflict of Interest
The authors declare that the research was conducted in the absence of any commercial or financial relationships that could be construed as a potential conflict of interest.
Publisher’s Note
All claims expressed in this article are solely those of the authors and do not necessarily represent those of their affiliated organizations, or those of the publisher, the editors and the reviewers. Any product that may be evaluated in this article, or claim that may be made by its manufacturer, is not guaranteed or endorsed by the publisher.
Acknowledgments
We are most grateful to the Germplasm Nursery for Tropical palms and the Scientific Observation and Experiment Station of Tropical oil crops of the Ministry of Agriculture and Rural affairs of China for providing oil palm materials.
Supplementary Material
The Supplementary Material for this article can be found online at: https://www.frontiersin.org/articles/10.3389/fpls.2021.748130/full#supplementary-material
Footnotes
- ^ https://www.ncbi.nlm.nih.gov/assembly/GCF_000442705.1
- ^ https://www.ncbi.nlm.nih.gov/
- ^ http://bioinformatics.psb.ugent.be/webtools/plantcare/html/
- ^ https://www.ncbi.nlm.nih.gov/genome/2669
References
Aleman, F., Yazaki, J., Lee, M., Takahashi, Y., Kim, A. Y., Li, Z., et al. (2016). An ABA-increased interaction of the PYL6 ABA receptor with MYC2 Transcription Factor: a putative link of ABA and JA signaling. Sci. Rep. 6:28941. doi: 10.1038/srep28941
Barcelos, E., Rios, S. A., Cunha, R. N., Lopes, R., Motoike, S. Y., Babiychuk, E., et al. (2015). Oil palm natural diversity and the potential for yield improvement. Front. Plant. Sci. 6:190. doi: 10.3389/fpls.2015.00190
Cutler, S. R., Rodriguez, P. L., Finkelstein, R. R., and Abrams, S. R. (2010). Abscisic acid: emergence of a core signaling network. Annu. Rev. Plant Biol. 61, 651–679. doi: 10.1146/annurev-arplant-042809-112122
Dar, A. A., Choudhury, A. R., Kancharla, P. K., and Arumugam, N. (2017). The FAD2 gene in plants: occurrence, regulation, and role. Front. Plant Sci. 8:1789. doi: 10.3389/fpls.2017.01789
Dehghan, N. F., and Yarizade, K. (2014). Bioinformatics study of delta-12 fatty acid desaturase 2 (FAD2) gene in oilseeds. Mol. Biol. Rep. 41, 5077–5087. doi: 10.1007/s11033-014-3373-5
Deng, S., Mai, Y., Shui, L., and Niu, J. (2019). WRINKLED1 transcription factor orchestrates the regulation of carbon partitioning for C18:1 (oleic acid) accumulation in Siberian apricot kernel. Sci. Rep. 9:2693. doi: 10.1038/s41598-019-39236-9
Dussert, S., Guerin, C., Andersson, M., Joët, T., Tranbarger, T. J., Pizot, M., et al. (2013). Comparative transcriptome analysis of three oil palm fruit and seed tissues that differ in oil content and fatty acid composition. Plant Physiol. 162, 1337–1358. doi: 10.1104/pp.113.220525
He, M., and Ding, N. Z. (2020). Plant unsaturated fatty acids: multiple roles in stress response. Front. Plant Sci. 11:562785. doi: 10.3389/fpls.2020.562785
He, M., Qin, C. X., Wang, X., and Ding, N. Z. (2020). Plant unsaturated fatty acids: biosynthesis and regulation. Front. Plant Sci. 11:390. doi: 10.3389/fpls.2020.00390
Huo, K., Shui, L., Mai, Y., Zhou, N., Liu, Y., Zhang, C., et al. (2020). Effects of exogenous abscisic acid on oil content, fatty acid composition, biodiesel properties and lipid components in developing Siberian apricot (Prunus sibirica) seeds. Plant Physiol. Biochem. 154, 260–267. doi: 10.1016/j.plaphy.2020.06.020
Ju, Y. L., Liu, M., Zhao, H., Meng, J. F., and Fang, Y. L. (2016). Effect of exogenous abscisic acid and methyl jasmonate on anthocyanin composition, fatty acids, and volatile compounds of cabernet sauvignon (Vitis vinifera L.) grape berries. Molecules 21:1354. doi: 10.3390/molecules21101354
Kim, D., Langmead, B., and Salzberg, S. L. (2015). HISAT: a fast spliced aligner with low memory requirements. Nat. Methods 12, 357–360. doi: 10.1038/nmeth.3317
Kim, M. J., Kim, H., Shin, J. S., Chung, C. H., Ohlrogge, J. B., and Suh, M. C. (2006). Seed-specific expression of sesame microsomal oleic acid desaturase is controlled by combinatorial properties between negative cis-regulatory elements in the SeFAD2 promoter and enhancers in the 5’-UTR intron. Mol. Genet. Genomics 276, 351–368. doi: 10.1007/s00438-006-0148-2
Kim, M. J., Kim, J. K., Shin, J. S., and Suh, M. C. (2007). The SebHLH transcription factor mediates trans-activation of the SeFAD2 gene promoter through binding to E- and G-box elements. Plant Mol. Biol. 64, 453–466. doi: 10.1007/s11103-007-9165-8
Kumar, S., Stecher, G., Li, M., Knyaz, C., and Tamura, K. (2018). MEGA X: molecular evolutionary genetics analysis across computing platforms. Mol. Biol. Evol. 35, 1547–1549. doi: 10.1093/molbev/msy096
Langmead, B., and Salzberg, S. L. (2012). Fast gapped-read alignment with Bowtie 2. Nat. Methods 9, 357–359. doi: 10.1038/nmeth.1923
Li, B., and Dewey, C. N. (2011). RSEM: accurate transcript quantification from RNA-Seq data with or without a reference genome. BMC Bioinform. 12:323. doi: 10.1186/1471-2105-12-323
Li, R., Li, Y., Kristiansen, K., and Wang, J. (2008). SOAP: short oligonucleotide alignment program. Bioinformatics 24, 713–714. doi: 10.1093/bioinformatics/btn025
Love, M. I., Huber, W., and Anders, S. (2014). Moderated estimation of fold change and dispersion for RNA-seq data with DESeq2. Genome Biol. 15:550. doi: 10.1186/s13059-014-0550-8
Ma, L., Cheng, X., Wang, C., Zhang, X., Xue, F., Li, Y., et al. (2021). Explore the gene network regulating the composition of fatty acids in cottonseed. BMC Plant Biol. 21:177. doi: 10.1186/s12870-021-02952-4
Niu, Y., Wu, L., Li, Y., Huang, H., Qian, M., Sun, W., et al. (2020). Deciphering the transcriptional regulatory networks that control size, color, and oil content in Brassica rapaseeds. Biotechnol. Biofuels 13:90. doi: 10.1186/s13068-020-01728-6
Norlina, R., Norashikin, M. N., Loh, S. H., Aziz, A., and Cha, T. S. (2020). Exogenous abscisic acid supplementation at early stationary growth phase triggers changes in the regulation of fatty acid biosynthesis in Chlorella vulgaris UMT-M1. Appl. Biochem. Biotechnol. 191, 1653–1669. doi: 10.1007/s12010-020-03312-y
Okuley, J., Lightner, J., Feldmann, K., Yadav, N., Lark, E., and Browse, J. (1994). Arabidopsis FAD2 gene encodes the enzyme that is essential for polyunsaturated lipid synthesis. Plant Cell 6, 147–158. doi: 10.1105/tpc.6.1.147
Shahid, M., Cai, G., Zu, F., Zhao, Q., Qasim, M. U., Hong, Y., et al. (2019). Comparative transcriptome analysis of developing seeds and silique wall reveals dynamic transcription networks for effective oil production in Brassica napus L. Int. J. Mol. Sci. 20:1982. doi: 10.3390/ijms20081982
Teh, H. F., Neoh, B. K., Wong, Y. C., Kwong, Q. B., Ooi, T. E., Ng, T. L., et al. (2014). Hormones, polyamines, and cell wall metabolism during oil palm fruit mesocarp development and ripening. J. Agric. Food Chem. 62, 8143–8152. doi: 10.1021/jf500975h
Wang, J. J., Liu, Z. J., Liu, H., Peng, D. S., Zhang, J. P., and Chen, M. X. (2021). Linum usitatissimum FAD2A and FAD3A enhance seed polyunsaturated fatty acid accumulation and seedling cold tolerance in Arabidopsis thaliana. Plant Sci. 311:111014. doi: 10.1016/j.plantsci.2021.111014
Xiao, G., Zhang, Z. Q., Yin, C. F., Liu, R. Y., Wu, X. M., Tan, T. L., et al. (2014). Characterization of the promoter and 5’-UTR intron of oleic acid desaturase (FAD2) gene in Brassica napus. Gene 545, 45–55. doi: 10.1016/j.gene.2014.05.008
Yeap, W. C., Lee, F. C., Shabari, S. D. K., Musa, H., Appleton, D. R., and Kulaveerasingam, H. (2017). WRI1-1, ABI5, NF-YA3 and NF-YC2 increase oil biosynthesis in coordination with hormonal signaling during fruit development in oil palm. Plant J. 91, 97–113. doi: 10.1111/tpj.13549
Yu, Q., Hua, X. Y., Yao, H., Zhang, Q., He, J., Peng, L., et al. (2021). Abscisic acid receptors are involves in the Jasmonate signaling in Arabidopsis. Plant Signal. Behav. 16:1948243. doi: 10.1080/15592324.2021.1948243
Keywords: oil palm, linoleic acid, abscisic acid, FAD2, ABRE motif
Citation: Shi P, Hua W, Htwe YM, Zhang D, Li J and Wang Y (2021) Abscisic Acid Improves Linoleic Acid Accumulation Possibly by Promoting Expression of EgFAD2 and Other Fatty Acid Biosynthesis Genes in Oil Palm Mesocarp. Front. Plant Sci. 12:748130. doi: 10.3389/fpls.2021.748130
Received: 27 July 2021; Accepted: 29 October 2021;
Published: 03 December 2021.
Edited by:
Dongdong Li, Hainan University, ChinaReviewed by:
Enrique Martinez Force, Instituto de la Grasa (IG), SpainZhou Kaibing, Hainan University, China
Copyright © 2021 Shi, Hua, Htwe, Zhang, Li and Wang. This is an open-access article distributed under the terms of the Creative Commons Attribution License (CC BY). The use, distribution or reproduction in other forums is permitted, provided the original author(s) and the copyright owner(s) are credited and that the original publication in this journal is cited, in accordance with accepted academic practice. No use, distribution or reproduction is permitted which does not comply with these terms.
*Correspondence: Jun Li, bGlqdW5Ab2lsY3JvcHMuY24=; Yong Wang, RWxhZWlzQGNhdGFzLmNu
 Peng Shi
 Wei Hua
 Yin Min Htwe
 Dapeng Zhang
 Jun Li
 Yong Wang
