
94% of researchers rate our articles as excellent or good
Learn more about the work of our research integrity team to safeguard the quality of each article we publish.
Find out more
ORIGINAL RESEARCH article
Front. Plant Sci., 01 October 2021
Sec. Plant Abiotic Stress
Volume 12 - 2021 | https://doi.org/10.3389/fpls.2021.727374
This article is part of the Research TopicPhotosynthesis in a Changing Global Climate: a Matter of Scale, Volume IIView all 5 articles
 Huixing Kang1
 Ting Zhu1
 Yan Zhang1
 Xinran Ke1
 Wenjuan Sun2
 Zhenghua Hu3
 Xinguang Zhu4
 Haihua Shen2
 Yao Huang2
 Yanhong Tang1*
Crops developed under elevated carbon dioxide (eCO2) exhibit enhanced leaf photosynthesis under steady states. However, little is known about the effect of eCO2 on dynamic photosynthesis and the relative contribution of the short-term (substrate) and long-term (acclimation) effects of eCO2. We grew an Oryza sativa japonica cultivar and a Triticum aestivum cultivar under 400 μmol CO2 mol−1 air (ambient, A) and 600 μmol CO2 mol−1 air (elevated, E). Regardless of growth [CO2], the photosynthetic responses to the sudden increase and decrease in light intensity were characterized under 400 (a) or 600 μmol CO2 mol−1 air (e). The Aa1, Ae2, Ea3, and Ee4 treatments were employed to quantify the acclimation effect (Ae vs. Ee and Aa vs. Ea) and substrate effect (Aa vs. Ae and Ea vs. Ee). In comparison with the Aa treatment, both the steady-state photosynthetic rate (PN) and induction state (IS) were higher under the Ae and Ee treatments but lower under the Ea treatment in both species. However, IS reached at the 60 sec after the increase in light intensity, the time required for photosynthetic induction, and induction efficiency under Ae and Ee treatment did not differ significantly from those under Aa treatment. The substrate effect increased the accumulative carbon gain (ACG) during photosynthetic induction by 45.5% in rice and by 39.3% in wheat, whereas the acclimation effect decreased the ACG by 18.3% in rice but increased it by 7.5% in wheat. Thus, eCO2, either during growth or at measurement, enhances the dynamic photosynthetic carbon gain in both crop species. This indicates that photosynthetic carbon loss due to an induction limitation may be reduced in the future, under a high-CO2 world.
According to IPCC (2014), “the atmospheric CO2 concentration is projected to reach beyond 550 μmol CO2 mol−1 air by 2100 under high emissions scenarios.” increase in atmospheric CO2 has been reported to enhance photosynthesis under constant light conditions, i.e., steady-state photosynthesis (Ainsworth and Long, 2005; Ainsworth and Rogers, 2007). However, terrestrial plants in natural environments are exposed to fluctuating light (Pearcy, 1983; Tang et al., 1988; Pearcy et al., 1990), which increases leaf carbon gain more than steady light under long-term exposure to elevated CO2 (eCO2) (Leakey et al., 2002). Thus, knowledge about photosynthetic responses to fluctuating light, i.e., dynamic photosynthesis, at eCO2 conditions helps improve our understanding of the future global carbon flux.
Plasticity in photosynthesis in response to long-term eCO2 can be attributed to the short-term (substrate) effect, long-term (acclimation) effect, or both. The substrate effect is related to increased CO2 supply, which is reported to enhance dynamic photosynthesis greatly (Tomimatsu and Tang, 2012; Tomimatsu et al., 2014, 2019; Kaiser et al., 2017b). The acclimation effect is related to variations in leaf morphological, anatomical, and biochemical traits, but little information is known about its role and relative contribution.
The activation of Calvin-Benson cycle enzymes and stomatal opening regulate the photosynthetic response to a sudden increase in light intensity (Way and Pearcy, 2012; Kaiser et al., 2015) and are affected by variations in leaf chemical and morphological traits. Leaves exposed to long-term eCO2 have a lower Rubisco activase (Rca) content (Geiger et al., 1999; Aranjuelo et al., 2011; Tomimatsu et al., 2019) and develop small stomata (Maherali et al., 2002; Zhu et al., 2018; Zheng et al., 2019). The rate of Rubisco activation is proportional to Rca content (Woodrow and Mott, 1989; Yamori et al., 2012). Stomatal morphology affects the stomatal opening kinetics in some species (Drake et al., 2013; Kardiman and Ræbild, 2018; Zhang et al., 2019), although contradictory evidence has also been reported (Elliott-Kingston et al., 2016; McAusland et al., 2016). Whether and how acclimation to eCO2 affects dynamic photosynthesis remains untested.
All studies listed in Table 1 have investigated woody species, except for one study on C4 grass (Knapp et al., 1994). Rice and wheat are important for the global population as direct sources of food (FAO, 2016); yet, there are no available reports on the effect of long-term eCO2 on dynamic photosynthesis in rice, wheat, or any other C3 crop plants. The light environments for crop plants are characterized by long periods of sunlight punctuated by shadeflecks (Pearcy et al., 1990), whereas those for within-canopy woody plants are characterized by long periods of diffuse light punctuated by sunflecks (Tang et al., 1988; Chazdon and Pearcy, 1991). The slow photosynthetic induction in wheat costs at least 21% of its daily potential assimilation (Taylor and Long, 2017). Thus, it is of great importance to investigate whether acclimation to eCO2 improves dynamic photosynthesis in C3 crop plants.
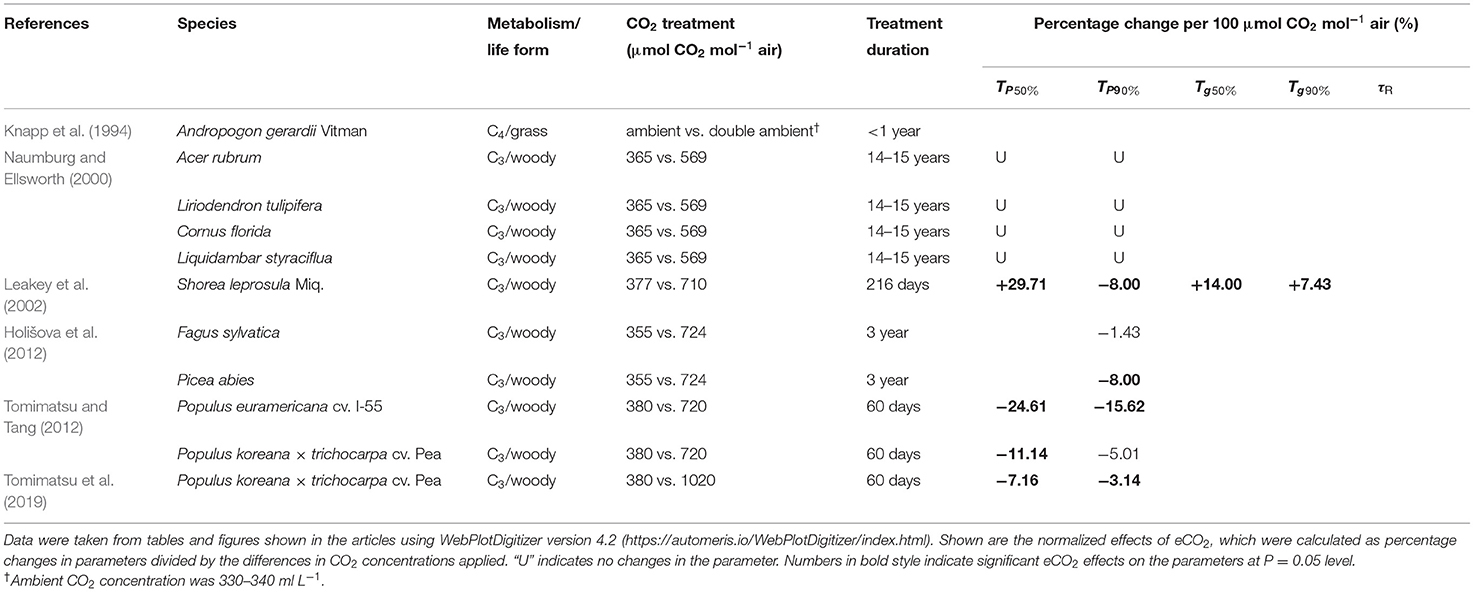
Table 1. Summaries of previous studies addressing the effect of long-term elevated carbon dioxide (eCO2) on photosynthetic induction.
In this study, we aimed to address: (1) how eCO2 affects dynamic photosynthesis; (2) the relative contribution of the acclimation and substrate effects of eCO2 on dynamic photosynthesis.
The study was conducted at the Agricultural Meteorology and Ecology Experimental Station, Nanjing University of Information Engineering, Nanjing, China (32°16′N, 118°46′E). An Oryza sativa japonica cultivar (Nanjing 9108) and a Triticum aestivum cultivar (Yangmai 22) were used. There are many cultivars of rice and wheat since both are widely cultivated crop species with a very long cultivation history. Nanjing 9108 was nominated as “super rice” by the Chinese Ministry of Agriculture in 2015, whereas Yangmai 22 is a high-yield wheat cultivar. Currently, both are the major and most widely cultivated cultivars in the middle and lower reaches of the Yangtze River. The rice seeds were sown (rice, May 2017; wheat, October 2017) at 400 μmol CO2 mol−1 air. Afterward, the rice seedlings were transplanted into octagonal open-top chambers (OTCs) with 400 (ambient, denoted by A) or 600 μmol CO2 mol−1 air (elevated, denoted by E). The wheat seeds were directly sown in the soil in each OTC. The OTCs were 3 m high with a bottom area of ~12 m2. Ventilation fans were installed on the inner walls of the OTCs to minimize the impact of heterogeneous temperature and CO2 concentration on the height of the flag leaves. The plants grown within the core area of an ambient [CO2] OTC and an elevated [CO2] OTC were selected for the experiment. The soil was carefully plowed before transplanting the rice seedlings and sowing the wheat seeds. These practices allowed for fairly homogeneous soil conditions for the two CO2 treatments (OTCs), which were only 8–10 m apart from each other. The soil nutrition content at a 0–20-cm depth before sowing the wheat seeds was 1.25 vs. 1.34 g N kg−1, .84 vs. .83 g P kg−1, and 18.1 vs. 18.08 g K kg−1 for the ambient vs. elevated OTC, respectively. Atmospheric environments during the growth period were also similar between the two OTCs (Supplementary Figure 1). Furthermore, all plants in the two treatments received the same management practices, e.g., fertilization, irrigation, and pest control. All these conditions ensured that the major difference between the two treatments was growth CO2 concentration. We then focused on the biological replication, i.e., the individual plants, for photosynthetic measurement replicates. The measurements were conducted during grain filling: rice, September 15–28, 2017; wheat, April 20–27, 2018.
In both species, flag leaves contribute an important portion of assimilates used for grain filling (Yoshida, 1981; Carmo-Silva et al., 2017). We then decided on all the measurements to be conducted with the flag leaves. Gas exchange parameters were measured on the south-facing, fully expanded flag leaves with portable infrared gas analyzers (Li-Cor 6400 and Li-Cor 6800, LI-COR Biosciences, Lincoln, NE, USA). Air temperature during grain filling was slightly higher for rice than for wheat; therefore, the block temperature was set to 32.5°C for rice and 30°C for wheat. Relative humidity was maintained at 60–65%. Measurements were made on three to four leaves from different plants (one leaf per plant).
To determine the responses of the net photosynthetic rate to the intercellular CO2 concentration (PN-Ci curves, equivalent to A-Ci curves as in common usage), leaves were acclimated to a saturating light intensity of 1,500 μmol photons m−2 s−1 at a CO2 concentration identical to growth [CO2]. Then, the CO2 concentration in the reference cell was varied from 50 to 1,500 μmol CO2 mol−1 air. Altogether, 14 different CO2 concentrations were investigated.
To characterize dynamic photosynthesis, we measured the photosynthetic time course in response to a simulated increase and decrease in light intensity. The leaves were first acclimated at 100 μmol photons m−2 s−1 for over 30 min, then the light intensity within the leaf chamber was increased to 1,500 μmol photons m−2 s−1, and kept constant for 5 min. Afterward, the light intensity was decreased to 50 μmol photons m−2 s−1 and kept constant for 5 min. The net photosynthetic rate and stomatal conductance (gs) were recorded every second for the entire measurement period. Photosynthetic characteristics in plants grown at 600 μmol CO2 mol−1 air were influenced not only by the short-term but also the long-term effect of eCO2, in comparison with plants grown at 400 μmol CO2 mol−1 air. To distinguish both effects, we measured dynamic photosynthesis at 400 (denoted by a) and 600 μmol CO2 mol−1 air (denoted by e), regardless of growth [CO2]. The differences between the two growth conditions [CO2] under the same measurement [CO2] (i.e., Ae vs. Ee and Aa vs. Ea) were considered to be caused by the acclimation effect of eCO2, while the differences between the two measurements [CO2] from the same growth [CO2] (i.e., Aa vs. Ae and Ea vs. Ee) were considered to be due to the instantaneous substrate effect of eCO2.
The leaves used for the gas exchange measurements were collected, brought to the laboratory, and then oven-dried at 65°C for 48 h before grinding. The carbon and nitrogen concentrations of ground samples were determined using a CHNOS elemental analyzer (Vario EL III, Elementar Analysensysteme GmbH, Langenselbold, Germany).
Five flag leaves other than those used for the gas exchange measurements from the same OTC were sampled and kept in a 2.5% glutaraldehyde solution. Images of the center of the abaxial leaf surface at ×800 magnification for rice and ×400 for wheat were acquired with a scanning electron microscope (FEI Quanta 200F, Thermo Fisher Scientific, Waltham, MA, USA). Stomatal density and guard cell length were determined using the ImageJ software (National Institute of Health, Bethesda, MD, USA) from 10–20 fields of view.
To evaluate the rates of photosynthetic and stomatal induction responses, we calculated the time to reach 50 and 90% of the steady-state photosynthetic rate (PN) (TP50% and TP90%) and gs (Tg50% and Tg90%) at 1,500 μmol photons m−2 s−1. Photosynthetic induction state (IS) was calculated after Chazdon and Pearcy (1986):
where PN, 100 is the steady-state PN reached at 100 μmol photons m−2 s−1 and PN, 1500 is the steady-state PN reached at 1,500 μmol photons m−2 s−1. Both were calculated by averaging single values over the last half-minute of each period.
We assumed that the transition between the Rubisco-limited state and the ribulose 1,5-bisphosphate (RuBP) regeneration-limited state occurs at a Ci of 200–400 μmol CO2 mol−1 air at ambient growth [CO2] and a Ci of 400–600 μmol CO2 mol−1 air at elevated growth [CO2] during the induction response. Then, PN-Ci curves were divided into two parts and fitted separately to obtain the apparent maximum Rubisco carboxylation rate (Vc, max), electron transport rate at 1,500 μmol photons m−2 s−1 (J1500), and CO2 photo compensation point (Γ*). Parameters estimated from the PN-Ci curves were then used to correct transient PN by removing stomatal limitations. Since RuBP regeneration limitation typically relaxes within 2 min (Taylor and Long, 2017) and triose phosphate use limitation barely occurs at the CO2 concentration investigated in this study (Long and Bernacchi, 2003), the PN was corrected only 2 min after the increase in light intensity. Under Rubisco limitation, PN at time t can be calculated after Farquhar et al. (1980):
where Vc, max(t) and Ci(t) is Vc, max, and Ci at time t, respectively, Km is the Michaelis–Menten constants of Rubisco taken from Bernacchi et al. (2001), and RL is mitochondrial respiration rate in the light and assumed to be 60% of dark respiration rate (Way et al., 2019), which was determined in a preliminary test. To remove the stomatal limitation, PN was recalculated by replacing Ci(t) with the final, steady-state Ci (Ci,f):
where is corrected PN(t). Combining Equations (1, 2) to eliminate the unknown variable Vc,max(t):
The time courses of were then fitted to the model proposed by Woodrow and Mott (1989):
where and are the final corrected and estimated initial photosynthetic rate, respectively; τR is the apparent time constant of Rubisco activation. Diffusional and biochemical limitations were estimated after Kaiser et al. (2017a).
Accumulative carbon gain (ACG) during a period of time was calculated as
where t0 is the time when light intensity was increased. The eCO2 may affect the steady-state PN and photosynthetic induction, both of which result in changes in transient PN during photosynthetic induction and, thus, affect ACG (Figure 1). To distinguish the relative contribution of eCO2 to the ACG via accelerated photosynthetic induction from the enhanced steady-state PN, we decomposed ACG into ideal carbon gain (ICG) and induction efficiency (IE). The ICG during the same period of time was defined as
As Equation (7) shows, ICG is determined by steady-state PN only. Thus, IE is calculated by dividing the ACG by the ICG, after Tang et al. (1994):
Induction efficiency is linearly correlated with TP90% (Supplementary Figure 2); thus, the accelerated photosynthetic induction will result in a higher IE. The relative contribution of eCO2 on ACG via accelerated photosynthetic induction is represented as the percentage difference in ACG under the Aa treatment and estimated using IE under the Ae and Ee treatments.
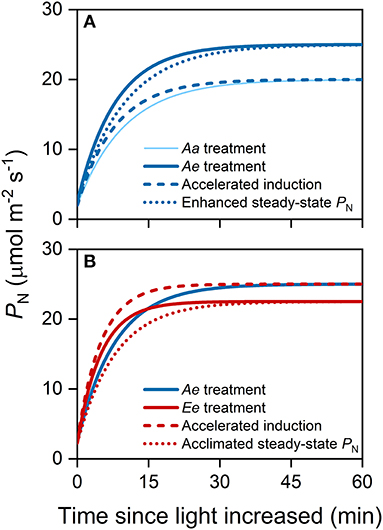
Figure 1. An example illustrating the substrate effect of elevated carbon dioxide (eCO2) (A) and the acclimation effect of eCO2 (B) on accumulative carbon gain (ACG) via changes in steady-state photosynthetic rates (PN) and photosynthetic induction. In this study, we assume that the acclimation to long-term eCO2 accelerates photosynthetic induction but decreases the steady-state PN at high light intensity. All lines were modeled with an exponential function. (A) The thin solid curve represents the time course of PN following an increase in light intensity from 100 to 1,500 μmol photons m−2 s−1 under the Aa treatment, while the thick solid curve represents that under Ae treatment. The dashed blue curve represents the time course of PN considering accelerated photosynthetic induction only, i.e., the rate of photosynthetic induction is the same as that under the Ae treatment. The dotted blue curve represents the time course of PN considering changes in steady-state PN only i.e., steady-state PN are the same as that under the Ae treatment. (B) The solid red curve represents the time course of PN under the Ee treatment. The dashed red curve represents the time course of PN considering changes in photosynthetic induction only, i.e., the rate of photosynthetic induction is the same as that under the Ee treatment. The dotted red curve represents the time course of PN considering changes in steady-state PN only i.e., the final, steady-state PN is the same as that under the Ee treatment.
Additionally, post-illumination carbon gain (PICG) due to the simulated lightfleck was calculated as,
where t1 is the time when light intensity was decreased.
A two-way ANOVA was performed to evaluate the contribution of the acclimation and substrate effects and their interaction. When the requirement of the normality and homogeneity of variances were met, the differences in the means of different treatments (Aa, Ae, Ea, and Ee) were then assessed by a least significant difference test. All statistical analyses were carried out with SPSS Statistics Version 26 for Windows (IBM Corp., Armonk, NY, USA) at a significance level of 0.05.
In both species, the PN,100 and PN,1,500 in leaves from both growth [CO2] treatments were higher when the measurements were conducted under eCO2 (Table 2). The averaged PN,1,500 under the Ee treatment was significantly higher than that under the Aa treatment by 30.5% in rice and 37.8% in wheat. The averaged PN,50 did not differ significantly across treatments in rice. In wheat, PN,50 was significantly lower under the Ea treatment compared with the other three treatments. In both species, gs,1,500 did not differ significantly across treatments (Table 2). In rice, gs,100 did not differ significantly across treatments, however, gs,50 was higher under the Ae and Ea than under the Ee and Aa treatments. In wheat, both gs,100 and gs,50 were higher under the Aa and Ee than under the Ae and Ea treatments. The averaged Ci,50, Ci,100, and Ci,1,500 were higher when measurements were conducted under eCO2 than under ambient CO2 in both species.

Table 2. Steady-state photosynthetic rate (PN), stomatal conductance (gs), and intercellular CO2 concentration (Ci) reached under different light intensities in rice and wheat.
In rice, the differences in PN,100 and PN,1,500 were attributable to measurement [CO2] only, whereas the differences in gs,100 and gs,1,500 were attributable to the interaction of growth and measurement [CO2] only. The differences in gs,1,500 were also, to a less extent, attributable to measurement [CO2]. In wheat, the differences in PN and gs were attributable to measurement [CO2]; the differences in PN,100 and gs,100 were also attributable to the interaction of growth and measurement [CO2].
In both species, PN increased faster when measurements were conducted under eCO2 after the sudden increase in light intensity (Figures 2A,B). During the photosynthetic induction and post-illumination period, transient PN was higher under the Ae than under the Ee treatment in rice but was higher under the Ee than under the Ae treatment in wheat. Transient IS was highest under the Ee treatment and lowest under the Ea treatment in both species (Figures 2C,D). In rice, the IS was similar between the Aa and Ae treatments, whereas, in wheat, the IS was surprisingly higher under the Aa than under the Ae treatment over the first 5 min of photosynthetic induction. In rice, transient gs was higher under the Ae and Ea than under the Aa and Ee treatments (Figure 2E). In wheat, transient gs was higher under the Aa than under the Ae treatment but was similar between the Ea and Ee treatments (Figure 2F). During the first 10 min of photosynthetic induction, transient Ci was higher under the Ee than under the Ae treatment in both species (Figures 2G,H). Transient Ci was higher under the Ea than under the Aa treatment in rice but was higher under the Aa than under the Ea treatment in wheat. During the post-illumination period, transient Ci was similar across treatments in both species.
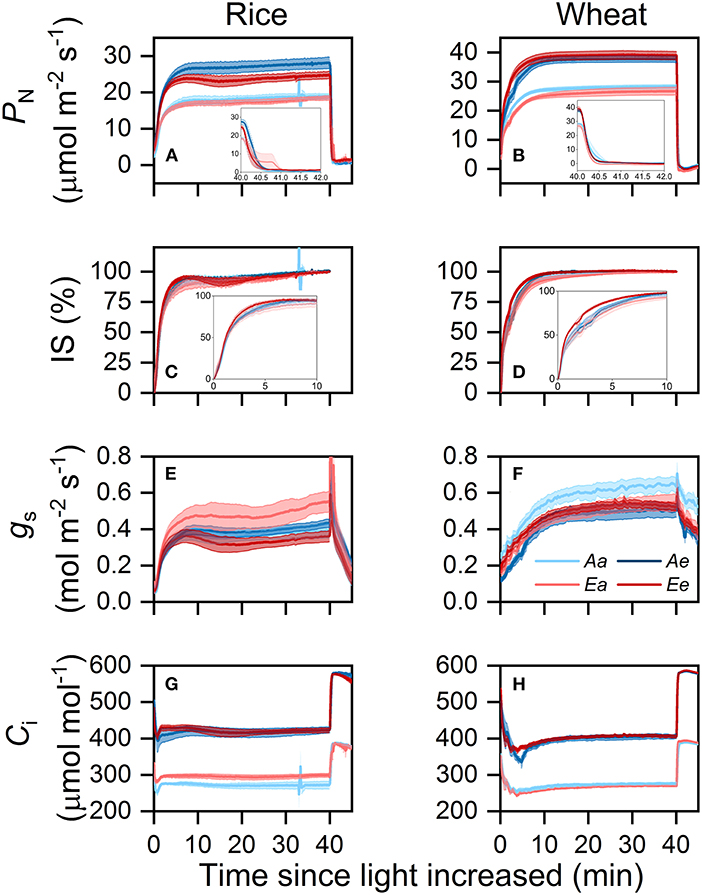
Figure 2. Time courses of PN (A,B), IS (C,D), gs (E,F), and Ci (G,H) in rice (A,C,E,G) and wheat (B,D,F,H) leaves following an increase in light intensity from 100 to 1,500 μmol photons m−2 s−1 and then a decrease in light intensity from 1,500 to 50 μmol photons m−2 s−1. Values are presented as the means ± SE of three to four biological replicates, i.e., individual plants for each species. PN, photosynthetic rate; IS, induction state; gs, stomatal conductance; Ci, intercellular CO2 concentration.
In both species, the averaged TP50% and TP90% were lower under the Ee than under the Aa and Ae treatments, despite that such differences were insignificant (Figures 3A,B). In wheat plants grown at an ambient CO2 concentration, Tg50% was significantly higher under the Ae than under the Aa treatment, whereas Tg90% was higher under the Aa than the Ae treatment (Figures 3C,D). In wheat plants grown at an eCO2 concentration, both Tg50% and Tg90% were higher under the Ea than under the Ee treatment. However, Tg50% and Tg90% were similar in rice leaves from different growth conditions [CO2] or between different measurements [CO2] from the same growth [CO2]. No significant differences in the IS60s values across treatments were found in both species (Figure 3E). In both species, τR was shorter when measurements were conducted under eCO2 (Figure 3F). In wheat, the differences in TP90% were attributable to measurement [CO2] and the interaction of growth and measurement [CO2] (Table 3). The differences in Tg50% in both species were attributable to the interaction of growth and measurement [CO2] only. In both species, the diffusional limitation was similar between the Aa and the Ea treatment, i.e., the limitation showed minimal significant differences in leaves from different growth conditions [CO2] when measurements were conducted under ambient CO2. However, the diffusional limitation was lower under the Ee than under the Ae treatment. The biochemical limitation tended to be lower when measurements were conducted under eCO2, regardless of growth [CO2] (Supplementary Figure 3). The percentage of diffusional limitation among the total photosynthetic limitation was lower than 10% during most of the time of the photosynthetic induction period (Supplementary Figures 3A,B). Biochemical limitation dominated over diffusional limitation for the first 3 min of induction in both species.
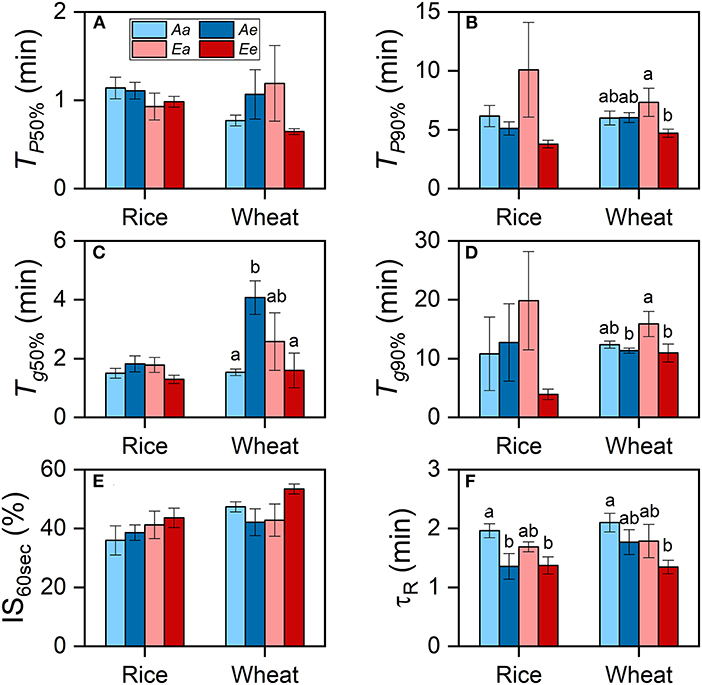
Figure 3. The rates of photosynthetic induction and stomatal opening in rice and wheat leaves. (A) Time required for the photosynthetic rate to reach 50% of PN,1,500 (TP50%). (B) Time required for the photosynthetic rate to reach 90% of PN,1,500 (TP90%). (C) Time required for stomatal conductance to reach 50% of gs,1,500 (Tg50%). (D) Time required for stomatal conductance to reach 90% of gs,1,500 (Tg90%). (E) The IS reached 30 s following an increase in light intensity (IS60s). (F) The apparent time constant of Rubisco activation (τR). Bars and vertical lines indicate the means and standard errors of three to four biological replicates, i.e., individual plants for each species, respectively. Different letters above error bars indicate significant differences between two treatments within each species. The absence of letters denotes the absence of significant difference.
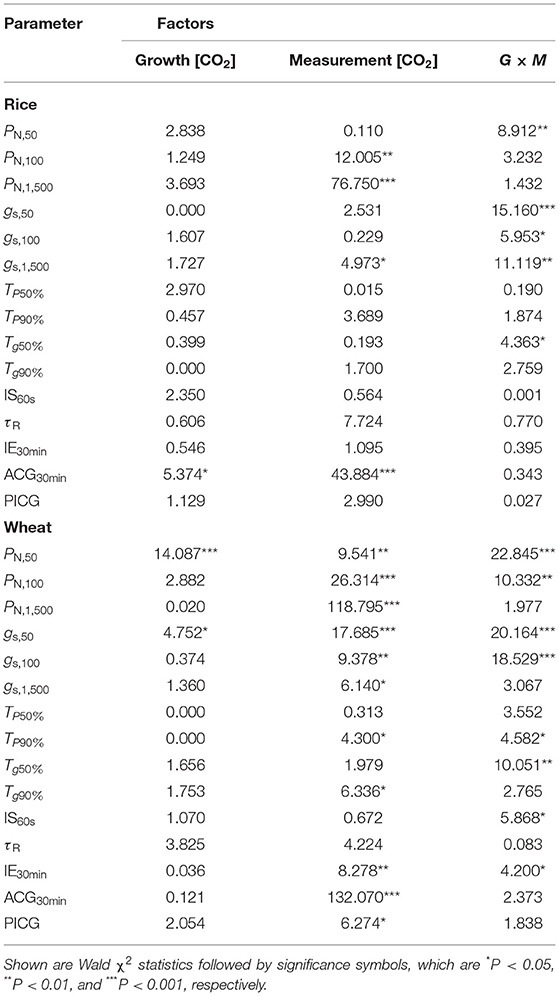
Table 3. The influences of growth (G) and measurement CO2 concentration (M) on the differences in the photosynthetic characteristics of rice and wheat.
In comparison with the Aa treatment, ACG30min was higher by 45.5 (Ae) and 27.2% (Ee) in rice (Figure 4A) and by 39.3 (Ae) and 46.8% (Ee) in wheat (Figure 4B). However, ACG30min was lower under the Ea than the Aa treatment by 10.9% in rice and by 4.7% in wheat. In comparison with the Aa treatment, PICG was higher by 45.4 (Ae) and 67% (Ee) in rice (Figure 4C) and by 4.7 (Ae) and 4.1% (Ee) in wheat (Figure 4D). In rice, PICG was higher under the Ea than the Aa treatment by 29.4% in rice but was lower by 26.3% in wheat.
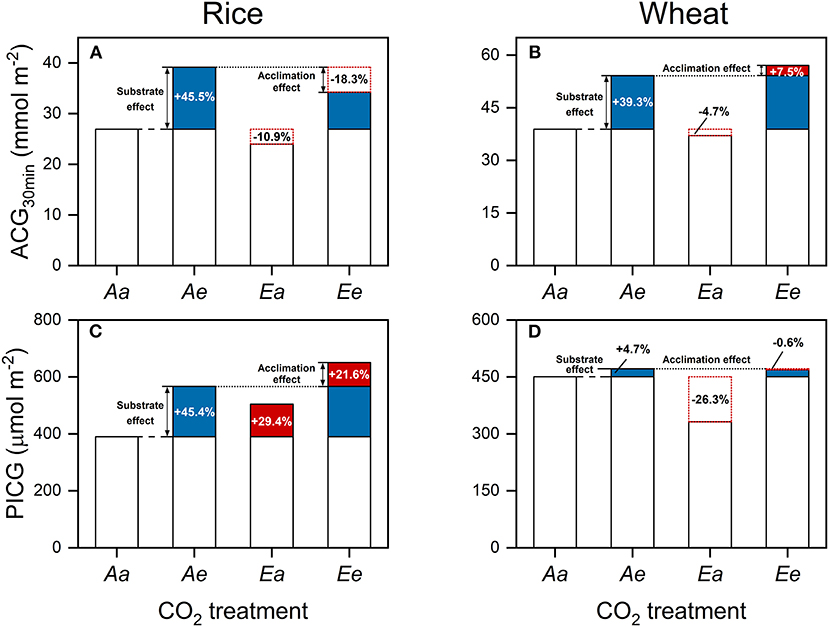
Figure 4. Accumulative carbon gain during a time period of 30 min following an increase in light intensity from 100 to 1,500 μmol photons m−2 s−1 (A,B) and during the post-illumination period (C,D) in rice (A,C) and wheat (B,D) leaves. Values are means of three to four biological replicates, i.e., individual plants for each species. Blue-filled bars lines indicate the substrate effect of eCO2, whereas red-filled and open bars with red dotted frames indicate the acclimation effect of eCO2. Numbers indicate the extent of the substrate and acclimation effect of eCO2 on ACG, taking ACG30min under the Aa treatment as the base value.
Despite these changes in ACG30min, the IE30min did not differ significantly among the Aa, Ae, and Ee treatments in both species (Figures 5A,B). In both species, IE30min was lowest under the Ea treatment. There were no significant differences observed in IE between the Aa and the Ae treatments in both species. In wheat, the averaged IE was highest under the Ee treatment throughout photosynthetic induction.
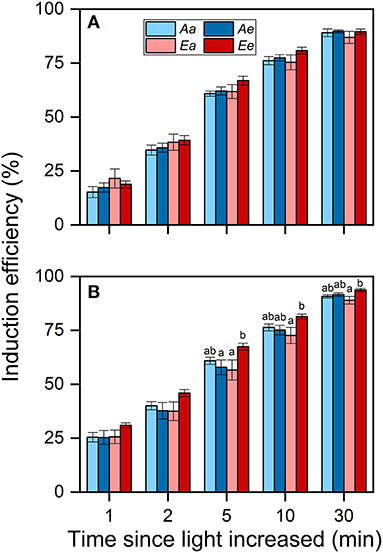
Figure 5. Induction efficiency (IE) in rice (A) and wheat (B) leaves. Bars and vertical lines indicate the means and SEs of three to four biological replicates, i.e., individual plants for each species, respectively. Different letters above error bars indicate significant differences across treatments within each species. The absence of letters denotes the absence of significant difference.
To further evaluate the contribution of accelerated photosynthetic induction under the Ae and Ee treatments to ACG30min, we estimated the potential ACG30min, assuming no effect of eCO2 on steady-state PN, which was equivalent to no changes in ICG. Compared with the Aa treatment, the increase in IE30min under Ae alone increased ACG30min by 0.6% in rice and by 0.9% in wheat, whereas the increase in IE30min under Ee alone increased ACG30min by 0.4% in rice and by 3.3% in wheat (Figures 6A,B). The changes in steady-state PN under Ae alone increased ACG30min by 44.5% in rice and 38.1% in wheat, whereas the changes in steady-state photosynthesis under Ae alone increased ACG30min by 26.3% in rice and 42.1% in wheat.

Figure 6. The effects of eCO2 on ACG30min by changes in photosynthetic induction and steady-state photosynthesis in rice (A) and wheat (B) leaves. The ACG under the Aa treatment was calculated by integrating PN over a time period of 30 min following an increase in light intensity from 100 to 1,500 μmol photons m−2 s−1. Carbon gains under other hypothetical conditions were calculated by multiplying IE30min and ICG30min measured under different CO2 treatments, as the subscripts indicate. IE30min, IE over the first 30 min of photosynthetic induction; ICG30min, ideal ACG, calculated as the product of (PN, 1, 500 – PN, 100) and 30 min. Values are means of three to four biological replicates, i.e., individual plants for each species. Blue bars indicate the substrate effect of eCO2 and red bars indicate the sum of the substrate and acclimation effect of eCO2. Bars without any patterns indicate the effects of changes in photosynthetic induction and bars with oblique lines indicate the effects of changes in steady-state photosynthesis. Numbers indicate the percentage changes in ACG30min, taking ACG30min under the Aa treatment as the base value.
The Rubisco carboxylation capacity (Vc, max) was lower at elevated than at ambient growth [CO2]; the difference was significant in wheat (Supplementary Table 1). Regardless of growth [CO2], Vc, max was higher in wheat than in rice. There were no significant differences in stomatal density at the two growth conditions [CO2] (Supplementary Table 1). Guard cells were shorter at elevated than at ambient growth [CO2]; the difference was significant in wheat. No significant differences in carbon or nitrogen content were found between ambient and elevated growth [CO2] (Supplementary Table 1).
Several studies reported accelerated photosynthetic induction in woody species at eCO2 (Leakey et al., 2002; Holišova et al., 2012; Tomimatsu and Tang, 2012). In this study, the differences in TP between the Aa and Ae treatments were small in two crop species (Figures 3A,B), and the differences in TP50% were not related to different measurement [CO2]. The modeling analysis also indicates that the changes in IE30min under the Ae treatment alone increased ACG30min by <1% in both species (Figure 6). On the contrary, the changes in steady-state PN alone increased ACG30min by more than one-third in both species (Figure 6). Acevedo-Siaca et al. (2020) reported that, in rice, increases in the photosynthetic carbon gain in fluctuating light are smaller compared with those in steady state. If the contribution of improved transient PN at eCO2 on carbon gain were excluded in their study, the increased CO2 supply may play a limited role in accelerating photosynthetic induction in crops. Thus, an increased CO2 supply improves crop photosynthesis by improving steady-state and transient PN (Table 2, Figures 2A,B), rather than accelerating photosynthetic induction.
There are no relevant investigations on why an increased CO2 supply imposes limited influences on the rate of photosynthetic induction in crop species, however, we hypothesized that dumbbell-shaped stomata, which respond to light faster than kidney-shaped stomata (Franks and Farquhar, 2007; McAusland et al., 2016; Harrison et al., 2020), lower the diffusion limitation imposed on photosynthetic induction in the crop species. Therefore, crop species may exhibit little changes in the rates of photosynthetic induction when there is a minimal increase in CO2 supply. The difference in measurement [CO2] in our study (200 μmol CO2 mol−1 air) was smaller than that in the studies reporting significant effects of eCO2 on photosynthetic induction (Table 1).
The effect of acclimation to eCO2 has rarely been distinguished from the effect of increased CO2 supply because the measurement [CO2] was the same as the growth [CO2] in previous studies. In comparison with the Aa treatment, the acclimation effect alone resulted in a 18.3% decrease in ACG30min in rice but a 7.5% increase in ACG30min in wheat (Figures 4A,B), suggesting the differential influences of the acclimation effect on the photosynthetic carbon gain between the two crop species. Such differences are likely to be related to the difference in the acclimation effect on PN,1,500, because the high IE30min under the Ee treatment led to a smaller increase in ACG30min than high PN,1,500, correspondingly ICG30min, under the Ee treatment in both species (Figure 6). Previous eCO2 experiments also show that the enhancement of photosynthesis is greater in wheat than in rice (Long et al., 2006). Wheat allocates less leaf nitrogen to Rubisco and a greater catalytic constant of Rubisco carboxylation than rice (Supplementary Table 1), and thus may have greater benefits from eCO2 (Makino, 2011).
In this study, IS60s, TP90%, and IE did not differ significantly between Ee and Ae, or even between the Ee and Aa treatments (Figures 2C,D, 3B, 5), suggesting limited influence of acclimation effect on the rate of photosynthetic induction. At timescales of minutes, the rate of photosynthetic induction is mainly determined by the light-activation of Rubisco and stomatal opening (Way and Pearcy, 2012; Kaiser et al., 2015). To speed up the rate of Rubisco activation, more resources should be allocated to Rca, which is necessary for Rubisco activation (Yamori et al., 2012). This requirement is unlikely to be met at eCO2, as previous studies reported the decreased content of Rca in rice (Chen et al., 2005) and wheat (Zhang et al., 2009; Aranjuelo et al., 2011). This is consistent with the finding that τR (Figure 3F) and biochemical limitation (Supplementary Figures 3C,D) did not differ significantly between the Ae and Ee treatments in both species. On the contrary, the differences in TP between the Ae and Ee treatments may be related to the changes in the rate of stomata opening. Accumulating evidence demonstrates that species with fast stomatal opening show fast photosynthetic induction (Drake et al., 2013; Deans et al., 2019; Yamori et al., 2020). In comparison with the Ae treatment, the stomata tended to open faster (Figures 3C,D) and stomatal limitation tended to be lower (Supplementary Figures 3A,B) under the Ee treatment in both species. We hypothesized that the faster stomatal opening in the leaves acclimated to eCO2 was achieved by a decrease in guard cell length (Supplementary Table 1), which is consistent with previous studies (Maherali et al., 2002; Zhu et al., 2018; Zheng et al., 2019). In general, small dumbbell-shaped stomata open faster than large ones within the same genus (McAusland et al., 2016). However, a negative correlation between stomatal size and Tg50% in the genus Oryza was reported recently (Zhang et al., 2019). More research is needed to address how acclimation to eCO2 in stomatal morphology affects photosynthesis.
The effects of eCO2 on the dynamic photosynthesis in crops have been rarely investigated until recently (Acevedo-Siaca et al., 2020; Ohkubo et al., 2020). This study showed that eCO2 has limited influences on the rates of photosynthetic induction in two crop species but increased photosynthetic carbon gain greatly by improving steady-state and transient PN. These findings indicate that photosynthetic carbon loss due to induction limitation may be reduced in the future, under a high CO2 world. We acknowledge that the photosynthetic responses to increasing CO2 concentration are complex. To project crop photosynthesis and yield in the future, both field experiments and in silico modeling, spanning a wide range of CO2 concentrations, are urgently needed (Drag et al., 2020). The findings in this study, which clarified the contribution of the substrate and acclimation effects of eCO2, imply that dynamic photosynthesis is likely to reduce photosynthetic induction limitation under temporally changing light environments in the future, under a high CO2 world.
In comparison with wheat, the photosynthetic acclimation to eCO2 in rice compromised the beneficial effect of an increased CO2 supply on ACG30min but further improved PICG (Figure 4A). Such an increase in PICG may counterbalance the decrease in ACG if rice leaves receive many brief (<1 min) sunflecks. Nonetheless, photosynthetic characteristics vary greatly among rice and wheat accessions (Qu et al., 2017; Salter et al., 2019; Acevedo-Siaca et al., 2020), and the effects of eCO2 on photosynthesis are likely to differ between them. The results presented here do not necessarily suggest an advantageous position for wheat in the future. Instead, this study may provide a potential reason for the lower enhancement of yield in rice than in wheat at eCO2 (Long et al., 2006), though detailed assessments are needed because of the large variations in photosynthetic light utilization among them.
By examining dynamic photosynthesis under four different CO2 treatments, this study showed that neither an increased CO2 supply nor an acclimation to eCO2 imposes large influences on the rates of photosynthetic induction in two crop species. But, an increased CO2 supply enhances photosynthetic carbon gain greatly via improving steady-state PN. The acclimation effect of eCO2 may compromise, or slightly strengthen, the beneficial effect of an increased CO2 supply, depending on the species and the fluctuations in light intensity. Our study suggests that the photosynthetic carbon gain in the two crop species is likely to be enhanced in a CO2-enriched future when photosynthetic induction limitation becomes significant for leaf carbon gain.
The original contributions presented in the study are included in the article/Supplementary Material, further inquiries can be directed to the corresponding author/s.
YT and YH conceived and designed the experiment. WS and ZH provided the experimental materials. HK, TZ, YZ, XK, and HS conducted the experiment and collected data. HK, TZ, and YZ analyzed the data and drafted the manuscript. All authors contributed to the editing and revising of the final version of the manuscript.
This study was supported by the Key Research of Plant Functional Ecology Program of Peking University (No. 7101302307), National Natural Science Foundation of China (Grant No. 41530533), and Key Laboratory of College of Urban and Environmental Sciences (No. 7100602014).
The authors declare that the research was conducted in the absence of any commercial or financial relationships that could be construed as a potential conflict of interest.
All claims expressed in this article are solely those of the authors and do not necessarily represent those of their affiliated organizations, or those of the publisher, the editors and the reviewers. Any product that may be evaluated in this article, or claim that may be made by its manufacturer, is not guaranteed or endorsed by the publisher.
We thank Jianguo Gao and Yixin Ma for their useful comments on the manuscript and Chao Liu and Chunhua Lv for their assistance in fieldwork.
The Supplementary Material for this article can be found online at: https://www.frontiersin.org/articles/10.3389/fpls.2021.727374/full#supplementary-material
1. ^Aa, plants grown at 400 μmol mol−1 CO2 were measured at 400 μmol mol−1 CO2.
2. ^Ae, plants grown at 400 μmol mol−1 CO2 were measured at 600 μmol mol−1 CO2.
3. ^Ea, plants grown at 600 μmol mol−1 CO2 were measured at 400 μmol mol−1 CO2.
4. ^Ee, plants grown at 600 μmol mol−1 CO2 were measured at 600 μmol mol−1 CO2.
Acevedo-Siaca, L. G., Coe, R., Wang, Y., Kromdijk, J., Quick, W. P., and Long, S. P. (2020). Variation in photosynthetic induction between rice accessions and its potential for improving productivity. New Phytol. 227, 1097–1108. doi: 10.1111/nph.16454
Ainsworth, E. A., and Long, S. P. (2005). What have we learned from 15 years of free-air CO2 enrichment (FACE)? A meta-analytic review of the responses of photosynthesis, canopy properties and plant production to rising CO2. New Phytol. 165, 351–372. doi: 10.1111/j.1469-8137.2004.01224.x
Ainsworth, E. A., and Rogers, A. (2007). The response of photosynthesis and stomatal conductance to rising [CO2]: mechanisms and environmental interactions. Plant Cell Environ. 30, 258–270. doi: 10.1111/j.1365-3040.2007.01641.x
Aranjuelo, I., Cabrera-Bosquet, L., Morcuende, R., Avice, J. C., Nogues, S., Araus, J. L., et al. (2011). Does ear C sink strength contribute to overcoming photosynthetic acclimation of wheat plants exposed to elevated CO2? J. Exp. Bot. 62, 3957–3969. doi: 10.1093/jxb/err095
Bernacchi, C. J., Singsaas, E. L., Pimentel, C., Portis, A. R., and Long, S. P. (2001). Improved temperature response functions for models of Rubisco-limited photosynthesis. Plant Cell Environ. 24, 253–259. doi: 10.1111/j.1365-3040.2001.00668.x
Carmo-Silva, E., Andralojc, P. J., Scales, J. C., Driever, S. M., Mead, A., Lawson, T., et al. (2017). Phenotyping of field-grown wheat in the UK highlights contribution of light response of photosynthesis and flag leaf longevity to grain yield. J. Exp. Bot. 68, 3473–3486. doi: 10.1093/jxb/erx169
Chazdon, R. L., and Pearcy, R. W. (1986). Photosynthetic responses to light variation in rainforest species: I. Induction under constant and fluctuating light conditions. Oecologia 69, 517–523. doi: 10.1007/BF00410357
Chazdon, R. L., and Pearcy, R. W. (1991). The importance of sunflecks for forest understory plants. BioScience 41, 760–766. doi: 10.2307/1311725
Chen, G. Y., Yong, Z. H., Liao, Y., Zhang, D. Y., Chen, Y., Zhang, H. B., et al. (2005). Photosynthetic acclimation in rice leaves to free-air CO2 enrichment related to both ribulose-1,5-bisphosphate carboxylation limitation and ribulose-1,5-bisphosphate regeneration limitation. Plant Cell Physiol. 46, 1036–1045. doi: 10.1093/pcp/pci113
Deans, R. M., Brodribb, T. J., Busch, F. A., and Farquhar, G. D. (2019). Plant water-use strategy mediates stomatal effects on the light induction of photosynthesis. New Phytol. 222, 382–395. doi: 10.1111/nph.15572
Drag, D. W., Slattery, R., Siebers, M., DeLucia, E. H., Ort, D. R., and Bernacchi, C. J. (2020). Soybean photosynthetic and biomass responses to carbon dioxide concentrations ranging from pre-industrial to the distant future. J. Exp. Bot. 71, 3690–3700. doi: 10.1093/jxb/eraa133
Drake, P. L., Froend, R. H., and Franks, P. J. (2013). Smaller, faster stomata: scaling of stomatal size, rate of response, and stomatal conductance. J. Exp. Bot. 64, 495–505. doi: 10.1093/jxb/ers347
Elliott-Kingston, C., Haworth, M., Yearsley, J. M., Batke, S. P., Lawson, T., and McElwain, J. C. (2016). Does size matter? atmospheric CO2 may be a stronger driver of stomatal closing rate than stomatal size in taxa that diversified under low CO2. Front. Plant Sci. 7:1253. doi: 10.3389/fpls.2016.01253
FAO (2016). 2016 FAOSTAT. Rome: Food and Agriculture Organization of the United Nations. Available online at: http://www.fao.org/faostat/en/#home (accessed 12 December 2016).
Farquhar, G. D., von Caemmerer, S., and Berry, J. A. (1980). A biochemical model of photosynthetic CO2 assimilation in leaves of C3 species. Planta 149, 78–90. doi: 10.1007/BF00386231
Franks, P. J., and Farquhar, G. D. (2007). The mechanical diversity of stomata and its significance in gas-exchange control. Plant Physiol. 143, 78–87. doi: 10.1104/pp.106.089367
Geiger, M., Haake, V., Ludewig, F., Sonnewald, U., and Stitt, M. (1999). The nitrate and ammonium nitrate supply have a major influence on the response of photosynthesis, carbon metabolism, nitrogen metabolism and growth to elevated carbon dioxide in tobacco. Plant Cell Environ. 22, 1177–1199. doi: 10.1046/j.1365-3040.1999.00466.x
Harrison, E. L., Arce Cubas, L., Gray, J. E., and Hepworth, C. (2020). The influence of stomatal morphology and distribution on photosynthetic gas exchange. Plant J. 101, 768–779. doi: 10.1111/tpj.14560
Holišova, P., Zitov,á, M., Klem, K., and Urban, O. (2012). Effect of elevated carbon dioxide concentration on carbon assimilation under fluctuating light. J. Environ. Qual. 41, 1931–1938. doi: 10.2134/jeq2012.0113
IPCC (2014). “Chapter 4: Terrestrial and inland water systems,” in Climate Change 2014: Impacts, Adaptation, and Vulnerability. Part A: Global and Sectoral Aspects. Contribution of Working Group II to the Fifth Assessment Report of the Intergovernmental Panel on Climate Change, eds C. B. Field, D. J. Dokken, K. J. Mach, M. D. Mastrandrea, T. E. Bilir, and M. Chatterjee, et al. (New York, NY; Cambridge, UK: Cambridge University Press). p. 271–360.
Kaiser, E., Kromdijk, J., Harbinson, J., Heuvelink, E., and Marcelis, L. F. (2017a). Photosynthetic induction and its diffusional, carboxylation and electron transport processes as affected by CO2 partial pressure, temperature, air humidity and blue irradiance. Ann. Bot. 119, 191–205. doi: 10.1093/aob/mcw226
Kaiser, E., Morales, A., Harbinson, J., Kromdijk, J., Heuvelink, E., and Marcelis, L. F. (2015). Dynamic photosynthesis in different environmental conditions. J. Exp. Bot. 66, 2415–2426. doi: 10.1093/jxb/eru406
Kaiser, E., Zhou, D., Heuvelink, E., Harbinson, J., Morales, A., and Marcelis, L. F. M. (2017b). Elevated CO2 increases photosynthesis in fluctuating irradiance regardless of photosynthetic induction state. J. Exp. Bot. 68, 5629–5640. doi: 10.1093/jxb/erx357
Kardiman, R., and Ræbild, A. (2018). Relationship between stomatal density, size and speed of opening in Sumatran rainforest species. Tree Physiol. 38, 696–705. doi: 10.1093/treephys/tpx149
Knapp, A. K., Fahnestock, J. T., and Owensby, C. E. (1994). Elevated atmospheric CO2 alters stomatal responses to variable sunlight in a C4 grass. Plant Cell Environ. 17, 189–195. doi: 10.1111/j.1365-3040.1994.tb00282.x
Leakey, A. D., Press, M. C., Scholes, J. D., and Watling, J. R. (2002). Relative enhancement of photosynthesis and growth at elevated CO2 is greater under sunflecks than uniform irradiance in a tropical rain forest tree seedling. Plant Cell Environ. 25, 1701–1714. doi: 10.1046/j.1365-3040.2002.00944.x
Long, S. P., Ainsworth, E. A., Leakey, A. D. B., Nösberger, J., and Ort, D. R. (2006). Food for thought: lower-than-expected crop yield stimulation with rising CO2 concentrations. Science 312, 1918–1921. doi: 10.1126/science.1114722
Long, S. P., and Bernacchi, C. J. (2003). Gas exchange measurements, what can they tell us about the underlying limitations to photosynthesis? procedures and sources of error. J. Exp. Bot. 54, 2393–2401. doi: 10.1093/jxb/erg262
Maherali, H., Reid, C. D., Polley, H. W., Johnson, H. B., and Jackson, R. B. (2002). Stomatal acclimation over a subambient to elevated CO2 gradient in a C3/C4 grassland. Plant Cell Environ. 25, 557–566. doi: 10.1046/j.1365-3040.2002.00832.x
Makino, A. (2011). Photosynthesis, grain yield, and nitrogen utilization in rice and wheat. Plant Physiol. 155, 125–129. doi: 10.1104/pp.110.165076
McAusland, L., Vialet-Chabrand, S., Davey, P., Baker, N. R., Brendel, O., and Lawson, T. (2016). Effects of kinetics of light-induced stomatal responses on photosynthesis and water-use efficiency. New Phytol. 211, 1209–1220. doi: 10.1111/nph.14000
Naumburg, E., and Ellsworth, D. S. (2000). Photosynthetic sunfleck utilization potential of understory saplings growing under elevated CO2 in FACE. Oecologia 122, 163–174. doi: 10.1007/PL00008844
Ohkubo, S., Tanaka, Y., Yamori, W., and Adachi, S. (2020). Rice cultivar takanari has higher photosynthetic performance under fluctuating light than koshihikari, especially under limited nitrogen supply and elevated CO2. Front. Plant Sci. 11:1308. doi: 10.3389/fpls.2020.01308
Pearcy, R. W. (1983). The light environment and growth of C3 and C4 tree species in the understory of a Hawaiian forest. Oecologia 58, 19–25. doi: 10.1007/BF00384537
Pearcy, R. W., Roden, J. S., and Gamon, J. A. (1990). Sunfleck dynamics in relation to canopy structure in a soybean (Glycine max (L.) Merr.) canopy. Agri. For. Meteorol. 52, 359–372. doi: 10.1016/0168-1923(90)90092-K
Qu, M., Zheng, G., Hamdani, S., Essemine, J., Song, Q., Wang, H., et al. (2017). Leaf photosynthetic parameters related to biomass accumulation in a global rice diversity survey. Plant Physiol. 175, 248–258. doi: 10.1104/pp.17.00332
Salter, W. T., Merchant, A. M., Richards, R. A., Trethowan, R., and Buckley, T. N. (2019). Rate of photosynthetic induction in fluctuating light varies widely among genotypes of wheat. J. Exp. Bot. 70, 2787–2796. doi: 10.1093/jxb/erz100
Tang, Y., Hiroshi, K., Mitsumasa, S., and Izumi, W. (1994). Characteristics of transient photosynthesis in Quercus serrata seedlings grown under lightfleck and constant light regimes. Oecologia 100, 463–469. doi: 10.1007/BF00317868
Tang, Y., Washitani, I., Tsuchiya, T., and Iwaki, H. (1988). Fluctuation of photosynthetic photon flux density within a Miscanthus sinensis canopy. Ecol. Res. 3, 253–266. doi: 10.1007/BF02348584
Taylor, S. H., and Long, S. P. (2017). Slow induction of photosynthesis on shade to sun transitions in wheat may cost at least 21% of productivity. Philos. Trans. Royal Soc. B Biol. Sci. 372:543. doi: 10.1098/rstb.2016.0543
Tomimatsu, H., Iio, A., Adachi, M., Saw, L. G., Fletcher, C., and Tang, Y. (2014). High CO2 concentration increases relative leaf carbon gain under dynamic light in Dipterocarpus sublamellatus seedlings in a tropical rain forest, Malaysia. Tree Physiol. 34, 944–954. doi: 10.1093/treephys/tpu066
Tomimatsu, H., Sakata, T., Fukayama, H., and Tang, Y. (2019). Short-term effects of high CO2 accelerate photosynthetic induction in Populus koreana x trichocarpa with always-open stomata regardless of phenotypic changes in high CO2 growth conditions. Tree Physiol. 39, 474–483. doi: 10.1093/treephys/tpy078
Tomimatsu, H., and Tang, Y. (2012). Elevated CO2 differentially affects photosynthetic induction response in two Populus species with different stomatal behavior. Oecologia 169, 869–878. doi: 10.1007/s00442-012-2256-5
Way, D. A., Aspinwall, M. J., Drake, J. E., Crous, K. Y., Campany, C. E., Ghannoum, O., et al. (2019). Responses of respiration in the light to warming in field-grown trees: a comparison of the thermal sensitivity of the Kok and Laisk methods. New Phytol. 222, 132–143. doi: 10.1111/nph.15566
Way, D. A., and Pearcy, R. W. (2012). Sunflecks in trees and forests: from photosynthetic physiology to global change biology. Tree Physiol. 32, 1066–1081. doi: 10.1093/treephys/tps064
Woodrow, I. E., and Mott, K. A. (1989). Rate limitation of non-steady-state photosynthesis by ribulose-1,5-bisphosphate carboxylase in spinach. Austr. J. Plant Physiol. 16, 487–500. doi: 10.1071/PP9890487
Yamori, W., Kusumi, K., Iba, K., and Terashima, I. (2020). Increased stomatal conductance induces rapid changes to photosynthetic rate in response to naturally fluctuating light conditions in rice. Plant Cell Environ. 43, 1230–1240. doi: 10.1111/pce.13725
Yamori, W., Masumoto, C., Fukayama, H., and Makino, A. (2012). Rubisco activase is a key regulator of non-steady-state photosynthesis at any leaf temperature and, to a lesser extent, of steady-state photosynthesis at high temperature. Plant J. 71, 871–880. doi: 10.1111/j.1365-313X.2012.05041.x
Yoshida, S. (1981). “Physiological analysis of rice yield,” in Fundamentals of Rice Crop Science (Makati City: International Rice Research Institute), 231–251.
Zhang, D. Y., Chen, G. Y., Chen, J., Yong, Z. H., Zhu, J. G., and Xu, D. Q. (2009). Photosynthetic acclimation to CO2 enrichment related to ribulose-1,5-bisphosphate carboxylation limitation in wheat. Photosynthetica 47, 152–154. doi: 10.1007/s11099-009-0025-4
Zhang, Q., Peng, S., and Li, Y. (2019). Increase rate of light-induced stomatal conductance is related to stomatal size in the genus Oryza. J. Exp. Bot. 70, 5259–5269. doi: 10.1093/jxb/erz267
Zheng, Y., Li, F., Hao, L., Yu, J., Guo, L., Zhou, H., et al. (2019). Elevated CO2 concentration induces photosynthetic down-regulation with changes in leaf structure, non-structural carbohydrates, and nitrogen content of soybean. BMC Plant Biol. 19:255. doi: 10.1186/s12870-019-1788-9
Keywords: acclimation, dynamic photosynthesis, elevated CO2, photosynthetic induction, rice, wheat
Citation: Kang H, Zhu T, Zhang Y, Ke X, Sun W, Hu Z, Zhu X, Shen H, Huang Y and Tang Y (2021) Elevated CO2 Enhances Dynamic Photosynthesis in Rice and Wheat. Front. Plant Sci. 12:727374. doi: 10.3389/fpls.2021.727374
Received: 18 June 2021; Accepted: 01 September 2021;
Published: 01 October 2021.
Edited by:
Carmen Arena, University of Naples Federico II, ItalyReviewed by:
Marco Landi, University of Pisa, ItalyCopyright © 2021 Kang, Zhu, Zhang, Ke, Sun, Hu, Zhu, Shen, Huang and Tang. This is an open-access article distributed under the terms of the Creative Commons Attribution License (CC BY). The use, distribution or reproduction in other forums is permitted, provided the original author(s) and the copyright owner(s) are credited and that the original publication in this journal is cited, in accordance with accepted academic practice. No use, distribution or reproduction is permitted which does not comply with these terms.
*Correspondence: Yanhong Tang, dGFuZ3loQHBrdS5lZHUuY24=
Disclaimer: All claims expressed in this article are solely those of the authors and do not necessarily represent those of their affiliated organizations, or those of the publisher, the editors and the reviewers. Any product that may be evaluated in this article or claim that may be made by its manufacturer is not guaranteed or endorsed by the publisher.
Research integrity at Frontiers
Learn more about the work of our research integrity team to safeguard the quality of each article we publish.