 Debjyoti Sen Gupta1,2*
 Partha S. Basu3
 J. Souframanien4
 Jitendra Kumar1*
 P. Dhanasekar4
 Sanjeev Gupta2
 Muthaiyan Pandiyan5
 S. Geetha5P. Shanthi5
 Vaibhav Kumar3
 Narendra Pratap Singh6
- 1Division of Crop Improvement, ICAR-Indian Institute of Pulses Research, Kanpur, India
- 2All India Coordinated Research Project on Mungbean, Urdbean, Lentil, Lathyrus, Rajmash, and Fieldpea, ICAR-Indian Institute of Pulses Research, Kanpur, India
- 3Division of Basic Sciences, ICAR-Indian Institute of Pulses Research, Kanpur, India
- 4Nuclear Agriculture & Biotechnology Division, Bhabha Atomic Research Centre, Mumbai, India
- 5National Pulses Research Centre, Vamban, India
- 6Division of Biotechnology, ICAR-Indian Institute of Pulses Research, Kanpur, India
Urdbean (Vigna mungo L. Hepper) is one of the important pulse crops. Its cultivation is not so popular during summer seasons because this crop is unable to withstand excessive heat stress beside lack of humidity in the atmosphere. Therefore, a panel of 97 urdbean diverse genotypes was assessed for yield under stress and non-stress conditions with an aim to identify heat tolerant genotypes. This study identified 8 highly heat tolerant and 35 highly heat sensitive genotypes based on heat susceptibility index. Further, physiological and biochemical traits-based characterization of a group of six highly heat sensitive and seven highly heat tolerant urdbean genotypes showed genotypic variability for leaf nitrogen balance index (NBI), chlorophyll (SPAD), epidermal flavnols, and anthocyanin contents under 42/25°C max/min temperature. Our results showed higher membrane stability index among heat tolerant genotypes compared to sensitive genotypes. Significant differences among genotypes for ETR at different levels of PAR irradiances and PAR × genotypes interactions indicated high photosynthetic ability of a few genotypes under heat stress. Further, the most highly sensitive genotype PKGU-1 showed a decrease in different fluorescence parameters indicating distortion of PS II. Consequently, reduction in the quantum yield of PS II was observed in a sensitive one as compared to a tolerant genotype. Fluorescence kinetics showed the delayed and fast quenching of Fm in highly heat sensitive (PKGU 1) and tolerant (UPU 85-86) genotypes, respectively. Moreover, tolerant genotype (UPU 85-86) had high antioxidant activities explaining their role for scavenging superoxide radicals (ROS) protecting delicate membranes from oxidative damage. Molecular characterization further pinpointed genetic differences between heat tolerant (UPU 85-86) and heat sensitive genotypes (PKGU 1). These findings will contribute to the breeding toward the development of heat tolerant cultivars in urdbean.
Introduction
Urdbean (Vigna mungo L. Hepper) is a popular food legume grown in many Asian countries including India, Pakistan, Myanmar, Bangladesh, Thailand, and China. India is the largest producer and consumer of urdbean. It produces about 3.36 million tons of urdbean (Project Coordinator’s Report, 2019-2020) and imports another 0.5 million tons from other urdbean growing countries, particularly from Myanmar. During 2014-2015, Myanmar produced 1.51 million tons of urdbean that is locally known as black matpe bean. Nutritionally, urdbean is dense with protein (21-28%), dietary fiber (161-187 g/kg), iron (16-255 mg/kg), zinc (5-134 mg/kg), and other micronutrients like other pulses (Chitra et al., 1996; Sen Gupta et al., 2020). Therefore, its nutrient-dense profile has encouraged an introduction to many developed countries including the United States, Russia, and European nations as a potential pulse crop (Sen Gupta et al., 2020).
Urdbean is grown in different ecologies and seasons across the growing regions. In India, it is grown mainly in the rainy season (July-October) and in the southern part it is also cultivated as a winter season crop (November to February). However, its cultivation is not wide in the summer season due to excessive heat stress and a lack of humidity in the atmosphere. Thus, availability of heat tolerant cultivars can bring more areas under urdbean cultivation. Previously, genetic variability for heat tolerance was reported in many food legumes (Sita et al., 2017), but it is not yet explored in urdbean. It is a warm season food legume, which requires 25-35°C temperature along with high humidity for its normal growth and development. However, prevailing high temperature (>40°C) during flowering results in deformation of flower parts or flower drop leading to negative impact on yield. Similarly, in mungbean, higher temperatures of >38/25°C (day and night, respectively) markedly affected the yield under summer-season cultivation (Nayyar et al., 2017).
The effect of heat stress results in drastic yield losses due to pollen or ovule inactivity, flower abortion, and even post-fertilization impaired growth and development of embryo or seed in many pulses (Sita et al., 2017). Moreover, the current climate change scenario also leads to abrupt changes in mean temperature. Therefore, breeding of heat tolerant urdbean varieties becomes more relevant under such situations. Urdbean is a close relative of mungbean, which is extensively cultivated in identical ecologies. In this crop as well as in another Vigna pulse crop, cowpea, sources of heat tolerance have already been identified (Ehlers and Hall, 1998; Basu et al., 2019).
Knowledge of key traits imparting heat tolerance can help to improve the grain yield of urdbean (Scafaro et al., 2010). Therefore, physio-biochemical mechanisms underlying these key traits are essential to screen large numbers of germplasm at critical temperature under both field and controlled conditions (Gaur et al., 2019). In several other crops, various physiological traits such as photosynthetic activity, membrane stability, pollen viability, and phenolic compounds have been used to identify heat tolerant genotypes (Allakhverdiev and Murata, 2004; Asseng et al., 2015; Sita et al., 2017) and genetic variability has been reported for key physiological traits under heat stress conditions (Challinor et al., 2007).
Urdbean is a highly photothermo-sensitive crop. Therefore, its yield potential varies across locations due to variable daylength and thermal regimes. Thus, minimizing the genotype × environment interactions can help to achieve stable yield of urdbean. The high temperature stress above the threshold across the locations during the summer season could be the compounding effects of both heat and photosensitivity. One of the strategies for selecting photo-thermo insensitive lines is to evaluate different genotypes at multi-locations having varying daylength and thermal regimes. As a result, genotypes having stable yield across the locations could be identified as putative photo-thermo insensitive lines. This strategy should be made to screen thermo-tolerant lines from the panel of photo-thermo insensitive lines so that widely adapted stable heat tolerant lines could be identified having less influence of photo-thermoperiods. In the present investigation, this approach has been followed to identify contrasting genotypes having a high level of tolerance or sensitivity to high temperature.
Knowledge of genetics underlying key traits imparting heat tolerance helps the breeder to make genetic improvements more precisely. In recent years, molecular markers helped to decipher the genetics of complex key morpho-physiological traits imparting heat tolerance in several crops (Argyris et al., 2008; Roy et al., 2011; Paliwal et al., 2012). However, in urdbean, use of molecular markers for mapping and characterization of traits related to heat tolerance is poorly understood. Currently, simple sequence repeats (SSRs) and single nucleotide polymorphisms (SNPs) are available for molecular characterization in urdbean (Raizada and Souframanien, 2019; Souframanien et al., 2020; Pootakham et al., 2021). Hence, this experiment was designed with the following objectives: (i) to evaluate a set of urdbean genotypes under field conditions with natural heat stress conditions (flowering and podding stage coincides with high temperature), and to compare it with normal field conditions (comparatively less exposure to high temperature during flowering and podding), (ii) to precisely phenotype selected contrasting heat tolerant and sensitive genotypes for different physiological and biochemical traits, and (iii) to characterize heat tolerant and sensitive genotypes with heat-related genic markers.
Materials and Methods
Plant Materials
Plant materials comprised of 97 urdbean genotypes, which were grown during the summer season of 2016 at the Main Research Farm of Indian Institute of Pulses Research (IIPR), Kanpur (26.28°N and 80.21°E), and National Pulses Research Centre of TNAU, Vamban (10.20°N, 78.50° E) in India. The tested urdbean genotypes comprised of germplasm, breeding lines, and cultivars of diverse origins (Supplementary File 1). Maturity duration for these genotypes ranged from 70 to 75 days. The field experiments were grown in augmented- randomized complete block (RCB) design. Three checks (Uttara, Shekhar-2, IPU 02-43) were replicated with randomization in each one of the five blocks. Each plot consisted of double rows of 4 m length. Rows were spaced 30 cm apart and interplant distance was 10 cm. Two trials were conducted at each location and based on meteorological data and average yield of trial one was designated as “stress environment (SE)” and another was named as “non-stress environment (NSE).” Standard practices were followed to raise the rainfed crop excluding one pre-sown irrigation.
Heat Susceptibility Index
Heat susceptibility index (HSI) for each individual urdbean genotype was calculated using the equation by Fischer and Maurer (1978): HSI = (1-Yh/Y)/(1-Xh/X) where Yh and Y are the phenotypic means (Yield) for each genotype under heat stress and non-heat stress conditions, respectively, and Xh and X are the phenotypic means (Yield) for all lines under heat stressed and non-heat stress conditions, respectively.
Meteorological Data Collection
Weather data from Kanpur and Vamban locations were recorded throughout the growing period by the respective meteorological observatories present in both places.
Physiological Characterization of Heat Tolerant and Sensitive Genotypes
Plant Samples Under Controlled Environment
Seeds of selected contrasting urdbean genotypes were obtained from the urdbean breeding program of IIPR, Kanpur. Seeds were surface sterilized with 70% ethanol for 5 min, followed by treatment with 1% sodium hypochlorite (v/v) for 3 min. The sterilized seeds were rinsed 3 times with sterile Milli-Q (Merck Millipore, Germany) water under aseptic conditions and soaked overnight at room temperature.
The sterilized seeds were sown in cocopit–vermicompost–soil mixture (3:1:1 ratio) and irrigated with Hoagland solution. The plants were raised under a controlled environment chamber (Hi-point, Taiwan) and maximum minimum temperature 40/25°C with 14-h photoperiod was maintained. The light sources were RGB LED (Red-Green-Blue-White) having an irradiance level of 460 μmol photons m–2s–1 and relative humidity 80%. The required moisture and fertility of the soil compost was ensured by irrigating with water or Hoagland solution at regular intervals.
Nitrogen Balance Index, Chlorophyll, Anthocyanin, and Flavanols Contents
The physiological status of selected plant leaves was determined using a hand-held device DUALEX leaf clip device (Force-A, France), which enabled comparative values of leaf chlorophyll (leaf greenness) content (Chl), epidermal flavanols (Flv), nitrogen balance index (NBI), and anthocyanin content of leaves subjected to heat stress in a sensor-controlled chamber consistently maintained at 40/25°C (maximum/minimum).
Measurement of chlorophyll
DUALEX measures the chlorophyll content of a leaf based on the transmittance ratio at two different wavelengths. One in the far-red absorbed by chlorophyll and one in the near-infrared as a reference. The leaf chlorophyll content can rapidly and accurately be assessed from light transmittance. A first wavelength very close to the red quantifies the chlorophyll and a second in the near-infrared can take into account the effects of leaf structure.
Chlorophyll index = (Near-infrared transmittance – Red transmittance)/(Red transmittance)
Measurements of polyphenols (flavanols) and anthocyanin
DUALEX measures flavanols and anthocyanins content of the leave’s epidermis based on differential ratio of chlorophyll fluorescence. Near-infrared chlorophyll fluorescence is measured under a first reference excitation light not absorbed by polyphenols. It is compared to a second sampling light specific to a particular type of polyphenols (e.g., green for anthocyanins or UV-A for flavanols). Only a fraction of this light reaches the chlorophyll in the mesophyll and can generate near-infrared fluorescence.
Flavanol index = Log (Near-infrared fluorescence excited red/Near-infrared fluorescence excited UV-A)
Anthocyanin index = Log (Near-infrared fluorescence excited red/Near-infrared fluorescence excited green)
Differential measurement of fluorescence emitted by chlorophyll
The difference in chlorophyll fluorescence measured in the near-infrared is thus directly proportional to the amount of polyphenols (flavanols) present in the epidermis of the leaf.
Measurement of nitrogen balance index
It is the ratio of chlorophyll to flavanol index. Polyphenols, specifically flavanols, are indicators of nitrogen status of plants. Indeed, when a plant is under optimal conditions, it favors its primary metabolism and synthesizes proteins (nitrogen-containing molecules) containing chlorophyll and a few flavanols (carbon-based secondary compounds). On the contrary, in case of nitrogen deficiency, the plant directs its metabolism toward an increased production of flavanols.
Membrane Stability
The membrane stability index (MSI) was determined using the electrolyte leakage (EL) method. For keeping uniformity among samples, the well-developed fully expanded fourth leaf from the top of test plants was collected, washed using distilled water, surface dried, and dipped in deionized water at 40°C for 1 h. The electrical conductivity (EC) of tissue leachates was measured using a conductivity meter (Model HI2300, Hanna, United States). The contents were incubated further by dipping the same leaf in deionized water at 100°C for 1 h and EC was measured. The MSI was calculated by the following formula:
MSI = C1/C2, where C1 = EC (EC μS) at 40°C for 1 h and C2 = EC (EC μS) at 100°C for 1 h (Blum and Ebercon, 1981)
Fluorescence Image Analysis
Leaf samples of all high temperature (40/25°C; maximum/minimum) grown urdbean genotypes from both groups (heat tolerant and sensitive) were used for chlorophyll fluorescence studies as described by Schreiber and Bilger (1987). High temperature grown genotypes were given hot water heat shock at 43°C for 1 h and thereafter stressed leaves were dark-adapted for 10 min in a temperature-controlled chamber and image analysis was conducted. Photosynthetic response between the tolerant and sensitive lines was assessed using a fluorescence imaging system (Mess & Regeltechnik, Waltz, Germany). The dark-adapted leaves were subjected to 0.05 μmol weak 2 Hz modulated light for 100 μs followed by superimposing saturation light pulses of 4000 μmol m–2s–1 PAR for 400 ms to obtain quantum yield (Fv/Fm; variable to maximum fluorescence ratio) and fluorescence images were captured. Subsequently, leaves were exposed to actinic light of 200 μmol photons m– 2s– 1 for 2 min for light adaptation. Same saturated pulses were superimposed to obtain quantum yield in light-adapted leaves. Quantum yield (FV/Fm), maximal fluorescence (Fm), minimum fluorescence (F0), and quantum yield of non-regulated energy dissipation [Y(NO)] values were compared between heat tolerant and sensitive genotypes.
Photosynthetic Electron Transport Rate
All tested 13 genotypes were pretreated with thermal shock at 43°C for 1 h by inserting leaves in a circulating hot water bath. This temperature was considered detrimental for the photosynthetic membrane and induces disorganization of photosystems and membrane bound electron transport components. Light response of ETR representing the photosynthetic activity of leaves of all tested urdbean genotypes was studied using software ImagingWin (Walz-Imaging System, GmbH, Germany) employing an irradiance range of 200–700 μmolm– 2 s– 1. The light curve and initial fluorescence values (F0 and Fm, respectively) of the dark-adapted leaves were used for calculation of ETR (ETR = Quantum yield × PAR × 0.5 × Absorptivity). Absorptivity describes the fraction of incident light, which is absorbed, and 0.5 indicates that only half of the absorbed quanta is distributed to PS II (under steady state conditions). The light curve of an individual selection was obtained with increasing order of irradiance until ETR was light saturated.
Fluorescence Parameters During Light–Dark Transition
After measuring the F0, Fm and Fv/Fm in dark-adapted leaves, the leaves were exposed to actinic light of irradiance 200 μmolm– 2 s– 1 and then saturated light pulse was triggered at every 50 s to obtain F0, Fm and Fv/Fm in light-adapted leaves until 250 s of illumination. Thereafter, actinic light was switched off and F0, Fm and Fv/Fm were measured at every 50 s in order to ascertain the restoration of normal F0, Fm and Fv/Fm in heat-tolerant and sensitive lines during a dark cycle.
In another experiment, high temperature grown contrasting urdbean genotypes were allowed to adapt in the dark for 5 min and thereafter saturated light flash 4000 μmolm– 2 s– 1 was triggered for 100 ms to obtain F0 and Fm. Then, leaves were exposed to actinic light 200 μmolm– 2 s– 1 for light adaptation. The light phase was continued until 350 s and then at every 15 s saturated pulse was applied to obtain F0 and Fm. Thereafter, leaves were put into a dark phase for adaptation and in a similar manner a saturated pulse was applied at every 15 s to obtain F0 and Fm. The only difference between these two events was fluorescence kinetics in light followed by in dark to see the recovery of F0 and Fm in a dark phase.
Biochemical Parameters-in vivo Visualization of Superoxide Radical and Hydrogen Peroxide
In vivo visualization of superoxide radical
In vivo assay of superoxide radical in the leaf was carried out according to the method of Frahry and Schopfer (2001). Fresh leaf samples were collected and dipped in staining solution for 1 h. The staining solution was composed of 10 mM sodium azide, 100 mM potassium phosphate (pH 7.8), and 0.1 % Nitroblue tetrazolium. After 1 h, leaf samples were bleached by immersing them into boiling ethanol for 15 min. The bleaching solution decolorized the leaves except the dark blue insoluble formazan deposits formed by the reaction of NBT with a superoxide radical. The photographs of the stained samples were captured using a good quality camera for further use.
In vivo visualization of hydrogen peroxide
The visualization of hydrogen peroxide in the leaf samples was examined using the method of Christensen et al. (1997). The collected leaf samples were washed using double distilled water. The washed samples were dipped into a solution containing 0.1% 3,3′-diaminobenzidine (DAB) dissolved in HCl acidified water (pH 3.8). Then, it was incubated for 16 h to allow the uptake of DAB and its reaction with H2O2 and peroxidase. The leaf samples were bleached by immersing them in boiling ethanol for 15 min. The photographs of the stained samples were captured using a good quality camera for further use.
Molecular Characterization
Genic SSR markers were used to characterize eight heat-sensitive (IPU99-200, IC-21001, Shekhar-2, Uttara, PU-19, HPU-120, H-1, PKGU-1) and eight heat-tolerant (UPU-85-86, IPU94-2, IPU-98/36, No. 5/31, PGRU-95014, PGRU-95016, PLU-1, BGP-247) genotypes in the present study. Details of 21 genic-simple sequence repeat (SSR) markers were provided in Table 13.
DNA Extraction and PCR
DNA was extracted from 1-day-old seedlings by the Dellaporta et al. (1983) method. The SSR primer pairs for sequence-specific markers were designed from leguminous crops having relevance to abiotic stress tolerance (Table 13). PCR reactions were carried out in a 25-μl reaction volume in an Eppendorf Master Cycler (Eppendorf, Hamburg, Germany) with the following composition: 50 ng of genomic DNA, 10 mM Tris-HCl (pH 8.3), 50 mM KCl, 2.5 mM MgCl2, 0.08% Non-idet P40, 0.2 mM dNTPs, 1.5 pmoles each of forward and reverse primers, and 0.5 unit Taq DNA polymerase (Fermentas, Life Sciences). The amplification conditions were initial denaturation at 94°C for 3 min and 5 cycles at 94°C for 30 s, 56 to 46°C (-1°C each cycle), 72°C for 1 min followed by 35 cycles at 94°C for 30 s, 46°C for 1 min, 72°C for 1 min, and ends up with a final extension at 72°C for 7 min. PCR products were resolved on 3% agarose gel in TBE buffer at 80 V and the image was captured in a gel documentation system (Syngene, United Kingdom).
Statistical Analysis
Analysis of variance for yield at each growing environment (Kanpur-stress, Kanpur-nonstress, Vamban-stress, Vamban-non-stress) was performed using a statistical package augmented RCBD (Aravind et al., 2020) in RStudio application using R (Programming Language for Statistical Analysis) (R Core Team, 2019). The yield data across four growing environments were graphically analyzed for interpreting G × E interaction using the “GGEBiplotGUI” statistical package in RStudio software using R (Frutos et al., 2014). GGE biplot methodology, which is composed of two concepts, the biplot concept and the GGE concept, was used for yield analysis across locations (Gabriel, 1971; Yan, 2001). This methodology uses a biplot to show the factors (G and G × E) that are important for evaluation of genotypes and that are also the sources of variation in G × E interaction analysis of multi- location trial data (Yan et al., 2000; Yan, 2001). All the physiological and biochemical data points were subjected to statistical analysis using Microsoft Excel software. For molecular data, all gels were scored manually, and data were input into Excel (Microsoft) spreadsheets. The band data were scored as a 1/0 (presence/absence) matrix. Genetic similarity coefficients of pair-wise comparisons among the accessions analyzed were calculated based on Jaccard’s similarity coefficient (Jaccard, 1908) within the Similarity for Qualitative Data (SIMQUAL) module of NTSYS 2.02i (Rohlf, 1998). The Unweighted Pair Group Method with Arithmetic Mean (UPGMA) clustering method was used to construct the dendrogram.
Results
Characterization of Heat Stress Conditions and Identification of Heat Tolerant Genotypes
In the present study, natural heat stress conditions were determined based on mean yield obtained over 97 genotypes at two different locations (Kanpur and Vamban). The Kanpur location is situated in the northern part of India (26.28°N and 80.21°E) where early sown (mid-May) genotypes experienced heat stress with a rise of temperature (>40°C) coinciding with the reproductive stage, whereas late sown genotypes received moderate temperature (<40°C) during onset of flower followed by pod setting to grain development (Figure 1). Mean yield of early sown trials at this location was low (910 kg/ha) compared to late sown trial (1224 kg/ha) (p < 0.05). Similarly, the Vamban location is the extreme southern part of India (10.20°N, 78.50°E) where early sown crops are usually subjected to stress conditions with a rise of temperature to the extent of about 40°C during the reproductive stage (Figure 1). Early sown trials of this location showed low average yield (895 kg/ha) compared to late sown trials that had low temperature (<40°C) during the reproductive stage and higher mean yield (925 kg/ha) for 97 genotypes (Table 1) (p < 0.05). Analysis of variation over 97 genotypes for yield showed significant genotypic differences at p < 0.05 and < 0.01 probabilities under stress (early) and non-stress (late) conditions at both locations (Table 2). The heat sensitive and tolerant genotypes were identified at a preliminary stage based on the heat susceptibility index (HSI) under a field trial conducted in two contrasting environments. Sensitive genotypes were characterized with an HSI ranging from 0.08 to 3.19 at the Kanpur location and from 0.37 to 13.75 at the Vambam location, while HSI varied from -0.01 to -20.48 at Kanpur and -0.03 to –62.29 at Vambam among tolerant genotypes (Table 3). GGE biplot analysis identified most stable genotypes over the locations for yield (Figure 2).
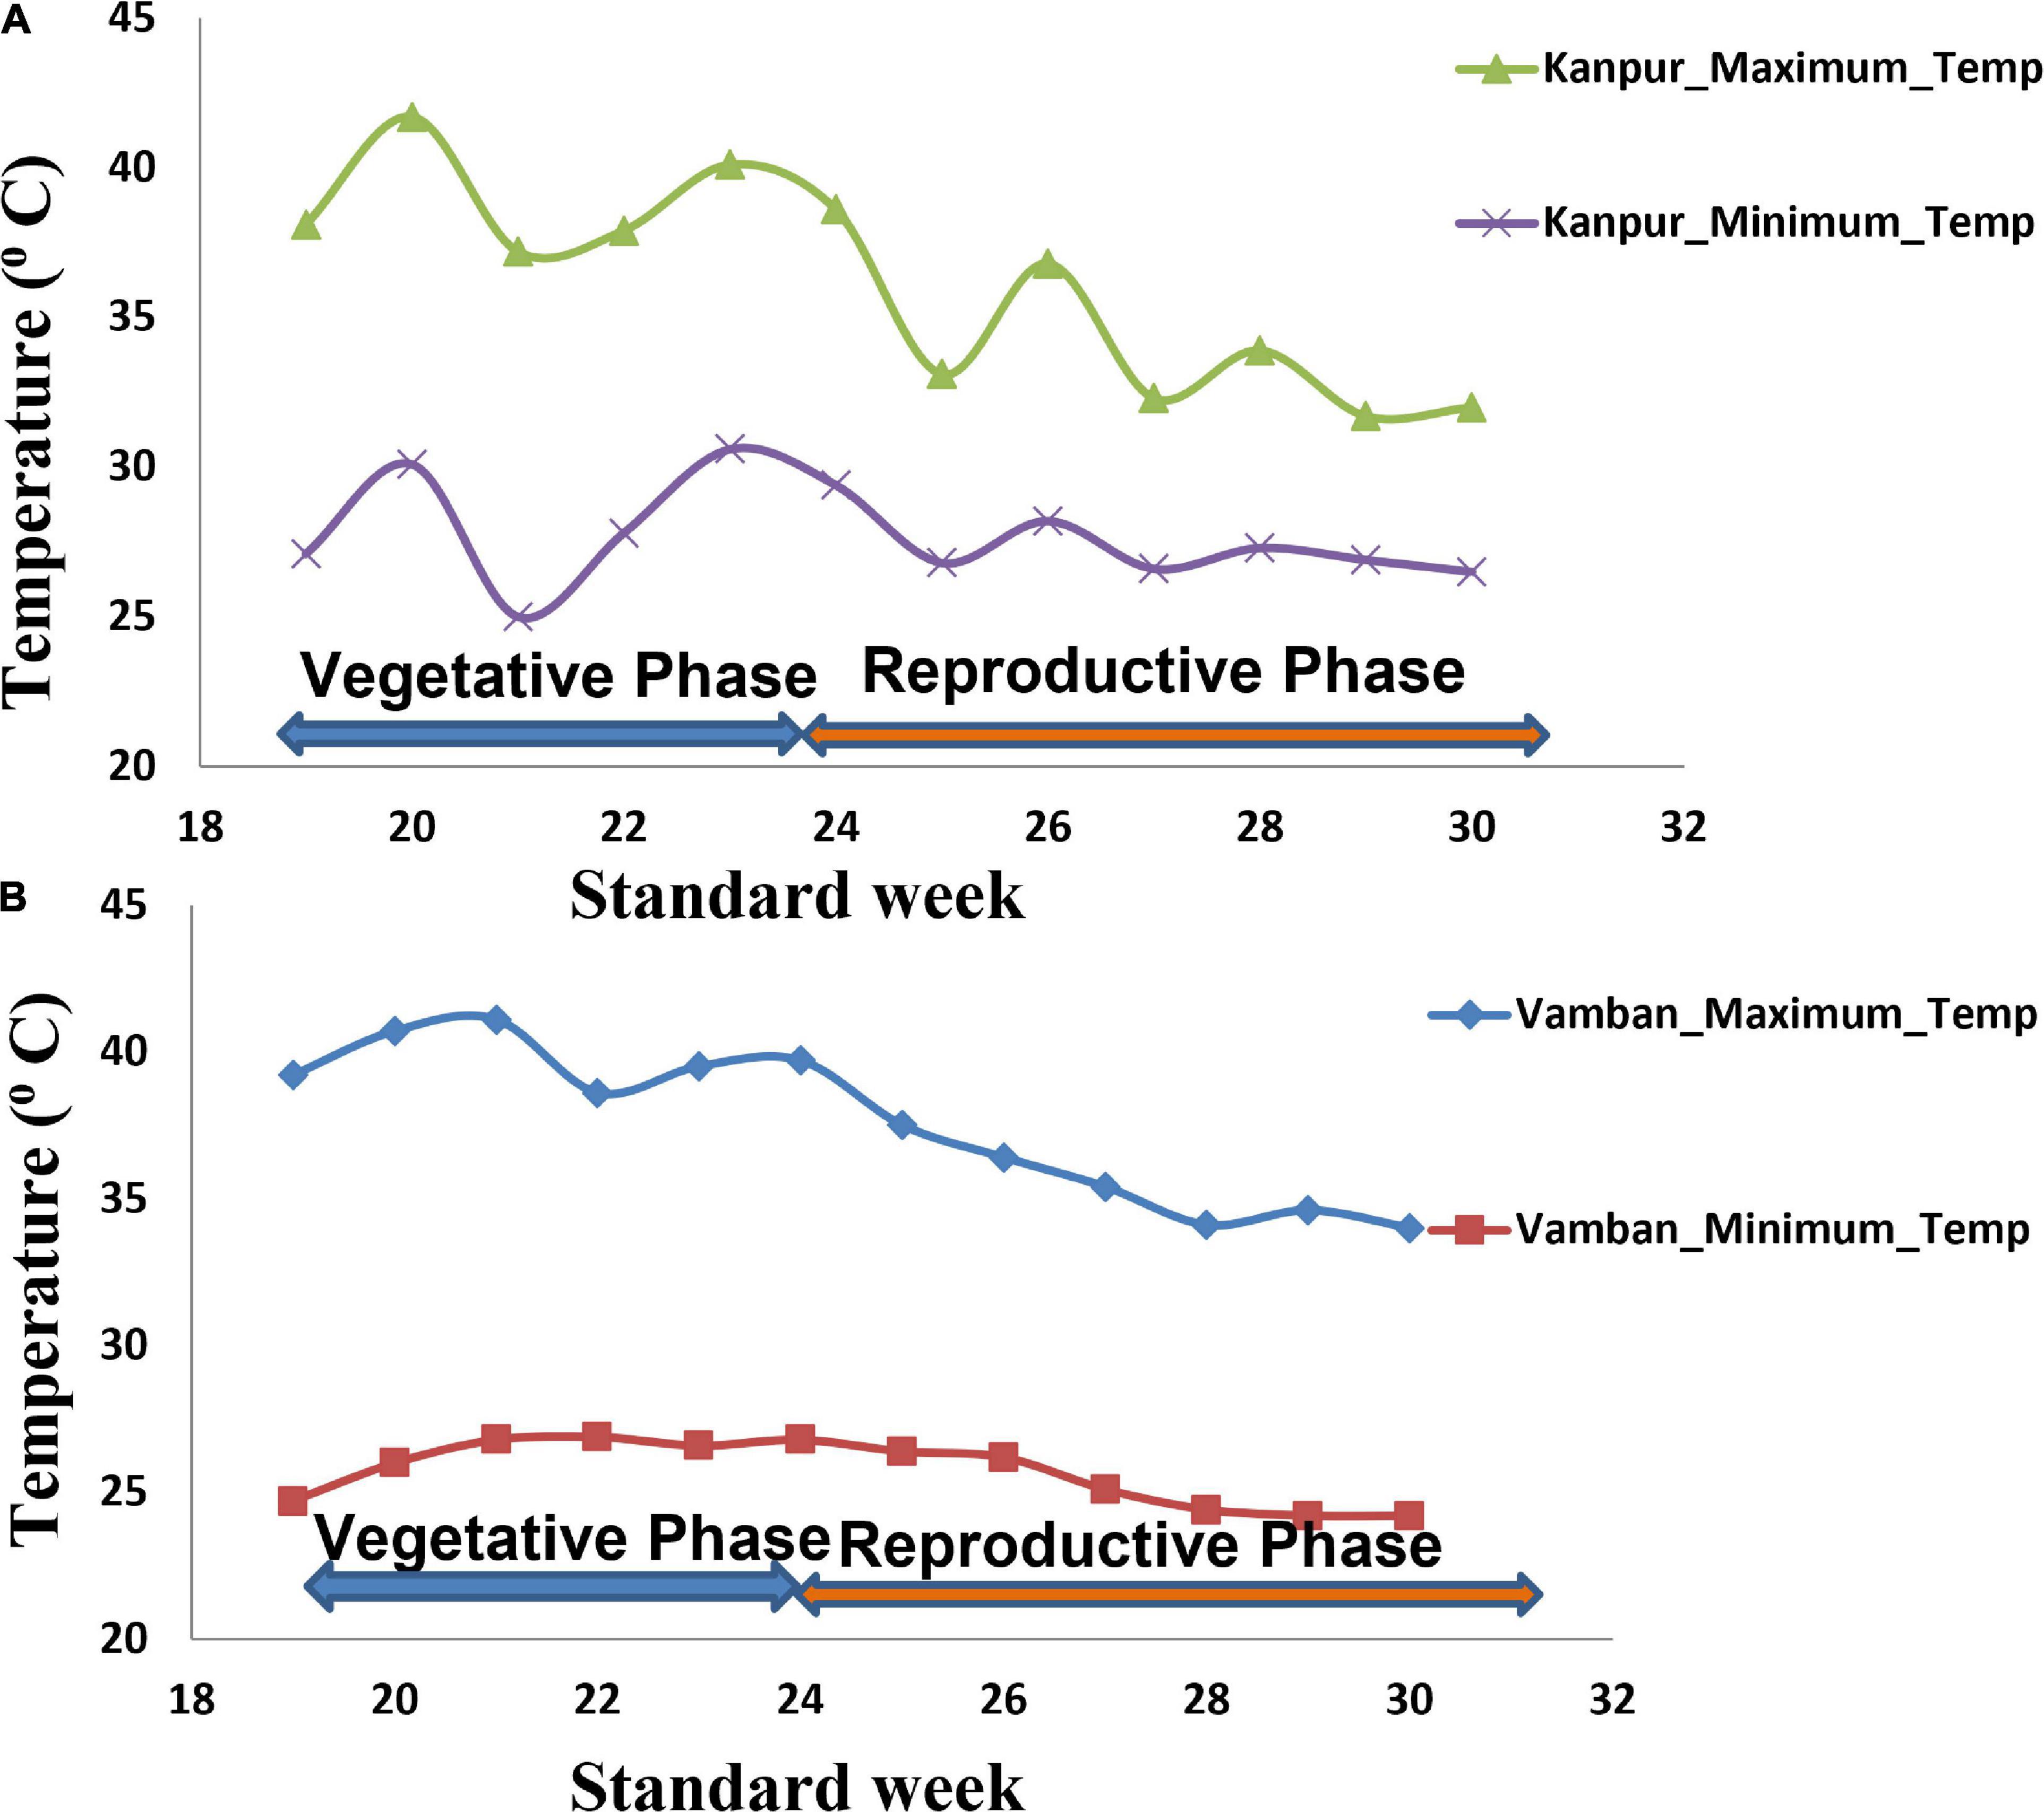
Figure 1. Temperature regime at two field trial sites during crop growth period (Kanpur and Vamban). (A) Temperature regime at the Kanpur location. (B) Temperature regime at the Vamban location.
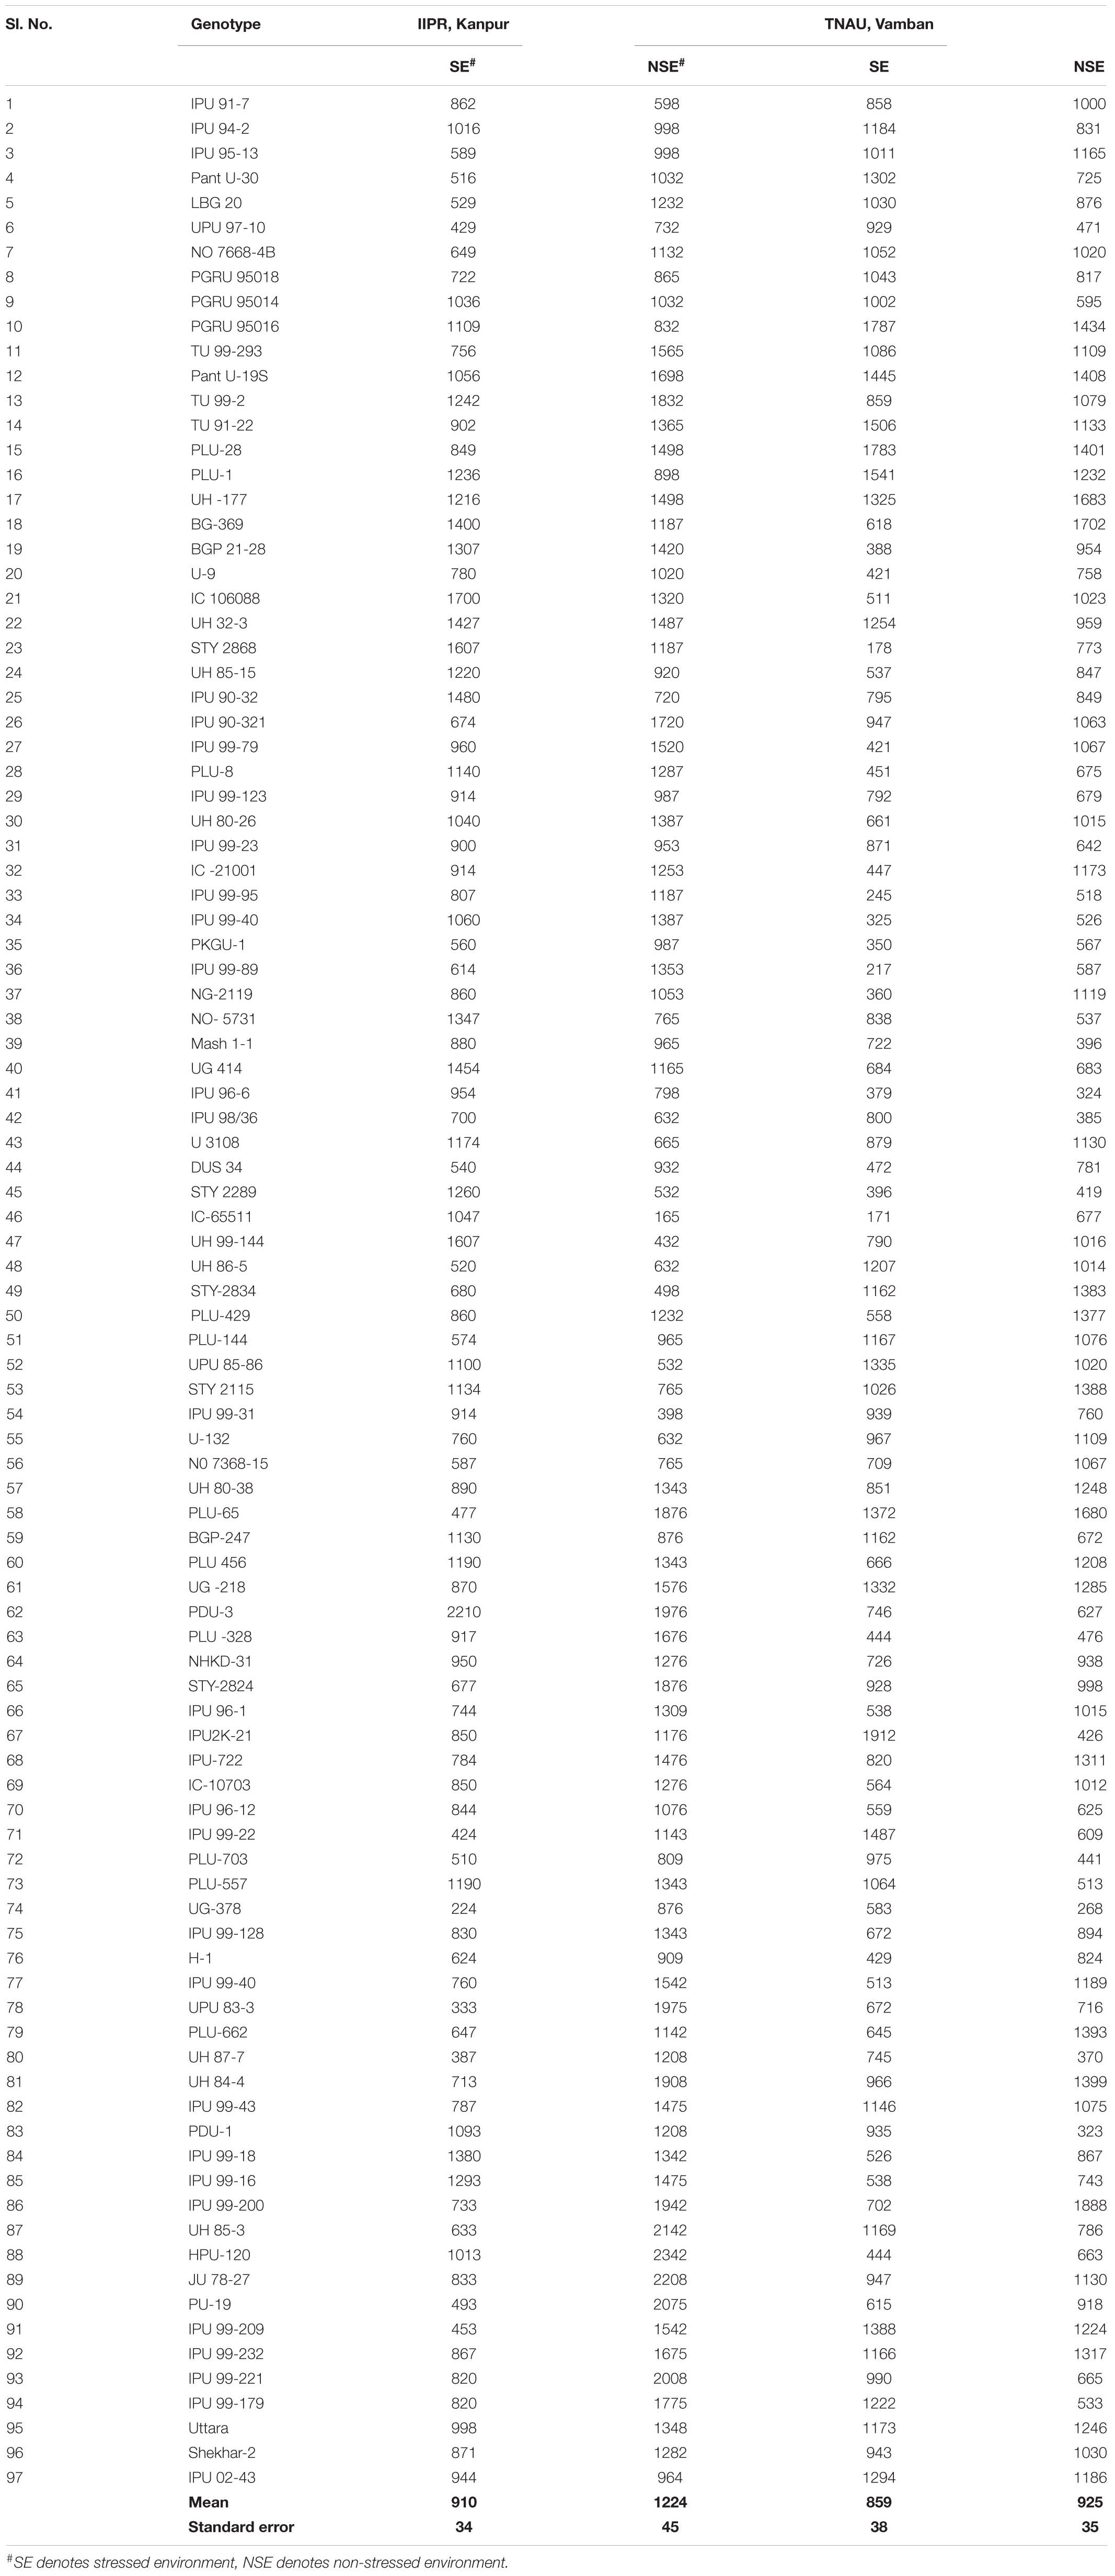
Table 1. Yield of 97 urdbean genotypes grown in IIPR, Kanpur and TNAU, Vamban.
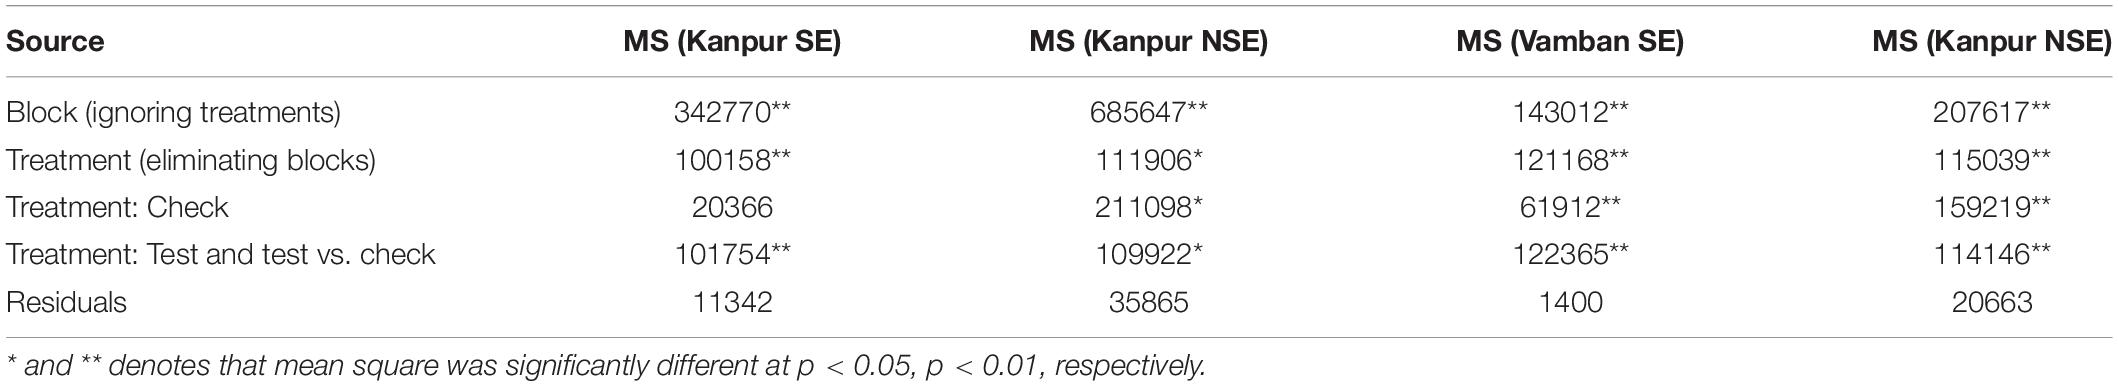
Table 2. ANOVA of yield over stress and non-stress environments in IIPR, Kanpur and TNAU, Vamban.
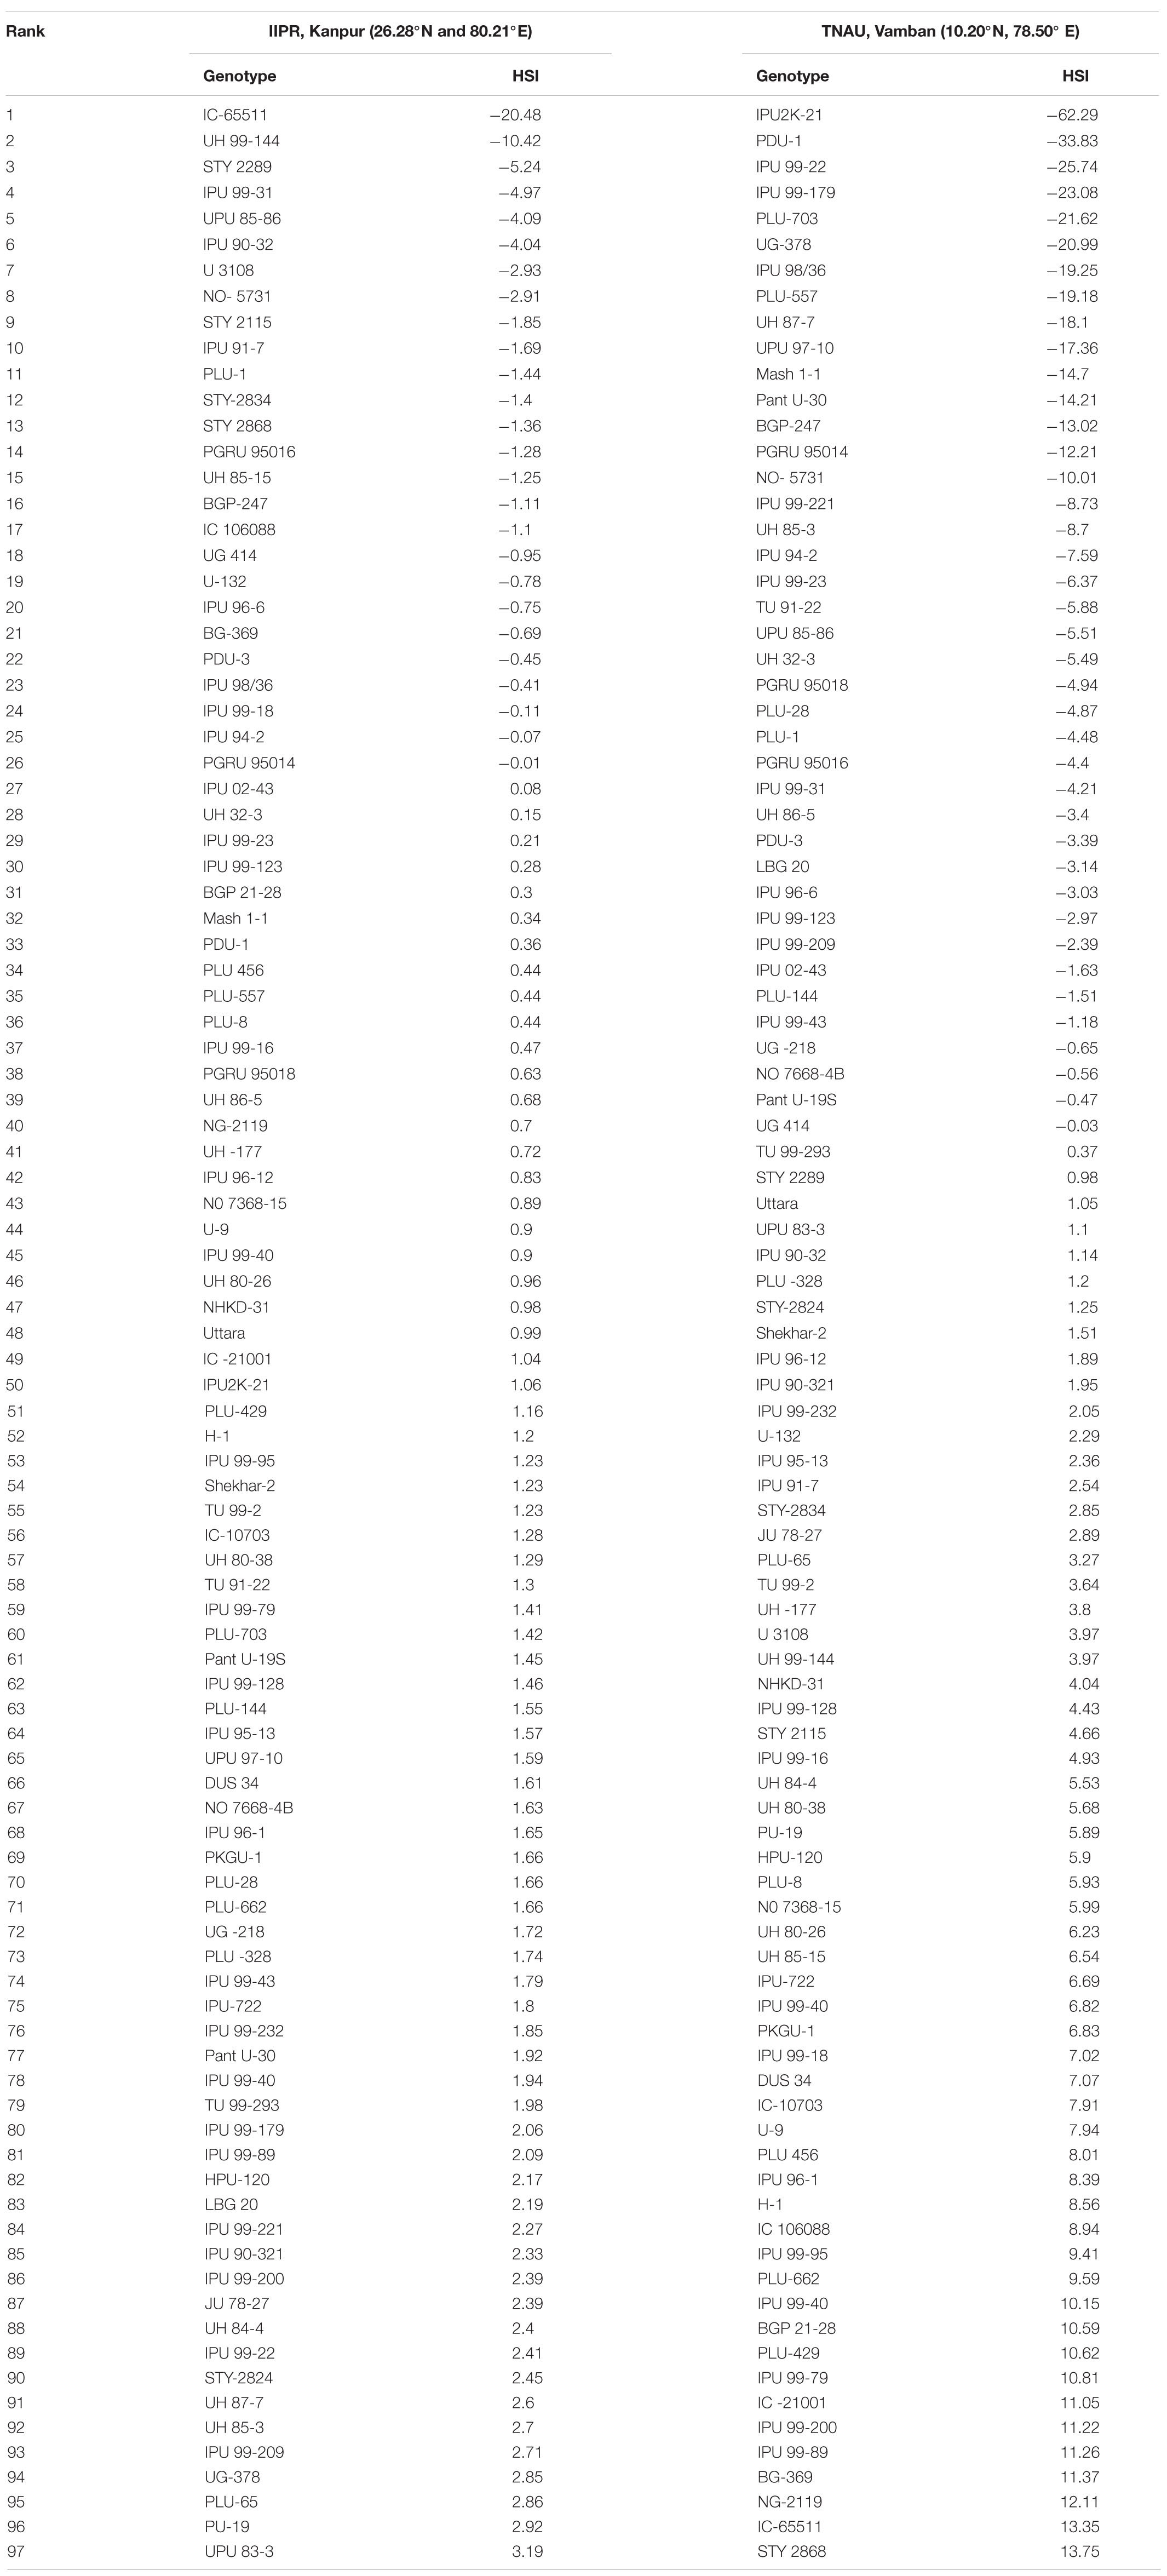
Table 3. Heat susceptibility index (HSI) of 97 urdbean genotypes under IIPR, Kanpur and TNAU, Vamban condition.
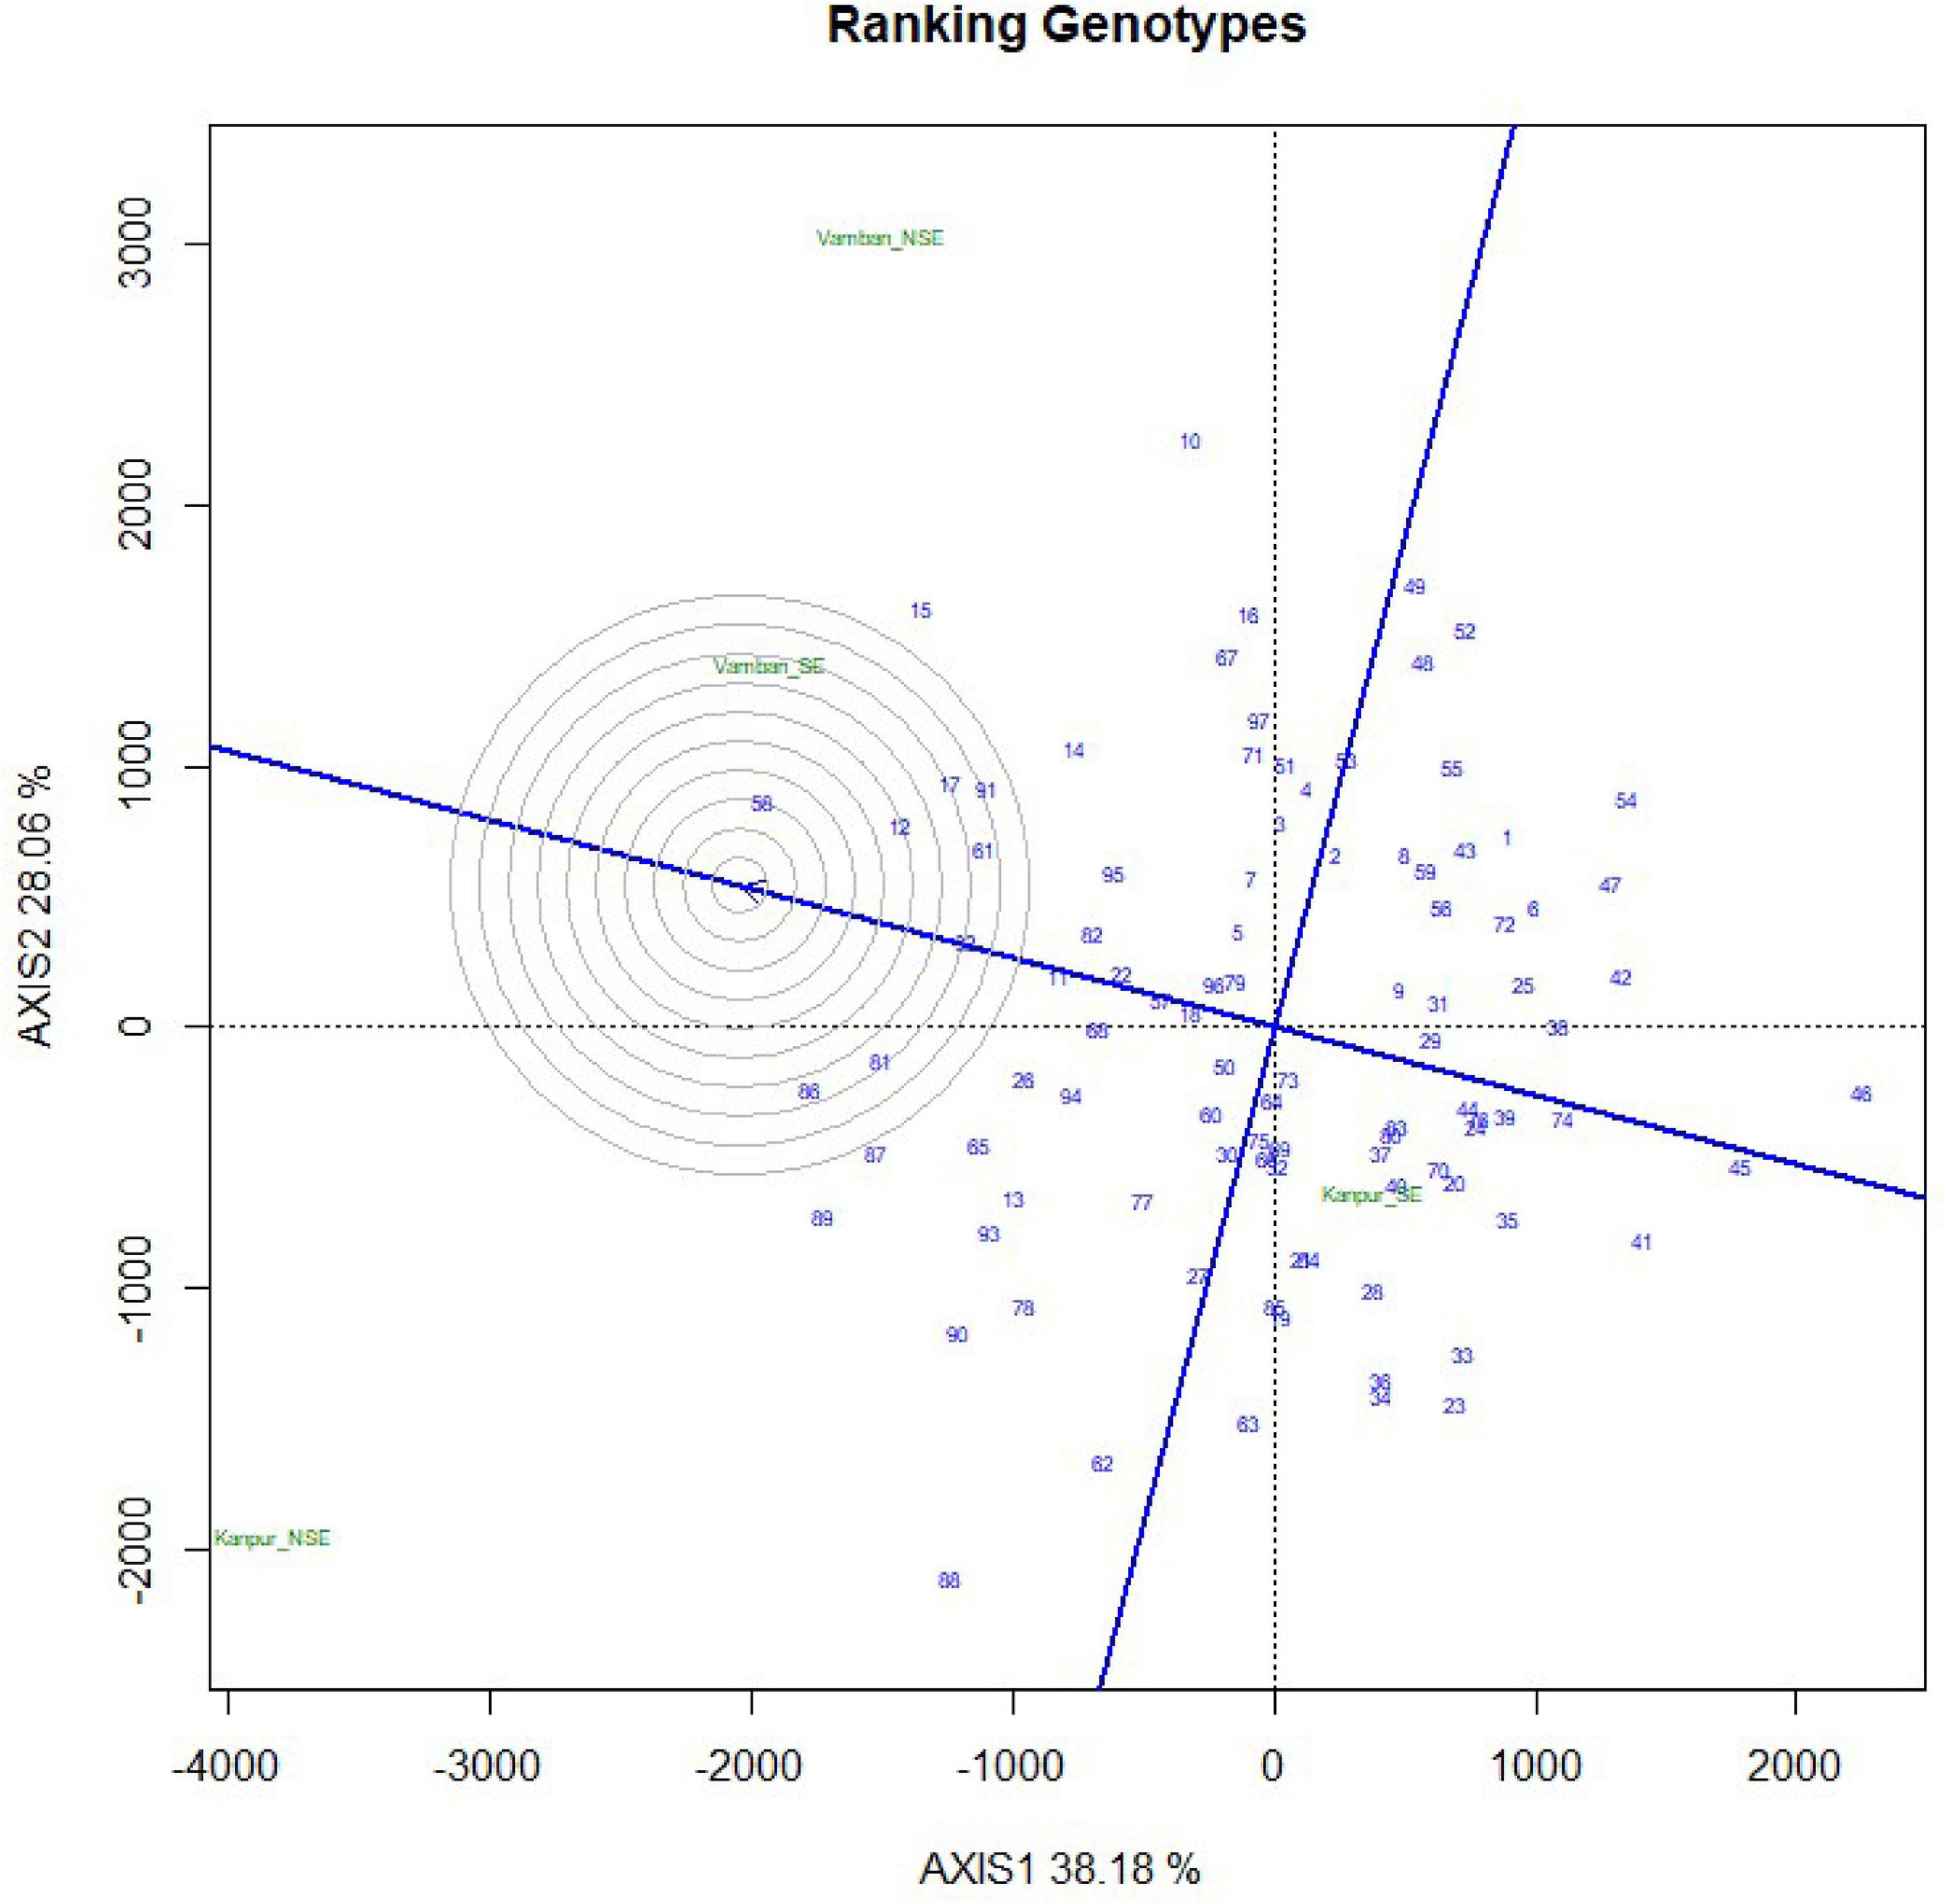
Figure 2. Ranking of 97 urdbean geneotypes by GGEBiplot analysis on the basis of yield data across four growing environments.
Physiological Characterization
Field trials identified 8 highly heat tolerant and 35 highly heat sensitive genotypes based on HSI (Table 4). Among these, six highly sensitive (IPU 99-200, IC 21001, Shekhar 2, PU 19, H-1, PKGU 1) and seven highly tolerant (UPU 85-86, IPU 94-2, IPU 98/36, NO- 5731, PGRU 95016, PLU 1, BGP 247) genotypes, showing stable HSI over both locations, were used for further physiological analyses (Table 4). These genotypes were grown under a controlled environment right from seedling stage until maturity in a high thermal regime (40/25°C: maximum/minimum) with high humidity and under optimum irrigation and soil fertility.
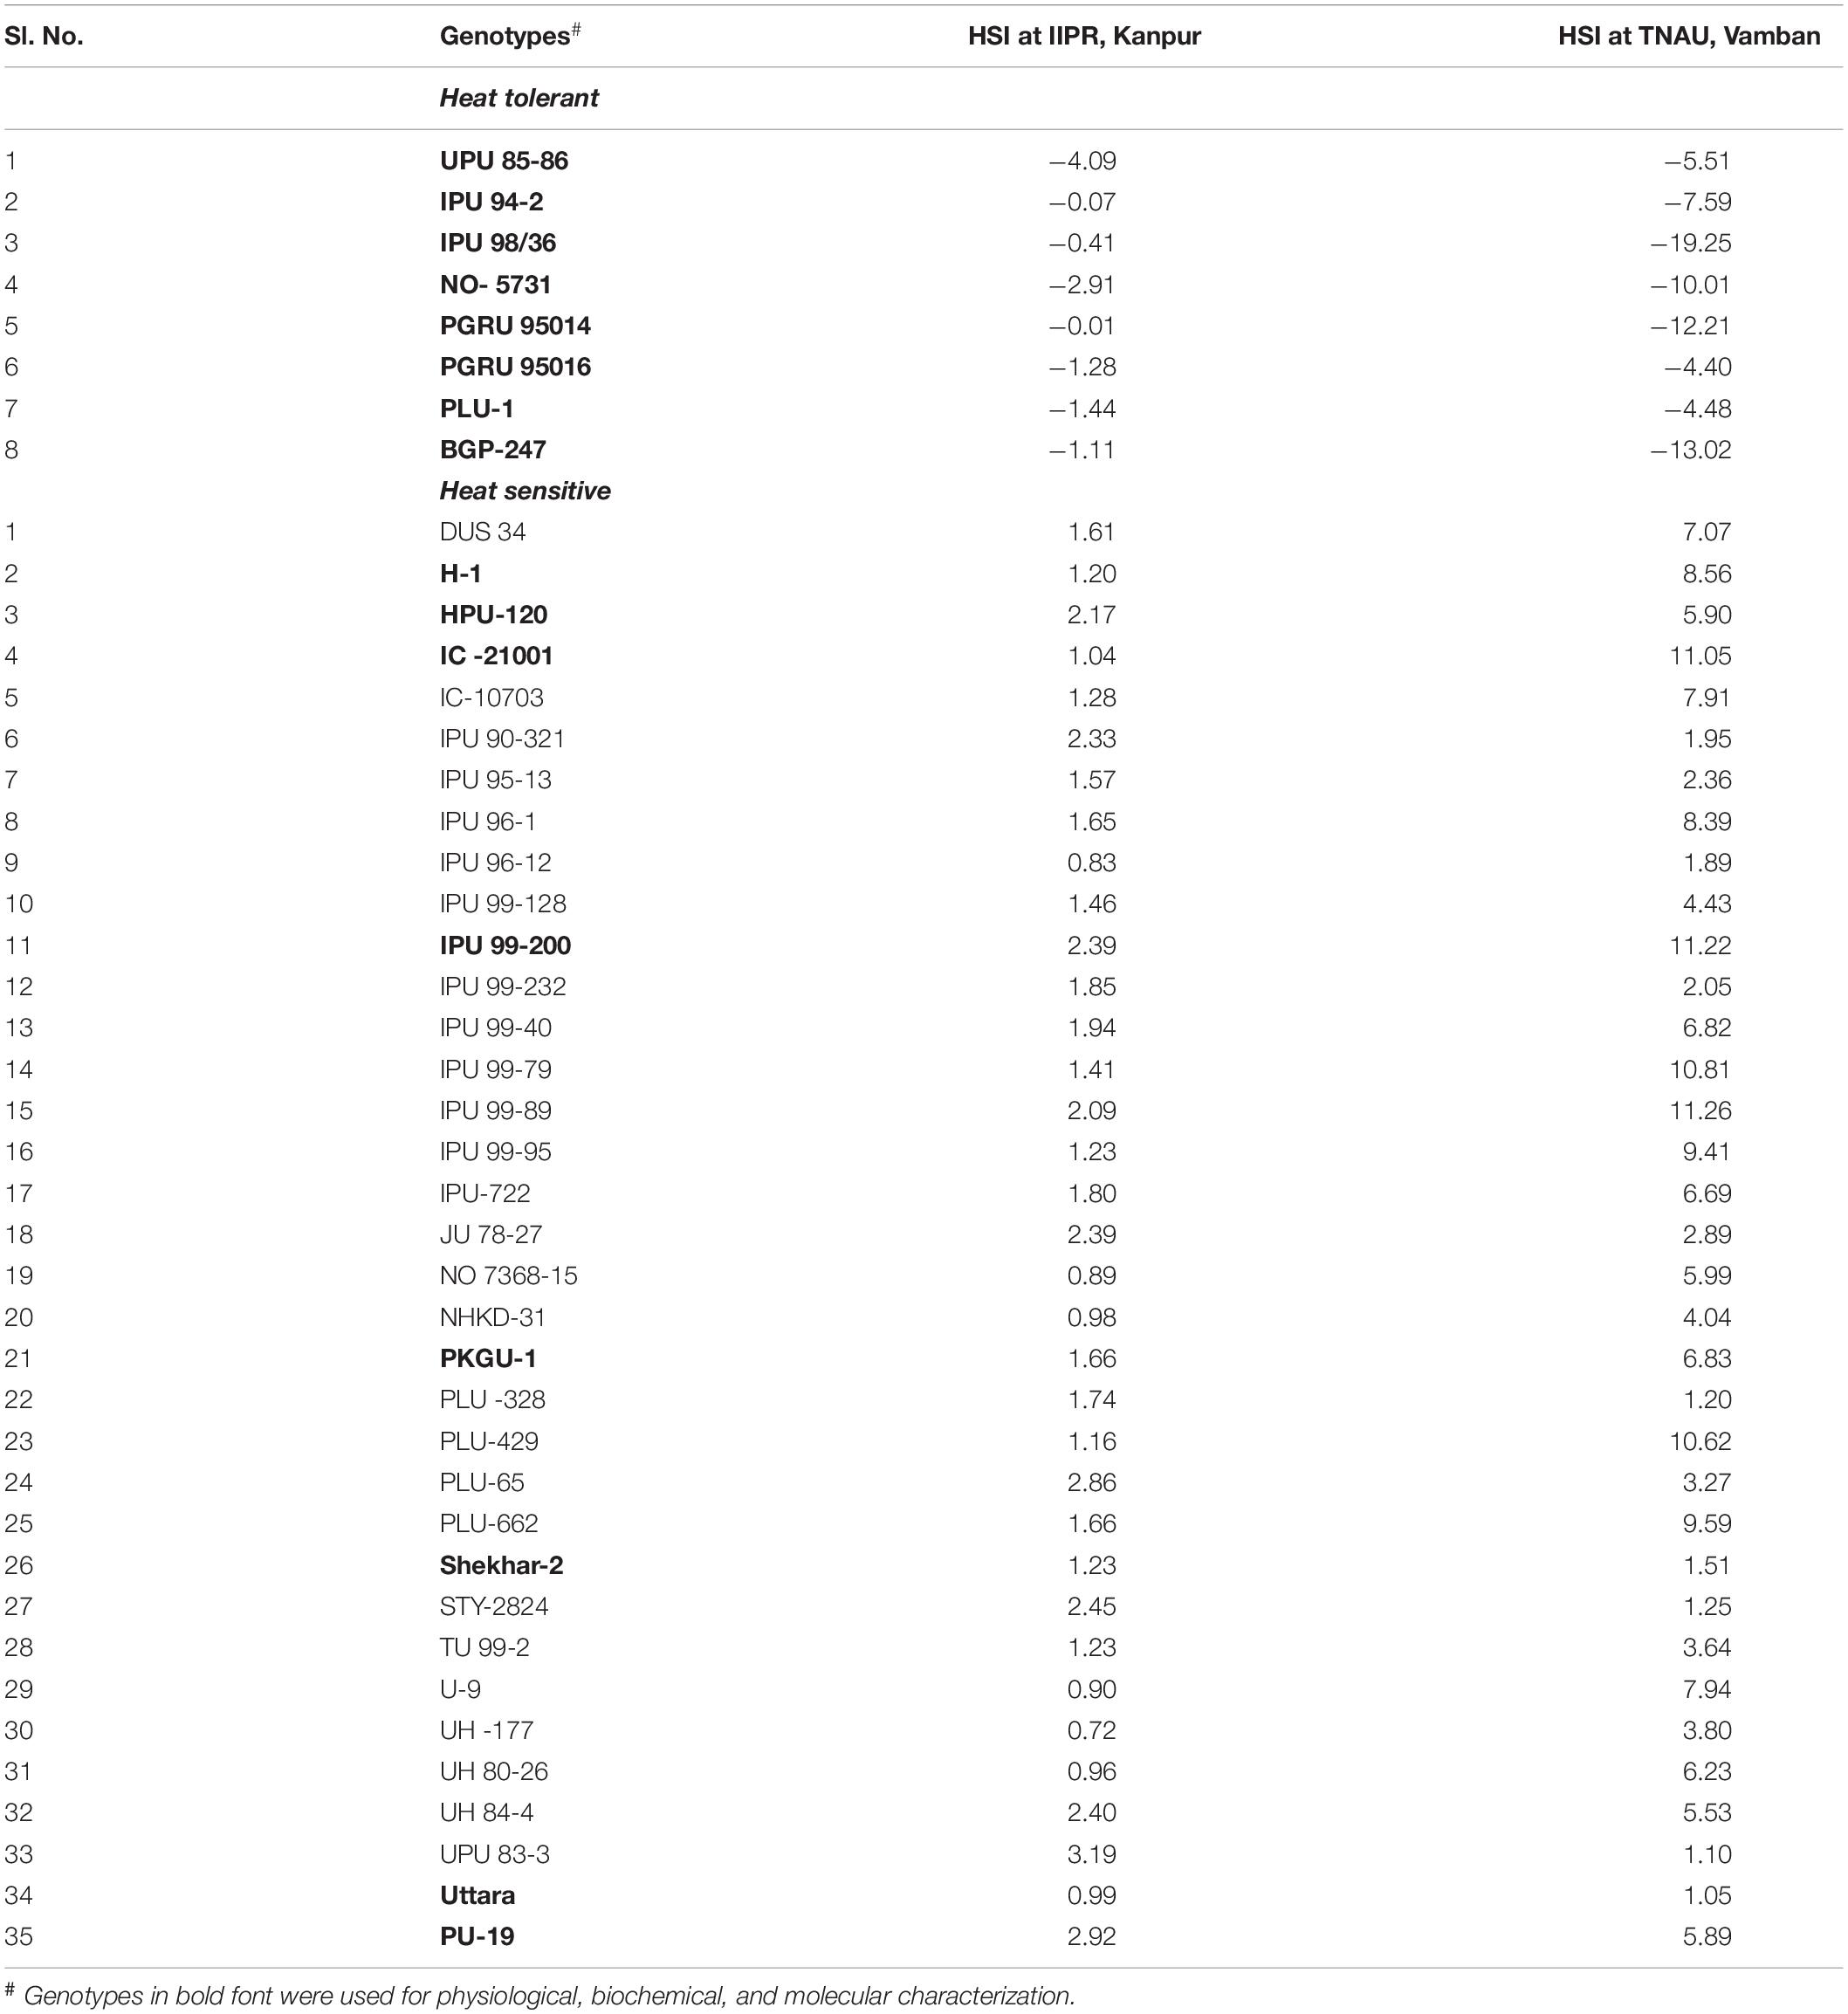
Table 4. Heat-tolerant and heat-sensitive urdbean genotypes over both the locations (IIPR, Kanpur and TNAU, Vamban) based on HSI.
Physiological Status Under Stress Environment
Changes in the physiological status were observed between two contrasting groups having different degrees of heat sensitivity when they were grown under higher thermal regime (40/25°C). The genotypic variability in nitrogen balance index (NBI) and chlorophyll (Chl) was significant (p < 0.05). No significant differences were observed among tested genotypes for anthocyanin and flavanol content when subjected to heat stress (Table 5). However, group comparison (heat tolerant vs. heat sensitive) (t-test) revealed significant differences in leaf nitrogen status (NBI) and anthocyanin (Anth) at p < 0.01 (Table 6).
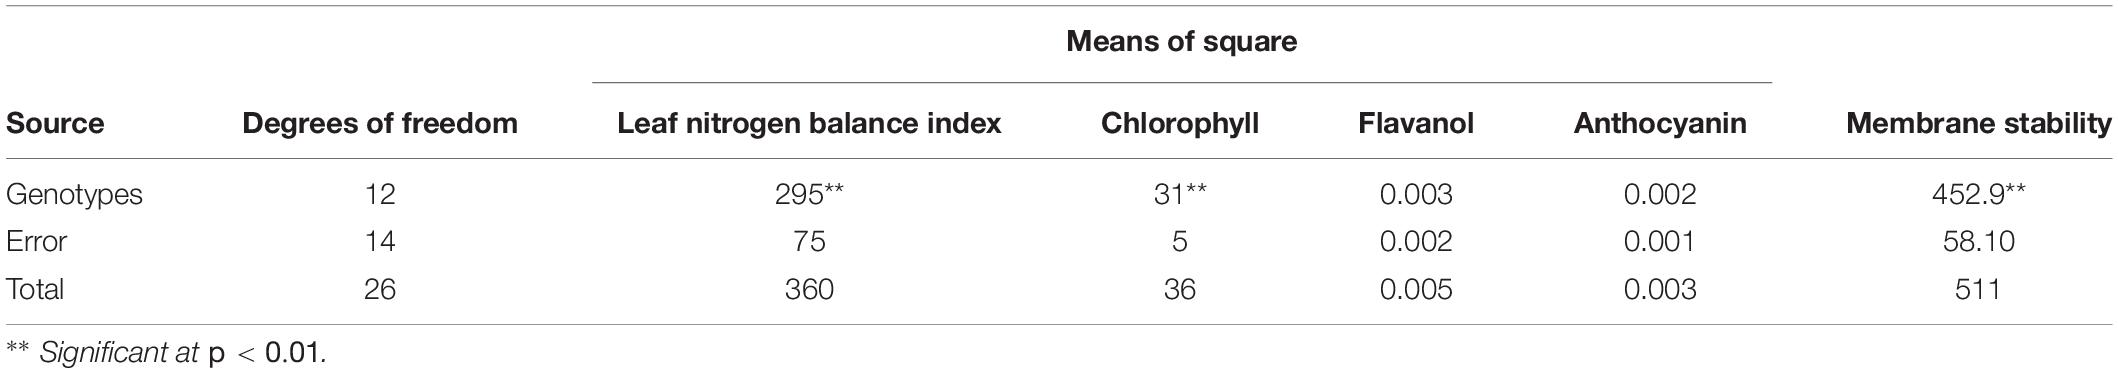
Table 5. Analysis of variance of fluorescence parameters of 13 tested urdbean genotypes.
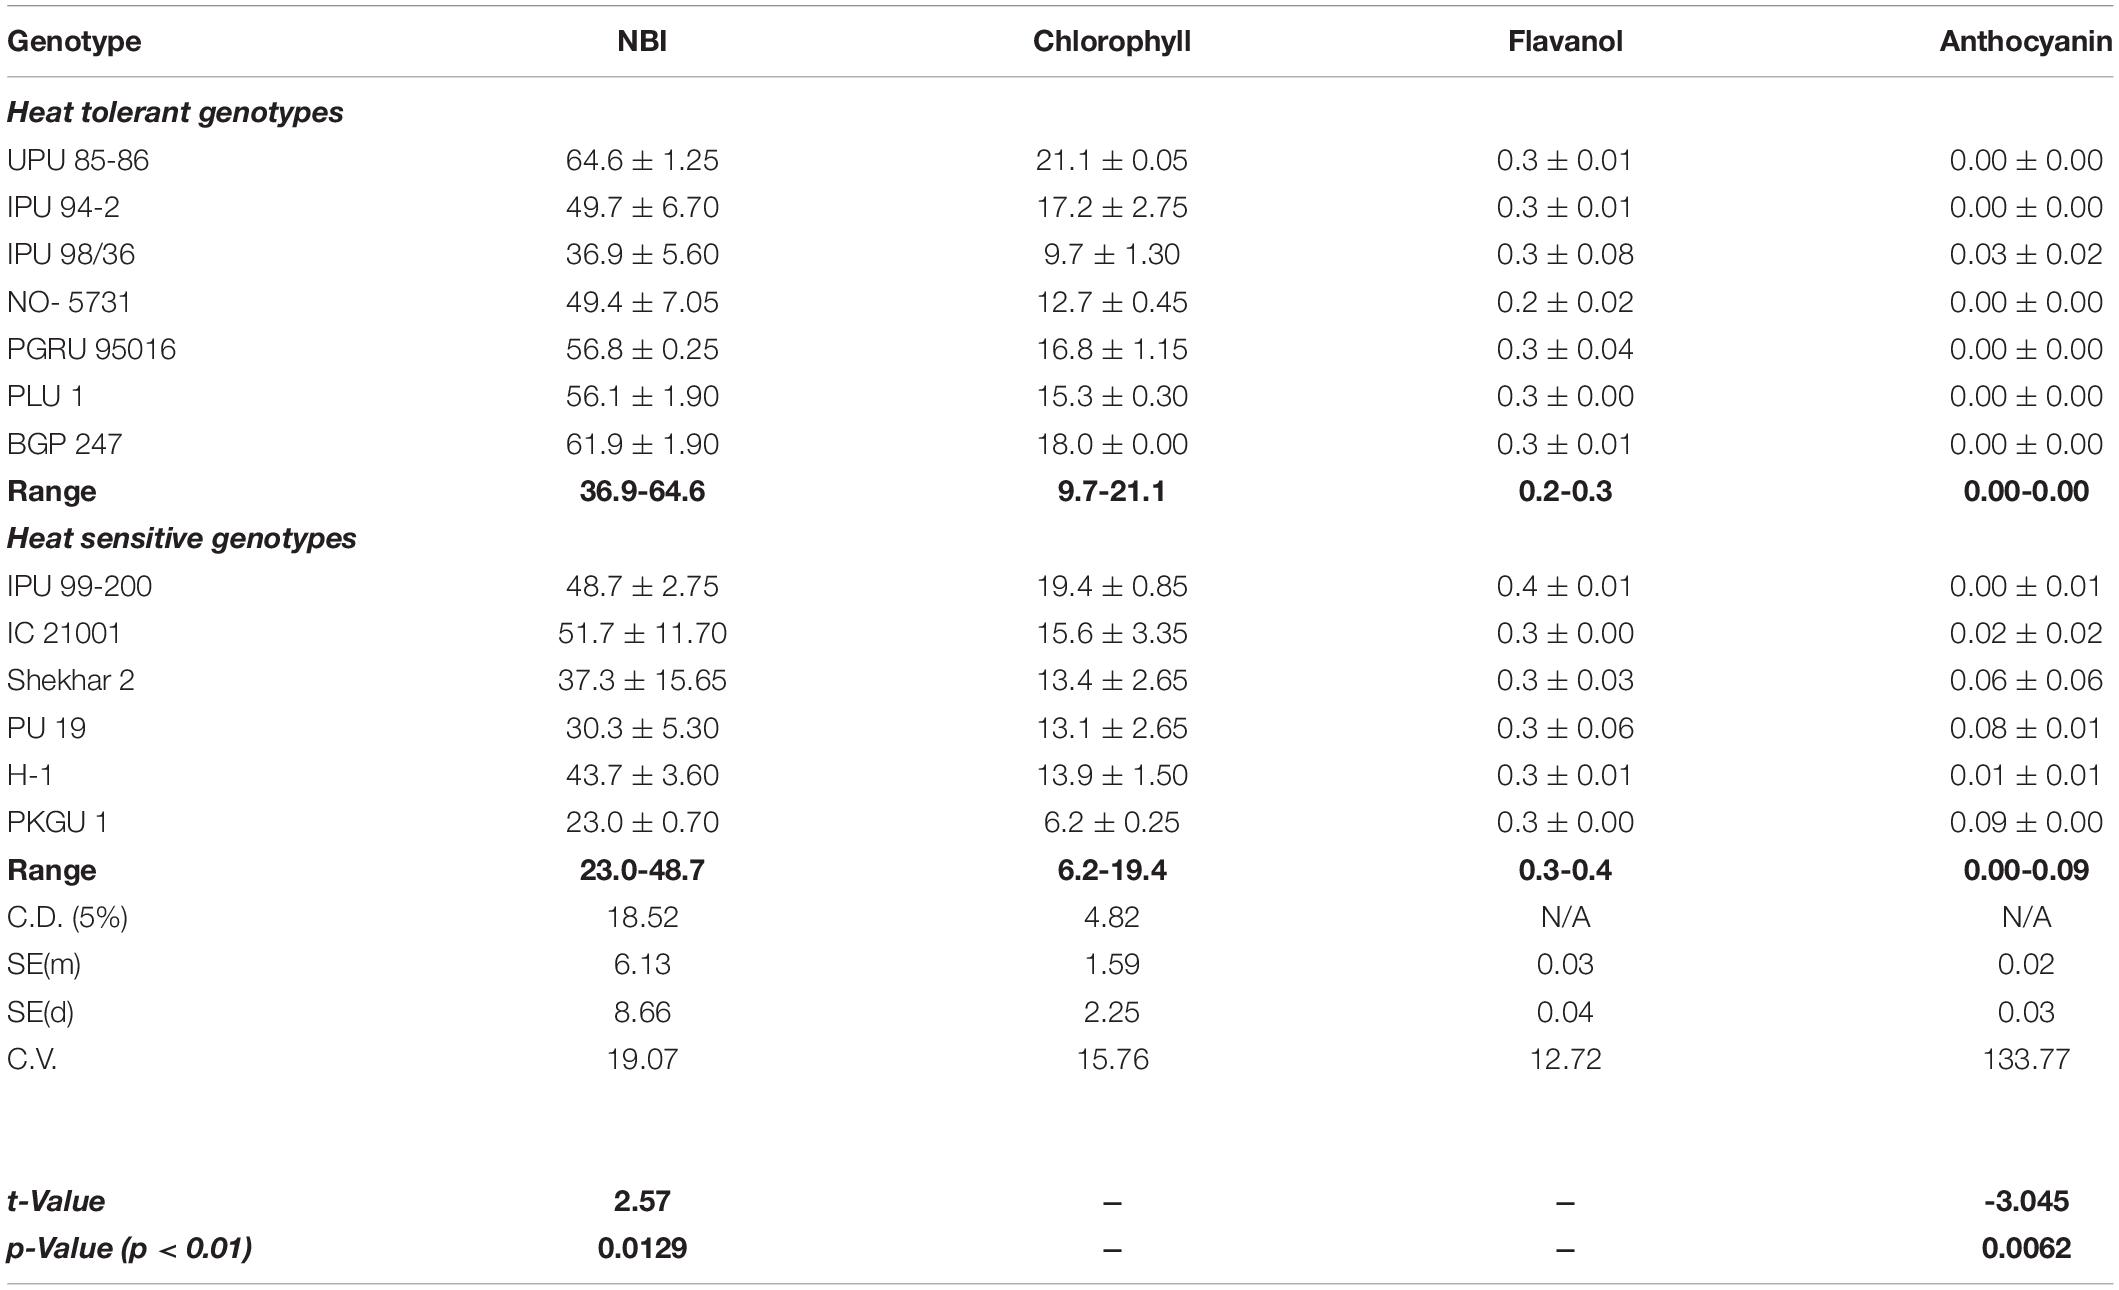
Table 6. Leaf nitrogen balance index (NBI), chlorophyll (SPAD), epidermal flavanols, and anthocyanins in different urdbean genotypes grown under 42/30°C max/min temperature.
In the present study, a range of genetic variability was observed higher among seven heat tolerant genotypes (36.9-64.6 and 9.7-21.1) compared to six heat sensitive genotypes (23.0-48.7 and 6.2-19.4) for NBI and chlorophyll content, respectively (Table 6).
Membrane Stability
Analysis of variance showed significant differences among the studied urdbean genotypes for membrane stability index (Table 5). It ranged from 32.3% to 74.5% in sensitive genotypes while it ranged from 34.5 to 62.8% in tolerant genotypes (Table 7). Although membrane stability was observed significantly higher in the sensitive genotype IPU 99-200 (74.5%), membrane stability was on average higher among tolerant genotypes compared with sensitive genotypes (Table 7). Among tolerant genotypes, maximum membrane stability was observed in PLU-1 (62.8 %) followed by UPU 85-86 (60.7 %) (Table 7).
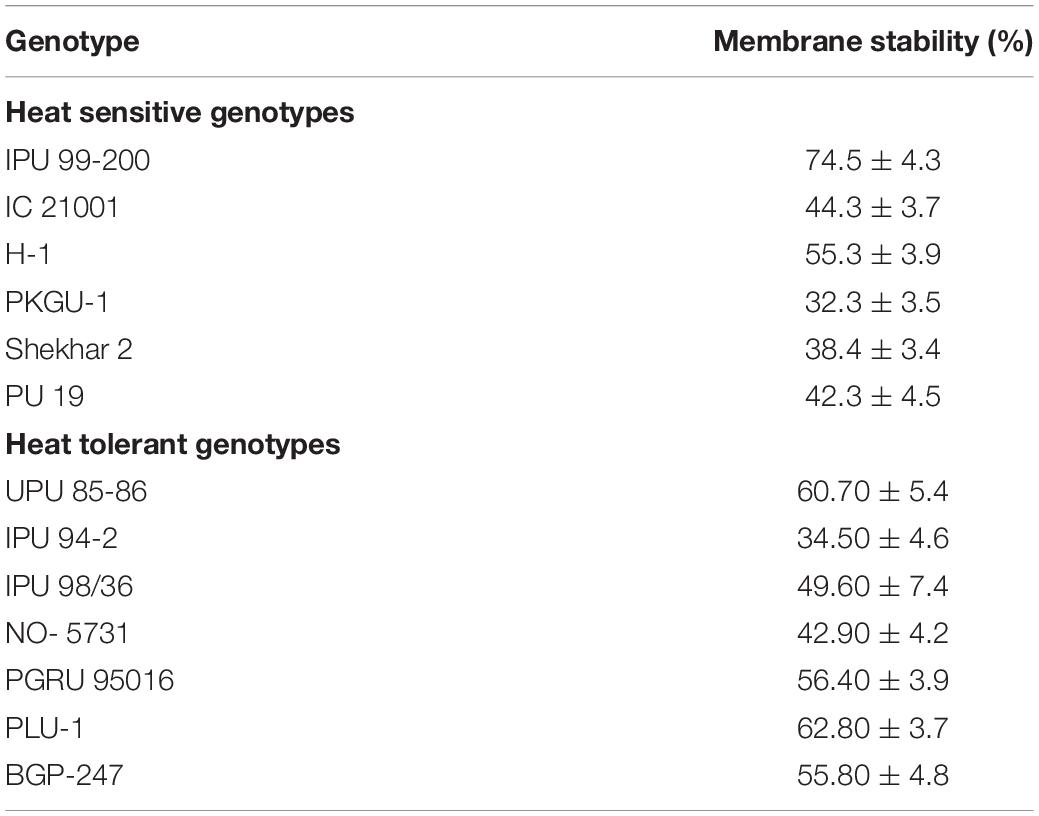
Table 7. Membrane stability of 13 urdbean genotypes.
Correlation Analysis Among Nitrogen Balance Index, Chlorophyll, Flavanol, Anthocyanin Contents, and Membrane Stability
A highly significant (p < 0.01) positive correlation (r2 = 0.85) was observed between NBI and chlorophyll content. Also, correlation of anthocyanin content with chlorophyll content (r2 = −0.72) and NBI (r2 = −0.89) was highly significant (p < 0.01) and negative in nature (Table 8).
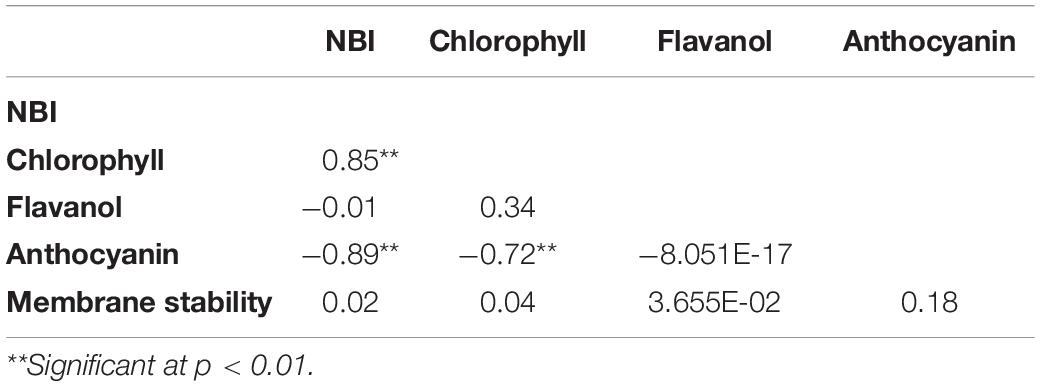
Table 8. Correlation analysis of nitrogen balance index (NBI), chlorophyll, flavanol, anthocyanin contents, and membrane stability.
Photosynthetic Electron Transport Rate
Photosynthetic electron transport rate (ETR) was analyzed among 13 heat sensitive and tolerant urdbean genotypes at increasing levels of PAR (photosynthetically active radiation). The analysis of variance showed significant differences among genotypes for ETR at different levels of PAR irradiances (Table 9). These differences were more noticeable with progressive increase in the levels of PAR irradiances among test genotypes (Figure 3). The interaction of PAR irradiances with genotypes (PAR × genotypes) was also observed to be significant (Table 9). In the present study, higher levels of irradiances were found to be the main determinant of differentiating thermotolerance based on photosynthetic performance in all studied genotypes after heat shock (43°C for 1 h). The light-saturated ETR was obtained almost in all test genotypes within the PAR ranging from 400 to 500 μmol m–2 s–1 (Figure 3). The PAR irradiances exceeding the saturation range of 400-500 μmol m–2 s–1 pose damaging effects on photosynthetic systems due to excessive production of superoxide radicals. Perhaps tolerant genotypes exposed to combined stress of high PAR irradiances and heat shock that still maintain high ETR have alternate mechanisms scavenging harmful radicals. However, under light limiting conditions below 400-500 μmol m–2 s–1, genotype performances were assessed primarily under single stress that was only heat shock. Therefore, the ability of heat tolerance can be detected but cannot be truly assessed under light limiting conditions. Realizing the facts under field conditions, actual heat stress is often combined or integrated with high solar radiation and the crop is forced to experience the combined effects of heat and high light stress, and assimilate production is virtually collapsed resulting in massive yield loss. In the present study, the light-saturated photosynthetic electron transport rate was observed higher than the mean of all test genotypes in most of the tolerant genotypes. Five out of seven heat tolerant genotypes (UPU 85-86, BG 247, PLU 1, PGRU 95016, and IPU 94-2) showed higher photosynthetic ETR than the rest of the tested urdbean genotypes.
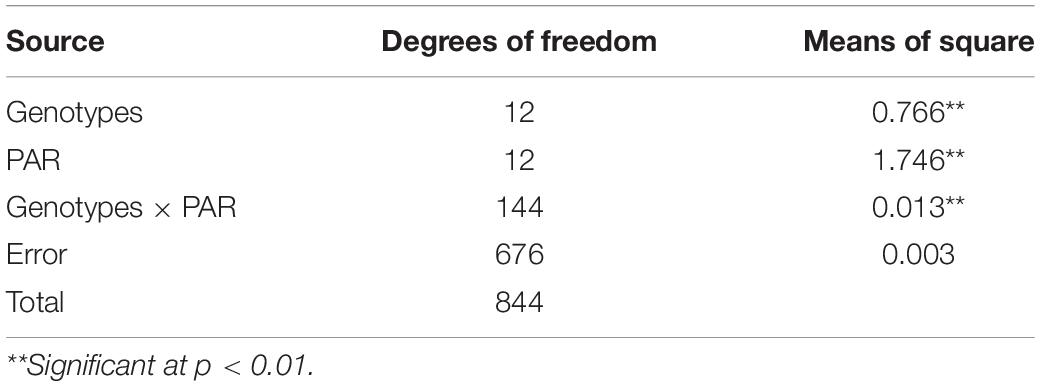
Table 9. Analysis of variance for electron transport rate.
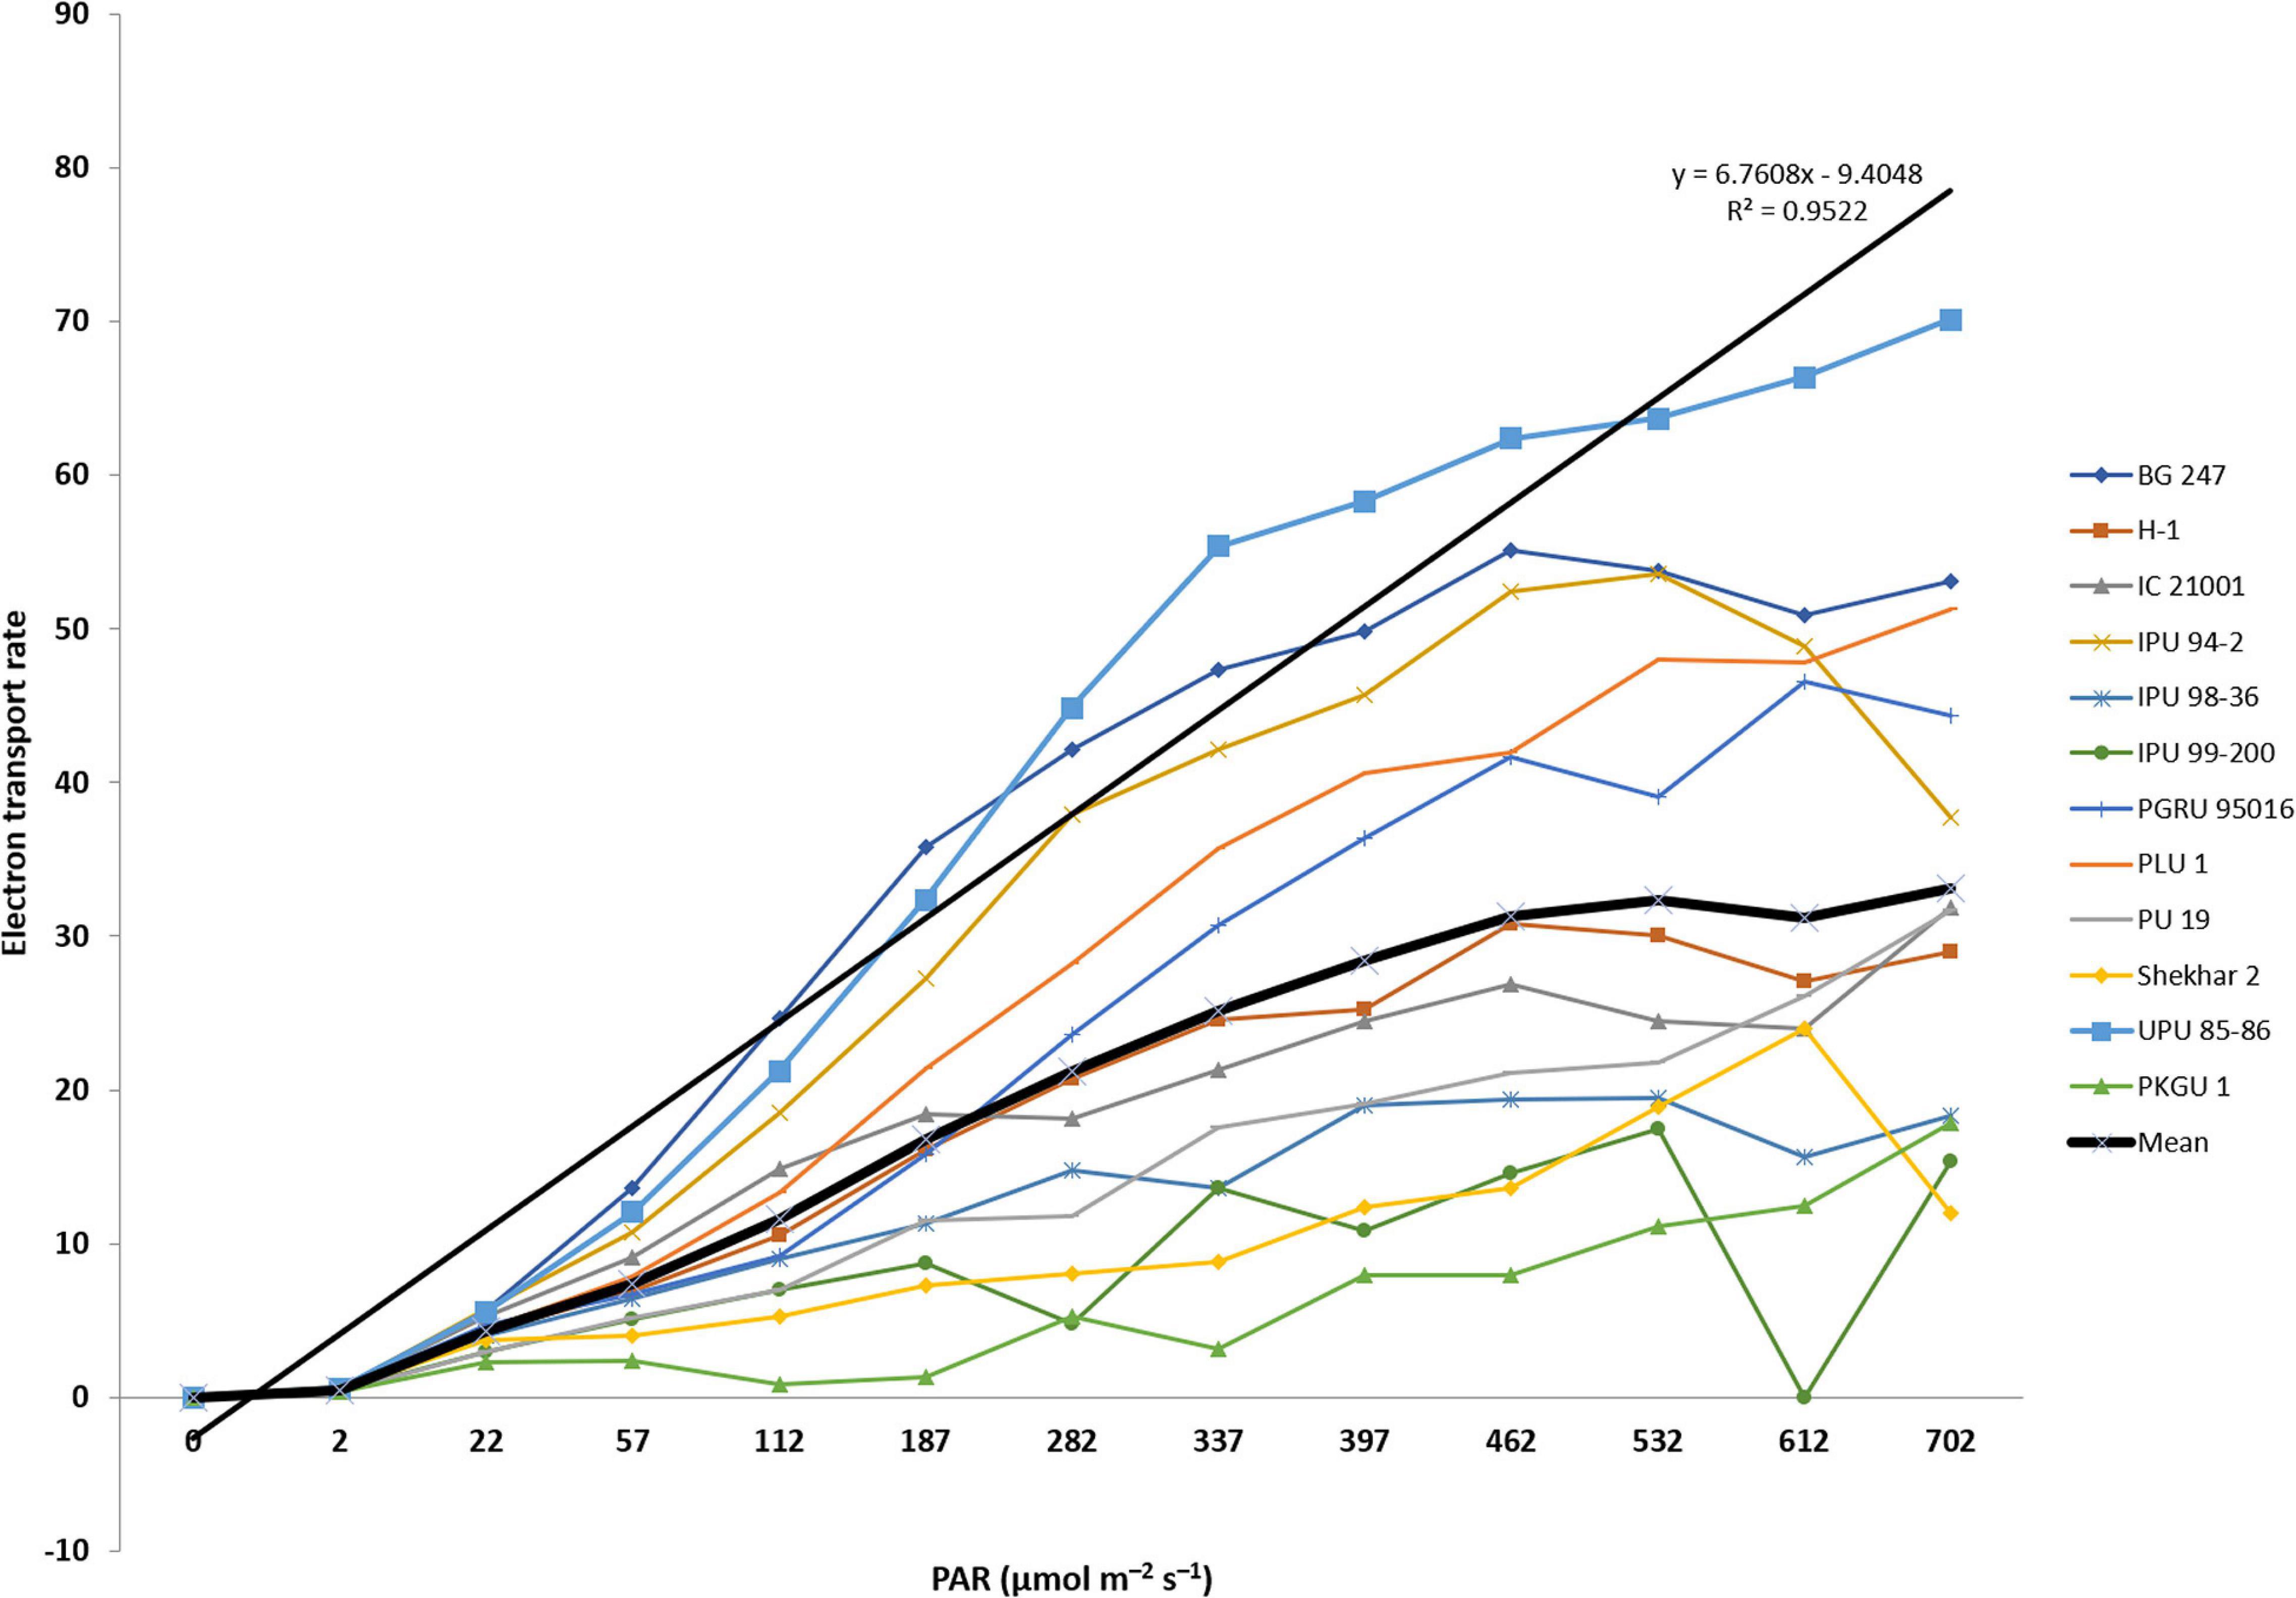
Figure 3. Electron transport rate (ETR) of heat tolerant and sensitive urdbean genotypes over increased irradiation (PAR).
Fluorescence Parameters in Highly Heat Tolerant and Sensitive Genotypes
Further studies remained confined to two extreme genotypes having a high degree of heat tolerance (UPU 85-86) and sensitivity (PKGU-1) based on the field trials and precision phenotyping. The different fluorescence parameters were analyzed to distinguish highly tolerant (UPU 85-86) and highly sensitive (PKGU-1) genotypes. Analysis of variance of fluorescence parameters between heat tolerant (UPU 85-86) and heat sensitive genotypes (PKGU-1) showed significant differences (Table 10). The mean value of these parameters is given in Table 11. The observed increase in average minimal fluorescence (F0) and corresponding decline in the maximal fluorescence (Fm) and variable fluorescence (Fv) in preheated leaves of sensitive genotype PKGU-1 was the strong indicator of distortion of PS II. Consequently, reduction in the quantum yield of PS II was evident in the sensitive one as compared to the tolerant genotype. The decrease in the quantum yield with concomitant rise in the quantum yield of non-regulated energy dissipation [Y(NO) = 0.439] in the sensitive genotype compared to the tolerant genotype [Y(NO) = 0.253] suggested dissipation of absorbed light energy into wasteful thermal or fluorescence quenching, leading to reduction in the photosynthetic efficiency especially targeting the light reaction. While average maximal fluorescence, variable fluorescence, and quantum yield were higher in the tolerant genotype (Fm = 0.277, Fv = 0.215, and Fv/Fm = 0.749, respectively) than the sensitive one (Fm = 0.257, Fv = 0.155, and Fv/Fm = 0.544, respectively). Despite the differences in average values of these two genotypes, analysis of variance showed significant differences only for minimal fluorescence (F0), quantum yield (Fv/Fm), and quantum yield of non-regulated energy dissipation [Y(NO)] at p =< 0.01 (Table 10). The significant differences for quantum yield suggest that these two test genotypes responded differently under heat stress conditions as depicted in fluorescence images for heat tolerant (UPU 85-86) and heat sensitive genotypes (PKGU-1) (Figure 4 and Table 10).
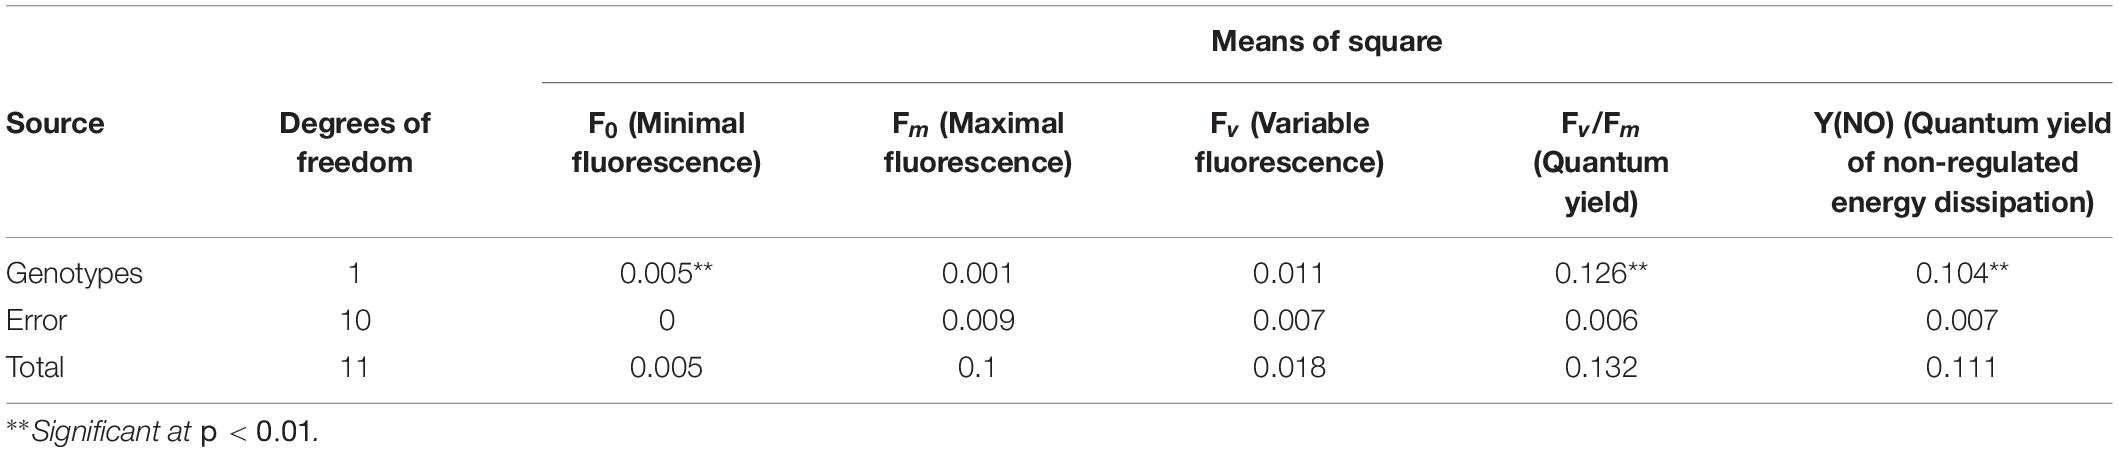
Table 10. Analysis of variance of fluorescence parameters between heat-tolerant (UPU85-86) and heat-sensitive genotypes (PKGU-1).
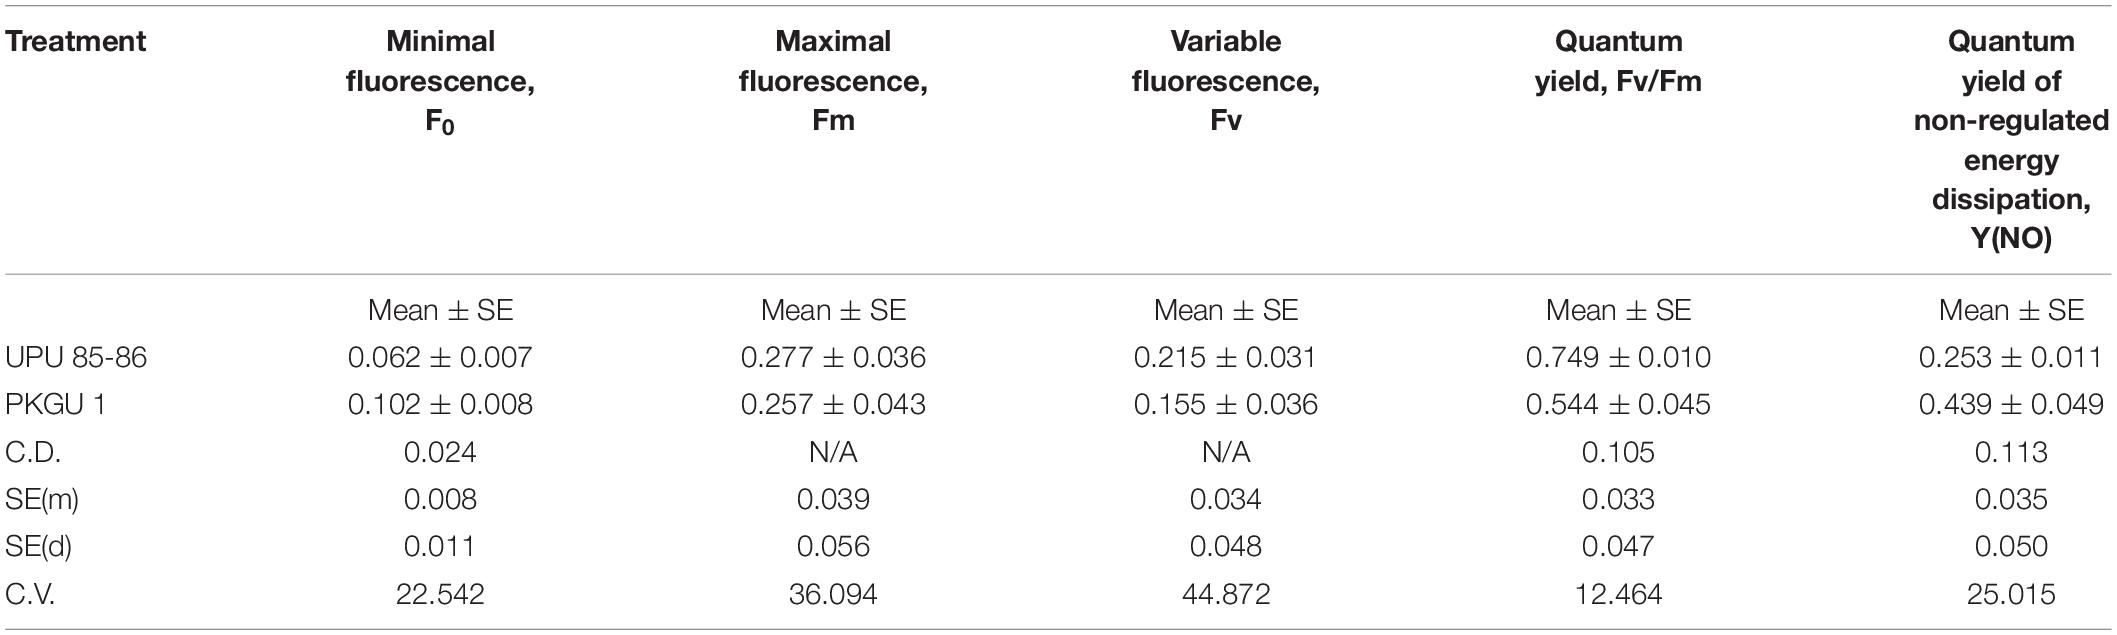
Table 11. Fluorescence parameters to differentiate two contrasting heat tolerant and sensitive urdbean genotypes grown at 42/25°C max/min temperature.
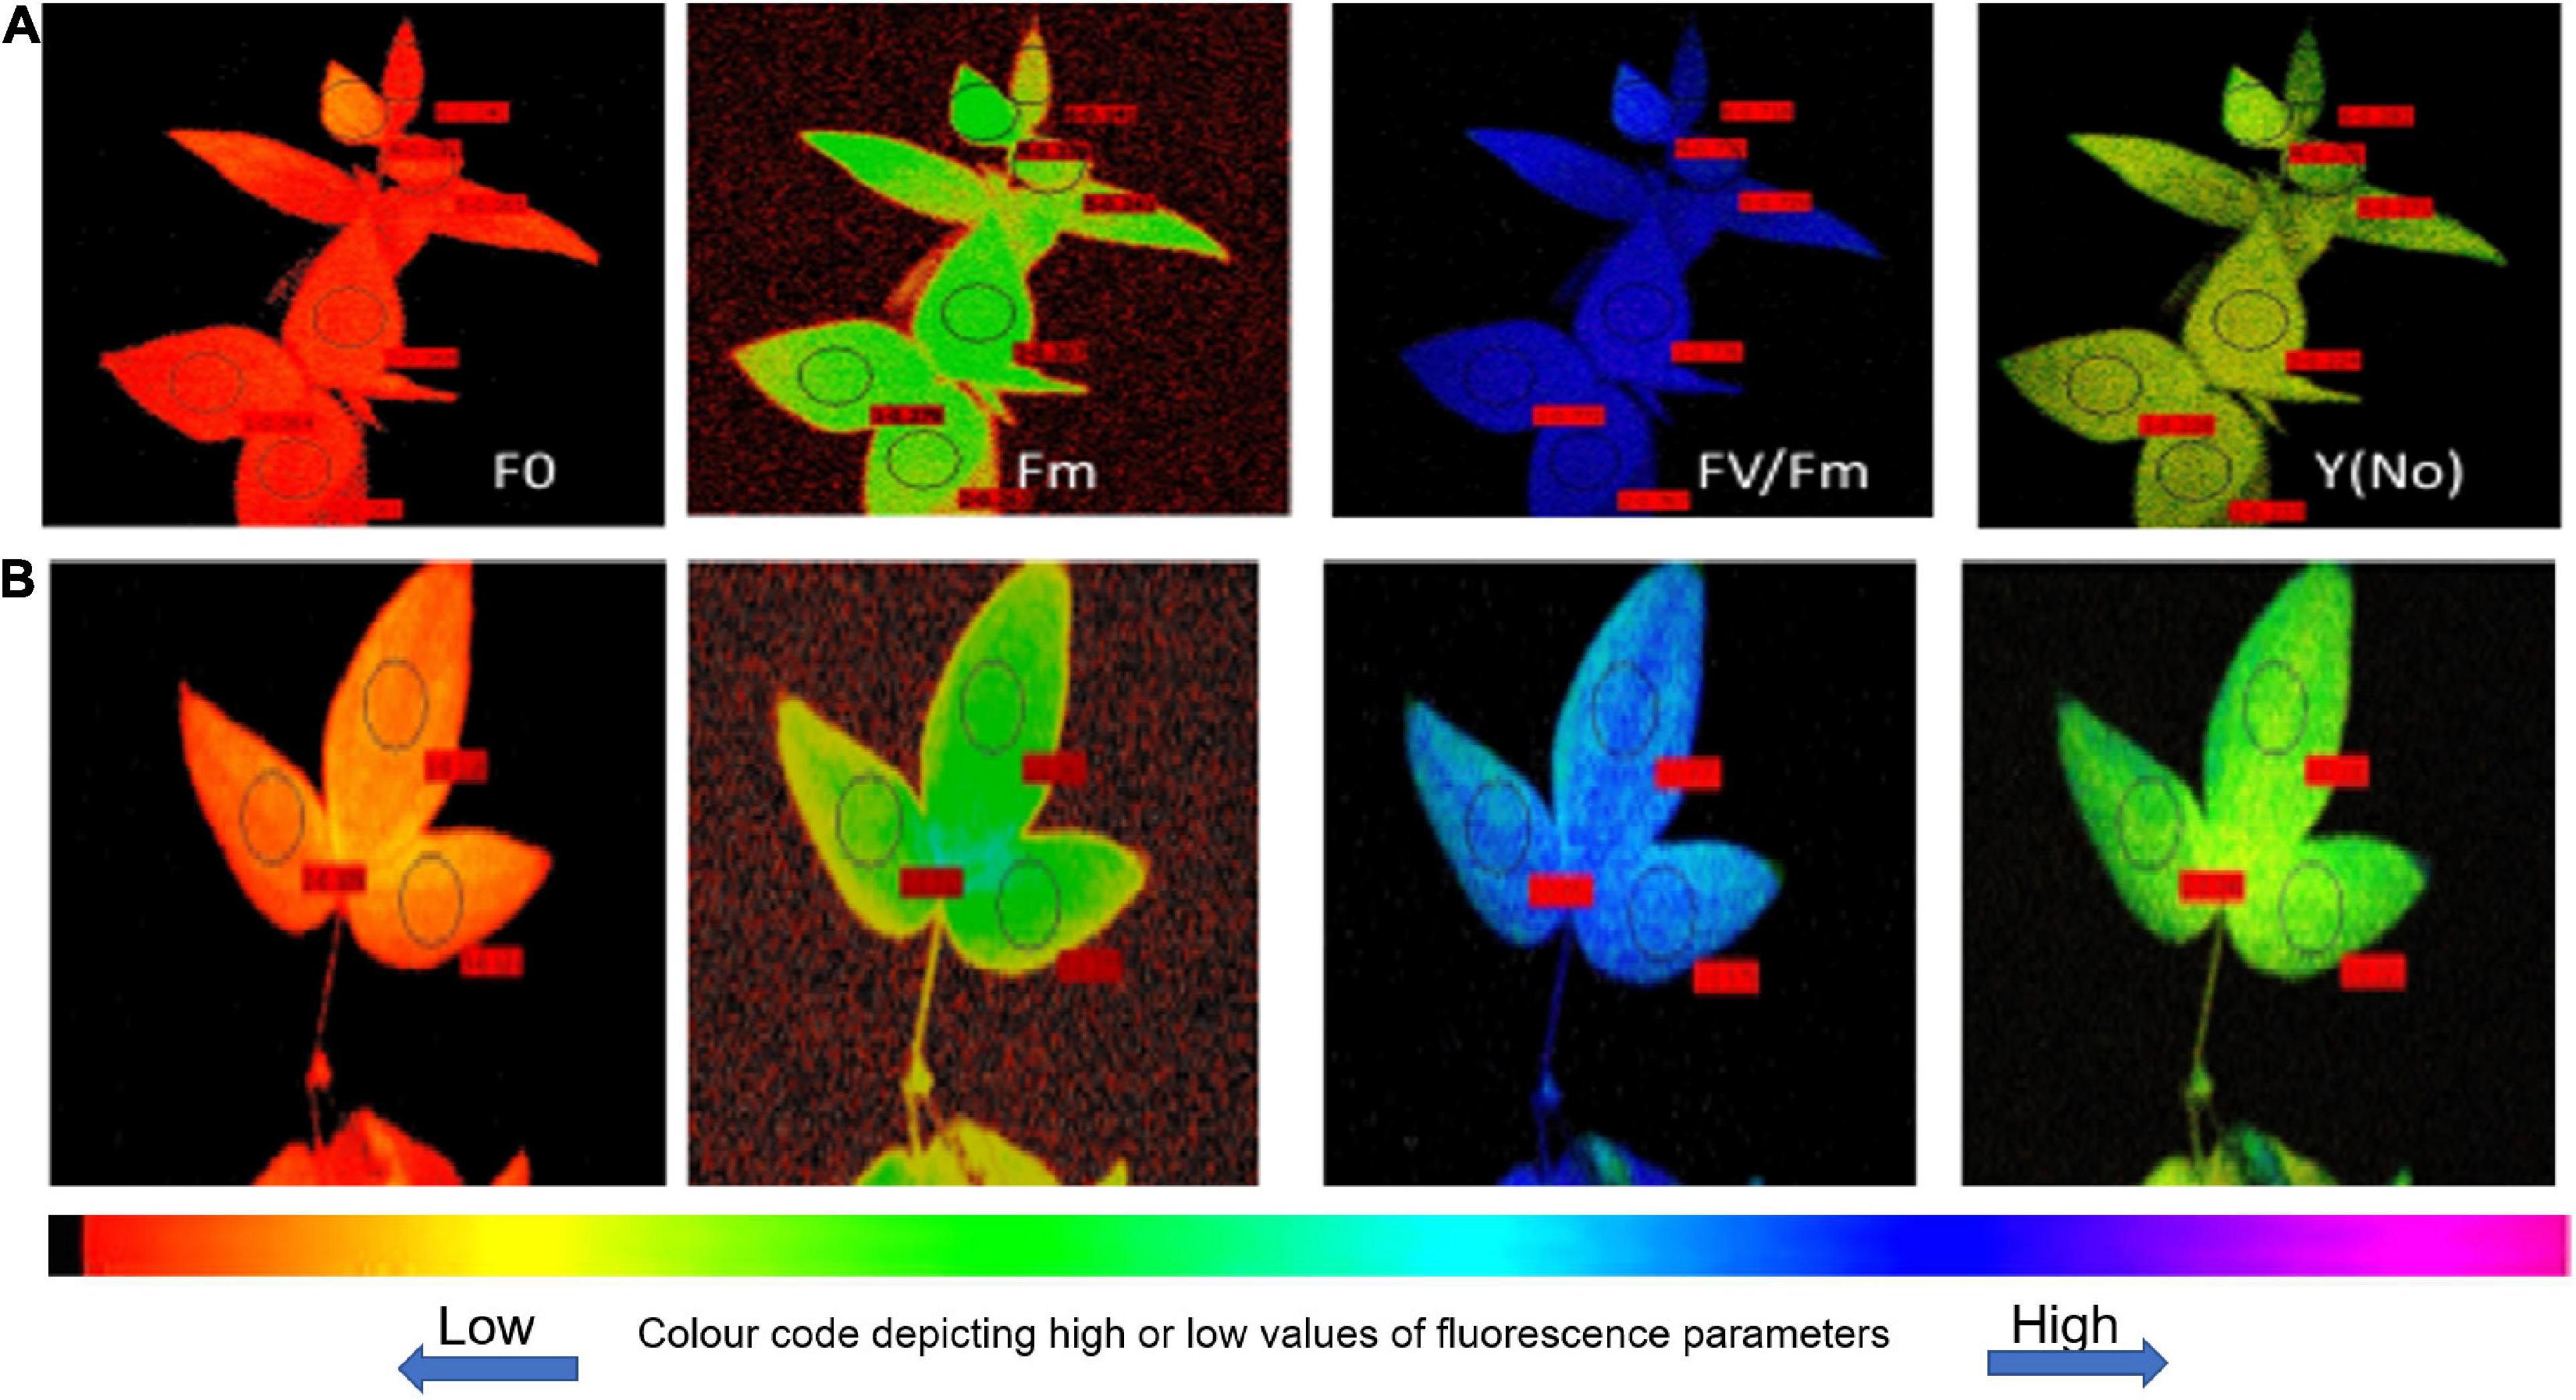
Figure 4. Fluorescence images for heat-tolerant (A) (UPU85-86) and heat-sensitive genotypes (B) (PKGU-1).
Phenotyping Heat Tolerant and Sensitive Genotypes Using Chlorophyll Fluorescence Image-Based Diagnostics
The quantitative values of fluorescence parameters as shown in Table 11 were transformed into color fluorescence images and the differences in the image pattern between heat tolerant and sensitive genotypes could be easily distinguishable by different shades of color as indicated in the color code bar appended with Figure 4 having low or high values. For example, a deep blue color of quantum yield as shown in the heat tolerant genotype UPU 85-86 is attributed to high quantum yield of PS II, while similar treatment resulted in fading of the blue color to convert to sky blue, representing reduction in the quantum yield. In a similar manner, the heat sensitive genotype PKGU-1 had higher values of minimal fluorescence (F0) and quantum yield of non-regulated energy dissipation [Y(NO)], which has been well depicted by changes in the color of the corresponding fluorescence images largely differing from the heat tolerant genotype (UPU 85-86). The maximum fluorescence Fm also decreased compared to the heat tolerant ones, which could be easily defined by changes in the color of fluorescence images between these two categories.
Auto-Recovery of Fluorescence Parameters During Light-Dark Transition
The repeated flashes of saturated pulses were triggered at regular intervals upon leaves of heat tolerant (UPU 85-86) and sensitive genotype (PKGU-1) adapted to actinic light (200 μmol m–2 s–1) continuously for 300 s to obtain Fv/Fm, Fm, and F0 after each saturation pulse. Thereafter, actinic light switched off to allow leaves for light to dark transitions to assess the recovery of Fv/Fm, Fm, and F0 (Figure 5). The results showed that quantum yield (Fv/Fm) decreased drastically in the heat sensitive genotype (PKGU-1) when leaves were continuously exposed to actinic light and dark transition. The quantum yield (Fv/Fm) could not recover to the pre-illumination value of 0.50 (Figure 5). Notably minimal fluorescence F0 remained higher and unaltered during the entire dark period suggesting damage or distortion of PS II in sensitive genotypes. Whereas, quantum yield Fv/Fm remained higher in the tolerant one (UPU 85-86) during light phase and completely and reversibly recovered to a pre-illumination value of 0.7 in the dark phase (Figure 5).
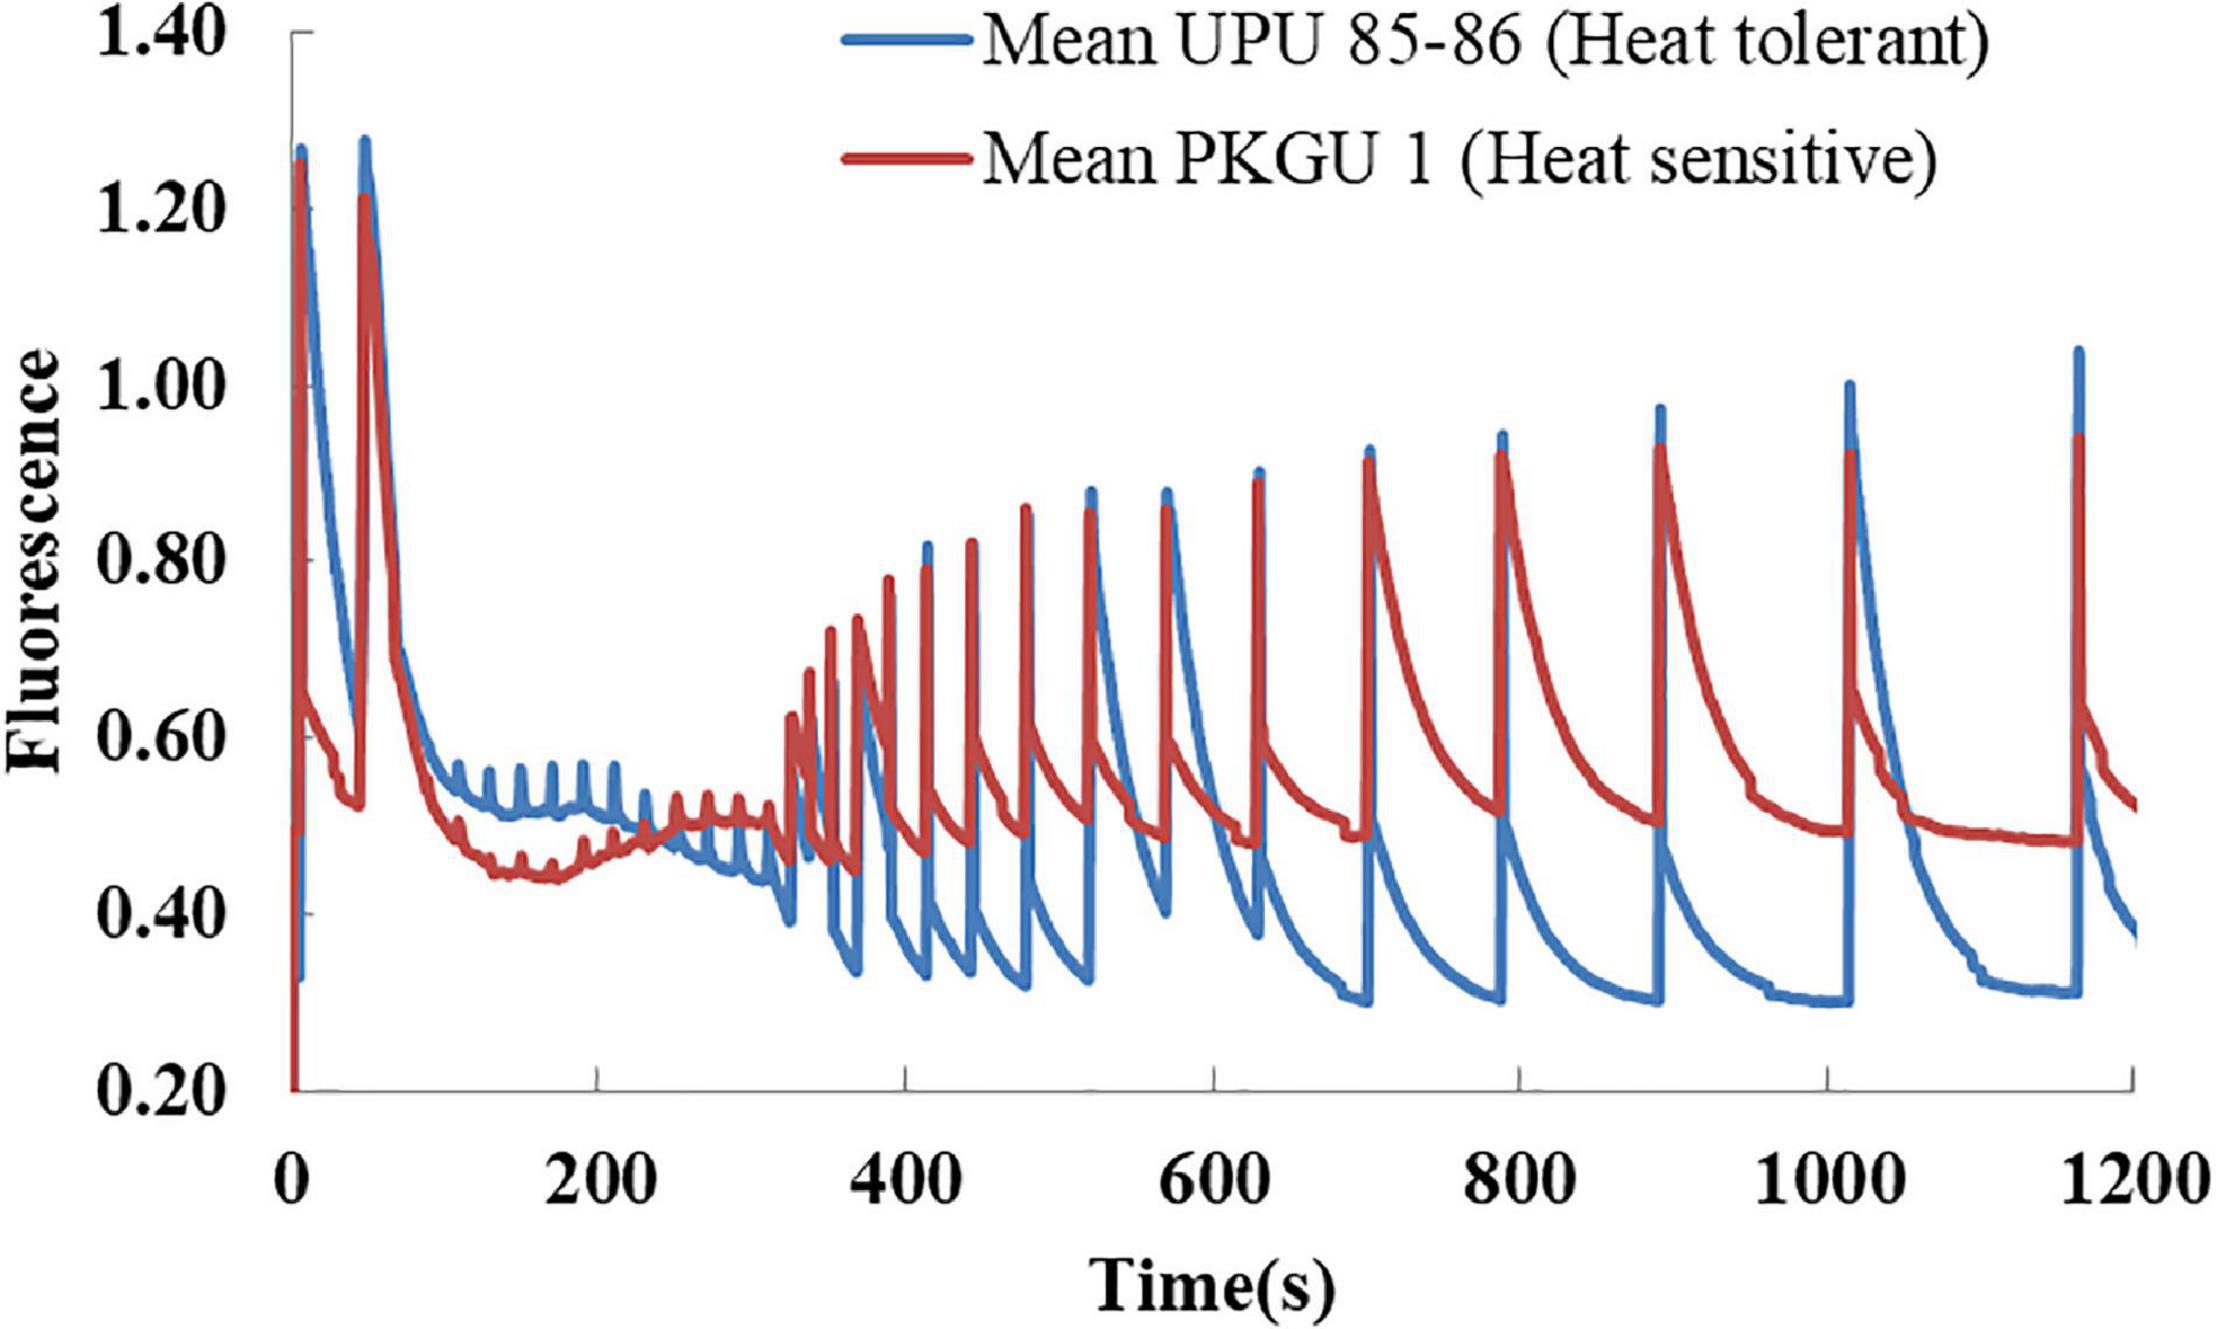
Figure 5. Relative auto-recovery of altered fluorescence during light to dark transition in two contrasting urdbean genotypes (heat-tolerant UPU85-86 and heat-sensitive PKGU-1).
Fluorescence kinetics of high temperature grown heat sensitive (PKGU 1) and heat tolerant (UPU 85-86) genotypes were studied during light to dark transition (Figure 6). Maximum fluorescence (Fm) peak was observed in both contrasting lines immediately after dark adaptation and thereafter the time course trend revealed faster quenching or declining of Fm in both heat sensitive and tolerant genotypes along with shorter peaks of Fm (Figure 6) throughout the period until leaves were exposed to light. At the beginning of the dark phase starting after 350 s, the Fm values started rising and the time taken to decrease in the Fm in these two contrasting genotypes could differentiate them on the basis of their differential sensitivity toward heat stress (Table 12).
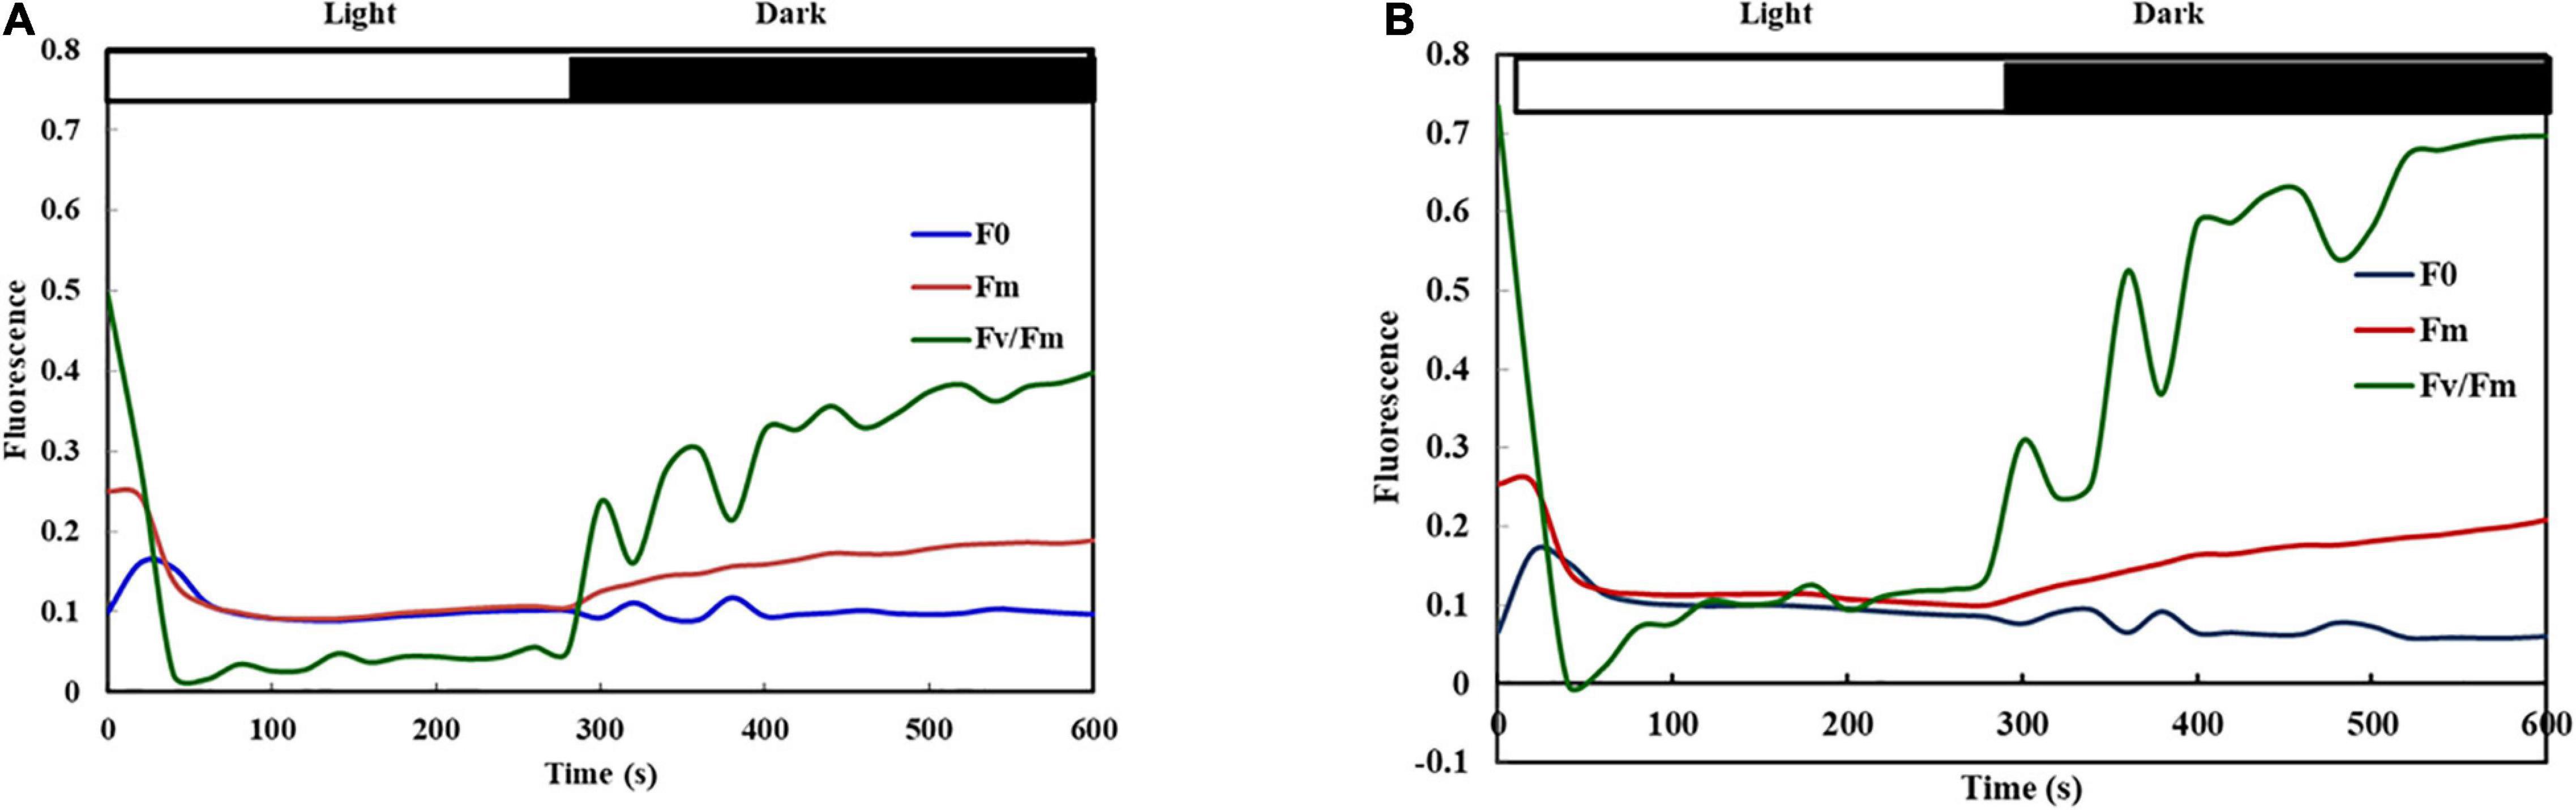
Figure 6. Fluorescence kinetics of heat sensitive (PKGU-1; A) and heat tolerant (UPU 85-86; B) urdbean genotypes during light to dark transition. The dark phase started from 350 s.
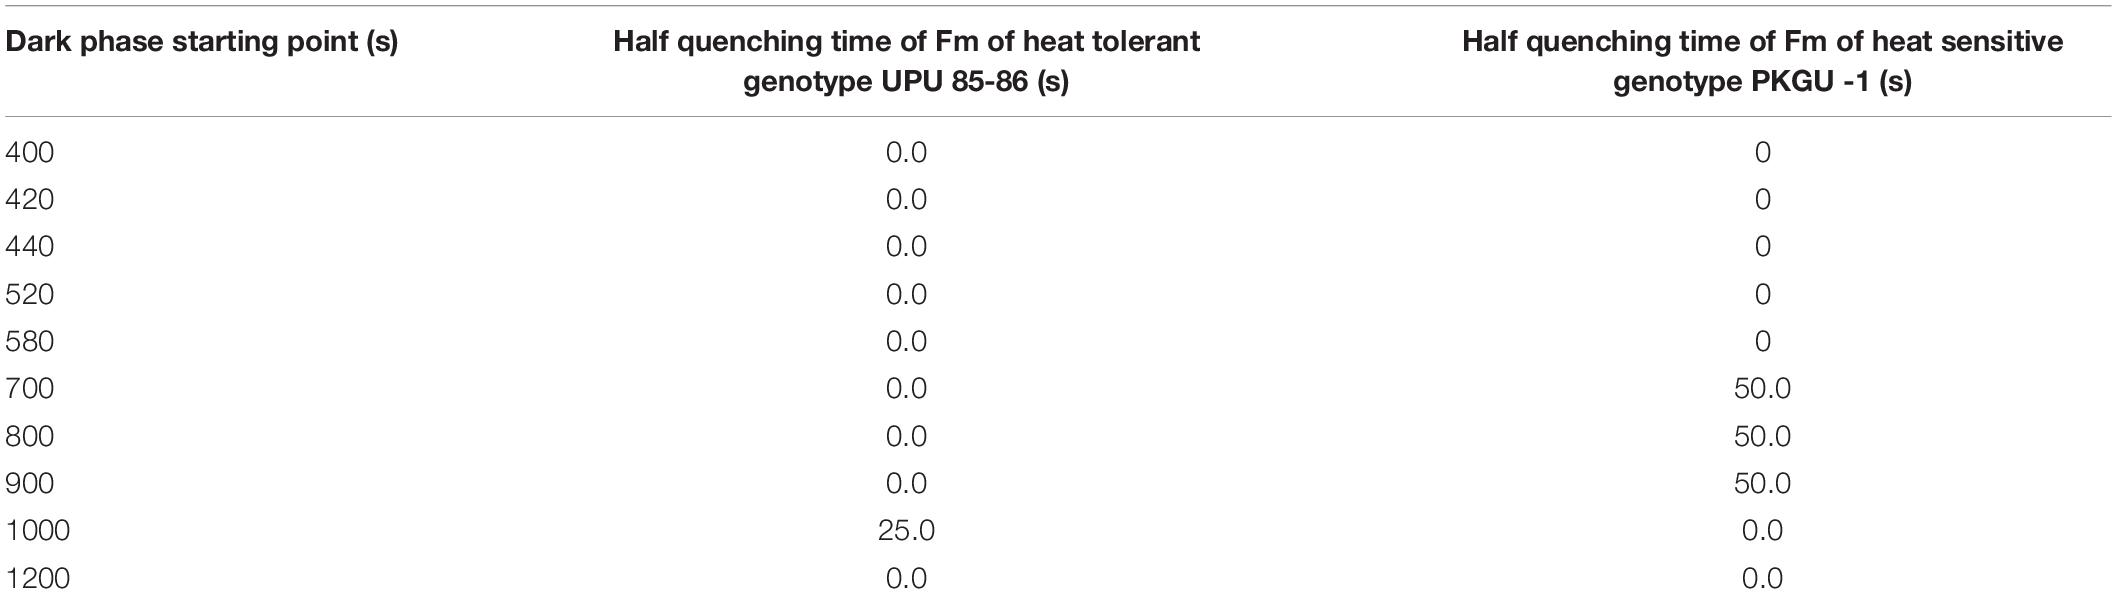
Table 12. Half quenching time of Fm for heat tolerant (UPU85-86) and sensitive (PKGU-1) urdbean genotypes.
Biochemical Analysis of Heat Sensitive and Tolerant Genotypes
Antioxidative enzymes such as superoxide dismutase (SOD) and peroxidase (POX) play important roles in protecting cellular systems like membranes, proteins, and enzymes by scavenging superoxide radicals and hydrogen peroxides produced during detrimental temperature beyond the threshold level of tolerance which is shown by in vivo visualization of superoxide radicals and hydrogen peroxides in Figure 7. High antioxidant activity confers tolerance to heat stress, which was represented by less blue color staining zones (formazan deposits) in the leaf (superoxide radicals) or lack of dark brown staining (hydrogen peroxides) as observed in the heat tolerant genotype UPU 85-86 (Figure 7). On the contrary, more intense blue crystal patches over leaf surfaces (superoxide radicals) and intense brown coloration (hydrogen peroxides) were the indicators of low antioxidative enzyme activities in heat sensitive genotypes (PKGU-1).
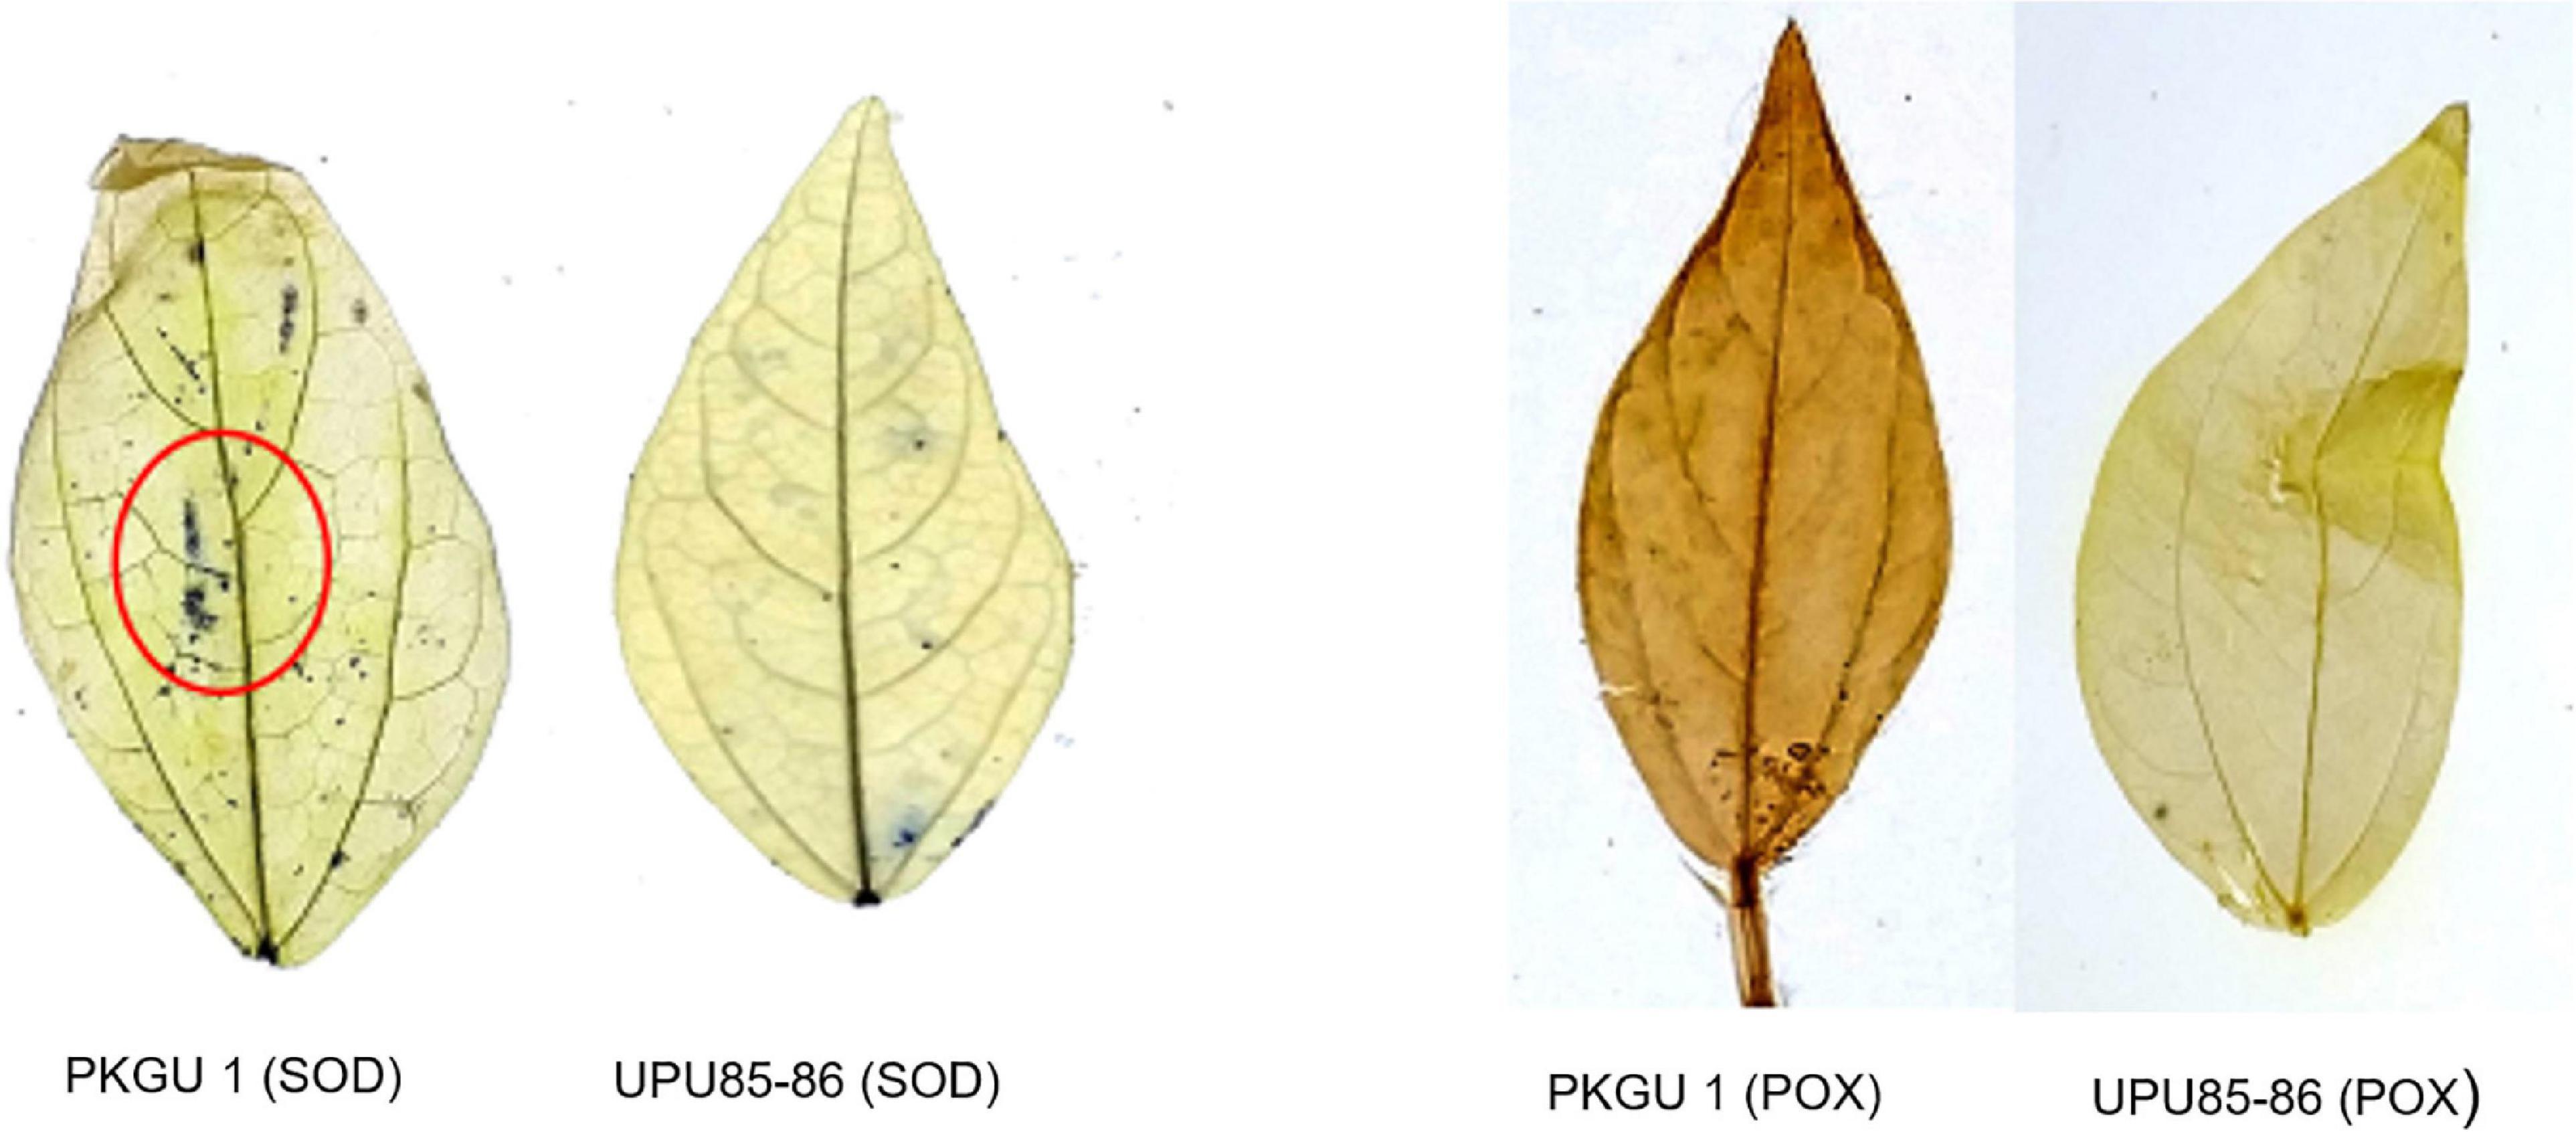
Figure 7. In vivo visualization of antioxidant activity for superoxide radicals and hydrogen peroxides in heat sensitive and tolerant genotypes.
Molecular Characterization
Twenty heat related polymorphic SSR markers were able to group the 16 urdbean genotypes into three major clusters as shown in Figure 8. The representative amplification profiles of the 16 urdbean genotypes using SSR markers are illustrated in Figure 9. Polymorphic information content ranged from 0.23 to 0.88 with an average value of 0.55 and one to three alleles were amplified by markers (Table 13). Cluster I is comprised of a single genotype UPU 85-86. Cluster II consisted of a mixture of six heat tolerant (IPU94-2, NO.5/31, PLU1, IPU98-36, PGRU-95014, PGRU-95016) and six heat sensitive genotypes (HPU120, H1, IC21001, PU19, UTTARA, IPU99-200). Cluster III housed two sensitive (SHEKHAR-2 and PKGU-1) and one heat tolerant genotype (BGP-247). The heat tolerant genotype UPU 85-86 and the heat sensitive genotype PKGU-1 were genetically distinct and were resolved at the extremes of the dendrogram. Thus, UPU 85-86 and PKGU-1 are genetically distinct as well as contrasting for heat tolerance.
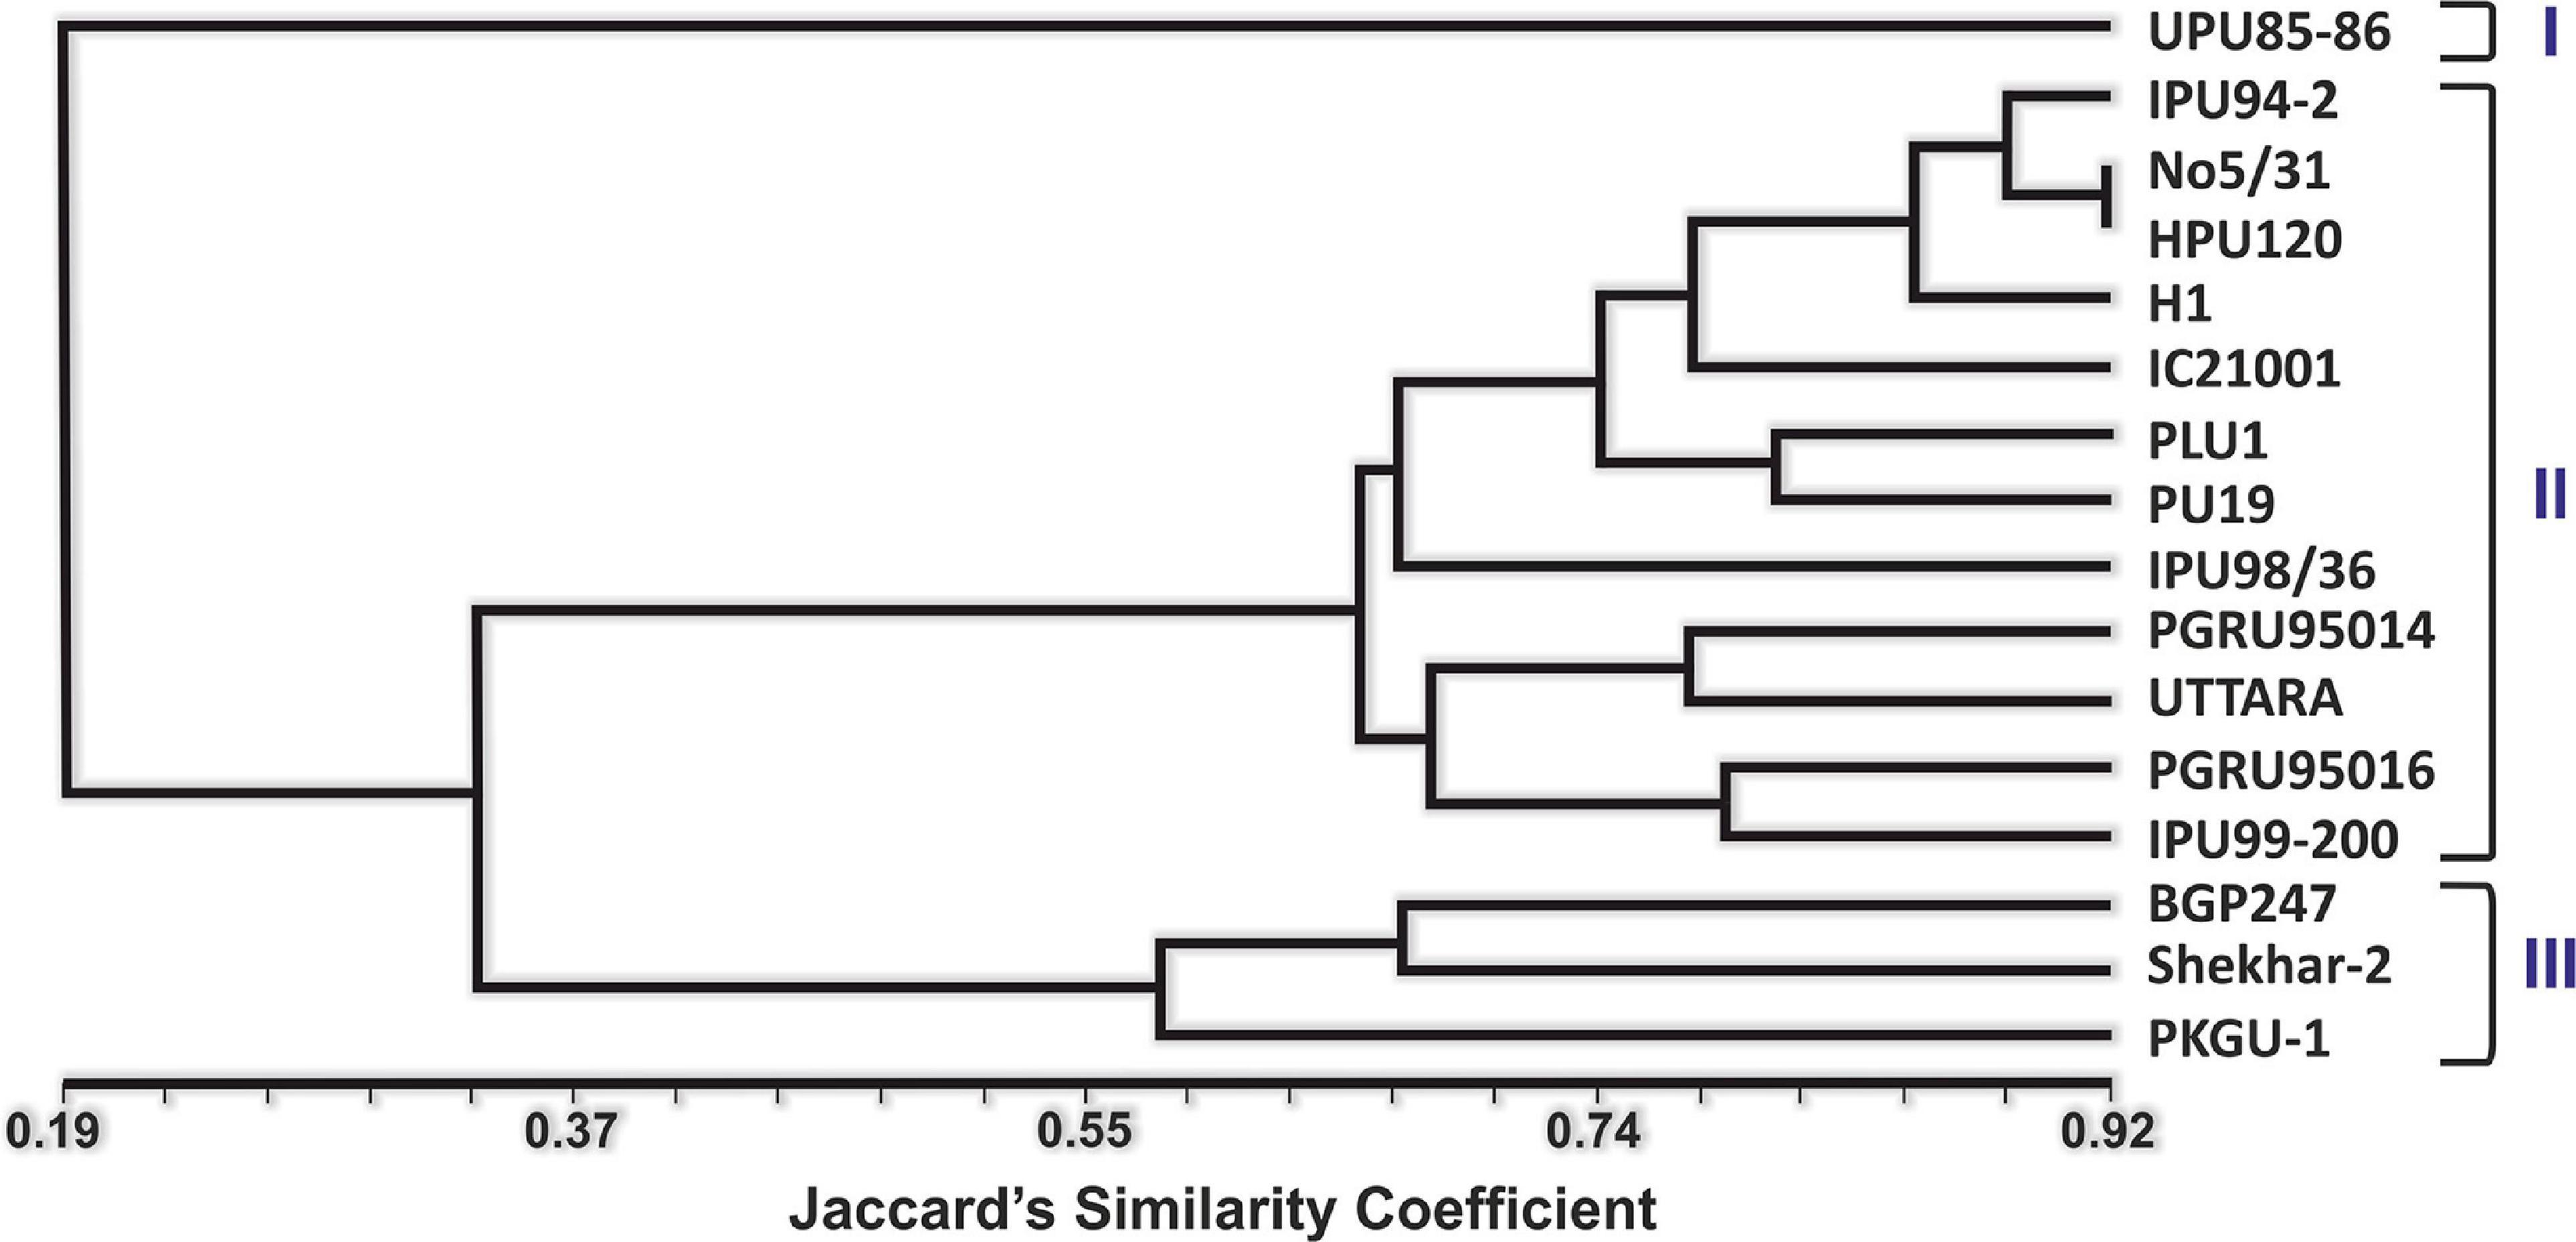
Figure 8. Unweighted Pair Group Method with Arithmetic Mean-based dendrogram showing the clustering of different urdbean genotypes.
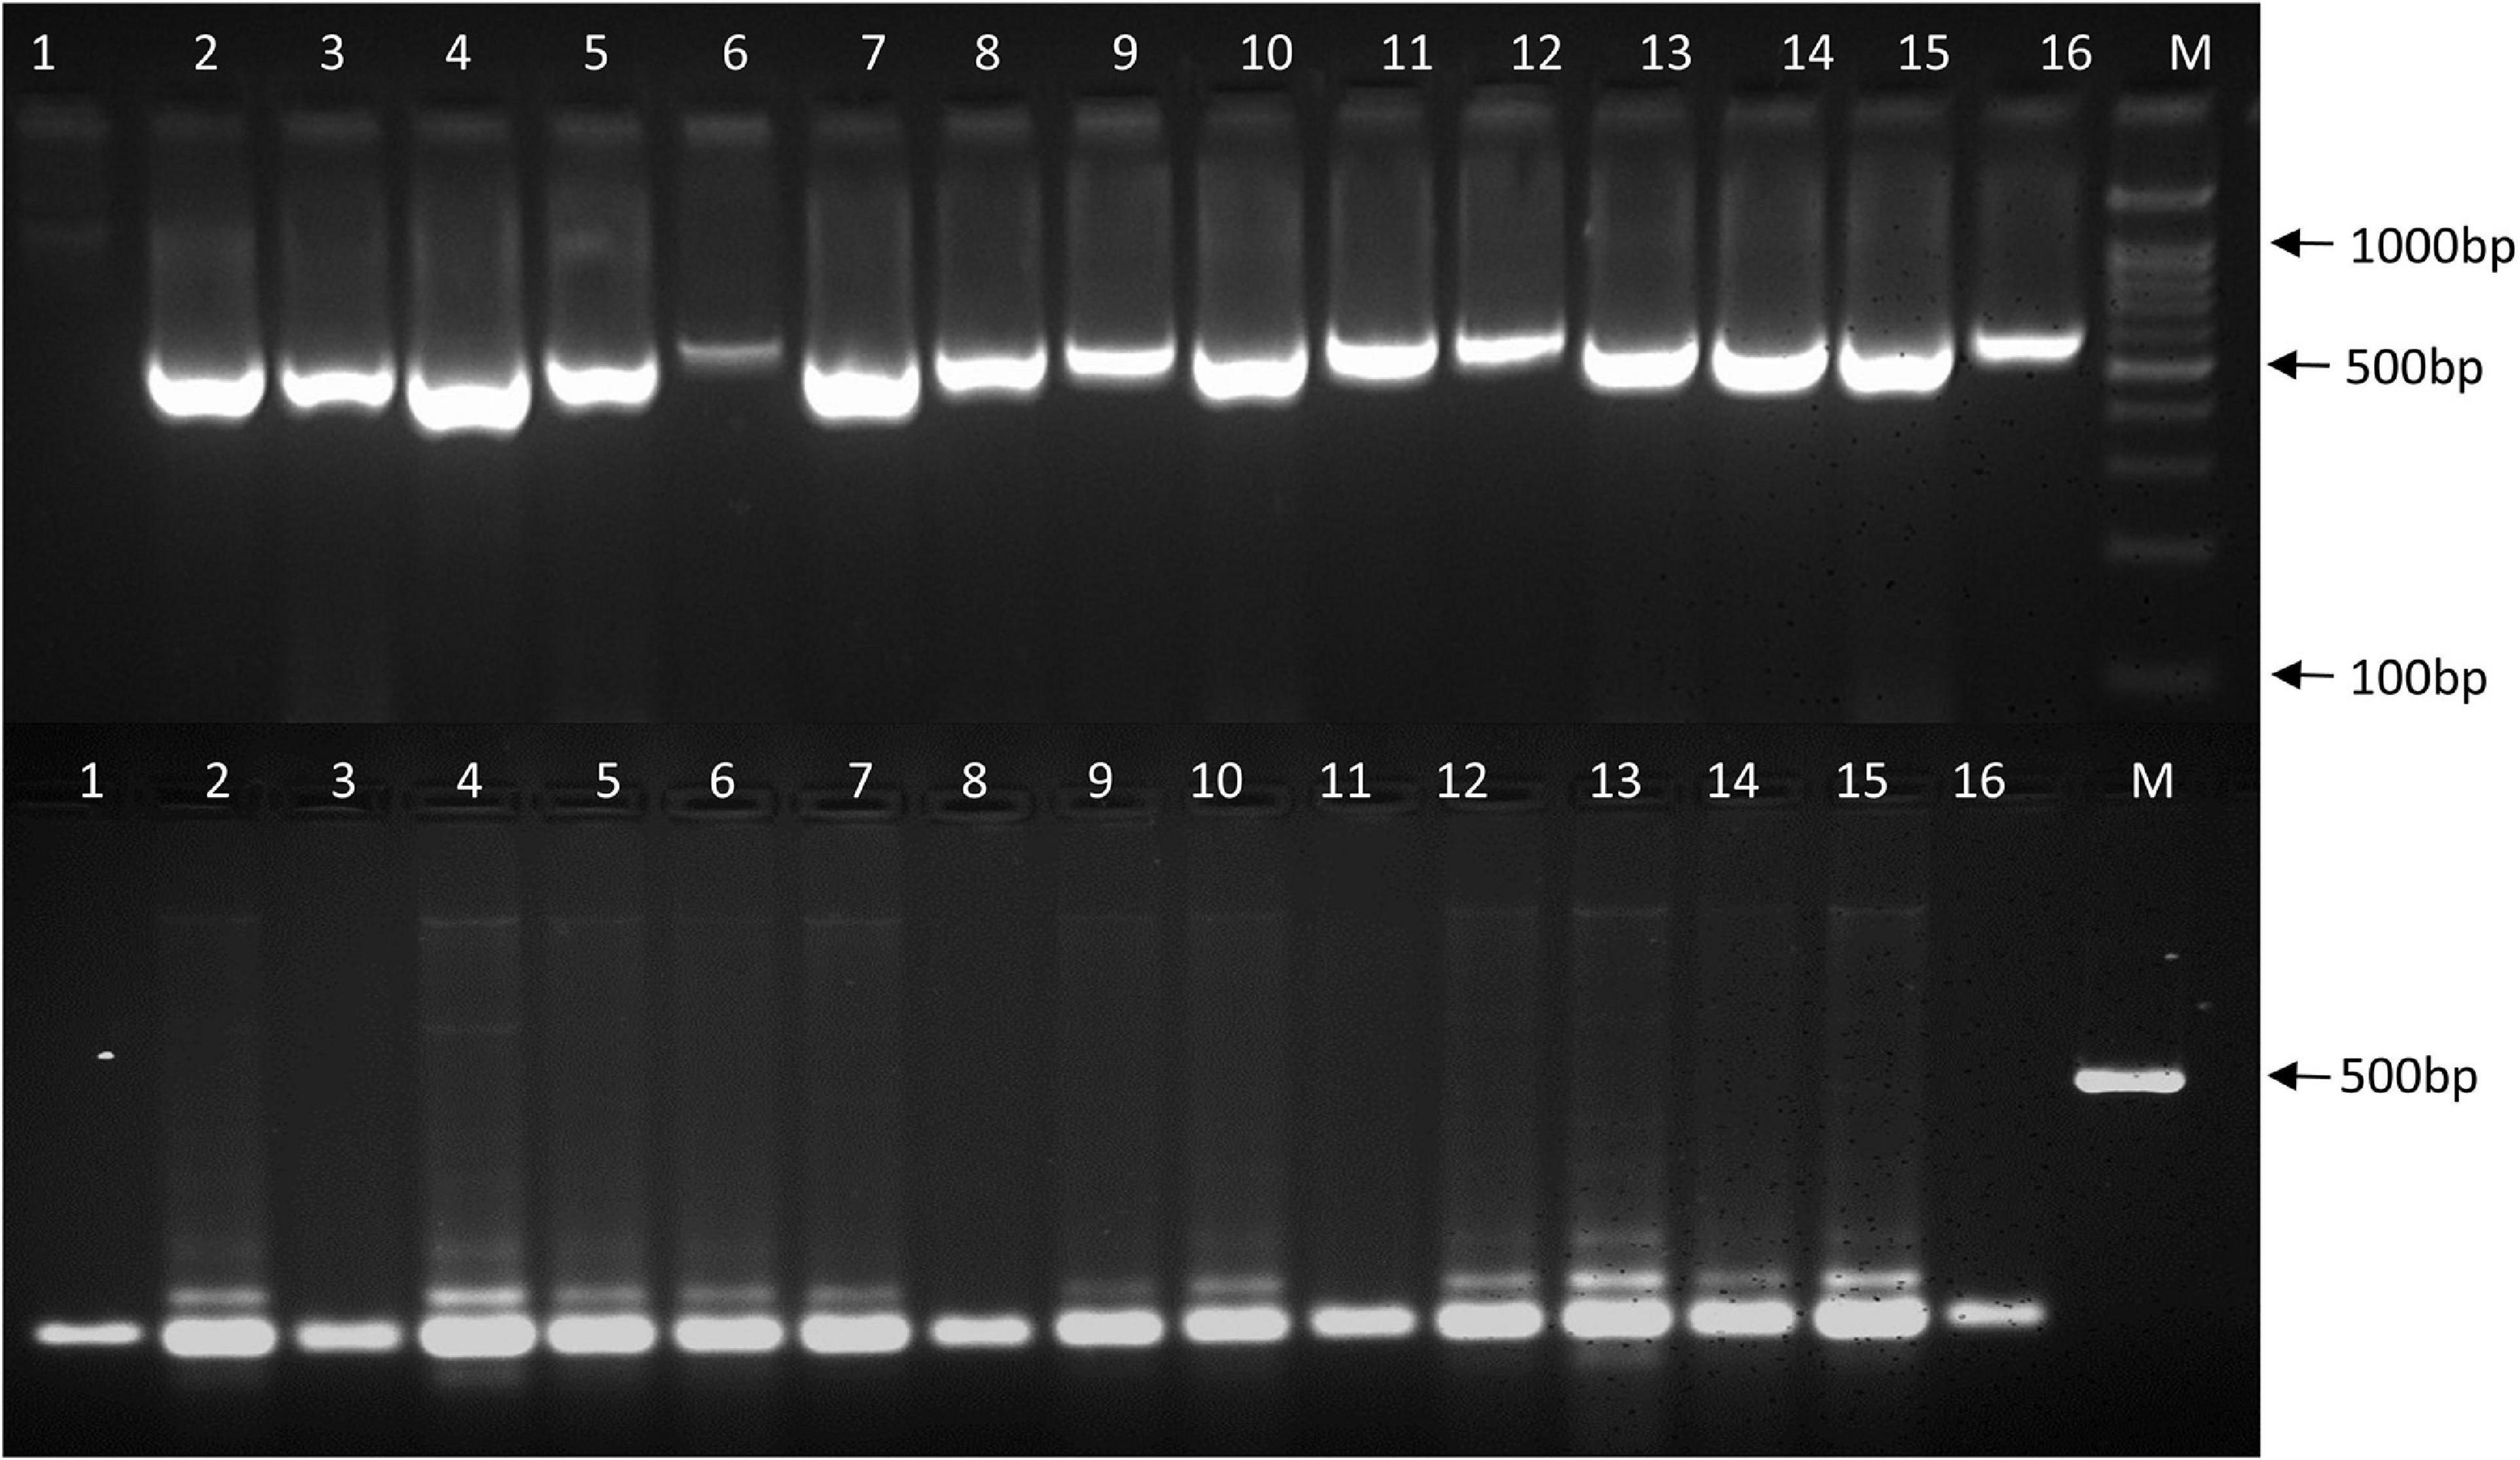
Figure 9. Amplification profiles of 16 urdbean genotypes using SSR primers (DR04 and YMVSSR74). The numbers represent the genotypes 1: UPU-85-86; 2: IPU94-2; 3: IPU-98/36; 4: NO. 5/31; 5: PGRU-95014; 6: PGRU-95016; 7: PLU-1, 8: BGP-247; 9: IPU99-200; 10: IC-21001; 11: SEKHAR-2; 12: UTTARA; 13: PU-19; 14: HPU-120; 15: H-1; 16: PKGU-1; M: DNA marker.
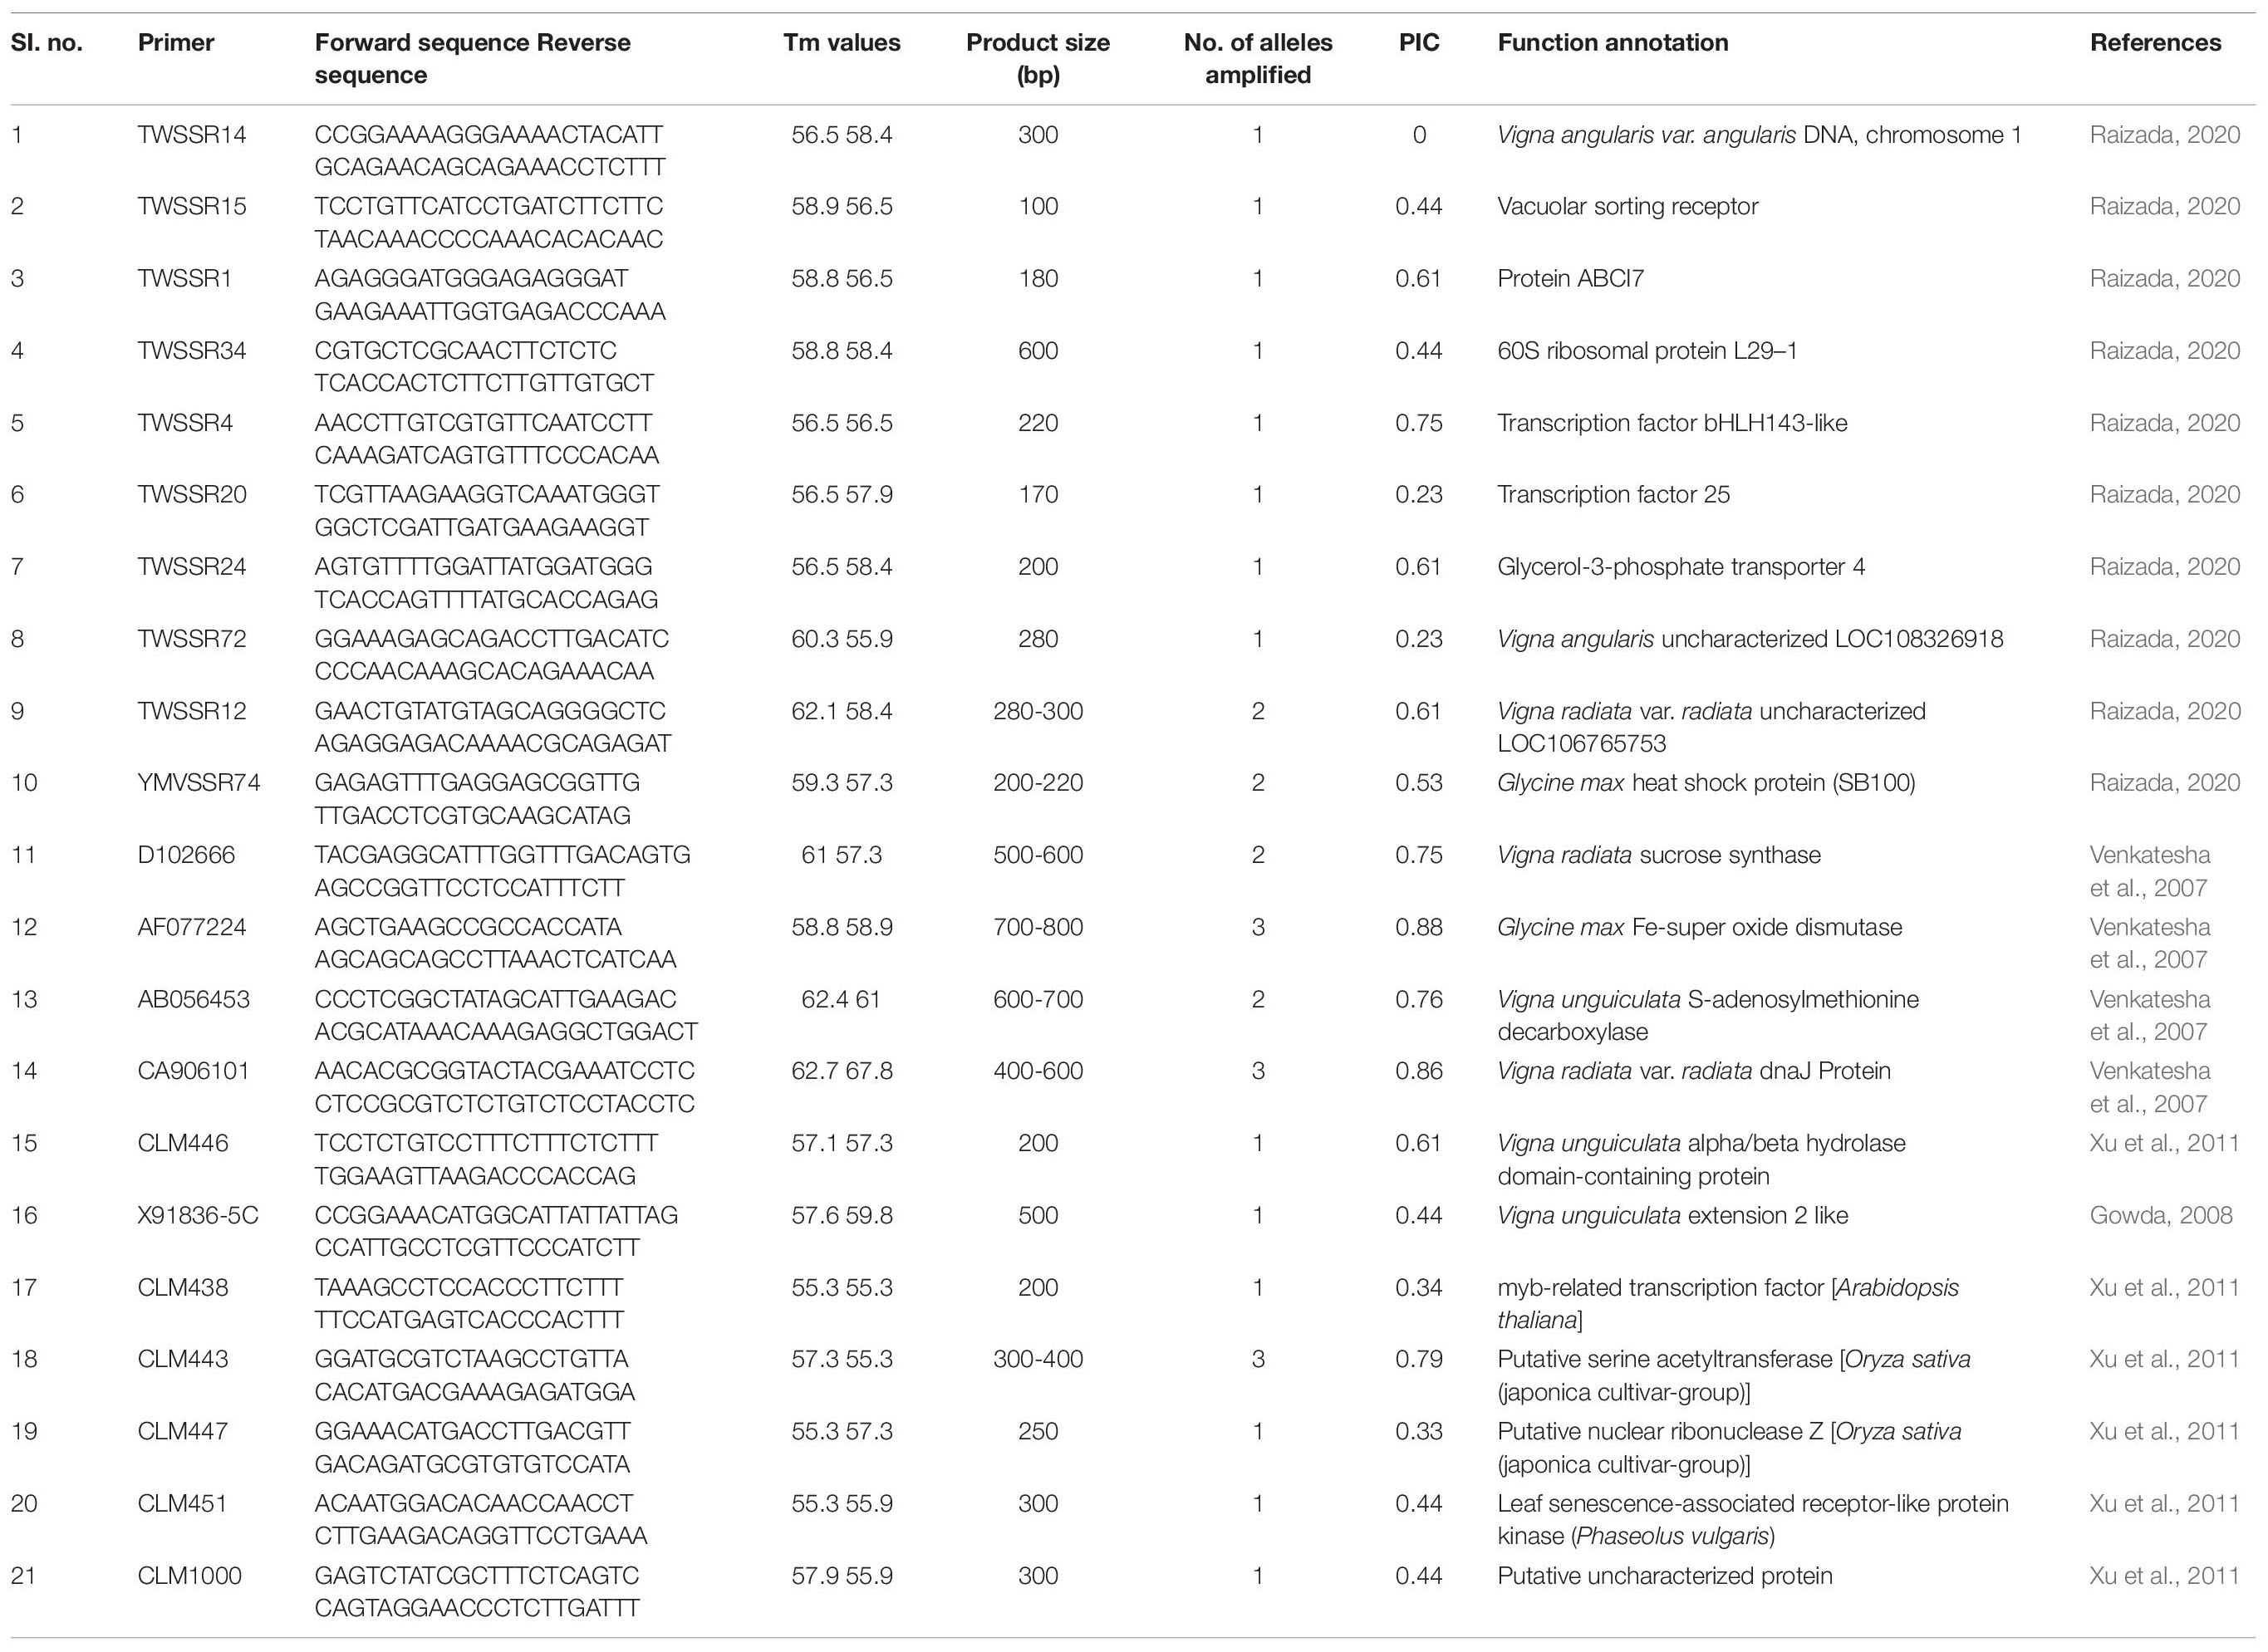
Table 13. Details of genic-SSRs used for genotyping 16 urdbean genotypes.
Discussion
In the present study, a panel of 97 urdbean genotypes was assessed under heat stress and non-heat stress conditions at two field locations. Stress conditions of a location have been decided based on average yield of trials and high temperature during early sown trials compared to lower temperature during late sown trials in the present study. The significant genotypic differences among tested urdbean genotypes for yield indicated the availability of heat tolerant genotypes. In other Vigna species, genetic variability for yield and yield contributing traits have also been observed under heat stress conditions (Basu et al., 2019). Heat susceptibility index (HSI) based on yield potential of a particular genotype under heat stress and non-stress conditions helped to distinguish heat sensitive and tolerant genotypes. This led to the identification of 8 highly heat tolerant and 35 highly heat sensitive genotypes. In the present study, tolerant genotypes had negative HSI due to higher yield under stress conditions compared to non-stress conditions, while highly sensitive genotypes had positive high HSI at both locations. HSI is a widely used method for identification of heat tolerant genotypes and has been used to identify heat tolerant genotypes in other crops (Pandey et al., 2015; Bhandari et al., 2017; Sita et al., 2017). Further, GGE biplot analysis identified most stable genotypes over the locations for yield.
The leaf NBI and chlorophyll content based on SPAD value showed significant differences among genotypes and both these parameters were higher in seven heat tolerant genotypes (36.9-64.6 and 9.7-21.1) compared to six heat sensitive genotypes (23.0-48.7 and 6.2-19.4). These results indicated enhanced chlorophyll synthesis and thereby maintaining higher leaf nitrogen balance in the heat tolerant genotype when grown at high temperature. The decrease in chlorophyll content in the heat sensitive genotypes reduced photosynthetic capacity and induced faster senescence due to high temperature as reported earlier in wheat and cucumber (Tewari and Tripathy, 1998). In the present study, no significant differences were observed among the heat sensitive and tolerant genotypes for leaf anthocyanin pigment. However, significantly higher leaf anthocyanin content (p < 0.01) was found in heat sensitive genotypes indicating the role of anthocyanin pigment for protecting the survival of sensitive genotypes from high temperature stress (Table 6). In other crops, the role of anthocyanin pigment accumulation has also been shown in response to various abiotic stresses (Castellarin et al., 2007) due to its antioxidant properties and photoprotection ability (Abdel-Aal et al., 2008).
Membrane stability index (MSI) under heat stress is one of the important physiological traits for identification of heat tolerant genotypes (Sikder et al., 2001; Dhanda and Munjal, 2006; Ashraf and Foolad, 2007) because high temperature affects several physiological processes such as photosynthesis and respiration through conformational changes in cell membrane bound proteins (Blum et al., 2001). In cowpea and Brassica, this trait has been used to identify potential heat tolerant genotypes (Ismail and Hall, 1999; Ram et al., 2012). In the present study, significant genotypic differences have been observed among genotypes for MSI. However, the membrane stability index did not correlate strongly with heat tolerance as few sensitive genotypes (i.e., IPU 99-200) also showed higher membrane stability index. In general, a higher membrane stability index has been observed among tolerant genotypes compared to sensitive genotypes under heat stress in the present investigation. In wheat, genetic variability has been observed for this trait, which could be exploited in the development of a heat tolerant wheat variety (Kumar et al., 2013). Since different physiological stages affect this trait, a particular physiological stage that has maximum correlation of MSI with the heat tolerance is needed to be identified for screening the diverse genotypes under heat stress (Hemantaranjan et al., 2014). Therefore, combinations of different physiological traits can be useful for harnessing higher yield under heat stress conditions as observed in an earlier study (Kumar et al., 2018).
Photosynthetic ETR is a potential physiological trait for screening the heat tolerant genotypes. It determines photosynthetic functionality of plants under high temperature and excessive irradiances. Both are often detrimental for plants due to excess generation of toxic superoxide radicals responsible for damaging the functionality of the photosynthetic system (Allakhverdiev and Murata, 2004). In the present study, photosynthetic ETR was significantly different among studied genotypes. Yamada et al. (1996) reported enhanced physiological efficiency of a genotype under high temperature if it had the ability to maintain higher photosynthetic ETR with increasing PAR. In our study, all heat tolerant genotypes generally showed a curvilinear relationship of photosynthetic ETR with increasing PAR but responses of ETR beyond light saturation (ETRmax) remained significantly higher in highly tolerant genotype-UPU 85-86 (Figure 3) indicating its greater radiation use efficiency even under higher temperature exposure. Whereas the light-saturation point of ETR in highly sensitive one-PKGU-1 was very low and as a result it could not sustain photosynthesis at combined stresses such as high irradiance and high temperature. Thus, sensitive genotypes are more prone to heat stress than tolerant genotypes primarily due to substantial reduction of electron transport and damage of photosystems as reported in earlier studies (Song et al., 2014; Brestic et al., 2016; Chovancek et al., 2019).
The ratio of variable to maximum fluorescence (Fv/Fm), which is known as quantum yield, and the minimal fluorescence (F0) show their correlation with heat tolerance (Yamada et al., 1996). These parameters are associated with photosystem II (PSII) and carbon fixation. Heat stress affects the photosynthesis process due to inhibition of the activity of PSII (Camejo et al., 2005; Allakhverdiev et al., 2008; Yamamoto, 2016). In winter wheat significant differences among genotypes have been observed for thermostability of PSII and its acclimation effects on PSII photochemical efficiency (Brestic et al., 2012). However, in another study, high temperature stress also affected PSI due to a non-stomatal limitation of photosynthesis by decreasing the activity of rubisco and other parameters of photochemistry (Salvucci and Crafts-Brandner, 2004; Chovancek et al., 2019). In the present study, decreasing the variable fluorescence (FV = Fm – F0) leads to decrease in the quantum yield (Fv/Fm) due to inhibition of PSII under heat stress (Kumar et al., 2018). However, quantum yield varied among the studied genotypes and most of the heat tolerant urdbean genotypes had higher quantum yield when grown under high temperature (Figure 4). This indicates that heat tolerant genotypes have superior photosynthetic activity under stress than heat sensitive ones. This could be due to increased activity of antioxidative enzymes SOD and peroxidase, the inherent ability to have higher membrane stability, higher chlorophyll retention capacity, or development of certain compounds in heat tolerant genotypes that protect PSII as reported in earlier studies (Murata et al., 2012).
Different fluorescence parameters were recorded to study the effect of temperature on the photosynthetic activities in two contrasting genotypes having different sensitivity to heat stress. Initial fluorescence intensity (F0) measured in the dark-adapted state, when all PSII reaction centers are open, has been used as a thermo-injury index. The increase in the F0 in sensitive genotype PKGU-1 as shown in the image (Figure 4) was evident from the color code bar toward the higher side as well as its corresponding numerical value (Table 11). This sudden change in F0 is associated with photosynthetic membranes that had suffered irreversible injury. These findings have been supported further from earlier reports by Georgieva and Yordanov (1993). In contrast, heat shocked leaf of tolerant genotype had much lower values of initial fluorescence (F0). The maximum Fm and variable fluorescence showed no significant difference between sensitive and tolerant genotypes. However, quantum yield (Fv/Fm) image and its numerical values were distinctly different, suggesting that altered quantum yield was largely affected by initial fluorescence (F0). The higher thermal injury or rise of F0 was observed in the sensitive genotype as compared to the tolerant ones.
The significant decrease in Fv/Fm at high temperature in sensitive genotype (PKGU-1) indicated that plants were under severe stress and that the photochemical efficiency of PSII was severely impaired. This revealed that high temperature significantly affected the photochemistry of PSII leading to photoinhibition (Baker and Rosenqvist, 2004). Furthermore, the sharp decrease in the Fv/Fm at high temperature was due to the increase in F0 under the stress condition. Our results are consistent with earlier reports indicating the decline in Fv/Fm that involves an increase in F0 (Yamada et al., 1996).
The fluorescence parameters such as maximum fluorescence (Fm), quantum yield (Fv/Fm), and minimal fluorescence (F0) during light to dark transition phases demonstrate the potential ability of a photosynthetic system to recover to normal values that were observed before the illumination by actinic light. In the present study, the decrease in the effective quantum yield Fv/Fm was more pronounced in heat-shocked leaves of the sensitive genotype exposed to light condition compared to the tolerant ones which could likely to be due to photoinhibition of PSII associated with increase in F0. The photoinhibition is often reversible during light to dark transition but it depends on sensitivity of genotype to heat stress and hence recovery might be delayed. The heat tolerant genotype showed complete recovery in Fv/Fm in the dark after 500 s, suggesting that reversible changes of photosystems occurred during continuous illumination up to 250 s (Figure 5). However, in the case of sensitive ones, it appeared to undergo an irreversible change for a longer period and could not recover in the dark phase even after 500 s (Figure 5). The delayed recovery of Fv/Fm could likely be associated with major conformational changes in photosystems to operate in a normal manner.
Maximum decrease in quantum yield indicates damage to the photosynthetic apparatus of the plants (Van der Westhuizen et al., 2020). Many studies have reported variation in the tolerance to high-temperature stress among genotypes of wheat, chickpea, lentil, and mungbean on the basis of pollen sterility, seed abortion, maintenance of photosynthesis, chlorophyll content, and an extended grain-filling duration at elevated temperatures (Viswanathan and Khanna-Chopra, 2001; Tahir and Nakata, 2005; Hays et al., 2007; Krishnamurthy et al., 2011; Kumar et al., 2018; Basu et al., 2019). Heat stress sensitivity of photosynthesis (Singh and Thakur, 2018) due to the inactivation of photosystem II (PSII) (Rustioni et al., 2015) leads to the decrease in variable chlorophyll fluorescence (Fv). This is the most thermolabile component of the photosynthetic electron transport chain (Camejo et al., 2005). Therefore, the detection and quantification of temperature-induced changes in the photosynthetic apparatus is an important tool to distinguish genotypes for their heat stress tolerance (Baker and Rosenqvist, 2004). In the present investigation, significant increase in quantum yield of non-regulated energy dissipation was also observed in the highly heat sensitive genotype PKGU-1 (Table 11). Moreover, more time was required toward quenching of maximum fluorescence Fm (i.e., delay in quenching of Fm) and high values of quenching of F0 indicated severe photo-inactivation of PS II in the sensitive genotype (PKGU-1). This was in complete agreement to the fact that greater thermo-tolerance is associated with faster recovery of photo-damage to PSII. Therefore, rapid overnight recovery of photo-inhibition was observed in tolerant genotype UPU 85-86 (Figure 6 and Table 12).
The qualitative analysis was done to demonstrate in vivo visualization of oxidants such as superoxide radicals and hydrogen peroxides, which clearly elucidated the differences in enzymatic activities of superoxide dismutase (SOD) and peroxidase (POX) in heat shocked leaves of extreme heat tolerant and sensitive genotypes (Figure 7). The presence of blue crystalline formazan deposits and dark brown precipitates indicated low activities of SOD and POX enzymes in the sensitive genotype. As a result, the sensitive genotype failed to scavenge the harmful radicals, which caused damage to membranes due to heat stress.
Further, in the case of SSR marker data based dendrogram, a highly heat tolerant genotype (UPU 85-86) was distinctly clustered from the highly heat sensitive genotype (PKGU-1). Heat tolerance being a trait governed by several genes, it becomes very difficult to categorize them solely based on SSR markers unless the markers are highly linked to the heat tolerance trait. Since the primers were designed based on their relevance to abiotic stress tolerance like drought, salinity, and so on, in addition to heat tolerance, the clustering based on their amplification profiles holds importance. The dendrogram obtained by Sun et al. (2015) in tall fescue also showed the heat tolerant genotypes to be strewn across the dendrogram. In addition, a low correlation was found between morpho-physiological heat tolerance traits and SSR markers by the Mantel test (data not shown). The identified genetically diverse and high temperature tolerant lines would be useful in designing breeding programs for developing heat stress tolerance in urdbean.
Conclusion
Based on field evaluation of 97 urdbean genotypes over two locations under two different growing conditions, a panel of heat tolerant and sensitive genotypes was identified which were stable in yield. Genotypic differences existed for physiological traits like leaf NBI, chlorophyll (SPAD), epidermal flavanols and anthocyanin contents among the tested heat tolerant and sensitive genotypes. The genotypic variation in the membrane stability was evident, which defined the variation in the heat tolerance but to a lesser extent. The high antioxidant activities were shown by heat tolerant genotype (UPU 85-86) explaining their role for scavenging superoxide radicals (ROS) protecting delicate membranes from oxidative damage. Perhaps the higher photosynthetic activities including ETR, quantum yield, and lesser photoinhibition as observed in the heat tolerant genotype UPU 85-86 are associated with inherent stable membranes and higher expression of antioxidative enzymes during exposure to high temperature enabling the plant to maintain optimum functionality. Molecular characterization further pinpointed genetic differences between heat tolerant (UPU 85-86) and heat sensitive genotypes (PKGU-1).
Data Availability Statement
The original contributions presented in the study are included in the article/Supplementary Material, further inquiries can be directed to the corresponding author/s.
Author Contributions
DS conceived the idea, conducted the experiments, analyzed data, and wrote the draft manuscript. PB contributed to the writing, reviewing, editing, physiological data, and analysis of experimental data. JS and PD carried out the molecular work. JK conceived the idea and wrote the drafted manuscript. SaG, MP, SG, and NP reviewed and edited the manuscript. VK contributed to the antioxidant profile of two urdbean genotypes. PS conducted the field trials. All authors contributed to the article and approved the submitted version.
Funding
This work was supported partially by the research grant from the ICAR, New Delhi in the form of a project “National Innovations in Climate Resilient Agriculture (NICRA).” ICAR-Indian Institute of Pulses Research also funded the experiments. No separate funding was received for publication in peer-reviewed journals.
Conflict of Interest
The authors declare that the research was conducted in the absence of any commercial or financial relationships that could be construed as a potential conflict of interest.
Publisher’s Note
All claims expressed in this article are solely those of the authors and do not necessarily represent those of their affiliated organizations, or those of the publisher, the editors and the reviewers. Any product that may be evaluated in this article, or claim that may be made by its manufacturer, is not guaranteed or endorsed by the publisher.
Acknowledgments
We thank Director, ICAR-Indian Institute of Pulses Research, Head, Basic Science Division and Head, Crop Improvement Division of this institute for extending the laboratory and field facilities to conduct research.
Supplementary Material
The Supplementary Material for this article can be found online at: https://www.frontiersin.org/articles/10.3389/fpls.2021.719381/full#supplementary-material
References
Abdel-Aal, E. S. M., Abou-Arab, A. A., Gamel, T. H., Hucl, P., Young, J. C., and Rabalski, I. (2008). Fractionation of blue wheat anthocyanin compounds and their contribution to antioxidant properties. J. Agric. Food Chem. 56, 11171–11177. doi: 10.1021/jf802168c
Allakhverdiev, S. I., and Murata, N. (2004). Environmental stress inhibits the synthesis de novo of proteins involved in the photodamage–repair cycle of Photosystem II in Synechocystis sp. PCC 6803. Biochim. Biophys. Acta BBA.Bioenerget. 1657, 23–32. doi: 10.1016/j.bbabio.2004.03.003
Allakhverdiev, S. I., Kreslavski, V. D., Klimov, V. V., Los, D. A., Carpentier, R., and Mohanty, P. (2008). Heat stress: an overview of molecular responses in photosynthesis. Photosyn. Res. 98, 541–550. doi: 10.1007/s11120-008-9331-0
Aravind, J., Mukesh Sankar, S., Wankhede, D. P., and Kaur, V. (2020). augmentedRCBD: Analysis of augmented randomised complete block designs. R package version 0.1.2. ICAR-NBPGR, New Delhi
Argyris, J., Dahal, P., Hayashi, E., Still, D. W., and Bradford, K. J. (2008). Genetic variation for lettuce seed thermoinhibition is associated with temperature-sensitive expression of abscisic acid, gibberellin, and ethylene biosynthesis, metabolism, and response genes. Plant Physiol. 148, 926–947. doi: 10.1104/pp.108.125807
Ashraf, M. F. M. R., and Foolad, M. R. (2007). Roles of glycine betaine and proline in improving plant abiotic stress resistance. Environ. Exp. Bot. 59, 206–216. doi: 10.1016/j.envexpbot.2005.12.006
Asseng, S., Ewert, F., Martre, P., Rötter, R. P., Lobell, D. B., Cammarano, D., et al. (2015). Rising temperatures reduce global wheat production. Nat. Clim. Chang. 5, 143–147. doi: 10.1038/nclimate2470
Baker, N. R., and Rosenqvist, E. (2004). Applications of chlorophyll fluorescence can improve crop production strategies: an examination of future possibilities. J. Exp. Bot. 55, 1607–1621. doi: 10.1093/jxb/erh196
Basu, P. S., Pratap, A., Gupta, S., Sharma, K., Tomar, R., and Singh, N. P. (2019). Physiological traits for shortening crop duration and improving productivity of greengram (Vigna radiata L. Wilczek) under high temperature. Front. Plant Sci. 10:1508. doi: 10.3389/fpls.2019.01508
Bhandari, K., Sharma, K. D., Rao, B. H., Siddique, K. H., Gaur, P., Agrawal, S. K., et al. (2017). Temperature sensitivity of food legumes: a physiological insight. Acta Physiol. Plant. 39:68. doi: 10.1007/s11738-017-2361-5
Blum, A., and Ebercon, A. (1981). Cell membrane stability as a measure of drought and heat tolerance in wheat. Crop Sci. 21, 43–47. doi: 10.2135/cropsci1981.0011183X002100010013x
Blum, A., Klueva, N., and Nguyen, H. T. (2001). Wheat cellular thermotolerance is related to yield under heat stress. Euphytica 117, 117–123. doi: 10.1023/A:1004083305905
Brestic, M., Zivcak, M., Kalaji, H. M., Carpentier, R., and Allakhverdiev, S. I. (2012). Photosystem II thermostability in situ: environmentally induced acclimation and genotype-specific reactions in Triticum aestivum L. Plant Physiol. Biochem. 57, 93–105. doi: 10.1016/j.plaphy.2012.05.012
Brestic, M., Zivcak, M., Kunderlikova, K., and Allakhverdiev, S. I. (2016). High temperature specifically affects the photoprotective responses of chlorophyll b-deficient wheat mutant lines. Photosyn. Res. 130, 251–266. doi: 10.1007/s11120-016-0249-7
Camejo, D., Rodríguez, P., Morales, M. A., Dell’Amico, J. M., Torrecillas, A., and Alarcón, J. J. (2005). High temperature effects on photosynthetic activity of two tomato cultivars with different heat susceptibility. J. Plant Physiol. 162, 281–289. doi: 10.1016/j.jplph.2004.07.014
Castellarin, S. D., Pfeiffer, A., Sivilotti, P., Degan, M., Peterlunger, E., and Di Gaspero, G. (2007). Transcriptional regulation of anthocyanin biosynthesis in ripening fruits of grapevine under seasonal water deficit. Plant Cell Environ. 30, 1381–1399. doi: 10.1111/j.1365-3040.2007.01716.x
Challinor, A., Wheeler, T., Garforth, C., Craufurd, P., and Kassam, A. (2007). Assessing the vulnerability of food crop systems in Africa to climate change. Clim. Change 83, 381–399. doi: 10.1007/s10584-007-9249-0
Chitra, U., Singh, U., and Rao, P. V. (1996). Phytic acid, in vitro protein digestibility, dietary fiber, and minerals of pulses as influenced by processing methods. Plant Foods Hum. Nutr. 49, 307–316. doi: 10.1007/BF01091980
Chovancek, E., Zivcak, M., Botyanszka, L., Hauptvogel, P., Yang, X., Misheva, S., et al. (2019). Transient heat waves may affect the photosynthetic capacity of susceptible wheat genotypes due to insufficient photosystem I photoprotection. Plants 8:282. doi: 10.3390/plants8080282
Christensen, T. H., Zhang, Z., Wei, Y., and Collinge, D. B. (1997). Subcellular localization of H2O2 in plants. H2O2 accumulation in papillae and hypersensitive response during the barley—powdery mildew interaction. Plant J. 11, 1187–1194.
Dellaporta, S. L., Wood, J., and Hicks, J. B. (1983). A plant DNA minipreparation: version II. Plant Mol. Biol. Rep. 1, 19–21. doi: 10.1007/BF02712670
Dhanda, S. S., and Munjal, R. (2006). Inheritance of cellular thermotolerance in bread wheat. Plant Breed. 125, 557–564. doi: 10.1111/j.1439-0523.2006.01275.x
Ehlers, J. D., and Hall, A. E. (1998). Heat tolerance of contrasting cowpea lines in short and long days. Field Crops Res. 55, 11–21. doi: 10.1016/S0378-4290(97)00055-5
Fischer, R. A., and Maurer, R. (1978). Drought resistance in spring wheat cultivars. 1. Grain-yield responses. Aust. J. Agric. Res. 29, 897–912. doi: 10.1071/AR9780897
Frahry, G., and Schopfer, P. (2001). NADH-stimulated, cyanide-resistant superoxide production in maize coleoptiles analyzed with a tetrazolium-based assay. Planta 212, 175–183. doi: 10.1007/s004250000376
Frutos, E., Galindo, M. P., and Leiva, V. (2014). An interactive biplot implementation in R for modeling genotype-by-environment interaction. Stoch. Environ. Res. Risk Assess. 28, 1629–1641.
Gabriel, K. R. (1971). The biplot graphic display of matrices with application to principal component analysis. Biometrika 58, 453–467. doi: 10.1093/biomet/58.3.453
Gaur, P. M., Samineni, S., Thudi, M., Tripathi, S., Sajja, S. B., Jayalakshmi, V., et al. (2019). Integrated breeding approaches for improving drought and heat adaptation in chickpea (Cicer arietinum L.). Plant Breed. 138, 389–400. doi: 10.1111/pbr.12641
Georgieva, K., and Yordanov, I. (1993). Temperature dependence of chlorophyll fluorescence parameters of pea seedlings. J. Plant Physiol. 142, 151–155. doi: 10.1016/S0176-1617(11)80955-7
Gowda, M. B. (2008). Genetic enhancement of Dolichos bean through integration of conventional breeding and molecular approaches. Final Project Report. Witney: The Kirkhouse Trust.
Hays, D. B., Do, J. H., Mason, R. E., Morgan, G., and Finlayson, S. A. (2007). Heat stress induced ethylene production in developing wheat grains induces kernel abortion and increased maturation in a susceptible cultivar. Plant Sci. 172, 1113–1123. doi: 10.1016/j.plantsci.2007.03.004
Hemantaranjan, A., Bhanu, A. N., Singh, M. N., Yadav, D. K., Patel, P. K., Singh, R., et al. (2014). Heat stress responses and thermotolerance. Adv. Plants Agric. Res. 1, 1–10. doi: 10.15406/apar.2014.01.00012
Ismail, A. M., and Hall, A. E. (1999). Reproductive-stage heat tolerance, leaf membrane thermostability and plant morphology in cowpea. Crop Sci. 39, 1762–1768. doi: 10.2135/cropsci1999.3961762x
Jaccard, P. (1908). Nouvelles recherches sur la distribution florale. Bull.Soc. Vaudoise des Sci. Nat. 44, 223–270.
Krishnamurthy, L., Gaur, P. M., Basu, P. S., Chaturvedi, S. K., Tripathi, S., Vadez, V., et al. (2011). Large genetic variation for heat tolerance in the reference collection of chickpea (Cicer arietinum L.) germplasm. Plant Genet. Resour. 9, 59–69. doi: 10.1017/S1479262110000407
Kumar, J., Basu, P. S., Gupta, S., Dubey, S., Gupta, D. S., and Singh, N. P. (2018). Physiological and molecular characterisation for high temperature stress in Lens culinaris. Funct. Plant Biol. 45, 474–487. doi: 10.1071/FP17211
Kumar, S., Kumari, P., Kumar, U., Grover, M., Singh, A. K., Singh, R., et al. (2013). Molecular approaches for designing heat tolerant wheat. J. Plant Biochem. Biotechnol. 22, 359–371. doi: 10.1007/s13562-013-0229-3
Murata, N., Allakhverdiev, S. I., and Nishiyama, Y. (2012). The mechanism of photoinhibition in vivo: re-evaluation of the roles of catalase, α-tocopherol, non-photochemical quenching, and electron transport. Biochim. Biophys. Acta BBA Bioenerget. 1817, 1127–1133. doi: 10.1016/j.bbabio.2012.02.020
Nayyar, H., Gaur, P. M., Kumar, S., Singh, S., Bindumadhava, H., Nair, R. M., et al. (2017). “How rising temperatures would be detrimental for cool and warm-season food legumes,” in Proceedings of the InterDrought-V, February 21-25, 2017, (Hyderabad: HICC).
Paliwal, R., Röder, M. S., Kumar, U., Srivastava, J. P., and Joshi, A. K. (2012). QTL mapping of terminal heat tolerance in hexaploid wheat (T. aestivum L.). Theor. Appl. Genet. 125, 561–575. doi: 10.1007/s00122-012-1853-3
Pandey, G. C., Mamrutha, H. M., Tiwari, R., Sareen, S., Bhatia, S., Siwach, P., et al. (2015). Physiological traits associated with heat tolerance in bread wheat (Triticum aestivum L.). Physiol. Mol. Biol. Plants 21, 93–99. doi: 10.1007/s12298-014-0267-x
Pootakham, W., Nawae, W., Naktang, C., Sonthirod, C., Yoocha, T., Kongkachana, W., et al. (2021). A chromosome-scale assembly of the black gram (Vigna mungo) genome. Mol. Ecol. Resour. 21, 238–250. doi: 10.1111/1755-0998.13243
Project Coordinator’s Report (2019). All India Coordinated Research Project on Mungbean, Urdbean, Lentil, Lathyrus, Field Pea. Kanpur: Indian Institute of Pulses Research.
R Core Team (2019). R: a Language and Environment for Statistical computing. Vienna: R Foundation for Statistical Computing.
Raizada, A. (2020). Development of genic-markers for yellow mosaic virus and bruchid resistance traits in blackgram (Vigna mungo (L.) Hepper). Ph.D. Thesis. Mumbai: Homi Bhabha National Institute, 214–265.
Raizada, A., and Souframanien, J. (2019). Transcriptome sequencing, de novo assembly, characterisation of wild accession of blackgram (Vigna mungo var. silvestris) as a rich resource for development of molecular markers and validation of SNPs by high resolution melting (HRM) analysis. BMC Plant Biol. 19:358. doi: 10.1186/s12870-019-1954-0
Ram, B., Singh, B. K., Singh, M., Singh, V. V., and Chauhan, J. S. (2012). Physiological And Molecular Characterization Of Indian Mustard (b. Juncea l.) Genotypes for High Temperature Tolerance. London: Crop Improvement (ICSA), 5–6.
Rohlf, F. J. (1998). NTSYS-Pc: Numerical taxonomy and Multivariate Analysis System, Version 2.0. Setauket: Exeter publications.
Roy, S. J., Tucker, E. J., and Tester, M. (2011). Genetic analysis of abiotic stress tolerance in crops. Curr. Opin. Plant Biol. 14, 232–239. doi: 10.1016/j.pbi.2011.03.002
Rustioni, L., Milani, C., Parisi, S., and Failla, O. (2015). Chlorophyll role in berry sunburn symptoms studied in different grape (Vitis vinifera L.) cultivars. Sci. Hortic. 185, 145–150. doi: 10.1016/j.scienta.2015.01.029
Salvucci, M. E., and Crafts-Brandner, S. J. (2004). Relationship between the heat tolerance of photosynthesis and the thermal stability of Rubisco activase in plants from contrasting thermal environments. Plant Physiol. 134, 1460–1470. doi: 10.1104/pp.103.038323
Scafaro, A. P., Haynes, P. A., and Atwell, B. J. (2010). Physiological and molecular changes in Oryza meridionalis Ng., a heat-tolerant species of wild rice. J. Exp. Bot. 61, 191–202. doi: 10.1093/jxb/erp294
Schreiber, U., and Bilger, W. (1987). “Rapid assessment of stress effects on plant leaves by chlorophyll fluorescence measurements,” in Plant Response To Stress, eds J. D. Tenhunen, F. M. Catarino, O. L. Lange, and W. C. Oechel (Berlin: Springer), 27–53. doi: 10.1007/978-3-642-70868-8_2
Sen Gupta, D., Singh, U., Kumar, J., Shivay, Y. S., Dutta, A., Sharanagat, V. S., et al. (2020). Estimation and multi-variate analysis of iron and zinc concentration in a diverse panel of urdbean (Vigna mungo L. Hepper) genotypes grown under differing soil conditions. J. Food Comp. Anal. 93:103605. doi: 10.1016/j.jfca.2020.103605
Sikder, S., Ahmed, J. U., and Hossain, T. (2001). Heat tolerance and relative yield performance of wheat varieties under late seeded conditions. Indian J. Agric. Res. 35, 141–148.
Singh, J., and Thakur, J. K. (2018). “Photosynthesis and abiotic stress in plants,” in Biotic And Abiotic Stress Tolerance in Plants, ed. S. Vats (Singapore: Springer), 27–46. doi: 10.1007/978-981-10-9029-5_2
Sita, K., Sehgal, A., HanumanthaRao, B., Nair, R. M., Vara Prasad, P. V., Kumar, S., et al. (2017). Food legumes and rising temperatures: effects, adaptive functional mechanisms specific to reproductive growth stage and strategies to improve heat tolerance. Front. Plant Sci. 8:1658. doi: 10.3389/fpls.2017.01658
Song, Y., Chen, Q., Ci, D., Shao, X., and Zhang, D. (2014). Effects of high temperature on photosynthesis and related gene expression in poplar. BMC Plant Biol. 14:111. doi: 10.1186/1471-2229-14-111
Souframanien, J., Raizada, A., Dhanasekar, P., and Suprasanna, P. (2020). Draft genome sequence of the pulse crop blackgram [Vigna mungo (L.) Hepper] reveals potential R-genes. Sci. Rep. 11:11247. doi: 10.1038/s41598-021-90683-9
Sun, X., Xie, Y., Bi, Y., Liu, J., Amombo, E., Hu, T., et al. (2015). Comparative study of diversity based on heat tolerant-related morpho-physiological traits and molecular markers in tall fescue accessions. Sci. Rep. 5, 1–14. doi: 10.1038/srep18213
Tahir, I. S. A., and Nakata, N. (2005). Remobilization of nitrogen and carbohydrate from stems of bread wheat in response to heat stress during grain filling. J. Agron. Crop Sci. 191, 106–115. doi: 10.1111/j.1439-037X.2004.00127.x
Tewari, A. K., and Tripathy, B. C. (1998). Temperature-stress-induced impairment of chlorophyll biosynthetic reactions in cucumber and wheat. Plant Physiol. 117, 851–858. doi: 10.1104/pp.117.3.851
Van der Westhuizen, M. M., Oosterhuis, D. M., Berner, J. M., and Boogaers, N. (2020). Chlorophyll a fluorescence as an indicator of heat stress in cotton (Gossypium hirsutum L.). South Afr. J. Plant Soil 37, 116–119. doi: 10.1080/02571862.2019.1665721
Venkatesha, S. C., Gowda, M. B., Mahadevu, P., Rao, A. M., Kim, D. J., Ellis, T. H. N., et al. (2007). Genetic diversity within Lablab purpureus and the application of gene-specific markers from a range of legume species. Plant Genet. Resour. 5, 154–171. doi: 10.1017/S1479262107835659
Viswanathan, C., and Khanna-Chopra, R. (2001). Effect of heat stress on grain growth, starch synthesis and protein synthesis in grains of wheat (Triticum aestivum L.) varieties differing in grain weight stability. J. Agron. Crop Sci. 186, 1–7. doi: 10.1046/j.1439-037x.2001.00432.x
Xu, P., Wu, X., Wang, B., Liu, Y., Ehlers, J. D., Close, T. J., et al. (2011). A SNP and SSR based genetic map of asparagus bean (Vigna. unguiculata ssp. sesquipedialis) and comparison with the broader species. PLoS One 6:e15952. doi: 10.1371/journal.pone.0015952
Yamada, M., Hidaka, T., and Fukamachi, H. (1996). Heat tolerance in leaves of tropical fruit crops as measured by chlorophyll fluorescence. Sci. Hortic. 67, 39–48. doi: 10.1016/S0304-4238(96)00931-4
Yamamoto, Y. (2016). Quality control of photosystem II: the mechanisms for avoidance and tolerance of light and heat stresses are closely linked to membrane fluidity of the thylakoids. Front. Plant Sci. 7:1136. doi: 10.3389/fpls.2016.01136
Yan, W. (2001). GGEbiplot—A Windows application for graphical analysis of multienvironment trial data and other types of two-way data. Agron. J. 93, 1111–1118. doi: 10.2134/agronj2001.9351111x
Keywords: Vigna mungo, heat tolerance, abiotic stress, membrane stability, electron transport rate, heat susceptibility index, chlorophyll fluorescence, molecular markers
Citation: Sen Gupta D, Basu PS, Souframanien J, Kumar J, Dhanasekar P, Gupta S, Pandiyan M, Geetha S, Shanthi P, Kumar V and Pratap Singh N (2021) Morpho-Physiological Traits and Functional Markers Based Molecular Dissection of Heat-Tolerance in Urdbean. Front. Plant Sci. 12:719381. doi: 10.3389/fpls.2021.719381
Received: 02 June 2021; Accepted: 02 August 2021;
Published: 29 September 2021.
Edited by:
Jose C. Jimenez-Lopez, Estación Experimental de Zaidín, Consejo Superior de Investigaciones Científicas, SpainReviewed by:
Marek Zivcak, Slovak University of Agriculture, SlovakiaKrishnendu Chattopadhyay, National Rice Research Institute (ICAR), India
Jun-ichi Sakagami, Kagoshima University, Japan
Copyright © 2021 Sen Gupta, Basu, Souframanien, Kumar, Dhanasekar, Gupta, Pandiyan, Geetha, Shanthi, Kumar and Pratap Singh. This is an open-access article distributed under the terms of the Creative Commons Attribution License (CC BY). The use, distribution or reproduction in other forums is permitted, provided the original author(s) and the copyright owner(s) are credited and that the original publication in this journal is cited, in accordance with accepted academic practice. No use, distribution or reproduction is permitted which does not comply with these terms.
*Correspondence: Debjyoti Sen Gupta, ZGViZ3BiQGdtYWlsLmNvbQ==; ZGVianlvdGkuZ3VwdGFAaWNhci5nb3YuaW4=; Jitendra Kumar, aml0ZW5kcmE3M0BnbWFpbC5jb20=