 Binjie Xu
 Xi Gong3†
 Jiefu Zhang
 Qi Peng
- 1Key Laboratory of Cotton and Rapeseed, Ministry of Agriculture, Institute of Industrial Crops, Jiangsu Academy of Agricultural Sciences, Nanjing, China
- 2Innovative Institute of Chinese Medicine and Pharmacy, Chengdu University of Traditional Chinese Medicine, Chengdu, China
- 3Triticeae Research Institute, Sichuan Agricultural University, Chengdu, China
- 4Institute of Life Sciences, Jiangsu University, Jiangsu, China
Sclerotinia stem rot caused by Sclerotinia sclerotiorum is a devastating disease for many important crops worldwide, including Brassica napus. Although numerous studies have been performed on the gene expression changes in B. napus and S. sclerotiorum, knowledge regarding the molecular mechanisms of B. napus–S. sclerotiorum interactions is limited. Here, we revealed the changes in the gene expression and related pathways in both B. napus and S. sclerotiorum during the sclerotinia stem rot (SSR) infection process using transcriptome analyses. In total, 1,986, 2,217, and 16,079 differentially expressed genes (DEGs) were identified in B. napus at 6, 24, and 48 h post-inoculation, respectively, whereas 1,511, 1,208, and 2,051 DEGs, respectively, were identified in S. sclerotiorum. The gene ontology and Kyoto Encyclopedia of Genes and Genomes analyses showed that most of the hormone-signaling pathways in B. napus were enriched, and thus, the hormone contents at four stages were measured. The DEGs and hormone contents revealed that salicylic acid was activated, while the jasmonic acid pathway was repressed at 24 h post-inoculation. Additionally, the expressional patterns of the cell wall-degrading enzyme-encoding genes in S. sclerotiorum and the hydrolytic enzymes in B. napus were consistent with the SSR infection process. The results contribute to a better understanding of the interactions between B. napus and S. sclerotiorum and the development of future preventive measures against SSR.
Introduction
Brassica napus (canola, rapeseed) is the second most widely produced oilseed crop worldwide and is constantly threatened by a devastating disease caused by the fungal pathogen Sclerotinia sclerotiorum. Sclerotinia sclerotiorum (Lib.) de Bary, the causative agent of sclerotinia stem rot (SSR), is a plant pathogen that belongs to the Sclerotiniaceae family of Ascomycete fungi. It also has a wide host range and can infect more than 400 plant species, including many important crop plants (Boland and Hall, 1994; Kabbage et al., 2015). This fungus is a prototypical necrotrophic pathogen, and it secretes the non-selective phytotoxin oxalic acid (OA), which aids the pathogen in multiple ways, such as pH acidification, Ca2+ chelation, and the low-pH activation of degradative enzymes, which augment the fungal colonization of host plants (Xu et al., 2018). Cultivating disease-resistant rapeseed varieties is the most cost-effective way to prevent and control SSR. However, the lack of identified resistance genes in cultivated rapeseed varieties and related species has limited the molecular breeding of rapeseed. Therefore, it is imperative to understand the molecular mechanisms of B. napus and S. sclerotiorum interactions and to create new sources of disease-resistant rapeseed.
Usually, plants respond through two immune pathways when attacked by pathogens: pathogen-associated molecular patterns (PAMP)-triggered immunity and effector-triggered immunity (Jones and Dangl, 2006), which involve physical barriers (e.g., cell walls and a vast array of antimicrobial compounds). Many of these antimicrobial compounds are part of active defense response, and their rapid induction is contingent on the ability of the plant to recognize and respond to invading pathogens (Staskawicz et al., 1995; Baker et al., 1997). Phytohormones, an antimicrobial chemical factor, play crucial roles in plant defenses following a pathogen attack. Generally, plant defense responses against pathogens are controlled by complex signaling pathways that often involve the classical defense phytohormones: salicylic acid (SA), ethylene (ET), and jasmonic acid (JA) (Robert-Seilaniantz et al., 2011). The SA signaling triggers resistance against biotrophic and hemibiotrophic pathogens and the establishment of systemic acquired resistance, whereas a combination of JA and ET signaling activates resistance against necrotrophs (Glazebrook, 2005; Grant and Lamb, 2006).
Because of the availability and efficiency of next-generation sequencing technology, transcriptome analyses have been used to understand the molecular mechanisms of host plant interactions with pathogens. Wu et al. (2016) used transcriptome analysis to classify 13,313 genes according to their functional categories and analyzed the expression levels of genes having hydrolase-related functions. Seifbarghi et al. (2017) used an RNA-sequencing (RNA-seq) analysis to comprehensively catalog genes that are expressed and upregulated during B. napus infections, with a particular focus on early events. By examining the global transcriptional changes in S. sclerotiorum during the infection of rapeseed plants having different susceptibilities to the pathogen, the roles of peroxisome-related pathways, along with cell-wall degradation and host metabolite detoxification, have been identified (Chittem et al., 2020).
Here, we performed a genome-wide expression profiling of B. napus and S. sclerotiorum to investigate the defense mechanisms involved in both the resistance of B. napus against infections, the S. sclerotiorum infection of B. napus, and their interactions. For this purpose, we used the rapeseed cultivar “Ning RS-1” that was inoculated with S. sclerotiorum isolate 1980 for differential gene expression analyses at three different time points, namely, an early stage of pathogen establishment and the late stages of symptom expression and sporulation. Additionally, hormone contents were measured and analyzed in combination with the expressional patterns of related genes in B. napus. An in-depth analysis of differentially expressed genes (DEGs) during infection or in response to S. sclerotiorum may provide insights into the molecular mechanisms of the disease resistance of B. napus.
Materials and Methods
Plant Material, Pathogen, and Pathogen Inoculation
The double haploid B. napus cultivar “Ning RS-1,” which shows a partial SSR resistance (Zhang et al., 2002), was used as the host plant. The S. sclerotiorum isolate 1980 was used because its genome sequence was available (Derbyshire et al., 2017). The S. sclerotiorum was washed with sterilized water and cultured on a potato dextrose agar (PDA) medium (300 g/L of diced potato, 20 g/L of sucrose, and 15 g/L of agar in 1 L of ddH2O) for activation at 25°C over 4 days. Then, mycelial plugs (5 mm in diameter) excised from plates with growing fungal cultures were collected and placed on the leaves of 3-month-old rapeseed plants for inoculation. After inoculation, the plants were incubated in a sealed and humidified tray at room temperature. Leaf samples were collected using a 2-cm diameter punch at 6, 24, and 48 h post-inoculation (hpi). The leaves without inoculation and the mycelial plugs were mixed and used as 0 hpi (mock) samples. Three independent biological replicates (three plants/biological replicate/time point) were used for each inoculation experiment. In total, 12 samples were prepared and subjected to RNA-seq analysis.
RNA Extraction, cDNA Library Construction, and RNA Sequencing
The total RNA was extracted using a TRIzol reagent (TIANGEN, Beijing, China) following the procedure of the manufacturer and checked for quantity and purity with a Bioanalyzer 2100 and RNA 6000 Nano LabChip Kit (Agilent, Santa Clara, CA, USA). Before RNA extraction, the fungi from the culture plates and oilseed leaves at 0 hpi were pooled as a mixed RNA sample. In total, 12 RNA samples (three inoculated samples at 6, 24, and 48 hpi and a mixed mock-fungal sample for each biological replicate) were used for library construction with an TruSeq RNA Sample Preparation kit v2 (Illumina, San Diego, CA, USA) following the instructions of the manufacturer. All the samples were sequenced using an Illumina HiSeq 2000 sequencer by Biomac Inc. (Beijing, China).
Data Processing, Read Mapping, and Differential Gene Expression Analysis
Various quality controls for raw reads were conducted using FastQC version 0.1.9 (Brown et al., 2017) to remove the primer/adaptor sequence-containing and low-quality [in which the number of bases with PHRED-like scores (Q-score) of <20 exceeded 30%] reads. Then, the first 10 bp of the reads that showed unstable base compositions as determined by the percentages of four different nucleotides (A, T, C, and G) and the low-quality bases (Q-score <20) from the 3′ ends of the reads were trimmed, and the reads of <50 bp were removed. All the high-quality reads of each sample that passed the quality control assays were mapped independently to the B. napus and S. sclerotiorum genomes using TopHat 2 (Trapnell et al., 2012; Kim et al., 2013) with the default parameters. The reference genomes of B. napus were downloaded from http://www.genoscope.cns.fr/brassicanapus/data/, whereas those of S. sclerotiorum were downloaded from the National Center for Biotechnology Information search database (https://www.ncbi.nlm.nih.gov/assembly/GCA_001857865.1/). Only uniquely mapped reads were used for further gene expression analyses. For all the comparisons, read counts were normalized to the aligned fragments per kilobase of transcript per million (FPKM) mapped reads (Mortazavi et al., 2008) to obtain the relative expression levels. Differential expression analyses between different developmental stages were performed using the DESeq R packages (Wang et al., 2010). The DEGs between different samples were identified using the restrictive conditions of an absolute value of fold change ≥4 and a false discovery rate ≤ 0.001.
Gene Ontology (GO) and Kyoto Encyclopedia of Genes and Genomes (KEGG) Enrichment Analyses
For the gene functional annotation, all the genes in B. napus and S. sclerotiorum were used as queries against the National Center for Biotechnology Information non-redundant protein (https://blast.ncbi.nlm.nih.gov/Blast.cgi), Swiss-Prot (Apweiler et al., 2004), and Pfam (Finn et al., 2014) databases. The GO terms associated with each BLAST hit were annotated using Blast2GO (Conesa et al., 2005). Then, all the B. napus and S. sclerotiorum genes were used as queries against the InterPro database (http://www.ebi.ac.uk/interpro/) using InterProScan550 (Jones et al., 2014). Finally, the GO terms of the B. napus and S. sclerotiorum genes were annotated by merging the Blast2GO and InterPro annotation results. The GO enrichment analysis provided all the GO terms that were significantly enriched with DEGs compared with the genome background using Blast2GO with a false discovery rate of ≤ 0.01. The annotations were then refined and enriched using the TopGo R package (http://www.bioconductor.org/packages/release/bioc/html/topGO.html). The enrichment of DEGs in the Kyoto Encyclopedia of Genes and Genomes (KEGG) pathways was analyzed using the KOBAS software 2.0 (Xie et al., 2011). The heat maps were drawn using the R package and TBtools (Chen et al., 2020) based on the log2 transformed FPKM values. The expression value for a given gene was normalized.
Quantitative RT-PCR Assays
Quantitative real-time-PCR assays were performed to confirm the RNA-seq results and analyze the expression level of target genes. In total, 2 μg of the total RNA from each sample (the same samples used for RNA-seq) were used to synthesize cDNA with a TransScript One-Step gDNA Remover and cDNA Synthesis Kit following the instructions of the manufacturer (TaKaRa, Dalian, China). The quantitative real-time-PCR (qRT-PCR) was performed using an SYBR premix Ex Taq™ RT-PCR kit (TaKaRa). All the experiments were performed following the instructions of the manufacturer. The data were collected from three biological and three technical replicates. The transcript level was normalized using three reference genes, Actin 2 (BnaC03g73810D), Ubiquitin-conjugating enzyme 10 (BnaA10g06670D), and Yellow Leaf Specific 8 (BnaC09g47620D). The primers used in these experiments are listed in Supplementary Table 1.
Measurement of Hormones in B. napus Leaves
The samples infected with S. sclerotiorum were prepared and collected in the same manner described for the RNA-seq analysis. In addition, samples taken from uninfected areas of the same leaves were collected. The SA, JA, gibberellic acid (GA3), indole-3-acetic acid (IAA), and abscisic acid (ABA) concentrations were measured using an ultraperformance liquid chromatography-tandem mass spectrometry (UPLC-MS/MS) method (Balcke et al., 2012) with minor modifications. The phytochemical standards were purchased from Sigma-Aldrich (St. Louis, MO, USA), whereas other reagents were purchased from Solarbio (Beijing, China). Three biological replicates per hormone were analyzed.
Results
A DEG Analysis of B. napus Infected Leaves Using RNA-seq
Sclerotinia sclerotiorum was inoculated into the B. napus leaves at the early flowering stage (Figure 1A). The leaf necrosis symptom was not observed at 0 and 6 hpi, but it was significant at 24 hpi, and the S. sclerotiorum rapidly infected the B. napus leaves between 24 and 48 hpi (Figures 1B–E). The RNA-seq data revealed that approximately 44.7 to 66.4 million paired-end reads were generated in B. napus (Supplementary Table 2). After mapping to the reference genome using TopHat2 (v2.0.12) and merging annotations through cuffmerge, 102,216 genes were annotated to the published reference genome and 2,112 new genes were annotated and predicted (Supplementary Table 3).
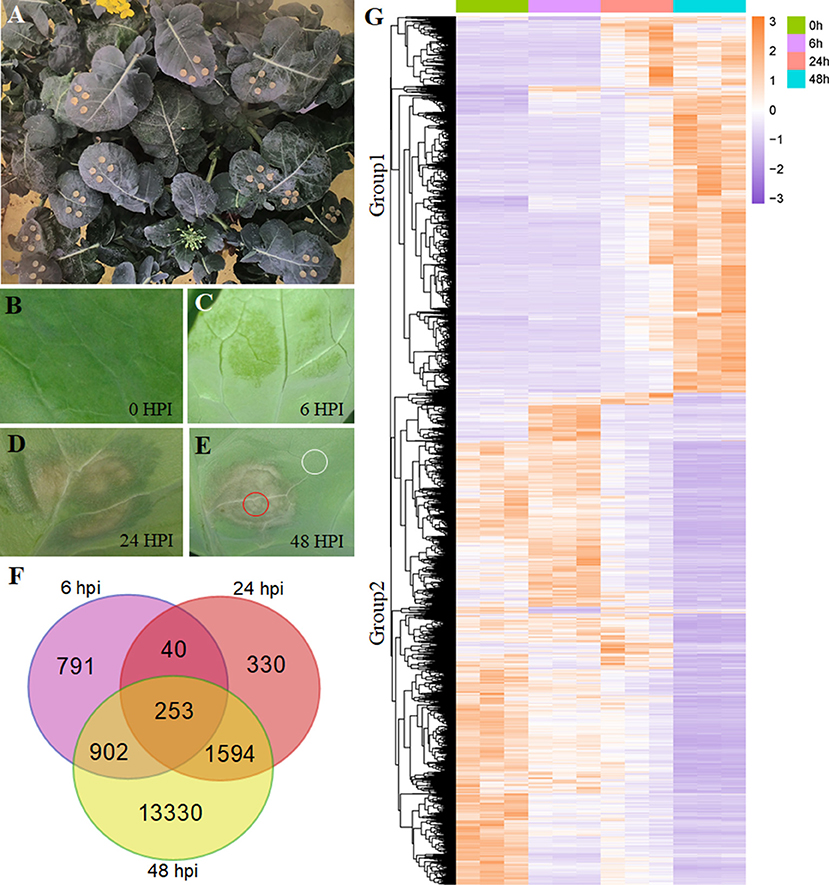
Figure 1. Differentially expressed gene (DEG) analysis in Brassica napus. (A) The growing plant of B. napus at the flowering stage. (B–E) The symptoms of Sclerotinia sclerotiorum infection on B. napus leaves at 0, 6, 24, and 48 hpi. The circled areas in (E) were used in Figure 5. (F) Overlapping and unique DEGs at the 6-, 24-, and 48-hpi stages. (G) Heatmap illustrating the hierarchical clustering results for RNA-sequencing (RNA-seq), group 1 and group 2 represent two expressed patterns. hpi, hours post-inoculation.
Using the gene expression levels calculated by FPKM mapped reads, we found a tight overlap among the three stages (6, 24, and 48 hpi) compared with the mock stage (0 hpi; Figure 1F), having 253 DEGs. The numbers of genes expressed in only one stage were 791, 330, and 13,330 for 6, 24, and 48 hpi, respectively. At the 48-hpi stage, the highest numbers of DEGs (16,079) and stage-specific genes (13,330) were identified, indicating that time was required to genetically respond to the S. sclerotiorum infection of B. napus.
Functional Classification Using GO and KEGG Pathway Analyses in B. napus
A hierarchical clustering analysis used to compare global gene expression changes showed two significantly different expression pattern groups (Figure 1G). Furthermore, the GO analysis indicated that these upregulated DEGs during pathogen infection (8,602 genes clustered in Group 1) were enriched in 20 subcategories of biological processes, including the regulation of plant-type hypersensitive response, protein targeting to the membrane, responses to stress processes, the negative regulation of programmed cell death (PCD), systemic acquired resistance, and responses to JA (Figure 2A; Supplementary Table 4), whereas the downregulated DEGs (11,164 genes clustered in Group 2) were enriched in both cellular components and biological processes, including the chloroplast envelope, an integral component of the membrane, plant-type cell wall, auxin polar transport, and the regulation of hormone levels (Figure 2B; Supplementary Table 4).
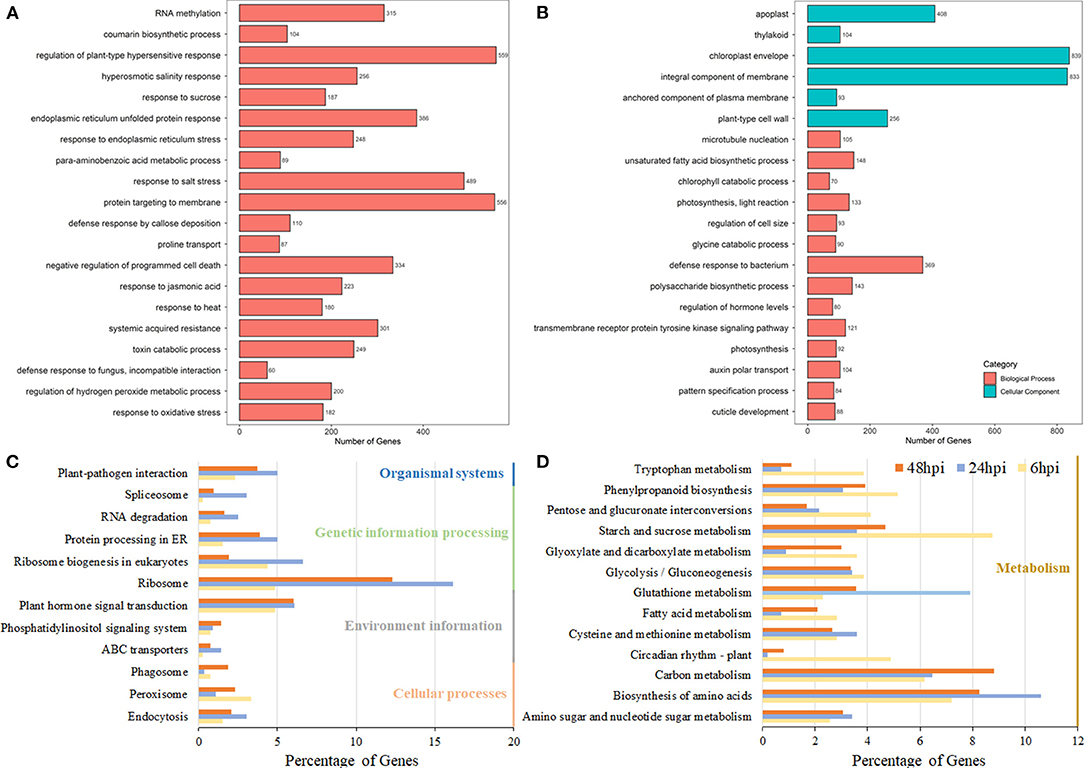
Figure 2. Pathway analysis of DEGs in B. napus based on the gene ontology (GO) and Kyoto Encyclopedia of Genes and Genome (KEGG) databases. The GO enrichment analysis of Group 1 (A) and Group 2 (B). The y-axis indicated the numbers of annotated genes, and the x-axis indicated the GO terms. The GO analysis was conducted using the Blast2Go software. (C,D) The KEGG enrichment analysis of DEGs at the 6-, 24-, and 48-hpi stages. The x-axis indicated the ratio of the enriched gene number to the total gene number at three stages, and the y-axis indicated different enriched terms.
Using all the DEGs at the three developmental stages, 6, 24, and 48 hpi, compared with the mock stage, 389, 557, and 3,946 genes were mapped to the KEGG database, respectively. At 24 and 48 hpi, these DEGs were classified into 50 different terms, with the ribosome (90/557 and 485/3,946, respectively) and the biosynthesis of amino acids pathway (59/557 and 326/3,946, respectively) accounting for large proportions of the DEGs (Figures 2C,D; Supplementary Table 5). Most DEGs were classified into pathways related to starch and sucrose metabolism (34/389) and the biosynthesis of amino acids (28/389) at the 6-hpi stage (Figure 2D). During the infection, the number of DEGs in plant-pathogen interactions and plant hormone signal transduction pathways increased dramatically (Figure 2C). A detailed analysis showed that the DEGs grouped into the plant hormone signal transduction pathway category were mainly classified as being involved in JA and ET signal transduction and brassinosteroid biosynthesis (Supplementary Table 6). At 6 hpi, DEGs were classified into the auxin/IAA, cytokinin, ABA, and JA pathways (Figure 3; Table 1; Supplementary Table 6), which indicated that these hormone signals were activated at the early stage of pathogen infection. Then, more hormone signal pathways, including that of SA, were activated, consistent with the pathogen invasion (Figures 3B,C).
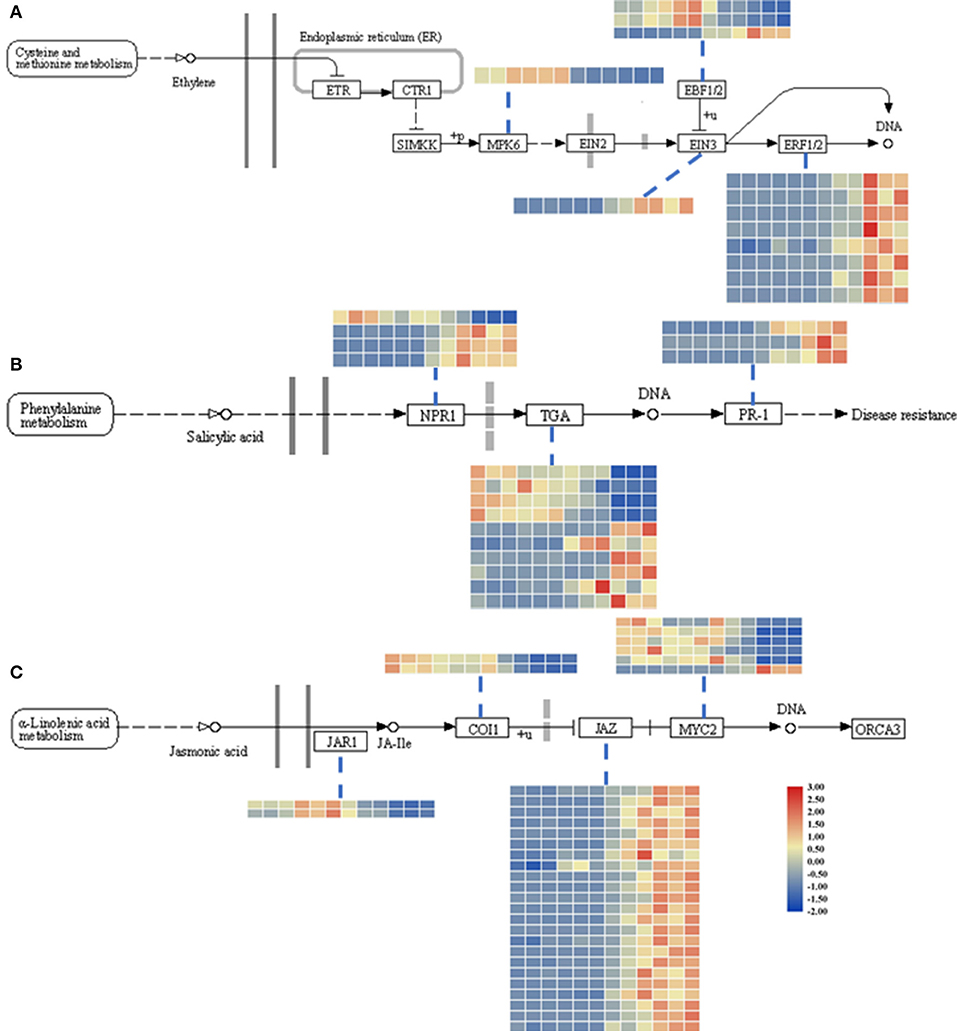
Figure 3. Heatmap of DEGs related to the ET (ethylene; A), SA (salicylic acid; B), and JA (jasmonic acid; C) signaling pathways. The descriptions of DEGs in this picture were listed in Table 1. The heatmap was drawn with TBtools (Chen et al., 2020).
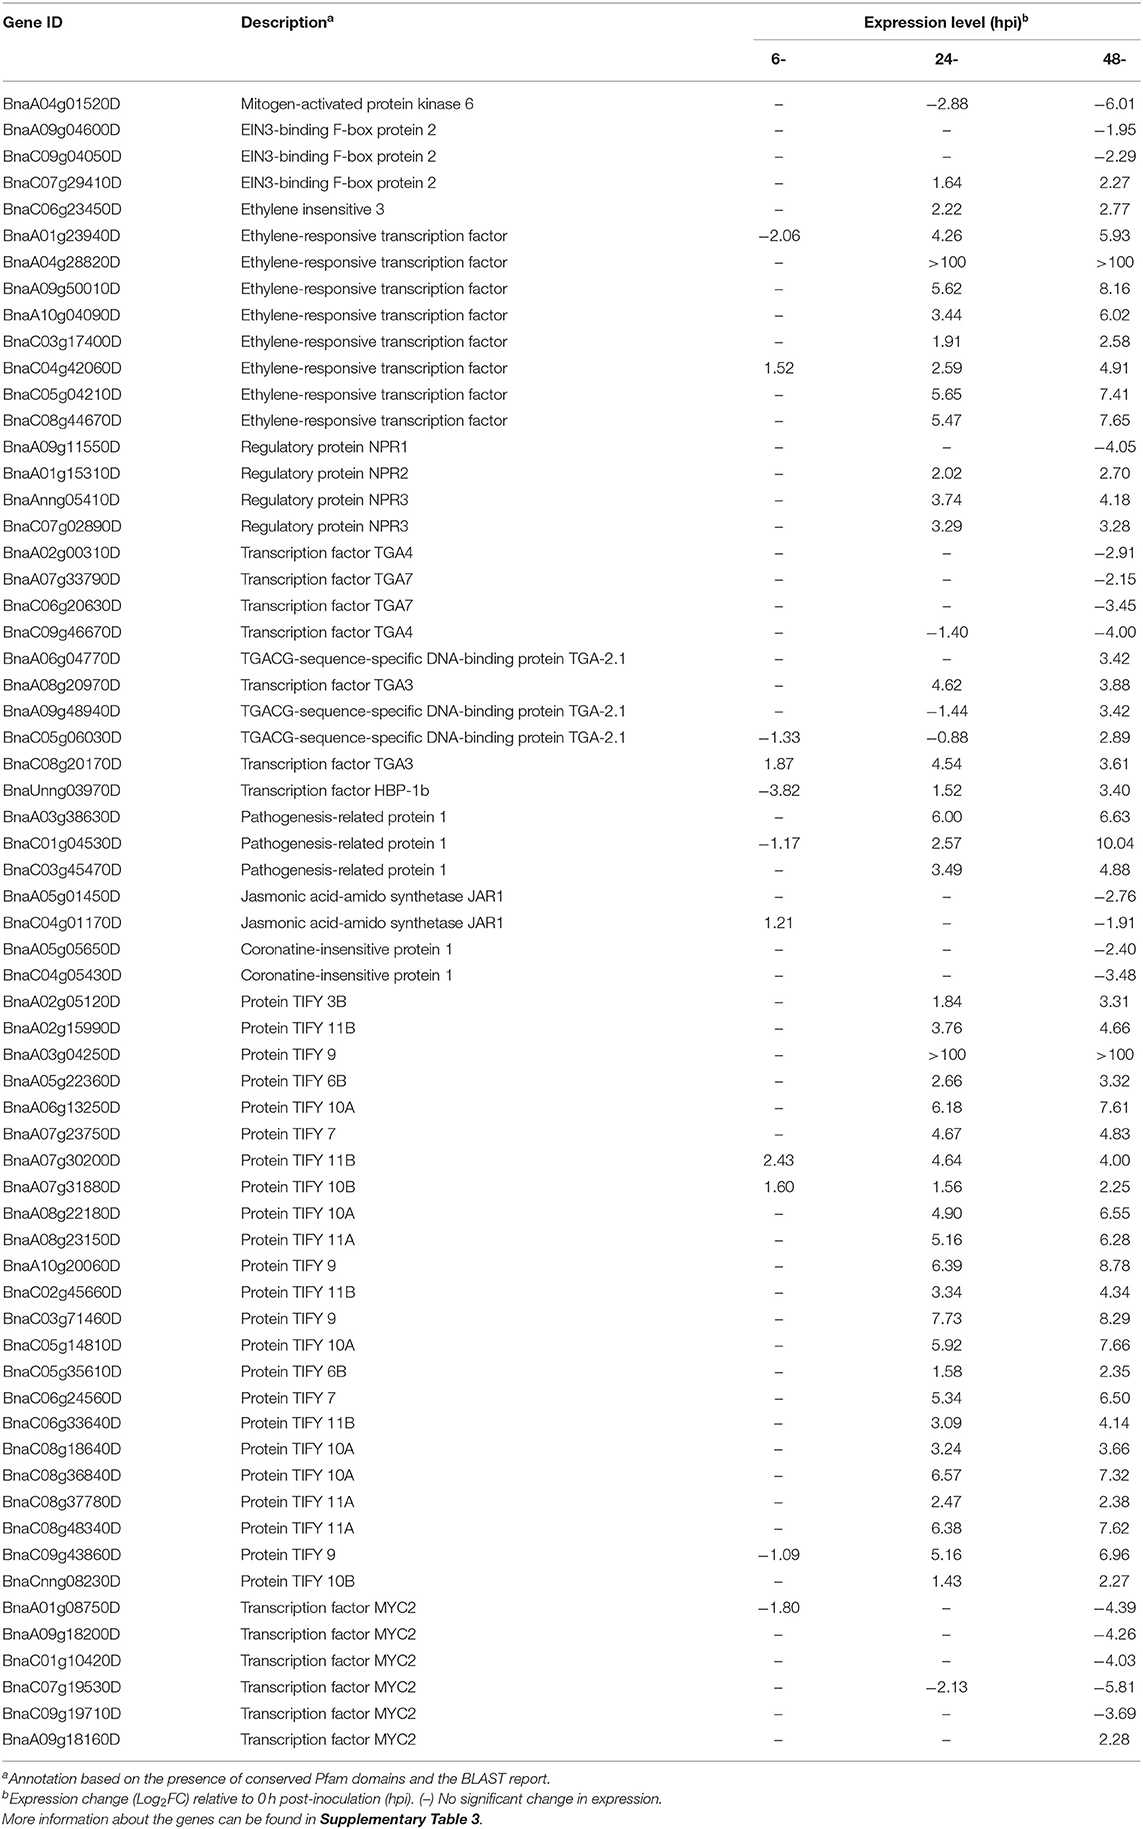
Table 1. Description and expression of genes in B. napus involved in the hormone signaling pathway.
Expression Patterns of Defense Response-Associated Genes
The RNA-seq data were verified through a qRT-PCR analysis of eight DEGs at four stages (Supplementary Table 1). The expression patterns of the eight genes as determined by the qRT-PCR were largely consistent with those obtained from RNA-seq (Figure 4).
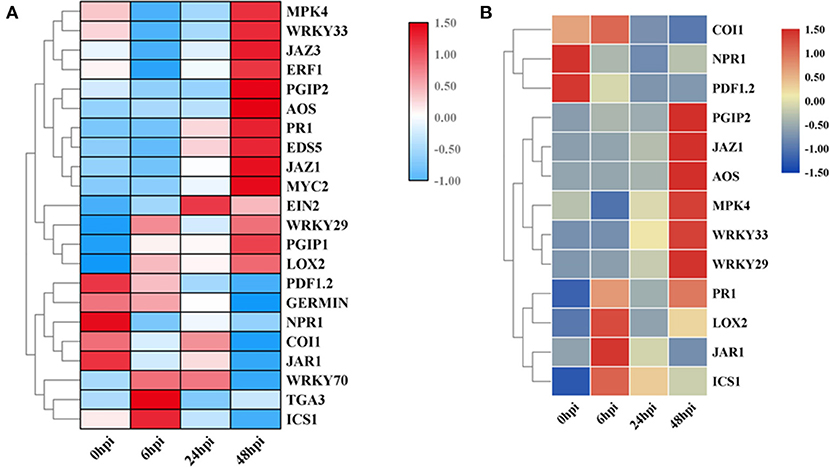
Figure 4. Validation of the expression of 22 genes by quantitative reverse transcription PCR (qRT-PCR). (A) The expression-level changes based on qRT-PCR data. (B) The expression-level changes based on RNA-seq data. Gene IDs are listed in Supplementary Table 1.
Additionally, to identify the expression patterns of genes involved in defense-response pathways, which play crucial roles in a pathogen attack, several genes were selected and analyzed by qRT-PCR (Figure 4A). In the JA pathway, the expression levels of two genes involved in JA biosynthesis at four stages were identified. The expression levels of allene oxide synthases (AOS; BnaC02g29610D) and lipoxygenase 2 (LOX2; BnaA07g19600D), two genes encoding the key enzymes of JA biosynthesis, increased as the pathogen infection proceeded, while the expression levels of JAR1, coronatine-insensitive 1 (COI1), and MYC2 were more complicated (Figure 3C). In particular, the expression levels of jasmonate ZIM-domain proteins (JAZs), the key proteins involved in the JA-signaling pathway, in binding to COI1 through Skp1/Cullin1/F-box protein COI1 (SCFcoi1) complex-mediated ubiquitination and in regulating ubiquitin-26S proteasome degradation, were downregulated (Figure 3C). In rapeseed, the mitogen-activated protein kinase cascade reaction and its direct targets, WRKY transcription factors, play broad roles in regulating defenses (Eulgem and Somssich, 2007). The expression levels of MPK4, WRKY33, WRKY29, and WRKY70 were analyzed by qPCR, and these genes were all upregulated after 6 hpi (Figure 4). Isochorismate synthase 1 (ICS1) is an important gene involved in SA biosynthesis (Zheng et al., 2015). In this study, the expression level of BnICS1 (BnaC06g22820D) showed a significant increase at 6 hpi and then decreased at 24 and 48 hpi (Figure 4A). Polygalacturonase-inhibiting proteins (PGIPs) occur in plant cell walls and counteract the actions of the polygalacturonase (PG) from S. sclerotiorum to prevent the degradation of cell walls (De Lorenzo and Ferrari, 2002). The expression levels of PGIP1 and PGIP2 were upregulated consistently after inoculation and peaked at 48 hpi (Figure 4A).
Several Hormone Contents Changed in B. napus Leaves After S. sclerotiorum Infection
Considering the differential expression of genes involved in plant hormone pathways, the contents of five hormones, ABA, IAA, GA3, JA, and SA, were measured (Figure 5). To distinguish the hormonal differences in infected and uninfected areas (white circle in Figure 1E), the hormone contents at four stages were measured. It was hypothesized that the trends in the hormone levels in the uninfected leaves were related to plant resistance, whereas the hormone levels in the infected leaves were related to plant-pathogen interactions. The ABA content in the infected leaves was reduced significantly (p < 0.01) during pathogen infection (Figure 5A), while the GA3 content was maintained at the same level at 0 and 48 hpi after significantly increasing at 6 and 24 hpi (Figure 5B). The IAA content at 48 hpi was greater than in the mock stage (p < 0.05; Figure 5C). The JA and SA contents were stable at 6 hpi, increased significantly (p < 0.01) at 24 hpi, and then decreased slightly at 48 hpi (Figures 5D,E).
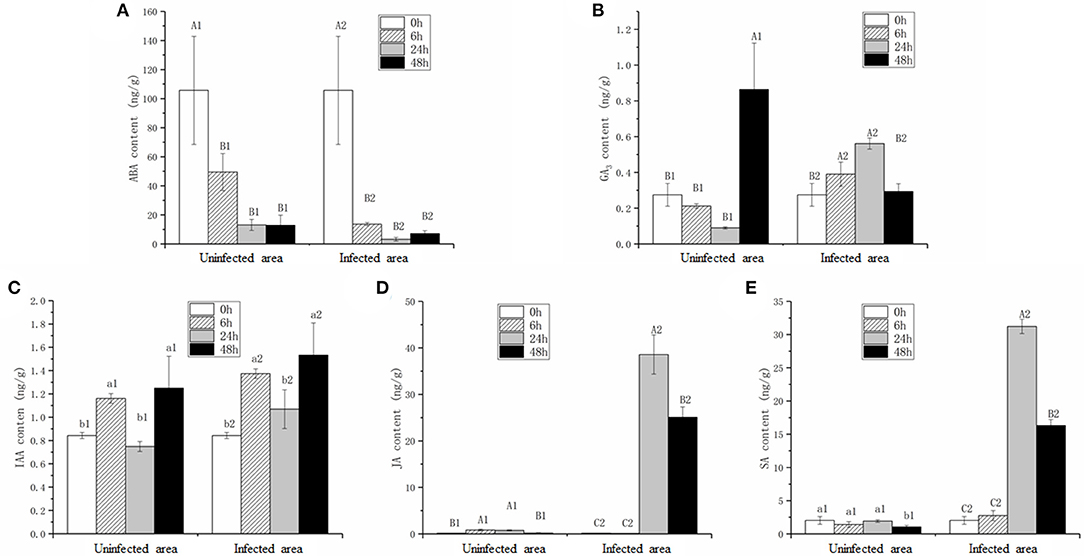
Figure 5. Contents of abscisic acid (ABA) (A), gibberellic acid (GA3) (B), indole-3-acetic acid (IAA) (C), JA (D), and SA (E) in infected (infected area) and uninfected leaves (uninfected area). Values are the mean ± SD of three biological replicates per treatment. Different letters above each column indicate a significant difference (Capital letters: p < 0.01; others: p < 0.05; n = 3).
The ABA and IAA contents in uninfected leaves were consistent within the infected leaves (Figures 5A,C), whereas the JA and SA contents in the uninfected leaves were extremely lower compared with the infected leaves at 24 and 48 hpi (Figures 5D,E). Interestingly, the GA3 content change trends in the uninfected and infected leaves during pathogen infection were opposite (Figure 5B).
Differential Gene Expression Analysis in S. sclerotiorum
During the infection, many expressed genes of S. sclerotiorum were induced and changed, with the peak occurring at 48 hpi (Figure 6A; Supplementary Table 7). The expression patterns of S. sclerotiorum genes varied and clustered into different sub-clusters (Figure 6B). Some DEGs were enriched in cell-wall modification (GO:0005618 and GO:0042545) and the chitin/chitinase process (GO:0006032 and GO:0004568), which play important roles during host invasion. The KEGG analysis showed that the DEGs of S. sclerotiorum at 6 hpi were mainly enriched in the ribosome and its biogenesis pathway (Figure 6C). Then, at 24 hpi, the DEGs were enriched in the valine, leucine and isoleucine degradation, pentose and glucuronate interconversions, starch and sucrose metabolism, and peroxisome pathways (Figures 6C,D). At 48 hpi, some DEGs showed enrichment in the pentose and glucuronate interconversions, starch and sucrose metabolism, and alpha-linolenic acids pathway (Figures 6C,D; Supplementary Table 8), in which the expression levels of shikimate dehydrogenase (SS1G_08336; gene 7815), chorismate mutase type II (SS1G_08569; gene 8012), and galactose oxidase (SS1G_13392; gene10461) were upregulated. Many genes in these pathways, including SS1G_00468, SSPG1, SS1G_07184, and SS1G_01021, were upregulated (Supplementary Table 9).
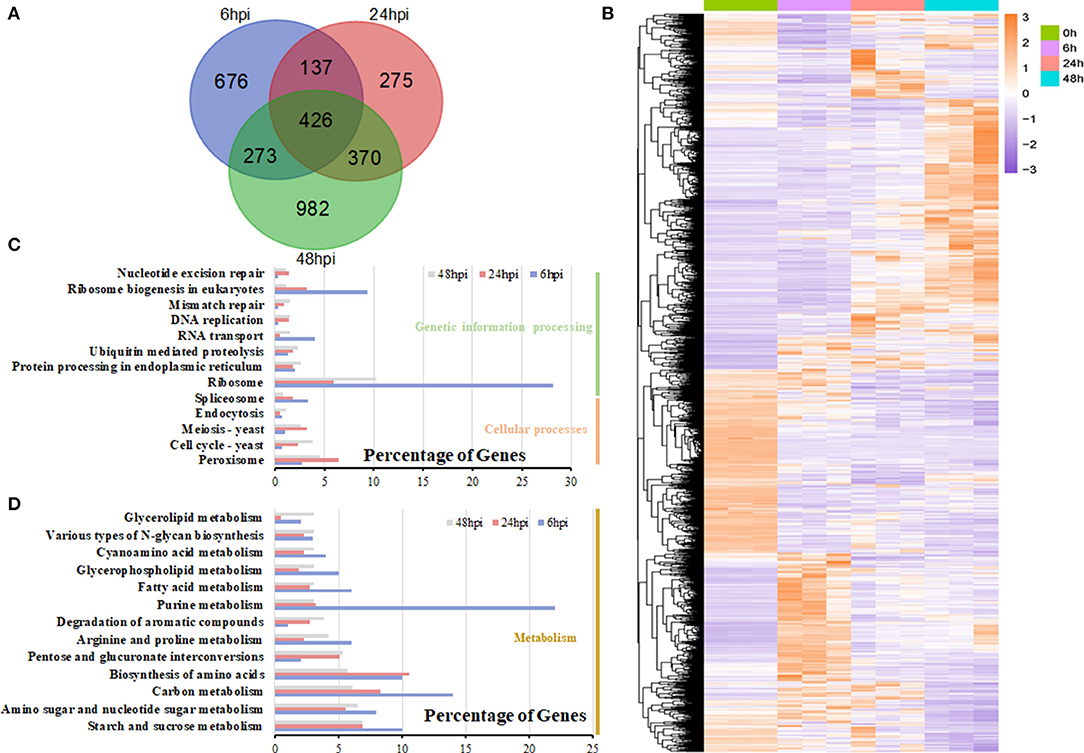
Figure 6. DEG analysis in S. sclerotiorum. (A) The number of DEGs expressed at the 6-, 24-, and 48-hpi stages and their overlapping. (B) Heatmap illustrating the hierarchical clustering results for RNA-seq. (C,D) KEGG enrichment analysis of DEGs at the 6-, 24-, and 48-hpi stages. The x-axis indicated the ratio of the enriched gene number to the total gene number at three stages, and the y-axis indicated different enriched terms.
The sclerotium is central to the life and disease cycles of S. sclerotiorum (Bolton et al., 2006), which require the expression of numerous associated genes. As a group, the ATP-binding cassette and major facilitator superfamily (MFS) transporters exhibit wide ranges of specificities (amino acids, drugs, heavy metals, inorganic ions, peptides, polysaccharides, and sugars); however, some have been implicated in the secretion of fungal toxins or the efflux of host phytoalexins (Perlin et al., 2014). Here, 8 genes encoding MFS transporters and 22 genes encoding ATP-binding cassette transporters were detected and showed differential expression levels during the infection stage (Figure 7). Interestingly, almost all the differential expressed MFS genes encoded sugar transport proteins but showed various expression patterns (Figure 7; Supplementary Table 9). For instance, the expression level of SS1G_05572 (gene 6935) was upregulated at 48 hpi, while SS1G_08425 (gene 7888) was significantly downregulated compared with 0 hpi, which suggested unknown and diverse functions for these MFS genes (Figure 7).
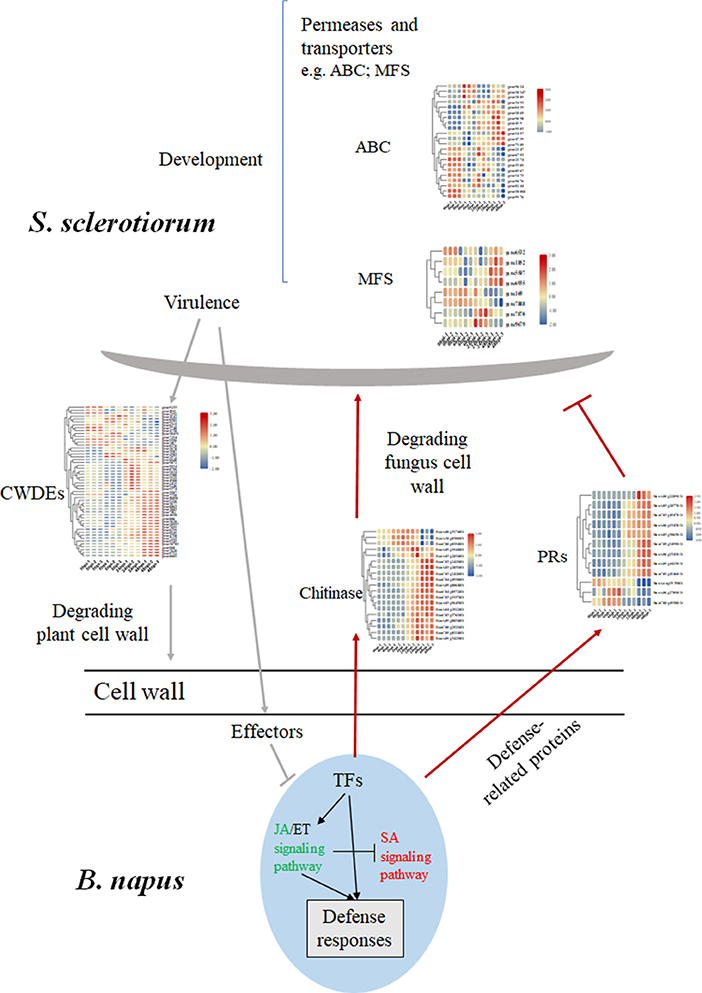
Figure 7. Differential changed genes involved in the major molecular mechanisms of B. napus–S. sclerotiorum interactions. The SA signaling pathway colored in red indicated an activation, while the JA signaling pathway colored in green indicated repression in our study. Abbreviations: CWDE, cell wall-degrading enzymes; PRs, pathogen-related proteins; TF, transcription factor.
Numerous genes encoding enzymes with hydrolytic activities were induced during infection, with the largest group encoding carbohydrate-active enzymes. Most of the predicted carbohydrate-active enzyme-encoding genes were from the glycoside hydrolase (GH) and carbohydrate esterase (CE) families, and they were upregulated during the S. sclerotiorum infection process (Amselem et al., 2011; Seifbarghi et al., 2017). In this research, 52 genes belonging to the GH family were identified, and most showed increased expression levels during the infection (Table 2). Among them, the GH28 subfamily contains PGs, enzymes that degrade cell-wall pectin. SsPG1 (Gene11050), SsPG5 (Gene1929), and SsPG6 (Gene9072), which encode PG and endopolygalacturonase (endo-PG), respectively, were upregulated at 24–48 hpi (Figure 7; Table 2).
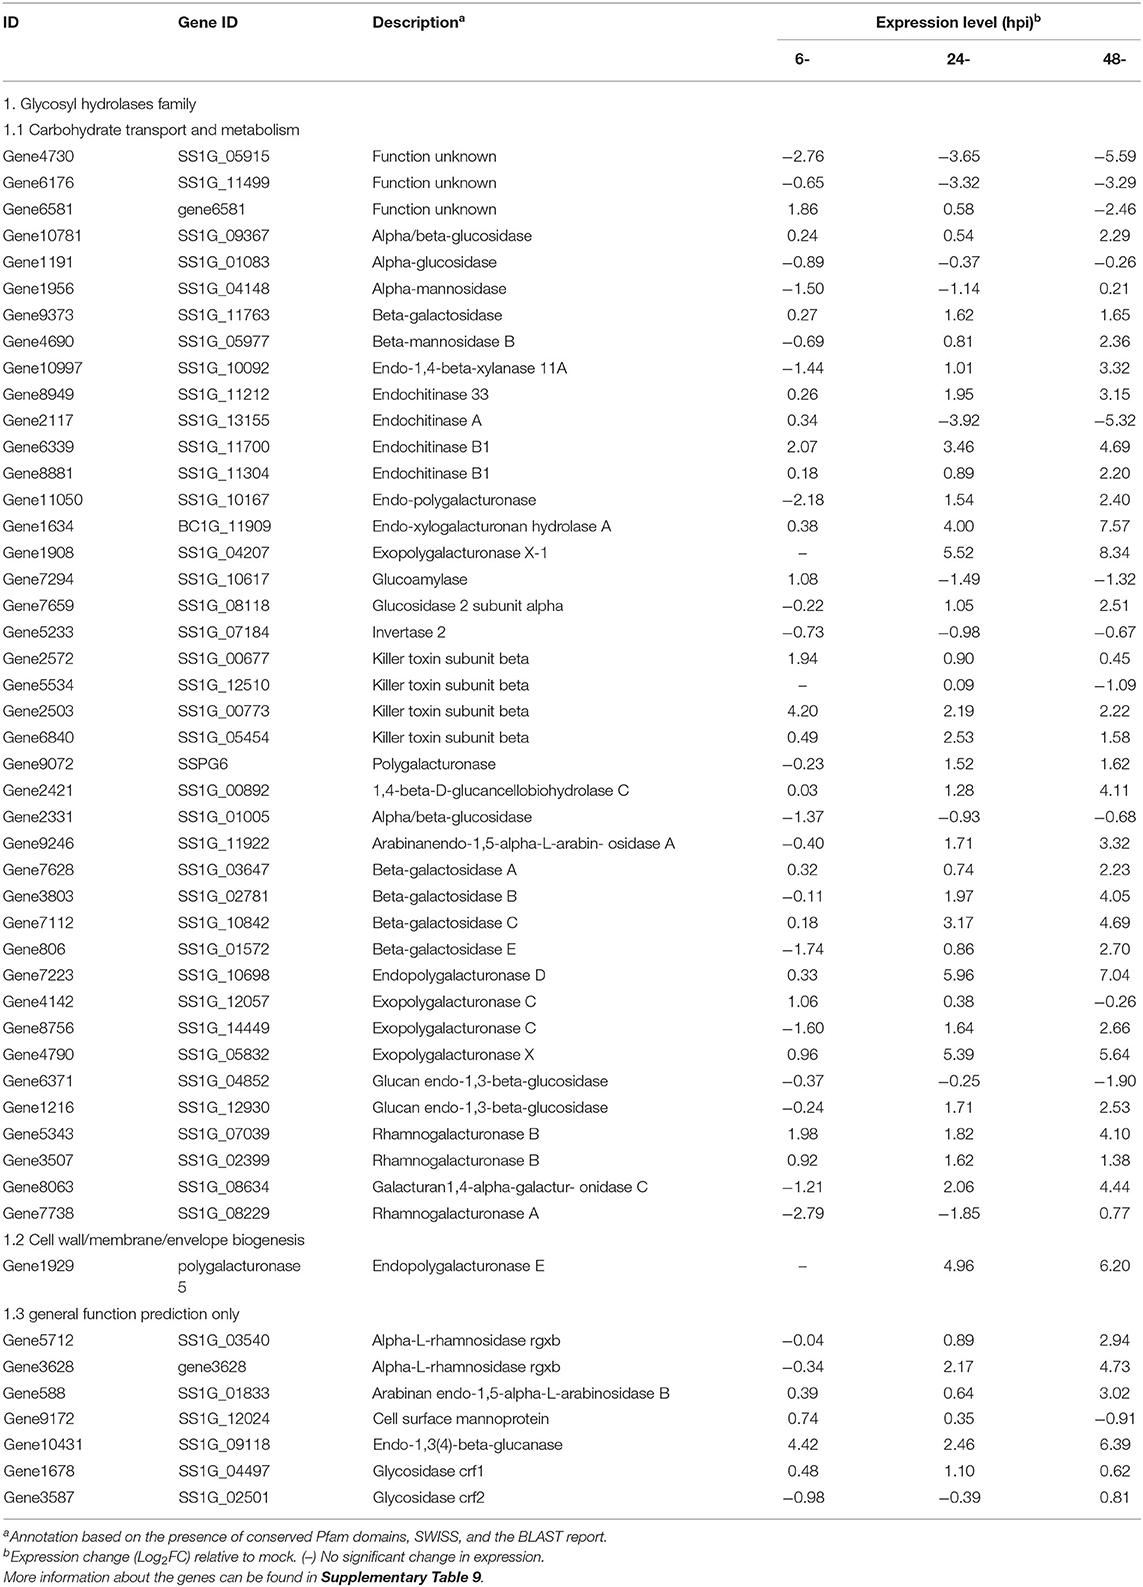
Table 2. Description and expression of genes in S. sclerotiorum involved in CWDEs.
Discussion
When rapeseeds are attacked by S. sclerotiorum, the response involves a range of physiological and biochemical activities. First, rapeseeds form protective barriers, which involve enhanced lignin monomer production, to prevent infection and fungal expansion (Uloth et al., 2016). Then, S. sclerotiorum may be killed by different active antimicrobial products formed by rapeseeds, such as indole glycosides, or by the production of chitinase and β-1, 3-glucanase, which degrade the cell walls of S. sclerotiorum (Stotz et al., 2011; Zhang et al., 2015). Third, enzymes or chemicals are formed to inhibit the virulence factors of S. sclerotiorum, such as PGIP, which is produced by rapeseeds to inhibit the plant cell wall-degrading enzyme PG secreted by S. sclerotiorum (De Lorenzo and Ferrari, 2002). Additionally, it is necessary for S. sclerotiorum to evolve mechanisms that encourage infection. Usually, pathogenic factors, like OA, are secreted to affect signal transduction in host cells (Kabbage et al., 2015). Sclerotinia sclerotiorum promotes cell death by inducing SA synthesis in the host, and numerous effectors secreted by S. sclerotiorum participate in host-pathogen interactions (Amselem et al., 2011; Derbyshire et al., 2017).
Phytohormones and Their Signaling Pathways Play Different Roles in B. napus Defense Responses
The role of plant hormones in plant defenses against pathogens, especially JA, SA, and ET, has been well studied (Bari and Jones, 2009). In this research, the contents of five hormones were detected, and the changing trends of IAA and ABA in infected and uninfected leaves were similar (Figures 5A,C), indicating that the two hormones were not directly involved in B. napus–S. sclerotiorum interactions. An important plant growth and development regulator, GA3, belongs to the gibberellins family and is known to stimulate diverse aspects of developmental processes (Hedden and Phillips, 2000; Yamaguchi, 2008; Sun, 2011). Previously, the role of GA in the signaling involved in defense responses received little attention. However, GA signaling components, especially the negative regulator DELLA, play major roles in plant disease resistance and susceptibility by modulating JA- and SA-dependent responses (Achard et al., 2006, 2008; Navarro et al., 2008). Here, the GA3 content change trends in infected and uninfected leaves were completely contrary. The GA3 content decreased continuously in uninfected leaves, whereas the content in infected leaves increased rapidly after the formation of disease spots, indicating that the GA3 content was directly induced by S. sclerotiorum. The GA3 content in infected areas increased without changes in the expression levels of GA-signaling components from 0 to 24 hpi, compared with the decreased content in uninfected areas (Figure 5B). These results suggest that, after a pathogen attack, plants increase the GA3 content in the infected area by transporting it from nearby areas rather than through early-stage biosynthesis.
The JA contents were lower in uninfected leaves, but the trend was consistent with previous reports (Pieterse et al., 2012; Wu et al., 2016). The transcriptomic data and qPCR results led us to speculate that the interactions between rapeseeds and S. sclerotiorum are complex. In this research, even though leaf necrosis was not shown, the gene encoding LOX2, which is a key enzyme in JA synthesis, was expressed at 6 hpi (Figures 1C, 4). Then, the upregulated expression levels of JAR1, COI1, and MYC2 indicated that the JA-signaling pathway was activated at 6 hpi (Figure 3C). At the early stages of S. sclerotiorum infection, rapeseeds may induce a downstream defense response by synthesizing JA; consequently, numerous JA synthesis-related proteins should be expressed, and downstream signal transmission should be induced. However, although JA content dramatically increased at 24 hpi and 48 hpi, the symptoms in rapeseed leaves were more severe (Figures 1, 5D). At these times, LOX2 and AOS expression levels were still increased, but the JAR1, COI1, and MYC2 expression levels were decreased (Figures 3C, 4). The expression of the JAZ protein family increased, resulting in the inhibition of MYC2 transcription factor activity, which was consistent with the findings of Wu et al. (2016). As the key protein of the JA-signaling pathway, JAZ degradation controls the activation of downstream genes (Chini et al., 2007). Bacteria and fungi secrete effectors or enzymes that prevent JAZ degradation in their host plants (Gimenez-Ibanez et al., 2014; Plett et al., 2014; Patkar et al., 2015; Dallery et al., 2020). Thus, the effectors from S. sclerotiorum may stabilize the JAZ proteins in rapeseeds. Although the JA content in the inoculated area was significantly increased at 24 and 48 hpi, the JA-responsive genes were repressed and failed in pathogen defense (Figures 1D, 5D). This study revealed that S. sclerotiorum failed to prevent JA synthesis in rapeseeds but successfully inhibited the JA-signaling pathway through unknown secreted proteins, resulting in the failure of related defense responses in rapeseeds. Future investigations will identify the related secreted proteins and their mechanisms.
Ethylene plays a positive role in the SSR resistance in B. napus (Yang et al., 2010; Wu et al., 2016). The ET content was not measured in this study, but the upregulated expression levels of EIN3 and ERF1/2 after 24 hpi indicated that the ET-signaling pathway was activated, which suggests that this pathway functions more in late-stage pathogen defenses (Figures 3A, 4).
Salicylic acid and its signaling pathway trigger resistance against biotrophic and hemibiotrophic pathogens (Glazebrook, 2005). Although the pathogen S. sclerotiorum is a necrotrophic pathogen, some reports indicate that SA positively regulates S. sclerotiorum resistance (Novákov et al., 2014; Ding et al., 2020). Here, the SA contents in infected leaves dramatically increased after 24 hpi, with SA signaling-related genes having upregulated expression levels, especially the defense-related PR1 genes (Zhang et al., 1999; Figures 3B, 5E). The qRT-PCR analyses of the expression levels of genes such as ICS1, MPK4, and EDS5 at different stages after S. sclerotiorum inoculation into rapeseed leaves confirmed that the SA synthesis in rapeseeds did involve the branch acid pathways. The BnICS1 expression level was regulated by plant hormone networks and participated in the activating of the SA-signaling pathway at the early infection stages (Peng et al., 2016). These results suggested that the SA pathway aids the response of rapeseeds to the infection by S. sclerotiorum at late stages.
The Battle of Cell Walls Both in B. napus and S. sclerotiorum
Once the fungus is established, a transition to necrotrophy occurs and host cell death pathways are subverted, inducing apoptotic cell death. This fungal-induced cell death provides nutrients that exclusively benefit the fungus. In pathogenic fungi, the cell wall plays a critical role during host invasion because it is the first structure to physically contact plant cells. It is then recognized by several plant components through microbe-associated molecular patterns to activate host immune responses (Latgé and Beauvais, 2014). During the invasion process, S. sclerotiorum secretes cell wall-degrading enzymes (CWDEs) to degrade the cell walls of the hosts, resulting in the death of plants cells. Meanwhile, the rapeseed continuously secretes hydrolytic enzymes, such as chitinases and glucanases, to degrade the cell walls of S. sclerotiorum (Stotz et al., 2011; Zhang et al., 2015). RNA-seq analysis of a global study on S. sclerotiorum gene expression, especially the genes encoding hydrolytic enzymes, transporters, and effectors as it infects B. napus from 0 to 48 hpi (Seifbarghi et al., 2017), found that many genes involved in polysaccharide degradation show high expression levels at 24 and 48 hpi, including SSPG1 (SS1G_10167), SSPG3 (SS1G_10698), and exoPG1 (SS1G_04207). In our study, most genes encoding CWDEs in S. sclerotiorum were upregulated after 24 hpi and accompanied the appearance of leaf necrosis (Figures 1D, 7), which was consistent with the results of Seifbarghi et al. (2017). In our research, however, the expression level of SSPG1 was downregulated at 6 hpi, which might be an effect of the partial resistance of rapeseed plants. Consequently, it is hypothesized that, during early-stage infections, S. sclerotiorum induces SA synthesis in rapeseeds to promote infection, and after the S. sclerotiorum infection is successful, numerous CWDEs are synthesized to ingest nutrients (Bashi et al., 2012).
In summary, the process of reciprocal evolution occurs as rapeseeds interact with S. sclerotiorum. Although rapeseeds have developed a complex defense system or acquired disease-resistance genes against diverse pathogens, it is difficult to avoid S. sclerotiorum infections, which can interfere with hormone synthesis and signaling pathways. Thus, analyzing the molecular mechanisms of the hormone-regulated metabolic networks involved in B. napus–S. sclerotiorum interactions and excavating related protein-protein interactions will aid in breeding B. napus. These results lay a foundation and provide new insights for further research.
Data Availability Statement
The original contributions presented in the study are publicly available. This data can be found here: National Center for Biotechnology Information (NCBI) BioProject database under accession number PRJNA735329.
Author Contributions
QP conceived and designed the experiments and amended the manuscript. JZ provided the rapeseed cultivars RS-1 and Ss1980, cultivated the plant samples, and inoculated the pathogens. SC and MH contributed to RNA extraction and qRT-PCR. BX and XG contributed to the measurement of hormones and data analysis and wrote the manuscript. All authors contributed to the article and approved the submitted version.
Funding
This study was supported by the National Natural Science Foundation of China (No. 31771834), Natural Science Foundation of Jiangsu Province (No. BK20191237), and China Agriculture Research System of MOF and MARA (CARS-12).
Conflict of Interest
The authors declare that the research was conducted in the absence of any commercial or financial relationships that could be construed as a potential conflict of interest.
The reviewer X-LT declared a shared affiliation, with no collaboration, with one of the authors QP to the handling editor at the time of the review.
Publisher's Note
All claims expressed in this article are solely those of the authors and do not necessarily represent those of their affiliated organizations, or those of the publisher, the editors and the reviewers. Any product that may be evaluated in this article, or claim that may be made by its manufacturer, is not guaranteed or endorsed by the publisher.
Acknowledgments
We thank International Science Editing (http://www.internationalscienceediting.com) for editing this manuscript.
Supplementary Material
The Supplementary Material for this article can be found online at: https://www.frontiersin.org/articles/10.3389/fpls.2021.716935/full#supplementary-material
References
Achard, P., Cheng, H., De Grauwe, L., Decat, J., Schoutteten, H., Moritz, T., et al. (2006). Integration of plant responses to environmentally activated phytohormonal signals. Science 311, 91–94. doi: 10.1126/science.1118642
Achard, P., Renou, J. P., Berthome, R., Harberd, N. P., and Genschik, P. (2008). Plant DELLAs restrain growth and promote survival of adversity by reducing the levels of reactive oxygen species. Curr Biol. 18, 656–660. doi: 10.1016/j.cub.2008.04.034
Amselem, J., Cuomo, C. A., van Kan, J. A. L., Viaud, M., Benito, E. P., Couloux, A., et al. (2011). Genomic analysis of the necrotrophic fungal pathogens Sclerotinia sclerotiorum and Botrytis cinerea. PLoS Genet. 7:e1002230. doi: 10.1371/journal.pgen.1002230
Apweiler, R., Bairoch, A., Wu, C. H., Barker, W. C., Boeckmann, B., Ferro, S., et al. (2004). UniProt: the Universal Protein knowledgebase. Nucleic Acids Res. 32, D115–D119. doi: 10.1093/nar/gkh131
Baker, B., Zambryski, P., Staskawicz, B., and Dinesh-Kumar, S. P. (1997). Signaling in plant–microbe interactions. Science 276, 726–733. doi: 10.1126/science.276.5313.726
Balcke, G. U., Handrick, V., Bergau, N., Fichtner, M., Henning, A., Stellmach, H., et al. (2012). An UPLC-MS/MS method for highly sensitive high-throughput analysis of phytohormones in plant tissues. Plant Methods. 8:47. doi: 10.1186/1746-4811-8-47
Bari, R., and Jones, J. D. (2009). Role of plant hormones in plant defence responses. Plant Mol Biol. 69, 473–488. doi: 10.1007/s11103-008-9435-0
Bashi, Z. D., Rimmer, S. R., Khachatourians, G. G., and Hegedus, D. D. (2012). Factors governing the regulation of Sclerotinia sclerotiorum cutinase A and polygalacturonase 1 during different stages of infection. Can. J. Microbiol. 58, 605–616. doi: 10.1139/w2012-031
Boland, G. J., and Hall, R. (1994). Index of plant hosts of Sclerotinia sclerotiorum. Can. J. Plant Pathol. 16, 93–108. doi: 10.1080/07060669409500766
Bolton, M. D., Thomma, B. P., and Nelson, B. D. (2006). Sclerotinia sclerotiorum (Lib.) de Bary: biology and molecular traits of a cosmopolitan pathogen. Mol. Plant Pathol. 7, 1–16. doi: 10.1111/j.1364-3703.2005.00316.x
Brown, J., Pirrung, M., and McCue, L. A. (2017). FQC Dashboard: integrates FastQC results into a web-based, interactive, and extensible FASTQ quality control tool. Bioinformatics 33, 3137–3139. doi: 10.1093/bioinformatics/btx373
Chen, C. J., Chen, H., Zhang, Y., Thomas, H. R., Frank, M. H., He, Y. H., et al. (2020). TBtools: an integrative toolkit developed for interactive analyses of big biological data. Mol. Plant 13, 1194–1202. doi: 10.1016/j.molp.2020.06.009
Chini, A., Fonseca, S., Fernandez, G., Adie, B., Chico, J. M., Lorenzo, O., et al. (2007). The JAZ family of repressors is the missing link in jasmonate signalling. Nature 448, 666–671. doi: 10.1038/nature06006
Chittem, K., Yajima, W. R., Goswami, R. S., and del Río Mendoza, L. E. (2020). Transcriptome analysis of the plant pathogen Sclerotinia sclerotiorum interaction with resistant and susceptible canola (Brassica napus) lines. PLoS ONE 15:e0229844. doi: 10.1371/journal.pone.0229844
Conesa, A., Götz, S., García-Gómez, J. M., Terol, J., Talón, M., and Robles, M. (2005). Blast2GO: a universal tool for annotation, visualization and analysis in functional genomics research. Bioinformatics. 21:3674–3676. doi: 10.1093/bioinformatics/bti610
Dallery, J. F., Zimmer, M., Halder, V., Suliman, M., Pign,é, S., Le Goff, G., et al. (2020). Inhibition of jasmonate-mediated plant defences by the fungal metabolite higginsianin B. J Exp Bot. 71, 2910–2921. doi: 10.1093/jxb/eraa061
De Lorenzo, G., and Ferrari, S. (2002). Polygalacturonase-inhibiting proteins in defense against phytopathogenic fungi. Curr. Opin. Plant Biol. 5, 295–299. doi: 10.1016/S1369-5266(02)00271-6
Derbyshire, M., Denton-Giles, M., Hegedus, D., Seifbarghy, S., Rollins, J., van Kanet, J., et al. (2017). The complete genome sequence of the phytopathogenic fungus Sclerotinia sclerotiorum reveals insights into the genome architecture of broad host range pathogens. Genome Biol. Evol. 9, 593–618. doi: 10.1093/gbe/evx030
Ding, Y. J., Mei, J. Q., Chai, Y., Yang, W. J., Mao, Y., Yan, B. Q., et al. (2020). Sclerotinia sclerotiorum utilizes host-derived copper for ROS detoxification and infection. PLoS Pathog. 16:e1008919. doi: 10.1371/journal.ppat.1008919
Eulgem, T., and Somssich, I. E. (2007). Networks of WRKY transcription factors in defense signaling. Curr Opin Plant Biol. 10, 366–371. doi: 10.1016/j.pbi.2007.04.020
Finn, R. D., Bateman, A., Clements, J., Coggill, P., Eberhardt, R. Y., Eddy, S. R., et al. (2014). Pfam: the protein families database. Nucleic Acids Res. 42, D222–D230. doi: 10.1093/nar/gkt1223
Gimenez-Ibanez, S., Boter, M., Fernández-Barbero, G., Chini, A., Rathjen, J. P., and Solano, R. (2014). The bacterial effector HopX1 targets JAZ transcriptional repressors to activate jasmonate signaling and promote infection in Arabidopsis. PLoS Biol. 12:e1001792. doi: 10.1371/journal.pbio.1001792
Glazebrook, J. (2005). Contrasting mechanisms of defense against biotrophic and necrotrophic pathogens. Ann. Rev. Phytopathol. 43, 205–227. doi: 10.1146/annurev.phyto.43.040204.135923
Grant, M., and Lamb, C. (2006). Systemic immunity. Curr Opin Plant Biol. 9, 414–420. doi: 10.1016/j.pbi.2006.05.013
Hedden, P., and Phillips, A. L. (2000). Gibberellin metabolism: new insights revealed by the genes. Trends Plant Sci. 5, 523–530. doi: 10.1016/S1360-1385(00)01790-8
Jones, J. D. G., and Dangl, J. L. (2006). The plant immune system. Nature 444, 323–329. doi: 10.1038/nature05286
Jones, P., Binns, D., Chang, H. Y., Fraser, M., Li, W., McAnulla, C., et al. (2014). InterProScan 5: genome-scale protein function classification. Bioinformatics 30, 1236–1240. doi: 10.1093/bioinformatics/btu031
Kabbage, M., Yarden, O., and Dickman, M. B. (2015). Pathogenic attributes of Sclerotinia sclerotiorum: switching from a biotrophic to necrotrophic lifestyle. Plant Sci. 233, 53–60. doi: 10.1016/j.plantsci.2014.12.018
Kim, D., Pertea, G., Trapnell, C., Pimentel, H., Kelley, R., and Salzberg, S. L. (2013). TopHat2: accurate alignment of transcriptomes in the presence of insertions, deletions and gene fusions. Genome Biol. 14:R36. doi: 10.1186/gb-2013-14-4-r36
Latgé, J. P., and Beauvais, A. (2014). Functional duality of the cell wall. Curr. Opin. Microbio. 20, 111-117. doi: 10.1016/j.mib.2014.05.009
Mortazavi, A., Williams, B., McCue, K., Schaeffer, L., and Wold, B. (2008). Mapping and quantifying mammalian transcriptomes by RNA-Seq. Nat. Meth. 5, 621–628. doi: 10.1038/nmeth.1226
Navarro, L., Bari, R., Achard, P., Lison, P., Nemri, A., Harberd, N. P., et al. (2008). DELLAs control plant immune responses by modulating the balance of jasmonic acid and salicylic acid signaling. Curr. Biol. 18, 650–655. doi: 10.1016/j.cub.2008.03.060
Novákov,á, M., Sašek, V., Dobrev, P. I., Valentov,á, O., and Burketov,á, L. (2014). Plant hormones in defense response of Brassica napus to Sclerotinia sclerotiorum-reassessing the role of salicylic acid in the interaction with a necrotroph. Plant Physiol. Biochem. 80, 308–317. doi: 10.1016/j.plaphy.2014.04.019
Patkar, R. N., Benke, P. I., Qu, Z., Chen, Y. Y., Yang, F., Swarup, S., et al. (2015). A fungal monooxygenase-derived jasmonate attenuates host innate immunity. Nat. Chem. Biol. 11, 733–740. doi: 10.1038/nchembio.1885
Peng, Q., Gao, J. Q., Zhou, X. Y., Zhang, J. F., Pu, C. K., Chen, H. M., et al. (2016). BnICS1 induced expression and related signaling pathway from Brassica napus. Chin. J. Oil Crop Sci. 38, 7–12. doi: 10.7505/j.issn.1007-9084.2016.01.02
Perlin, M. H., Andrews, J., and Toh, S. S. (2014). Essential letters in the fungal alphabet: ABC and MFS transporters and their roles in survival and pathogenicity. Adv Genet. 85, 201–253. doi: 10.1016/B978-0-12-800271-1.00004-4
Pieterse, C. M., Van der Does, D., Zamioudis, C., Leon-Reyes, A., and Van Weeset, S. C. M. (2012). Hormonal modulation of plant immunity. Ann. Rev. Cell Dev Bi. 28, 489–521. doi: 10.1146/annurev-cellbio-092910-154055
Plett, J. M., Daguerre, Y., Wittulsky, S., Vayssières, A., Deveau, A., Melton, S. J., et al. (2014). Effector MiSSP7 of the mutualistic fungus Laccaria bicolor stabilizes the Populus JAZ6 protein and represses jasmonic acid (JA) responsive genes. Proc. Natl. Acad. Sci. U.S.A. 111, 8299–8304. doi: 10.1073/pnas.1322671111
Robert-Seilaniantz, A., Grant, M., and Jones, J. D. G. (2011). Hormone crosstalk in plant disease and defense: more than just jasmonate–salicylate antagonism. Annu. Rev. Phytopathol. 49, 317–343. doi: 10.1146/annurev-phyto-073009-114447
Seifbarghi, S., Borhan, M. H., Wei, Y., Coutu, C., Robinson, S. J., and Hegedus, D. D. (2017). Changes in the Sclerotinia sclerotiorum transcriptome during infection of Brassica napus. BMC Genom. 18:266. doi: 10.1186/s12864-017-3642-5
Staskawicz, B. J., Ausubel, F. M., Baker, B. J., Ellis, J. G., and Jones, J. D. G. (1995). Molecular genetics of plant disease resistance. Science 268, 661–667. doi: 10.1126/science.7732374
Stotz, H. U., Sawada, Y., Shimada, Y., Hirai, M. Y., Sasaki, E., Krischke, M., et al. (2011). Role of camalexin, indole glucosinolates, and side chain modification of glucosinolate-derived isothiocyanates in defense of Arabidopsis against Sclerotinia sclerotiorum. Plant J. 67, 81–93. doi: 10.1111/j.1365-313X.2011.04578.x
Sun, T. P. (2011). The molecular mechanism and evolution of the GA-GID1-DELLA signaling module in plants. Curr Biol. 21, R338-345. doi: 10.1016/j.cub.2011.02.036
Trapnell, C., Roberts, A., Goff, L., Pertea, G., Kim, D., Kelley, D. R., et al. (2012). Differential gene and transcript expression analysis of RNA-seq experiments with TopHat and Cufflinks. Nat. Protoc. 7, 562–578. doi: 10.1038/nprot.2012.016
Uloth, M. B., Clode, P. L., You, M. P., and Barbetti, M. J. (2016). Attack modes and defence reactions in pathosystems involving Sclerotinia sclerotiorum, Brassica carinata, B. juncea and B. napus. Ann. Bot. 117, 79–95. doi: 10.1093/aob/mcv150
Wang, L. K., Feng, Z. X., Wang, X., Wang, X. W., and Zhang, X. G. (2010). DEGseq: An R package for identifying differentially expressed genes from RNA-seq data. Bioinformatics 26, 136–138. doi: 10.1093/bioinformatics/btp612
Wu, J., Zhao, Q., Yang, Q., Liu, H., Li, Q., Yi, X., et al. (2016). Comparative transcriptomic analysis uncovers the complex genetic network for resistance to Sclerotinia sclerotiorum in Brassica napus. Sci Rep. 6:19007. doi: 10.1038/srep19007
Xie, C., Mao, X. Z., Huang, J. J., Ding, Y., Wu, J. M., Dong, S., et al. (2011). KOBAS 2.0: a web server for annotation and identification of enriched pathways and diseases. Nucl. Acids Res. 39, W316–W322. doi: 10.1093/nar/gkr483
Xu, L., Li, G., Jiang, D., and Chen, W. (2018). Sclerotinia sclerotiorum: An evaluation of virulence theories. Ann. Rev. Phytopathol. 56, 311–338. doi: 10.1146/annurev-phyto-080417-050052
Yamaguchi, S. (2008). Gibberellin metabolism and its regulation. Ann. Rev. Plant Biol. 59, 225–251. doi: 10.1146/annurev.arplant.59.032607.092804
Yang, B., Rahman, M. H., Liang, Y., Shah, S., and Kav, N. V. N. (2010). Characterization of Defense Signaling Pathways of Brassica napus and Brassica carinata in Response to Sclerotinia sclerotiorum Challenge. Plant Mol. Biol. Rep. 28, 253–263. doi: 10.1007/s11105-009-0149-5
Zhang, J. F., Fu, S. Z., Qi, C. K., Pu, H. M., Chen, Y. Q., Gu, B. C., et al. (2002). Breeding and utilization of Ning RS-1 resistance to sclerotinia stem rot in rapeseed (B. napus L.). Chin. J. Oil Crop Sci. 24, 6–9. doi: 10.1006/jfls.2001.0409
Zhang, Y., Fan, W., Kinkema, M., Li, X., and Dong, X. (1999). Interaction of NPR1 with basic leucine zipper protein transcription factors that bind sequences required for salicylic acid induction of the PR-1 gene. Proc. Natl. Acad. Sci. U.S.A. 96, 6523–6528. doi: 10.1073/pnas.96.11.6523
Zhang, Y. Y., Huai, D. X., Yang, Q. Y., Cheng, Y., Ma, M., Kliebenstein, D. J., et al. (2015). Overexpression of three glucosinolate biosynthesis genes in Brassica napus identifies enhanced resistance to Sclerotinia sclerotiorum and Botrytis cinerea. PLoS ONE. 10:e0140491. doi: 10.1371/journal.pone.0140491
Keywords: Sclerotinia sclerotiorum, Brassica napus, interaction, transcriptome analysis, plant hormones, cell wall enzymes
Citation: Xu B, Gong X, Chen S, Hu M, Zhang J and Peng Q (2021) Transcriptome Analysis Reveals the Complex Molecular Mechanisms of Brassica napus–Sclerotinia sclerotiorum Interactions. Front. Plant Sci. 12:716935. doi: 10.3389/fpls.2021.716935
Received: 29 May 2021; Accepted: 06 September 2021;
Published: 08 October 2021.
Edited by:
Chunyu Zhang, Huazhong Agricultural University, ChinaReviewed by:
Pilar Soengas, Misión Biológica de Galicia, Consejo Superior de Investigaciones Científicas (CSIC), SpainXiao-Li Tan, Jiangsu University, China
Copyright © 2021 Xu, Gong, Chen, Hu, Zhang and Peng. This is an open-access article distributed under the terms of the Creative Commons Attribution License (CC BY). The use, distribution or reproduction in other forums is permitted, provided the original author(s) and the copyright owner(s) are credited and that the original publication in this journal is cited, in accordance with accepted academic practice. No use, distribution or reproduction is permitted which does not comply with these terms.
*Correspondence: Qi Peng, cGVuZ3FpMTk4MUBqYWFzLmFjLmNu
†These authors have contributed equally to this work