 Zhenhua Cui
 Nannan Wang1†
 Shaoling Zhang
- 1Department of Horticulture, Qingdao Agricultural University, Qingdao, China
- 2Sanying Precision Instruments Co., Ltd., Tianjin, China
- 3Department of Horticulture, State Key Laboratory of Crop Genetics and Germplasm Enhancement, Nanjing Agricultural University, Nanjing, China
Cork spot is one of the most damaging physiological disorders in pear fruit, causing considerable economic loss every year. However, the mechanism of cork spot occurrence requires further examination. In this study, X-ray CT scanning was applied to analyze the microstructure of pear fruit “Akizuki” (Pyrus pyrifolia), a cultivar susceptible to cork spot disorder, to elucidate the fruit texture alteration between healthy and cork spotted fruit. Results showed that cork spotted fruit had much higher porosity (9.37%) than healthy fruit (3.52%). Reconstructed three-dimensional (3D) network skeleton models showed highly branched pore channels in cork spotted fruit and a low degree of pore connectivity in healthy fruit. Even in areas of disordered fruit without cork spot, the pore throat diameter, pore length, and coordinated core number (i.e., 77, 160, and 16, respectively) were much higher than that of healthy fruit. The structure analysis of fruit core showed that core deformation only occurred in cork spotted fruit. A much more highly branched network was observed in cork spotted fruit cores compared with healthy fruit cores. High-resolution observation of flesh tissue directly demonstrated that pore size in cork spotted fruit (87 μm) was four times larger than that of healthy fruit (22 μm). Altered expression of genes related to Ca2+ transport and the uneven distribution of intracellular Ca2+ were also shown to associate with the development of cork spot disorder. Our results suggest that flesh tissue damage likely occurred prior to the initiation of cork spot. The dysfunction of long-distance and transmembrane Ca2+ transport channels could be responsible for the imbalanced distribution of Ca2+ inside the fruit, thus resulting in the development of cork spot.
Introduction
“Akizuki” (Pyrus pyrifolia), a late-maturing pear cultivar with russet skin, was bred in Japan in 1988. “Akizuki” has a large fruit size, attractive fruit shape, and delicate flesh with high sugar content, and it is an important economic crop in China. However, “Akizuki” is susceptible to cork spot disorder, one of the major physiological disorders in pear. This disorder has threatened the Chinese pear industry since 2000 (Hayama et al., 2017; Duan et al., 2019). Cork spot is a preharvest disorder, initiated at 60–80 days after full bloom (DAFB), and develops until fruit harvest, depending on cultivar specificity (Cui et al., 2020). Fruit with cork spots has brownish flesh or grayish corky lesions beneath the fruit skin, and the flesh develops a bitter taste. In some cultivars, disordered fruit has a bumpy fruit surface, such as in “Chili” (Pyrus bretschneideri) (Cui et al., 2020). Higher lignin content and necrotic tissues are typically observed in cork spotted areas of flesh, which is believed to be caused by mineral nutrient imbalances (Facteau et al., 2010), such as in Ca, Mg, B, and K. Ca deficiency in the fruit was originally considered as the major reason for the development of cork spot (Mason and Welsh, 1970; Woodbridge, 1971), and Ca2+ spray on fruit before the harvest was believed to reduce the incidence of cork spot (Raese and Drake, 1993, 2006; Raese et al., 1995; Sharma et al., 2013). However, in our recent studies, we found higher Ca content in cork spotted tissues compared with healthy tissues, and free Ca2+ was enriched in the cell wall, while less Ca2+ was distributed in the cytoplasm in disordered fruit (Duan et al., 2019; Cui et al., 2020). Therefore, we proposed that the dysfunction of Ca2+ transmembrane transport and intracellular distribution in the fruit could initiate the development of cork spot disorder in pear fruit (Cui et al., 2020).
Fruit microstructure determines the mechanical and transport properties of tissues (Mebatsion et al., 2009). In pear, the intercellular spaces occupy as much as 5.1% of the total fruit volume, which is the most important pathway for gas diffusion (e.g., O2, CO2, and H2O) in plants (Kader, 2002). Meanwhile, the vascular system is responsible for water and nutrient transport from the plant to the fruit. Therefore, a complete void network and the vascular system are critical for the development of healthy fruit. In our previous research, we found brownish vascular tissues distributed in cork spotted “Chili” fruit, and spotted areas were close to necrotic vascular tissues (Cui et al., 2020), indicating that the change of fruit tissue structure is associated with the occurrence of this physiological disorder. However, traditional histological studies with two-dimensional sections are destructive to the fruit and can only observe on a single plane, which is unable to correctly render critical connectivity information such as small voids between cells, vascular capillaries, or cell walls.
X-ray CT, a three-dimensional (3D) visualization technique, has long been applied to non-destructively acquire the 3D images of the internal structure of agricultural commodities (Schoeman et al., 2016). X-ray CT recognizes internal structures based on differences in X-ray attenuation resulting from 3D variation in the composition of the material. This makes X-ray CT an excellent technique to visualize the porous structure of products on both qualitative and quantitative scales (Herremans et al., 2014a,b; Magwaza and Opara, 2014; Diels et al., 2017). In apple fruit, Janssen et al. (2020) found considerable variations of fruit porosity in different tissues based on the 3D connectivity of pores. Microstructural changes were observed in apple tissues with water core disorder with the help of X-ray scanning (Herremans et al., 2014a). X-ray CT was also used to classify fruit tissue as healthy or browning disordered at a successful rate of 97% (Herremans et al., 2013), as well as being used for the quantitative analysis of the 3D topology of the pore space in apple fruit (Mendoza et al., 2007). In pear, core breakdown disorder was analyzed using X-ray CT over time in storage (Lammertyn et al., 2003). Herremans et al. (2015) characterized 3D tissue anatomy at the level of single cells and intercellular spaces in pear using the X-ray CT analysis, demonstrating significant differences between genotypes in void and cell networks that relate to differences in aeration properties of tissues. X-ray CT was also applied to analyze and detect the mealiness in “Forelle” (Pyrus communis) (Muziri et al., 2016). In addition to the abovementioned studies, X-ray CT was also used to visualize the subsurface microstructure and void network connectivity in other various products, such as mango (Cantre et al., 2014b), pomegranate (Magwaza and Opara, 2014), kiwifruit (Cantre et al., 2014a), and cucumber (Kuroki et al., 2004). However, the application of X-ray CT to analyze the microstructure differences between healthy pear fruit and cork spot disordered pear fruit is very limited. Knowledge of pear fruit microstructure changes in a quantitative and qualitative 3D view is important for a better understanding of the occurrence of cork spot disorder. Recent research (Duan et al., 2020) first attempted to non-destructively distinguish between healthy and cork spot disordered pear “Chili” (P. bretschneideri) and to preliminarily analyze the porous differences between them using X-ray CT. However, more information and investigation on the microstructure changes in cork spotted pear fruit are still needed to explore the mechanism of the development of cork spot disorder. Therefore, the objective of this study was to acquire more details of microstructure changes in cork spot disordered pear fruit “Akizuki” (P. pyrifolia) using the high-resolution X-ray CT analysis. Results of the study are expected to provide useful information for the control of cork spot disorder for orchard managers and will be valuable for further exploration of the mechanism of the development of cork spot disorder.
Materials and Methods
Fifteen-year-old “Akizuki” trees grafted on Pyrus betulaefolia rootstocks were used for this study at the Experimental Station of Qingdao Agricultural University located at 36°19′N and 120°23′E in the Shandong Province, China. The trees were planted with the spacing of 2 m within rows and 5 m between rows. Trees were managed with full nutrition and water. The fruit was harvested at 140 DAFB for the experiment, which is considered a maturity time point.
Analysis of Fruit Quality
In total, 10 healthy and 10 cork spotted fruits were used for quality analysis. Fruit attribute parameters such as single fruit weight, vertical length, horizontal length, firmness, soluble solids, and titratable acidity were measured according to the study by Cui et al. (2020). The fruit transverse sections and longitudinal sections were stained with 0.5% safranine solution for 2 min at room temperature and then rinsed with distilled water for 2 min before being photographed by a digital camera (Canon 70D, Japan).
X-Ray CT Scanning
A nanoVoxel-3502E system (Sanying Precision Instruments Co., Ltd., Tianjin) was utilized to scan both intact fruit and flesh pieces. Samples were rotated on the stage at an increment of 0.4° over a total of 360° at room temperature. The rotating stage was 250 mm away from the X-ray source and 700 mm away from the detector. For intact fruit scanning, the fruit was positioned with the calyx-end to the stem-end axis parallel with the scanner axis of rotation. Transverse and longitudinal section slices were generated from the shadow projections using the Feldkamp reconstruction algorithm (Feldkamp et al., 1984). To obtain high-resolution observations, flesh pieces that were 1 cm away from the cork spot area on the equatorial plane were sampled for scanning. The scanning settings for both types of samples are shown in Table 1.

Table 1. Settings of X-ray scanning used in this study.
Image Processing
The 16-bit slice images were obtained and then reconstructed into 3D images using the system-supplied reconstruction software with a filtered back-projection algorithm (Feldkamp et al., 1984) after X-ray scanning. To facilitate segmentation, the global thresholds of the grayscale limit were defined to separate pores (i.e., low X-ray attenuation, resulting in lower grayscale values) and flesh tissues (i.e., higher X-ray attenuation, resulting in higher grayscale values). A threshold of 69.7 and 54.8 for cork spotted fruit and healthy fruit, respectively, was used as a discriminative value for the separation of pores and flesh tissue according to the obvious deep valley in the histogram of gray level frequencies (Duan et al., 2020). The 3D stacks of 8-bit grayscale images were then generated after segmentation. Porosity was defined as the pore volume/area divided by the total volume/area of the analyzed sample. The pore equivalent diameter was the diameter of a sphere of equivalent volume as the irregularly shaped object (Jennings and Parslow, 1988).
Avizo 8.1 software (Thermo Fisher Scientific, China) was applied to skeletonize the network for the analysis of the essential pore network with connectivity information between pores. The skeleton analysis procedure includes the extraction of the filar centerline from the scanning data and segmentation of the distance image mapping. Later, the network model was refined, the connection voxel was retained, and the voxel skeleton was converted into a spatial graphics object. Visual inspection of 3D images was conducted using VoxelStudio Max 3.0 software (Volume Graphic, GmbH, Heidelberg, Germany).
Measurement of Gene Expression
Three time points of the fruit were sampled as follows: 87 DAFB (initiation stage of cork spot), 107 DAFB (early stage of the development of cork spot), and 127 DAFB (full development stage of cork spot). Cork spot disorder initiates much earlier inside the fruit than the symptoms show on the surface. According to our field experience, the fruit flesh turning to light green from white is a signal of cork spot initiation. This usually happens around 87 DAFB, and the spotted tissue continues to develop and turns brownish and lignified later. Therefore, to correctly distinguish and sample the healthy and cork spotted fruit at 87 and 107 DAFB, we need to cut the fruit first and select the fruit with greenish or brownish tissues as cork spotted fruit; otherwise, we think they are healthy. Five healthy fruits and five cork spotted fruits were sampled as biological replications, and each fruit was repeated three times.
The quantitative real-time PCR (qRT-PCR) was applied to measure the expression levels of related genes. Total RNA of the fruit was extracted using the RNAprep Pure Plant Kit (polysaccharides and polyphenolics-rich) (Tiangen, China) according to the instructions of the manufacturer. RNA quality was evaluated by both optical density (OD) value (1.9–2.1) at 260/280 nm (NanoDrop 2000C, Thermo Scientific) and electrophoresis in a 1.5% agarose gel with sharp, clear 28S and 18S rRNA bands stained by ethidium bromide according to the study by Cui et al. (2017). cDNA was synthesized using reagent kits (RR047A, Takara, Japan) according to the instructions of the manufacturer. All cDNA was diluted five times before the qPCR analysis. The qPCR was carried out using reagent kits (RR820A, Takara, Japan) in a 15-μl reaction volume according to the instructions of the manufacturer on a LightCycler 480 instrument (Roche, Switzerland). All genes selected for analysis and their specific primers are displayed in Supplementary Table 1. Two controls of no-reverse transcriptase and no-template were included. The transcript levels of each gene were normalized according to the reference gene, using the 2−ΔΔCT method (Livak and Schmitten, 2001).
Ca2+ Localization
Free Ca2+ distribution was analyzed using Fluo-4 AM as a fluorescent Ca2+ indicator according to the study by Cui et al. (2020). Fruit at 127 DAFB with the full development of cork spot was sliced at specific areas with a razor blade and then incubated in 4-(2-hydroxyethyl)piperazine-1-ethanesulfonic acid (HEPES) buffer (pH = 7.2) at room temperature for 1 h. The sections were incubated in a mixture (1:1) of 10 μmol/L Fluo-4 AM and 25% Pluronic F-127 for 1 h at 37°C in the dark, followed by rinsing with HEPES buffer for 2 min. A laser scanning confocal microscope (Leica TGS SP5, Germany) equipped with an Optiphot microscope (Nikon, Japan) was used to capture the fluorescence signals at an excitation wavelength of 488 nm stimulated by argon ions. An emission wavelength of 516 nm was captured at a scanning speed of 400 Hz. At least 10 samples of each treatment were used for the observation of free Ca2+ distribution.
Statistical Analysis
The SPSS 17.0 software (IBM-SPSS, Armonk, NY, United States) was used for the statistical analysis of the morphometric measurements. Arcsine transformations were conducted on the data, which are expressed as percentages.
Results
Fruit Quality Comparison
At maturity, the single fruit weight of cork spotted fruit (521 g) was significantly greater than that of healthy fruit (471 g) (Table 2). There was no significant difference in fruit vertical length between healthy and cork spotted fruit, while cork spotted fruit had a greater horizontal length (105 mm) than healthy fruit (92 mm). A similar level of fruit firmness was found between healthy and cork spotted fruit. For both soluble solids content and titratable acidity, there were no significant differences between cork spotted and healthy fruit (Table 2).
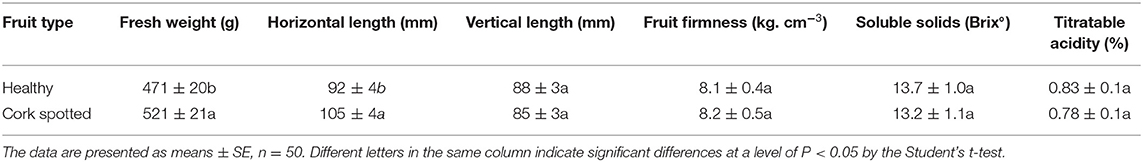
Table 2. Comparison of fruit quality between healthy and cork spotted “Akizuki” fruit.
Fruit Appearance Observation
At harvest time, all fruit had a similar appearance, and it was difficult to discriminate between healthy (Figure 1A) and cork spotted fruit (Figure 1D) through visual inspection with the naked eye. From both the gray and yellow 3D images reconstructed from X-ray scanning, the healthy fruit had a smooth surface (Figures 1B,C). However, both the gray and yellow 3D images of the cork spotted fruit showed clearly collapsed pitting on the surface (Figures 1E,F), which was not obvious through normal visual inspection. This indicated that X-ray scanning could discriminate between healthy and cork spotted fruit surfaces at a more accurate level.
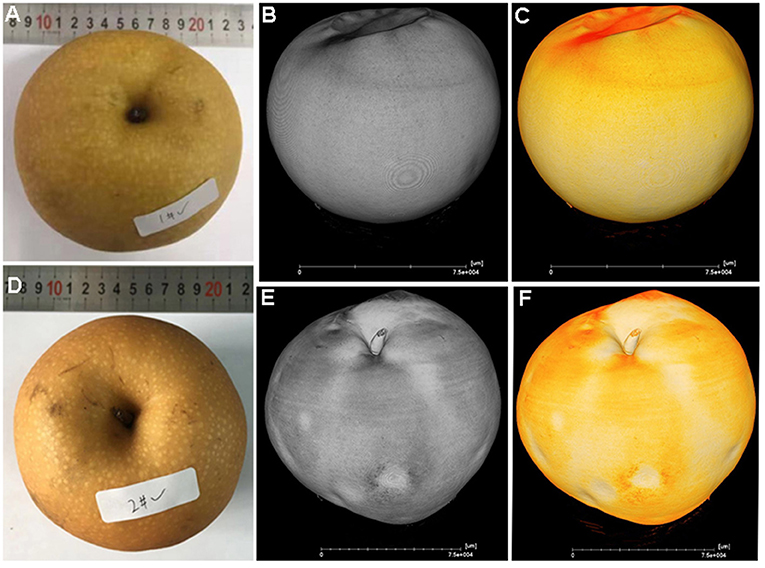
Figure 1. Comparison of the appearance of healthy and cork spotted “Akizuki” fruit at harvesttime. (A) Healthy fruit. (B,C) Gray and yellow rendering of healthy fruit with X-ray scanning, respectively. (D) Cork spotted fruit. (E,F) Gray and yellow rendering of cork spotted fruit with X-ray scanning, respectively.
Fruit Cork Spot Distribution Analysis
From experience in the field over consecutive years, the severity of cork spot disorder varies from year to year depending on the climate and tree growth conditions. In cork spotted fruit, necrotic, and desiccated flesh tissue is distributed close to the fruit skin on the equatorial plane (Figure 2C), while the core and the areas surrounding the core showed a rare distribution of cork spot (Figures 2C,D). The observation on the longitudinal section showed that cork spot distribution is more prone on the calyx-end of the fruit (Figure 2D). Red dots stained by safranine indicate cellulose, which was more present in cork spotted fruit (Figures 2C,D) than in healthy fruit (Figures 2A,B). The segments of both the equatorial plane and the longitudinal section from X-ray scanning were extracted for cork spot distribution analysis (Figures 2E–H). The dark background on the grayscale images was recognized as pores (i.e., lower grayscale values), and the light objects were recognized as tissue (i.e., higher grayscale values). On the equatorial plane, smaller pores (i.e., less density of the dark background) were homogeneously distributed in the healthy fruit (Figure 2E), while larger pores (i.e., high density of the dark background) were observed in the cork spotted fruit (Figure 2G). On the vertical segment, there were fewer and smaller pores in the healthy fruit (Figure 2F), while there were larger and more pores in the cork spotted fruit (Figure 2H). In accordance with the histological observation, the cork spot (i.e., bigger and stronger pores) was distributed close to the fruit skin and the calyx-end of the cork spotted fruit (Figures 2G,H) based on the X-ray scanning analysis. This confirmed the reliability of X-ray scanning for the microstructure analysis of cork spot disordered fruit.
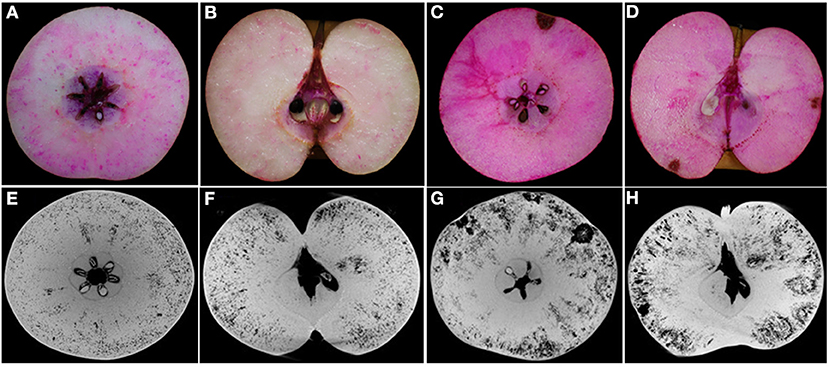
Figure 2. Observation of cork spot distribution in “Akizuki” fruit at harvesttime. (A,B) Transverse and longitudinal sections of healthy fruit stained by safranine solution, respectively. (C,D) Transverse and longitudinal sections of cork spotted fruit stained by safranine solution, respectively. (E,F) Transverse and longitudinal segments of healthy fruit extracted from the X-ray scanning data, respectively. (G,H) Transverse and longitudinal segments of cork spotted fruit extracted from the X-ray scanning data, respectively.
Porous Structure Analysis of the Whole Fruit
The segmentation of the whole fruit X-ray scanning data was conducted for the porous structure analysis. By stacking the transverse slices from the calyx-end to the stem-end of the fruit, the 3D image of the whole fruit was assembled (Figures 3A,D). The red dots represent the voids based on the threshold values and object density and size (Figures 3A,D). From the whole visual comparison, the cork spotted fruit (Figure 3D) contained several voids inside the fruit than the healthy fruit (Figure 3A). The most frequent pore size was 300 μm in both the healthy and cork spotted fruit (Figures 3B,E) with an amount of 229,278 and 260,509, respectively. Pores measuring 100 μm had an amount of 54,326 and 143,377 in the healthy and the cork spotted fruit, respectively. Other pore sizes (ranging from 500 to 3,000 μm) were more observed in the healthy fruit than in the cork spotted fruit (Figures 3B,E). The average pore diameter was 240 μm in healthy fruit and 260 μm in cork spotted fruit (Table 3). The average number of pores in the healthy fruit was 0.20 mm−3, which was significantly less than the cork spotted fruit (0.58 mm−3) (Table 3). For the porosity analysis, the porosity of the healthy fruit was high at the calyx-end, decreased toward the middle of the fruit, and then increased close to the stem-end (Figure 3C). In the cork spotted fruit, there were higher levels of porosity (more than 10%) on both the ends of the fruit compared with the middle portion of the fruit (Figure 3F). There was a significant difference in porosity between the healthy fruit (3.52%) and the cork spotted fruit (9.37%) (Table 3).
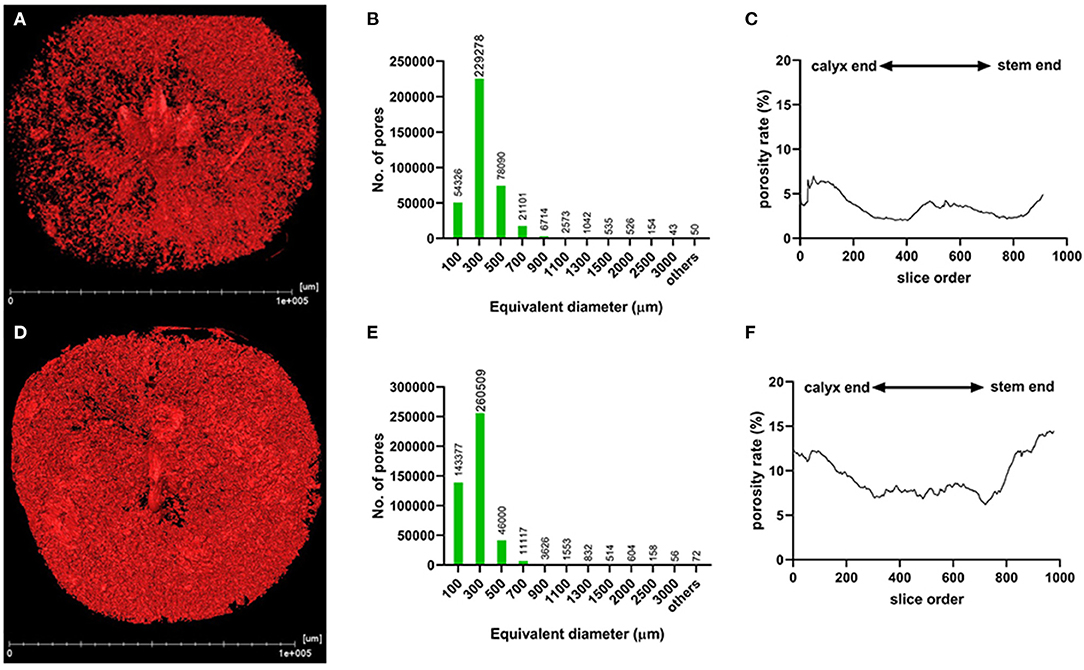
Figure 3. Microstructure analysis of whole “Akizuki” fruit at harvesttime. (A,D) Renderings of X-ray scanning of healthy and cork spotted fruit, respectively. Red dots represent pores based on the grayscale value threshold. (B,E) Histograms of the pore number and size in healthy and cork spotted fruit, respectively. (C,F) Porosity analysis of healthy and cork spotted fruit, respectively. The segmentation of the X-ray scanning data was conducted from the calyx-end to the stem-end of the fruit.
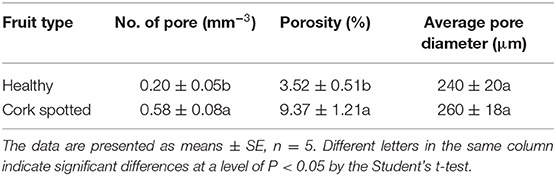
Table 3. Microstructure analysis of healthy and cork spotted “Akizuki” fruit using the segmentation of the X-ray scanning data of the whole fruit.
Porosity Analysis of the Cork Spot Area
Based on the histological observation and the porosity analysis of the whole fruit, three different zones of the fruit were identified as follows: the high-risk area (HRA) with cork spot (outer mesocarp), the middle-risk area (MRA) with cork spot (middle portion of the mesocarp), and the low-risk area (LRA) with cork spot (inner mesocarp) (Figures 4A,B). The segmentation of both HRA and MRA scanning data was conducted for the more specific analysis of porosity. For the healthy fruit, the porosity stayed at a low level (<1.5%) (Figures 4C,E), even though it contained the HRA and MRA. While in the HRA and MRA of the cork spotted fruit, a much higher porosity level was found compared with the healthy fruit (Figures 4D,F). For the HRA of the cork spotted fruit, the porosity stayed at a high level of 15–30% (Figures 4D,F, marked with a rectangle). Even though there was no visual cork spot in the MRA of the cork spotted fruit, the porosity level was still close to 5% (Figure 4F), which was much higher than that of the healthy fruit (Figure 4E).
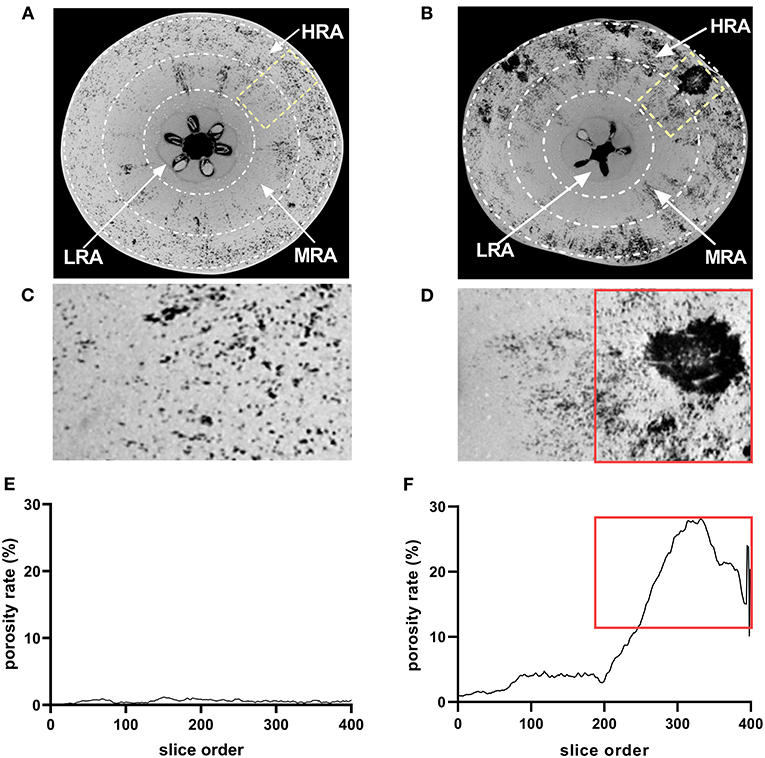
Figure 4. Microstructure analysis of specific areas of “Akizuki” fruit. (A,B) Equatorial plane of healthy and cork spotted fruit, respectively. The HRA, MRA, and LRA were defined as the high-risk area with cork spot, the middle-risk area with cork spot, and the low-risk area with cork spot, respectively. (C,D) Closer view of (A) marked in yellow rectangle and of (B) marked in yellow rectangle, respectively. (E,F) Porosity analysis of (C,D), respectively. Red rectangles in (D,F) represent the tissues and their corresponding porosity.
Three-Dimensional Network Skeleton Analysis of HRA and MRA
To further analyze the structural properties inside the fruit associating with cork spot, a 3D geometric model was built for a small piece of flesh (2.5 × 1.5 × 1.0 cm) on the equatorial plane containing both the HRA and MRA (Figure 5). Any two voxels of pore volume were connected to build the network model if they shared a face, an edge, or a corner. For the healthy fruit, the HRA and MRA scanning data were used together to build a 3D network (Figures 5A–C). From a general view, the healthy fruit had fewer pores (red dots in Figure 5A) than the cork spotted fruit (red dots in Figures 5D,G), which was consistent with the results in the whole fruit analysis (Figures 3A,D). A low degree of connectivity was found in the pore network of the healthy fruit (Figures 5B,C). The pore channels were based on their thickness. The average length of a pore channel was 119 μm in the healthy fruit (Table 4). The average diameter and average length of a pore throat (an intersection of pores) were 64 and 210 μm, respectively (Table 4). The number of coordinated pores in the healthy fruit was zero, indicating a less branched pore network. Since the porosity of both the MRA and HRA in the cork spotted fruit was relatively high, their network skeleton analysis was separated. In the MRA of the cork spotted fruit, a relatively high density of pores and the highly branched pore channels were observed (Figures 5D–F). The average length of pore channels was 160 μm, remarkably higher than that of the healthy fruit (Table 4). The average length and average diameter of pore throats were 226 and 77 μm, respectively, in the MRA of cork spotted fruit (Table 4). The average and largest number of coordinated pores were 2 and 16, respectively (Table 4). For the HRA of the cork spotted fruit, the average length of a pore channel (161 μm) was similar to that of the MRA in the cork spotted fruit (Table 4). However, the average length and average diameter of a pore in the HRA were remarkably greater (i.e., 268 and 100 μm, respectively) than that of the MRA of the cork spotted fruit (Table 4). This difference was also shown in the 3D network model (Figures 5H,I). A pore network with more red indicated the greater size of the pore channels. The average and largest coordinated number of pores in the HRA of the cork spotted fruit were 2 and 48, respectively (Table 4), indicating the highly branched and connected pore network (Figure 5I).
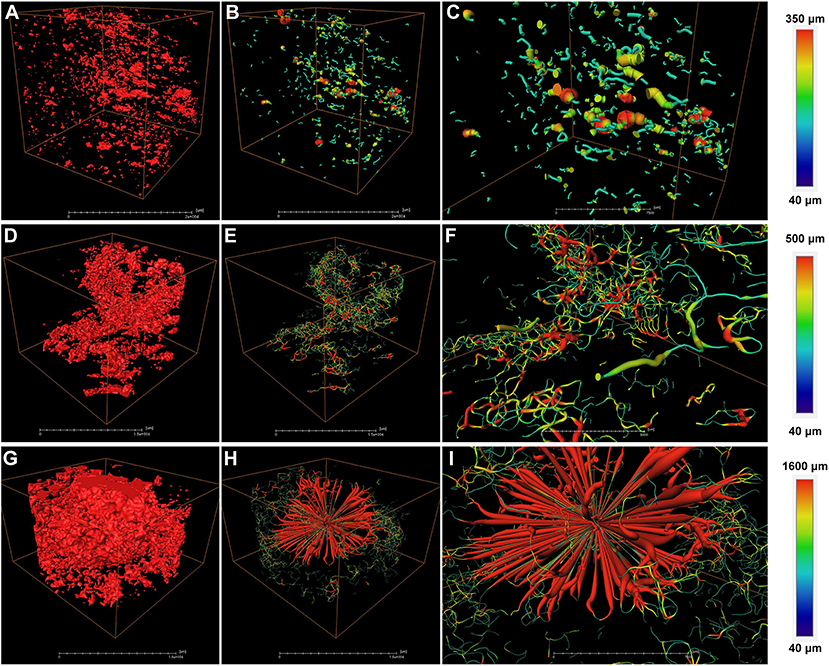
Figure 5. Network skeleton analysis of specific areas of “Akizuki” fruit. (A) Pore analysis of the HRA (high-risk area with cork spot) and MRA (middle-risk area with cork spot) of healthy fruit. Red dots represent pores based on the grayscale value threshold. (B) Reconstructed 3D network model of (A). (C) Closer view of (B). (D,G) Pore analysis of the MRA and HRA of cork spotted fruit, respectively. Red dots represent pores based on the grayscale value threshold. (E,H) Reconstructed 3D network models of (D,G), respectively. (F,I) Closer view of (E,H), respectively. Color bars on the right indicate pore thickness from narrow (blue) to wide (red).
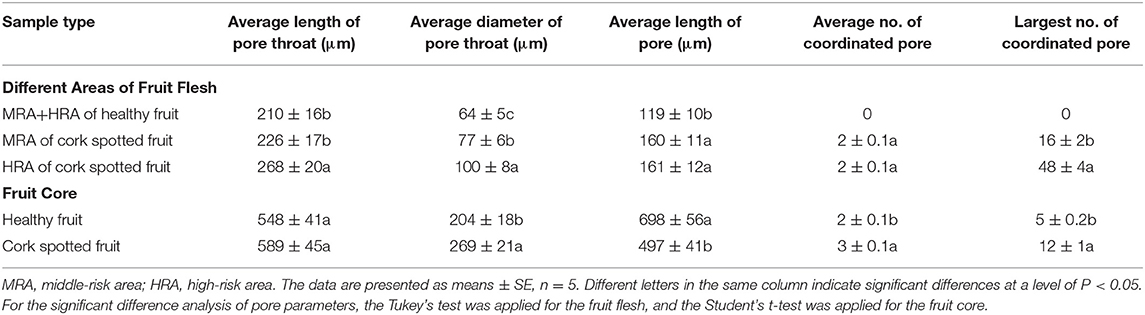
Table 4. Analysis of the morphometric parameters in different areas of healthy and cork spotted fruit under the reconstructed 3D network model.
Structure and Network Analysis of the Fruit Core
The fruit core shape and porous structure were also analyzed in both the healthy and cork spotted fruit (Figure 6). From the whole fruit observations, the healthy fruit core could be clearly separated from the flesh based on the grayscale values (Figure 6A), while the cork spotted fruit core showed a similar texture property to the flesh and could not be distinguished based solely on the grayscale values (Figure 6E). After extracting the scanning data of the core from the fruit and reconstructing it through 3D rendering, the healthy fruit core had an intact shape with a smooth surface (Figure 6B), while the cork spotted fruit core had a damaged shape and rough surface (Figure 6F). For the network connectivity analysis, the healthy fruit core had longer and narrower pore channels (Figures 6C,D) compared with those of the cork spotted fruit core (Figures 6G,H). The average pore channel length was 698 μm in the healthy core and 497 μm in the cork spotted core (Table 4). Both the average length and average diameter of the pore throats were similar between the healthy core (i.e., 548 and 204 μm, respectively) and the cork spotted core (i.e., 589 and 269 μm, respectively) (Table 4). The cork spotted core had a highly branched network structure (Figure 6H) with an average coordinated pore number of 3 and the largest coordinated pore number of 12 (Table 4). In the healthy fruit core, the average coordinated pore number was 2, and the largest coordinated pore number was only 5 (Table 4), which was accordant with its 3D network image with less branches and a lower degree of connectivity (Figure 6D).
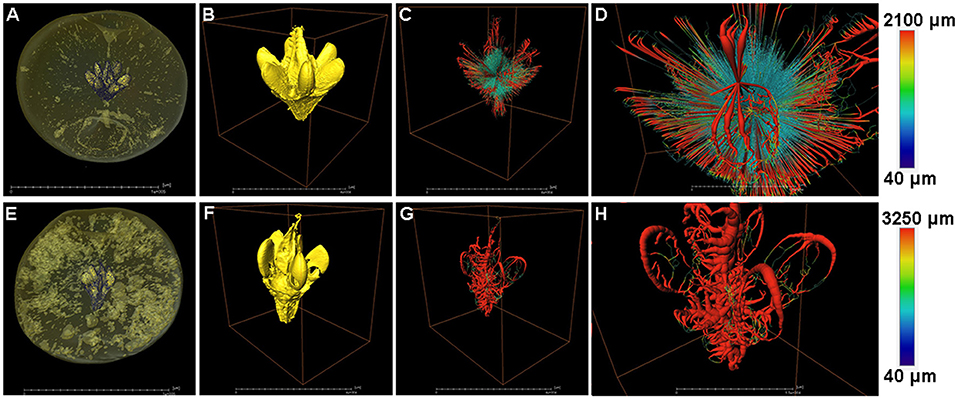
Figure 6. Structure and network skeleton analysis of “Akizuki” fruit core. (A,E) Renderings of X-ray scanned healthy and cork spotted fruit, respectively, where the fruit core was distinguished by the grayscale values. (B,F) Reconstructed 3D model of the healthy fruit core and cork spotted fruit core, respectively. (C,G) Reconstructed 3D network model of (B,F), respectively. (D,H) Closer view of (C,G), respectively. Color bars on the right indicate pore thickness from narrow (blue) to wide (red).
High-Resolution Analysis of the Flesh Microstructure
A piece of flesh from the MRA without cork spot in both healthy and cork spotted fruit was used for the high-resolution observation by X-ray scanning. Under high-resolution observation (pixel size 0.5 μm), the flesh from the healthy fruit had higher grayscale values (Figures 7A,B) than that observed from the cork spotted fruit (Figures 7D,E). In further segmentation analysis, the healthy flesh had a much smaller pore diameter (about 22 μm) (Figure 7C) than that of the cork spotted fruit (about 87 μm) (Figure 7F). This indicated that even in flesh without cork spot, there were obvious texture differences between healthy and cork spotted fruit.
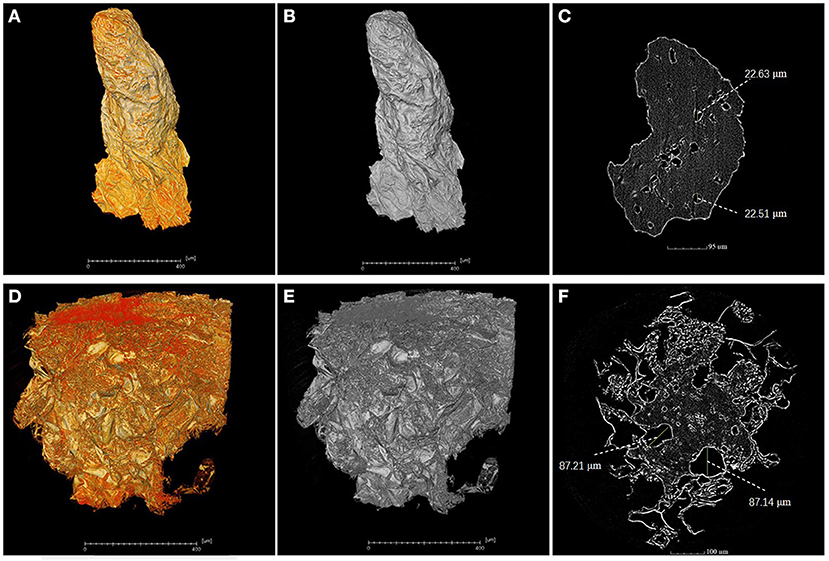
Figure 7. High-resolution analysis of flesh microstructure of “Akizuki” fruit. (A,B) Yellow and gray reconstructed 3D images of flesh from the MRA (middle-risk area with cork spot) of the healthy fruit, respectively. (C) Segment of the X-ray scanning of the healthy fruit flesh. (D,E) Yellow and gray reconstructed 3D images of flesh from the MRA of cork spotted fruit, respectively. (F) Segment of the X-ray scanning of the cork spotted fruit flesh.
Analysis of Gene Expression Related to Ca2+ Transport
Genes functioning as Ca2+ sensors (PpCML), Ca2+ transporter/channels (PpCNGC), Ca2+/H+ exchangers (PpCAX), and Ca2+-ATPase (PpACA) were selected for expression analysis (Figure 8). Different areas of the fruit were sampled. For the LRA of the fruit, there was no significant difference in the expressions of PpCML11, PpCML29, PpCML47, and PpACA4 from 87 to 127 DAFB between healthy and cork spotted fruit (Figure 8). PpCML41 had a higher expression level in the cork spotted fruit at 127 DAFB compared with the healthy fruit. PpCAX4 had a higher expression level in the cork spotted fruit at 107 DAFB than in the healthy fruit but then became similar between healthy and cork spotted fruit at 127 DAFB (Figure 8). For the MRA of the fruit, no significant difference was found in the expression levels of PpCML11, PpCML29, and PpACA4 between the healthy fruit and the cork spotted fruit from 87 to 127 DAFB. PpCML41 had higher expression levels in the cork spotted fruit than in the healthy fruit at both 107 and 127 DAFB while PpCML47 had a higher expression level in the cork spotted fruit than in the healthy fruit at both 107 and 127 DAFB. The only significant difference of PpCAX4 expression was found at 107 DAFB with a higher level in the cork spotted fruit than that in the healthy fruit (Figure 8). For the HRA of the fruit, PpCML11 had a higher expression level at 107 DAFB in the healthy fruit than that in the cork spotted fruit while no significant difference was found in the expression level of PpCML29 between healthy and cork spotted fruit from 87 to 127 DAFB. The higher expression level of PpCML41 was only found at 127 DAFB in the cork spotted fruit compared with the healthy fruit. PpCML47 had a higher expression level in the cork spotted fruit than in the healthy fruit at 107 DAFB, which then increased drastically and became much higher in the cork spotted fruit at 127 DAFB. A significant difference of PpACA4 expression was only found at 107 DAFB with a higher level in the cork spotted fruit than in the healthy fruit while PpCAX4 had a higher expression level in the cork spotted fruit than that in the healthy fruit at 107 DAFB (Figure 8).
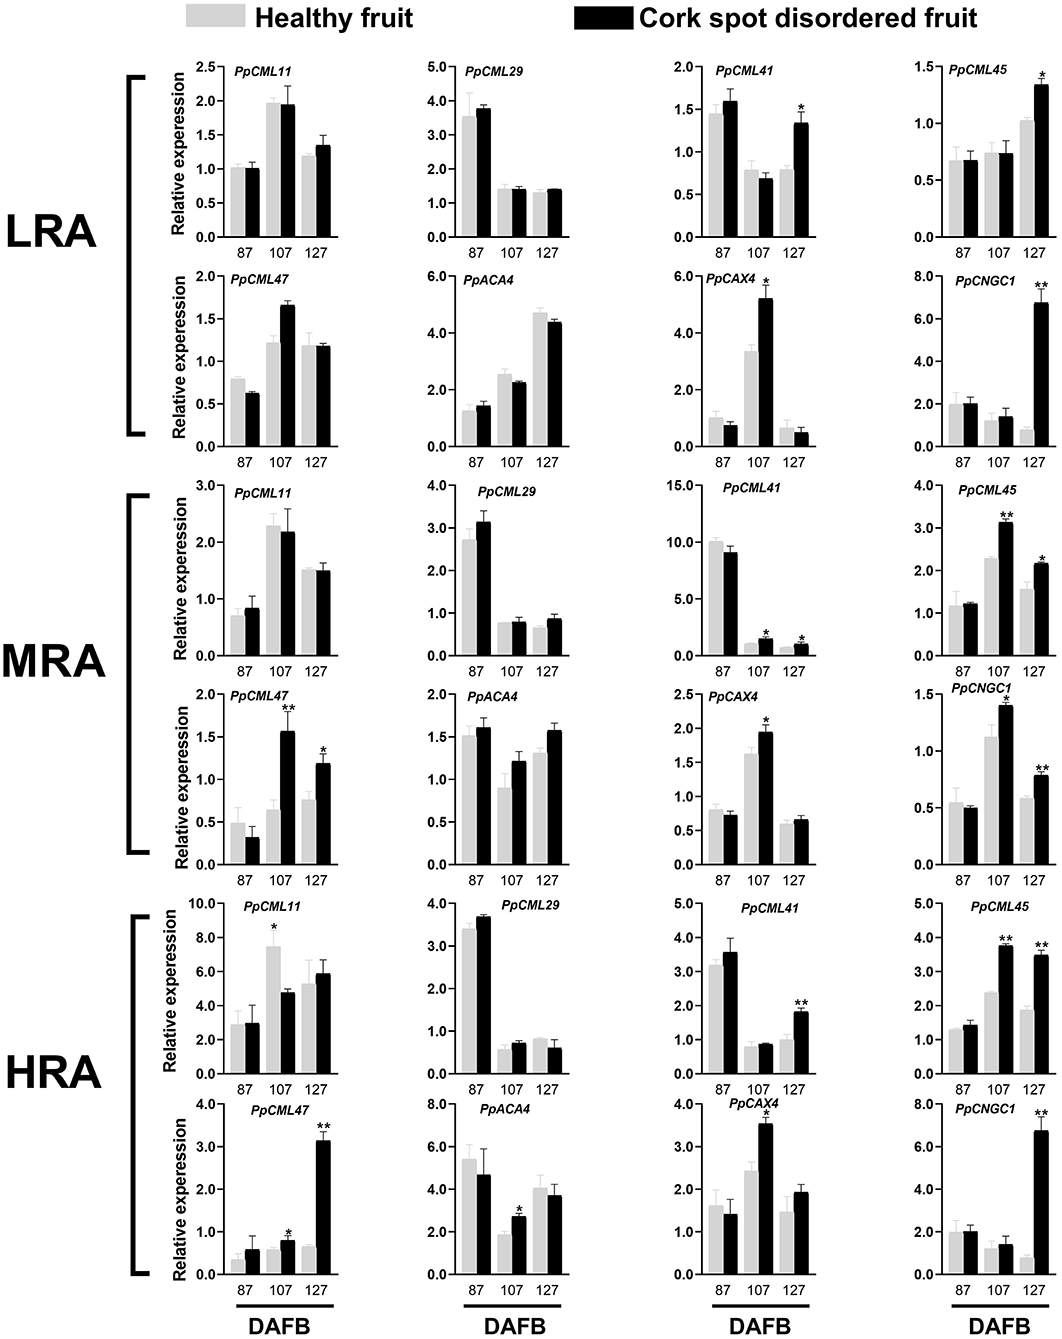
Figure 8. Expression analysis of genes involved in Ca2+ transport during fruit development. * and ** indicate the significant differences in the expression within the group at a level of P < 0.05 and P < 0.01, respectively.
Free Ca2+ Distribution
Free Ca2+ distribution was analyzed in different areas of both healthy and cork spotted fruit at 127 DAFB (Figure 9). The observation of Ca2+ signals was indicated by the green fluorescence in the merged field. For the LRA of the fruit, the Ca2+ distribution was homogeneous and diffuse in both healthy fruit and cork spotted fruit with both having a similar intensity of Ca2+ signals (Figure 9). For the MRA of the fruit, Ca2+ distribution in the healthy fruit had a similar pattern as the LRA while there was an uneven distribution of Ca2+ in the cork spotted fruit with several Ca2+ signals surrounding the margins of the cells compared with the interior cytoplasm. The Ca2+ signals in the cork spotted fruit were stronger than those observed in the healthy fruit (Figure 9). For the HRA of the healthy fruit, the Ca2+ distribution pattern was consistent with what was observed in the LRA and MRA in the healthy fruit with a homogeneous and diffuse distribution. However, in the cork spotted fruit, the Ca2+ signal intensity was quite uneven. Ca2+ signals were centralized to the margins of the cells, similar to what was noted in the MRA, but the Ca2+ signal intensity was not as strong as what was observed in the MRA. The cytoplasmic leakage of the HRA may be responsible for the reduced Ca2+ signal intensity compared with the MRA, which may be due to the necrosis and high lignification of the HRA (Figure 9).
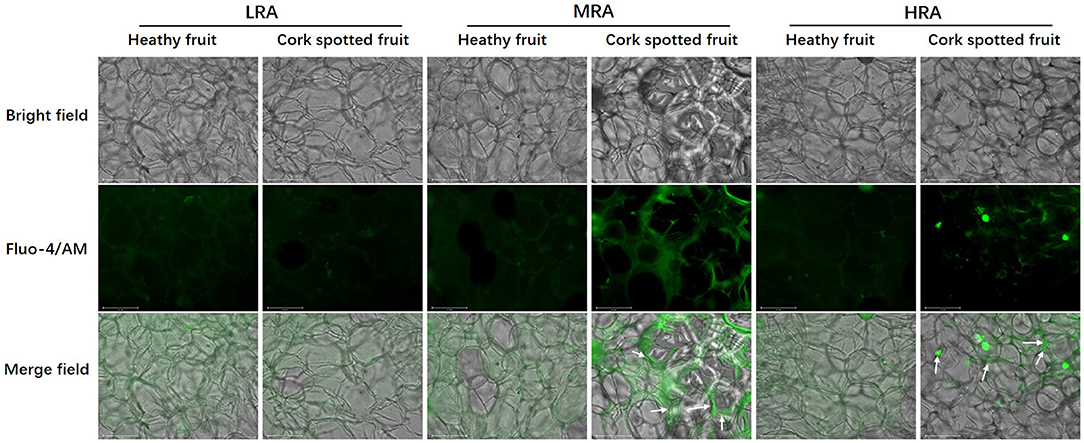
Figure 9. Observation of free Ca2+ distribution in different areas of both healthy fruit and cork spotted fruit at 127 days after full bloom (DAFB) by using the laser scanning confocal microscope. Green fluorescence in the merge indicates Ca2+ distribution. White arrows indicate the enrichment of the Ca2+ signal. Scale bar = 125 μm.
Discussion
X-ray CT scanning, which is notably a non-destructive method, has long been developed and validated for the analysis of agricultural food texture during both preharvest and postharvest periods (Wang et al., 2018). However, the application of X-ray CT scanning for the diagnosis and analysis of pear fruit physiological disorders is quite limited (Lammertyn et al., 2003; Muziri et al., 2016; Duan et al., 2020). This study is the first to systematically analyze the cork spot distribution, porous characteristics, network skeleton of different areas, and fruit core integrity and structure in both healthy and cork spotted pear fruit using the high-resolution X-ray CT scanning to explore the causal factors of cork spot disorder in pear.
Our study showed that cork spotted fruit had a greater fruit weight and a larger horizontal length (Table 1), which was consistent with other reports regarding cork spot disorder in pear (Hayama et al., 2017; Duan et al., 2019). Even though cork spotted fruit also had a higher porosity than the healthy fruit (Figure 3), no direct evidence suggested the existence of the correlation between fruit size and porosity. The alteration of the fruit microstructure influences gas exchange/diffusion and water transport inside the fruit and further affects the fruit texture (Kuroki et al., 2004; Mendoza et al., 2007). Both core breakdown in the “Conference” pear (Lammertyn et al., 2003) and mealiness in the “Forelle” pear during the shelf life were found to be associated with higher porosity. Our results showed no correlation between the fruit porosity and fruit texture, including fruit firmness, soluble solids content, and titratable acidity (Table 1). Similar results were also reported in kiwifruit (Cantre et al., 2014a). Ting et al. (2013) correlated firmness with low tissue microporosity in four apple cultivars, and Winisdorffer et al. (2015) found that water content and distribution may influence tissue microstructure, but no correlation was observed between soluble solids content and porosity. This indicated the complex relationship between fruit microstructure and fruit texture, which was controlled by both genetic and environmental factors.
Unlike “Chili,” “Akizuki” has no obvious cork spotting symptoms on the fruit surface (Figure 1). However, X-ray scanning easily distinguished between healthy and cork spotted fruit and was able to discern the cork spot area inside the fruit, which was accordant with the histological observation (Figure 2). This validated the reliability and power of utilizing X-ray in non-destructive testing as reported in other studies (Mebatsion et al., 2009; Winisdorffer et al., 2015; Cakmak, 2019). Cork spotted “Akizuki” fruit had remarkably more pores and higher porosity in the whole fruit (Figure 3), indicating the degradation of flesh tissue. Even though the selected MRA of the cork spotted fruit for the porosity analysis had no cork spot, it still showed much higher porosity compared with the healthy fruit (Figure 4), suggesting that flesh tissue damage occurs prior to the development of cork spot. Cui et al. (2020) observed the necrotic and browning vascular tissues in cork spotted “Chili” fruit, which supported our observation with X-ray scanning. In apple fruit, dysfunctional xylem in the fruit results in a higher (K+ Mg+ N)/Ca ratio and thus induces the development of bitter pit, a similar physiological disorder (Miqueloto et al., 2014). Water core, another physiological disorder, was found to initiate near the vascular bundles according to the study by Kasai and Arakawa (2010). The long-distance transport of Ca2+ in fruit is through the apoplastic pathways, which is along the water mass flow in the xylem (Gilliham et al., 2011). Therefore, normal xylem function influences the Ca2+ distribution and delivery within the whole fruit. An early loss of xylem function in “Catarina” apple altered the Ca2+ content in the fruit and resulted in the higher incidence of bitter pit compared with “Fuji” (Miqueloto et al., 2014), and the Ca2+ content in different parts of the wax apple fruit was associated with its xylem functionality during the stages of fruit development (Chen et al., 2019). Both the previous studies (Miqueloto et al., 2014; Chen et al., 2019) emphasized the influence of xylem function in the development of Ca2+-deficiency-related fruit disorders. Even though our study did not test the xylem function directly in the healthy and cork spotted fruit, both the porosity (Figure 4) and reconstructed 3D structure analysis (Figure 5) suggested tissue damage in the MRA and HRA of the cork spotted fruit, which possibly altered xylem function. These findings imply that the functions of water and mineral transport channels in the plant likely influence the development of this type of physiological disorder. In the analysis of the fruit porous network, we observed less branched porous channels in healthy fruit (Figure 5), indicating normal porous microstructure for water and nutrient transport and gas exchange, which is critical for proper fruit growth and storage (Kuroki et al., 2004; Winisdorffer et al., 2015). In the cork spotted fruit, the highly branched porous channels (i.e., a large number of coordinated pores) (Figure 5) were possibly due to the extension and interconnection with adjacent small pores, which further aggravated the breakage of the vascular system as observed by the histological section (Cui et al., 2020).
Even though cork spot rarely localized at the inner mesocarp (i.e., tissues surrounding the fruit core) in “Akizuki,” such as what was observed in the study of “Chili” (Duan et al., 2020), the core of cork spotted fruit was deformed with a highly branched pore channel when compared with healthy fruit (Figure 6). This result was accordant with what was observed in cork spotted “Chili” (Duan et al., 2020) despite the major morphological differences between “Akizuki” and “Chili.” To our knowledge, this study was the first to digitize and reconstruct a fruit core 3D model (Figures 6B,F) and to use the X-ray CT scanning data to analyze the structure and network skeleton. The different texture of the fruit core compared with the fruit flesh may prevent the occurrence of cork spot. Another possibility is that the strong vascular connection between the petiole and the core maintained normal Ca2+ transport. The deformation of the core may be caused by parts of the flesh affected by cork spot, but this assumption needs further validation. To our knowledge, our high-resolution observation (i.e., 0.5 μm in pixel size) has been the best resolution utilized so far to analyze the fruit microstructure (Figure 7). The MRA of cork spotted fruit had pore sizes four times larger than that of healthy fruit, further confirming our porosity analysis results with the whole fruit. This indicated that flesh tissue microstructure damage occurred before the initiation of the cork spot disorder.
Together with the long-distance transport of Ca2+, the cell-to-cell transmembrane transport of Ca2+ mediated by membrane transport proteins, such as probable calcium-binding protein (CML), auto-inhibited Ca2+-ATPase (ACA), Ca2+ exchanger (CAX), and cyclic nucleotide-gated ion channels (CNGC), determines the intercellular and intracellular distribution of Ca2+ (Spalding and Harper, 2011; de Freitas and Mitcham, 2012). Recent researchers have proposed that the intracellular imbalance of Ca2+ could be the factor causing cork spot disorder, rather than mere Ca2+ deficiency (Duan et al., 2019; Cui et al., 2020). The higher expression of CAX was shown to lower the cytoplasmic Ca2+ concentration in both tomato (de Freitas et al., 2011) and Arabidopsis (Conn et al., 2012) by increasing the Ca2+ transport from cytoplasm to vacuole. Once Ca2+ is deposited in vacuoles, it is rarely redistributed (Gilliham et al., 2011). Pear superficial scald and pear hard-end, two disorders possibly related to Ca2+ deficiency, were shown to associate with the higher expression of CMLs and CNGCs (Wang et al., 2017; Li et al., 2020). Our study found the higher expression of PpCML11, PpCML41, PpCML45, PpCML47, PpCAX4, and PpCNGC1 in either the MRA or the HRA of the cork spotted fruit during fruit development (Figure 8), indicating that membrane transport proteins play important roles in the development of cork spot disorder. Moreover, the uneven distribution of free Ca2+ only appeared in the MRA and HRA of cork spotted fruit (Figure 9). These two areas also showed significantly different gene expressions (Figure 8) and remarkable differences in porous characteristics in the flesh (Figures 4, 5) compared with the healthy fruit. These results suggest that Ca2+ cell-to-cell transport and intracellular allocation highly depend on functional membrane proteins (Winisdorffer et al., 2015) and that an undamaged flesh tissue and an intact cell membrane are critical to prevent the development of cork spot.
Considering both previous studies and our present research, it appears that pear fruit cork spot could be initiated by the dysfunction of Ca2+ transport, including long-distance transport inside the fruit and intracellular transmembrane transport. The long-distance transport and intracellular transmembrane transport rely on the vascular system and related membrane proteins, respectively. Programmed cell death is an important means in plant immune systems (Coll et al., 2011), and it is believed to be responsible for the larger pore size in apple fruit (Cantre et al., 2014a). Thus, we hypothesized that programmed cell death damaged cell membrane integrity and further caused tissue breakage, which interrupted normal Ca2+ balance in the fruit and induced the occurrence of cork spot. Based on this, we propose that future cork spot studies should further explore the mechanism of this disorder and find effective control strategies in the orchard. Since cork spot is a physiological disorder, there are considerable variations of the disorder incidence from year to year, which is affected by, but not limited to, climate, soil structure, water, nutrition, and cultivation measures. Therefore, future studies exploring the mechanism of cork spot should not focus on just one single external factor. Also, there should be an additional investigation regarding the development of the vascular system during fruit growth and the causal factors of vascular system damage, which may influence the Ca2+ transport. Furthermore, studies relating to programmed cell death and membrane integrity damage could be a new point of exploration, especially regarding Ca2+-transport-related membrane proteins. The multiomics analysis may also facilitate a better understanding of the underlying molecular regulation.
Conclusion
X-ray scanning is a powerful and reliable tool for the analysis of the microstructure of cork spotted pear fruit, especially under high-resolution observation. Distinct from previous cork spot-related studies, our investigation of the microstructure of pear fruit improved our understanding of the microstructural characteristics of cork spot disorder from a novel perspective. Cork spotted pear fruit had much higher porosity in the whole fruit and more highly branched pore connectivity, which may have interrupted Ca2+ transport and allocation. Vascular system breakage and cell membrane damage likely occurred in the fruit prior to the development of cork spot. Additional studies, especially regarding molecular regulation, should be conducted.
Data Availability Statement
The original contributions presented in the study are included in the article/Supplementary Material, further inquiries can be directed to the corresponding author/s.
Author Contributions
ZC and NW conducted the experiment, and ZC prepared the manuscript. YD and XX provided impontant technical help in X-ray scanning. RW and SZ gave useful guidance and valuable discussion. CM conceived the idea and provided financial support. All authors contributed to the article and approved the submitted version.
Funding
This study was financially supported by the Agriculture Science and Technology of Shandong Province (2019YQ015), the China Agriculture Research System of MOF and MARA, the National Key R&D Program of China (2018YFD1000200), the Breeding Plan of Shandong Provincial Qingchuang Research Team (2019), the Taishan Scholar Project of Shandong Province, and the Doctoral Foundation of Qingdao Agricultural University.
Conflict of Interest
XX was employed by Sanying Precision Instruments.
The remaining authors declare that the research was conducted in the absence of any commercial or financial relationships that could be construed as a potential conflict of interest.
Publisher's Note
All claims expressed in this article are solely those of the authors and do not necessarily represent those of their affiliated organizations, or those of the publisher, the editors and the reviewers. Any product that may be evaluated in this article, or claim that may be made by its manufacturer, is not guaranteed or endorsed by the publisher.
Supplementary Material
The Supplementary Material for this article can be found online at: https://www.frontiersin.org/articles/10.3389/fpls.2021.715124/full#supplementary-material
References
Cakmak, H. (2019). Assessment of fresh fruit and vegetable quality with non-destructive methods. Food Qual. Shelf Life. 2019, 303–331. doi: 10.1016/B978-0-12-817190-5.00010-0
Cantre, D., East, A., Verboven, P., Trejo Araya, X., Herremans, E., and Nicolaï, B. M. (2014a). Microstructural characterisation of commercial kiwifruit cultivars using x-ray micro computed tomography. Postharvest Biol. Technol. 92, 79–86. doi: 10.1016/j.postharvbio.2014.01.012
Cantre, D., Herremans, E., Verboven, P., Ampofo-Asiama, J., and Nicolaï, B. M. (2014b). Characterization of the 3D microstructure of mango (Mangifera indica. cv. carabao) during ripening using x-ray computed microtomography. Innov. Food ence Emerg. Technol. 24, 28–39. doi: 10.1016/j.ifset.2013.12.008
Chen, S. J., Yeh, D. M., Lin, H. L., and Li, K. T. (2019). Discontinuity of xylem function during maturation associated with quality development and calcium allocation in wax apple (Syzygium samarangense merr. and perry) fruit. Fruits 74, 117–123. doi: 10.17660/th2019/74.3.3
Coll, N. S., Epple, P., and Dangl, J. L. (2011). Programmed cell death in the plant immune system. Cell Death Differ. 18, 1247–1256. doi: 10.1038/cdd.2011.37
Conn, S. J., Gilliham, M., Athman, A., Schreiber, A. W., Baumann, U., Moller, I., et al. (2012). Cell-specific vacuolar calcium storage mediated by cax1 regulates apoplastic calcium concentration, gas exchange, and plant productivity in arabidopsis. Plant Cell 23, 240–257. doi: 10.1105/tpc.109.072769
Cui, Z. H., Bi, W. L., Hao, X. Y., Li, P. M., Duan, Y., Walker, M. A., et al. (2017). Drought stress enhances up-regulation of anthocyanin biosynthesis in Grapevine leafroll-associated virus 3 infected in vitro grapevine (Vitis vinifera) leaves. Plant Dis. 101, 1606–1615. doi: 10.1094/PDIS-01-17-0104-RE
Cui, Z. H., Jiao, Q. Y., Wang, R., and Ma, C. H. (2020). Investigation and analysis of relationship between mineral elements alteration and cork spot physiological disorder of Chinese pear 'chili' (Pyrus bretschneideri Rehd.). Sci. Hortic. 260:108883. doi: 10.1016/j.scienta.2019.108883
de Freitas, S. T., Padda, M., Wu, Q. Y., Park, S., and Mitcham, E. J. (2011). Dynamic alternations in cellular and molecular components during blossom-end rot development in tomatoes expressing scax1, a constitutively active Ca(2+)/H(+) antiporter from arabidopsis. Plant Physiol. 156, 844–855. doi: 10.1104/pp.111.175208
de Freitas, S. T., and Mitcham, E. J. (2012). Factors involved in fruit calcium deficiency disorders. Hort. Rev. 40, 107–146. doi: 10.1002/9781118351871.ch3
Diels, E., Van Dael, M., Keresztes, J., Vanmaercke, S., Verboven, P., and Nicolaï, B. M. (2017). Assessment of bruise volumes in apples using x-ray computed tomography. Postharvest Biol. Technol. 128, 24–32. doi: 10.1016/j.postharvbio.2017.01.013
Duan, Y. X., Xu, X., Wang, R., and Ma, C. H. (2020). X-ray μCT analysis to characterize cork spot disorder in Chinese pear 'Chili' (Pyrus bretschneideri). Postharvest Biol. Technol. 170:111321. doi: 10.1016/j.postharvbio.2020.111321
Duan, Y. X., Xu, Y., Wang, R., and Ma, C. H. (2019). Investigation and prevention of cork spot disorder in 'Akizuki' pear (Pyrus pyrifolia Nakai). Hort. Sci. 54, 480–486. doi: 10.21273/HORTSCI13775-18
Facteau, T. J., Cahn, H., and Mielke, E. A. (2010). Mineral concentrations in individual ‘d'Anjou' pear fruit with and without cork spot. J. Food Qual. 23, 513–519. doi: 10.1111/j.1745-4557.2000.tb00576.x
Feldkamp, L. A., Davis, L. C., and Kress, J. W. (1984). Practical cone-beam algorithm. J. Opt. Soc. Am. 1, 612–619. doi: 10.1364/JOSAA.1.000612
Gilliham, M., Dayod, M., Hocking, B. J., Xu, B., Conn, S. J., Kaiser, B. N., et al. (2011). Calcium delivery and storage in plant leaves: exploring the link with water flow. J. Exp. Bot. 62, 2233–2250 doi: 10.1093/jxb/err111
Hayama, H., Mitani, N., Yamane, T., Inoue, H., and Kusaba, S. (2017). Characteristics of cork spot like disorder in Japanese pear ‘Akizuki' and ‘Oushuu'. Hortic. Res. (Japan). 16, 79–87. doi: 10.2503/hrj.16.79
Herremans, E., Melado-Herreros, A., Defraeye, T., Verlinden, B., Hertog, M., and Verboven, P. (2014a). Comparison of X-ray CT and MRI of watercore disorder of different apple cultivars. Postharvest Biol. Technol. 87, 42–50. doi: 10.1016/j.postharvbio.2013.08.008
Herremans, E., Verboven, P., Bongaers, E., Estrade, P., Verlinden, B., Wevers, M., et al. (2013). Characterisation of 'Braeburn' browning disorder by means of X-ray micro-CT. Postharvest Biol. Technol. 75, 114–124. doi: 10.1016/j.postharvbio.2012.08.008
Herremans, E., Verboven, P., Defraeye, T., Rogge, S., Ho, Q. T., and Hertog, M. L. A. T.M. (2014b). X-ray CT for quantitative food microstructure engineering: the apple case. Nucl. Inst. Methods Phys. Res. Sect. B 324, 88–94. doi: 10.1016/j.nimb.2013.07.035
Herremans, E., Verboven, P., Verlinden, B. E., Cantre, D., Abera, M., Wevers, M., et al. (2015). Automatic analysis of the 3-d microstructure of fruit parenchyma tissue using X-ray micro-CT explains differences in aeration. BMC Plant Biol. 15:264. doi: 10.1186/s12870-015-0650-y
Janssen, S., Verboven, P., Nugraha, B., Wang, Z., and Nicola, B. M. (2020). 3d pore structure analysis of intact 'Braeburn' apples using X-ray micro-CT. Postharvest Biol. Technol. 159:111014. doi: 10.1016/j.postharvbio.2019.111014
Jennings, B. R., and Parslow, K. (1988). Particle size measurement: the equivalent spherical diameter. Proc. Roy. Soc. Lond. Ser. A 419, 137–149. doi: 10.1098/rspa.1988.0100
Kader, A. (2002). Postharvest Technology of Horticultural Crops, 3rd Edn. Davis, CA: University of California.
Kasai, S., and Arakawa, O. (2010). Antioxidant levels in watercore tissue in ‘Fuji' apples during storage. Postharvest Biol. Technol. 55, 103–107. doi: 10.1016/j.postharvbio.2009.08.008
Kuroki, S., Oshita, S., Sotome, I., Kawagoe, Y., and Seo, Y. (2004). Visualization of 3-d network of gas-filled intercellular spaces in cucumber fruit after harvest. Postharvest Biol. Technol. 33, 255–262. doi: 10.1016/j.postharvbio.2004.04.002
Lammertyn, J., Dresselaers, T., Hecke, P. V., Jancsók, P., and Nicolaï, B. M. (2003). Analysis of the time course of core breakdown in 'Conference' pears by means of MRI and X-ray CT. Postharvest Biol. Technol. 29, 19–28. doi: 10.1016/S0925-5214(02)00212-0
Li, Q., Cheng, C. X., Zhang, X. F., Wang, C. H., and Yang, S. L. (2020). Preharvest bagging and postharvest calcium treatment affects superficial scald incidence and calcium nutrition during storage of 'chili' pear (Pyrus bretschneideri) fruit. Postharvest Biol. Technol. 163:111149. doi: 10.1016/j.postharvbio.2020.111149
Livak, K. J., and Schmitten, T. D. (2001). Analysis of relative gene expression data using real-time quantitative PCR and the 2−ΔΔct method. Methods. 25, 402–408. doi: 10.1006/meth.2001.1262
Magwaza, L. S., and Opara, U. L. (2014). Investigating non-destructive quantification and characterization of pomegranate fruit internal structure using X-ray computed tomography. Postharvest Biol. Technol. 95, 1–6. doi: 10.1016/j.postharvbio.2014.03.014
Mason, J. L., and Welsh, M. F. (1970). Cork spot (pit) of ‘Anjou' pear related to calcium concentration in fruit. Hort. Sci. 5:447.
Mebatsion, H. K., Verboven, P., Endalew, A. M., Billen, J., Ho, Q. T., and Nicolaï, B. M. (2009). A novel method for 3-d microstructure modeling of pome fruit tissue using synchrotron radiation tomography images. J. Food Engineer. 93, 141–148. doi: 10.1016/j.jfoodeng.2009.01.008
Mendoza, F., Verboven, P., Mebatsion, H. K., Kerckhofs, G., Wevers, M., and Nicolaï, B. M. (2007). Three-dimensional pore space quantification of apple tissue using X-ray computed microtomography. Planta 226, 559–570. doi: 10.1007/s00425-007-0504-4
Miqueloto, A., Amarante, C. V. T. D., Steffens, C. A., Dos Santos, A., and Mitcham, E. (2014). Relationship between xylem functionality, calcium content and the incidence of bitter pit in apple fruit. Sci. Hortic. 165, 319–323. doi: 10.1016/j.scienta.2013.11.029
Muziri, T., Theron, K. I., Cantre, D., Wang, Z., Verboven, P., and Nicolaï, B. M. (2016). Microstructure analysis and detection of mealiness in 'Forelle' pear (Pyrus communis l.) by means of X-ray computed tomography. Postharvest Biol. Technol. 120, 145–156. doi: 10.1016/j.postharvbio.2016.06.006
Raese, J. T., and Drake, S. R. (2006). Calcium foliar sprays for control of alfalfa greening, cork spot, and hard end in ‘Anjou' pears. J. Plant Nutr. 29, 543–552. doi: 10.1080/01904160500526683
Raese, T., and Drake, S. R. (1993). Effects of preharvest calcium sprays on apple and pear quality. J. Plant Nutr. 26, 1807–1819. doi: 10.1080/01904169309364651
Raese, T., Drake, S. R., and Staff, D. C. (1995). Influence of different calcium materials and spray timings on mineral composition, yield, fruit quality, and control of fruit disorders of ‘Anjou' pears. J. Plant Nutr. 18, 823–838 doi: 10.1080/01904169509364941
Schoeman, L., Williams, P., Plessis, A. D., and Manley, M. (2016). X-ray micro-computed tomography (μCT) for non-destructive characterisation of food. Trends Food Sci. Technol. 47, 10–24. doi: 10.1016/j.tifs.2015.10.016
Sharma, R. R., Singh, D., and Pal, R. K. (2013). Synergistic influence of pre-harvest calcium sprays and postharvest hot water treatment on fruit firmness, decay, bitter pit incidence and postharvest quality of royal delicious apples (Borkh). Am. J. Plant Sci. 4, 153–159. doi: 10.4236/ajps.2013.41020
Spalding, E. P., and Harper, J. F. (2011). The ins and outs of cellular Ca2+ transport. Curr. Opin. Plant Biol. 14, 715–720. doi: 10.1016/j.pbi.2011.08.001
Ting, V. J. L., Silcock, P., Bremer, P. J., and Biasioli, F. (2013). X-ray micro-computer tomographic method to visualize the microstructure of different apple cultivars. J. Food Sci. 78, E1735–E1742. doi: 10.1111/1750-3841.12290
Wang, Y. L., Zhang, X. F., Wang, R., Bai, Y. X., Liu, C. L., Yuan, Y. B., et al. (2017). Differential gene expression analysis of' Chili' (Pyrus bretschneideri) fruit pericarp with two types of bagging treatments. Hortic. Res. 4:17005. doi: 10.1038/hortres.2017.5
Wang, Z., Herremans, E., Janssen, S., Cantre, D., Verboven, P., and Nicolaï, B. M. (2018). Visualizing 3D food microstructure using tomographic methods: advantages and disadvantages. Ann. Rev. Food Sci. Technol. 9, 323–343. doi: 10.1146/annurev-food-030117-012639
Winisdorffer, G., Musse, M., Quellec, S., Barbacci, A., Gall, S. L., Mariette, F., et al. (2015). Analysis of the dynamic mechanical properties of apple tissue and relationships with the intracellular water status, gas distribution, histological properties and chemical composition. Postharvest Biol. Technol. 104, 1–16. doi: 10.1016/j.postharvbio.2015.02.010
Keywords: “Akizuki”, Ca2+ transport, microstructure, X-ray CT scanning, cork spot disorder
Citation: Cui Z, Wang N, Duan Y, Xu X, Wang R, Zhang S and Ma C (2021) High-Resolution Microstructure Analysis of Cork Spot Disordered Pear Fruit “Akizuki” (Pyrus pyrifolia Nakai) Using X-Ray CT. Front. Plant Sci. 12:715124. doi: 10.3389/fpls.2021.715124
Received: 26 May 2021; Accepted: 19 July 2021;
Published: 16 August 2021.
Edited by:
Claudio Bonghi, University of Padua, ItalyReviewed by:
Kanji Isuzugawa, Yamagata Prefectural College of Agriculture and Forestry, JapanClaudia Moggia, University of Talca, Chile
Yongcai Li, Gansu Agricultural University, China
Copyright © 2021 Cui, Wang, Duan, Xu, Wang, Zhang and Ma. This is an open-access article distributed under the terms of the Creative Commons Attribution License (CC BY). The use, distribution or reproduction in other forums is permitted, provided the original author(s) and the copyright owner(s) are credited and that the original publication in this journal is cited, in accordance with accepted academic practice. No use, distribution or reproduction is permitted which does not comply with these terms.
*Correspondence: Chunhui Ma, bWFjaHVuaHVpMjAwMEAxNjMuY29t
†These authors have contributed equally to this work