
94% of researchers rate our articles as excellent or good
Learn more about the work of our research integrity team to safeguard the quality of each article we publish.
Find out more
ORIGINAL RESEARCH article
Front. Plant Sci. , 04 August 2021
Sec. Plant Systematics and Evolution
Volume 12 - 2021 | https://doi.org/10.3389/fpls.2021.712064
 Neng Wei1,2,3,4
 Oscar A. Pérez-Escobar2
 Paul M. Musili5
 Wei-Chang Huang6
 Jun-Bo Yang7
 Ai-Qun Hu2
 Guang-Wan Hu1,3,8
 Olwen M. Grace2*
 Qing-Feng Wang1,3,8*
With c. 2,000 species, Euphorbia is one of the largest angiosperm genera, yet a lack of chloroplast genome (plastome) resources impedes a better understanding of its evolution. In this study, we assembled and annotated 28 plastomes from Euphorbiaceae, of which 15 were newly sequenced. Phylogenomic and comparative analyses of 22 plastome sequences from all four recognized subgenera within Euphorbia revealed that plastome length in Euphorbia is labile, presenting a range of variation c. 42 kb. Large-scale expansions of the inverted repeat (IR) region were identified, and at the extreme opposite, the near-complete loss of the IR region (with only 355 bp left) was detected for the first time in Euphorbiaceae. Other structural variations, including gene inversion and duplication, and gene loss/pseudogenization, were also observed. We screened the most promising molecular markers from both intergenic and coding regions for phylogeny-based utilities, and estimated maximum likelihood and Bayesian phylogenies from four datasets including whole plastome sequences. The monophyly of Euphorbia is supported, and its four subgenera are recovered in a successive sister relationship. Our study constitutes the first comprehensive investigation on the plastome structural variation in Euphorbia and it provides resources for phylogenetic research in the genus, facilitating further studies on its taxonomy, evolution, and conservation.
Euphorbia is the largest genus in the family Euphorbiaceae (i.e., the spurge family), comprising some 2,000 species with a nearly global distribution pattern (Horn et al., 2012, 2014; Webster, 2014). Many Euphorbia species are key components of tropical ecosystems worldwide (Yang et al., 2012; Dorsey et al., 2013; Peirson et al., 2013) and its taxonomy is notoriously challenging due to the persistent homoplasy of their morphological characters, species diversity, and its wide distribution (Webster, 1967; Steinmann and Porter, 2002; Bruyns et al., 2006). Molecular phylogenetic studies have improved the delimitation of the Euphorbia as well as its infrageneric classification. Here, only Euphorbia has been consistently placed in the subtribe Euphorbiinae, for several traditionally segregated genera including Chamaesyce, Cubanthus, Elaeophorbia, Endadenium, Monadenium, Pedilanthus, Poinsettia, and Synadenium are now understood to be deeply nested within Euphorbia (Steinmann and Porter, 2002; Bruyns et al., 2006; Steinmann et al., 2007; Zimmermann et al., 2010; Horn et al., 2012).
Four subgenera, subg. Esula, Athymalus, Chamaesyce, and Euphorbia have been gradually recovered in Euphorbia, although the phylogenetic relationship among them has been in flux (Steinmann and Porter, 2002; Bruyns et al., 2006, 2011; Park and Jansen, 2007; Zimmermann et al., 2010; Horn et al., 2012). Subsequently, the molecular phylogenetic classification for these four subgenera into a global concept of Euphorbia based on the nuclear-ribosomal ITS and the plastid ndhF and matK loci has been established (Yang et al., 2012; Dorsey et al., 2013; Peirson et al., 2013; Riina et al., 2013).
Whole chloroplast genome (plastome) sequences have become a useful tool with which to estimate the phylogenetic relationships of plant lineages (Barrett et al., 2016; Hassemer et al., 2019; Li et al., 2019), due to the relative ease at which plastid genomes can be sequenced. In particular, whole plastome phylogenomics is an increasingly frequent approach for species identification, and population genetic analyses (Yang et al., 2013; Gitzendanner et al., 2018), even in very large genera, such as Begonia (Harrison et al., 2016). However, the absence of plastid genomic datasets has prevented to date the construction of such phylogenomic frameworks that could help to test the current subgeneric relationships within Euphorbia.
Plastomes are generally highly conserved, in terms of gene content and order, size and structural rearrangement (Raubeson and Jansen, 2005; Wicke et al., 2011; Ruhlman and Jansen, 2014), especially at lower taxonomy levels (genus and species). They are often composed of three characteristic regions, namely the Large Single Copy (LSC), the Small Single Copy (SSC), and the Inverted Repeats (IR), the latter present in two copies and interspaced by the SSC (de Vries and Archibald, 2018). Dramatic reductions in genome size and gene content have been characterized in non-photosynthetic parasitic plant lineages such as Cuscuta (Braukmann et al., 2013), Pilostyles (Bellot and Renner, 2016), and Hydnora (Naumann et al., 2016), largely due to the disablement of photosynthesis-related genes, as well as the transcription and translation of genes (de Pamphilis and Palmer, 1990; Morden et al., 1991; Wicke and Naumann, 2018). Plastome size variations are mainly reflected by the expansion or contraction of the IR regions (Wicke et al., 2011; Zhu et al., 2016). Large-scale expansions occur by transferring numerous genes from the Single Copy (SC) region into the IR regions and have been observed in disparate obligately photosynthetic lineages, such as Asarum (Aristolochiaceae; Sinn et al., 2018), Pelargonium (Geraniaceae; Weng et al., 2017), Plantago (Plantaginaceae; Asaf et al., 2020), and Trochodendraceae (Sun et al., 2013). At the opposite extreme, most, or even all, of the IR region may be lost, as is known in conifers (Lin et al., 2010; Wu et al., 2011), Cactaceae (Sanderson et al., 2015), Fabaceae (Choi et al., 2019), Geraniaceae (Guisinger et al., 2011), Passifloraceae (Cauz-Santos et al., 2020), and the Lophopyxidaceae-Putranjivaceae clade (Jin et al., 2020a).
Euphorbia species have been used in different aspects of human’s activities, due to their highly ornamental and aesthetic values (Berry and Riina, 2007), their important roles in traditional medicine (Ernst et al., 2015, 2019), their usages in pharmaceutical industries (Shi et al., 2008), as well as being promising biofuel sources (Patan et al., 2018). Although, plastome sequences of Euphorbia have been sporadically reported in recent years (Horvath et al., 2018; Zhang et al., 2019; Jiang et al., 2020; Khan et al., 2020; Alqahtani and Jansen, 2021), a comprehensive comparative plastome analysis has not been considered until now.
To help addressing the genomic data-gap in Euphoria, in this study, we newly sequenced, assembled, and annotated plastomes of Euphorbia species based on a taxonomically representative sampling from the four subgenera. We analyzed these data in a comparative genomic framework within Euphorbia (1) to explore plastome structure variations; (2) to identify promising molecular markers for future study; and (3) to provide a robust phylogenomic backbone for the genus.
The plastome sequences of 28 accessions in Euphorbiaceae were sampled, of which 15 plastomes were sequenced for this study and a further 13 published whole-plastome sequences were obtained from GenBank (Supplementary Table S1). Our sampling included 22 species in the genus Euphorbia, representing all four subgenera: subg. Esula (five species sampled), subg. Athymalus (four species sampled), subg. Chamaesyce (five species sampled), and subg. Euphorbia (eight species sampled). Except for Cubanthus and Poinsettia, other traditionally segregated genera in Euphorbiinae, namely Chamaesyce, Elaeophorbia, Endadenium, Monadenium, Pedilanthus, and Synadenium, were included in the sampling. A further two species from tribe Hippomaneae in the same subfamily Euphorbioideae were incorporated. In addition, four species from the subfamily Acalyphoideae and Crotonoideae were also included as outgroups, based on the previous phylogenetic studies of Euphorbiaceae (Wurdack et al., 2005; Tokuoka, 2007).
Plant material was obtained from silica-dried leaves collected from plants in natural populations, or from living collections cultivated in botanical gardens (Supplementary Table S1). Total genomic DNA was extracted from fresh or silica-dried leaves with the Mag-MK Plant Genomic DNA Extraction Kit (Sangon Biotech Co., Shanghai, China) based on the manufacturer’s protocol.1 DNA quality was assessed by electrophoresis on a 1% agarose gel. Besides, DNA quality was also evaluated using the Qubit 2.0 Fluorometer (Life Technologies, CA, United States). Short inserts of about 350 bp were used to construct paired-end 150-bp sequencing libraries using the NEBNext Ultra II DNA Library Prep Kit for Illumina (NEB, United States) following the manufacturer’s protocol.2 Libraries were sequenced on a flow cell using an Illumina HiSeq2000 sequencing platform (Illumina, San Diego, CA, United States). In total, three duplicate libraries were constructed and sequenced separately using an Illumina HiSeq2000 genome analyzer sequenced at Beijing Genomics Institute (Shenzhen, China).
The quality of the raw sequence reads was assessed in the program FastQC v.0.11.8.3 The raw reads were filtered using the software Trimmomatic v.0.33 (Bolger et al., 2014) by removing low-quality bases with PhredScore < 30 and adapters, and reads with length < 50 bp. The remaining high-quality reads were assembled into complete plastome using GetOrganelle (Jin et al., 2020b) under default settings, with kmers: -k 21,35,45,55,65,75,85,95,105,115,121. Finally, the resulting scaffolds and their connectivity were visualized in the software Bandage 0.7.1 (Wick et al., 2015), and the complete linear plastomes were produced.
The linear plastome sequences were annotated by PGA (Qu et al., 2019) and GeSeq (Tillich et al., 2017), respectively. To avoid possible annotation errors, start/stop codons, and exon/intron boundaries were manually checked, using Geneious 8.0.2 (Kearse et al., 2012) and the reference plastid genome of Euphorbia esula from Horvath et al. (2018) available from the NCBI repository (NC_033910.1). All annotated plastome accessions were prepared with GB2sequin (Lehwark and Greiner, 2019) for GenBank submission (Supplementary Table S1). Graphical maps of the linear plastomes were plotted using the online program OGDRAW (Greiner et al., 2019). To assess the quality of the newly assembled plastomes, we aligned the trimmed Illumina reads against each of these new assemblies. Such a procedure also enabled us to confirm the plastome structure. This procedure was conducted by the pipeline PALEOMIX v.1.3.2 (Schubert et al., 2014), using the BAM pipeline and BWA-backtrack algorithm (Li and Durbin, 2009). Lastly, the IR/SC region boundaries of individual with some distinct plastome arrangements were confirmed by primer design, PCR, and Sanger sequencing. The PCR experimental conditions, and the newly designed primers and their location on IR/SC region boundaries are available in Supplementary File S2.
To render the comparative analyses of plastomes time tractable, we chose nine samples from the 22 assembled plastid genomes, representing the four subgenera of Euphorbia, and using E. esula as a reference. To detect and identify possible rearrangements, one copy of IR region was removed from the plastome sequences prior to alignment in Progressive Mauve (Darling et al., 2010) implemented in Mauve v.2.4.0 (Darling et al., 2004). The boundaries of the LSC, SSC, and IRs were visualized in IRscope (Amiryousefi et al., 2018) to identify possible expansions or contractions in the IR regions. Subsequently, plastome sequences were compared using the program mVISTA (Frazer et al., 2004) with Shuffle-LAGAN alignment mode (Brudno et al., 2003) to align the annotated plastomes.
Three types of repetitive sequences, consisting of simple sequence repeats (SSRs), tandem repeats, and dispersed repeats, were identified across the nine Euphorbia plastomes. Firstly, SSRs were detected using the web application MISA v.2.1 (Beier et al., 2017). Thresholds for a minimum number of repeat units were set as follows: 10 for mono-nucleotide, six for di-nucleotide, five for tri-nucleotide, tetra-nucleotide, penta-nucleotide, and hexa-nucleotide SSR. Then, tandem repeats were detected using the Tandem Repeats Finder v.4.0.9 (Benson, 1999). Following the protocol of Xu and Wang (2021), the maximum period size, minimum alignment score to report repeat, maximum TR array size (bp, millions), alignment parameters of match, mismatch, indels, were set to 500, 80, two, two, seven, and seven, respectively. Lastly, REPuter (Kurtz et al., 2001) was used to identify four types of dispersed repeat elements (Forward, Reverse, Complement, and Palindromic) based on the criteria: minimum repeat size equal to 30 bp, and Hamming distance equal to three, following the setting by Cauz-Santos et al. (2020).
Sequence variability (SV) was evaluated among the 22 Euphorbia plastome sequences. We extracted the sequences of intergenic and intronic loci. The loci flanked by the same genes/exons were identified as syntenic, while the loci with lengths < 150bp were removed. Following Shaw et al. (2014), we calculated the SV for each of the syntenic loci. The formula is as follows: SV = (number of nucleotide mutations + the number of indel events)/(number of conserved sites + the number of nucleotide mutations + the number of indel events). DnaSP v.6 (Lanfear et al., 2017) was used to count the number of nucleotide mutations and indel events.
The phylogenetic informativeness (PI) of each protein-coding gene was assessed with the online program PhyDesign (Lopez-Giraldez and Townsend, 2011) using the HyPhy substitution rates algorithm (Pond et al., 2005) for DNA sequences, with the default settings. Following Lopez-Giraldez and Townsend (2011), we used the per-site profiles approach to reduce phylogenetic noise and to avoid the confounding influence of gene length. Maximum likelihood (ML) trees were inferred using the concatenated alignments of 76 coding sequences (CDSs) from 28 Euphorbiaceae accessions representing 22 Euphorbia species. Prior to inputting the ML trees into PhyDesign, ML trees were converted to rooted ultrametric trees using the “chronos” function in the ape package (Paradis et al., 2004) implemented in R v.4.0.2.4 Trees were calibrated with an arbitrary time scale (tips assigned to time 0 and root to 1). The converted relative-time ultrametric tree and alignment of concatenated 76 CDSs were used as input files in PhyDesign to calculate phylogenetic informativeness values (PIV).
Phylogenetic analyses of 28 taxa of Euphorbiaceae were performed, using both ML and Bayesian inference (BI) on four data matrices: the whole plastome, 76 CDSs, and top 10 and top five informative CDSs loci (selected based on the above PIV). The latter three data matrices (76 CDSs, top 10 and five informative CDSs) were extracted in Phylosuite v.1.2.1 (Zhang et al., 2020). The sequences of these four data matrices were aligned by MAFFT v.7.22 (Katoh and Standley, 2013) using the default settings. To ensure the efficiency and quality of whole plastome alignments, only one copy of the IR region was included, since the two IR copies of the plastome sequences in this study were identical.
TrimAl v.1.2 (Capella-Gutierrez et al., 2009) was used to trim each alignment sequence with automatd1 mode to reduce potentially poorly aligned regions. The trimmed alignment sequences were visually examined in Geneious v.8.0.2 (Kearse et al., 2012) and manually adjusted if necessary. Each of the trimmed alignments for all except, the whole plastome data matrix was then concatenated in Phylosuite v.1.2.1 (Zhang et al., 2020). Under the corrected Akaike Information Criterion (AICc), the best-fit model (GTR + F + I + G4) for the whole plastome dataset was estimated in ModelFinder (Kalyaanamoorthy et al., 2017). Using PartitionFinder2 (Lanfear et al., 2017), the best-fit partitioning schemes and evolutionary models were identified under the AICc for the three data matrices of CDSs (Supplementary Files S3–S5).
We inferred ML phylogenetic relationships based on the four datasets using IQ-TREE v.1.6.8 (Nguyen et al., 2015), under the Ultrafast bootstrap (Guindon et al., 2010; Minh et al., 2013) with 10,000 bootstrap replicates. We used MrBayes 3.2.6 (Ronquist et al., 2012) to infer phylogenies for the same four datasets. The Markov Chain Monte Carlo (MCMC) analyses were run for 10 million generations, sampling every 1,000 generations. Stationarity was deemed to be reached when the split frequencies (ASDF) SD deviation remained below 0.01. Besides, stationarity was also determined in Tracer 1.7 (Rambaut et al., 2018). The first 25% of sampled trees were discarded as burn-in. Then remaining trees were used to construct a majority-rule consensus tree and calculate the posterior probability. All phylogenetic analyses were hosted on the CIPRES Science Gateway.5 The final phylogenetic results were visualized and processed using the iTOL tool (Letunic and Bork, 2007).
The Illumina sequencing generated a total of 26,451,174–49,333,842 paired-end quality-filtered reads for each individual, with average coverage ranging from 107.5 to 512.7 (Supplementary Table S1). The summary of the 22 Euphorbia plastomes assembled and annotated is presenting in Table 1. The majority displayed the typical quadripartite structure composed of one LSC, one SSC, and two IRs. However, their length varied considerably, ranging from 136,630 bp in Euphorbia neogillettii to 178,650 bp in Euphorbia schlechtendalii. The LSC region ranged from 83,278 bp in E. neogillettii (subg. Euphorbia) to 94,275 bp in E. schlechtendalii (subg. Chamaesyce), whereas the SSC region varied from 3,360 bp in Euphorbia tithymaloides (subg. Euphorbia) to 41,645 bp in E. neogillettii. Of these, E. neogillettii represented the shortest length of Euphorbia plastome, with only the trnI and 5' rpl23 genes left in the IR region (355 bp in length), as contrasted to an IR of 43,573 bp in E. schlechtendalii. All species showed a moderate GC content, 35.1–35.8%, except for E. neogillettii, which had a noticeably low value (33.5%).
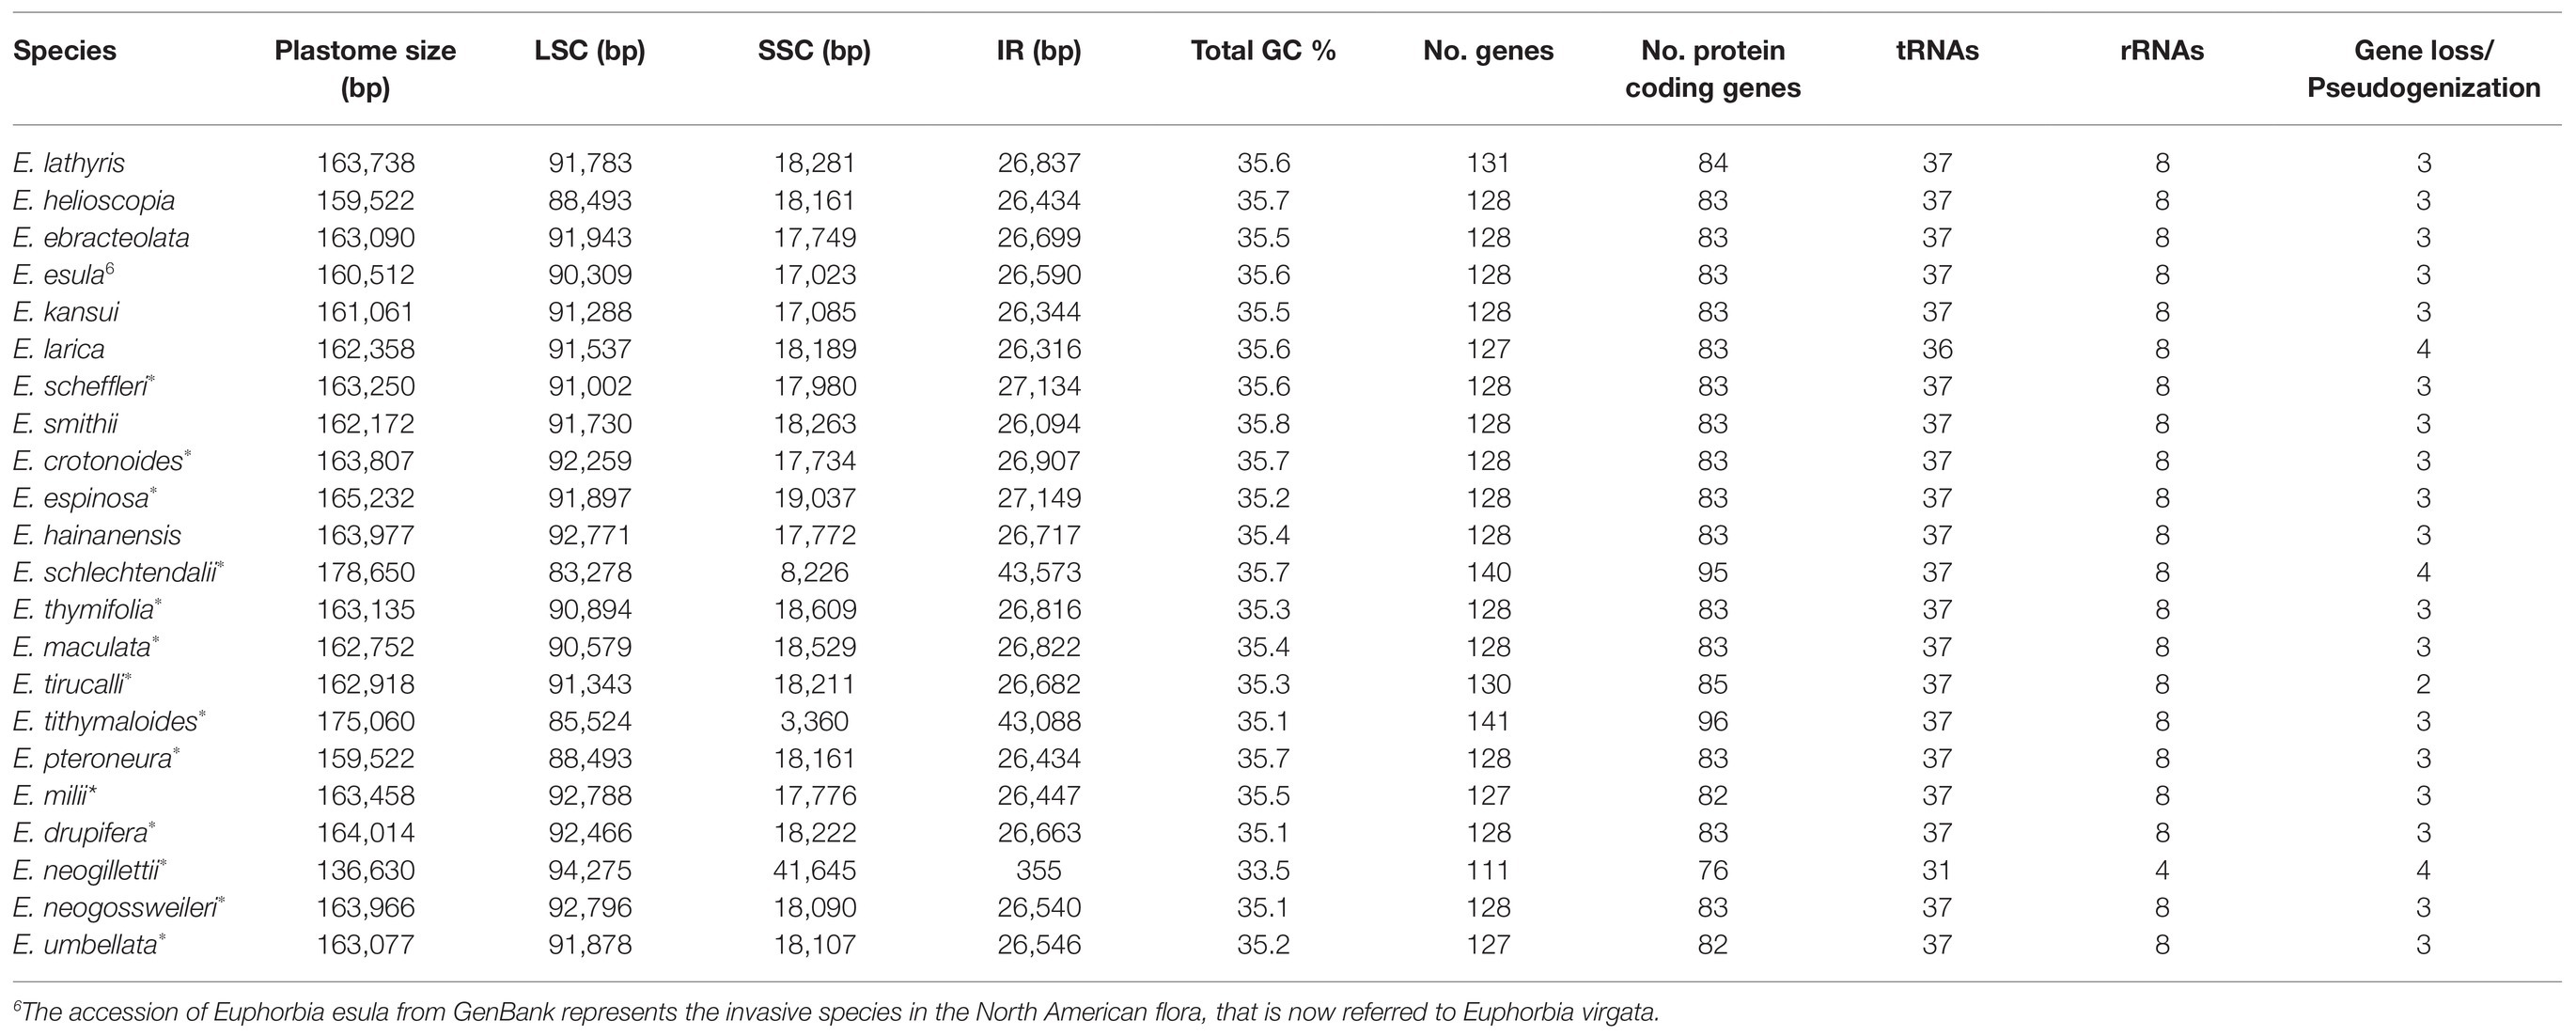
Table 1. Summary of the 22 Euphorbia plastome assembled and annotated (*indicates newly sequenced herein; - indicates the unavailable information).
The 22 Euphorbia plastomes contained between 111 and 141 genes and this variation was observed across the CDSs, tRNAs, rRNAs, and genes identified, as well as in gene duplication and losses/pseudogenizations. Plastid genes involved in different biological processes were annotated in different functional categories (Figure 1). Due to duplicated nature of the IR regions, up to 30 genes were found to have two copies, including CDSs, tRNAs, and rRNAs. The number of CDSs varied from 76 in E. neogillettii to 96 in E. tithymaloides, whereas the number of tRNAs was 37 in most species, with the exception of E. neogillettii, and Euphorbia larica, which lost one copy of six tRNA genes (trnA, trnI, trnL, trnN, trnR, and trnV) and contained only 36 tRNAs, with the trnH gene lost, respectively. All species were found to have eight rRNAs, except E. neogillettii (four rRNAs only).
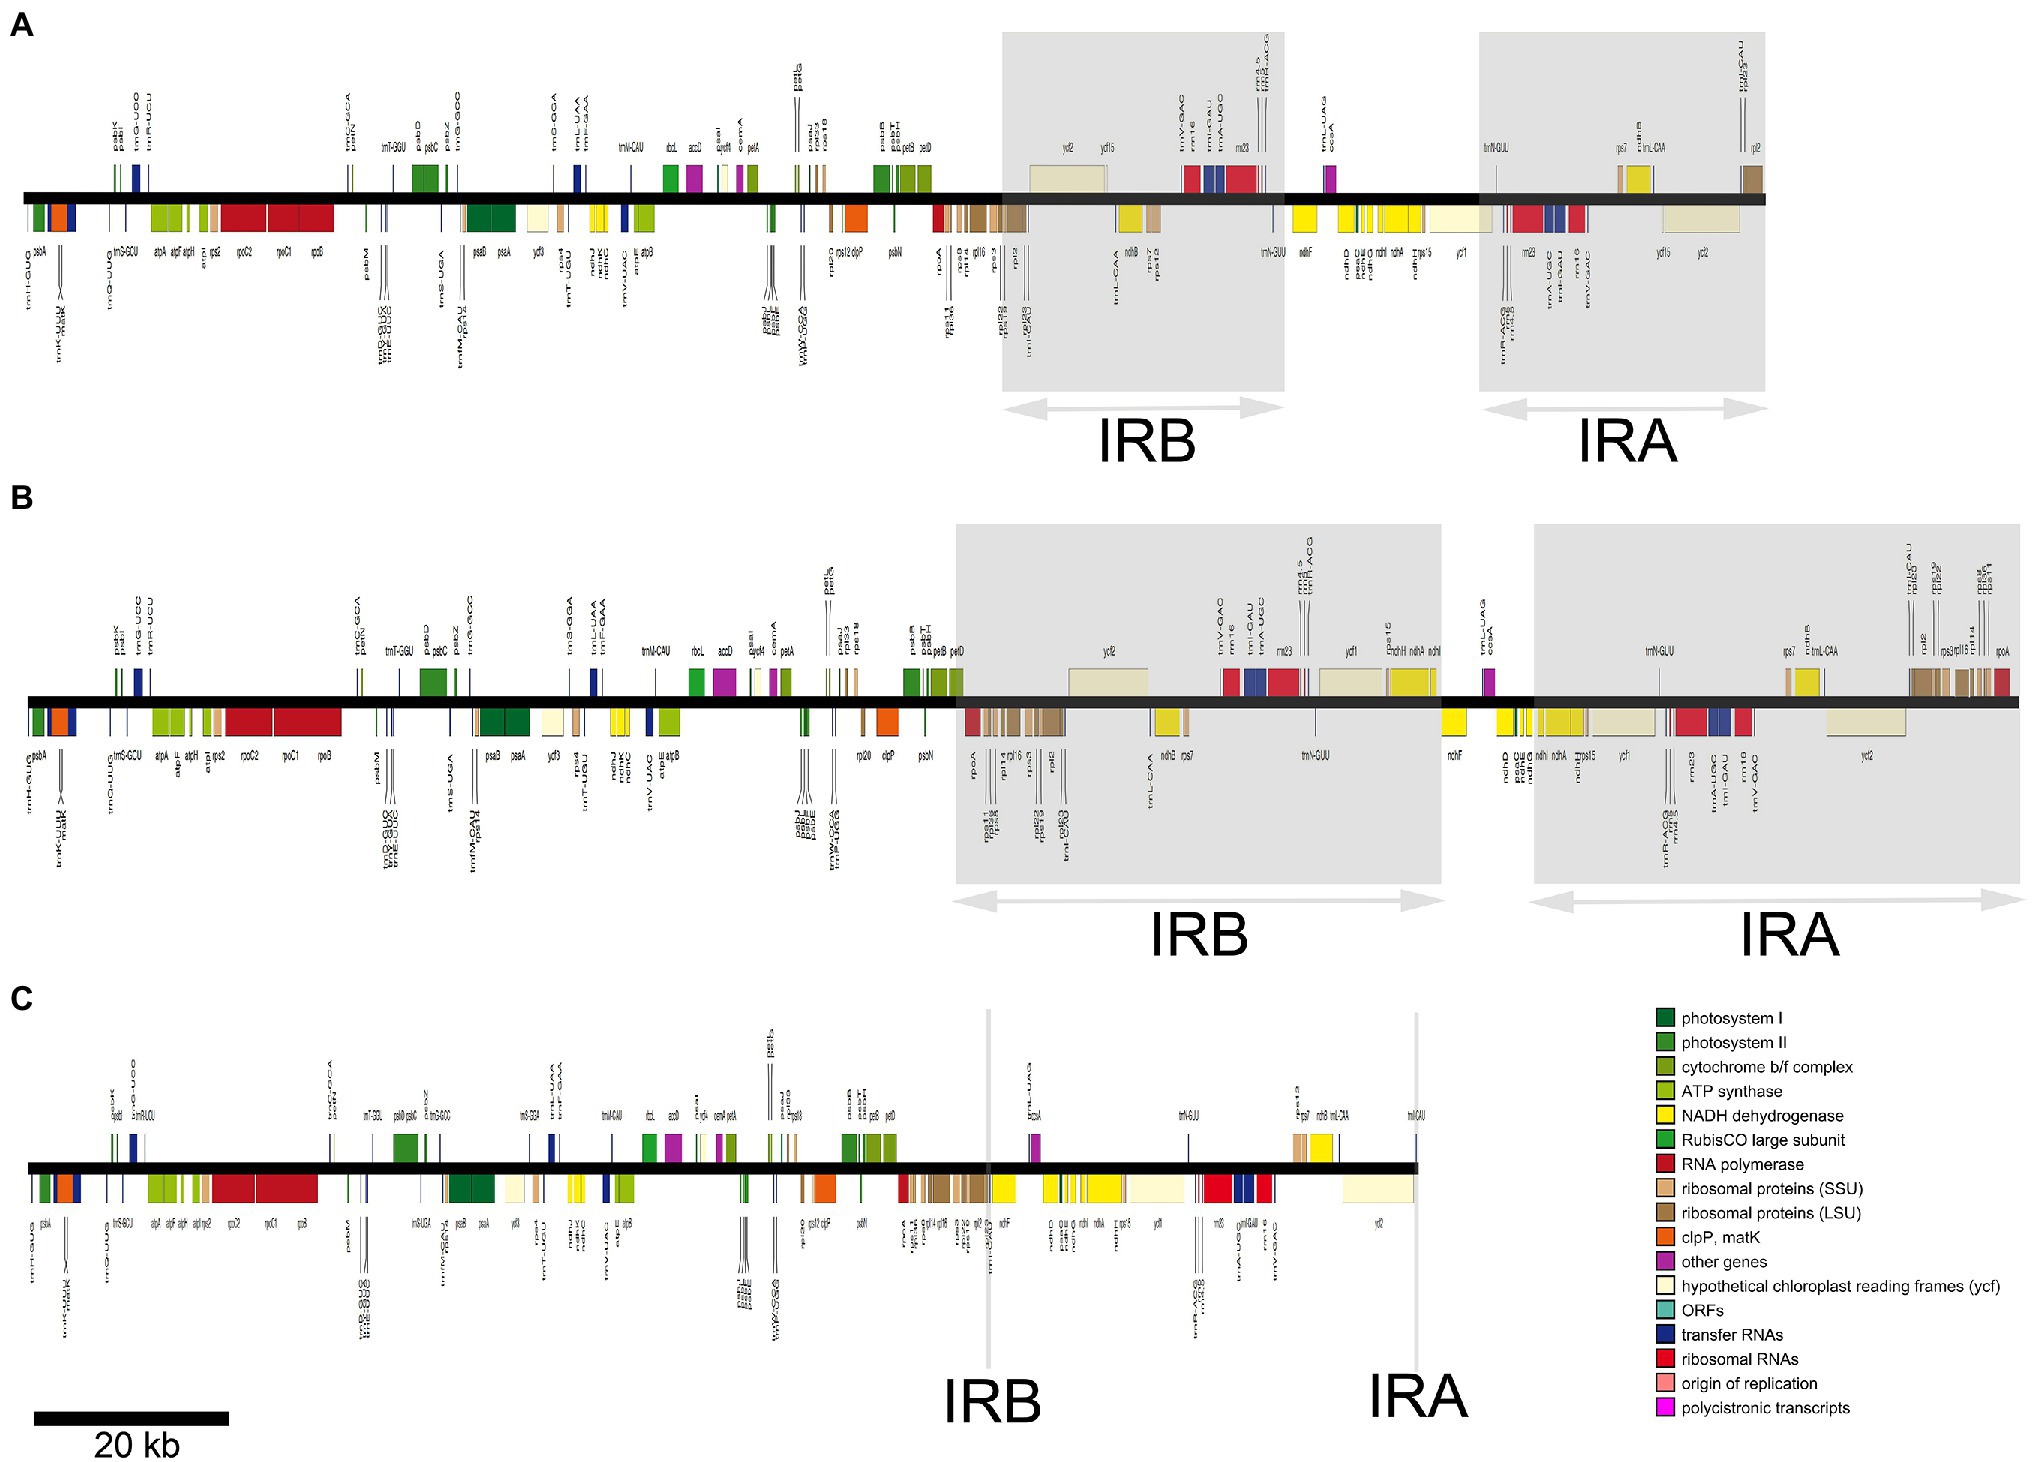
Figure 1. The plastid genomes of three representative Euphorbia species represented in linearized form, illustrating the large-scale expansion and contractions of the inverted repeat (IR) regions. Genes belonging to different functional categories are depicted by colored boxes proportional to the length of genes. Gray areas indicate IR region A and region B (IRA and IRB). Linear maps are drawn to the scale as indicated by the bar at the bottom left. The plastid chromosomes of (A–C) indicate E. esula, Euphorbia schlechtendalii, and Euphorbia neogillettii, respectively.
The Mauve aligner identified six locally collinear blocks (LCBs), four of which were involved in large-scale rearrangements (Figure 2). These rearrangements included relocations and reversion of collinear blocks found in three of the studied species (E. neogillettii, E. schlechtendalii, and E. tithymaloides). The second block (rpoA–rpl16) in E. schlechtendalii, was relocated from the posterior part of the LSC region to the IR region. The third block (rps3–rps19) in E. tithymaloides and E. schlechtendalii, was relocated from the typical end part of the LSC region to the IR region. An inversion in the fourth block (ndhF–trnL) in the SSC region was detected in E. tithymaloides. Lastly, the sixth block (rpl23–rpl2) in E. neogillettii was inverted and relocated from the IR to the LSC region.
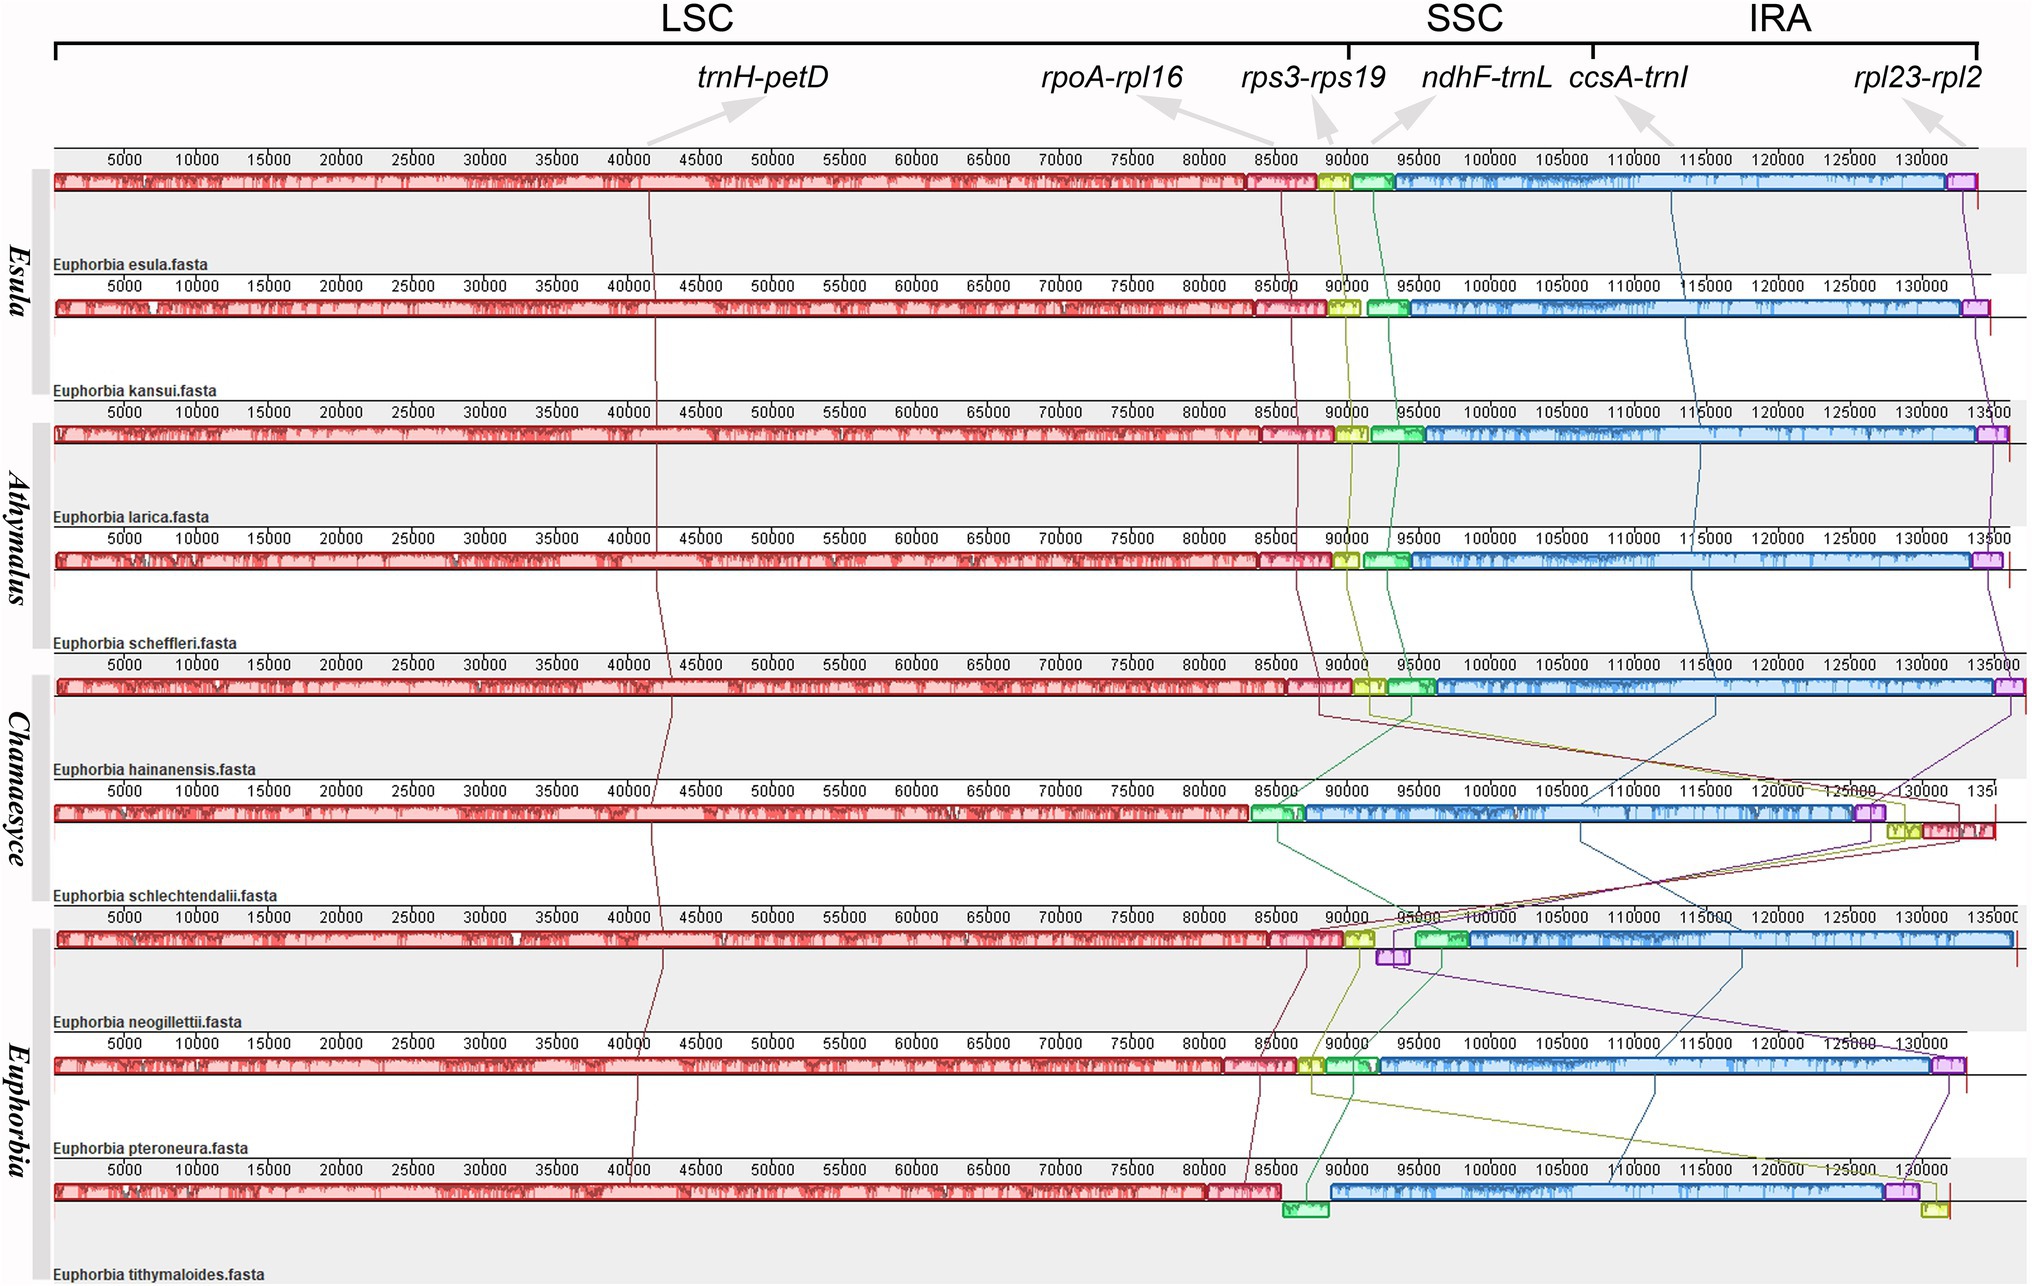
Figure 2. Structural alignment of Euphorbia plastomes representing the four subgenera Esula, Athymalus, Chamaesyce, and Euphorbia. The inverted repeat region B (IRB) was removed from the analysis (see Methods). Six colored blocks represent locally collinear blocks (LCBs), and the blocks connected by lines indicate homology. The terminal genes of each LCB are marked at the top. Blocks below the horizontal line indicate inversions relative to the reference (E. esula). The height of the colored region within a block reflects the average sequence identity relative to the reference. Numbers on the upper x-axis are genome map coordinates in kilobases (Kb). Vertical lines after species names, from top to bottom, indicate each subgenus.
The nine Euphorbia plastomes with variable SC/IR boundaries and differing IR regions (Figure 3) can be recognized in two groups: non-large-scale IR expansions and contractions (Group A) and large-scale IR expansions and contractions (Group B). Group B is represented by E. schlechtendalii, E. neogillettii, and E. tithymaloides, while Group A is represented by the remaining six accessions. The LSC/IRB boundary in Group A was consistently located in rpl22, rps19, and rps19–rpl2 but variable in Group B. It was found in petD, rpl23, and rpl16, in E. schlechtendalii, E. neogillettii, and E. tithymaloides, respectively. The IRB/SSC boundary in Group A was distributed in trnN–ndhF, ndhF, and in Group B in ndhF, trnI–ndhF, and ccsA–trnL, respectively. The SSC/IRA boundary in Group A was stable within ycf1 but was very variable in Group B, in ndhG–ndhI, ycf2–trnI, and ndhF–ccsA, respectively. The IRA/LSC boundary in Group A was located in rpl2–trnH, rpl2–psbA, and rps19–trnH, and in Group B in rpoA–trnH, trnI–trnH, and rps3–trnH, respectively. Moreover, the PCR products based on primer design around the IR/SC region boundaries were successfully sequenced. Thus, as to the species in Group B with large-scale IR expansions and contractions, their IR/SC region boundaries in the assembly and annotation were verified.
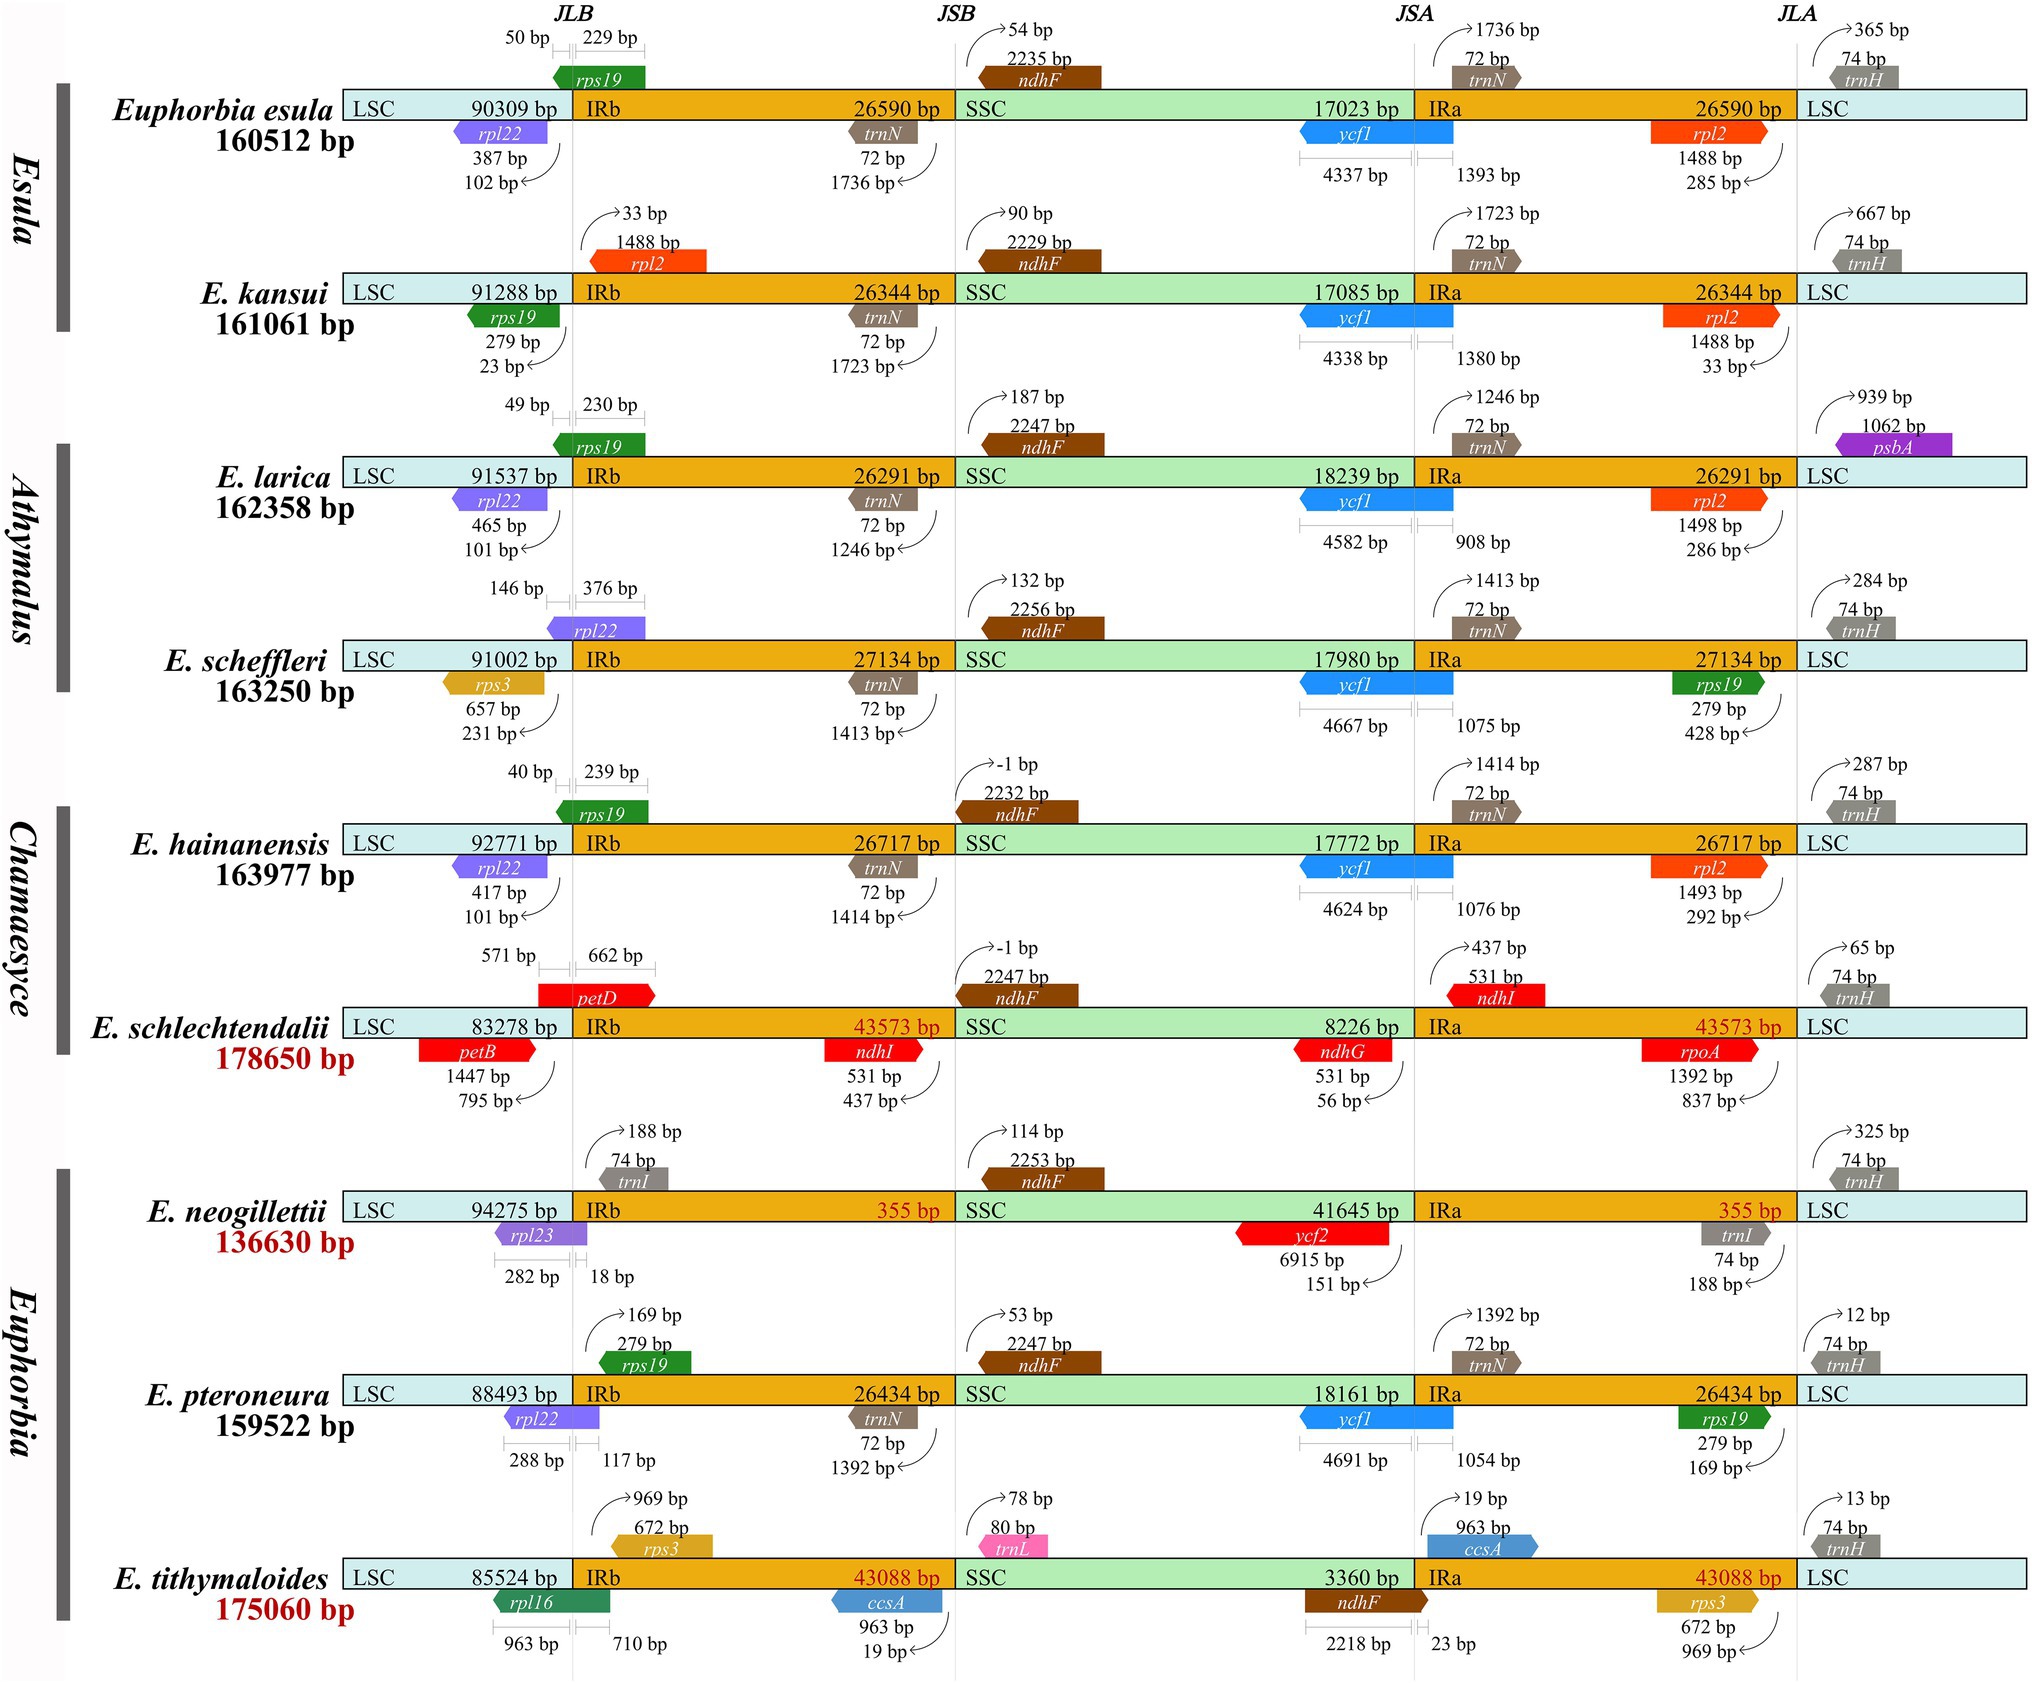
Figure 3. Comparison of IR-single copy (SC) boundary positions across plastomes of nine Euphorbia species in four subgenera. Colored boxes indicate gene structures and arrows indicate the direction of genes (pointing to the left: negative strand; to the right: positive strand). Gaps between the genes and the boundaries are indicated by the base lengths (bp). Abbreviations denote junction sites of the plastid genome, JLB (LSC/IRB), JSB (IRB/SSC), JSA (SSC/IRA), and JLA (IRA/LSC). LSC, SSC, IRA, and IRB indicate large single copy (LSC), small single copy (SSC), IR region A, and IR region B, respectively. The plastome length of species without large-scale IR expansion/contraction (Group A) is in black, whereas the plastome length of species with large-scale IR expansion/contraction (Group B) is in red.
Pairwise comparison among the Euphorbia plastomes using mVISTA with E. esula as a reference revealed both conserved and divergent regions across the plastome sequences (Figure 4). In general, the alignment uncovered sequence divergence across assemblies, suggesting that chloroplast genome sequences in Euphorbia are not highly conserved. The observed divergences occurred both in non-coding and coding regions. Sequence divergences were particularly frequent in the coding regions accD, clpP, rpl16, rpoA, rps19, ycf1, ycf2, and ycf3, as well as the ndh gene suite. Substantial divergences were detected among intergenic regions, including accD–psaI, atpH–atpI, ndhF–trnL, petA–psbJ, petN–psbM, psaA–ycf3, psbZ–trnG, rpoB–trnC, trnK–trnQ, and trnN–ndhF.
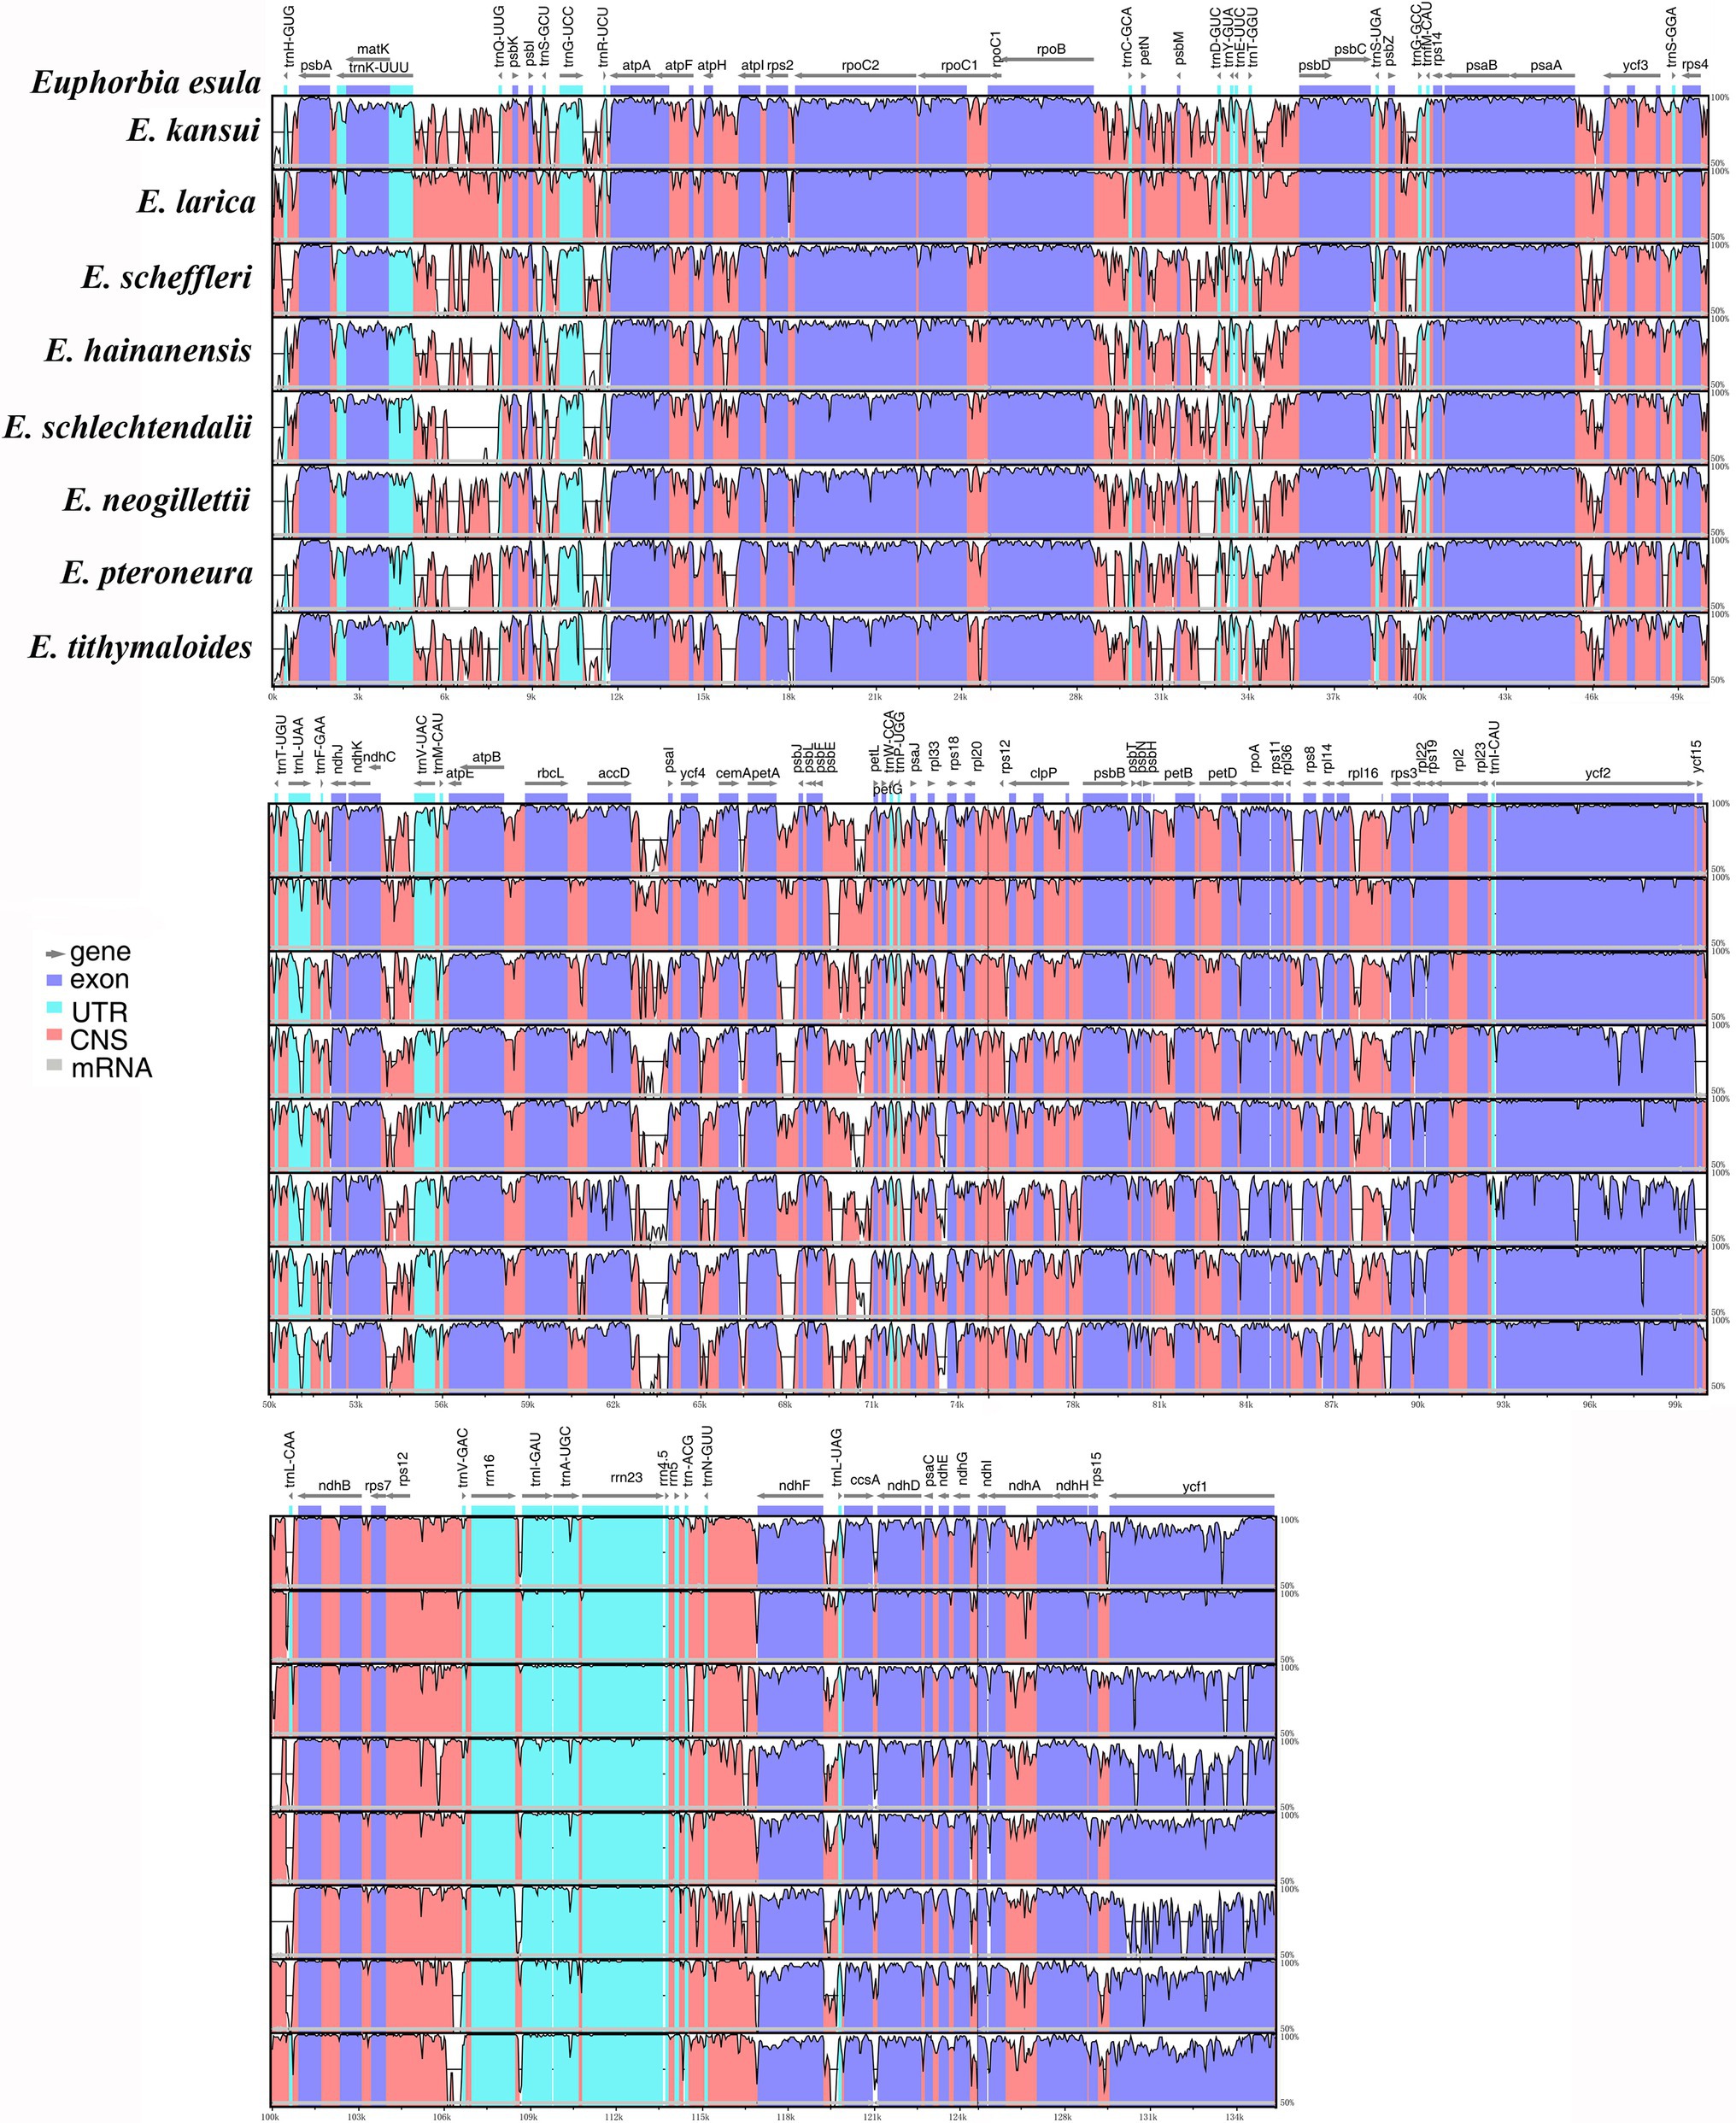
Figure 4. Visualized alignments of nine plastomes representing four subgenera of Euphorbia using mVISTA, with E. esula as the reference and only one copy of the inverted repeat regions shown. The horizontal axis represents the base sequence of the alignment, and the vertical scale represents the pairwise percent identity, ranging from 50 to 100%. Gray arrows above the alignment indicate genes and their orientations. Dark-blue boxes represent exon regions; light-blue boxes represent Untranslated Region (UTR) regions; red boxes represent non-coding sequence (CNS) regions; gray boxes represent mRNA regions.
The numbers of each three types of repetitive sequences highly diverged among the nine Euphorbia plastomes (Table 2). SSRs ranged from 71 (in E. larica) to 128 (in E. tithymaloides). The vast majority of SSRs in our analyses belonged to mono-nucleotide type, especially A and T. However, di-nucleotide (AT, TA, CT, and AG), tri-nucleotide (AAT, ATT, TAA, TAT, and TTA), and penta-nucleotide (TCTTT), were also observed. Tandem repeats ranged from 17 (E. esula) to 43 (E. schlechtendalii), and dispersed repeats differed widely from 52 (E. tithymaloides) to 228 (E. schlechtendalii), of which forward orientation and palindromic repeats constituted the majority. Overall, the total number of three types of repetitive sequences ranged from 159 (Euphorbia pteroneura) to 371 (E. schlechtendalii).
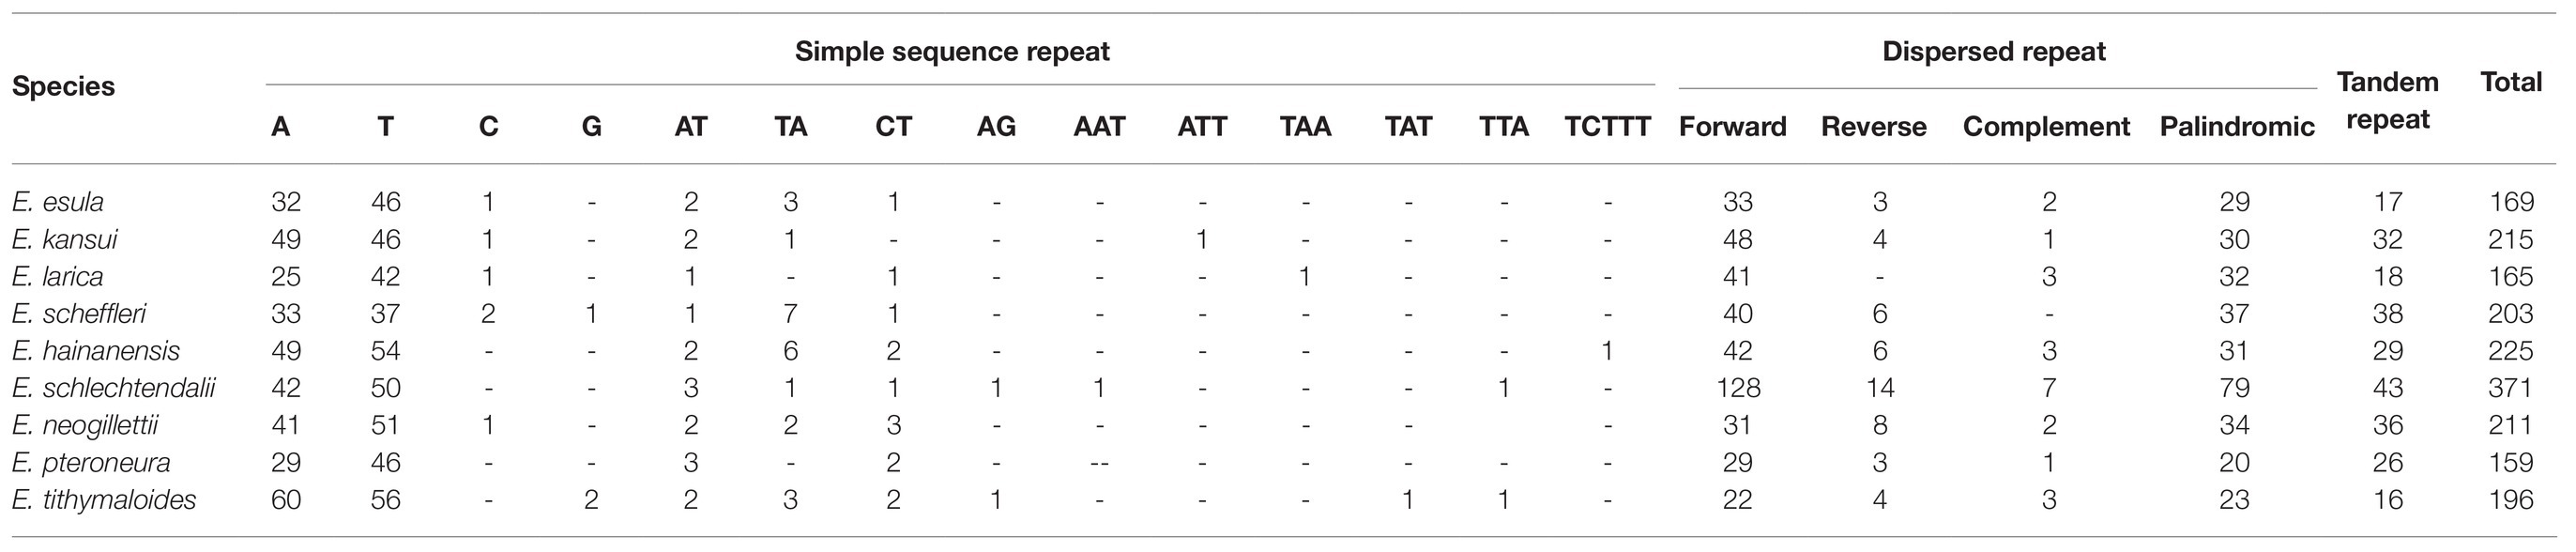
Table 2. Numbers of simple sequence repeat (SSR), tandem repeat, and dispersed repeat in the nine Euphorbia species.
In total, we identified 85 syntenic intergenic and intronic loci that were longer than 150bp (Figure 5). Specifically, they are ndhF–trnL, trnG–trnR, rpl33–rps18, trnS–trnG, accD–psaI, trnK–trnQ, psbI–trnS, psbE–petL, psbZ–trnG, and rps15–ycf1. All of these loci with the top 10 highest SV values are intergenic regions in the LSC and SSC, and none are located in the IR region.
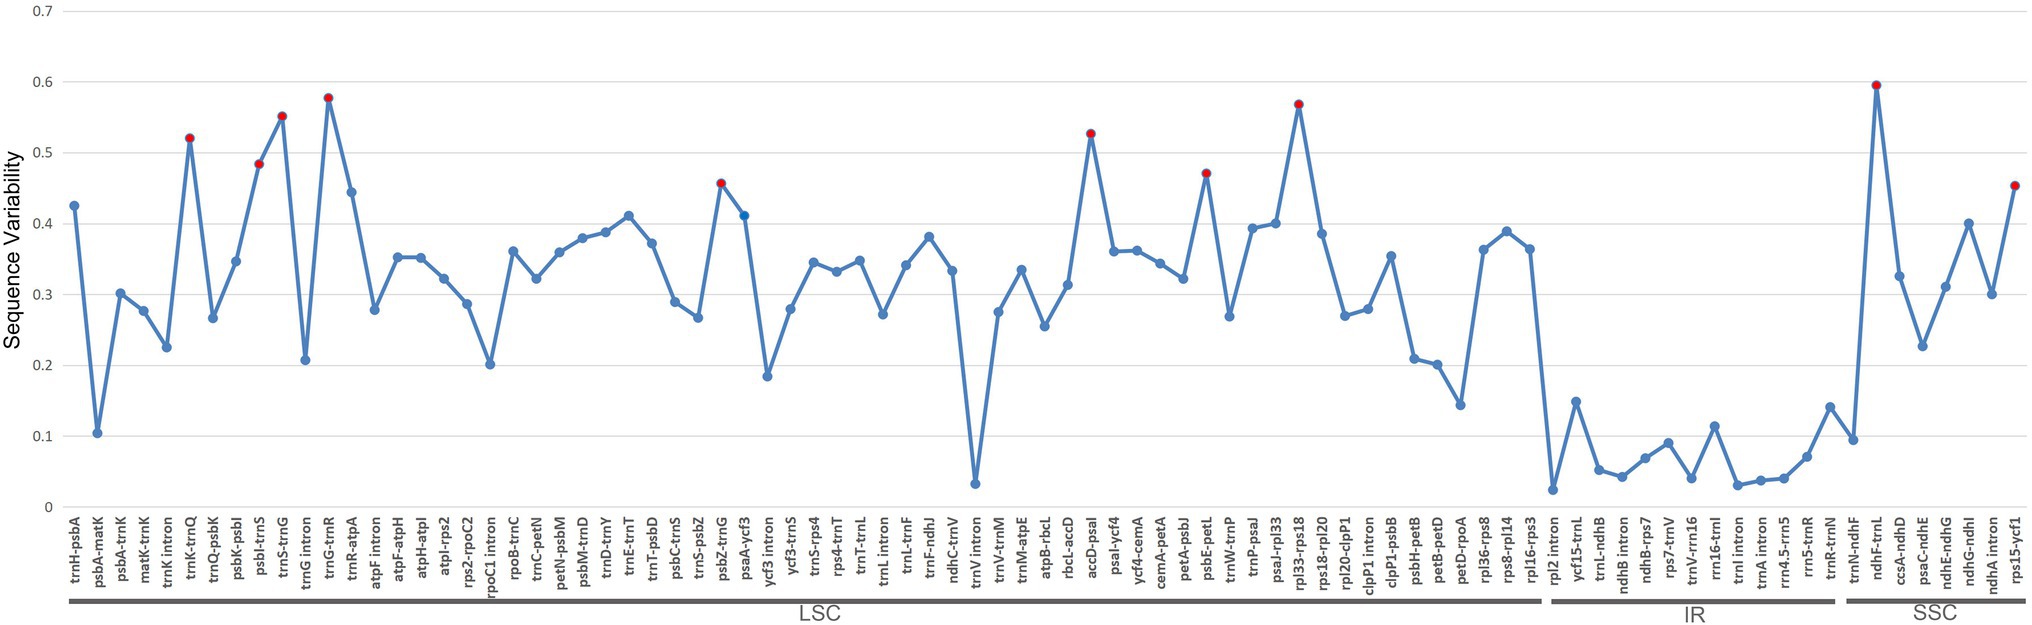
Figure 5. Sequence variability (SV) comparisons of the 85 syntenic intergenic and intronic loci in 22 Euphorbia plastome sequences. The blue lines represent the SV (%) of each locus. These syntenic loci are oriented according to their locations in the plastome. Red dots indicate the top 10 most variable syntenic intergenic and intronic loci with the highest SV.
The per-site PI profiles for the 76 CDSs from 28 Euphorbiaceae accessions were measured using PhyDesign (Figure 6; Supplementary Table S6). The ycf1 gene had the highest per-site PI among all CDSs, followed by rpl22, ndhF, rpoA, clpP, matK, rpl20, ccsA, accD, and rps3. Coding regions with high per-site PI were not necessarily CDSs with a longer length. For instance, ycf2 that has the longest gene length exhibited a comparatively low per-site PI.
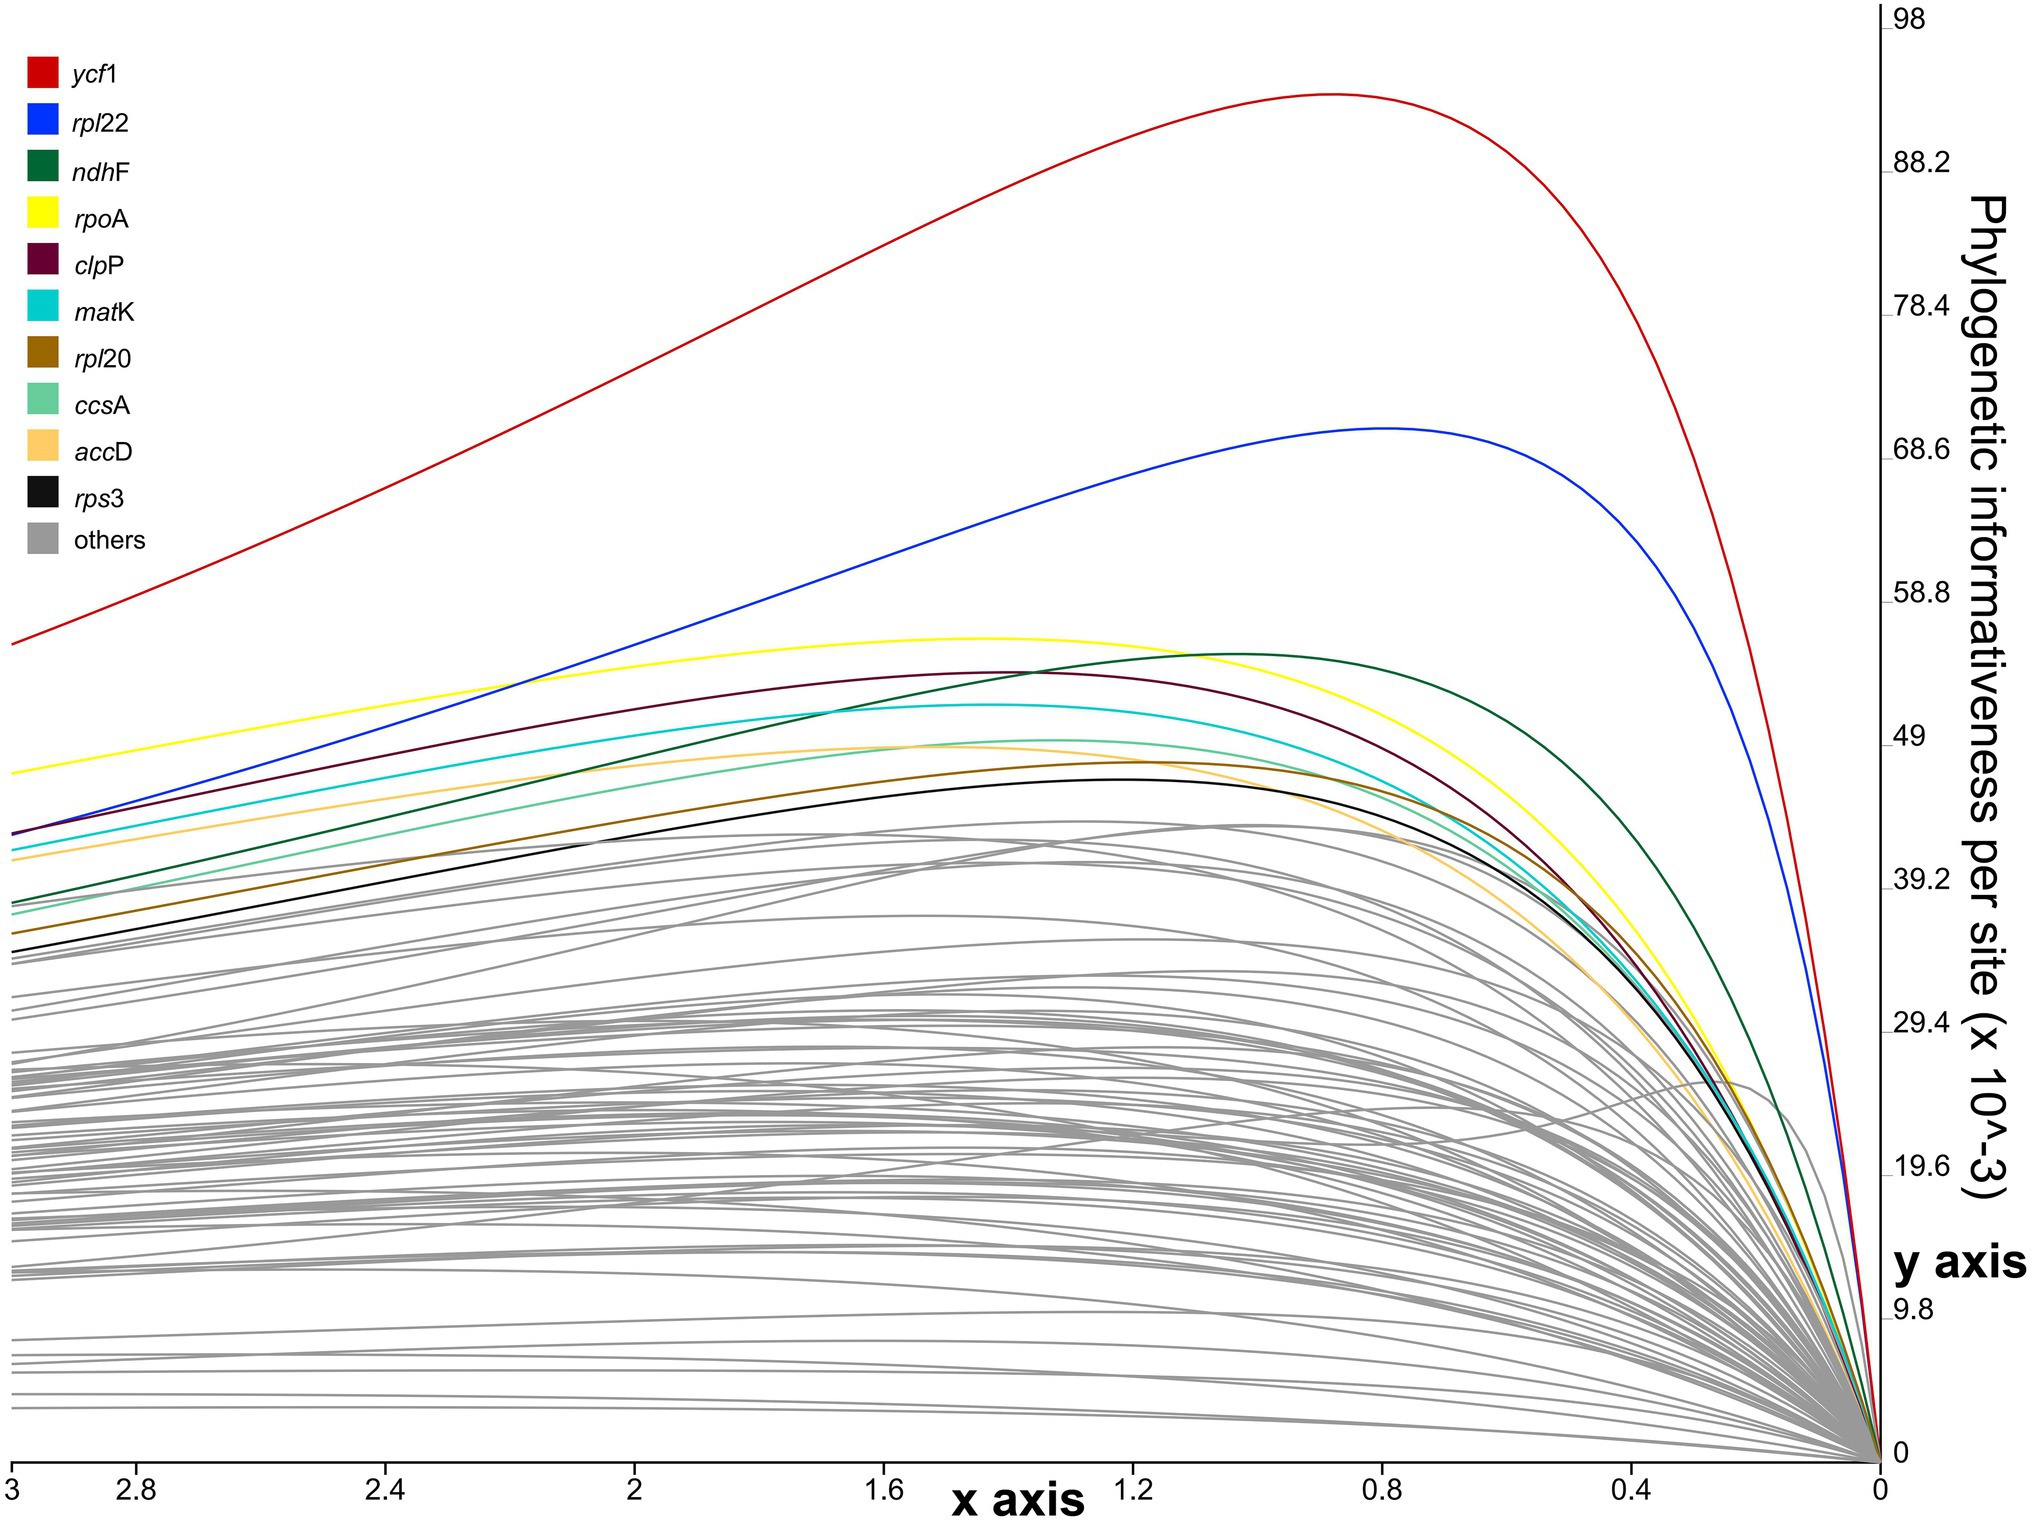
Figure 6. Phylogenetic informativeness per-site profiles of 76 coding sequences (CDSs) of Euphorbia estimated in PhyDesign. The 10 most informative CDSs are color-coded and indicated at the left. x- and y-axes represent relative-time and phylogenetic informativeness per site, respectively.
The final alignment of the whole plastome, 76 CDSs, top 10 and top five informative CDSs were 115,488, 65,896, 13,947, and 8,961 bp long, respectively (Supplementary Files S7–S10). The ML and BI analyses produced identical tree topologies (Figures 7, 8). Euphorbia and each of its four subgenera are monophyletic with 100% support (BS = 100, PP = 1.0), with six previously recognized genera (Chamaesyce, Synadenium, Monadenium, Pedilanthus, Endadenium, and Elaeophorbia) all deeply nested in Euphorbia s.s. with full support. The unpartitioned strategy (accounting for the whole plastome) and partitioned strategy (accounting for 76 CDSs and top 10 and top five informative CDSs) yielded identical phylogenetic topologies for 28 accessions of Euphorbiaceae in this study, except in subg. Athymalus. The topological discrepancies in subg. Athymalus were observed among phylogenies based on four datasets, which were represented by four accessions of subg. Athymalus (Figure 8). The phylogeny based on 76 CDSs and top 10 informative CDSs dataset generated the same topology of (E. larica, Euphorbia scheffleri; Euphorbia crotonoides, and E. smithii), whereas the topology from the whole plastome dataset was {E. larica [E. scheffleri (E. crotonoides, E. smithii)]}. Moreover, the dataset of the top 5 informative CDSs also yielded a different topology, {E. smithii [E. crotonoides (E. larica, E. scheffleri)]}. Only the phylogeny generated from 76 CDSs resolved species relationships in subg. Athymalus with full support.
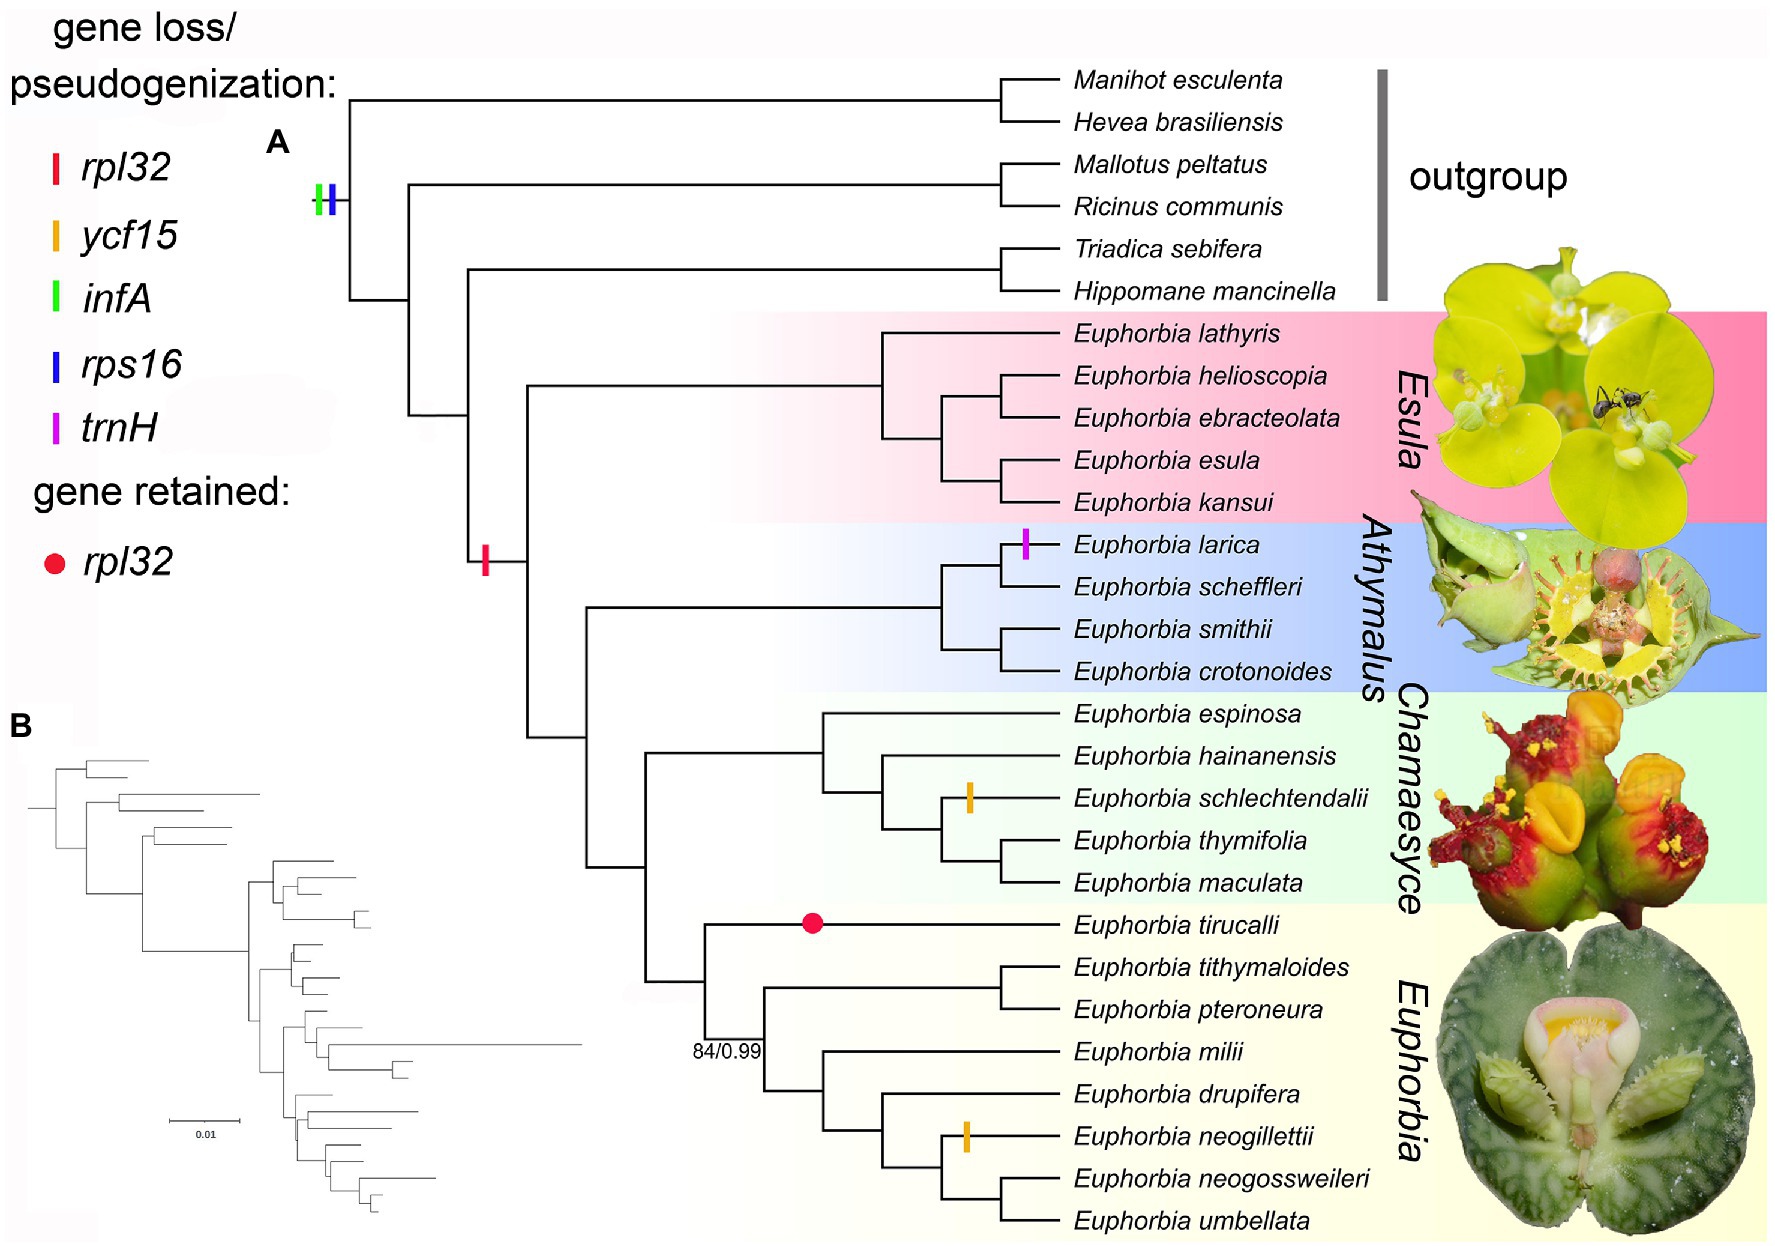
Figure 7. (A) Cladogram of maximum likelihood (ML) tree of Euphorbiaceae reconstructed from 76 plastid coding sequences (CDSs), showing the gene losses/pseudogenizations in the framework of representatives of Euphorbiaceae. Numbers below the branches are ML bootstrap values (BS)/Bayesian inference (BI) posterior probabilities (PP). All branches were supported as BS = 100/PP = 1.0 unless otherwise shown. Photographs (from top to bottom) are cyathia of Euphorbia sikkimensis, Euphorbia grantii, Euphorbia pulcherrima, and Euphorbia echinulata, respectively. Five species in subg. Chamaesyce were included in the previously segregate genus Chamaesyce, whereas E. umbellata, E. neogillettii, E. tithymaloides, Euphorbia neogossweileri, and Euphorbia drupifera represent the previously segregated genus Synadenium, Monadenium, Pedilanthus, Endadenium, and Elaeophorbia, respectively. (B) Phylogram of ML tree shown in (A), showing branch lengths proportional to nucleotide substitutions per site. Photo credit: Neng Wei.
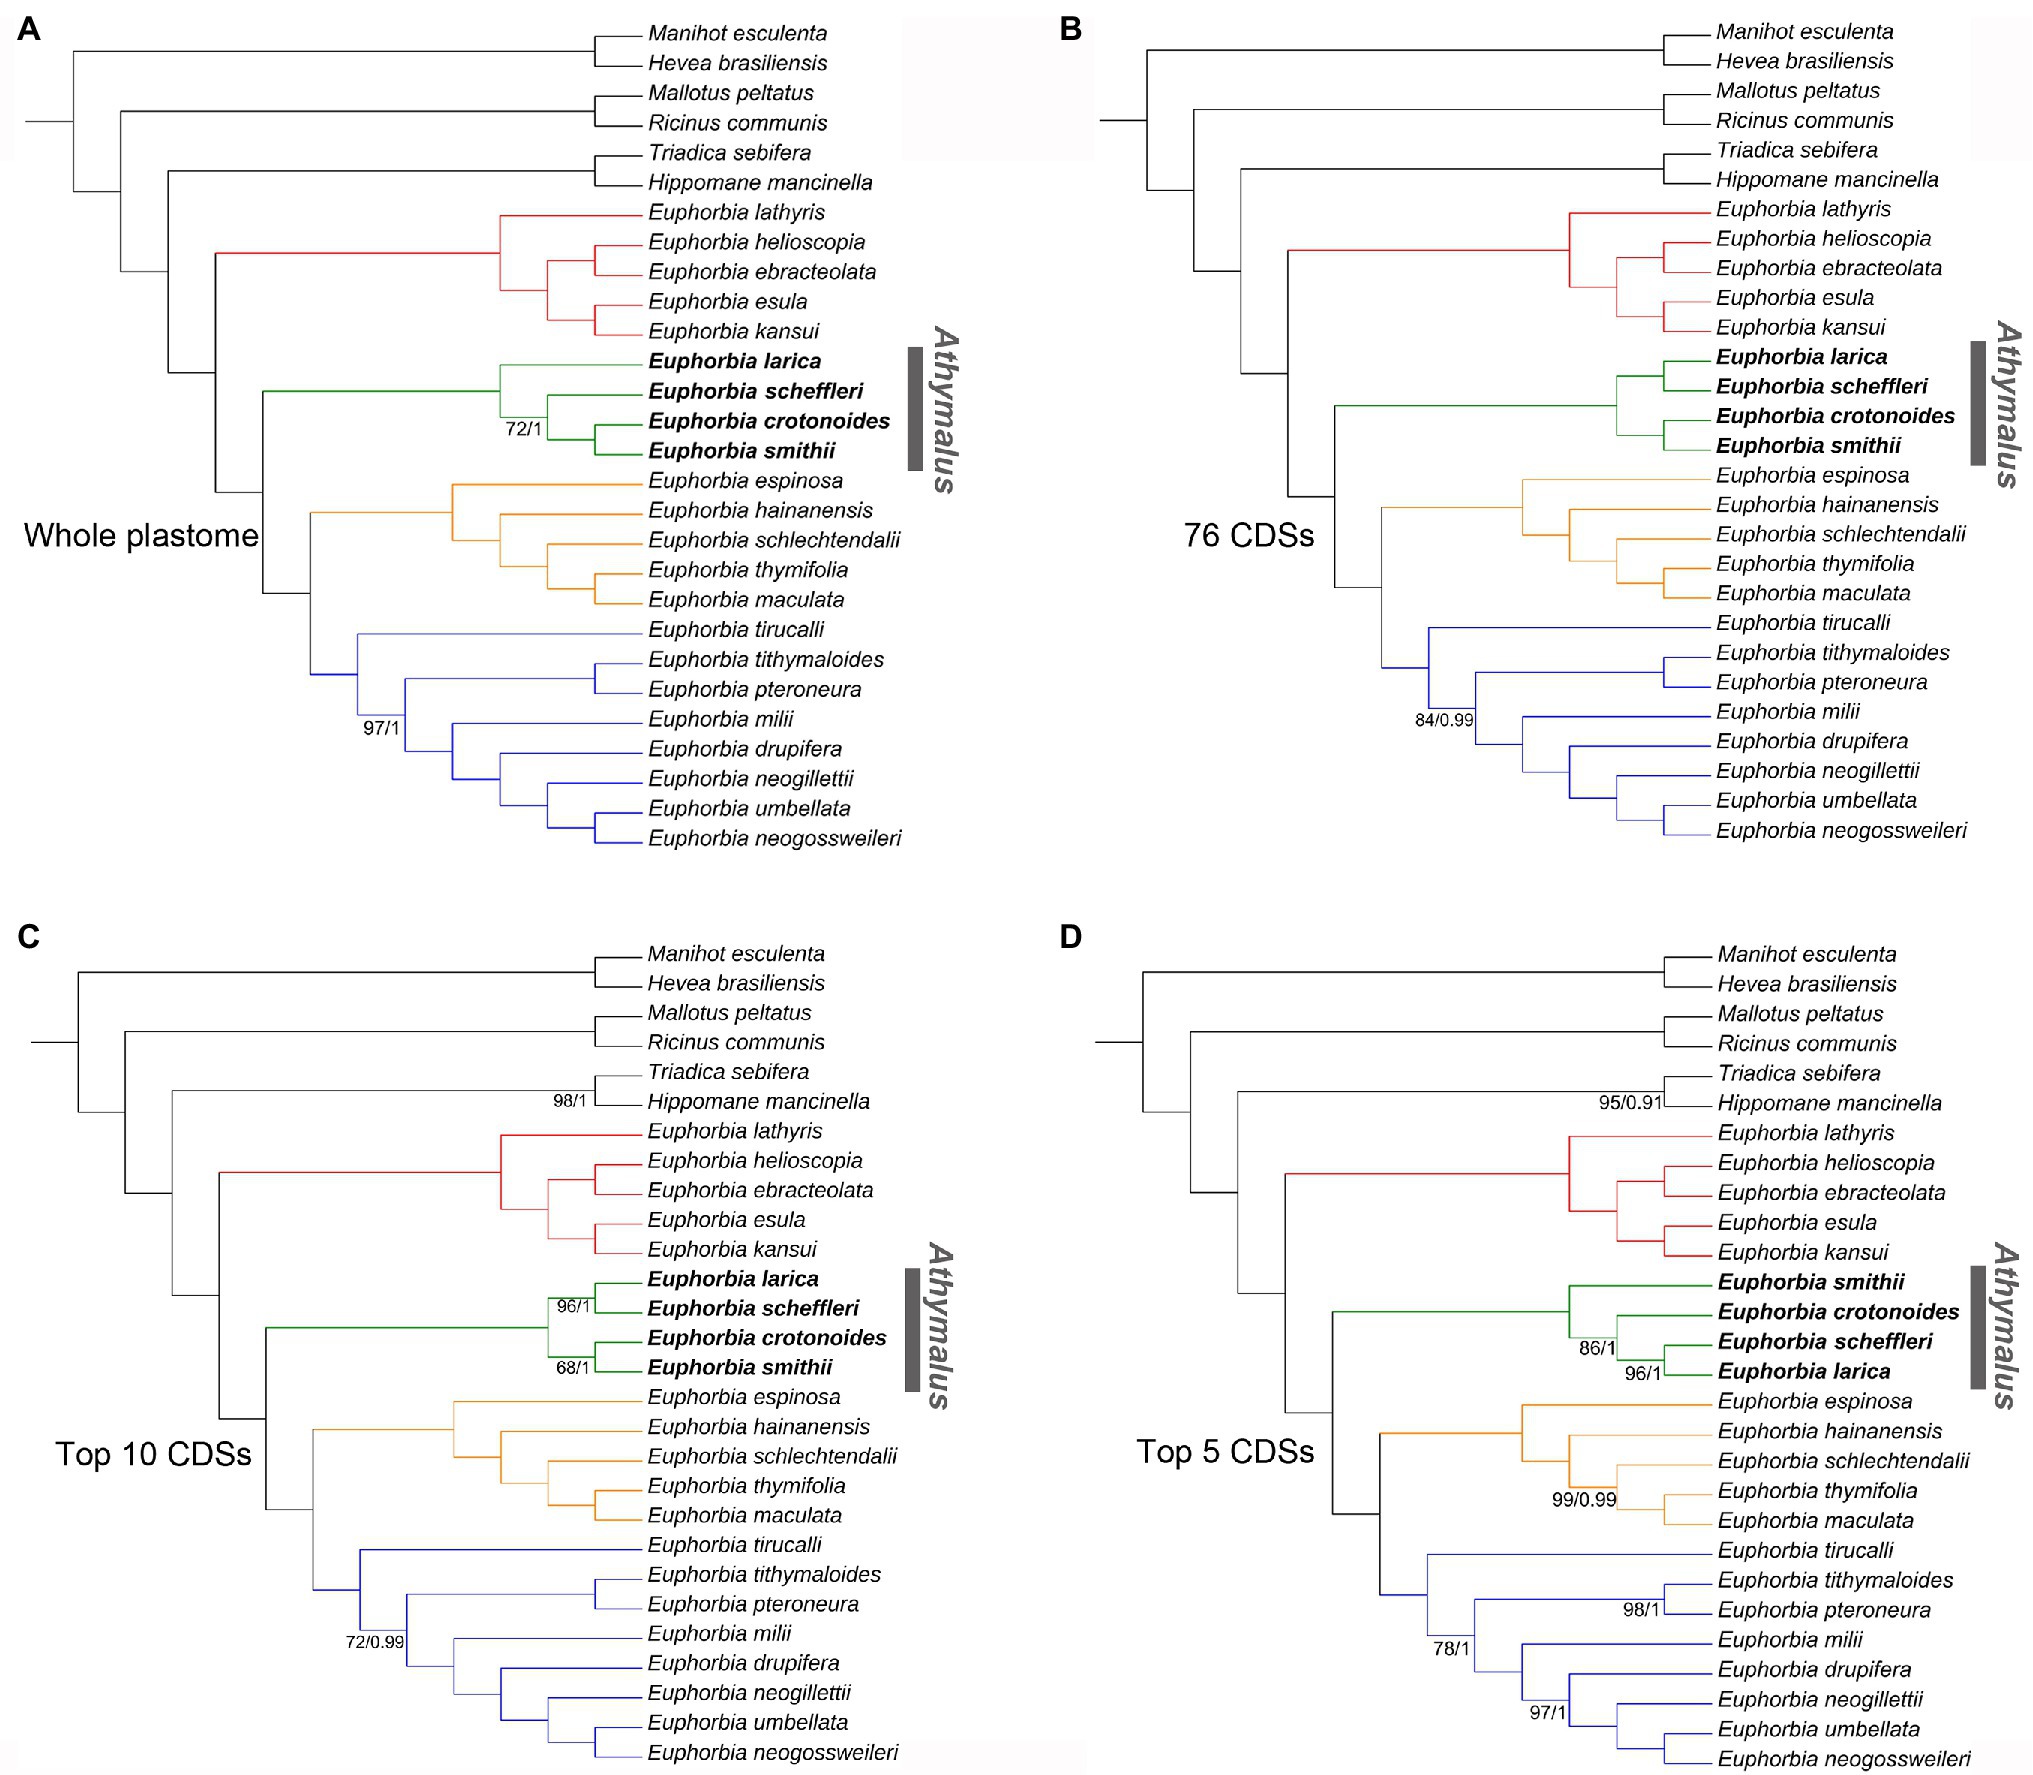
Figure 8. Comparisons of phylogenetic tree topologies for four datasets based on ML and BI analyses for 28 accessions in Euphorbiaceae. Numbers below the branches are ML bootstrap values (BS)/BI PP less than BP = 100/PP = 1; all other values were fully supported. (A) Tree based on the whole plastome sequences with one of the inverted repeat regions removed. (B) Tree based on the shared 76 CDSs dataset. (C) Tree based on the 10 most informative CDSs dataset. (D) Tree based on the five most informative CDSs dataset. Subgenera Esula, Athymalus, Chamaesyce, and Euphorbia, are colored in red, green, orange, and blue, respectively. Phylogenetic incongruence among four datasets was only detected in subg. Athymalus, indicated by bold in the name.
Comparative plastome analyses based on a taxon sampling representing the four major lineages of Euphorbia reveal a wide range of plastome size, rearrangements, gene losses/pseudogenizations, and duplications, suggesting that organelle evolution in the genus is far more complex than first thought (Alqahtani and Jansen, 2021). Plastomes are frequently treated as highly conserved among angiosperm, especially at genera and infrageneric levels (Wicke et al., 2011; Ruhlman and Jansen, 2014), including previous plastome comparative analyses of Euphorbia based on four species (Khan et al., 2020). However, plastome rearrangements might be more common at the generic level than previously thought, reported for the genus Asarum (Sinn et al., 2018) in the Aristolochiaceae, Erodium in Geraniaceae (Guisinger et al., 2011), and Passiflora in Passifloraceae (Cauz-Santos et al., 2020). In our study, plastome rearrangements do not appear to be strongly associated with phylogenetic relationships among Euphorbia, a pattern which is similar to previous studies conducted on monocots (e.g., Yang et al., 2010).
Within Euphorbia, the length of LSC, IRs, SSC, and whole plastome are highly variable, with some 42 kb variation ranging from the shortest (c. 136 kb) to the longest (c. 178 kb; Table 1; Figure 1). Several factors that contribute to the variation in plastome sizes include gene inversions and duplications, losses/pseudogenizations, and IR expansions/contractions (Xu and Wang, 2021). In particular, the expansions of the IR into the SC (LSC/SSC) regions have contributed the most to the increase of plastome size in E. tithymaloides and E. schlechtendalii. At the extreme opposite, the contraction of the IR region into the SC regions has contributed the most to the decrease of plastome size in E. neogillettii.
Similarly, five genes (rpl32, ycf15, infA, rps16, and trnH; Figure 7) involved in gene losses/pseudogenizations, have somewhat counteracted increases in plastome size. Of these five genes, infA and rps16 were lost/pseudogenized in all sampled species in Euphorbiaceae. The gene infA has been reported to be mostly a remnant pseudogene in almost all rosid species (Millen et al., 2001), as a consequence of a functional copy being transferred from the chloroplast to the nucleus. Previous studies supported that rps16 has been lost in most families of Malpighiales (Asif et al., 2010; de Santana Lopes et al., 2018; Bedoya et al., 2019), with the substitution of a nuclear-encoded mitochondrial-targeted gene. The gene rpl32, however, is lost in all Euphorbia sampled except Euphorbia tirucalli, suggesting that independent gene loss events occurred in the four subgenera. This gene loss has also been documented in Salicaceae of Malpighiales (Ueda et al., 2007). On the other hand, the evolutionary fate of infA, rpl32, and rps16 loss in the plastome was investigated and discussed, setting Euphorbia schimperi as an example (Alqahtani and Jansen, 2021). The loss of ycf15 in E. schlechtendalii and E. neogillettii, accompanied by large-scale IR expansion/contraction, was possibly associated with the IR boundary shift, as evidenced in Caprifoliaceae (He et al., 2017). We detected the putative loss of trnH in E. larica (Figure 3) but such contraction needs further confirmation, since it has not yet been documented in any other Euphorbiaceae. In the phylogenetic framework, the loss/pseudogenization of infA and rps16 in Euphorbia may have occurred prior to the divergence of the genus, whereas the loss/pseudogenization of rpl32, ycf15, and trnH may have occurred independently in Euphorbia.
Two distinct inversions of the gene regions ndhF–trnL (over 3 kb) and rpl23–rpl2 (c. 2 kb) were observed in E. tithymaloides and E. neogillettii, respectively (Figures 2, 3). However, we could not conclude that the inversion is the direct result of the IR boundary shift event in Euphorbia, as no inversion was detected in E. schlechtendalii, another species with the large-scale IR boundary shift. The inversion found here might be explained by the mechanism of intra-molecular recombination of repeats, which has been reported to influence the generation of rearrangements (Gray et al., 2009; Ruhlman et al., 2017).
In terms of repetitive sequences, Euphorbia plastomes exhibit highly variable numbers of SSRs, tandem repeats, and dispersed repeats. In particular, E. tithymaloides has the highest number of SSRs, compared with other Euphorbia. However, E. schlechtendalii presents the highest number of tandem repeats and dispersed repeats, with about two times as much as other Euphorbia. Interestingly, both these two species exhibit large-scale IR expansions, suggesting that the observed repetitive sequences might be positively correlated with rearrangement (IR expansion). This speculation has also been put forward previously (Milligan et al., 1989; Bzymek and Lovett, 2001; Cole et al., 2018).
Though plastomes analyzed in this study have the quadripartite structure common to the plant kingdom, large-scale expansion and contraction of IRs were found in the studied Euphorbia species. Until now, large-scale IR expansion/contraction in plastomes has been documented independently in disparate angiosperm lineages (Guisinger et al., 2011; Sun et al., 2013; Sanderson et al., 2015; Weng et al., 2017; Sinn et al., 2018; Choi et al., 2019; Cauz-Santos et al., 2020) and gymnosperm lineages (Lin et al., 2010; Wu et al., 2011; Yi et al., 2013). In the present study, however, we detected large-scale IR expansion and contraction within the same genus, which has, to our knowledge, only been documented in Asarum (Sinn et al., 2018) and Passiflora (Cauz-Santos et al., 2020) to date. The large-scale expansions and contractions of IRs are the main causes of plastome sequence length variations in these two genera.
Only the trnI gene and 5' rpl23 remained in the IR region (355 bp) in E. neogillettii, which is similar to the pattern observed for Pinaceae (Lin et al., 2010). Near- or complete loss of one copy of the IR is known in disparate lineages, such as conifers (Lin et al., 2010; Wu et al., 2011), Carnegiea in Cactaceae (Sanderson et al., 2015), Fabaceae (Choi et al., 2019), Erodium in Geraniaceae (Guisinger et al., 2011), Passiflora in Passifloraceae (Cauz-Santos et al., 2020), and the Lophopyxidaceae-Putranjivaceae clade in Malpighiales (Jin et al., 2020a). Plastomes of Putranjivaceae and its sister group Lophopyxidaceae have lost their IR region (spanning over 200 species; Jin et al., 2020a), whereas the near-complete loss of IR region in this study is clearly more localized. We found that the near-complete loss of IR region in E. neogillettii referred to IRB (Figures 1, 2), which is similar to IR loss found in the Lophopyxidaceae-Putranjivaceae clade (Jin et al., 2020a) and Tahina spectabilis (Barrett et al., 2016). Nevertheless, the IR-lacking legumes (Palmer et al., 1987), Carnegiea gigantea (Sanderson et al., 2015), and some Erodium species (Guisinger et al., 2011; Ruhlman et al., 2017) all have lost their IRA. As Jin et al. (2020a) presumed, we suppose that the loss of IRA or IRB seems to be a stochastic phenomenon.
Of the three sampled species (of c. 90; Dorsey et al., 2013) in Euphorbia sect. Monadenium, only E. neogillettii was been found to have lost its IR. Small-scale expansion with the integration of an additional rps19 or rpl22 in the IR regions identified in this study (Figure 3) has previously been documented in Euphorbia (Khan et al., 2020) and other members of Euphorbiaceae (Li et al., 2017). However, we found that the IR region of two Euphorbia (E. schlechtendalii and E. tithymaloides) plastomes expanded remarkably at the IR/SC boundaries (Figures 1–3), which has resulted in a largely reduced SSC region (8,226 and 3,360 bp, respectively).
Previous studies suggested that IR deletion contributed to the higher nucleotide substitution rate in the SC regions (Zhu et al., 2016; Schwarz et al., 2017). However, Palmer et al. (1987) concluded that the deletion of the IR regions would not necessarily result in plastome instability. In this case, the IR loss could be considered as a different type of plastome rearrangement, accompanied by other structural changes like inversions and gene losses/pseudogenizations (Sabir et al., 2014). Nevertheless, the expansion of IR regions has not necessarily decreased the substitution rates in multiple lineages, such as Pelargonium, Plantago, and Silene (Zhu et al., 2016; Weng et al., 2017). Different models have been proposed to explain the smaller or larger IR/SC boundary shifts among closely related species, including gene conversion (Goulding et al., 1996), double-strand DNA breaks (Wang et al., 2008), and dispersed repeats (Chumley et al., 2006). In contrast, large-scale genome reduction is speculated to be the result of the low-cost strategy, which facilitates rapid genome replication under detrimental environmental conditions (McCoy et al., 2008; Wu et al., 2009).
We identified promising DNA markers for phylogenetic estimation in 85 intergenic and intronic loci and 76 CDSs in Euphorbia plastome sequences. Among the top 10 intergenic and intronic loci with the highest SV values (Figure 5), three intergenic regions, including accD–psaI, ndhF–trnL, and psbZ–trnG, have also been found to be substantially divergent in Figure 4. However, none has previously been used in the phylogenetic inferences of Euphorbia, which were driven in part by factors including the barcode locus and the value to broad taxon sampling. Instead, other intergenic and intronic regions with lower SV values, including psbA–trnH (Bruyns et al., 2006), trnL–trnF (Zimmermann et al., 2010; Bruyns et al., 2011; Horn et al., 2012), rbcL–accD and rpl16 intron (Horn et al., 2012), have been utilized in previous studies – and may explain persistent challenges in resolving the Euphorbia tree of life. Of the most phylogenetically informative CDSs loci with the highest PIV values (Figure 6), only ndhF and matK have been adopted in previous phylogenetic studies of Euphorbia (Steinmann and Porter, 2002; Park and Jansen, 2007; Horn et al., 2012) and in the molecular classification system of its four subgenera (Yang et al., 2012; Dorsey et al., 2013; Peirson et al., 2013; Riina et al., 2013). Other CDSs, like ycf1, rpl22, rpoA, clpP, rpl20, ccsA, accD, and rps3 have great potential to be exploited as DNA markers. Among these coding regions, accD, clpP, rpoA, and ycf1 have also been observed with high sequence divergences in Figure 4. Similarly, three CDSs, clpP, ndhF, and ycf1, have also been found to be highly variable regions, which might provide a better understanding of phylogenetic inferences in the Euphorbiaceae (Khan et al., 2020). In particular, ycf1 has been increasingly reported as a useful marker for phylogenetic inference (Thomson et al., 2018; Kohler et al., 2020; Serna-Sánchez et al., 2020; Shen et al., 2020) and has been described as the most promising plastid DNA barcode for land plants (Dong et al., 2015). One example of utilization of ycf1 within Euphorbiaceae (genus Croton, Masa-Iranzo et al., 2021) used ycf1 in combination with other genetic regions in phylogenetic reconstruction.
The monophyly of both Euphorbia and its four subgenera is supported in the robust phylogenomic framework (Figures 7, 8). Six commonly recognized segregate genera, Chamaesyce, Synadenium, Monadenium, Pedilanthus, Endadenium, and Elaeophorbia, were all deeply nested in Euphorbia s.s., supporting previous phylogenetic analyses (Steinmann and Porter, 2002; Steinmann et al., 2007). This result is consistent with the concept for the “giant” Euphorbia (Bruyns et al., 2006, 2011; Horn et al., 2012; Dorsey et al., 2013). The four Euphorbia subgenera (subg. Esula, subg. Athymalus, subg. Chamaesyce, and subg. Euphorbia) were recovered in a successive sister relationship, in line with the well-established molecular classification systems (Yang et al., 2012; Dorsey et al., 2013; Peirson et al., 2013; Riina et al., 2013). Furthermore, our four plastome sequence datasets (whole plastome, 76 CDSs, top 10 and top five informative CDSs) yielded the same topology for all species sampled here, except for the species in subg. Athymalus (Figure 8). Within the subg. Athymalus, our phylogenetic inference from two datasets of 76 CDSs (Figure 8B) and the top 10 CDSs (Figure 8C), produced a conflicting topology compared with the trees based on whole plastome (Figure 8A) and top five CDSs (Figure 8D). The phylogeny from the 76 CDSs concatenated resolves relationships among Euphorbia best, compared with the phylogenies from the other three datasets. The topology (Figure 8A) supported by the whole plastome dataset in this study is the same recovered in Peirson et al. (2013) either for the combined ITS and ndhF or for ITS only. In contrast, the topology (Figure 8D) generated by the top five CDSs dataset matches the result of phylogenetic relationships estimate based on 296 low-copy nuclear genes in Villaverde et al. (2018). In addition, it seems that phylogenetic resolution within subg. Athymalus is problematic even using hundreds of nuclear genes, resulting in significant conflicting topologies (Villaverde et al., 2018). Thus, phylogenetic analyses based on nuclear and plastid data probably reveal similar patterns of phylogenetic incongruence to those observed in many other angiosperm lineages (e.g., Arecaceae: Pérez-Escobar et al., 2021; Asteraceae: Vargas et al., 2017; Cucurbitaceae: Renner et al., 2021; Orchidaceae: Pérez-Escobar et al., 2016).
The incongruence between topologies recovered in our analyses may be driven by several factors. Gaps in the whole plastome sequences alignment could play a role (Duvall et al., 2020). Homoplasy in the reduced datasets (top 10 and five informative CDSs) has also been invoked to explain discordance (Cauz-Santos et al., 2020), suggesting that phylogenetic results based on fewer markers are susceptible to this pattern. As shown in Figure 7B, a short internode connected by a long branch (indicating rapid radiation) was observed for E. larica-E. scheffleri clade in subg. Athymalus. Thus, the impact of rapid radiation in phylogenetic reconstruction should be also taken into consideration. Lastly, recent studies have revealed that the incongruence between species trees and gene trees from plastome sequences is also a factor leading to conflicting topologies (Goncalves et al., 2019; Walker et al., 2019).
Given the fact that Euphorbia is the only genus to date possessing all three major photosynthetic systems (Webster et al., 1975; Yang and Berry, 2011; Horn et al., 2014), future phylogenetic studies using a whole plastome approach might reveal better correlations between photosynthetic gene evolution and mode of photosynthesis. Comparative analyses between the plastome and nuclear genome might provide more evidence to further discern the signal of phylogenetic discordance as potentially driven by hybridization, or incomplete lineage sorting, and we anticipate that further studies may be rewarding.
We provide insights into the structural variation of the plastome as well as the phylogenetic estimation and relationships in the giant genus Euphorbia. Our analyses reveal that Euphorbia exhibits surprisingly rich plastome structural variations. In particular, unusual large-scale IR expansions and contractions are found within the genus, suggesting a complex plastome evolution history in Euphorbia. Our findings point to the need for further plastome explorations across plant lineages. To better perform phylogeny-based studies for Euphorbia in the future, we screened promising molecular markers both from intergenic and coding regions. Lastly, the monophyly of Euphorbia and its four subgenera is supported, using a robust plastid phylogenomic framework. Conflicting topologies were detected for subg. Athymalus, when comparing four different datasets from the plastome. These topological incongruences deserve further explorations to the underlying biologically relevant evolutionary history, using both nuclear and plastome datasets.
The datasets presented in this study can be found in online repositories. The names of the repository/repositories and accession number(s) can be found in the article/Supplementary Material.
NW: data curation, methodology, formal analysis, investigation, writing, and funding acquisition. OP-E: conceptualization, methodology, software, validation, review and editing, supervision, and funding acquisition. PM: sampling, investigation, data curation, and review. W-CH: sampling, review, and editing. J-BY: investigation, formal analysis, and review. A-QH: review and editing. G-WH: sampling, review, and editing. OG: conceptualization, validation, review and editing, supervision, and project administration. Q-FW: review and editing, supervision, project administration, and funding acquisition. All authors contributed to the article and approved the submitted version.
This work was supported by the grants from Sino-Africa Joint Research Center, CAS, China (grant number SAJC202101), International Partnership Program of Chinese Academy of Sciences (grant number 151853KYSB20190027), and the National Science Foundation of China (grant number 32070231) to Q-FW, and the University of Chinese Academy of Sciences Joint PhD Training Program to NW. OP-E acknowledges financial support from the Swiss Orchid Foundation and the Sainsbury Orchid Trust Fund at the Royal Botanic Gardens, Kew.
The authors declare that the research was conducted in the absence of any commercial or financial relationships that could be construed as a potential conflict of interest.
All claims expressed in this article are solely those of the authors and do not necessarily represent those of their affiliated organizations, or those of the publisher, the editors and the reviewers. Any product that may be evaluated in this article, or claim that may be made by its manufacturer, is not guaranteed or endorsed by the publisher.
We are grateful to Fredrick Munyao Mutie, Paul Rees, Imalka Kahandawala, Zhengwei Wang, Qi Wang, and Jie Cai for their help in collecting materials for the DNA extraction. We also thank Zhirong Zhang for providing help in DNA sequencing.
The Supplementary Material for this article can be found online at: https://www.frontiersin.org/articles/10.3389/fpls.2021.712064/full#supplementary-material
1. ^https://www.sangon.com/productImage/DOC/B518731/B518721_B518723_B518725_B518731_ZH_P.pdf
2. ^http://www.bea.ki.se/documents/datasheet_NEB_Ultra%20II%20DNA.pdf
3. ^http://www.bioinformatics.babraham.ac.uk/projects/fastqc/
Alqahtani, A., and Jansen, R. (2021). The evolutionary fate of rpl32 and rps16 losses in the Euphorbia schimperi (Euphorbiaceae) plastome. Sci. Rep. 11:7466. doi: 10.1038/s41598-021-86820-z
Amiryousefi, A., Hyvonen, J., and Poczai, P. (2018). IRscope: an online program to visualize the junction sites of chloroplast genomes. Bioinformatics 34, 3030–3031. doi: 10.1093/bioinformatics/bty220
Asaf, S., Khan, A. L., Lubna,, Khan, A., Khan, A., Khan, G., et al. (2020). Expanded inverted repeat region with large scale inversion in the first complete plastid genome sequence of Plantago ovata. Sci. Rep. 10:3881. doi: 10.1038/s41598-020-60803-y
Asif, M. H., Mantri, S. S., Sharma, A., Srivastava, A., Trivedi, I., Gupta, P., et al. (2010). Complete sequence and organization of the Jatropha curcas (Euphorbiaceae) chloroplast genome. Tree Genet. Genom. 6, 941–952. doi: 10.1007/s11295-010-0303-0
Barrett, C. F., Baker, W. J., Comer, J. R., Conran, J. G., Lahmeyer, S. C., Leebens-Mack, J. H., et al. (2016). Plastid genomes reveal support for deep phylogenetic relationships and extensive rate variation among palms and other commelinid monocots. New Phytol. 209, 855–870. doi: 10.1111/nph.13617
Bedoya, A. M., Ruhfel, B. R., Philbrick, C. T., Madrinan, S., Bove, C. P., Mesterhazy, A., et al. (2019). Plastid genomes of five species of riverweeds (Podostemaceae): structural organization and comparative analysis in Malpighiales. Front. Plant Sci. 10:1035. doi: 10.3389/fpls.2019.01035
Beier, S., Thiel, T., Munch, T., Scholz, U., and Mascher, M. (2017). MISA-web: a web server for microsatellite prediction. Bioinformatics 33, 2583–2585. doi: 10.1093/bioinformatics/btx198
Bellot, S., and Renner, S. S. (2016). The plastomes of two species in the endoparasite genus Pilostyles (Apodanthaceae) each retain just five or six possibly functional genes. Genome Biol. Evol. 8, 189–201. doi: 10.1093/gbe/evv251
Benson, G. (1999). Tandem repeats finder: a program to analyze DNA sequences. Nucleic Acids Res. 27, 573–580. doi: 10.1093/nar/27.2.573
Berry, P. E., and Riina, R. (2007). A new collaborative research project: a global inventory of Euphorbia. Euphorbia World 3, 12–13.
Bolger, A. M., Lohse, M., and Usadel, B. (2014). Trimmomatic: a flexible trimmer for Illumina sequence data. Bioinformatics 30, 2114–2120. doi: 10.1093/bioinformatics/btu170
Braukmann, T., Kuzmina, M., and Stefanović, S. (2013). Plastid genome evolution across the genus Cuscuta (Convolvulaceae): two clades within subgenus Grammica exhibit extensive gene loss. J. Exp. Bot. 64, 977–989. doi: 10.1093/jxb/ers391
Brudno, M., Do, C. B., Cooper, G. M., Kim, M. F., Davydov, E., Program, N. C. S., et al. (2003). LAGAN and Multi-LAGAN: efficient tools for large-scale multiple alignment of genomic DNA. Genome Res. 13, 721–731. doi: 10.1101/gr.926603
Bruyns, P. V., Klak, C., and Hanáček, P. (2011). Age and diversity in Old World succulent species of Euphorbia (Euphorbiaceae). Taxon 60, 1717–1733. doi: 10.1002/tax.606016
Bruyns, P. V., Mapaya, R. J., and Hedderson, T. J. (2006). A new subgeneric classification for Euphorbia (Euphorbiaceae) in southern Africa based on ITS and psbA-trnH sequence data. Taxon 55, 397–420. doi: 10.2307/25065587
Bzymek, M., and Lovett, S. T. (2001). Instability of repetitive DNA sequences: the role of replication in multiple mechanisms. Proc. Natl. Acad. Sci. U. S. A. 98, 8319–8325. doi: 10.1073/pnas.111008398
Capella-Gutierrez, S., Silla-Martinez, J. M., and Gabaldon, T. (2009). TrimAl: a tool for automated alignment trimming in large-scale phylogenetic analyses. Bioinformatics 25, 1972–1973. doi: 10.1093/bioinformatics/btp348
Cauz-Santos, L. A., da Costa, Z. P., Callot, C., Cauet, S., Zucchi, M. I., Berges, H., et al. (2020). A repertory of rearrangements and the loss of an inverted repeat region in Passiflora chloroplast genomes. Genome Biol. Evol. 12, 1841–1857. doi: 10.1093/gbe/evaa155
Choi, I. S., Jansen, R., and Ruhlman, T. (2019). Lost and found: return of the inverted repeat in the legume clade defined by its absence. Genome Biol. Evol. 11, 1321–1333. doi: 10.1093/gbe/evz076
Chumley, T. W., Palmer, J. D., Mower, J. P., Fourcade, H. M., Calie, P. J., Boore, J. L., et al. (2006). The complete chloroplast genome sequence of Pelargonium x hortorum: organization and evolution of the largest and most highly rearranged chloroplast genome of land plants. Mol. Biol. Evol. 23, 2175–2190. doi: 10.1093/molbev/msl089
Cole, L. W., Guo, W., Mower, J. P., and Palmer, J. D. (2018). High and variable rates of repeat-mediated mitochondrial genome rearrangement in a genus of plants. Mol. Biol. Evol. 35, 2773–2785. doi: 10.1093/molbev/msy176
Darling, A. C., Mau, B., Blattner, F. R., and Perna, N. T. (2004). Mauve: multiple alignment of conserved genomic sequence with rearrangements. Genome Res. 14, 1394–1403. doi: 10.1101/gr.2289704
Darling, A. E., Mau, B., and Perna, N. T. (2010). ProgressiveMauve: multiple genome alignment with gene gain, loss and rearrangement. PLoS One 5:e11147. doi: 10.1371/journal.pone.0011147
de Pamphilis, C. W., and Palmer, J. D. (1990). Loss of photosynthetic and chlororespiratory genes from the plastid genome of a parasitic flowering plant. Nature 348, 337–339. doi: 10.1038/348337a0
de Santana Lopes, A., Pacheco, T. G., Santos, K. G. D., Vieira, L. D. N., Guerra, M. P., Nodari, R. O., et al. (2018). The Linum usitatissimum L. plastome reveals atypical structural evolution, new editing sites, and the phylogenetic position of Linaceae within Malpighiales. Plant Cell Rep. 37, 307–328. doi: 10.1007/s00299-017-2231-z
de Vries, J., and Archibald, J. M. (2018). Plastid genomes. Curr. Biol. 28, R336–R337. doi: 10.1016/j.cub.2018.01.027
Dong, W., Xu, C., Li, C., Sun, J., Zuo, Y., Shi, S., et al. (2015). Ycf1, the most promising plastid DNA barcode of land plants. Sci. Rep. 5:8348. doi: 10.1038/srep08348
Dorsey, B. L., Haevermans, T., Aubriot, X., Morawetz, J. J., Riina, R., Steinmann, V. W., et al. (2013). Phylogenetics, morphological evolution, and classification of Euphorbia subgenus Euphorbia. Taxon 62, 291–315. doi: 10.12705/622.1
Duvall, M. R., Burke, S. V., and Clark, D. C. (2020). Plastome phylogenomics of Poaceae: alternate topologies depend on alignment gaps. J. Linn. Soc. Bot. 192, 9–20. doi: 10.1093/botlinnean/boz060
Ernst, M., Grace, O. M., Saslis-Lagoudakis, C. H., Nilsson, N., Simonsen, H. T., and Ronsted, N. (2015). Global medicinal uses of Euphorbia L. (Euphorbiaceae). J. Ethnopharmacol. 176, 90–101. doi: 10.1016/j.jep.2015.10.025
Ernst, M., Nothias, L.-F., van der Hooft, J. J. J., Silva, R. R., Saslis-Lagoudakis, C. H., Grace, O. M., et al. (2019). Assessing specialized metabolite diversity in the cosmopolitan plant genus Euphorbia L. Front. Plant Sci. 10:846. doi: 10.3389/fpls.2019.00846
Frazer, K. A., Pachter, L., Poliakov, A., Rubin, E. M., and Dubchak, I. (2004). VISTA: computational tools for comparative genomics. Nucleic Acids Res. 32, W273–W279. doi: 10.1093/nar/gkh458
Gitzendanner, M. A., Soltis, P. S., Yi, T.-S., Li, D.-Z., and Soltis, D. E. (2018). Plastome phylogenetics: 30 years of inferences into plant evolution. Adv. Bot. Res. 85, 293–313. doi: 10.1016/bs.abr.2017.11.016
Goncalves, D. J. P., Simpson, B. B., Ortiz, E. M., Shimizu, G. H., and Jansen, R. K. (2019). Incongruence between gene trees and species trees and phylogenetic signal variation in plastid genes. Mol. Phylogenet. Evol. 138, 219–232. doi: 10.1016/j.ympev.2019.05.022
Goulding, S. E., Olmstead, R. G., Morden, C. W., and Wolfe, K. H. (1996). Ebb and flow of the chloroplast inverted repeat. Mol. Gen. Genet. 252, 195–206. doi: 10.1007/BF02173220
Gray, B. N., Ahner, B. A., and Hanson, M. R. (2009). Extensive homologous recombination between introduced and native regulatory plastid DNA elements in transplastomic plants. Transgenic Res. 18, 559–572. doi: 10.1007/s11248-009-9246-3
Greiner, S., Lehwark, P., and Bock, R. (2019). OrganellarGenomeDRAW (OGDRAW) version 1.3.1: expanded toolkit for the graphical visualization of organellar genomes. Nucleic Acids Res. 47, W59–W64. doi: 10.1093/nar/gkz238
Guindon, S., Dufayard, J. F., Lefort, V., Anisimova, M., Hordijk, W., and Gascuel, O. (2010). New algorithms and methods to estimate maximum-likelihood phylogenies: assessing the performance of PhyML 3.0. Syst. Biol. 59, 307–321. doi: 10.1093/sysbio/syq010
Guisinger, M. M., Kuehl, J. V., Boore, J. L., and Jansen, R. K. (2011). Extreme reconfiguration of plastid genomes in the angiosperm family Geraniaceae: rearrangements, repeats, and codon usage. Mol. Biol. Evol. 28, 583–600. doi: 10.1093/molbev/msq229
Harrison, N., Harrison, R. J., and Kidner, C. A. (2016). Comparative analysis of Begonia plastid genomes and their utility for species-level phylogenetics. PLoS One 11:e0153248. doi: 10.1371/journal.pone.0153248
Hassemer, G., Bruun-Lund, S., Shipunov, A. B., Briggs, B. G., Meudt, H. M., and Ronsted, N. (2019). The application of high-throughput sequencing for taxonomy: the case of Plantago subg. Plantago (Plantaginaceae). Mol. Phylogenet. Evol. 138, 156–173. doi: 10.1016/j.ympev.2019.05.013
He, L., Qian, J., Li, X., Sun, Z., Xu, X., and Chen, S. (2017). Complete chloroplast genome of medicinal plant Lonicera japonica: genome rearrangement, intron gain and loss, and implications for phylogenetic studies. Molecules 22:249. doi: 10.3390/molecules22020249
Horn, J. W., van Ee, B. W., Morawetz, J. J., Riina, R., Steinmann, V. W., Berry, P. E., et al. (2012). Phylogenetics and the evolution of major structural characters in the giant genus Euphorbia L. (Euphorbiaceae). Mol. Phylogenet. Evol. 63, 305–326. doi: 10.1016/j.ympev.2011.12.022
Horn, J. W., Xi, Z., Riina, R., Peirson, J. A., Yang, Y., Dorsey, B. L., et al. (2014). Evolutionary bursts in Euphorbia (Euphorbiaceae) are linked with photosynthetic pathway. Evolution 68, 3485–3504. doi: 10.1111/evo.12534
Horvath, D. P., Patel, S., Doğramaci, M., Chao, W. S., Anderson, J. V., Foley, M. E., et al. (2018). Gene space and transcriptome assemblies of leafy spurge (Euphorbia esula) identify promoter sequences, repetitive elements, high-quality markers, and a full-length chloroplast genome. Weed Sci. 66, 355–367. doi: 10.1017/wsc.2018.2
Jiang, Y. L., Wang, H. X., Zhu, Z. X., and Wang, H. F. (2020). Complete plastome sequence of Euphorbia milii des Moul. (Euphorbiaceae). Mitochondrial DNA B Resour. 5, 426–427. doi: 10.1080/23802359.2019.1703598
Jin, D. M., Wicke, S., Gan, L., Yang, J. B., Jin, J. J., and Yi, T. S. (2020a). The loss of the inverted repeat in the Putranjivoid clade of Malpighiales. Front. Plant Sci. 11:942. doi: 10.3389/fpls.2020.00942
Jin, J. J., Yu, W. B., Yang, J. B., Song, Y., de Pamphilis, C. W., Yi, T. S., et al. (2020b). GetOrganelle: a fast and versatile toolkit for accurate de novo assembly of organelle genomes. Genome Biol. 21:241. doi: 10.1186/s13059-020-02154-5
Kalyaanamoorthy, S., Minh, B. Q., Wong, T. K. F., von Haeseler, A., and Jermiin, L. S. (2017). ModelFinder: fast model selection for accurate phylogenetic estimates. Nat. Methods 14, 587–589. doi: 10.1038/nmeth.4285
Katoh, K., and Standley, D. M. (2013). MAFFT multiple sequence alignment software version 7: improvements in performance and usability. Mol. Biol. Evol. 30, 772–780. doi: 10.1093/molbev/mst010
Kearse, M., Moir, R., Wilson, A., Stones-Havas, S., Cheung, M., Sturrock, S., et al. (2012). Geneious basic: an integrated and extendable desktop software platform for the organization and analysis of sequence data. Bioinformatics 28, 1647–1649. doi: 10.1093/bioinformatics/bts199
Khan, A., Asaf, S., Khan, A. L., Shehzad, T., Al-Rawahi, A., and Al-Harrasi, A. (2020). Comparative chloroplast genomics of endangered Euphorbia species: insights into hotspot divergence, repetitive sequence variation, and phylogeny. Plan. Theory 9:199. doi: 10.3390/plants9020199
Kohler, M., Reginato, M., Souza-Chies, T. T., and Majure, L. C. (2020). Insights into chloroplast genome evolution across Opuntioideae (Cactaceae) reveals robust yet sometimes conflicting phylogenetic topologies. Front. Plant Sci. 11:729. doi: 10.3389/fpls.2020.00729
Kurtz, S., Choudhuri, J. V., Ohlebusch, E., Schleiermacher, C., Stoye, J., and Giegerich, R. (2001). REPuter: the manifold applications of repeat analysis on a genomic scale. Nucleic Acids Res. 29, 4633–4642. doi: 10.1093/nar/29.22.4633
Lanfear, R., Frandsen, P. B., Wright, A. M., Senfeld, T., and Calcott, B. (2017). PartitionFinder 2: new methods for selecting partitioned models of evolution for molecular and morphological phylogenetic analyses. Mol. Biol. Evol. 34, 772–773. doi: 10.1093/molbev/msw260
Lehwark, P., and Greiner, S. (2019). GB2sequin - A file converter preparing custom GenBank files for database submission. Genomics 111, 759–761. doi: 10.1016/j.ygeno.2018.05.003
Letunic, I., and Bork, P. (2007). Interactive Tree of Life (iTOL): an online tool for phylogenetic tree display and annotation. Bioinformatics 23, 127–128. doi: 10.1093/bioinformatics/btl529
Li, H., and Durbin, R. (2009). Fast and accurate short read alignment with burrows–wheeler transform. Bioinformatics 25, 1754–1760. doi: 10.1093/bioinformatics/btp324
Li, H. T., Yi, T. S., Gao, L. M., Ma, P. F., Zhang, T., Yang, J. B., et al. (2019). Origin of angiosperms and the puzzle of the Jurassic gap. Nat. Plants 5, 461–470. doi: 10.1038/s41477-019-0421-0
Li, Z., Long, H., Zhang, L., Liu, Z., Cao, H., Shi, M., et al. (2017). The complete chloroplast genome sequence of tung tree (Vernicia fordii): organization and phylogenetic relationships with other angiosperms. Sci. Rep. 7:1869. doi: 10.1038/s41598-017-02076-6
Lin, C. P., Huang, J. P., Wu, C. S., Hsu, C. Y., and Chaw, S. M. (2010). Comparative chloroplast genomics reveals the evolution of Pinaceae genera and subfamilies. Genome Biol. Evol. 2, 504–517. doi: 10.1093/gbe/evq036
Lopez-Giraldez, F., and Townsend, J. P. (2011). PhyDesign: an online application for profiling phylogenetic informativeness. BMC Evol. Biol. 11:152. doi: 10.1186/1471-2148-11-152
Masa-Iranzo, I., Sanmartín, I., Caruzo, M. B. R., and Riina, R. (2021). Skipping the dry diagonal: spatio-temporal evolution of Croton section Cleodora (Euphorbiaceae) in the Neotropics. Bot. J. Linn. Soc. boab016. doi: 10.1093/botlinnean/boab016
McCoy, S. R., Kuehl, J. V., Boore, J. L., and Raubeson, L. A. (2008). The complete plastid genome sequence of Welwitschia mirabilis: an unusually compact plastome with accelerated divergence rates. BMC Evol. Biol. 8:130. doi: 10.1186/1471-2148-8-130
Millen, R. S., Olmstead, R. G., Adams, K. L., Palmer, J. D., Lao, N. T., Heggie, L., et al. (2001). Many parallel losses of infA from chloroplast DNA during angiosperm evolution with multiple independent transfers to the nucleus. Plant Cell 13, 645–658. doi: 10.1105/tpc.13.3.645
Milligan, B. G., Hampton, J. N., and Palmer, J. D. (1989). Dispersed repeats and structural reorganization in subclover chloroplast DNA. Mol. Biol. Evol. 6, 355–368. doi: 10.1093/oxfordjournals.molbev.a040558
Minh, B. Q., Nguyen, M. A., and von Haeseler, A. (2013). Ultrafast approximation for phylogenetic bootstrap. Mol. Biol. Evol. 30, 1188–1195. doi: 10.1093/molbev/mst024
Morden, C. W., Wolfe, K. H., de Pamphilis, C. W., and Palmer, J. D. (1991). Plastid translation and transcription genes in a non-photosynthetic plant: intact, missing and pseudo genes. EMBO J. 10, 3281–3288. doi: 10.1002/j.1460-2075.1991.tb04892.x
Naumann, J., Der, J. P., Wafula, E. K., Jones, S. S., Wagner, S. T., Honaas, L. A., et al. (2016). Detecting and characterizing the highly divergent plastid genome of the nonphotosynthetic parasitic plant Hydnora visseri (Hydnoraceae). Genome Biol. Evol. 8, 345–363. doi: 10.1093/gbe/evv256
Nguyen, L. T., Schmidt, H. A., von Haeseler, A., and Minh, B. Q. (2015). IQ-TREE: a fast and effective stochastic algorithm for estimating maximum-likelihood phylogenies. Mol. Biol. Evol. 32, 268–274. doi: 10.1093/molbev/msu300
Palmer, J. D., Osorio, B., Aldrich, J., and Thompson, W. F. (1987). Chloroplast DNA evolution among legumes: loss of a large inverted repeat occurred prior to other sequence rearrangements. Curr. Genet. 11, 275–286. doi: 10.1007/bf00355401
Paradis, E., Claude, J., and Strimmer, K. (2004). APE: analyses of Phylogenetics and evolution in R language. Bioinformatics 20, 289–290. doi: 10.1093/bioinformatics/btg412
Park, K.-R., and Jansen, R. K. (2007). A phylogeny of Euphorbieae subtribe Euphorbiinae (Euphorbiaceae) based on molecular data. J. Plant Biol. 50, 644–649. doi: 10.1007/bf03030608
Patan, S. S. V. K., Bugude, R., Sake, P. K., and Randall, G. T. (2018). Use of Euphorbia sp. (Euphorbiaceae) as biofuel feedstock for semi-arid and arid lands. Biofuels 12, 511–521. doi: 10.1080/17597269.2018.1501637
Peirson, J. A., Bruyns, P. V., Riina, R., Morawetz, J. J., and Berry, P. E. (2013). A molecular phylogeny and classification of the largely succulent and mainly African Euphorbia subg. Athymalus (Euphorbiaceae). Taxon 62, 1178–1199. doi: 10.12705/626.12
Pérez-Escobar, O. A., Balbuena, J. A., and Gottschling, M. (2016). Rumbling orchids: how to assess divergent evolution between chloroplast endosymbionts and the nuclear host. Syst. Biol. 65, 51–65.
Pérez-Escobar, O. A., Bellot, S., Przelomska, N. A. S., Flowers, J. M., Nesbitt, M., Ryan, P., et al. (2021). Molecular clocks and archaeogenomics of a Late Period Egyptian date palm leaf reveal introgression from wild relatives and add timestamps on the domstication. Mol. Biol. Evol. doi: 10.1093/molbev/msab188
Pond, S. L., Frost, S. D., and Muse, S. V. (2005). HyPhy: hypothesis testing using phylogenies. Bioinformatics 21, 676–679. doi: 10.1093/bioinformatics/bti079
Qu, X. J., Moore, M. J., Li, D. Z., and Yi, T. S. (2019). PGA: a software package for rapid, accurate, and flexible batch annotation of plastomes. Plant Methods 15:50. doi: 10.1186/s13007-019-0435-7
Rambaut, A., Drummond, A. J., Xie, D., Baele, G., and Suchard, M. A. (2018). Posterior summarization in Bayesian phylogenetics using tracer 1.7. Syst. Biol. 67, 901–904. doi: 10.1093/sysbio/syy032
Raubeson, L. A., and Jansen, R. K. (2005). “Chloroplast genomes of plants,” in Plant Diversity and Evolution: Genotypic and Phenotypic Variation in Higher Plants. ed. R. J. Henry (Cambridge, MA: CABI Press), 45–68.
Renner, S. S., Wu, S., Pérez-Escobar, O. A., Silver, M., Fei, Z., and Chomicki, G. (2021). A chromosome-level genome of a Kordofan melon illuminates the origin of domesticated watermelons. PNAS 118:e2101486118. doi: 10.1073/pnas.2101486118
Riina, R., Peirson, J. A., Geltman, D. V., Molero, J., Frajman, B., Pahlevani, A., et al. (2013). A worldwide molecular phylogeny and classification of the leafy spurges, Euphorbia subgenus Esula (Euphorbiaceae). Taxon 62, 316–342. doi: 10.12705/622.3
Ronquist, F., Teslenko, M., van der Mark, P., Ayres, D. L., Darling, A., Hohna, S., et al. (2012). MrBayes 3.2: efficient Bayesian phylogenetic inference and model choice across a large model space. Syst. Biol. 61, 539–542. doi: 10.1093/sysbio/sys029
Ruhlman, T. A., and Jansen, R. K. (2014). The plastid genomes of flowering plants. Methods Mol. Biol. 1132, 3–38. doi: 10.1007/978-1-62703-995-6_1
Ruhlman, T. A., Zhang, J., Blazier, J. C., Sabir, J. S. M., and Jansen, R. K. (2017). Recombination-dependent replication and gene conversion homogenize repeat sequences and diversify plastid genome structure. Am. J. Bot. 104, 559–572. doi: 10.3732/ajb.1600453
Sabir, J., Schwarz, E., Ellison, N., Zhang, J., Baeshen, N. A., Mutwakil, M., et al. (2014). Evolutionary and biotechnology implications of plastid genome variation in the inverted-repeat-lacking clade of legumes. Plant Biotechnol. J. 12, 743–754. doi: 10.1111/pbi.12179
Sanderson, M. J., Copetti, D., Burquez, A., Bustamante, E., Charboneau, J. L., Eguiarte, L. E., et al. (2015). Exceptional reduction of the plastid genome of saguaro cactus (Carnegiea gigantea): loss of the ndh gene suite and inverted repeat. Am. J. Bot. 102, 1115–1127. doi: 10.3732/ajb.1500184
Schubert, M., Ermini, L., Der Sarkissian, C., Jonsson, H., Ginolhac, A., Schaefer, R., et al. (2014). Characterization of ancient and modern genomes by SNP detection and phylogenomic and metagenomic analysis using PALEOMIX. Nat. Protoc. 9, 1056–1082. doi: 10.1038/nprot.2014.063
Schwarz, E. N., Ruhlman, T. A., Weng, M. L., Khiyami, M. A., Sabir, J. S. M., Hajarah, N. H., et al. (2017). Plastome-wide nucleotide substitution rates reveal accelerated rates in Papilionoideae and correlations with genome features across legume subfamilies. J. Mol. Evol. 84, 187–203. doi: 10.1007/s00239-017-9792-x
Serna-Sánchez, M. A., Pérez-Escobar, O. A., Bogarín, D., Torres, M. F., Alvarez-Yela, A. C., Arcila, J. E., et al. (2020). Plastid phylogenomics resolves ambiguous relationships within the orchid family and provides a solid timeframe for biogeography and macroevolution. Sci. Rep. 11:6858. doi: 10.1038/s41598-021-83664-5
Shaw, J., Shafer, H. L., Leonard, O. R., Kovach, M. J., Schorr, M., and Morris, A. B. (2014). Chloroplast DNA sequence utility for the lowest phylogenetic and phylogeographic inferences in angiosperms: the tortoise and the hare IV. Am. J. Bot. 101, 1987–2004. doi: 10.3732/ajb.1400398
Shen, J., Zhang, X., Landis, J. B., Zhang, H., Deng, T., Sun, H., et al. (2020). Plastome evolution in Dolomiaea (Asteraceae, Cardueae) using phylogenomic and comparative analyses. Front. Plant Sci. 11:376. doi: 10.3389/fpls.2020.00376
Shi, Q. W., Su, X. H., and Kiyota, H. (2008). Chemical and pharmacological research of the plants in genus Euphorbia. Chem. Rev. 108, 4295–4327. doi: 10.1021/cr078350s
Sinn, B. T., Sedmak, D. D., Kelly, L. M., and Freudenstein, J. V. (2018). Total duplication of the small single copy region in the angiosperm plastome: rearrangement and inverted repeat instability in Asarum. Am. J. Bot. 105, 71–84. doi: 10.1002/ajb2.1001
Steinmann, V. W., and Porter, J. M. (2002). Phylogenetic relationships in Euphorbieae (Euphorbiaceae) based on ITS and ndhF sequence data. Ann. Missouri Bot. Gard. 89, 453–490. doi: 10.2307/3298591
Steinmann, V. W., Van Ee, B., Berry, P. E., and Gutiérrez, J. (2007). The systematic position of Cubanthus and other shrubby endemic species of Euphorbia (Euphorbiaceae) in Cuba. An. Jard. Bot. Madr. 64, 123–133. doi: 10.3989/ajbm.2007.v64.i2.167
Sun, Y. X., Moore, M. J., Meng, A. P., Soltis, P. S., Soltis, D. E., Li, J. Q., et al. (2013). Complete plastid genome sequencing of Trochodendraceae reveals a significant expansion of the inverted repeat and suggests a Paleogene divergence between the two extant species. PLoS One 8:e60429. doi: 10.1371/journal.pone.0060429
Thomson, A. M., Vargas, O. M., and Dick, C. W. (2018). Complete plastome sequences from Bertholletia excelsa and 23 related species yield informative markers for Lecythidaceae. Appl. Plant Sci. 6:e01151. doi: 10.1002/aps3.1151
Tillich, M., Lehwark, P., Pellizzer, T., Ulbricht-Jones, E. S., Fischer, A., Bock, R., et al. (2017). GeSeq - versatile and accurate annotation of organelle genomes. Nucleic Acids Res. 45, W6–W11. doi: 10.1093/nar/gkx391
Tokuoka, T. (2007). Molecular phylogenetic analysis of Euphorbiaceae sensu stricto based on plastid and nuclear DNA sequences and ovule and seed character evolution. J. Plant Res. 120, 511–522. doi: 10.1007/s10265-007-0090-3
Ueda, M., Fujimoto, M., Arimura, S., Murata, J., Tsutsumi, N., and Kadowaki, K. (2007). Loss of the rpl32 gene from the chloroplast genome and subsequent acquisition of a preexisting transit peptide within the nuclear gene in Populus. Gene 402, 51–56. doi: 10.1016/j.gene.2007.07.019
Vargas, V., Ortiz, E. M., and Simpson, B. B. (2017). Conflicting phylogenomic signals reveal a pattern of reticulate evolution in a recent high-Andean diversification (Asteraceae: Astereae: Diplostephium). New Phyt. 214, 1736–1750. doi: 10.1111/nph.14530
Villaverde, T., Pokorny, L., Olsson, S., Rincón-Barrado, M., Johnson, M. G., Gardner, E. M., et al. (2018). Bridging the micro-and macroevolutionary levels in phylogenomics: Hyb-Seq solves relationships from populations to species and above. New Phytol. 220, 636–650. doi: 10.1111/nph.15312
Walker, J. F., Walker-Hale, N., Vargas, O. M., Larson, D. A., and Stull, G. W. (2019). Characterizing gene tree conflict in plastome-inferred phylogenies. PeerJ 7:e7747. doi: 10.7717/peerj.7747
Wang, R. J., Cheng, C. L., Chang, C. C., Wu, C. L., Su, T. M., and Chaw, S. M. (2008). Dynamics and evolution of the inverted repeat-large single copy junctions in the chloroplast genomes of monocots. BMC Evol. Biol. 8:36. doi: 10.1186/1471-2148-8-36
Webster, G. L. (1967). The genera of Euphorbiaceae in the southeastern United States. J. Arnold Arbor. 48, 363–430.
Webster, G. L., Broom, W. V., and Smith, B. N. (1975). Systematics of photosynthetic carbon fixation pathways in Euphorbia. Taxon 24, 27–33. doi: 10.2307/1218995
Webster, G. L. (2014). “Euphorbiaceae,” in Flowering Plants. Eudicots: Malpighiales. ed. K. Kubitzki (Berlin, Heidelberg: Springer Berlin Heidelberg), 51–216.
Weng, M. L., Ruhlman, T. A., and Jansen, R. K. (2017). Expansion of inverted repeat does not decrease substitution rates in Pelargonium plastid genomes. New Phytol. 214, 842–851. doi: 10.1111/nph.14375
Wick, R. R., Schultz, M. B., Zobel, J., and Holt, K. E. (2015). Bandage: interactive visualization of de novo genome assemblies. Bioinformatics 31, 3350–3352. doi: 10.1093/bioinformatics/btv383
Wicke, S., and Naumann, J. (2018). Molecular evolution of plastid genomes in parasitic flowering plants. Adv. Bot. Res. 85, 315–347. doi: 10.1016/bs.abr.2017.11.014
Wicke, S., Schneeweiss, G. M., de Pamphilis, C. W., Muller, K. F., and Quandt, D. (2011). The evolution of the plastid chromosome in land plants: gene content, gene order, gene function. Plant Mol. Biol. 76, 273–297. doi: 10.1007/s11103-011-9762-4
Wu, C. S., Lai, Y. T., Lin, C. P., Wang, Y. N., and Chaw, S. M. (2009). Evolution of reduced and compact chloroplast genomes (cpDNAs) in gnetophytes: selection toward a lower-cost strategy. Mol. Phylogenet. Evol. 52, 115–124. doi: 10.1016/j.ympev.2008.12.026
Wu, C. S., Wang, Y. N., Hsu, C. Y., Lin, C. P., and Chaw, S. M. (2011). Loss of different inverted repeat copies from the chloroplast genomes of Pinaceae and cupressophytes and influence of heterotachy on the evaluation of gymnosperm phylogeny. Genome Biol. Evol. 3, 1284–1295. doi: 10.1093/gbe/evr095
Wurdack, K. J., Hoffmann, P., and Chase, M. W. (2005). Molecular phylogenetic analysis of uniovulate Euphorbiaceae (Euphorbiaceae sensu stricto) using plastid rbcL and trnL-F DNA sequences. Am. J. Bot. 92, 1397–1420. doi: 10.3732/ajb.92.8.1397
Xu, X., and Wang, D. (2021). Comparative chloroplast genomics of Corydalis species (Papaveraceae): evolutionary perspectives on their unusual large scale rearrangements. Front. Plant Sci. 11:600354. doi: 10.3389/fpls.2020.600354
Yang, J. B., Tang, M., Li, H. T., Zhang, Z. R., and Li, D. Z. (2013). Complete chloroplast genome of the genus Cymbidium: lights into the species identification, phylogenetic implications and population genetic analyses. BMC Evol. Biol. 13:84. doi: 10.1186/1471-2148-13-84
Yang, M., Zhang, X., Liu, G., Yin, Y., Chen, K., Yun, Q., et al. (2010). The complete chloroplast genome sequence of date palm (Phoenix dactylifera L.). PLoS One 5:e12762. doi: 10.1371/journal.pone.0012762
Yang, Y., and Berry, P. E. (2011). Phylogenetics of the Chamaesyce clade (Euphorbia, Euphorbiaceae): reticulate evolution and long-distance dispersal in a prominent C4 lineage. Am. J. Bot. 98, 1486–1503. doi: 10.3732/ajb.1000496
Yang, Y., Riina, R., Morawetz, J. J., Haevermans, T., Aubriot, X., and Berry, P. E. (2012). Molecular phylogenetics and classification of Euphorbia subgenus Chamaesyce (Euphorbiaceae). Taxon 61, 764–789. doi: 10.1002/tax.614005
Yi, X., Gao, L., Wang, B., Su, Y. J., and Wang, T. (2013). The complete chloroplast genome sequence of Cephalotaxus oliveri (Cephalotaxaceae): evolutionary comparison of cephalotaxus chloroplast DNAs and insights into the loss of inverted repeat copies in gymnosperms. Genome Biol. Evol. 5, 688–698. doi: 10.1093/gbe/evt042
Zhang, D., Gao, F., Jakovlic, I., Zou, H., Zhang, J., Li, W. X., et al. (2020). PhyloSuite: an integrated and scalable desktop platform for streamlined molecular sequence data management and evolutionary phylogenetics studies. Mol. Ecol. Resour. 20, 348–355. doi: 10.1111/1755-0998.13096
Zhang, J. F., Zhao, L., Duan, N., Guo, H. X., Wang, C. Y., and Liu, B. B. (2019). Complete chloroplast genome of Euphorbia hainanensis (Euphorbiaceae), a rare cliff top boskage endemic to China. Mitochondrial DNA B Resour. 4, 1325–1326. doi: 10.1080/23802359.2019.1596761
Zhu, A., Guo, W., Gupta, S., Fan, W., and Mower, J. P. (2016). Evolutionary dynamics of the plastid inverted repeat: the effects of expansion, contraction, and loss on substitution rates. New Phytol. 209, 1747–1756. doi: 10.1111/nph.13743
Keywords: comparative genomics, organellar evolution, phylogenetic inference, plastome rearrangement, spurge family, structural variations
Citation: Wei N, Pérez-Escobar OA, Musili PM, Huang W-C, Yang J-B, Hu A-Q, Hu G-W, Grace OM and Wang Q-F (2021) Plastome Evolution in the Hyperdiverse Genus Euphorbia (Euphorbiaceae) Using Phylogenomic and Comparative Analyses: Large-Scale Expansion and Contraction of the Inverted Repeat Region. Front. Plant Sci. 12:712064. doi: 10.3389/fpls.2021.712064
Edited by:
Hua-Feng Wang, Hainan University, ChinaReviewed by:
Gang Yao, South China Agricultural University, ChinaCopyright © 2021 Wei, Pérez-Escobar, Musili, Huang, Yang, Hu, Hu, Grace and Wang. This is an open-access article distributed under the terms of the Creative Commons Attribution License (CC BY). The use, distribution or reproduction in other forums is permitted, provided the original author(s) and the copyright owner(s) are credited and that the original publication in this journal is cited, in accordance with accepted academic practice. No use, distribution or reproduction is permitted which does not comply with these terms.
*Correspondence: Olwen M. Grace, by5ncmFjZUBrZXcub3Jn; Qing-Feng Wang, cWZ3YW5nQHdiZ2Nhcy5jbg==
Disclaimer: All claims expressed in this article are solely those of the authors and do not necessarily represent those of their affiliated organizations, or those of the publisher, the editors and the reviewers. Any product that may be evaluated in this article or claim that may be made by its manufacturer is not guaranteed or endorsed by the publisher.
Research integrity at Frontiers
Learn more about the work of our research integrity team to safeguard the quality of each article we publish.