- 1Center of Excellence in Environment and Plant Physiology, Department of Botany, Faculty of Science, Chulalongkorn University, Bangkok, Thailand
- 2Program in Biotechnology, Faculty of Science, Chulalongkorn University, Bangkok, Thailand
- 3Advanced Virtual and Intelligent Computing Research Center, Department of Mathematics and Computer Science, Faculty of Science, Chulalongkorn University, Bangkok, Thailand
- 4Omics Science and Bioinformatics Center, Faculty of Science, Chulalongkorn University, Bangkok, Thailand
- 5Genome Center and Department of Plant Biology, University of California Davis Genome Center, UC Davis, Davis, CA, United States
- 6Molecular Crop Research Unit, Department of Biochemistry, Faculty of Science, Chulalongkorn University, Bangkok, Thailand
- 7National Center for Genetic Engineering and Biotechnology, National Science and Technology Development Agency, Khlong Luang, Thailand
Salinity stress tolerance is a complex polygenic trait involving multi-molecular pathways. This study aims to demonstrate an effective transcriptomic approach for identifying genes regulating salt tolerance in rice. The chromosome segment substitution lines (CSSLs) of “Khao Dawk Mali 105 (KDML105)” rice containing various regions of DH212 between markers RM1003 and RM3362 displayed differential salt tolerance at the booting stage. CSSL16 and its nearly isogenic parent, KDML105, were used for transcriptome analysis. Differentially expressed genes in the leaves of seedlings, flag leaves, and second leaves of CSSL16 and KDML105 under normal and salt stress conditions were subjected to analyses based on gene co-expression network (GCN), on two-state co-expression with clustering coefficient (CC), and on weighted gene co-expression network (WGCN). GCN identified 57 genes, while 30 and 59 genes were identified using CC and WGCN, respectively. With the three methods, some of the identified genes overlapped, bringing the maximum number of predicted salt tolerance genes to 92. Among the 92 genes, nine genes, OsNodulin, OsBTBZ1, OsPSB28, OsERD, OsSub34, peroxidase precursor genes, and three expressed protein genes, displayed SNPs between CSSL16 and KDML105. The nine genes were differentially expressed in CSSL16 and KDML105 under normal and salt stress conditions. OsBTBZ1 and OsERD were identified by the three methods. These results suggest that the transcriptomic approach described here effectively identified the genes regulating salt tolerance in rice and support the identification of appropriate QTL for salt tolerance improvement.
Introduction
Salinity is a major environmental stressor that affects rice production worldwide. Salt stress decreases crop yield and limits agricultural productivity (Munns, 2002), particularly in non-irrigated farmlands by triggering two primary effects on plants, osmotic stress, and ion toxicity (Boyer, 1982). In most rice cultivars, the seedling and early booting stages are the most sensitive to salt stress (Lafitte et al., 2007). High concentrations of sodium ions are toxic to most plants (Dionisio-Sese and Tobita, 2000). A combination of ion toxicity and osmotic stress inhibits growth and affects plant development or cause cell death (Hasegawa et al., 2000; Zhu, 2001, 2002). Moreover, these factors affect enzyme activities, which lead to a reduction in photosynthetic rate, metabolism, growth, and development; additionally, pollen germination may also be affected, lowering fertility. These effects contribute to the lower yield of crops exposed to salt stress (Abdullah et al., 2001).
Salt tolerance is a polygenic trait, and although several genes regulating salt tolerance have been identified, there are still some genes regulating salt tolerance in different rice varieties that are yet to be identified. Thai jasmine rice or “Khoa Dawk Mali 105” (“KDML105”) rice is one of the most popular Thai rice cultivars among consumers. The high quality KDML105 grains are produced in rain-fed farms in the northeastern part of Thailand, and the farmlands are characterized by high soil salinity (2–16 dS.m−1). Kanjoo et al. (2012) developed a drought tolerant line by generating chromosome substitution lines (CSSLs) in the KDML105 rice genetic background. The introgressions in these CSSLs contain drought-tolerant quantitative trait loci (QTL) on chromosome 1 and were engineered via marker-assisted breeding by crossing KDML105 to a drought-tolerant donor, DH212. Chutimanukul et al. (2018a,b). Chutimanukul et al. (2019) reported that CSSL16, a CSSL from this population, exhibited salt tolerance when compared to other CSSLs and KDML105 at the vegetative and seedling stage.
RNA-seq has been widely used to investigate transcriptomes under biotic and abiotic stress conditions in several plants (Song et al., 2014; Garg et al., 2015). High-throughput information can be analyzed to understand plant responses at the transcriptional level using various methods. The gene co-expression network (GCN) is a simplified method used in investigating the biological functions of genes under different conditions using the node degree or hub centrality. GCN analysis was applied to identify the gene modules that regulate drought tolerance (Sircar and Parekh, 2015), salt tolerance (Chutimanukul et al., 2018b), and osmotic stress tolerance (Nounjan et al., 2018). However, this type of network is an undirect graph, which contains nodes corresponding to genes and edges representing neighborhood relations (Stuart et al., 2003; Lee et al., 2004). Recently, the analysis of complex data is being carried out using high-performance computing systems. Consequently, the clustering coefficient method was developed to identify genes in plants or animals exposed to different environment (Zhang and Horvath, 2005).
In the analysis of network topological features, the node degree is one of the most generally used analytical techniques to identify the connection between the number of hub genes and neighboring nodes in the network. The consideration of the important genes can refer to the high number of neighboring nodes. The local density of the connection, referred to as the clustering coefficient (CC), is the measurement of the local density that quantifies the network's tendency of the connections (Watts and Strogatz, 1998; Ravasz et al., 2002). Furthermore, CC was developed from a simple binary network to a weighted network to fulfill the prediction constant degree of any real-world network (Humphries and Gurney, 2008). There have been reports of CC in GCN datasets from yeast and cancer microarrays (Zhang and Horvath, 2005). Moreover, the data analysis of degree on weighted gene co-expression network (WGCN) can be used to construct the signed gene co-expression network to define transcriptional modules (Horvath, 2011). This technique can identify the hub genes in plants or animals subjected to different conditions and the genes responsible for human diseases (Horvath, 2011; Mukund and Subramaniam, 2015; Riquelme Medina and Lubovac-Pilav, 2016).
To perform the expression network analysis for the identification of genes regulating salt tolerance in rice, we used the expression datasets from a single pair of rice lines with similar genetic backgrounds, but different levels of salt tolerance. Therefore, we selected the CSSL population because the lines share a similar genetic background but possess different levels of salt tolerance. To create an expression network, transcriptome datasets of the selected lines at seedling and booting stages were used to identify the major (hub) genes responsible for salt tolerance, as these two stages are the most susceptible to salt stress in rice.
In this study, we compared various CSSLs with different size segments of the putative abiotic stress tolerance genomic region to validate the salt tolerance of CSSL16 at the booting stage. The transcriptome data from leaves at the seedling stage, second leaf, and flag leaf at the booting stage of CSSL16 were analyzed using GCN, CC, and WGCN to predict the major genes responsible for salt tolerance. The expression of some predicted genes was investigated in both salt-tolerant and-susceptible lines.
Materials and Methods
Plant Materials
Rice (Oryza sativa L.) seeds of CSSL lines (CSSL10, CSSL14, and CSSL16) with “KDML105” rice genetic background, and their parents (DH212 and KDML105) were obtained from the Rice Gene Discovery Unit (RGDU), National Center for Genetic Engineering and Biotechnology (BIOTEC), Thailand. CSSL16 contained the full segment of the putative salt tolerance region between RM1003–RM3362 (Chutimanukul et al., 2018b), while CSSL10 contained the segment between RM1003–RM6827, and CSSL14 contained the segment between RM3468–RM3362 (Figure 1). The three CSSL lines, CSSL10, CSSL14, and CSSL16, were compared with KDML105 and DH212 for salt stress responses. Then the best CSSL candidate for salt tolerance was selected for transcriptomic analysis.

Figure 1. The chromosomal segment substitution line of CSSL10, CSSL14, and CSSL16 with regions between RM1003 and RM3362 markers on chromosome 1. Some genes with putative functions, Nodulin (LOC_Os01g61010), BTBZ1 (LOC_Os01g66890), PSB28 (LOC_Os01g71190), and ERD (LOC_Os01g72210), are included.
Determination of the Photosynthetic Rate and Yield Components of the Lines at Booting Stage
Plant Growth Condition
CSSL10, CSSL14, CSSL16, and their parental lines, “KDML105” and DH212 were grown in plastic pots containing soil. We supplied the necessary nutrients by applying Bangsai nutrient solution (1:100) to the soils. At the booting stage, 75 mM NaCl was added to the nutrient solution of the treatment groups, but not to the control group. The addition of NaCl increased the soil EC to 8 dS.m−1, thus inducing salt stress. The experiment was performed in randomized complete block design with four replicates. Three plants per replicate were used for collecting the data. Analysis of variance was performed and means were compared with Duncan's multiple range test.
Measurement of Physiological Parameters
After 6 days of salt-stress at the booting stage, standard physiological responses, such as net photosynthetic rate (Pn), stomatal conductance (gs), internal CO2 concentration (Ci), transpiration rate (E), Fv/Fm, and performance index (Pi), were evaluated. In parallel, every 3 days from day 0 to 9 during salt-stress treatment, we classified rice responses using the standard evaluation system (SES) of rice (IRRI, 1996). After 9 days of salt stress, the saline solution was washed out to reduce soil salinity to 2 dS.m−1. Plants were then grown until seed harvest and yield components were determined.
At day 6 of salt stress, we measured gas exchange parameters in the middle portion of the flag leaves using a portable photosynthesis system (LI-6400 XT; LI-COR, Lincoln, NE). We used three plants per group as a replicate. The leaves were examined under the following conditions: 500 mmol m−2 s−1 air flow per unit leaf area, 1,200 mol m−2 s−1 photosynthetically active radiation (PAR) at leaf surface, leaf temperature ranged from 31.0 to 35.0°C, and a CO2 concentration of 380 mol mol−1.
Fv/Fm and Pi were measured according to the recommended procedures of FMS 2 (Hansatech, King's Lynn, UK). Leaves were dark-adapted for 40 min using dark-adapted leaf clips before measurement.
Experimental Design and Statistical Analysis
The study was laid out in a completely randomized design (CRD), with four replicates per treatment group (samples from three plants in a group constituted a replicate). Data of physiological parameters were subjected to analysis of variance (ANOVA) and significant means were compared using Duncan's multiple range tests (DMRT) by using SPSS version 21 (IBM Corp, Armonk, USA). Values were considered statistically significant at p < 0.05.
Identification of the Putative Salt Tolerant Genes via Transcriptome Analysis
RNA Extraction and Sequencing
To identify the genes regulating salt tolerance in rice, we focused on transcriptome analysis of CSSL16, which had the highest salt tolerance in the seedling and booting stages. Three replicates were used for each condition (CSSL16 grown under normal condition and under salt stress (75 mM NaCl treatment), respectively). Leaf tissues were collected at the seedling and booting stages. We harvested leaf samples from 21 days old seedlings after 0 and 2 days of salt stress, while flag leaves and second leaves were harvested at the booting stage on days 0 and 3. Leaves from the seedlings, flag leaves, and second leaves of untreated plants were used as the control. Three biological replications were conducted for this experiment. Total RNA was extracted from the leave samples using plant RNA purification reagent (Invitrogen, USA), and contaminated genomic DNA was removed with DNaseI (Invitrogen). cDNA libraries were constructed using the KAPA Stranded RNA-Seq Library Preparation Kit from Illumina® (Kapa Biosystem, USA). All short reads with a size of ~300 bp were selected and connected with adaptors. Thereafter, all fragments were enriched by PCR for 12 cycles. The cDNA libraries were sequenced using Illumina Next-Generation sequencing (Illumina, USA).
For transcriptome analysis, all short-sequence reads were classified into the right category and QC was performed using a pipeline created by Missirian et al. (2011). The transcriptome sequences were uploaded to the NCBI database with BioProject ID, PRJNA507040. The sequence reads were aligned and mapped to the rice genome database (Ouyang et al., 2007) using Bowtie 2 (Langmead and Salzberg, 2012). The DESeq program (version 1.24.0) was used to identify differentially expressed genes (Anders and Huber, 2010). Genes with p-value <0.01 were identified as differentially expressed genes.
Identification of Marker Genes by GCN and CC Analysis
The read count of the RNA-Seq was analyzed and normalized using the DESeq package in software R (Anders and Huber, 2010). We constructed the gene co-expression network of the rice lines under normal and salt stress conditions at the growth stages following the method of Suratanee et al. (2018), and these constructs were combined as whole-state networks. The expression levels of whole-state networks were mixed. The edges in the network were recognized by calculating and selecting gene pairs with highly correlated (r ≥ 0.9) levels of expression. Node degree is the number of edges connected to a node in a network, and clustering coefficient is a measure of the proportion of true connections and the number of all possible connections among neighbors of a gene node. The nodes represent the investigated genes, and the edges represent the significant co-expression level of any of the gene pairs. GCN identifies genes by using the degree or hub centrality. The clustering coefficient (CC) is a common measure of the true proportion of the link between the gene nodes and neighbors. The original clustering coefficient (small-world network) by Watts and Strogatz (1998) is as follows:
C(i) varies from 0 to 1. aij is a binary value from the connection between node i and node j. The degree of node i is ki. If all neighbors of i are themselves connected to another, CC equals 1, and if the neighbors of i do not connect to each other, CC equals 0. Based on a real-world network, their nodes are mostly connected with some level of strength connections or weights. Moreover, the clustering coefficient for a weighted graph was constructed from the total weights of the neighbors (Onnela et al., 2005).
Identification of Marker Genes by Weighted Co-expression Network (WGCN)
For WGCN, the connection of the network has its own values as a binary network of 0 or 1. Therefore, a weighted degree is the sum of all edges connecting the given node and neighbors. According to Onnela et al. (2005), a weighted graph of the clustering coefficient is obtained by taking the geometric mean of the total weights of its neighbors. Moreover, these connection weights can be positive or negative. While 0 represents no connection with neighbors, 1 represents the highest connection with all neighbors. The formula for using the real weights in the network is as follows:
The weight of the edge connecting nodes i and j is wij. The connection weights can be categorized as positive or negative. The value of Crealweight(i) is distributed in the range [0, 1], where 0 means that there were no neighbors to connect to each other, and 1 means that there were high connections with neighbors. This formula was used to calculate the clustering coefficient for the real weights in the network, while the original formula was performed using a cut-off for the weight estimation into a binary class.
To clarify the analysis of GCN, CC, and WGCN, Figure 2 shows an example of a gene co-expression network in the form of a binary network (Figure 2A) and in the form of a weighted network (Figure 2B). Gene identification by GCN analysis involves calculating the degree for each gene in the binary network in Figure 2A. Then, the highly connected nodes are recognized as marker genes. Therefore, G1 with degree of 4, G2 with degree of 6, and G3 with degree of 4 have more connections than the other genes and are identified as important markers. On the other hand, gene identification of CC explores the possibility of connections among the neighbors of a certain node. There are no connections among the neighbors of G1 and among the neighbors of G3, while there is one connection among the neighbors of G2. Therefore, the CC values of G1 and G3 are zero while the CC value of G2 is 1/15 since 15 is the total number of all possible connections among the six neighbors.
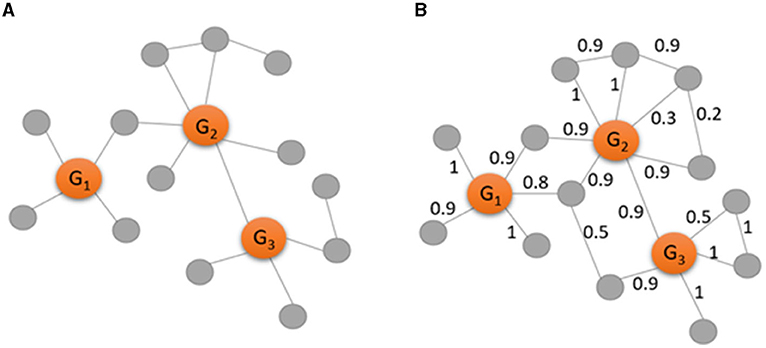
Figure 2. Examples of a binary gene co-expression network (A) and a weighted gene co-expression network (B) consisting of three observed genes (in orange) and 13 genes (in gray). The edges in the network (A) are recognized by calculating and selecting gene pairs with highly correlated (r ≥ 0.9), while the edges in the network (B) are weighted by the absolute values of the correlation.
Gene identification by WGCN involves the direct calculation of a weighted degree, that is the sum of all edge weights for a certain node in Figure 2B. With the use of weighted network, there are more edges with known strength as more information needs to be considered. Thus, the weighted degree of G1 is 4.6, the weighted degree of G2 is 5, and the weighted degree of G3 is 4.3. Comparing with the degree values above, the weighted network indicates that G1 is more important than G3 while they have the same level of importance in the binary network.
Validation of the Salt Tolerant Candidate Genes by Gene Expression Analysis
To validate regulation of salt-tolerance candidate genes by qRT-PCR, CSSL16, which had the highest salt tolerance at the seedling and booting stages, was compared with KDML105. The seeds of CSSL16 and KDML105 were soaked in water to induce germination. After 7 days, the seedlings were transplanted to nutrient solution (Udomchalothorn et al., 2014) with three replicates (three seedlings per replicate). Subsequently, after 7 days, the seedlings were transferred to nutrient solution without NaCl (control) and nutrient solution containing 75 mM NaCl (treatment group). Seedlings were harvested after salt stress treatment for 0, 3, 6, 12, 24, and 48 h for the early response and for the late response, seedlings were harvested on days 0, 3, and 6 of treatment.
Gene Expression Analysis
Total RNA was extracted from the shoots of seedlings from the control and treatment groups using GENEzol GZR100 (Geneaid Biotech, Taiwan). The RNA was treated with DNase I (Thermo Scientific, USA) and converted into cDNA. cDNA synthesis was performed using an Accupower RT premix (Bioneer Inc., Alameda, USA). The synthesized cDNA was used as template for the PCR. qRT-PCR was conducted using Luna Universal qPCR master mix M3003L (New England Biolabs Inc., USA).
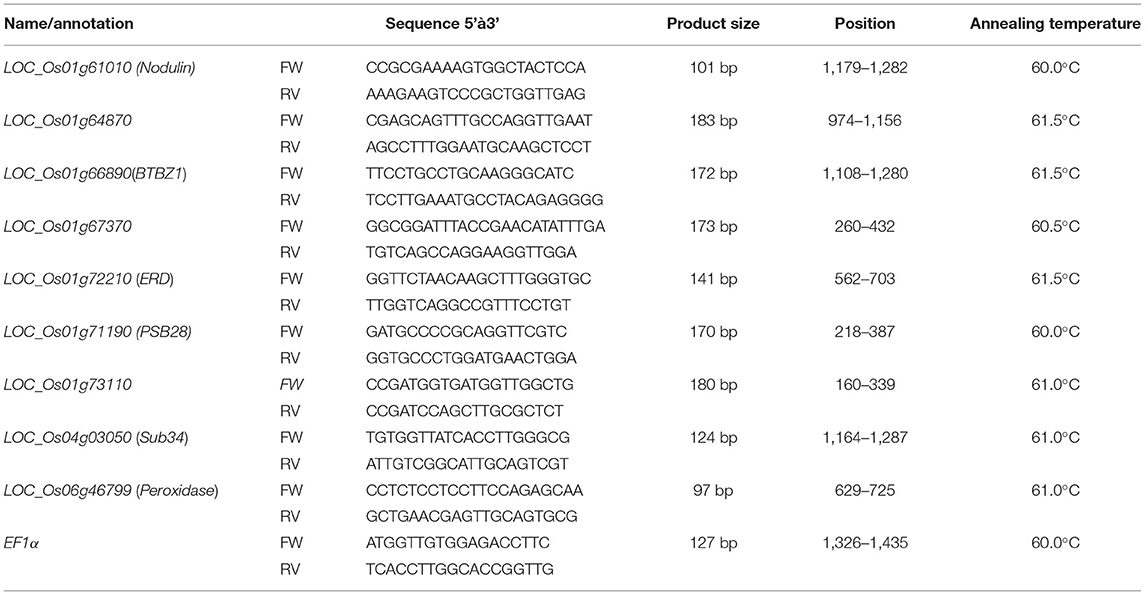
Quantitative RT-PCR reactions were conducted on three technical replicates for each sample. No template (NTC) was used as a negative control, and EF-1α primers (Chutimanukul et al., 2018b) were used as an internal control to standardize the equal template in the reaction. Gene sequences were obtained from the rice genome database (Ouyang et al., 2007) and then submitted to Primer3 to generate specific primers for the nine selected genes (Table 1). Relative gene expression was determined by qRT-PCR. The PCR conditions were as follows: an initial denaturation step at 95°C for 60 s, followed by 35 cycles of denaturation at 95°C for 15 s, annealing steps with the temperature shown in Table 1 for 30 s, and continued with an extension step at 75°C for 30 s. The melt curve and plate read were set at 60–94°C with increasing temperature at the rate of 5°C per 5 s. Average cycle threshold (Cq) values of all genes were normalized to the level of EF-1α reference genes in the same sample and then used to measure relative gene expression by following the ΔΔCt method as described by Pfaffl (2001). The gene expression analysis was interpreted based on the relative expression levels, and SPSS software was used for the analysis of variance (p < 0.05).
Analysis of Arabidopsis Mutant Lines for Salt Stress Responses
The selected mutant seeds were ordered from Arabidopsis Biological Resource Center (ABRC). The homozygous mutant lines were screened according to SALK T-DNA primer design. The homozygous mutant lines used in this experiment were bt3, psb28, AT5G45310, sbt3.3, sbt3.4, and per3 mutants. Col-0 wild type (WT) was used as a control. The evaluation of salt stress response was performed with complete randomized design with three replicates. Each replicate contained 20 seedlings. Mutant lines and WT seeds were sterilized and germinated for 7 days after stratification at 4°C for 48 h. Then, 7 day-old seedlings were transferred to the freshly prepared MS medium with or without 100 mM NaCl addition. After 7-day incubation under light intensity of 35 mmol.m−2.s−1, 16/8 light/dark cycle at 22 °C, dry weight was measured with 15 plants per treatment. Photosynthetic pigment contents were determined from 5 plants per treatment according to Wellburn (1994). The absorbance at A470, A646.8, and A663.2 were measured to determine Chlorophyll a, chlorophyll b and carotenoid contents by using the following equations:
Putative Promoter Analysis
The putative promoter region (2 kb upstream from coding region) of OsBTBZ1 gene of KDML105 and CSSL16 was retrieved from PRJNA659381. Sequence alignment was performed by using Needle tool via EMBOSS. Cis-elements were searched against PLACE database (Higo et al., 1999).
Results
CSSL16 Sustained Photosynthetic Responses Under Salt Stress at Booting Stage
The physiological study showed that the net photosynthesis rate (Pn) of the flag leaves of the rice lines under normal grown condition was not significantly different (Figure 3A). However, the Pn of the second leaves of the lines were significantly different, with the second leaves of “KDML105” recording the highest Pn values, while the second leaves of CSSL14 grown under normal conditions had the lowest Pn values.
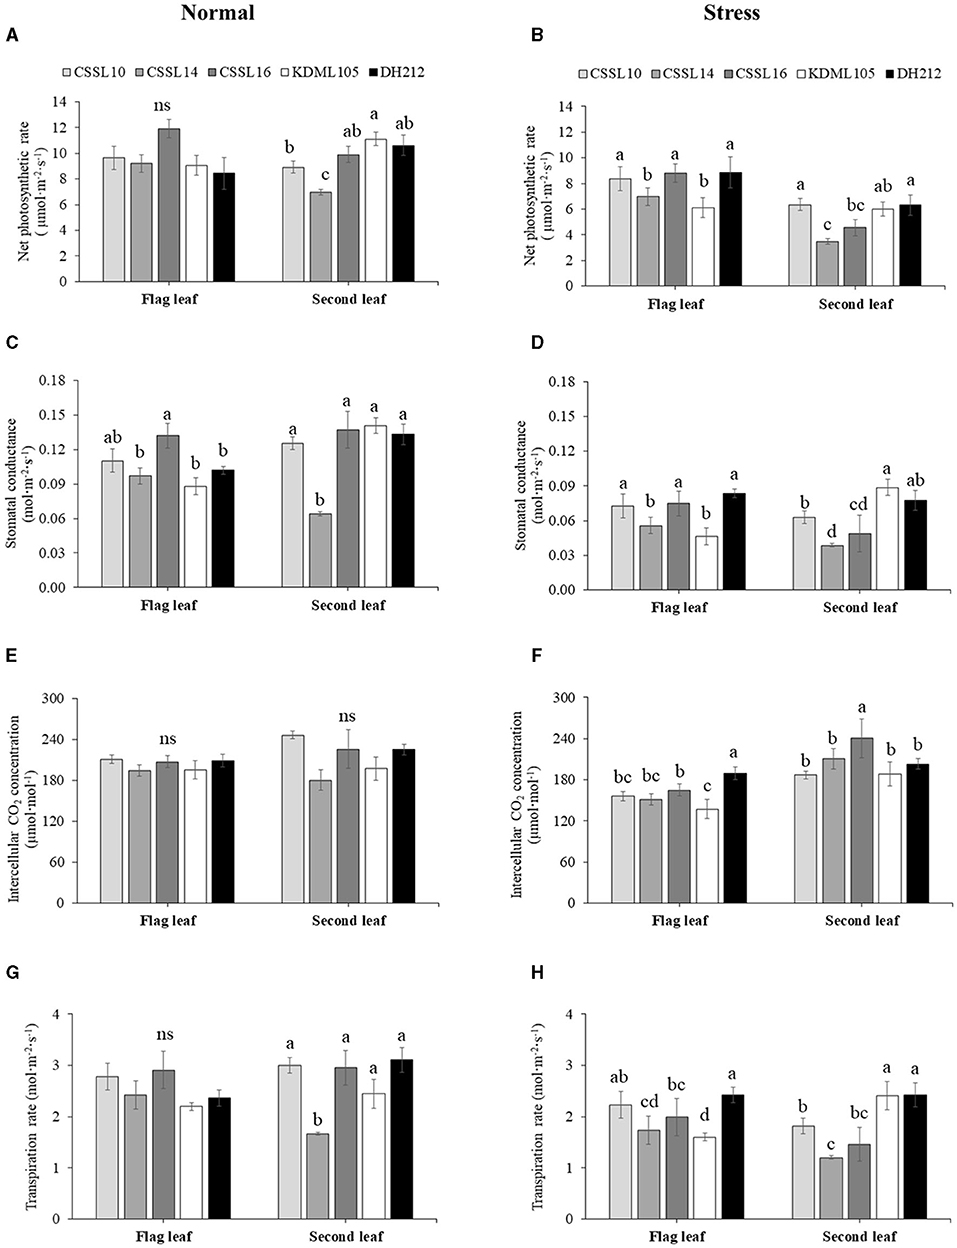
Figure 3. Gas exchange parameters, net photosynthesis rate [Pn, (A,B)], stomatal conductance [gs, (C,D)], internal CO2 concentration [Ci, (E,F)], and transpiration rate (E,G,H) of flag leaves and second leaves of CSSL10, CSSL14, CSSL16, “KDML105,” and DH212 under normal and salt stress conditions. Values are represented as mean ± SE (n = 4). Different letters above bars indicate significant difference between lines at p < 0.05. “ns” indicates no significant difference.
Salt stress caused a decrease in the Pn of the flag leaf and second leaf of the lines (Figure 3B). The flag leaves of CSSL10, CSSL16, and DH212 had significantly higher Pn than those of “KDML105” and CSSL14, while the second leaves of CSSL10 had similar Pn values to those of “KDML105” and DH212. A similar response was also found in stomatal conductance (Figures 3C,D). The Ci levels of rice grown under normal conditions were not significantly different; contrarily, the Ci levels of both flag leaves and second leaves of rice lines grown under salt stress were significantly different with the second leaves of “CSSL16” recording the highest Ci level (Figures 3E,F). The transpiration rate of these plants was consistent with their gs (Figures 3G,H).
Salt stress did not affect the PSII efficiency (Fv/Fm) of the flag leaves (Figures 4A,B). Additionally, the Pi's of the flag leaves were not significantly different under normal growth condition; contrarily, salt stress significantly affected the Pi's of the flag leaves, with CSSL14 recording the highest Pi, while “KDML105” recorded the lowest. The second leaves of CSSL16 recorded the highest Pi both under normal growth condition and under salt stress, while the second leaves of “KDML105” had the lowest Pi both under normal growth condition and under salt stress. Overall, the Pi's of the second leaves of the rice lines were significantly different both under normal growth conditions and under salt stress (Figures 4C,D). During the first 6 days and after 9 days under salt stress conditions (Figure 5), CSSL16 and DH212 had significantly lower SES than the other lines.
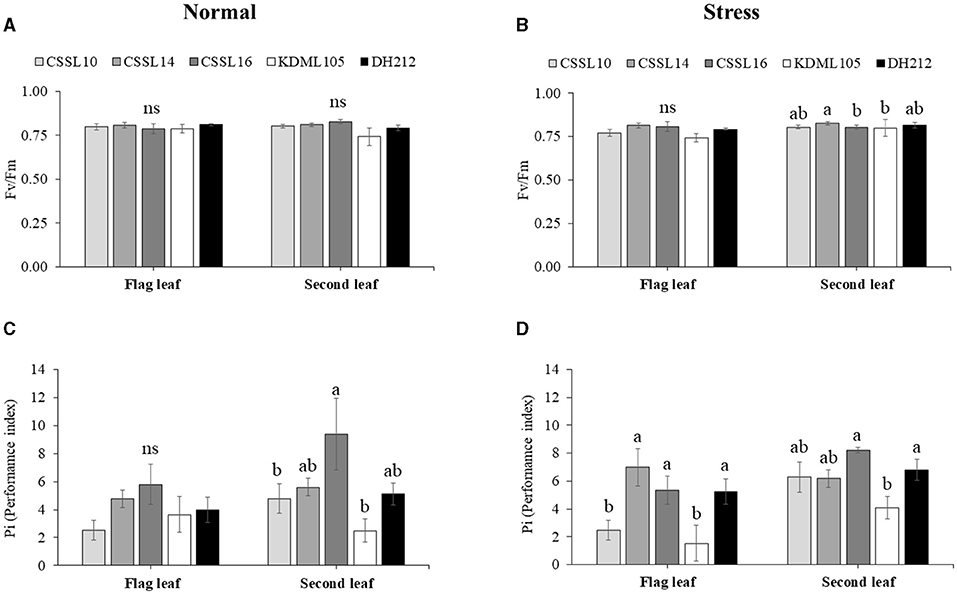
Figure 4. Maximum PSII efficiency (Fv/Fm) (A,B) and Performance index (Pi) (C,D) of flag leaves and second leaves in CSSL10, CSSL14, CSSL16, “KDML105.” and DH212 under normal and salt stress conditions. Values are represented as mean ± SE (n = 4). Different letters above bars indicate significant difference between lines at p < 0.05. “ns” indicates no significant difference.
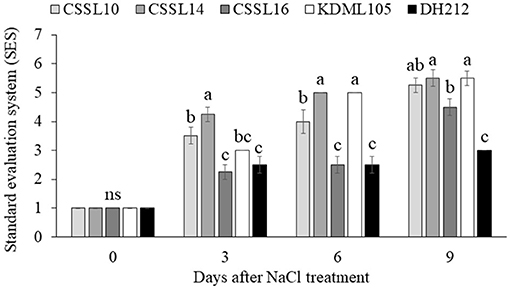
Figure 5. Standard evaluation system (SES) determined from the appearance of plants under salt stress condition for 0, 3, 6, and 9 days. Values are presented as mean ± SE (n = 4). Different letters above bars indicate significant difference between lines at p < 0.05. “ns” indicates no significant difference.
CSSL16 Had Higher Yield Components Than That Did “KDML105” and Other CSSLs
After exposing the rice seedlings to salt stress at 8 dS.m−1 for 9 days, soil salinity was reduced to 2 dS.m−1 and the plants were grown under this condition until grain harvest. The yield components of the different lines were determined after harvest (Table 2). Results showed that rice lines with KDML105 genetic background recorded higher tiller numbers per plant than the corresponding, introgression-free line DH212. Salt stress decreased tiller numbers per plant, panicle numbers per plant, panicle length, total seed number, and number of filled grains per plant. Moreover, shoot fresh weight, dry weight, and height were affected by salt stress (Table 2). CSSL16 had the highest tiller numbers per plant, panicle number per plant, total seed number per panicle, filled grain, and seed number per plant, compared to the other lines. Based on gas exchange parameters, PSII efficiency and yield component, CSSL16 was the most tolerant line under high salt stress at the booting stage. This suggested that the presence of the whole QTL region was required to achieve the best tolerance, implicating the action of two or more genes Therefore, CSSL16 was chosen for transcriptome analysis.
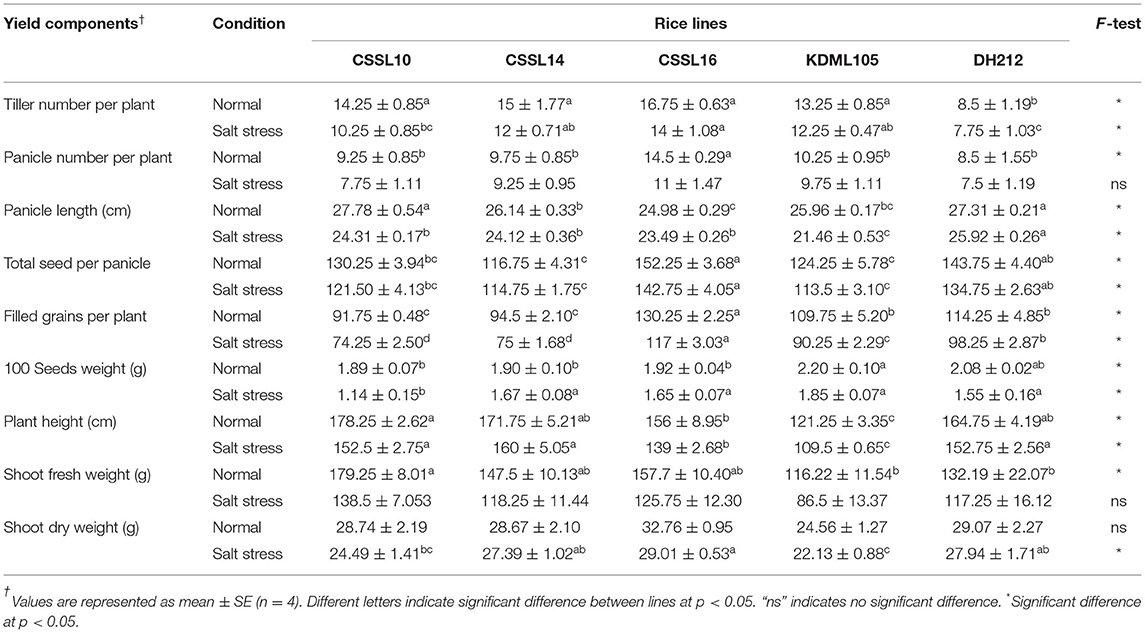
Table 2. Yield components of CSSL10, CSSL14, CSSL16, “KDML105,” and DH212 grown under normal or salt stress conditions (8 dS.m−1) at booting stage for 9 days.
Transcriptomics Profile of CSSL16 Rice at Seedling and Booting Stages
To identify genes regulating salt tolerance in rice, we analyzed the transcriptome of three seedling leaves, and from the flag and second leaves of CSSL16 plants exposed to normal growth condition and salt stress, respectively. Gene expression was examined by RNA sequencing of the leaves of seedlings at 0 and 2 days of treatment. At the booting stage, RNA sequencing was performed from flag leaf and second leaf samples at 0 and 3 days of treatments. We identified 511 differentially expressed genes in the leaves of the seedling, while 520 and 584 differentially expressed genes were identified in the second leaf and flag leaf, respectively (Supplementary Files 1, 2). More than 50% of the differentially expressed genes were downregulated by salt stress at the seedling stage and in the flag leaves at the booting stage. Contrarily, <50% of the differentially expressed genes were downregulated by salt stress in the second leaf.
We used the ClueGo tool to screen for gene ontology (GO) terms that were significantly enriched by the DEGs. The results showed that genes enriched in biological processes, such as response to inorganic substances, oxygen-containing compounds, alcohol, heat, and temperature stimulus were downregulated in the leaves of the seedlings, while the genes involved in cell wall biogenesis, cellular glucan metabolism, and glucan metabolism were upregulated (Supplementary Figure 1). We compared the transcriptomes of the second leaf before and after 3 days of salt stress. The GO enrichment analysis of the second leaf indicated a significant upregulation of genes regulating temperature and heat responses, and the sizes of cellular components and anatomical structures (Supplementary Figure 2), while genes enriched in cellular chemical homeostasis and chemical homeostasis were downregulated. When the plants were exposed to salt stress, the upregulated genes were enriched in response to heat and temperature stimulus (Supplementary Figure 3).
Combining the Gene Co-expression Network Analysis With SNP Information Can Identify Salt Tolerant Genes
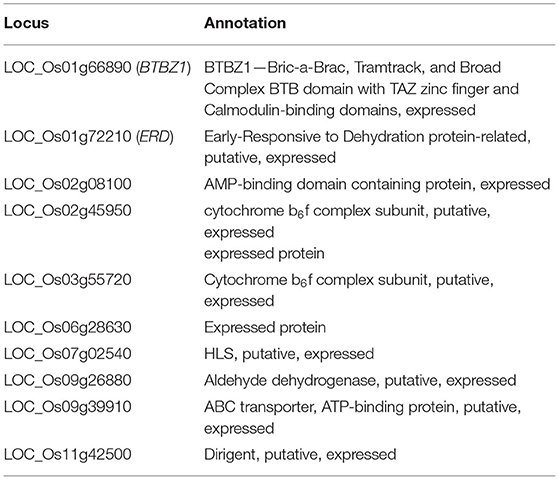
The co-expression networks under salinity and normal conditions were constructed by calculating the correlation of the expression levels of DEGs in the plants (leaves of the seedlings, flag leaves, and second leaves). Genes that were highly correlated (r > 0.9) under normal condition were used to construct the normal-state network. Similarly, genes that were highly correlated under salinity stress were used to construct the salinity-state network. We found 579 DEGs in the normal-state network and 573 DEGs in the salinity-state network. The results showed that the network created from expression data under normal conditions had higher number of nodes, edges, connection per node, and average degree than those of the network created from the expression data under the salt stress condition. The genes involved in salt tolerance were selected from genes with high connections per node under salt stress conditions and low connections per node under normal conditions. Fifty-seven candidate genes (Supplementary File 2) were selected. Most of the selected genes were on chromosome 1. Four of them, LOC_Os01g64870, LOC_Os01g66890, LOC_Os01g67370, and LOC_Os01g72210 were located in the salt/drought tolerant QTL reported by Kanjoo et al. (2012). LOC_Os01g72210 and LOC_Os01g67370 encoded unknown expressed proteins, while LOC_Os01g66890 was annotated as BTBZ1 and LOC_Os01g72210, was annotated as a protein part of the early response to dehydration (ERD) protein. Both BTBZ1 and ERD displayed SNPs between CSSL16 and “KDML105” in the promoter, 5'UTR, exons, introns, and 3'UTR.
We analyzed the distributions of the clustering coefficients for the binary network by comparing a dense local cluster between salt stress and normal conditions. The clustering coefficient analysis identified 30 genes involved in salt tolerance (Supplementary File 3). Four genes were located in the salt/drought tolerant QTL (Kanjoo et al., 2012), LOC_Os01g61010, LOC_Os01g66890 (BTBZ1), LOC_Os01g72210 (ERD), and LOC_Os01g73110. The CC analysis identified BTBZ1 and ERD, which were also identified by GCN analysis. LOC_Os01g61010 was annotated as encoding a Nodulin, while LOC_Os01g73110 encoded an unknown expressed protein.
Furthermore, we identified 59 genes using weighted co-expression network analysis (Supplementary File 2). LOC_Os01g64870, LOC_Os01g66890 (BTBZ1), LOC_Os01g71190, LOC_Os01g72210 (ERD), and LOC_Os04g03050 were located in the salt/drought QTL (Koyama et al., 2001; Kanjoo et al., 2011, 2012). Moreover, three out of the five genes (LOC_Os01g64870, BTBZ1, and ERD) were identified by both the co-expression network and clustering coefficient analyses. The other three genes included LOC_Os01g71190 (PSB28), which was annotated to encode the protein involved in photosystem II reaction center, while LOC_Os04g03050 and LOC_Os06g46799 encoded subtilisin (OsSub34) and peroxidase precursor, respectively.
Figure 6A displays a Venn diagram of the genes identified using the three network analyses. The blue, red, and green circles included genes identified by GCN, CC, and WGCN, respectively (Figure 6A). In total, we identified 92 genes using the three methods. Among the genes, 10 were identified by each of the three methods (Table 3). The co-expression network of 92 genes identified by GCN, CC, and WGCN is shown in Figure 7. The 10 genes, identified by these three techniques (GCN, CC, and WGCN), are displayed as red circles.
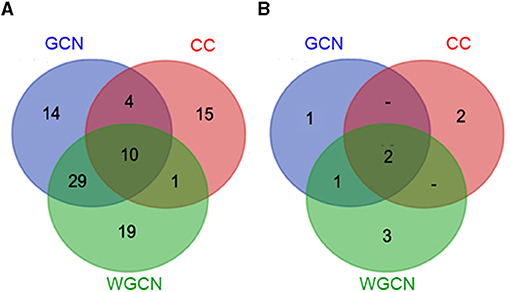
Figure 6. Venn diagram (A) showing the number of salt-responsive genes from co-expression network analysis (blue circle), Clustering coefficient analysis (red circle), weighted co-expression network analysis (green circle), and Venn diagram (B) showing number of salt-responsive genes containing the SNPs in each method analysis.
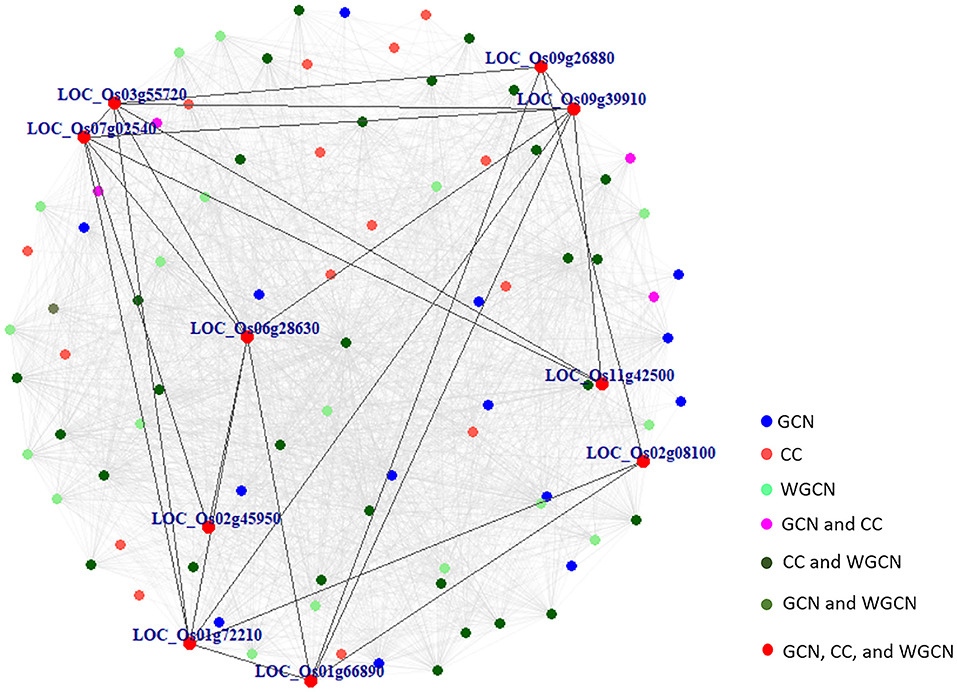
Figure 7. The co-expression network of 92 marker genes identified by GCN, CC, and WGCN. Ten genes in red were detected by all methods and the connections among them were shown in darked lines. All gray lines represent the connections among these 92 marker genes.
Using SNPs found in CSSL16 and “KDML105,” the number of genes identified by GCN, CC, and WGCN were 4, 4, and 6, respectively (Figure 6B). Together with the three methods of transcriptome analysis and SNP information of the salt tolerant and susceptible lines, we identified nine genes, which were responsible for salt tolerance in rice (Figure 6B and Table 4). Two out of these genes, which are LOC_Os01g66890 (BTBZ1) and LOC_Os01g72210 (ERD), contain SNPs between CSSL16 and “KDML105” rice. In addition, these two genes are connected to each other in the network (Figure 7). We hypothesize that the nine genes were responsible for the salt tolerance of CSSL16 compared with KDML105 rice.
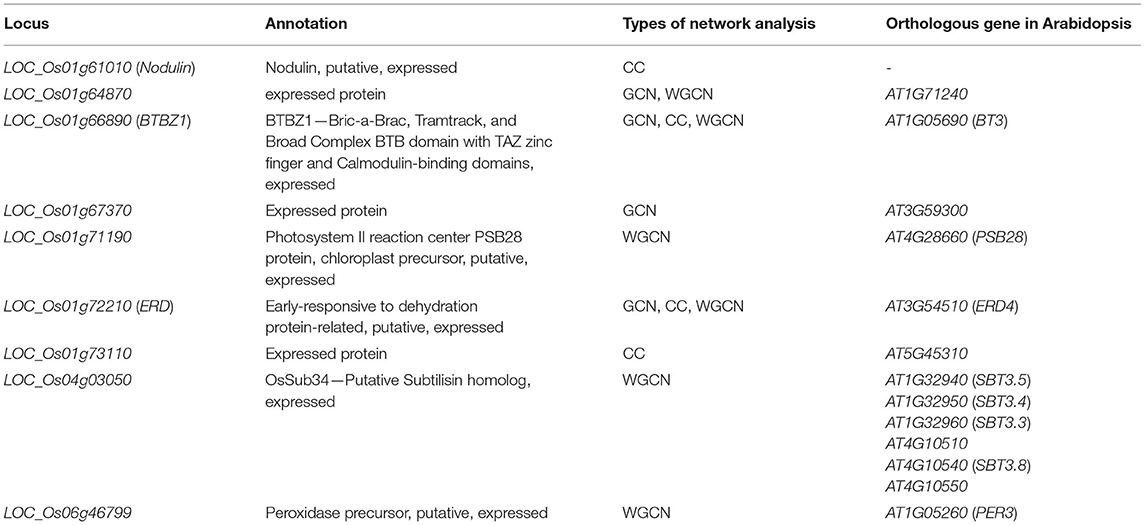
Table 4. Putative salt tolerance genes predicted by GCN, CC, and WGCN containing SNPs between CSSL16 and “KDML105” rice.
Significantly Different Expression Levels of the Candidate Genes in CSSL16 After Salt-Stress Treatment
To examine the salt-tolerance candidate gene expression, we used qRT-PCR to study the expression response to salt stress of the nine genes in Table 4. After growing rice seedlings for 14 days, 75 mM NaCl was added to the nutrient solution. We compared their expression in CSSL16, the salt-tolerant genotype, and in its salt-susceptible parent, “KDML105.” The comparison was performed in two sets of experiments to investigate the early (0, 3, 6, 12, 24, and 48 h after stress) and late (0, 3, and 6 days after stress) responses. After 6 days of salt stress, morphology of the plants is displayed in Figures 8A,B. For early stress responses, OsNodulin expression did not vary much during this period of salt stress (Figure 9A), while LOC_Os01g64870 expression in the salt-treated CSSL16 after 12 h of salt treatment was increased to more than 7-fold higher than treated KDML105 (Figure 9B). The expression levels of OsBTBZ1 (Figure 9C), LOC_01g67370 (Figure 9D), and OsPeroxidase (Figure 9I) in the salt-treated CSSL16 were also significantly higher than those of the salt-treated KDML105 after 12 h of the treatment, while the expression levels of OsERD (Figure 9E), LOC_01g73110 (Figure 9G), and OsSub34 (Figure 9H) in CSSL16 was dramatically higher than KDML105 after 6 h of salt stress. It is worth mentioning that the expression of OsBTBZ1, OsERD, OsSub34, and LOC_01g73110 was induced more than 15-fold by salt stress in the early response. The expression level of OsPSB28 (Figure 9F) was higher in CSSL16 after 6 and 48 h of stress, but the level of expression was fluctuating and did not show much difference during this early response.

Figure 8. Fourteen day-old KDML105 and CSSL16 seedlings after growing in nutrient solution in nomral condition or supplementaed with 75 mM NaCl for 6 days (A,B) and the seedlings that were soil-grown and treated with 75 mM for 12 days (C) or grown in normal condition (D).
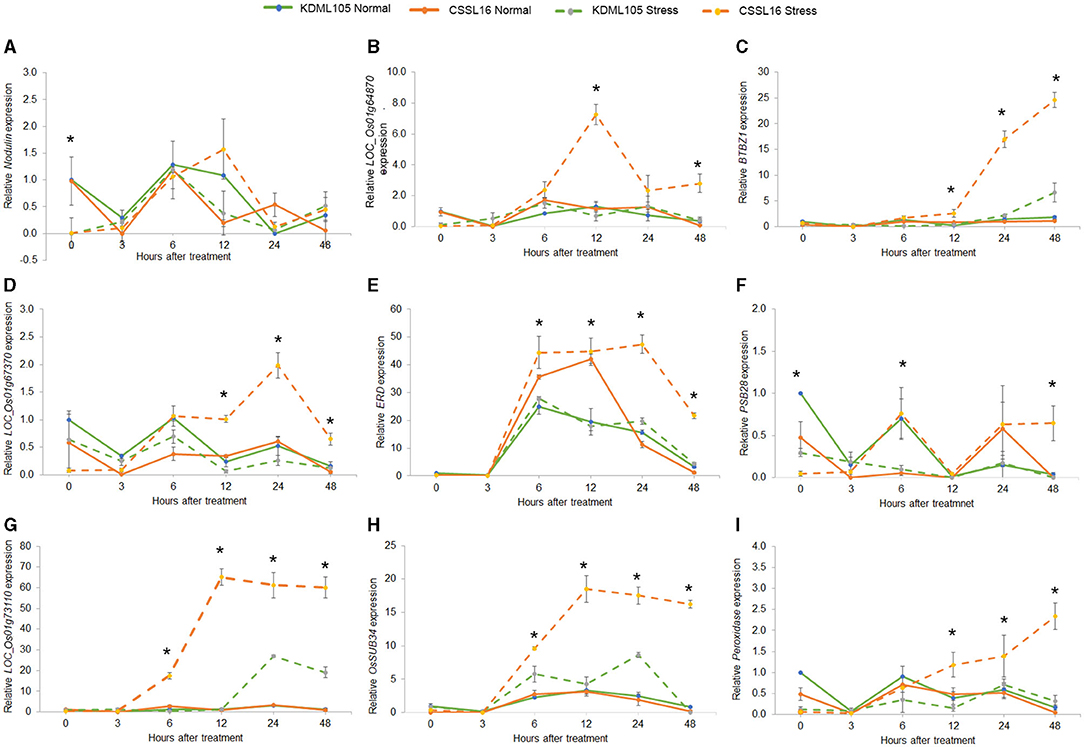
Figure 9. Gene expression analysis of nine candidate genes, Nodulin (A), Os01g64870 (B), BTBZ1 (C), Os01g67370 (D), ERD (E), PSBS28 (F), Os01g73110 (G), Sub34 (H), and Peroxidase (I) in CSSL16 and KDML105 under normal and salt stress conditions after 0, 3, 6, 9, 12, 24, and 48 h of salt stress. *indicates the significant difference among mean of the gene expression at p < 0.05.
For the late response, the expression of Nodulin (Figure 10A), LOC_Os01g64870 (Figure 10B), BTBZ1 (Figure 10C), LOC_Os0167370 (Figure 10D), and PSB28 (Figure 10F), increased significantly in CSSL16, but decreased in KDML105 at 3 days of exposure to salt stress. However, the expression of ERD (Figure 10E) and LOC_Os01g73110 (Figure 10G) increased in both CSSL16 and KDML105 at 3 days of salt stress. After 6 days of salt stress, the expression of Nodulin, LOC_Os01g64870, and BTBZ1 was still higher in CSSL16 compared with that of KDML105, but the expression of LOC_Os01g73110 decreased, while the expression of ERD increased. After 6 days of salt stress, the expression of ERD increased by more than 4.5- and 4-fold in CSSL16 and KDML105, respectively. The expression of OsSub34 was reduced by salt stress in both lines; however, this decrease was more pronounced in CSSL16 than that in “KDML105” (Figure 10H). Peroxidase increased after 6 days of salt stress in both lines (Figure 10I). The results suggest that the nine candidate genes may be involved in salt tolerance in rice.
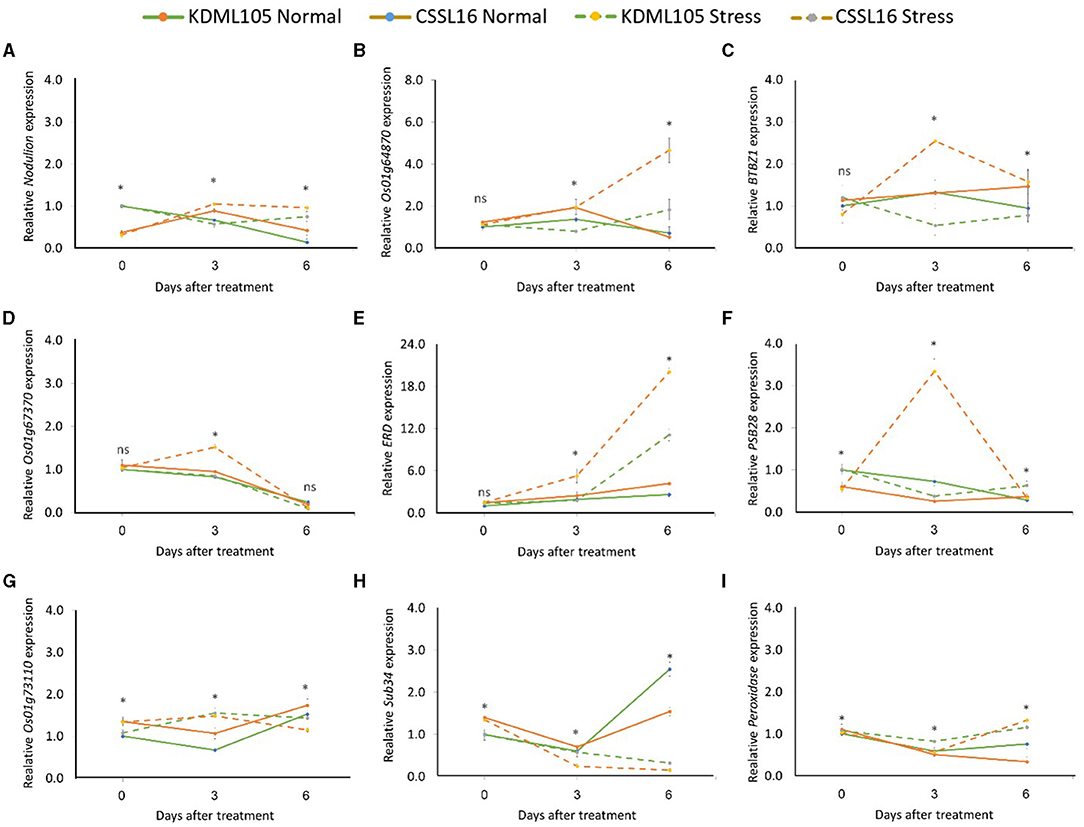
Figure 10. Gene expression analysis of nine candidate genes, Nodulin (A), Os01g64870 (B), BTBZ1 (C), Os01g67370 (D), ERD (E), PSBS28 (F), Os01g73110 (G), Sub34 (H), and Peroxidase (I) in CSSL16 and KDML105 under normal and salt stress conditions at day 0, 3, and 6 of salt stress. *indicates the significant difference among mean of the gene expression at p < 0.05.
The Predicted Genes Have the Potentials to Function in Salt Tolerance
In order to investigate the potential of these predicted genes for functioning in salt tolerance, Arabidopsis mutant lines containing T-DNA insertion in the genes orthologous to the predicted rice genes, were analyzed for their salt responsive phenotypes. Due to the dramatically higher induction at early response of OsBTBZ1, OsSub34, and LOC_01g73110, the Arabidopsis mutants of their ortholgous genes (Table 4), namely bt3, sbt3.3, sbt3.4, and at5g45310 mutants, were analyzed. Although OsERD4 displayed high level during early induction, the erd4 mutant was not included in this analysis because no homozygous insertion lines could be obtained. Finally, the psb28 and per3 mutants were included in this experiment and Col-0 wild type (WT) was used as a control.
Under normal growth condition, sbt3.4, psb28, and per3 mutants showed significantly higher dry weights than WT, while the bt3 mutant had significantly lower dry weight. The photosynthetic pigment contents were also different among these lines. The at5g45310 mutant displayed a similar phenotype to the WT, and so did sbt3.3, except that sbt3.3 had higher chl a content than the WT (Table 5).
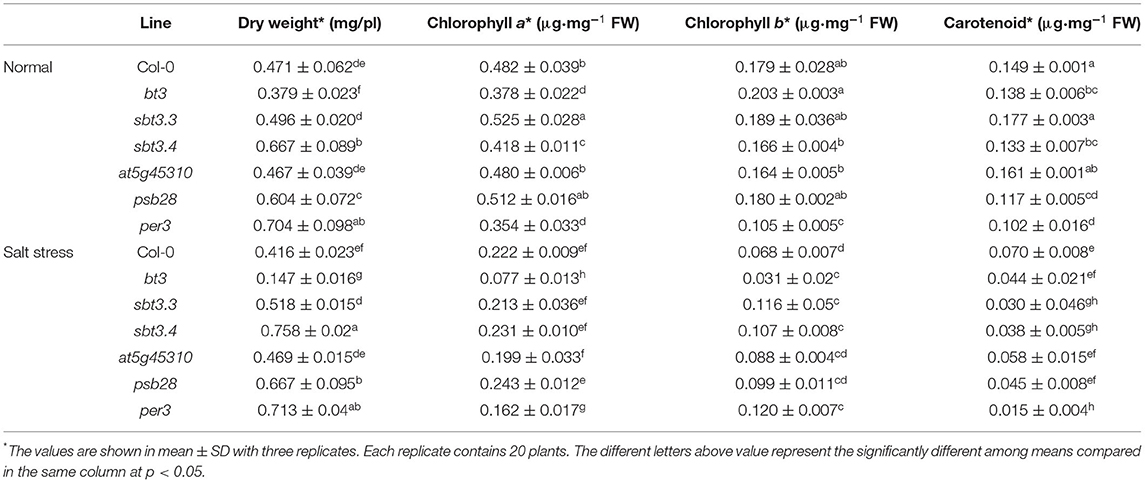
Table 5. Dry weight per plant, chlorophyll a, chlorophyll b and carotenoid contents of 14 day-old Col-0 wild type, bt3, sbt3.3, sbt3.4, at5g45310, psb28, and per3 mutants grown in MS medium or MS medium supplemented with 100 mM NaCl for 7 days.
Salt stress caused dry weight reduction in the WT, but it had decreased effects on the sbt3.3, sbt3.4, at5g45310, per3, and psb28 mutants. A negative effect of salt stress on dry weight was detected in the bt3 mutant, with more than 60% reduction in dry weight. Salt stress conditions caused the reduction of photosynthetic pigments content in all lines, especially the bt3 mutant, whose photosynthetic pigments content was decreased more than 65%. Interestingly, the carotenoid content in sbt3.3 and per3 mutants was dramatically decreased by salt stress (more than 80% reduction), but both mutants displayed better Chl b maintenance than the WT (Table 5). These changes in salt stress responses in these mutant lines, when compared to WT, suggest a role for these genes in salt stress adaptation in Arabidopsis and reinforce the hypothesis of functions of these gene families in other plant species, including rice.
Because the bt3 mutant displayed the highest growth inhibition and photosynthesis pigment reduction and the OsBTBZ1 gene was highly-induced under salt stress, we focused on its promoter. We compared putative regulatory sequences 2 kb base pairs upstream from the coding region of OsBTBZ1 in the KDML105 and CSSL16 accessions analyzing it for putative regulatory cis-elements (Supplementary Figure 4).
Three ABA responsive elements (ABREs) are located within 250 base pairs upstream of the gene. Moreover, four MYC binding sites, which represent water-stress responsive elements, are located within this region, and two out of four overlapped with the ABREs. Beyond this region, −251 to −2,000 bp, 12 more MYC binding sites are found. The MYB transcription factor was also reported for water stress and salt stress regulation (review; Ponce et al., 2021). Five MYB binding sites are located in the putative regulatory sequence of OsBTBZ1 gene.
Two elements that are found only in the putative regulatory region of CSSL16's OsBTBZ1 gene, but not in KDML105's are an endosperm-specific element (AAAG) and GAGA-binding site. The insertion and base substitution in KDML105 eliminate the two elements found in CSSL16. This polymorphism may contribute to the difference in OsBTBZ1 gene expression level in these two rice lines.
Discussion
In the present study, the results of the gas exchange parameters and yield components indicated that CSSL16 was more resistant to salt stress than KDML105 at the booting stage, as it recorded higher Pn and yield components than KDML105 (Table 2). This was consistent with the reports of Chutimanukul et al. (2018a,b), who examined salt tolerance in rice at the seedling and vegetative stages. Salt-tolerant rice varieties can maintain their photosynthetic ability after a short period of salt stress (Moradi and Ismail, 2007); however, shoot biomass may decrease (Bhowmik et al., 2009; Krishnamurthy et al., 2009). In the present study, we documented higher stomatal conductance in CSSL16 than in “KDML105,” which may have contributed to the higher net photosynthetic rate observed in CSSL16 (Figures 1B,D). Robinson (1988) reported that stomatal conductance and transpiration rate adaptation were the most important mechanisms for salt tolerance. Although the Pn of the second leaves of CSSL16 was lower than the Pn of the second leaves of KDML105, the tiller number per plant and filled grain number of CSSL16 were higher than those of KDML105 after salt stress. These results suggest that photosynthetic activity in the flag leaves contributed more to grain filling than that of the second leaves. However, salt stress during the booting stage did affect the overall yield of the rice lines (Table 2).
Studies in various plant species have shown that salt stress results in a decrease in Fv/Fm (Huang et al., 2014; Martins et al., 2020; Sun et al., 2021). A reduction of Fv/Fm can be used as an indicator of photo-inhibition in stressed plants (Hichem et al., 2009). In the present study, the Fv/Fm values of the flag leaves were unaffected by salt stress at the booting stage. Lisa et al. (2011) reported an increase in the expression of photosynthesis-related genes in salt tolerant rice cultivars. In the present study, photosynthesis was sustained in the CSSL16 at the vegetative stage under salt stress and this may be due to the higher expression of the PsbS1 gene encoding the chlorophyll binding protein in photosystem II (Chutimanukul et al., 2018b). Contrarily, the “KDML105” rice had the lowest Pn, suggesting that it was the most susceptible compared with the other lines. Pi refers to the quantum efficiency of primary photochemistry, the concentration of reaction centers, and excitation energy conversion in electron transport (Melis, 1999; Strasser et al., 2000). At the booting stage, CSSL14 and CSSL16 had higher Pi values under salt stress (Figure 3F), indicating that they were able to maintain the quantum efficiency of primary photochemistry.
A comparison of the three methods of transcriptomic analysis showed that WGCN identified the highest number of salt tolerance candidate genes, while CC identified the lowest number of candidate genes. Among the 92 genes identified by the three methods, nine genes contained SNPs in CSSL16 and KDML105. The expression level of the nine genes was different in CSSL16 and KDML105, consistent with the notion that they may be involved in regulating salt tolerance. Moreover, seven of the genes were located in the salt tolerance QTL reported by Kanjoo et al. (2012) (Figure 1).
The expression analysis of these nine genes within 48 h (Figure 8) showed much higher induction in OsBTBZ1, OsERD, LOC_Os01g73110, and OsSUB34 genes, when compared to the expression at later stages (Figure 9), suggesting that these four genes may function in the early response to salt stress. Therefore, we have tried to investigate the roles of these genes in salt stress tolerance by using the Arabidopsis mutant with T-DNA insertion in these orthologous genes. Unfortunately, we cannot obtain homozygous of Arabidopsis mutant with T-DNA insertion in ERD4 at this moment. We also investigate the Arabidopsis mutant with T-DNA insertion in PSB28 and Per3 gene. The decrease in photosynthetic pigments and changes in dry weight response in the mutant lines support the role of the genes in salt tolerance.
Some of the nine genes were reported to be involved in stress responses. LOC_Os01g61010 (Nodulin) encodes a member of a family of highly conserved proteins involved in regulating membrane transporters. Wallace et al. (2006) found that Nodulin contributed to water permeability under osmotic stress in soybean. Moreover, Nodulin stimulated phosphorylation to regulate the process of cellular transport during osmotic adaptation in soybean exposed to salt or drought stress (Guenther et al., 2003). LOC_Os01g73110 has not been characterized. However, Sircar and Parekh (2015), who investigated the function of LOC_Os01g73110 using the AraNet and RGAP database identified its homolog in Arabidopsis as AT5G45310, whose product is involved in the biosynthesis of abscisic acid (ABA). LOC_Os01g67370 Arabidopsis ortholog, AT3G59300, encodes a pentatricopeptide-repeat (PPR) superfamily protein. Some PPR proteins in Arabidopsis have been associated with abiotic stress responses, including oxidative stress and ABA responses (Liu et al., 2016). PSB28 was found to be associated with photosystem II reaction center and water splitting in light-dependent reactions. Suorsa and Aro (2007) reported the molecular function of PSB28. The PSB28 rice mutant identified from the T-DNA insertion population exhibited a pale green plant (Jung et al., 2008). The expression of PSB28 was reduced under water stress and heat stress in tomato seedlings (Zhang et al., 2018) and Populus tomentosa (Ren et al., 2019), respectively. Moreover, Kosmala et al. (2009) found that expression of the PSB28 gene responded to cold stress in Festuca pratensis. These results indicated that PSII and PSI were suppressed under stress conditions. Consequently, the accumulation of PSB28 might enhanced the electron transport rate and photochemical efficiency.
OsSub34 encodes a subtilisin protein associated with serine peptidase. Subtilisin contributes to plant responses under biotic and abiotic stress, organ abscission, senescence, and programmed cell death (Schaller et al., 2018). In rice, LOC_Os06g46799 encodes a peroxidase precursor that is highly responsive to various abiotic stress stimuli and plays an important role in the regulation of reactive oxygen species (ROS) by converting H2O2 to water (Hiraga et al., 2001). Hiraga et al. (2001) identified a group of genes that encodes redox regulation-related proteins, including ascorbate peroxidase, peroxidase precursor, glutathione synthetase, and glutathione S-transferase, in rice exposed to drought stress. Moreover, Chutimanukul et al. (2019) reported that CSSL16 had higher peroxidase activity than that did KDML105 under salt stress at the seedling stage, which supports the role of LOC_Os06g46799 in the present study.
BTBZ1 and ERD are proposed to be the genes with the highest correlation with salt tolerance in the rice lines, as both were predicted by three methods of gene co-expression network analysis. Additionally, BTBZ1 and ERD contained SNPs in CSSL16 and KDML105 and both genes were located in the salt/drought QTL previously identified by Kanjoo et al. (2011). Consistent with a joint requirement for both genes for optimal stress tolerance, CSSL10 and CSSL14 carry, respectively, either the BTBZ1 or the ERD allele of DH212 and neither displays the full tolerance phenotype of CSSL14. BTBZ1 belongs to the Bric-A-Brac/Tramtrack/Broad Complex (BTB) protein superfamily (subfamily C1) and contains a TAZ zinc finger and calmodulin-binding domain. The homologous gene in Arabidopsis, AtBT1, encodes a nuclear CaM-binding protein. The expression of AtBTs can be triggered by stress stimuli (Du and Poovaiah, 2004). BTB-ZF proteins are known as the POK, POZ, and Krüppel zinc finger proteins (Deweindt et al., 1995). Moreover, Stogios et al. (2005) reported that the BTB domain is a protein-protein interaction motif that is involved in cellular functions, including transcriptional regulation, cytoskeleton dynamics, ion channels, and targeting proteins for ubiquitination. Moreover, BTB-ZF genes constitute a supergene family encoding proteins that are thought to be transcription factors. Additionally, the analysis of protein-protein interactions from the Predicted Rice Interactome network (PRIN) indicated that the BTBZ1 protein interacted with a cullin protein (LOC_Os02g51180), which may be involved in the degradation of the target protein through the ubiquitin/proteasome pathway (Figueroa et al., 2005). Several reports have described the important role of BTB proteins in developmental programs, defense, and abiotic stress responses (Weber and Hellmann, 2009; Prasad et al., 2010). Nutrient, stress, and hormone responses were regulated by AtBT2 in Arabidopsis (Mandadi et al., 2009). However, an ortholog of the BTBZ gene in Arabidopsis (AT1G05690) was involved in plant development (Robert et al., 2009).
ERD was associated with early response to dehydration, which could be rapidly induced during drought stress and other abiotic stresses. ERD is a member of a large gene family, whose protein products are associated with triphosphate (ATP)-dependent proteases, heat shock proteins (HSPs), membrane proteins, proline, sugar senescence-related genes, chloroplasts, biosynthesis, protein transporters, dehydrogenase, and ubiquitin extension proteins (Kiyosue et al., 1994; Taji et al., 1999; Simpson et al., 2003). Borah et al. (2017) reported that “Dhagaddeshi rice,” a drought-tolerant cultivar, had higher expression levels of ERD1 and responded faster than the susceptible cultivar (IR20) to drought stress. Moreover, Liu et al. (2009) found that the ERD4 gene played a key role in the adaptation of maize to the early stages of stress and enhanced the plant's tolerance to abiotic stress conditions. In transgenic tobacco, the overexpression of ERD15 increased the efficiency of PSII (Fv/Fm) through the protection of cellular membranes (Ziaf et al., 2011). Additionally, transgenic Arabidopsis plants overexpressing the BjERD4 gene from Brassica juncea displayed increased tolerance to salt stress and drought, while the Bjedr4 knockdown lines were susceptible to salt and drought stress (Rai et al., 2016). Therefore, ERD may contribute to salt tolerance in rice.
The bt3 Arabidopsis mutant showed the highest reduction in growth and photosynthesis pigment content, while in rice, more than 20-fold induction of OsBTBZ1 gene was detected after 48 h of salt stress treatment. This is consistent with the cis-regulatory elements found in the putative OsBTBZ1 promoter (Supplementary Figure 4), which include 3 ABREs, 5 MYB binding sites, and 16 MYC binding sites. Many MYB proteins regulate salt tolerance through regulation of the ABA signaling pathway (review: Wang et al., 2021). Both MYB and MYC proteins function as the transcriptional activators in ABA signaling in Arabidopsis (Abe et al., 2003). Together with this literature information our finding support an OsBTBZ1 contribution to salt tolerance phenotype of CSSL16. The upstream region of OsBTBZ1 consists of multiple ERD binding sites. We identified OsERD as one of the key genes because it was highly induced prior to OsBTBZ1 (45-fold induction) in CSSL16, while it was up-regulated only 25-fold in KDML105. Therefore, the interaction between OsBTBZ1 and OsERD and their involvement in salt tolerance in rice should be further characterized.
Due to insertion and base substitution in the putative promoter region of OsBTBZ1 in KDML105, GAGA binding site was detected only in CSSL16. In Arabidopsis, bHLH34 binds to GAGA element and is involved in ABA and salinity response (Min et al., 2017). Moreover, rice Trithorax factor ULTRAPETALA 1 (OsULT1) was found to bind the promoter region of the OsDREB1b gene during transcriptional activation. The binding of OsULT1 to GAGAG elements decreases tri-methylation of lysine 27 on histone H3 (H3K27me3), which antagonizes the transcriptional repression effect of H3K27me3, favoring transcriptional activation of the gene (Roy et al., 2019). A similar phenomenon may occur in the regulation of OsBTBZ1 leading to the higher expression in CSSL16 than KDML105.
Considering all our findings, we hypothesize that the predicted key regulatory genes in the network reported here coordinate a response that makes the rice plants more tolerant to salt stress. The earlier and higher expression of LOC_Os01g64870, OsBTBZ1, LOC_Os01g67370, OsERD, LOC_Os01g73110, OsSUB34, and OsPeroxidase in CSSL16 leads to higher salt tolerance when compared to KDML105. Further investigations should be performed to validate this hypothesis in the future. Based on the ERD binding site in OsBTBZ1 putative promoter, we hypothesize that the ERD protein regulates OsBTBZ1 gene expression and regulates other genes such as PSB28, and Peroxidase. The proposed model for this hypothesis is shown in Figure 11.
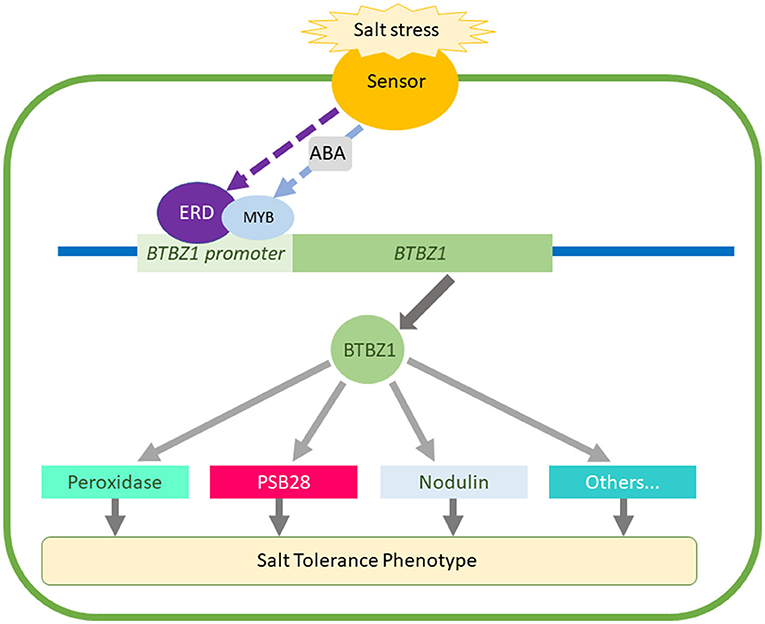
Figure 11. Hypothetical model for the function of the predicted genes obtained from the combining of genome and gene co-expression network analysis.
According to the comparison of the predicted alleles from chromosome 1 of DH212 in CSSLs, 3 candidate alleles from DH212, Nodulin (LOC_Os01g61010), LOC_Os01g64870, and BTBZ1 (LOC_Os01g66890) are located in CSSL10, while CSSL14 contains another 3 candidates from DH212, which are PSB28 (LOC_Os01g71190), ERD (LOC_Os01g72210), and LOC_Os01g73110. The salt tolerance phenotype of CSSL16 was significantly higher than CSSL10 and CSSL14 in all stages, seedling (Chutimanukul et al., 2018a, 2019), vegetative (Chutimanukul et al., 2018b) and booting stages. Therefore, we explicitly propose that the whole QTL in this region is necessary for salt tolerance in rice.
Conclusion
In the present study, we demonstrate an effective transcriptomic approach for identifying genes regulating salt tolerance in rice using two rice lines with close genetic relationships, but different salt tolerance ability. Combining GCN, CC, and WGCN analyses with available SNP information, we identified nine genes involved in salt tolerance in rice. Under salt stress, the expression levels of the nine genes differed in the two rice lines. Moreover, most of the genes were involved in abiotic stress responses. Therefore, we can conclude that the combination of the three methodologies for transcriptome analysis, GCN, CC, and WGCN with SNP information is an effective approach for the identification of genes involved in abiotic stress tolerance and it can support the identification of appropriate QTL for salt tolerance improvement.
Data Availability Statement
The datasets presented in this study can be found in online repositories. The names of the repository/repositories and accession number(s) can be found in the article/Supplementary Material.
Author Contributions
SC, LC, TT, and KP: study conception and design. PC, PM, MS, and TBS: data collection. PC, TBS, PM, KP, SC, and TB: analysis and interpretation of results. PC, TB, KP, LC, and SC: draft manuscript preparation. All authors reviewed the results and approved the final version of the manuscript.
Funding
This research was supported by the Sci-SuperIV fund from the Faculty of Science, Chulalongkorn University. PC was supported by a C2F Post-Doctoral Scholarship. TBS was supported by the RGJ-Asean Scholarships. PM was supported by C2F PhD Scholarship, Chulalongkorn University.
Conflict of Interest
The authors declare that the research was conducted in the absence of any commercial or financial relationships that could be construed as a potential conflict of interest.
Publisher's Note
All claims expressed in this article are solely those of the authors and do not necessarily represent those of their affiliated organizations, or those of the publisher, the editors and the reviewers. Any product that may be evaluated in this article, or claim that may be made by its manufacturer, is not guaranteed or endorsed by the publisher.
Acknowledgments
The authors would like to thank Mr. Nopphawitchayaphong Khrueasan and Mr. Asarnha Pattanatara for their help with field experiments, and the Comai Lab members of the UC Davis Department Plant Biology and Genome Center for their assistance with genome and transcriptome sequencing.
Supplementary Material
The Supplementary Material for this article can be found online at: https://www.frontiersin.org/articles/10.3389/fpls.2021.704549/full#supplementary-material
Supplementary File 1. Differentially Expressed Genes in seedling leaves, flag leaves, second leaves.
Supplementary Figure 1. The gene set enrichment analysis of differentially expressed genes in seedlings when compared between the transcriptome of seedlings grown under normal (0 day) condition and after 75 mM NaCl treatment for 2 days in term of biological process by using ClueGO tool.
Supplementary Figure 2. The gene set enrichment analysis for biological process of differentially expressed genes when compared between the transcriptome of second leaves from rice plants grown under normal (0 day) condition and after 75 mM NaCl treatment for 3 days at booting stage with ClueGO tool.
Supplementary Figure 3. The gene set enrichment analysis for biological process of differentially expressed genes when compared between the transcriptome of flag leaves from rice plants grown under normal (0 day) condition and after 75 mM NaCl treatment for 3 days at booting stage with ClueGO tool.
Supplementary Figure 4. The putative regulatory element analysis of OsBTBZ1 gene from CSSL16 and KDML105.
Supplementary File 2. The number of differentially expressed genes in leaves at seedling stage, second leaf, and flag leaf at booting stage under salt stress condition.
Supplementary File 3. List of significant candidate genes identified by gene co-expression network, clustering co-efficient and weighted gene co-expression network.
Abbreviations
CC, Clustering coefficients; Ci, internal CO2 concentration; CSSL, chromosome segment substitution line; E, transpiration rate; Fv/Fm, maximum PSII efficiency; GCN, Gene co-expression network; GO, Gene ontology; gs, stomatal conductance; KDML105, Khao Dawk Mali 105; PAR, Photosynthetically active radiation; Pi, Photosynthetic performance index; Pn, Net photosynthetic rate; PSI, Photosystem I; PSII, Photosystem II; RNA-seq, RNA sequencing; ROS, Reactive oxygen species; SES, Standard Evaluation System; WGCN, Weighted gene co-expression network.
References
Abdullah, Z., Khan, M. A., and Flowers, T. J. (2001). Causes of sterility in seed set of rice under salinity stress. J. Agron. Crop. Sci. 187, 25–32. doi: 10.1046/j.1439-037X.2001.00500.x
Abe, H., Urao, T., Ito, T., Seki, M., Shinozaki, K., and Yamaguchi-Shinozaki, K. (2003). Arabidopsis AtMYC2 (bHLH) and AtMYB2 (MYB) function as transcriptional activators in abscisic acid signaling. Plant Cell 15, 63–78. doi: 10.1105/tpc.006130
Anders, S., and Huber, W. (2010). Differential expression analysis for sequence count data. Nat. Prec. 2, 1–1. doi: 10.1038/npre.2010.4282.2
Bhowmik, S. K., Titov, S., Islam, M. M., Siddika, A., Sultana, S., and Haque, M. S. (2009). Phenotypic and genotypic screening of rice genotypes at seedling stage for salt tolerance. Afr. J. Biotechnol 8.
Borah, P., Sharma, E., Kaur, A., Chandel, G., Mohapatra, T., Kapoor, S., et al. (2017). Analysis of drought-responsive signalling network in two contrasting rice cultivars using transcriptome-based approach. Sci. Rep. 7, 1–21. doi: 10.1038/srep42131
Boyer, J. S. (1982). Plant productivity and environment. Science 218, 443–448. doi: 10.1126/science.218.4571.443
Chutimanukul, P., Kositsup, B., Plaimas, K., Buaboocha, T., Siangliw, M., Toojinda, T., et al. (2018a). Data in support of photosynthetic responses in a chromosome segment substitution line of ‘Khao Dawk Mali 105’rice at seedling stage. Data Brief 21, 307–312. doi: 10.1016/j.dib.2018.09.128
Chutimanukul, P., Kositsup, B., Plaimas, K., Buaboocha, T., Siangliw, M., Toojinda, T., et al. (2018b). Photosynthetic responses and identification of salt tolerance genes in a chromosome segment substitution line of ‘Khao Dawk Mali 105’rice. Environ. Exp. Bot. 155, 497–508. doi: 10.1016/j.envexpbot.2018.07.019
Chutimanukul, P., Kositsup, B., Plaimas, K., Siangliw, M., Toojinda, T., and Chadchawan, S. (2019). Effect of salt stress on antioxidant enzyme activity and hydrogen peroxide content in chromosome segment substitution line of ‘Khao Dawk Mali 105’rice. Agric. Nat. Resour. 53, 465–471.
Deweindt, C., Albagli, O., Bernardin, F., Dhordain, P., Quief, S., Lantoine, D., et al. (1995). The LAZ3/BCL6 oncogene encodes a sequence-specific transcriptional inhibitor: a novel function for the BTB/POZ domain as an autonomous repressing domain. Cell Growth Differ. 6, 1495–1503.
Dionisio-Sese, M. L., and Tobita, S. (2000). Effects of salinity on sodium content and photosynthetic responses of rice seedlings differing in salt tolerance. J. Plant Physiol. 157, 54–58. doi: 10.1016/S0176-1617(00)80135-2
Du, L., and Poovaiah, B. (2004). A novel family of Ca2+/calmodulin-binding proteins involved in transcriptional regulation: interaction with fsh/Ring3 class transcription activators. Plant Mol. Biol. 54, 549–569. doi: 10.1023/B:PLAN.0000038269.98972.bb
Figueroa, P., Gusmaroli, G., Serino, G., Habashi, J., Ma, L., Shen, Y., et al. (2005). Arabidopsis has two redundant Cullin3 proteins that are essential for embryo development and that interact with RBX1 and BTB proteins to form multisubunit E3 ubiquitin ligase complexes in vivo. Plant Cell 17, 1180–1195. doi: 10.1105/tpc.105.031989
Garg, R., Bhattacharjee, A., and Jain, M. (2015). Genome-scale transcriptomic insights into molecular aspects of abiotic stress responses in chickpea. Plant Mol. Biol. Rep. 33, 388–400. doi: 10.1007/s11105-014-0753-x
Guenther, J. F., Chanmanivone, N., Galetovic, M. P., Wallace, I. S., Cobb, J. A., and Roberts, D. M. (2003). Phosphorylation of soybean nodulin 26 on serine 262 enhances water permeability and is regulated developmentally and by osmotic signals. Plant Cell 15, 981–991. doi: 10.1105/tpc.009787
Hasegawa, P. M., Bressan, R. A., Zhu, J.-K., and Bohnert, H. J. (2000). Plant cellular and molecular responses to high salinity. Annu. Rev. Plant Biol. 51, 463–499. doi: 10.1146/annurev.arplant.51.1.463
Hichem, H., El Naceur, A., and Mounir, D. (2009). Effects of salt stress on photosynthesis, PSII photochemistry and thermal energy dissipation in leaves of two corn (Zea mays L.) varieties. Photosynthetica 47, 517–526. doi: 10.1007/s11099-009-0077-5
Higo, K., Ugawa, Y., Iwamoto, M., and Korenaga, T. (1999). Plant cis-acting regulatory DNA elements (PLACE) database: 1999. Nucl Acids Res. 27, 297–300. doi: 10.1093/nar/27.1.297
Hiraga, S., Sasaki, K., Ito, H., Ohashi, Y., and Matsui, H. (2001). A large family of class III plant peroxidases. Plant Cell Physiol. 42, 462–468. doi: 10.1093/pcp/pce061
Horvath, S. (2011). Weighted Network Analysis: Applications in Genomics and Systems Biology. Berlin: Springer Science & Business Media. doi: 10.1007/978-1-4419-8819-5
Huang, C., Wei, G., Jie, Y., Wang, L., Zhou, H., Ran, C., et al. (2014). Effects of concentrations of sodium chloride on photosynthesis, antioxidative enzymes, growth and fiber yield of hybrid ramie. Plant Physiol. 76, 86–93. doi: 10.1016/j.plaphy.2013.12.021
Humphries, M. D., and Gurney, K. (2008). Network ‘small-world-ness’: a quantitative method for determining canonical network equivalence. PLoS ONE 3:e0002051. doi: 10.1371/journal.pone.0002051
Jung, K.-H., Lee, J., Dardick, C., Seo, Y.-S., Cao, P., Canlas, P., et al. (2008). Identification and functional analysis of light-responsive unique genes and gene family members in rice. PLoS Genet 4:e1000164. doi: 10.1371/journal.pgen.1000164
Kanjoo, V., Jearakongman, S., Punyawaew, K., Siangliw, J. L., Siangliw, M., Vanavichit, A., et al. (2011). Co-location of quantitative trait loci for drought and salinity tolerance in rice. J Genet. Genom. 4, 126–138.
Kanjoo, V., Punyawaew, K., Siangliw, J. L., Jearakongman, S., Vanavichit, A., and Toojinda, T. (2012). Evaluation of agronomic traits in chromosome segment substitution lines of KDML105 containing drought tolerance QTL under drought stress. Rice Sci. 19, 117–124. doi: 10.1016/S1672-6308(12)60030-4
Kiyosue, T., Yamaguchi-Shinozaki, K., and Shinozaki, K. (1994). Cloning of cDNAs for genes that are early-responsive to dehydration stress (ERDs) in Arabidopsis thaliana L.: identification of three ERDs as HSP cognate genes. Plant Mol. Biol. 25, 791–798. doi: 10.1007/BF00028874
Kosmala, A., Bocian, A., Rapacz, M., Jurczyk, B., and Zwierzykowski, Z. (2009). Identification of leaf proteins differentially accumulated during cold acclimation between Festuca pratensis plants with distinct levels of frost tolerance. J. Exp. Bot. 60, 3595–3609. doi: 10.1093/jxb/erp205
Koyama, M. L., Levesley, A., Koebner, R. M., Flowers, T. J., and Yeo, A. R. (2001). Quantitative trait loci for component physiological traits determining salt tolerance in rice. Plant Physiol. 125, 406–422. doi: 10.1104/pp.125.1.406
Krishnamurthy, P., Ranathunge, K., Franke, R., Prakash, H., Schreiber, L., and Mathew, M. (2009). The role of root apoplastic transport barriers in salt tolerance of rice (Oryza sativa L.). Planta 230, 119–134. doi: 10.1007/s00425-009-0930-6
Lafitte, H., Yongsheng, G., Yan, S., and Li, Z. (2007). Whole plant responses, key processes, and adaptation to drought stress: the case of rice. J. Exp. Bot. 58, 169–175. doi: 10.1093/jxb/erl101
Langmead, B., and Salzberg, S. L. (2012). Fast gapped-read alignment with Bowtie 2. Nat. Methods 9:357. doi: 10.1038/nmeth.1923
Lee, H. K., Hsu, A. K., Sajdak, J., Qin, J., and Pavlidis, P. (2004). Coexpression analysis of human genes across many microarray data sets. Genome Res. 14, 1085–1094. doi: 10.1101/gr.1910904
Lisa, L. A., Elias, S. M., Rahman, M. S., Shahid, S., Iwasaki, T., Hasan, A. M., et al. (2011). Physiology and gene expression of the rice landrace Horkuch under salt stress. Funct. Plant Biol. 38, 282–292. doi: 10.1071/FP10198
Liu, J.-M., Zhao, J.-Y., Lu, P.-P., Chen, M., Guo, C.-H., Xu, Z.-S., et al. (2016). The E-subgroup pentatricopeptide repeat protein family in Arabidopsis thaliana and confirmation of the responsiveness PPR96 to abiotic stresses. Front. Plant Sci. 7:1825. doi: 10.3389/fpls.2016.01825
Liu, Y., Li, H., Shi, Y., Song, Y., Wang, T., and Li, Y. (2009). A maize early responsive to dehydration gene, ZmERD4, provides enhanced drought and salt tolerance in Arabidopsis. Plant Mol. Biol. Rep. 27:542. doi: 10.1007/s11105-009-0119-y
Mandadi, K. K., Misra, A., Ren, S., and Mcknight, T. D. (2009). BT2, a BTB protein, mediates multiple responses to nutrients, stresses, and hormones in Arabidopsis. Plant Physiol. 150, 1930–1939. doi: 10.1104/pp.109.139220
Martins, J. B., Júnior, J. a,.S, De Carvalho Leal, L. Y., Paulino, M. K. S. S., De Souza, E. R., et al. (2020). Fluorescence emission and photochemical yield of parsley under saline waters of different cationic nature. Sci. Hortic. 273:109574. doi: 10.1016/j.scienta.2020.109574
Melis, A. (1999). Photosystem-II damage and repair cycle in chloroplasts: what modulates the rate of photodamage in vivo? Trends Plant Sci 4, 130–135. doi: 10.1016/S1360-1385(99)01387-4
Min, J., Ju, H., Yoon, D., Lee, K., Lee, S., and Kim, C. S. (2017). Arabidopsis basic helix-loop-helix 34 (bHLH34) is involved in glucose signaling through binding to a GAGA cis-element. Front. Plant Sci. 8:2100. doi: 10.3389/fpls.2017.02100
Missirian, V., Comai, L., and Filkov, V. (2011). Statistical mutation calling from sequenced overlapping DNA pools in TILLING experiments. BMC Bioinform. 12, 1–10. doi: 10.1186/1471-2105-12-287
Moradi, F., and Ismail, A. M. (2007). Responses of photosynthesis, chlorophyll fluorescence and ROS-scavenging systems to salt stress during seedling and reproductive stages in rice. Ann. Bot. 99, 1161–1173. doi: 10.1093/aob/mcm052
Mukund, K., and Subramaniam, S. (2015). Dysregulated mechanisms underlying Duchenne muscular dystrophy from co-expression network preservation analysis. BMC Res. Notes 8, 1–10. doi: 10.1186/s13104-015-1141-9
Munns, R. (2002). Comparative physiology of salt and water stress. Plant Cell Environ. 25, 239–250. doi: 10.1046/j.0016-8025.2001.00808.x
Nounjan, N., Chansongkrow, P., Charoensawan, V., Siangliw, J. L., Toojinda, T., Chadchawan, S., et al. (2018). High performance of photosynthesis and osmotic adjustment are associated with salt tolerance ability in rice carrying drought tolerance QTL: physiological and co-expression network analysis. Front. Plant Sci. 9:1135. doi: 10.3389/fpls.2018.01135
Onnela, J.-P., Saramäki, J., Kertész, J., and Kaski, K. (2005). Intensity and coherence of motifs in weighted complex networks. Phys. Rev. E 71:065103. doi: 10.1103/PhysRevE.71.065103
Ouyang, S., Zhu, W., Hamilton, J., Lin, H., Campbell, M., Childs, K., et al. (2007). The TIGR rice genome annotation resource: improvements and new features. Nucleic Acids Res. 35, D883–D887. doi: 10.1093/nar/gkl976
Pfaffl, M. W. (2001). A new mathematical model for relative quantification in real-time RT–PCR. Nucleic Acids Res 29:e45. doi: 10.1093/nar/29.9.e45
Ponce, K. S., Meng, L., Guo, L., Leng, Y., and Ye, G. (2021). Advances in sensing, response and regulation mechanism of salt tolerance in rice. Inter. J Mol. Sci. 22, 1–29. doi: 10.3390/ijms22052254
Prasad, M. E., Schofield, A., Lyzenga, W., Liu, H., and Stone, S. L. (2010). Arabidopsis RING E3 ligase XBAT32 regulates lateral root production through its role in ethylene biosynthesis. Plant Physiol. 153, 1587–1596. doi: 10.1104/pp.110.156976
Rai, A. N., Tamirisa, S., Rao, K., Kumar, V., and Suprasanna, P. (2016). RETRACTION: Brassica RNA binding protein ERD4 is involved in conferring salt, drought tolerance and enhancing plant growth in Arabidopsis. Plant Mol. Biol. 90, 375–387. doi: 10.1007/s11103-015-0423-x
Ravasz, E., Somera, A. L., Mongru, D. A., Oltvai, Z. N., and Barabási, A.-L. (2002). Hierarchical organization of modularity in metabolic networks. Science 297, 1551–1555. doi: 10.1126/science.1073374
Ren, S., Ma, K., Lu, Z., Chen, G., Cui, J., Tong, P., et al. (2019). Transcriptomic and metabolomic analysis of the heat-stress response of Populus tomentosa Carr. Forests 10:383. doi: 10.3390/f10050383
Riquelme Medina, I., and Lubovac-Pilav, Z. (2016). Gene co-expression network analysis for identifying modules and functionally enriched pathways in type 1 diabetes. PLoS ONE 11:e0156006. doi: 10.1371/journal.pone.0156006
Robert, H. S., Quint, A., Brand, D., Vivian-Smith, A., and Offringa, R. (2009). BTB and TAZ domain scaffold proteins perform a crucial function in Arabidopsis development. Plant J. 58, 109–121. doi: 10.1111/j.1365-313X.2008.03764.x
Robinson, J. (1988). Does O2 photoreduction occur within chloroplasts in vivo? Physiol. Plant. 72, 666–680. doi: 10.1111/j.1399-3054.1988.tb09181.x
Roy, D., Chakrabarty, J., Mallik, R., and Chaudhuri, S. (2019). Rice trithorax factor ULTRAPETALA 1 (OsULT1) specifically binds to “GAGAG” sequence motif present in polycomb response elements. Biochim. Biophys. Acta Gene Regul. Mech. 1862, 582–597. doi: 10.1016/j.bbagrm.2019.02.001
Schaller, A., Stintzi, A., Rivas, S., Serrano, I., Chichkova, N. V., Vartapetian, A. B., et al. (2018). From structure to function–a family portrait of plant subtilases. New Phytol. 218, 901–915. doi: 10.1111/nph.14582
Simpson, S. D., Nakashima, K., Narusaka, Y., Seki, M., Shinozaki, K., and Yamaguchi-Shinozaki, K. (2003). Two different novel cis-acting elements of erd1, a clpA homologous Arabidopsis gene function in induction by dehydration stress and dark-induced senescence. Plant J. 33, 259–270. doi: 10.1046/j.1365-313X.2003.01624.x
Sircar, S., and Parekh, N. (2015). Functional characterization of drought-responsive modules and genes in Oryza sativa: a network-based approach. Front. Genet. 6:256. doi: 10.3389/fgene.2015.00256
Song, Y., Ci, D., Tian, M., and Zhang, D. (2014). Comparison of the physiological effects and transcriptome responses of Populus simonii under different abiotic stresses. Plant Mol. Biol. 86, 139–156. doi: 10.1007/s11103-014-0218-5
Stogios, P. J., Downs, G. S., Jauhal, J. J., Nandra, S. K., and Privé, G. G. (2005). Sequence and structural analysis of BTB domain proteins. Genome Biol. 6, 1–18. doi: 10.1186/gb-2005-6-10-r82
Strasser, R. J., Srivastava, A., and Tsimilli-Michael, M. (2000). “The fluorescence transient as a tool to characterize and screen photosynthetic samples,” in Probing Photosynthesis: Mechanisms, Regulation and Adaptation, 445–483.
Stuart, J. M., Segal, E., Koller, D., and Kim, S. K. (2003). A gene-coexpression network for global discovery of conserved genetic modules. Science 302, 249–255. doi: 10.1126/science.1087447
Sun, Q., Yamada, T., Han, Y., and Takano, T. (2021). Influence of salt stress on C4 photosynthesis in Miscanthus sinensis Anderss. Plant Biol. 23, 44–56. doi: 10.1111/plb.13192
Suorsa, M., and Aro, E.-M. (2007). Expression, assembly and auxiliary functions of photosystem II oxygen-evolving proteins in higher plants. Photosynth. Res. 93, 89–100. doi: 10.1007/s11120-007-9154-4
Suratanee, A., Chokrathok, C., Chutimanukul, P., Khrueasan, N., Buaboocha, T., Chadchawan, S., et al. (2018). Two-state co-expression network analysis to identify genes related to salt tolerance in thai rice. Genes 9:594. doi: 10.3390/genes9120594
Taji, T., Seki, M., Yamaguchi-Shinozaki, K., Kamada, H., Giraudat, J., and Shinozaki, K. (1999). Mapping of 25 drought-inducible genes, RD and ERD, in Arabidopsis thaliana. Plant Cell 40, 119–123. doi: 10.1093/oxfordjournals.pcp.a029469
Udomchalothorn, T., Plaimas, K., Comai, L., Buaboocha, T., and Chadchawan, S. (2014). Molecular karyotyping and exome analysis of salt-tolerant rice mutant from somaclonal variation. Plant Genome 7:plantgenome2014.2004.0016. doi: 10.3835/plantgenome2014.04.0016
Wallace, I. S., Choi, W.-G., and Roberts, D. M. (2006). The structure, function and regulation of the nodulin 26-like intrinsic protein family of plant aquaglyceroporins. Biochim. Biophys. Acta 1758, 1165–1175. doi: 10.1016/j.bbamem.2006.03.024
Wang, X., Niu, Y., and Zheng, Y. (2021). Multiple functions of MYB transcription factors in abiotic stress responses. Int. J. Mol. Sci. 22:116125. doi: 10.3390/ijms22116125
Watts, D. J., and Strogatz, S. H. (1998). Collective dynamics of ‘small-world’networks. Nature 393, 440–442. doi: 10.1038/30918
Weber, H., and Hellmann, H. (2009). Arabidopsis thaliana BTB/POZ-MATH proteins interact with members of the ERF/AP2 transcription factor family. FEBS J. 276, 6624–6635. doi: 10.1111/j.1742-4658.2009.07373.x
Wellburn, A. R. (1994). The Spectral determination of chlorophyll a and b, as well as total crotenoids, using various solvents with spectrophotometers of different resolution. J. Plant Physiol. 144, 307–313. doi: 10.1016/S0176-1617(11)81192-2
Zhang, B., and Horvath, S. (2005). A general framework for weighted gene co-expression network analysis. Stat. Appl. Genet. Mol. Biol. 4:17. doi: 10.2202/1544-6115.1128
Zhang, Y., Yu, S., Gong, H.-J., Zhao, H.-L., Li, H.-L., Hu, Y.-H., et al. (2018). Beneficial effects of silicon on photosynthesis of tomato seedlings under water stress. J. Integr. Agric. 17, 2151–2159. doi: 10.1016/S2095-3119(18)62038-6
Zhu, J.-K. (2001). Plant salt tolerance. Trends Plant Sci. 6, 66–71. doi: 10.1016/S1360-1385(00)01838-0
Zhu, J.-K. (2002). Salt and drought stress signal transduction in plants. Annu. Rev. Plant Biol. 53, 247–273. doi: 10.1146/annurev.arplant.53.091401.143329
Keywords: transcriptome analysis, gene co-expression network, salt-tolerant genes, rice, clustering co-efficient
Citation: Chutimanukul P, Saputro TB, Mahaprom P, Plaimas K, Comai L, Buaboocha T, Siangliw M, Toojinda T and Chadchawan S (2021) Combining Genome and Gene Co-expression Network Analyses for the Identification of Genes Potentially Regulating Salt Tolerance in Rice. Front. Plant Sci. 12:704549. doi: 10.3389/fpls.2021.704549
Received: 03 May 2021; Accepted: 06 August 2021;
Published: 26 August 2021.
Edited by:
Ravi Gupta, Jamia Hamdard University, IndiaReviewed by:
Sajad Majeed Zargar, Sher-e-Kashmir University of Agricultural Sciences and Technology of Kashmir, IndiaManu Kumar, Dongguk University Seoul, South Korea
Copyright © 2021 Chutimanukul, Saputro, Mahaprom, Plaimas, Comai, Buaboocha, Siangliw, Toojinda and Chadchawan. This is an open-access article distributed under the terms of the Creative Commons Attribution License (CC BY). The use, distribution or reproduction in other forums is permitted, provided the original author(s) and the copyright owner(s) are credited and that the original publication in this journal is cited, in accordance with accepted academic practice. No use, distribution or reproduction is permitted which does not comply with these terms.
*Correspondence: Supachitra Chadchawan, c3VwYWNoaXRyYS5jQGNodWxhLmFjLnRo; c19jaGFkY2hhd2FuQGhvdG1haWwuY29t
†These authors have contributed equally to this work
 Panita Chutimanukul1†
 Triono Bagus Saputro
 Kitiporn Plaimas
 Luca Comai
 Teerapong Buaboocha
 Meechai Siangliw
 Theerayut Toojinda
 Supachitra Chadchawan